1. Introduction
Poisson’s deformations are known in the literature as a material expansion or contraction in a direction perpendicular to the external loading. Typical stone materials have Poisson coefficients between 0.1 and 0.3 [
1]; for example, for concrete it is 0.15 … 0.2 and for steel it is 0.27 … 0.3. It should be mentioned that these values are related to the elastic stage of the behavior of materials under pure compression or tension.
At non-elastic strains, the ratio between the transverse and axial strains becomes inconstant; therefore, it cannot be described by the Poisson coefficient. In such cases, the Poisson effect is a function of real non-linear strain and the Poisson coefficient is replaced by the Poisson function (Poisson ratio) [
2]. For metals, the transfer from a Poisson coefficient to a Poisson function is less important as their non-linear behavior is due to the yielding of the material. However, for stone-type materials such as concrete, this transfer is very important as it begins at stress values that are about half of the ultimate one, which is when elastic–plastic deformation development begins [
3,
4].
The many ways of defining the Poisson ratio are known from the literature, but little is known regarding its accuracy [
5]. The initial values of the Poisson function at the beginning of the concrete elastic–plastic stage are equal to the Poisson coefficient, but the Poisson function values at higher strains are not constant. This factor is significant and should be considered in designs.
Following the available data, the Poisson effect before shear cracking is characterized by the well-known Poisson coefficient, but after cracking it is characterized by two ratios that were studied in [
6]. Experiments were performed to measure these ratios to provide a basis to develop a corresponding model for predicting shear stress vs. shear strain curves, including post-peak descending branches.
Many researchers in the fields of concrete and polymer materials have extended the definition of the Poisson function to linear viscoelasticity [
7]. The Poisson function can increase, decrease or have a non-monotonic function of time. Theoretical and practical examples have been provided to highlight that any evolution of concrete viscoelastic Poisson functions is possible.
The available methods for an ultimate limit state analysis of reinforced concrete structures or structural elements use the modelling of the material characteristics such as strain, stress and the strain rate [
8]. Such modelling is based on theoretical concepts, including plastic fracturing [
9], monotonic and cyclic behavior under multiaxial stress conditions [
10] and viscoplasticity [
11].
It was observed that the Poisson ratio of concrete lies in the range of 0.15 to 0.22 when determined from strain measurements under a compressive load [
12]. A similar range of the Poisson ratio was obtained under a tensile load. Although the Poisson ratio for the pure compression or tension of concrete has been investigated by many researchers, the problem has not been practically studied for bending elements. The authors performed a long-term experimental program on high-performance two-layer beams (TLB). In the frame of this program, we tested small-scale (0.7 m long) single supported TLBs [
13], full-scale (3 m long) simple supported beams [
14,
15], continuous (4 m long) two-span TLBs (each span was 2 m) [
16] and pre-stressed 3 m long TLBs [
17,
18].
In this paper, the available experimental data for real reinforced concrete (RC) single- and two-layer beams were analyzed in order to investigate the transverse deformations, Poisson ratio and corresponding function for elastic–plastic deformations in the compressed zone. The analysis was performed using a recently developed theoretical model of RC tensile behavior for different stress–strain conditions [
19] and structural phenomena [
4].
2. Research Aims, Scope and Novelty
As mentioned above, the Poisson ratio of concrete has been investigated for elements under pure compression, but the problem has not been studied for bending. The present research aimed to investigate the Poisson ratio in the compressed zone of real high-performance reinforced concrete beams. An analysis of the Poisson ratio at the elastic and elastic–plastic stages up to a failure was carried out. For this purpose, the experimental results obtained by the authors were used.
The novelty of the present study was that, for the first time, the dependence of the Poisson ratio was obtained for the compressed zone of real RC bending elements at the elastic and elastic–plastic stages. The results of this study form a basis for a more accurate design of such elements, enabling analyses to be performed without empirical coefficients.
3. Theoretical Background
3.1. Theoretical Model of the Indirect Tensile Behavior of Concrete
Research on concrete tensile strength is limited, relative to compression. Therefore, different stress–strain conditions under tension were investigated and a method considering these features in the design of RC structures was proposed [
19]. The concrete tensile stresses were divided into two groups; direct and indirect tension. It has been reported that indirect concrete tensile strength is higher than direct strength up to 2.8 times. For each type of tensile stresses, the linear, non-linear and ultimate limit state (ULS) were theoretically studied (without empirical coefficients), which is very convenient and accurate for the analysis of concrete resistance in pure tension and tension with transverse deformations.
The subject of the present research was a case corresponding with concrete transverse tension. With this type of tension, tensile deformations are secondary and are a result of longitudinal compression deformations. It has been shown in a previous study [
19] that the ascending and descending branches for concrete transverse tensile stress–strain behavior are linear and correspond with structural phenomena [
4]; i.e., plastic deformations are two times higher compared with elastic ones.
where
is the Poisson coefficient for the compressed concrete elastic stage,
fc is the concrete strength at compression and
fct is the concrete strength with transverse tension.
As compressed concrete deformations are elastic up to the appearance of cracks, then
where ε
ct ul = 0.1‰ is the ultimate value of the concrete tensile deformations and E
c is the concrete modulus of elasticity.
It was shown in [
19] that the concrete transverse tensile strength is two times higher than that in the tensile zone at bending.
3.2. The Main Idea of Structural Phenomena
The idea of structural phenomena (SP) was previously presented and demonstrated for different structural parameters at ULSs [
4]. The phenomena are valid for material properties as well as for structures and their elements under static and/or dynamic loadings. Following this idea, many design structural parameters at ULSs are two times higher or lower than at the beginning of loading, which is when the structure behaves elastically. SP were demonstrated using available experimental and theoretical data for different types of structures and elements (beams, frames and joints at static or/and dynamic forces).
It was also shown that SP enable the prediction of ULSs in structures by calculating changes in their strength and deformation before a real design, thus solving durability problems and revealing changes in structural static schemes. Using SP in the present study allowed the further development of RC theory to predict transverse deformations in the compressed zone of bending elements and to obtain a proper Poisson ratio based on the available experimental data.
3.3. Influence of Transverse Deformation on the Design of RC Structures
Experimental data regarding the influence of transverse deformations on the behavior of full-scale bending elements or real structures are very limited. At the same time, recent strong earthquakes have demonstrated that these deformations may be a reason for significant damage in columns, which may finally result in the collapse of buildings. Transverse (tensile) deformations can be divided into two stages: before the appearance of transverse cracks; and after their appearance up to failure. These two stages are evident, for example, in the response of RC columns to the strong earthquake in Mexico in 2017 [
20] (see Figure 3 in [
21]).
A similar problem is relevant for fiber-reinforced concrete elements. As mentioned in [
22], although steel fibers are accepted in modern design provisions, equations for estimating the elasticity modulus and Poisson ratio of fiber-reinforced concrete are not provided in building codes. Empirical equations have been developed to estimate the modulus of elasticity and Poisson ratio of concrete-reinforced different fibers.
Thus, a need for an experimental investigation into transverse deformations in real fiber-reinforced concrete structures has been raised. This experimental study is required to propose a theoretical dependence for the development of such deformations, from the initial loading stages to the ultimate limit state of a structure. Carrying out the present experimental research on real bending elements is especially important to develop proper design procedures for two-layer high-performance beams (steel fiber-reinforced concrete in addition to ordinary reinforcement) as well as a validation of these procedures.
4. Description of the Experiments
4.1. Concrete Properties and Production of Specimens
The present research focused on the analysis of experimental results obtained by testing real 8 m long RC beams. One single-layer beam (SLB) and one TLB were tested. The TLB consisted of normal strength concrete (NSC) in the tensile zone and steel fiber high-strength concrete (SFHSC) in the compressed one. The tests were carried out according to the German Concrete Association requirements [
23], which are similar to those of RILEM [
24] and other publications [
25]. According to [
23], the beams were loaded orthogonal to the casting direction. The steel fibers had an ultimate tensile strength of 1100 MPa, a length of 50 mm and a diameter of 1 mm. The number of fibers per 1 kg was about 3150.
The concrete component properties are presented in
Table 1. Dried aggregates were used for all mixtures. The concrete mixture proportioning per 1 m
3 of concrete was as follows:
| Cement | 400 kg |
| Water | 152 L |
| Fly ash | 100 kg |
| Super-plasticizer | 15.4 L |
| Sand fraction 0/2 | 675.43 kg |
| Gravel fraction 2/8 | 429.71 kg |
| Gravel fraction 8/16 | 618.78 kg |
| Steel fiber ratio | 40 kg |
Steel bars with an ultimate strain of 25‰ and a modulus of elasticity, yield strength and ultimate strength of 200 GPa, 500 MPa and 525 MPa, respectively, were used for the reinforcement [
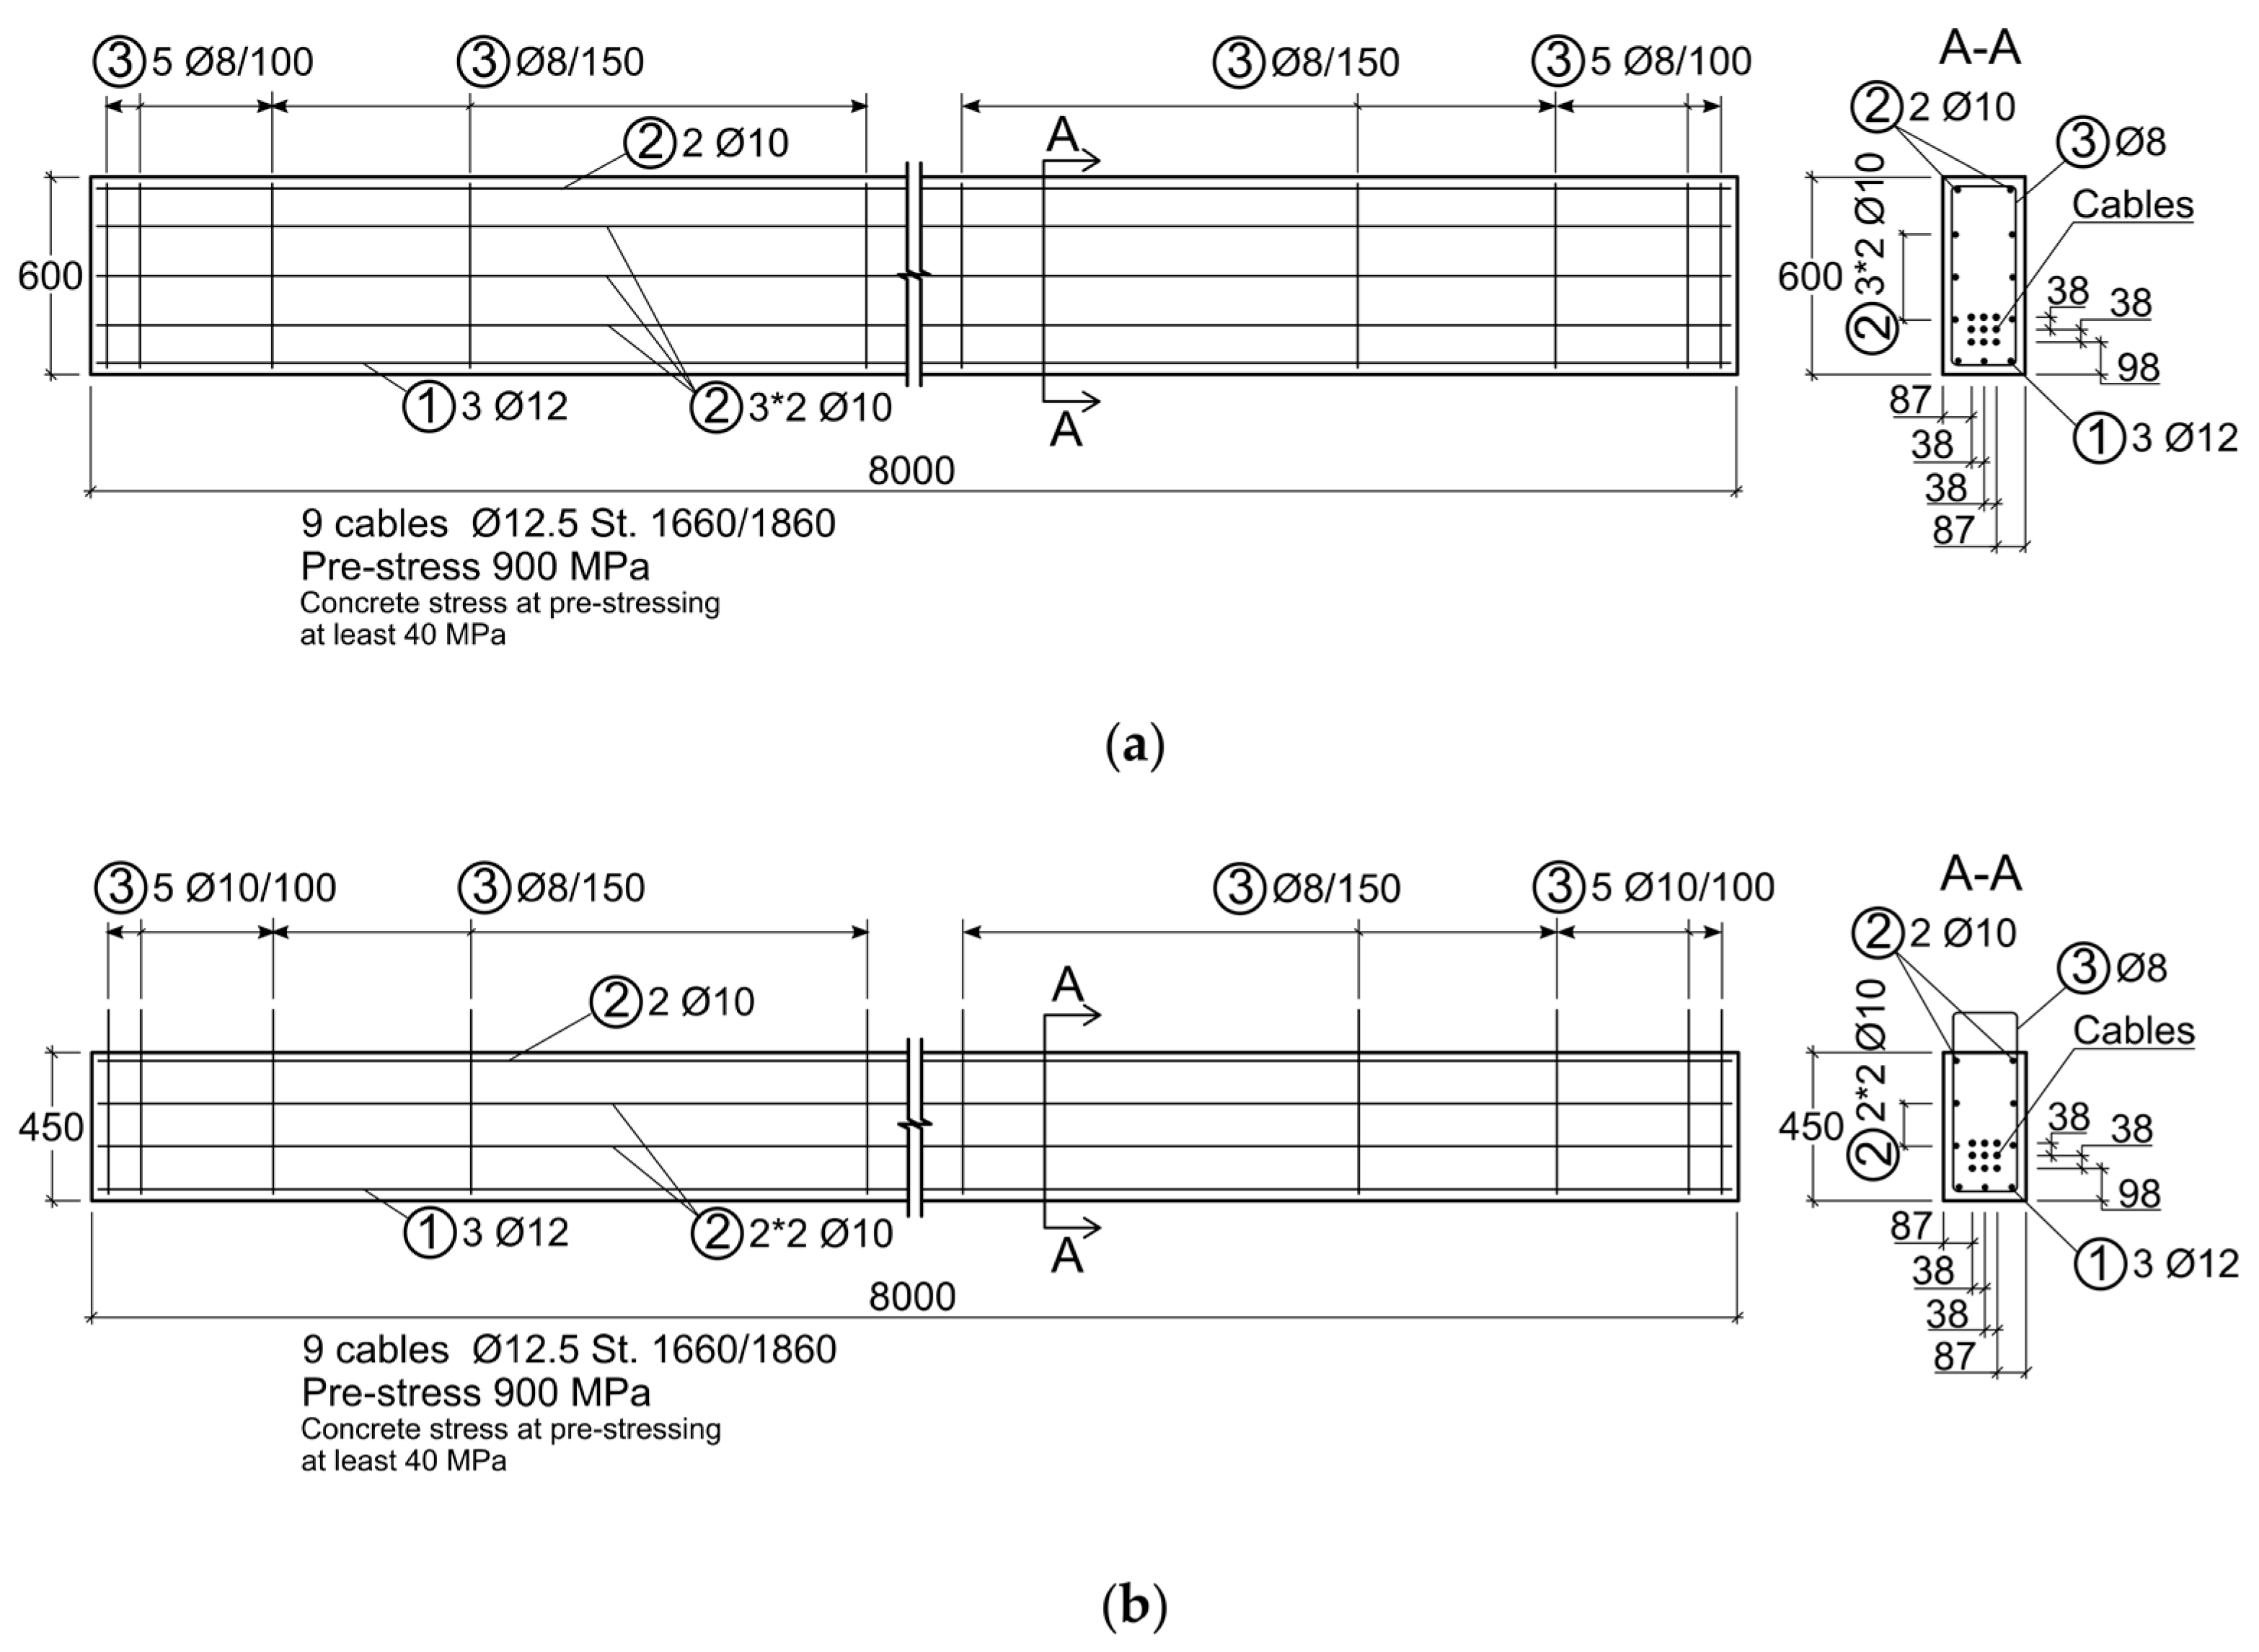
26]. The reinforcement schemes of the tested beams are shown in
Figure 1. The initial pre-stress was 900 MPa for both specimens.
To obtain the compressive and splitting tensile strengths of SFHSC, 6 15 × 15 × 15 cm cubes were tested. With this aim, a testing machine with a 5000 kN load capacity and a 100 cm maximum stroke was used. Three specimens were tested to obtain the compressive strength and three others were tested for the splitting tensile strength. The results of these tests are presented in
Table 2.
Concrete class C 40/50 was used for the SLB and for the NSC layer of the TLB. Concrete class C 90/100 was selected for the SFHSC layer of the TLB. The cross-section of both beams was 25 × 60 cm2. The depths of the TLB NSC and SFHSC layers were 45 cm and 15 cm, respectively.
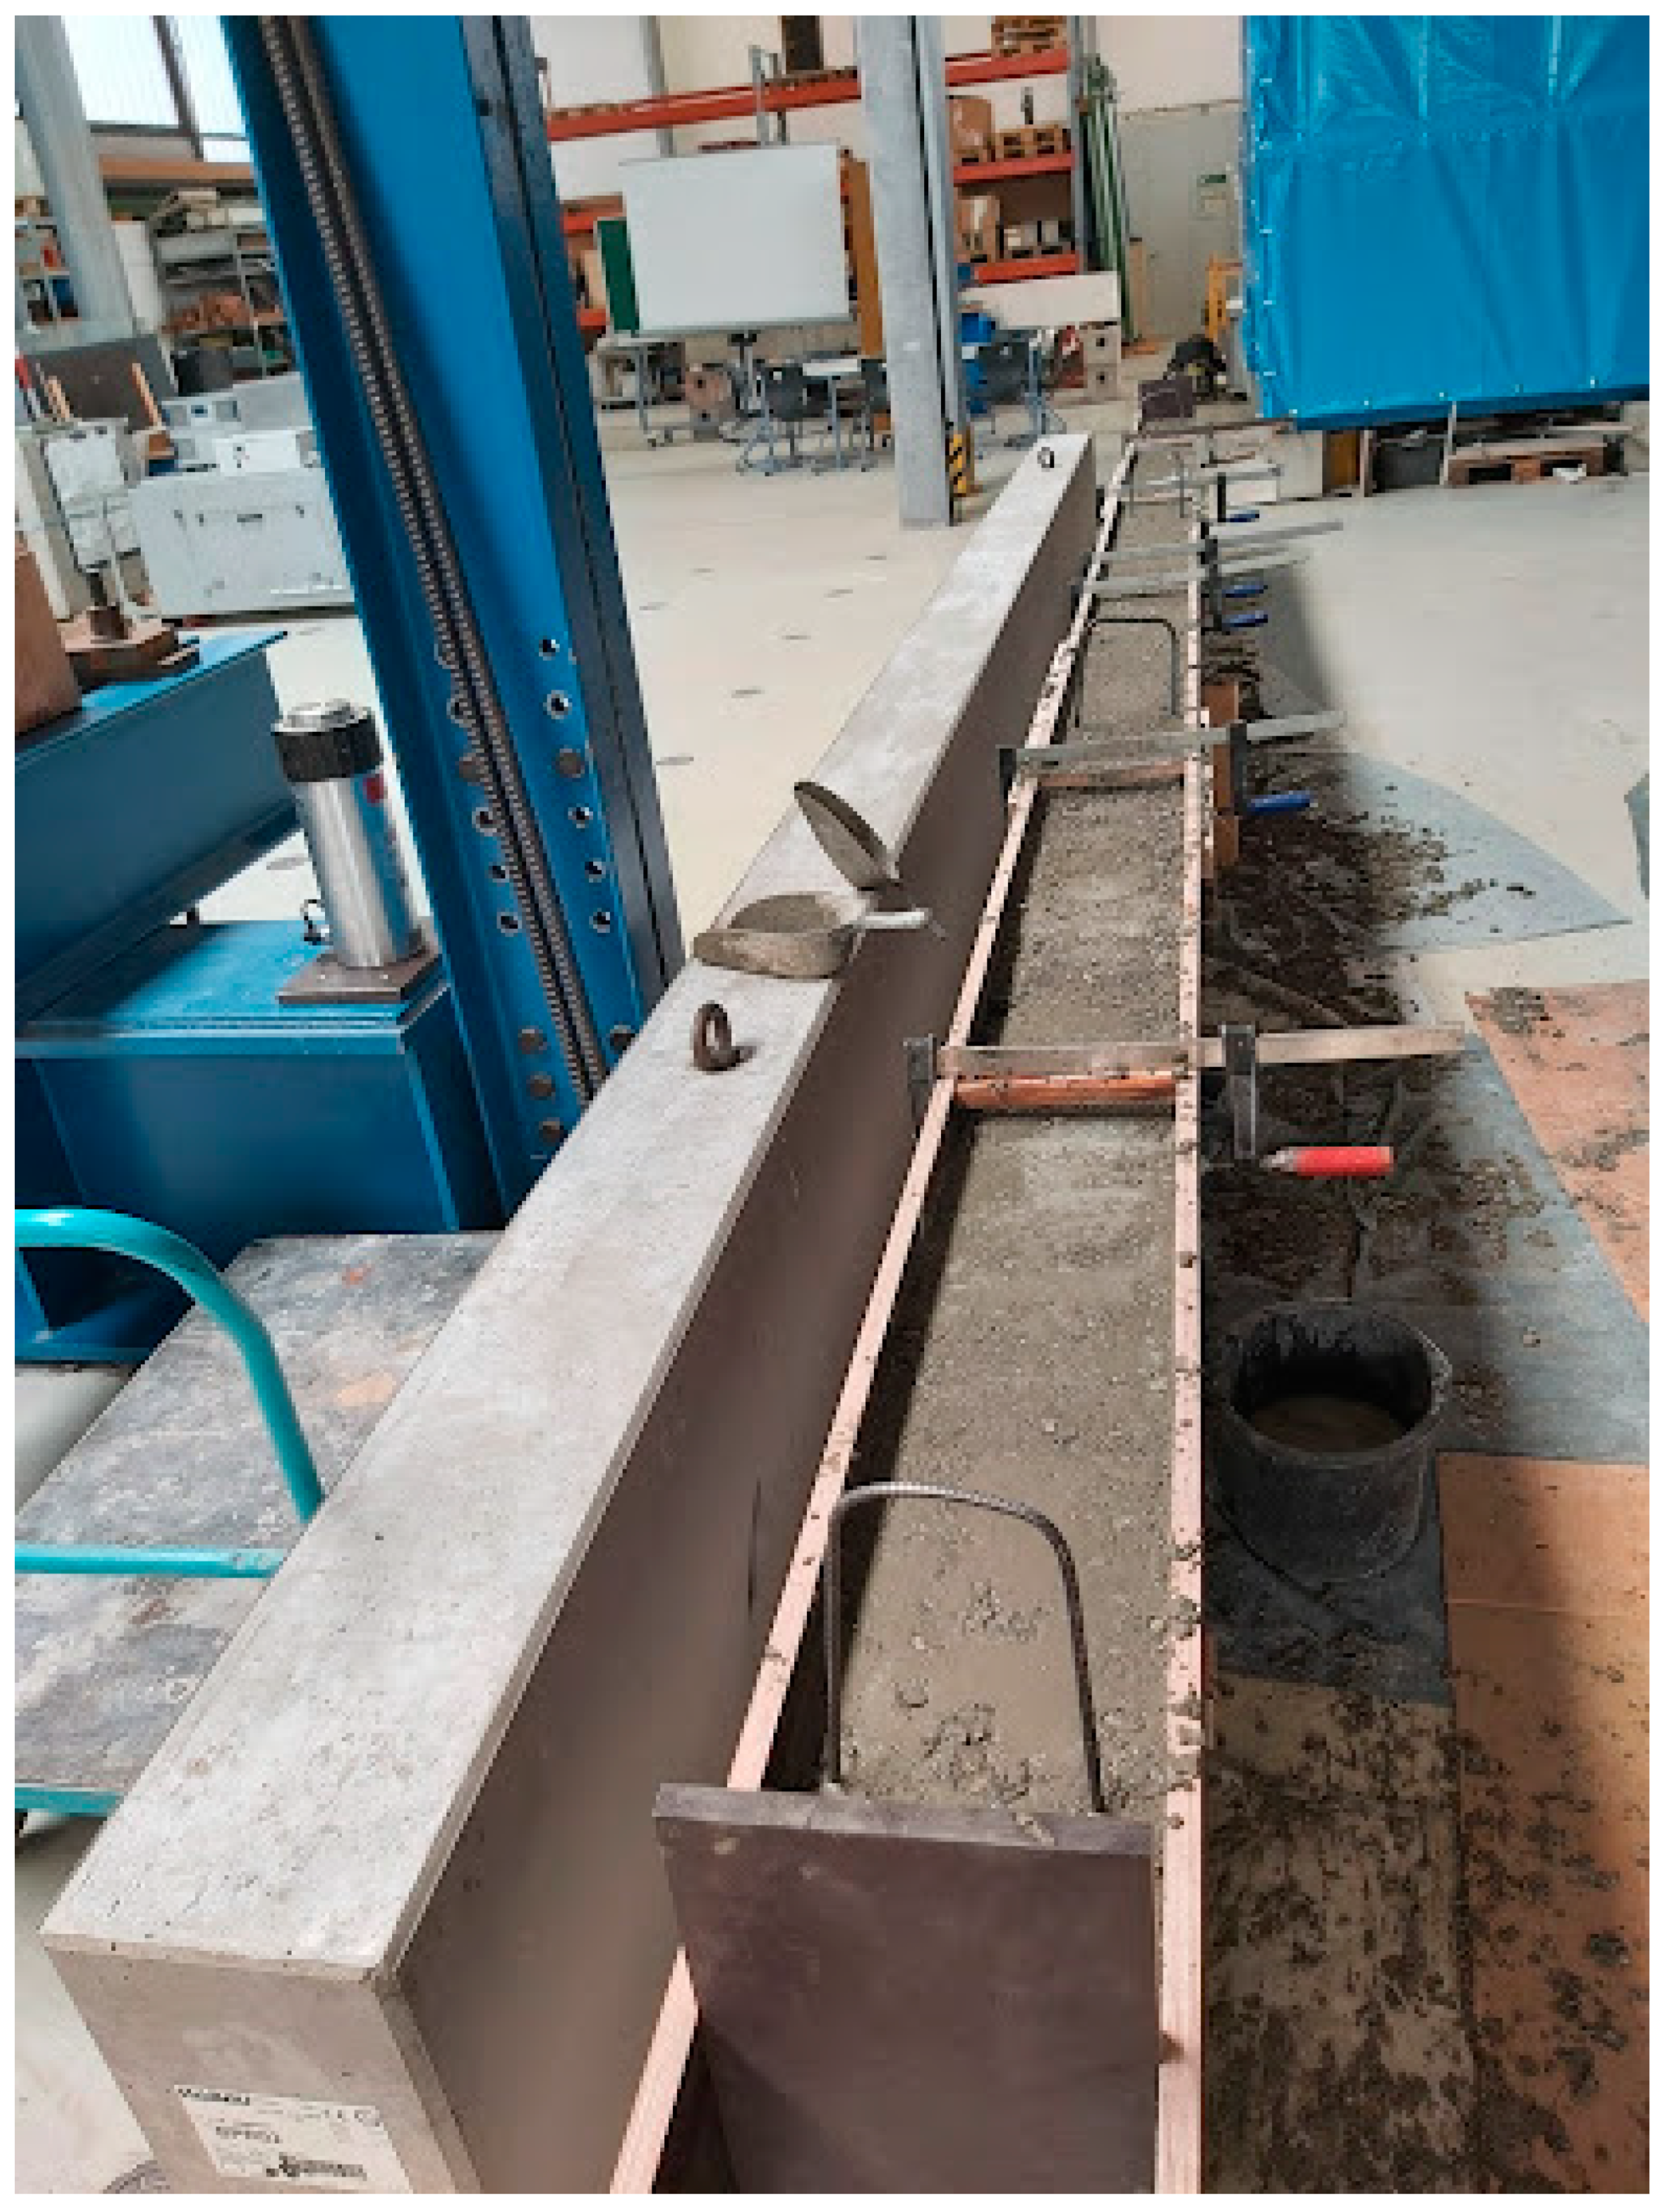
The pre-stress was transferred to both the SLB and TLB one day after casting in real industrial conditions. After that, the beams hardened in natural conditions. After casting the SFHSC layer of the TLB at the university laboratory (
Figure 2), both specimens were kept in natural conditions and tested after 28 days.
4.2. Testing Procedure
A scheme of the measurement device placement is shown in
Figure 3. Two strain gages (SG1 and SG2) were placed in the mid-span of the tested specimens in the upper part of the beams to study the longitudinal deformations in the compressed zone of the bending elements. The transverse deformations were measured at the same place by LVDTs 10 and 11. Strain gage SG2 was located on the opposite side of the beam; therefore, it is not shown in the figure. The load was applied in steps by a hydraulic actuator with a capacity of 400 kN and stroke of 200 mm.
CATMAN software [
27] was used for the data logging. At each load step, the mid-span deflections (LVDT 1) and longitudinal (SG1, SG2) and transverse (LVDT 10, LVDT 11) deformations in the compressed zone were measured (see
Figure 3).
5. Experimental Results and Discussion
5.1. Basic Analysis of the Measured Deflections and Deformations
The tested SLBs and TLBs were loaded, including the elastic–plastic stage. The cracks propagated almost up to the compressed zone border.
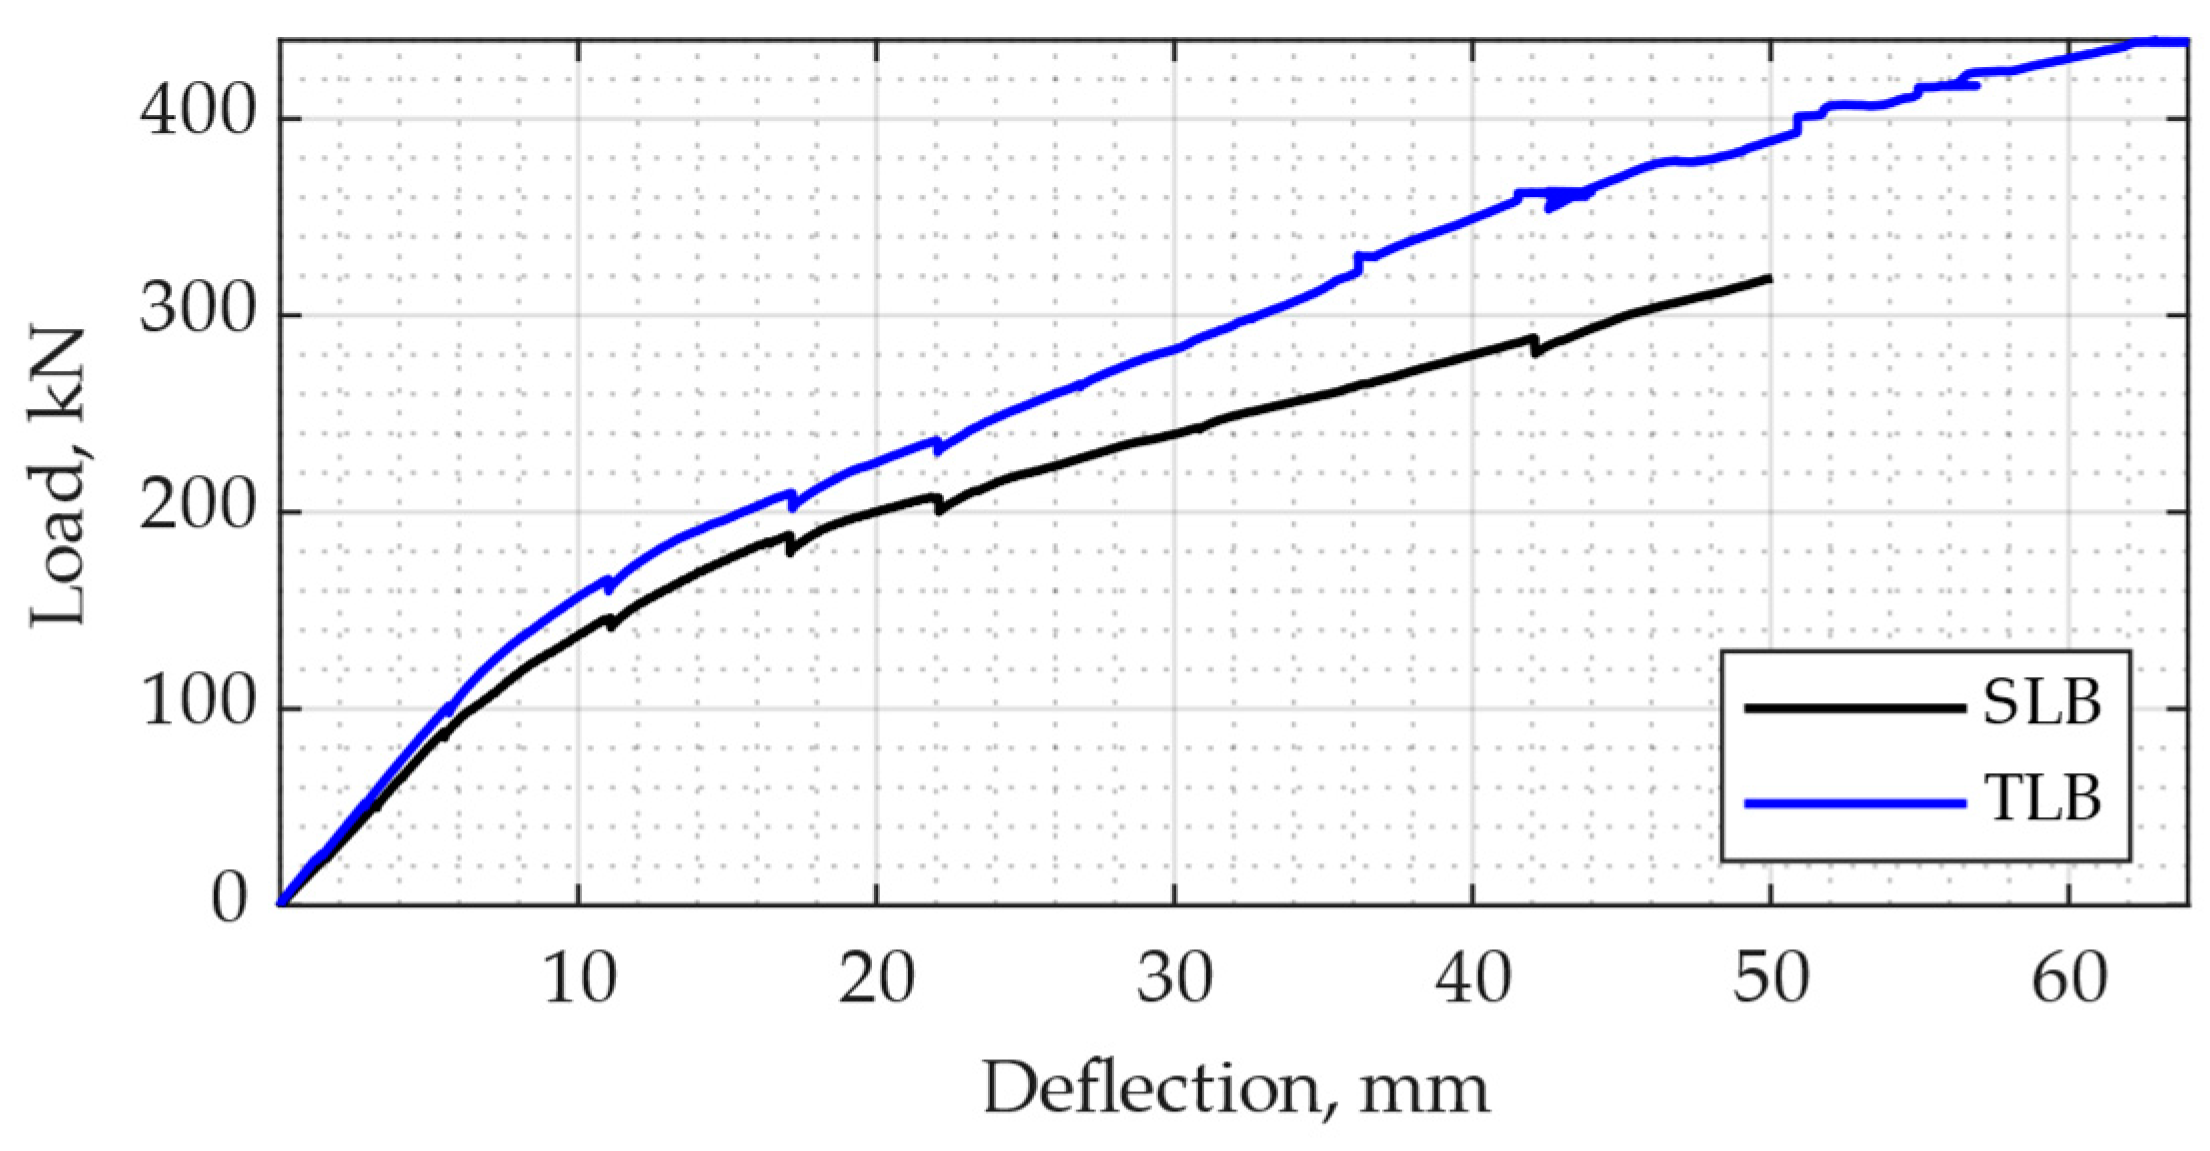
Figure 4 presents the relationship between the force and mid-span deflection in both tested beams. As evident from the figure, the maximum load measured in the SLB was about 320 kN; for the TLB, it was more than 440 kN (i.e., 37.5% higher). The TLB mid-span deflections under the same loads for the elastic–plastic deformation range were about 37% lower compared with the SLB. This was due to the positive effect of using SFHSC in the TLB compressed zone relative to the SLB, which had no steel fibers in the compressed zone.
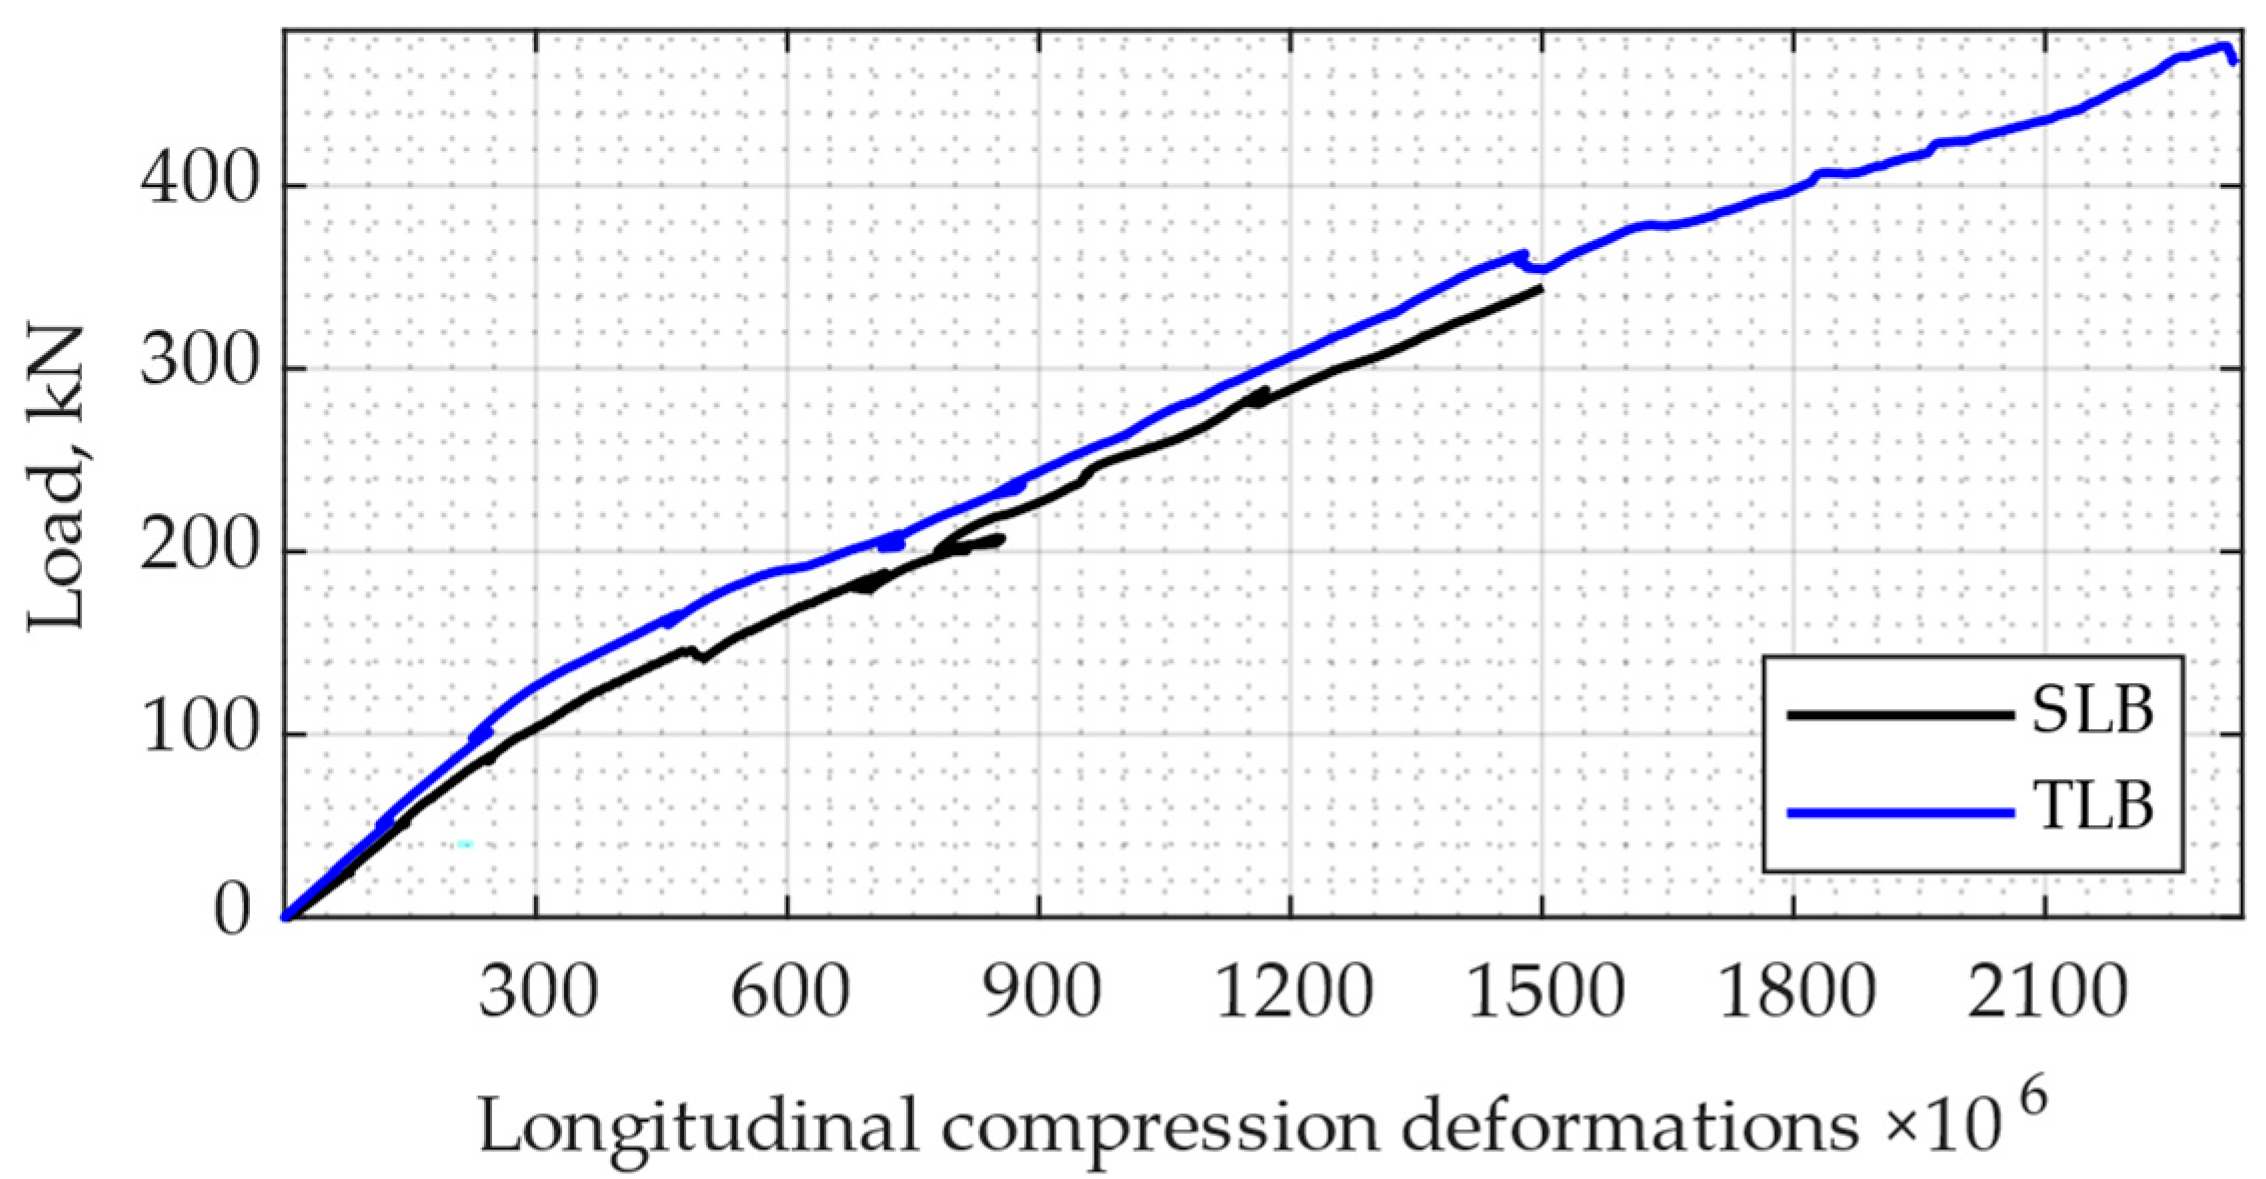
The typical relationships between the load and longitudinal compression deformations in concrete measured in the middle of the investigated SLBs and TLBs are shown in
Figure 5. The maximum compression deformations in the SLB were about 1.5‰; in the TLB, they were about 2.4‰ at the maximum measured loads. In other words, the deformability of SFHSC in the compressed zone of the TLB was 60% higher compared with the ordinary concrete without fibers in the SLB.
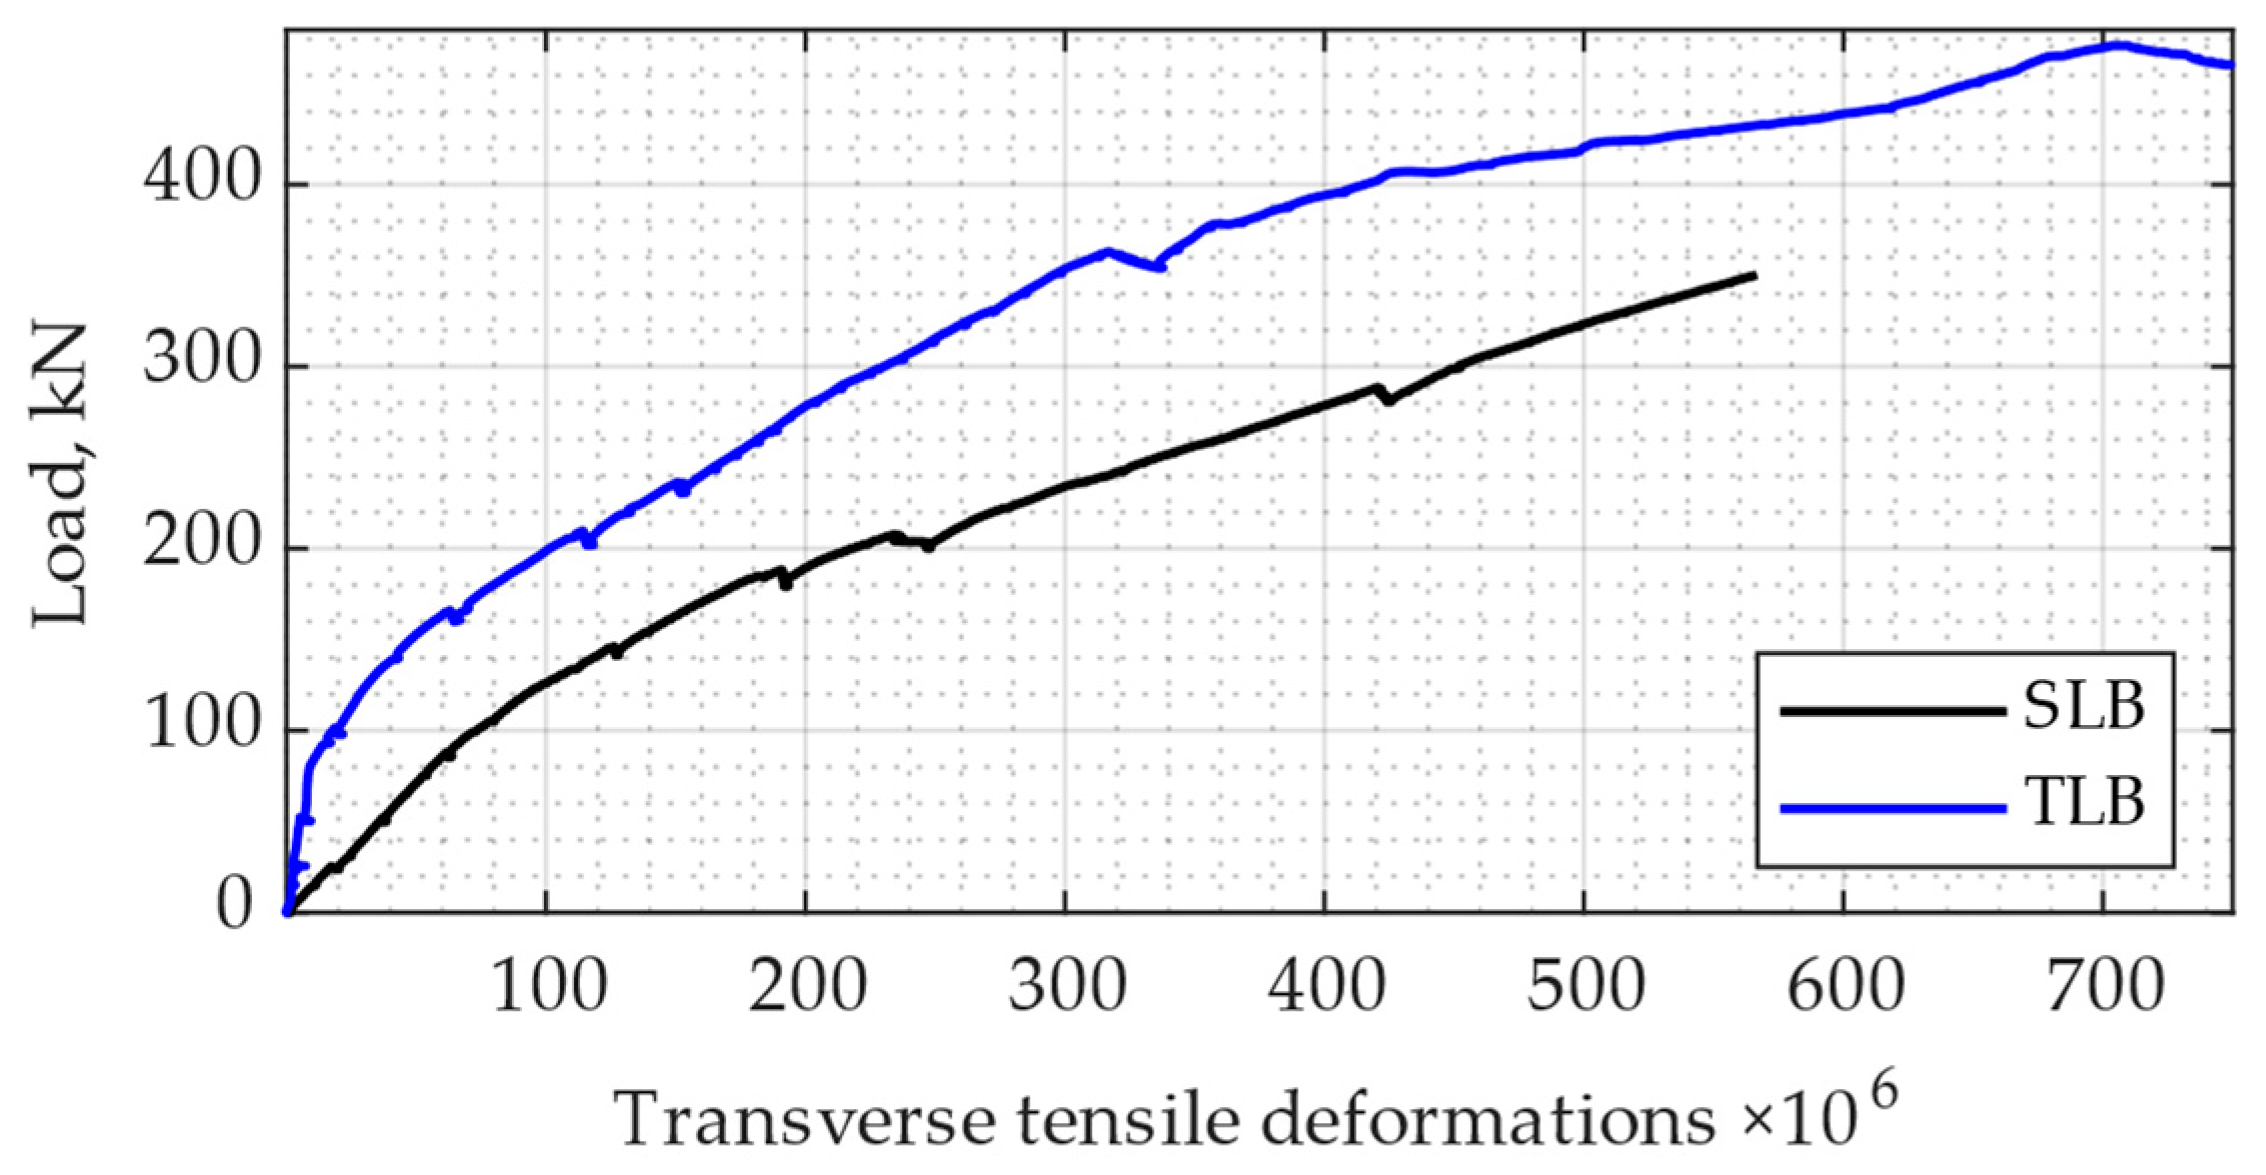
The typical relationships between the load and transverse tensile deformations measured in the middle of the investigated SLBs and TLBs are shown in
Figure 6. The maximum values of the tensile deformations in the SLB were about 0.55‰; in the TLB, they were about 0.75‰ at the maximum measured loads. In other words, the transverse deformability of SFHSC in the TLB was 36% higher compared with the SLB.
5.2. Development of Transverse Deformation Theory Based on the Obtained Experimental Results
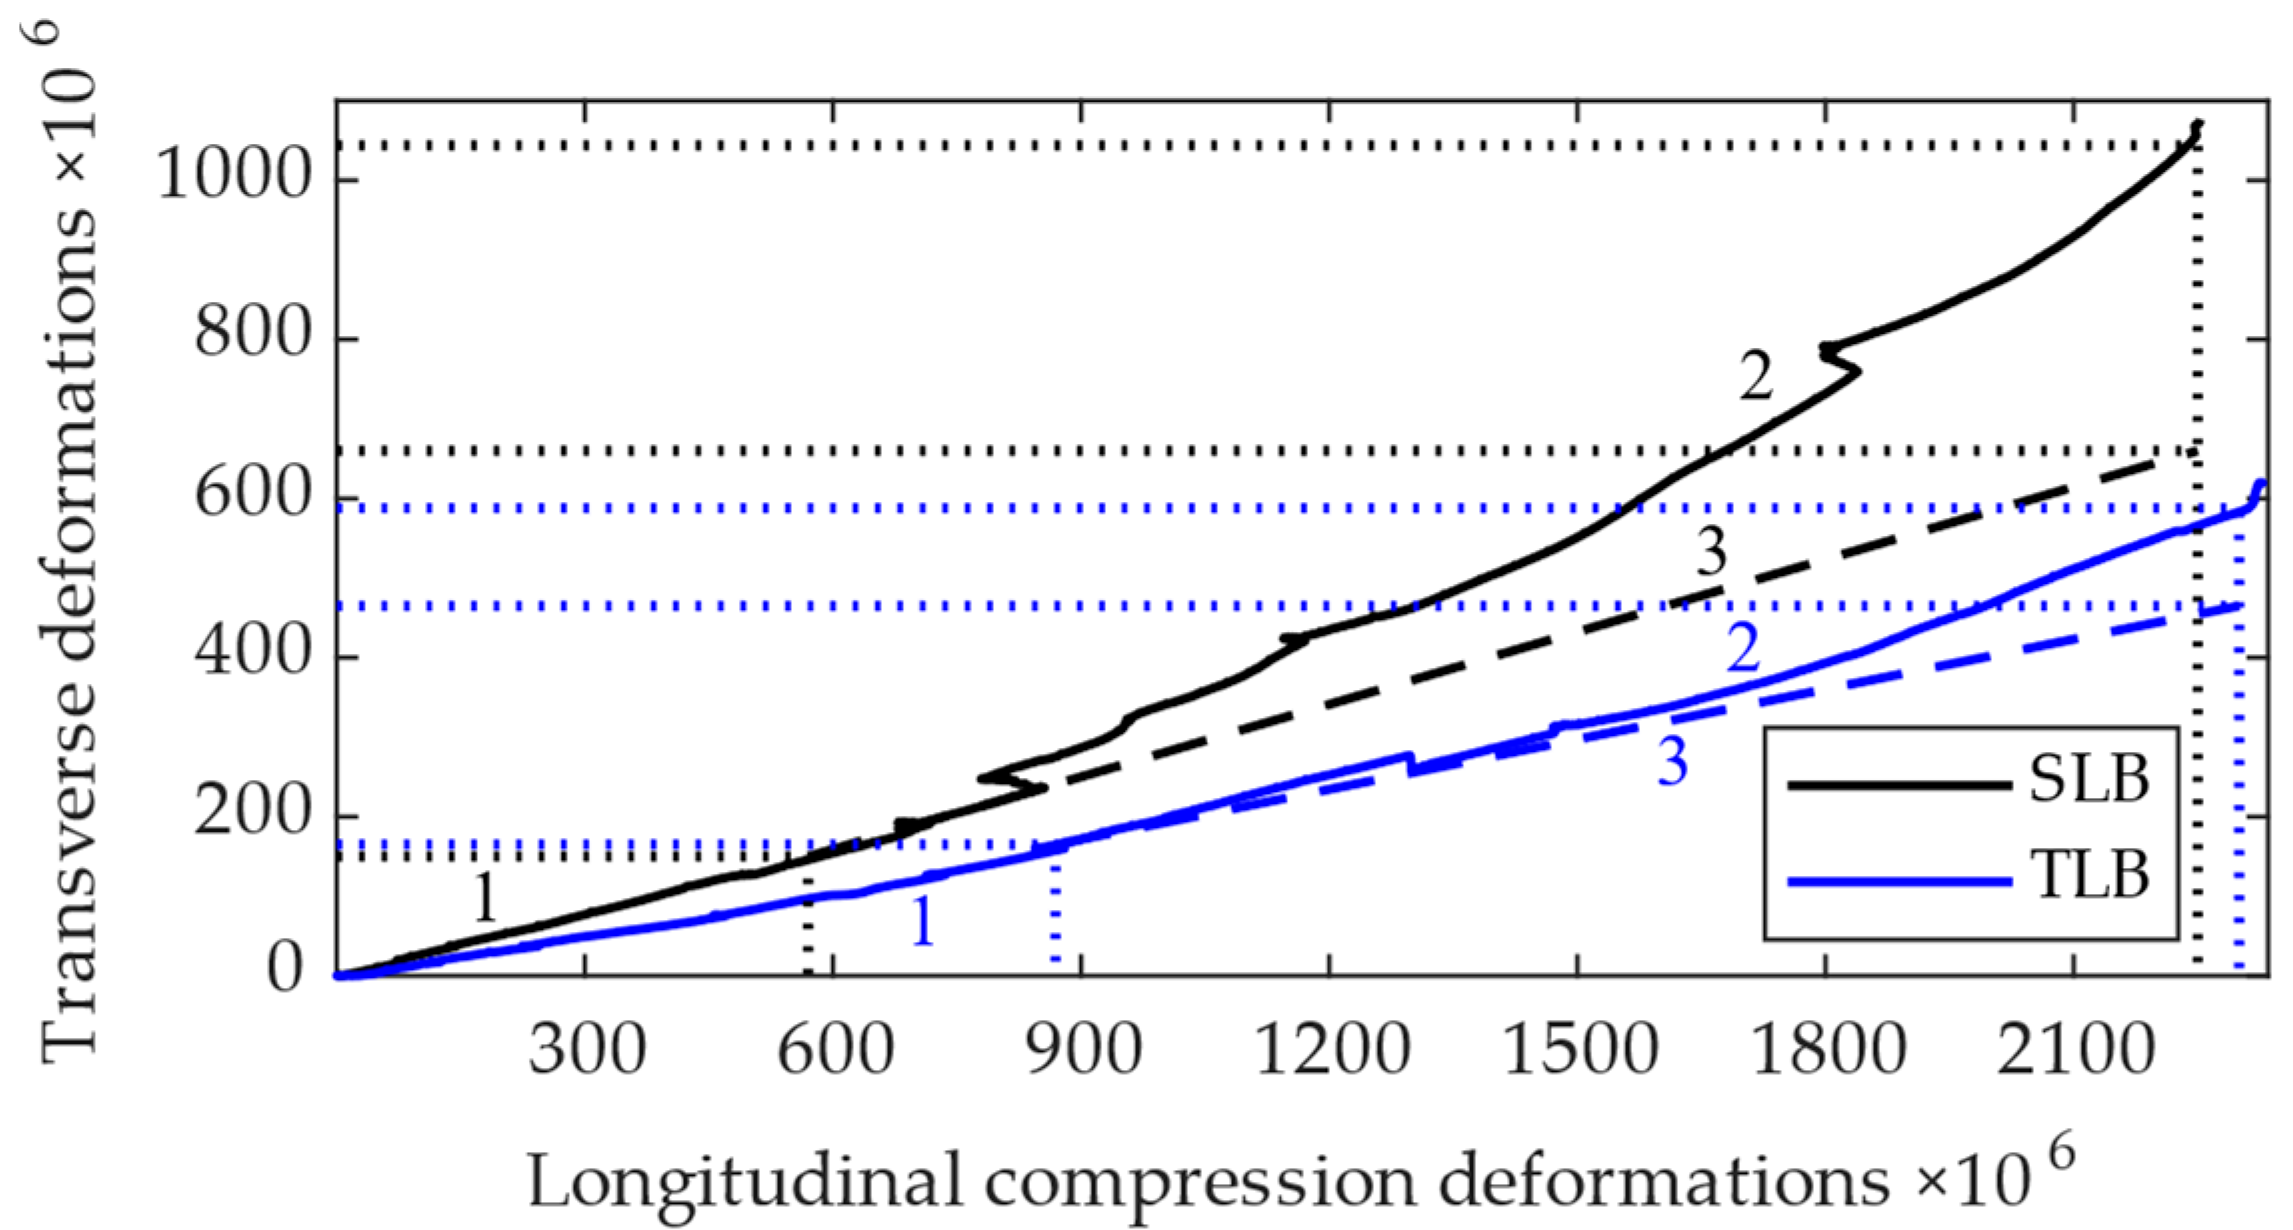
The relationships between the transverse and longitudinal deformations in the SLB and TLB are presented in
Figure 7. The dependence between these deformations was a concave curve; i.e., as the longitudinal deformations became higher, the transverse ones grew in a non-linear form. According to the classical interpretation of Poisson deformations, there is linear relationship between the transverse and longitudinal deformations up to the elasticity limit. This concept corresponded with line 1 in the figure. Line 2 corresponded with the non-linear parts of the graphs and began from the longitudinal deformations of 0.58‰ for the SLB and 0.85‰ for the TLB. The difference between these values was 46.6%, which, consequently, increased the transverse crack resistance of the TLBs. Concrete mechanics theory does not consider transverse cracks; the transverse deformations are limited to 20% of the longitudinal ones [
21,
28]. Line 3 presents a conditional extension of the linear elastic transverse deformations.
The theoretical interpretation of SFHSC (dependence between ε
trans/ε
c vs. ε
c) at a material level was previously discussed and verified for cylindrical specimens [
21]. It was shown that the main feature in SFHSC behavior is that for longitudinal deformations ε
c ≤ 1‰, the ratio ε
trans/ε
c is constant; it indicates that the SFHSC behaves linearly.
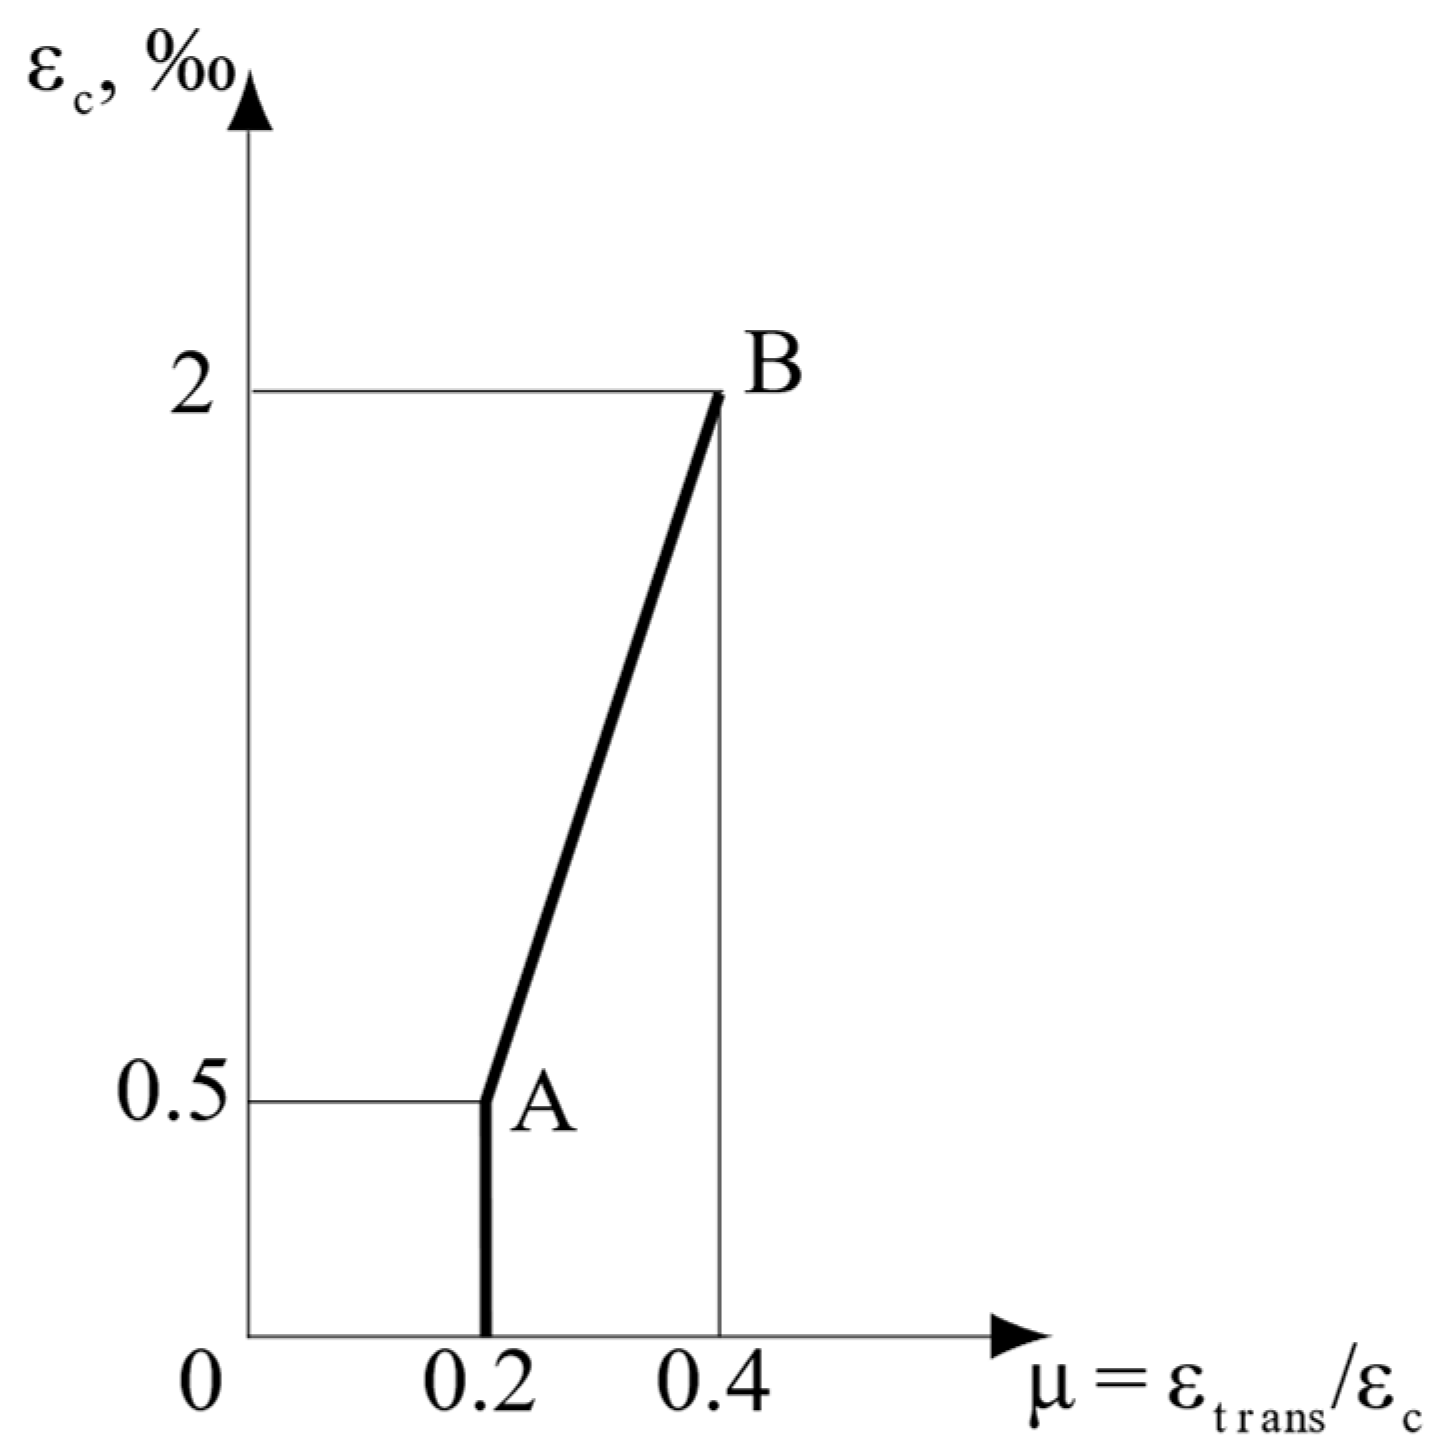
The concept was further investigated in the present research for real RC beams to confirm this idea at a structural level. From a theoretical viewpoint, there are two main stages in the behavior of concrete bending elements:
- -
The elastic stage, when the ratio between the transverse deformations to the longitudinal ones (µ = ε
trans/ε
c) vs. the longitudinal deformations (ε
c) is constant; i.e., for longitudinal deformations within 0 and 0.5‰, the ratio µ = 0.2 (
Figure 8);
- -
The elastic–plastic stage, when the ratio between the transverse deformations to the longitudinal ones (µ = ε
trans/ε
c) vs. the longitudinal deformations (ε
c) is linear (line AB in
Figure 8) and increases from µ = 0.2 to µ = 0.4 at ε
c = 0.5‰ and ε
c = 2‰, respectively.
The increase in the value of µ in the second stage was up to two times, which was as expected and corresponded with structural phenomena [
4]. Consequently, and following this theoretical model, the known term “Poisson coefficient” was valid, but only for 0 ≤ ε
c ≤ 0.5‰. When 0.5‰ < ε
c ≤ 2‰, this term was not correct and a suitable term was “Poisson ratio”. Obviously, this concept and the proposed theoretical model (
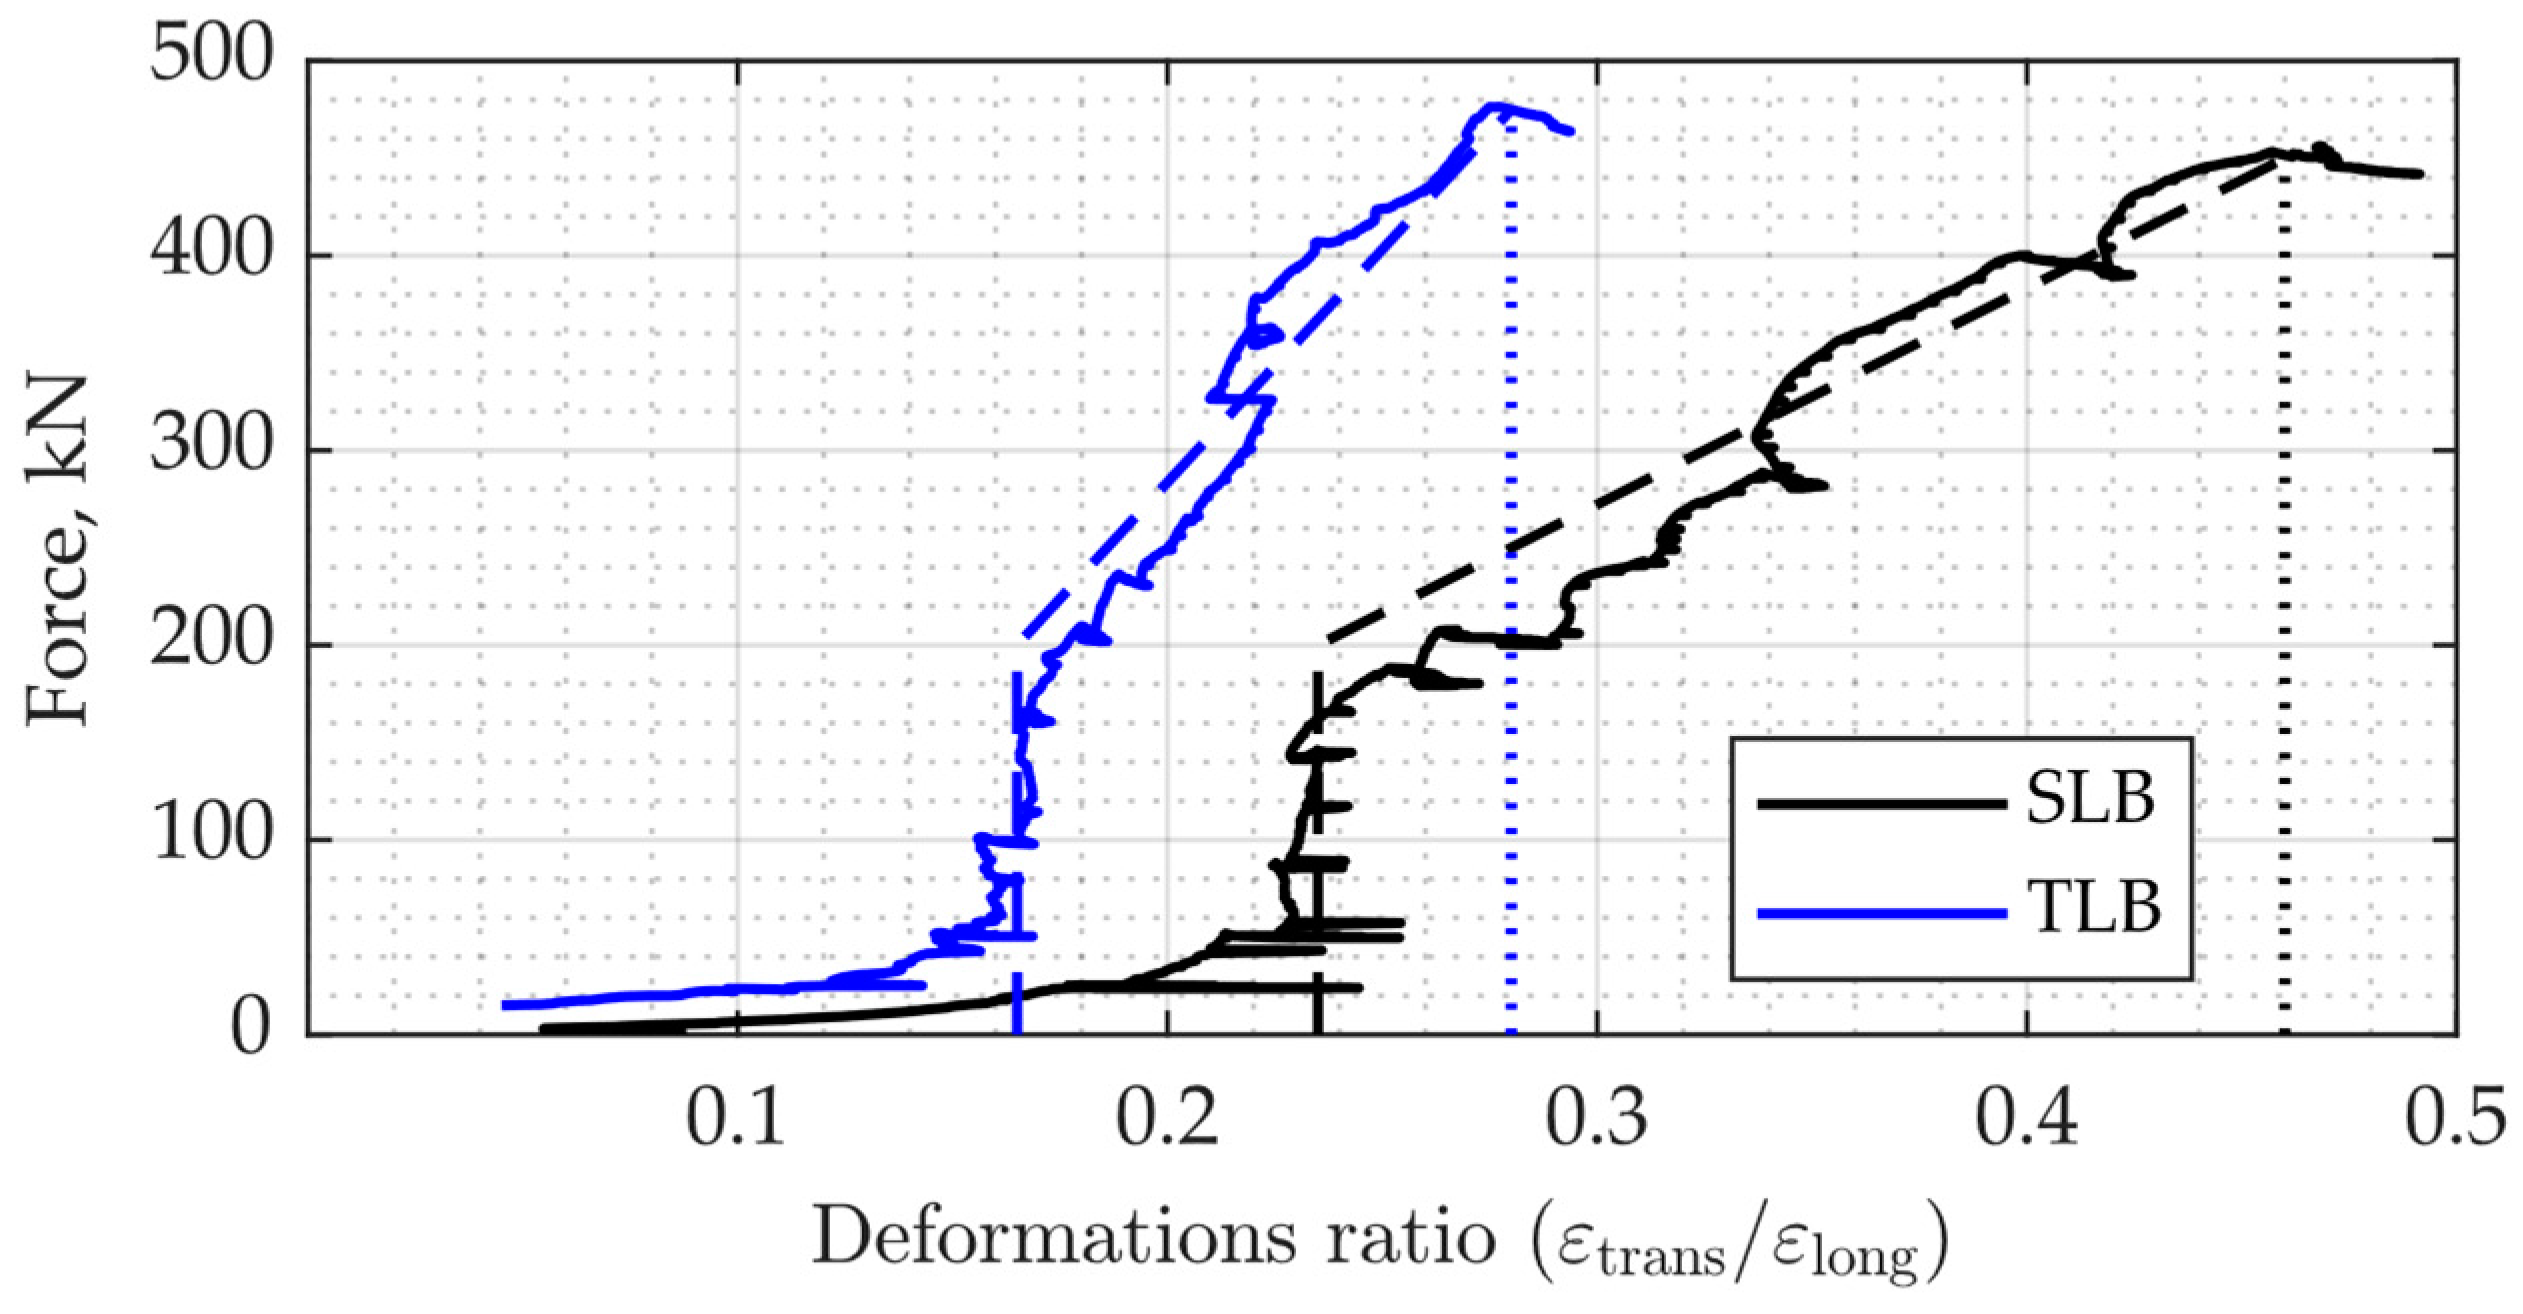
Figure 8) had to be verified. With this aim, the experimental data from testing the real SLB and TLB were analyzed.
Figure 9 compares the above-described theoretical graph (see
Figure 8) with the experimental data that were obtained in the frame of the present study for real SLB and TLB specimens (shown in
Figure 1) and described in
Section 4. The solid lines in
Figure 9 corresponded with the experimental data and the hidden ones corresponded with the theoretical model following
Figure 8. It was evident that the model accurately predicted the experimental data. Following
Figure 9, for the SLB the experimental values were 0.24 ≤ µ ≤ 0.46. For the TLB (
Figure 9), the corresponding limits were 0.16 ≤ µ ≤ 0.28. It was clear that a decrease in the limits of µ in the TLB was due to the use of SFHSC in its compressed zone.
6. Conclusions
The present research focused on an experimental investigation of the Poisson ratio in the compressed zone of real single- and two-layer reinforced concrete beams. The experimental data were compared with a theoretical model and a good correspondence was obtained.
It was shown that, in the elastic stage, the Poisson ratio was constant and, therefore, the term “Poisson coefficient” was valid, but only within elastic longitudinal deformation limits up to 0.5‰. At the elastic–plastic stage, the relationship between the transverse to longitudinal deformations vs. the longitudinal ones had an evident linear shape. Therefore, for this stage, instead of the term “Poisson coefficient”, a more appropriate term of “Poisson ratio” was used.
The results obtained in the frame of this study allow for a more accurate prediction of transverse deformations and corresponding cracks and define a new limit state for bending reinforced concrete elements.
The Poisson ratio limits depend on the concrete class; it varied from 0.2 ≤ µ ≤ 0.4 for NSC and 0.15 ≤ µ ≤ 0.3 for SFHSC. For both cases, the upper limits were two times higher than the lower ones, which corresponded with structural phenomena.
The authors recommend that the obtained data are considered for the more accurate design of reinforced concrete bending elements and that the proposed theoretical concept is included in modern design provisions. When the value of transverse deformations reached 0.5‰, the corresponding longitudinal deformations were about 2.5‰, indicating that the compressed concrete was in its ultimate limit state. Therefore, design provisions should include additional recommendations that deal with the limit state of bending reinforced concrete element sections related to the formation of cracks due to transverse deformations.
Author Contributions
Conceptualization: I.I., Y.R. and K.H.; Methodology: I.I. and Y.R.; Formal analysis: Y.R.; Resources: K.H. and S.K.; Data curation: Y.R.; Software: I.I. and K.H.; Investigation: K.H.; Funding acquisition: K.H.; Writing—original draft: I.I. and Y.R.; Writing—review and editing: I.I. and Y.R.; Project administration: K.H. and S.K. All authors have read and agreed to the published version of the manuscript.
Funding
The stay of the second co-author in Germany in order to carry out the experimental part of the research was supported by the Alexander von Humboldt Foundation, Germany, Grant No. 1070064.
Institutional Review Board Statement
Not applicable.
Informed Consent Statement
Not applicable.
Data Availability Statement
No new data were created.
Acknowledgments
The authors acknowledge the support of the Alexander von Humboldt Foundation, Germany.
Conflicts of Interest
The authors declare no conflict of interest.
References
- Jastrzebski, D. Nature and Properties of Engineering Materials; John Wiley & Sons, Inc.: New York, NY, USA, 1959. [Google Scholar]
- Mihai, L.A.; Goriely, A. How to characterize a nonlinear elastic material? A review on nonlinear constitutive parameters in isotropic finite elasticity. Proc. R. Soc. A 2017, 473, 20170607. [Google Scholar] [CrossRef] [PubMed]
- Iskhakov, I.; Ribakov, Y. Theoretical stress-strain model for compressed composite cement materials. Built Environ. 2018, 175, 9–16. [Google Scholar]
- Iskhakov, I.; Ribakov, Y. Structural phenomenon of cement-based composite elements in ultimate limit state. Adv. Build. Technol. Constr. Mater. 2016, 2016, 4710752. [Google Scholar] [CrossRef]
- Aili, A.; Vandamme, M.; Torrenti, J.M.; Masson, B. Difference between Creep and Relaxation Poisson’s Ratios: Theoretical and Practical Significance for Concrete Creep Testing. In Proceedings of the 10th International Conference on Mechanics and Physics of Creep, Shrinkage, and Durability of Concrete and Concrete Structures, Vienna, Austria, 21–23 September 2015; pp. 1219–1225. [Google Scholar]
- Zhu, R.R.H.; Hsu, T.T.C. Poisson effect in reinforced concrete membrane elements. ACI Struct. J. 2002, 99, 631–640. [Google Scholar]
- Charpin, L.; Sanahuja, J. Creep and relaxation Poisson’s ratio: Back to the foundations of linear viscoelasticity. Application to concrete. Int. J. Solids Struct. 2017, 110–111, 2–14. [Google Scholar] [CrossRef]
- Kotsovos, M.D. Finite-Element Modelling of Structural Concrete; CRC Press: Boca Raton, FL, USA, 2015; 381p. [Google Scholar]
- Bazant, Z.P.; Kim, S.S. Plastic-Fracturing Theory for Concrete. ASCE J. Eng. Mech. 1979, 105, 407–428. [Google Scholar]
- Fardis, M.N.; Alibe, B.; Tassoulas, J.L. Monotonic and Cyclic Constitutive Law for Concrete. ASCE J. Eng. Mech. 1983, 109, 516–536. [Google Scholar] [CrossRef]
- López Cela, J.J. Analysis of reinforced concrete structures subjected to dynamic loads with a viscoplastic Drucker–Prager model. Appl. Math. Model. 1998, 22, 495–515. [Google Scholar] [CrossRef]
- Lydon, F.D.; Balendran, R.V. Some observations on elastic properties of plain concrete. Cem. Concr. Res. 1986, 16, 314–324. [Google Scholar] [CrossRef]
- Holschemacher, K.; Iskhakov, I.; Ribakov, Y.; Mueller, T. Laboratory Tests of Two-Layer Beams Consisting of Normal and Fibered High Strength Concrete: Ductility and Technological Aspects. Mech. Adv. Mater. Struct. 2012, 19, 513–522. [Google Scholar] [CrossRef]
- Iskhakov, I.; Ribakov, Y.; Holschemacher, K.; Mueller, T. High Performance Repairing of Reinforced Concrete Structures. Mater. Des. 2013, 44, 216–222. [Google Scholar] [CrossRef]
- Iskhakov, I.; Ribakov, Y.; Holschemacher, K.; Mueller, T. Experimental Investigation of Full Scale Two-Layer Reinforced Concrete Beams. Mech. Adv. Mater. Struct. 2014, 21, 273–283. [Google Scholar] [CrossRef]
- Iskhakov, I.; Ribakov, Y.; Holschemacher, K. Experimental Investigation of Continuous Two-Layer Reinforced Concrete Beam. Struct. Concr. 2017, 18, 205–215. [Google Scholar] [CrossRef]
- Iskhakov, I.; Ribakov, Y.; Holschemacher, K.; Kaeseberg, S. Experimental Investigation and Comparison of Pre-Stressed Single-Layer and Repaired Two-Layer Reinforced Concrete Beams. Struct. Concr. 2020, 21, 2396–2407. [Google Scholar] [CrossRef]
- Iskhakov, I.; Ribakov, Y.; Holschemacher, K.; Kaeseberg, S. Experimental Investigation of Pre-Stressed Two Layer Reinforced Concrete Beams. Struct. Concr. 2021, 22, 238–249. [Google Scholar] [CrossRef]
- Iskhakov, I.; Ribakov, Y. Structural Phenomenon Based Theoretical Model of Concrete Tensile Behavior at Different Stress–Strain Conditions. J. Build. Eng. 2021, 33, 101594. [Google Scholar] [CrossRef]
- Mexico Earthquake September 2017. Available online: https://twitter.com/nssoaxaca/status/910224886014136320?refsrc=twsrc%5Etfw%7Ctwcamp%5Etweetembed%7Ctwterm%5E910224886014136320&ref_url=https%3A%2F%2Fwww.businessinsider.com%2Fmexico-puebla-earthquake-photos-videos-twitter-facebook-2017-9 (accessed on 9 November 2022).
- Iskhakov, I.; Ribakov, Y. Transverse Deformations and Structural Phenomenon as Indicators of Steel Fiberes High-Strength Concrete Nonlinear Behavior. Adv. Mater. Sci. Eng. 2019, 2019, 9147849. [Google Scholar] [CrossRef]
- Carrillo, J.; Ramirez, J.; Lizarazo-Marriaga, J. Modulus of elasticity and Poisson’s ratio of fiber-reinforced concrete in Colombia from ultrasonic pulse velocities. J. Build. Eng. 2019, 23, 18–26. [Google Scholar] [CrossRef]
- Deutscher Beton-und Bautechnik-Verein e.V. DBV-Merkblatt Stahlfaserbeton; Deutscher Beton-und Bautechnik-Verein e.V.: Wiesbaden, Germany, 2001. (In German) [Google Scholar]
- Vandewalle, L.; Nemegeer, D.; Balazs, L.; Barr, B.; Barros, J.; Bartos, P.; Banthia, N.; Criswell, M.; Denarie, E.; Di Prisco, M.; et al. RILEM TC 162-TDF: Test and Design Methods for Steel Fibre. Mater. Struct. 2002, 35, 579–582. [Google Scholar]
- Neville, A.M. Properties of Concrete, 3rd ed.; Longman Scientific and Technical: Essex, UK, 2002. [Google Scholar]
- DIN 1045-1; Tragwerke aus Beton, Stahlbeton und Spannbeton—Teil 1 Bemessung und Konstruktion. DIN Deutsches Institut für Normung e.V.: Berlin, Germany, 2008. (In German)
- Catman Professional Rel. version 4.5. HBM (Hottinger Baldwin Messtechnik GmbH) Software. HBM: Darmstadt, Germany, 2004.
- Iskhakov, I.; Frolov, I.; Ribakov, Y. Experimental Investigation of Concrete Transverse Deformations at Relatively High Loading Rates for Interpretation of High Strength Concrete Behavior. Appl. Sci. 2021, 11, 8460. [Google Scholar] [CrossRef]
| Disclaimer/Publisher’s Note: The statements, opinions and data contained in all publications are solely those of the individual author(s) and contributor(s) and not of MDPI and/or the editor(s). MDPI and/or the editor(s) disclaim responsibility for any injury to people or property resulting from any ideas, methods, instructions or products referred to in the content. |
© 2023 by the authors. Licensee MDPI, Basel, Switzerland. This article is an open access article distributed under the terms and conditions of the Creative Commons Attribution (CC BY) license (https://creativecommons.org/licenses/by/4.0/).


