
Multi-Layer QoE Learning System Implemented by Fiberhost


Abstract
:1. Introduction
1.1. Commercial Solutions
1.2. Related Works
1.3. Overview
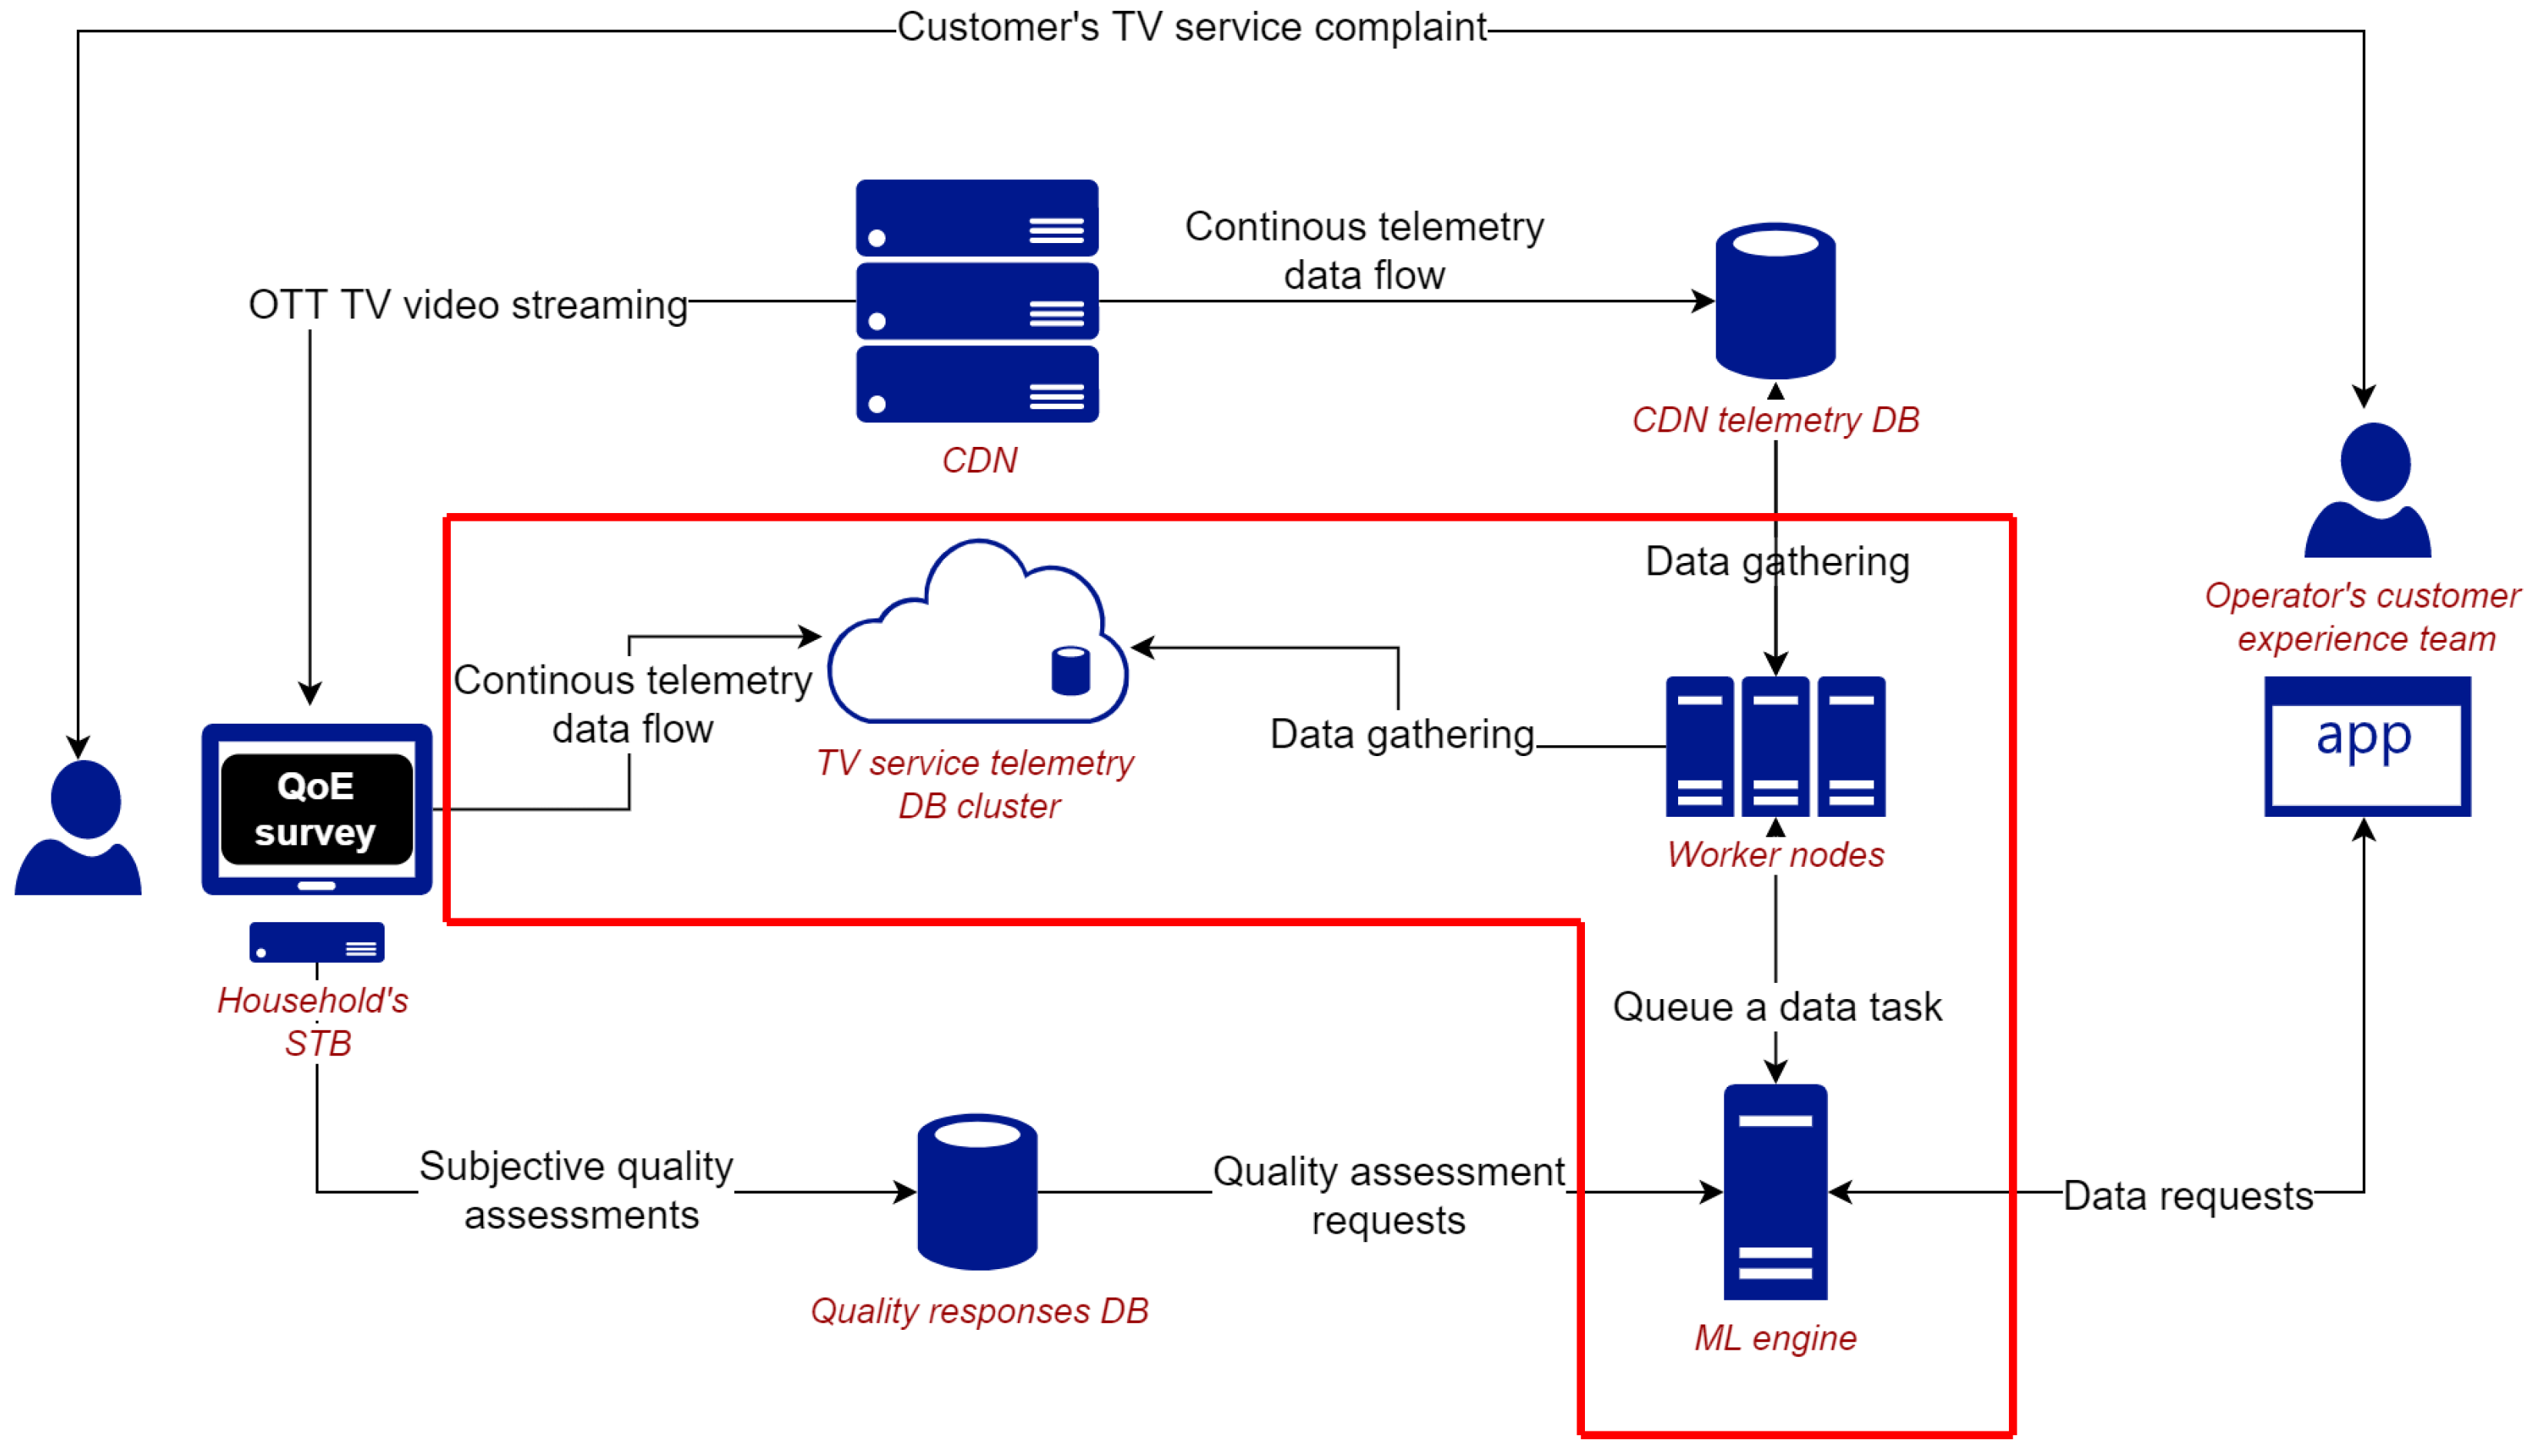
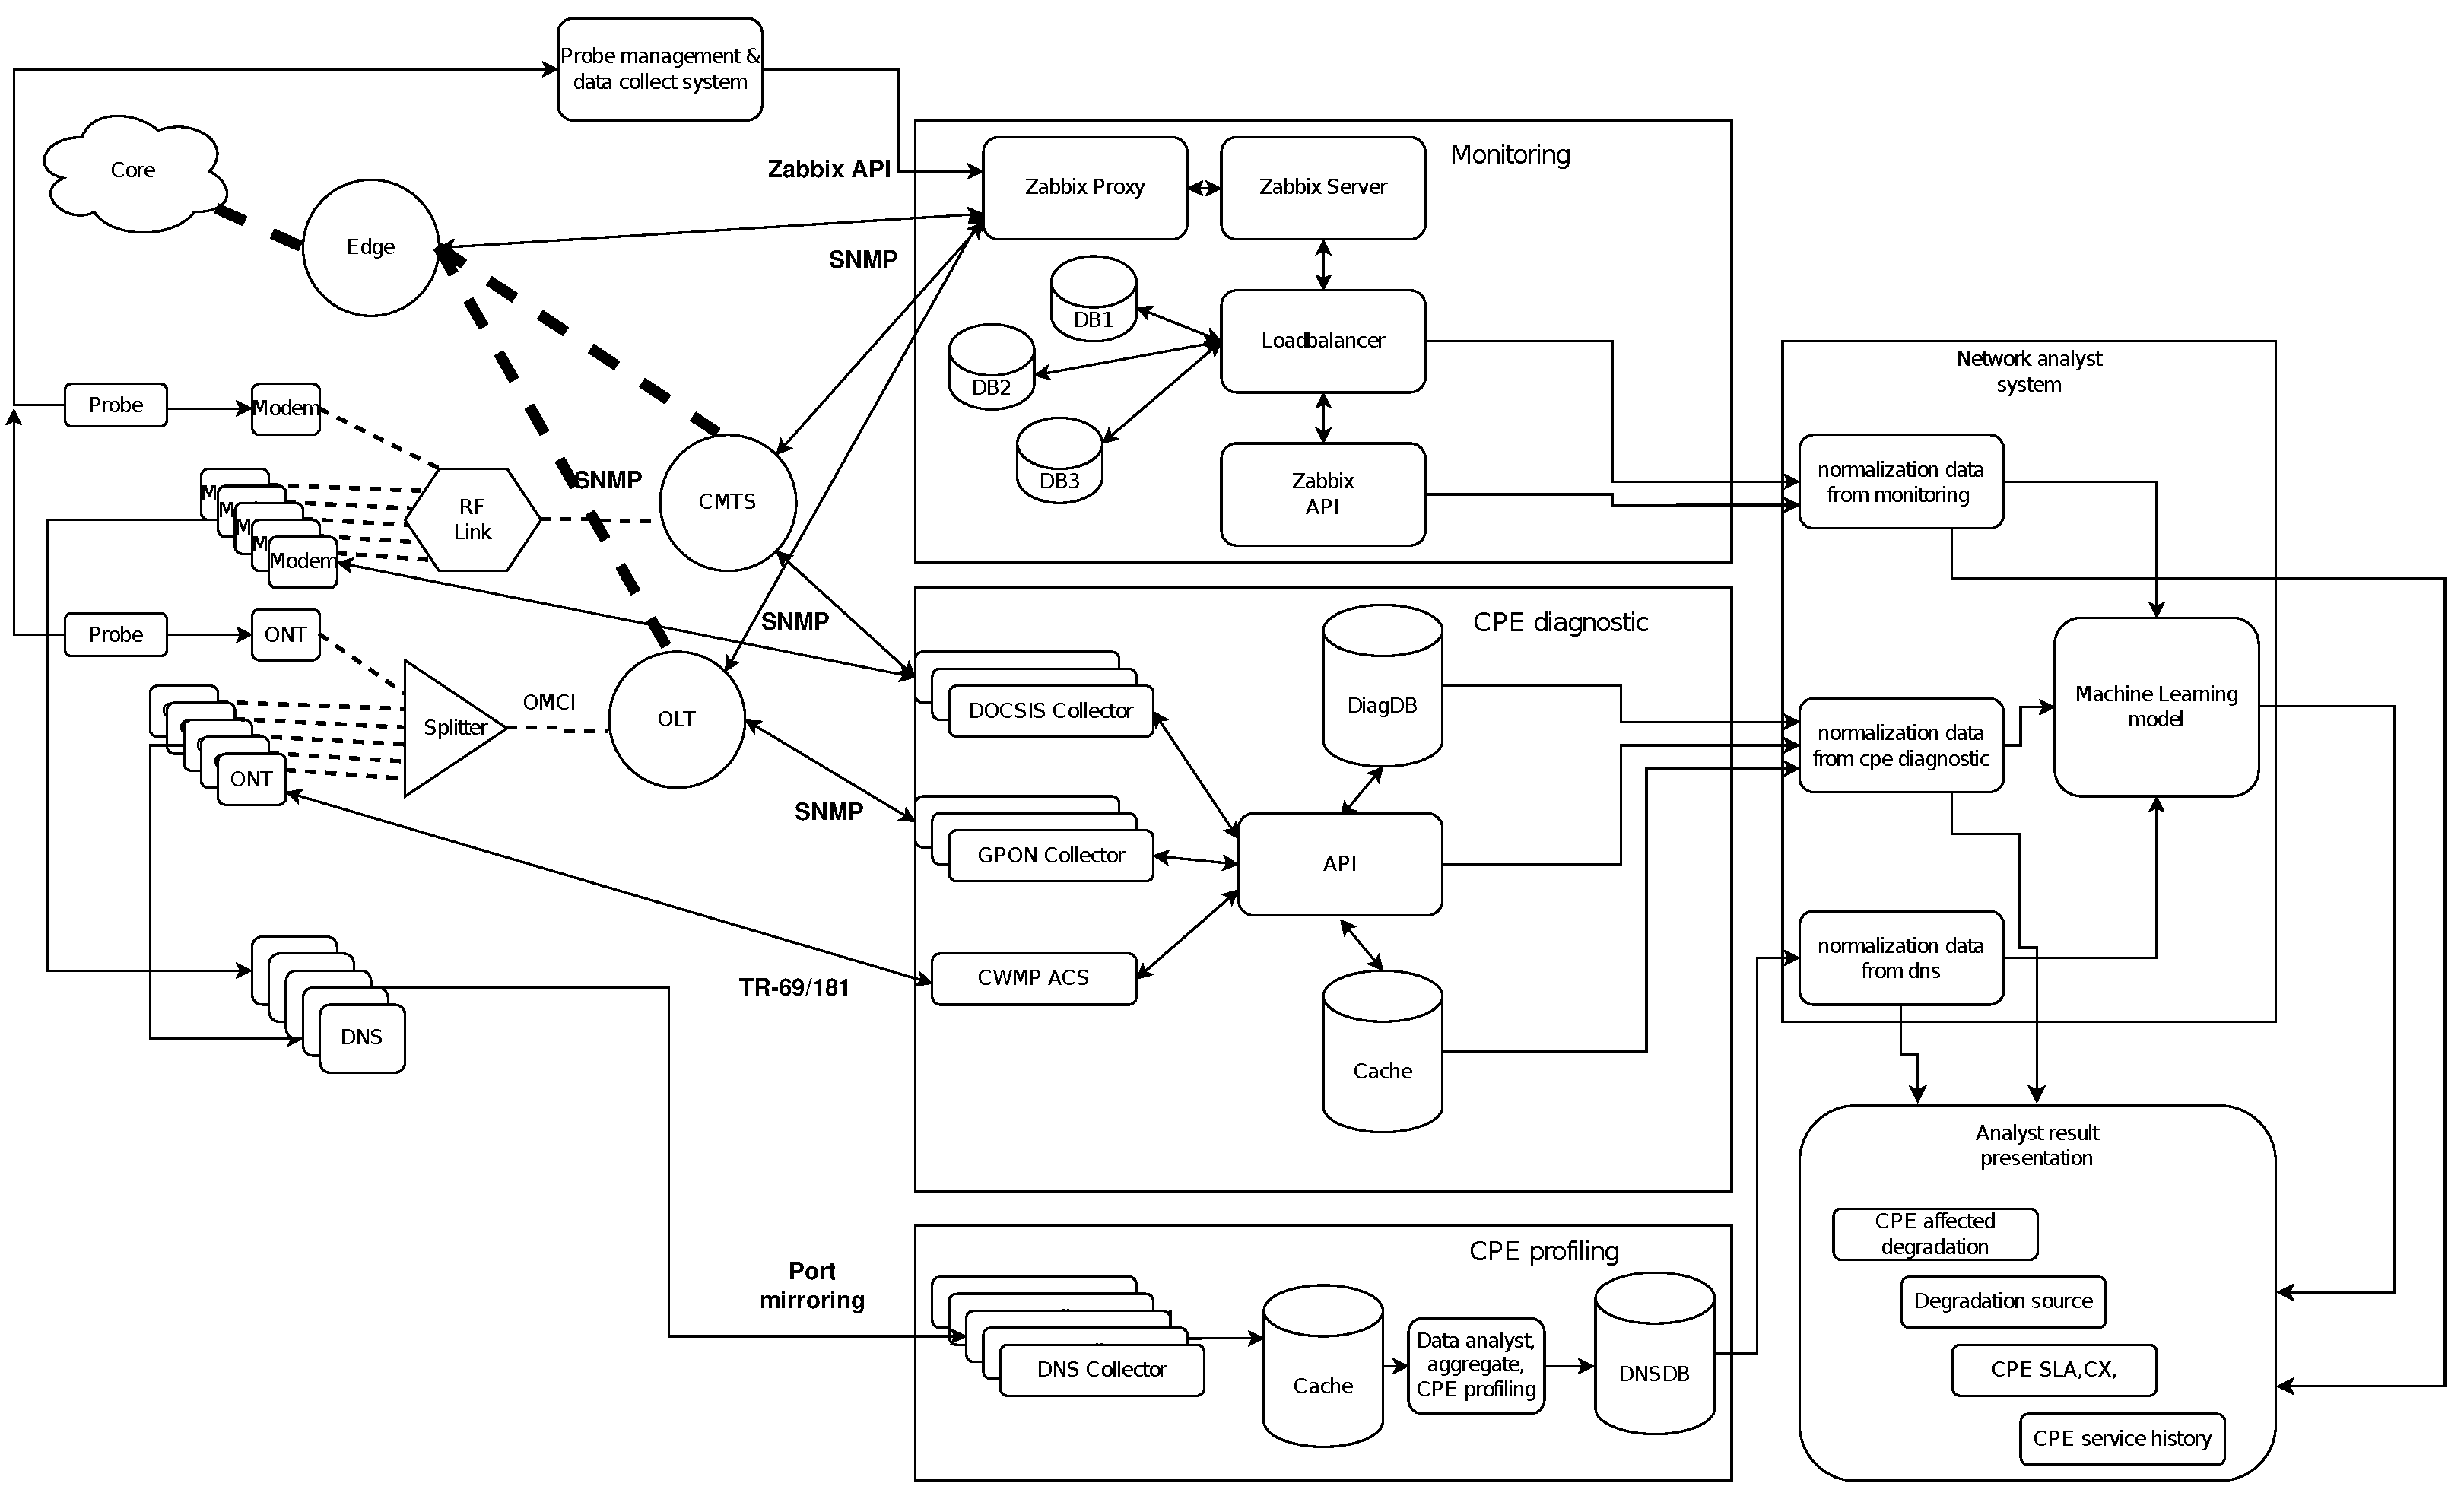
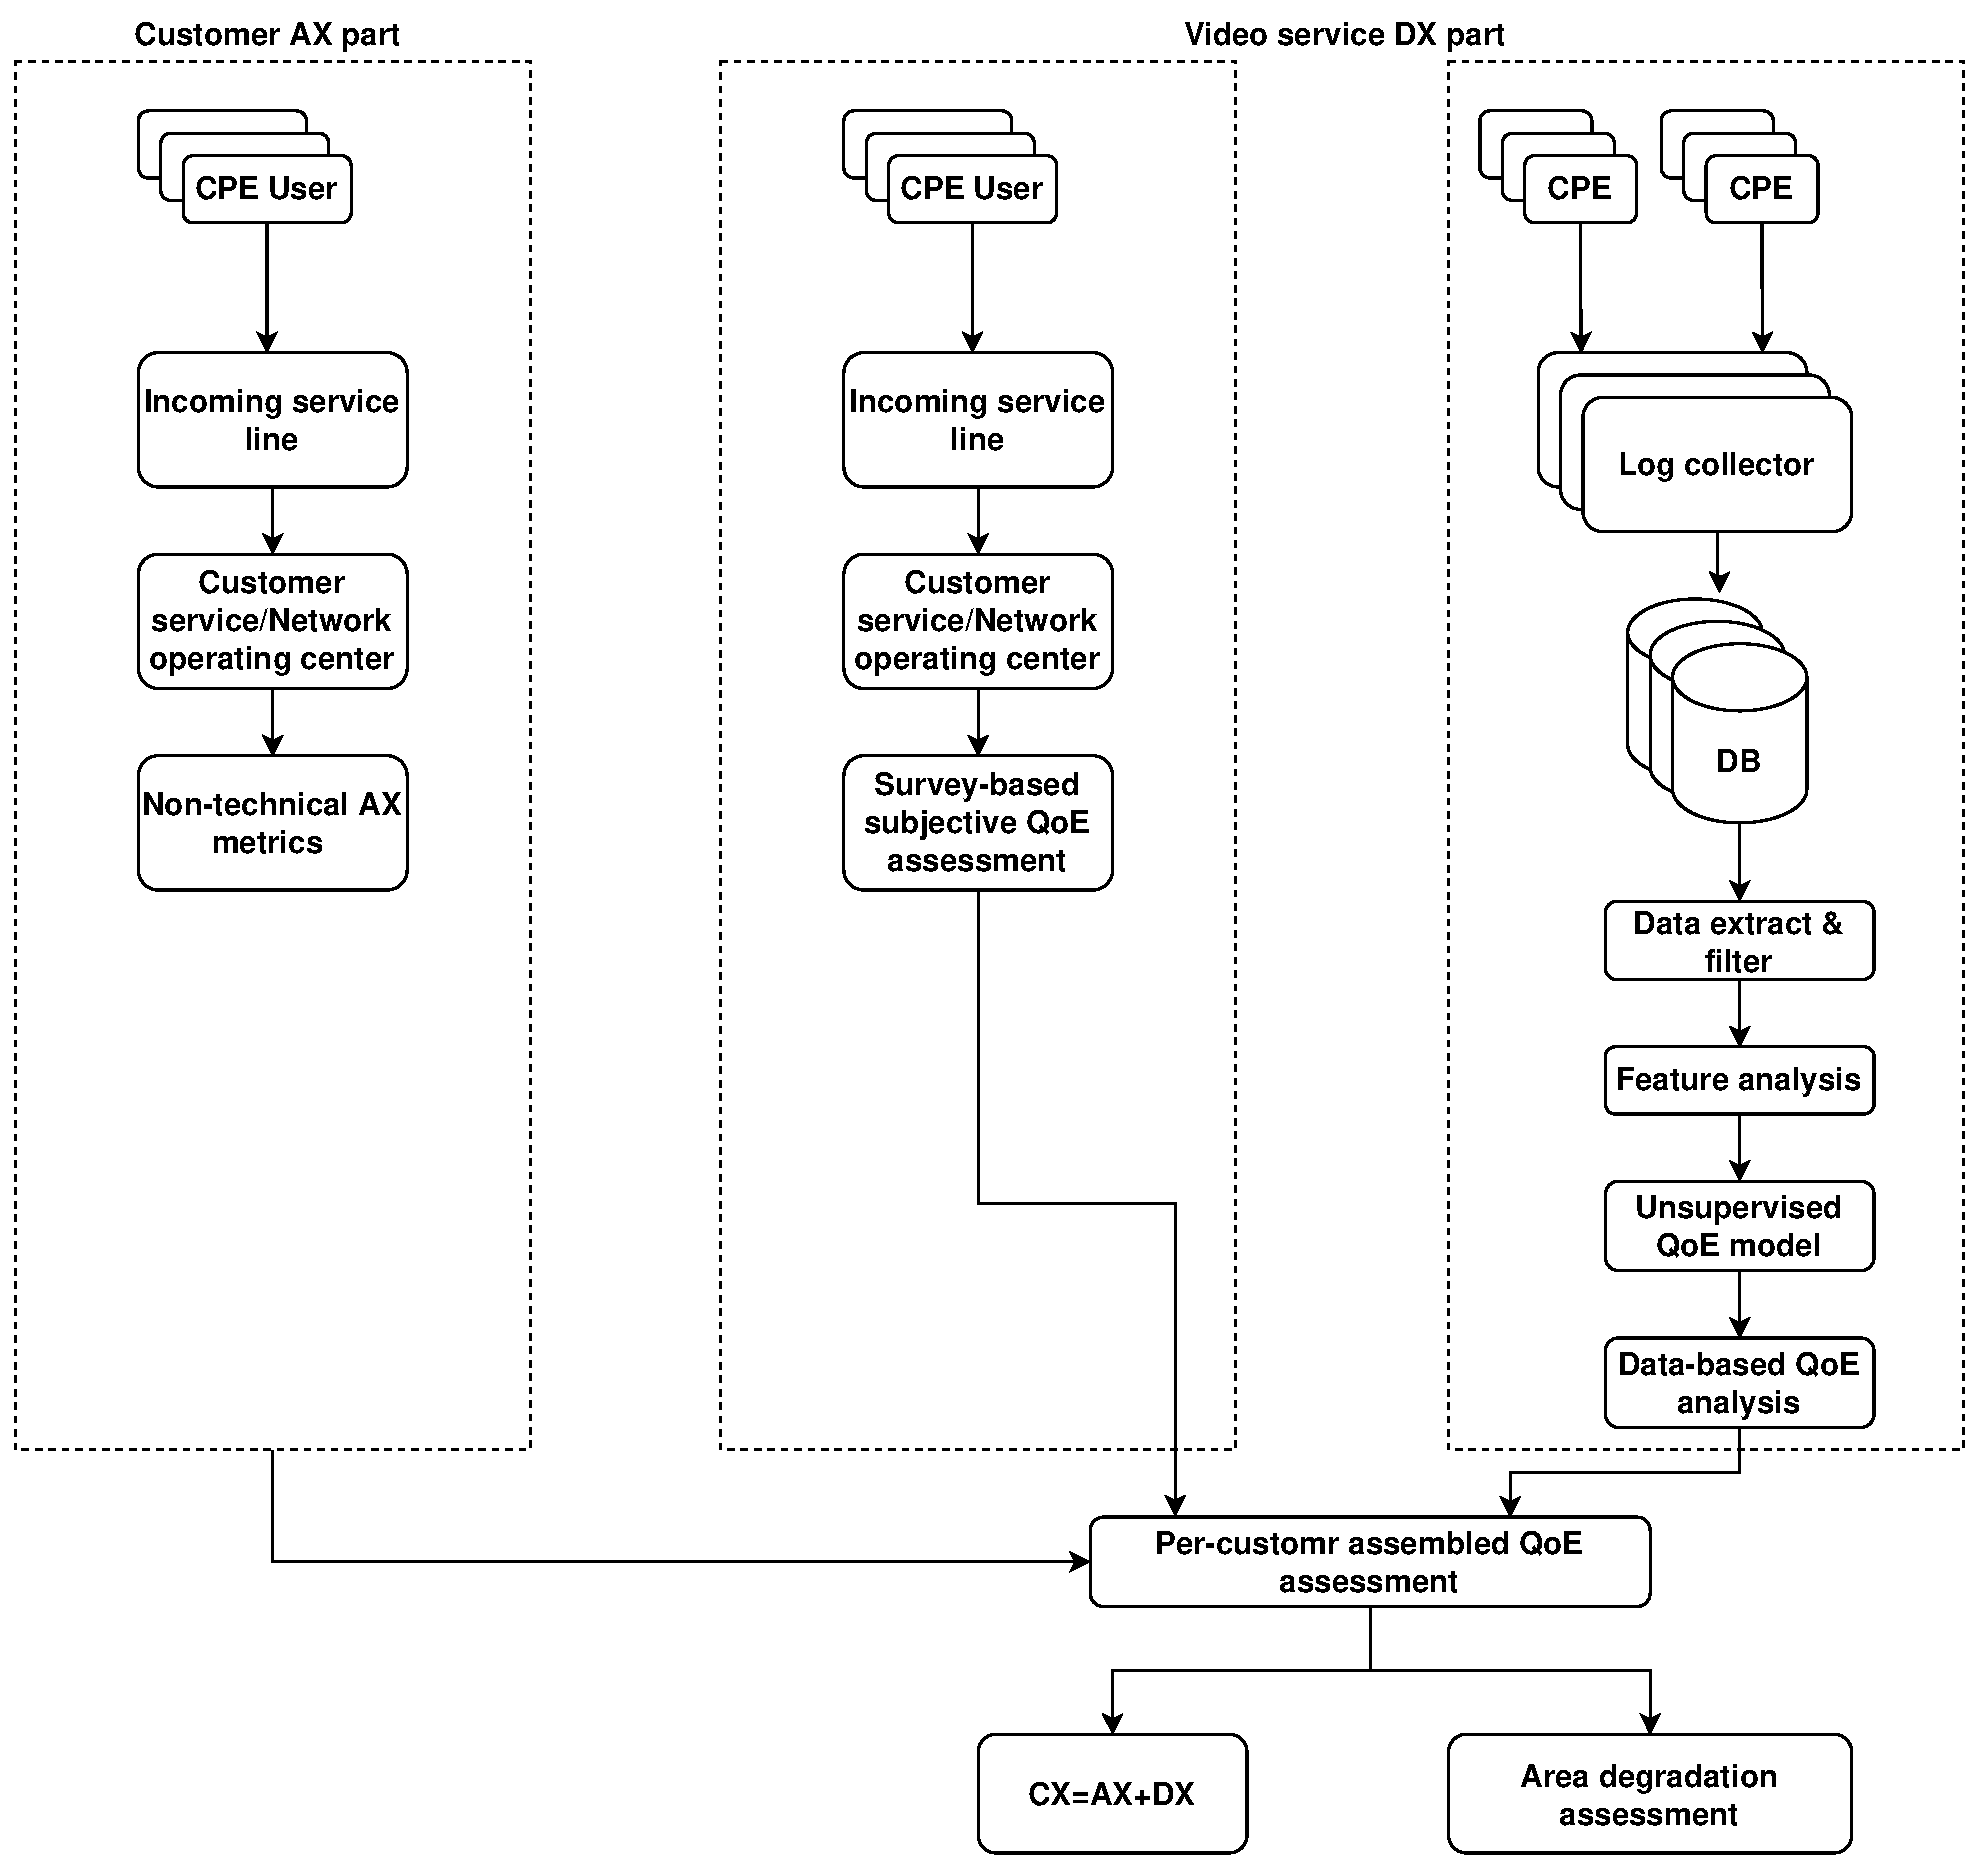
2. Data Collection Infrastructure
- Service and device Monitoring—which is the part responsible for monitoring of the health of all network devices, except CPEs and services that are configured on these devices, as well as performance Key Performance Indicators (KPIs) such as temperature, CPU load, memory utilization, etc.
- CPE diagnostics—which is the part responsible for monitoring of CPEs as well as allowing simple diagnostics to be conducted, such as ping, etc.
- CPE profiling—which is still under construction, and which will enable user behavior profiling, though this will require the end customer’s consent.
3. Multi-Layer QoE Metric Nature
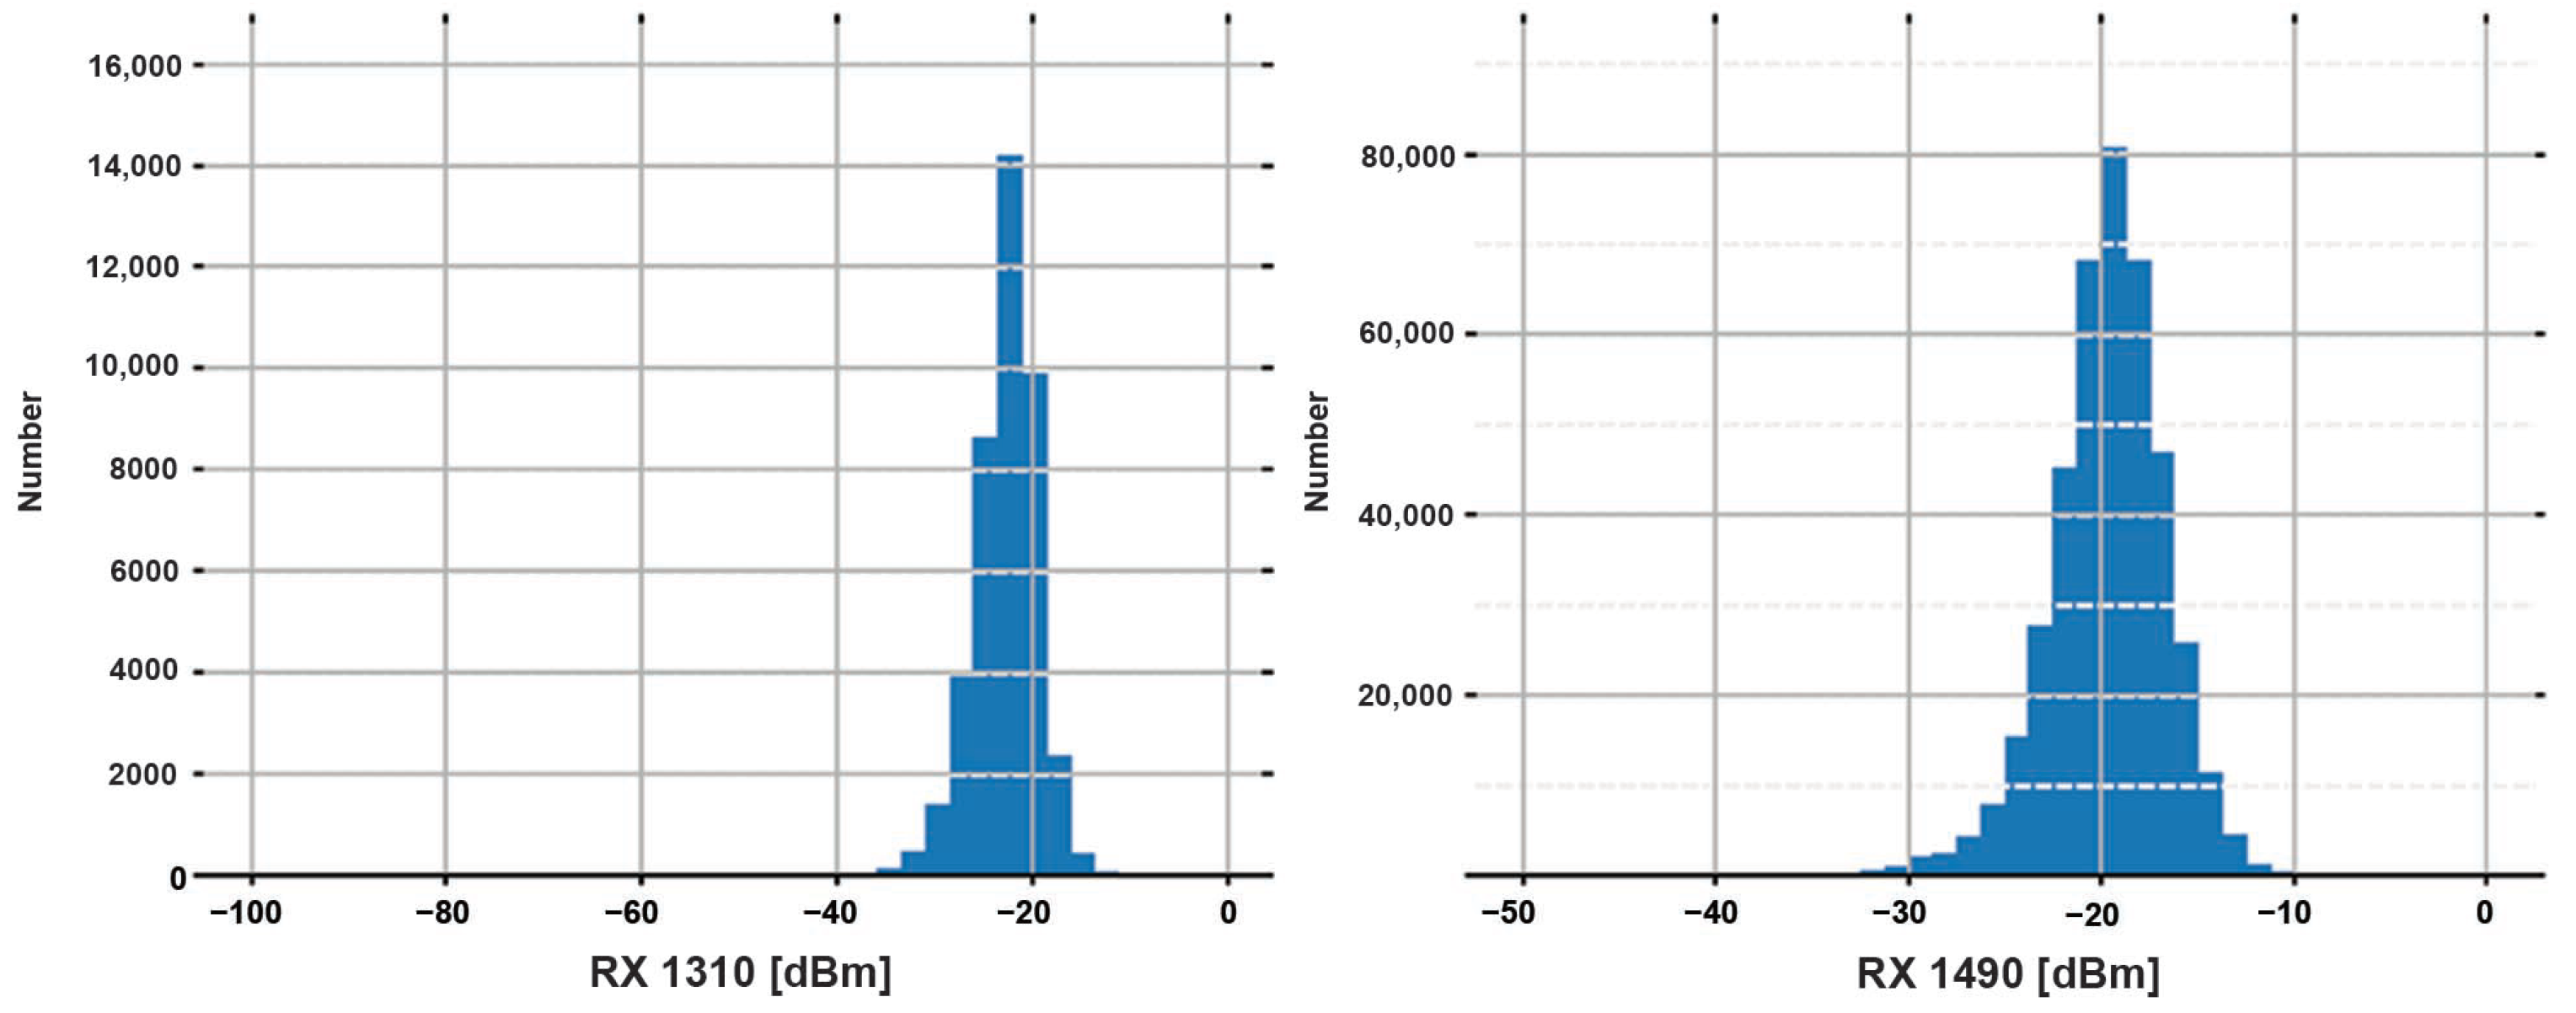
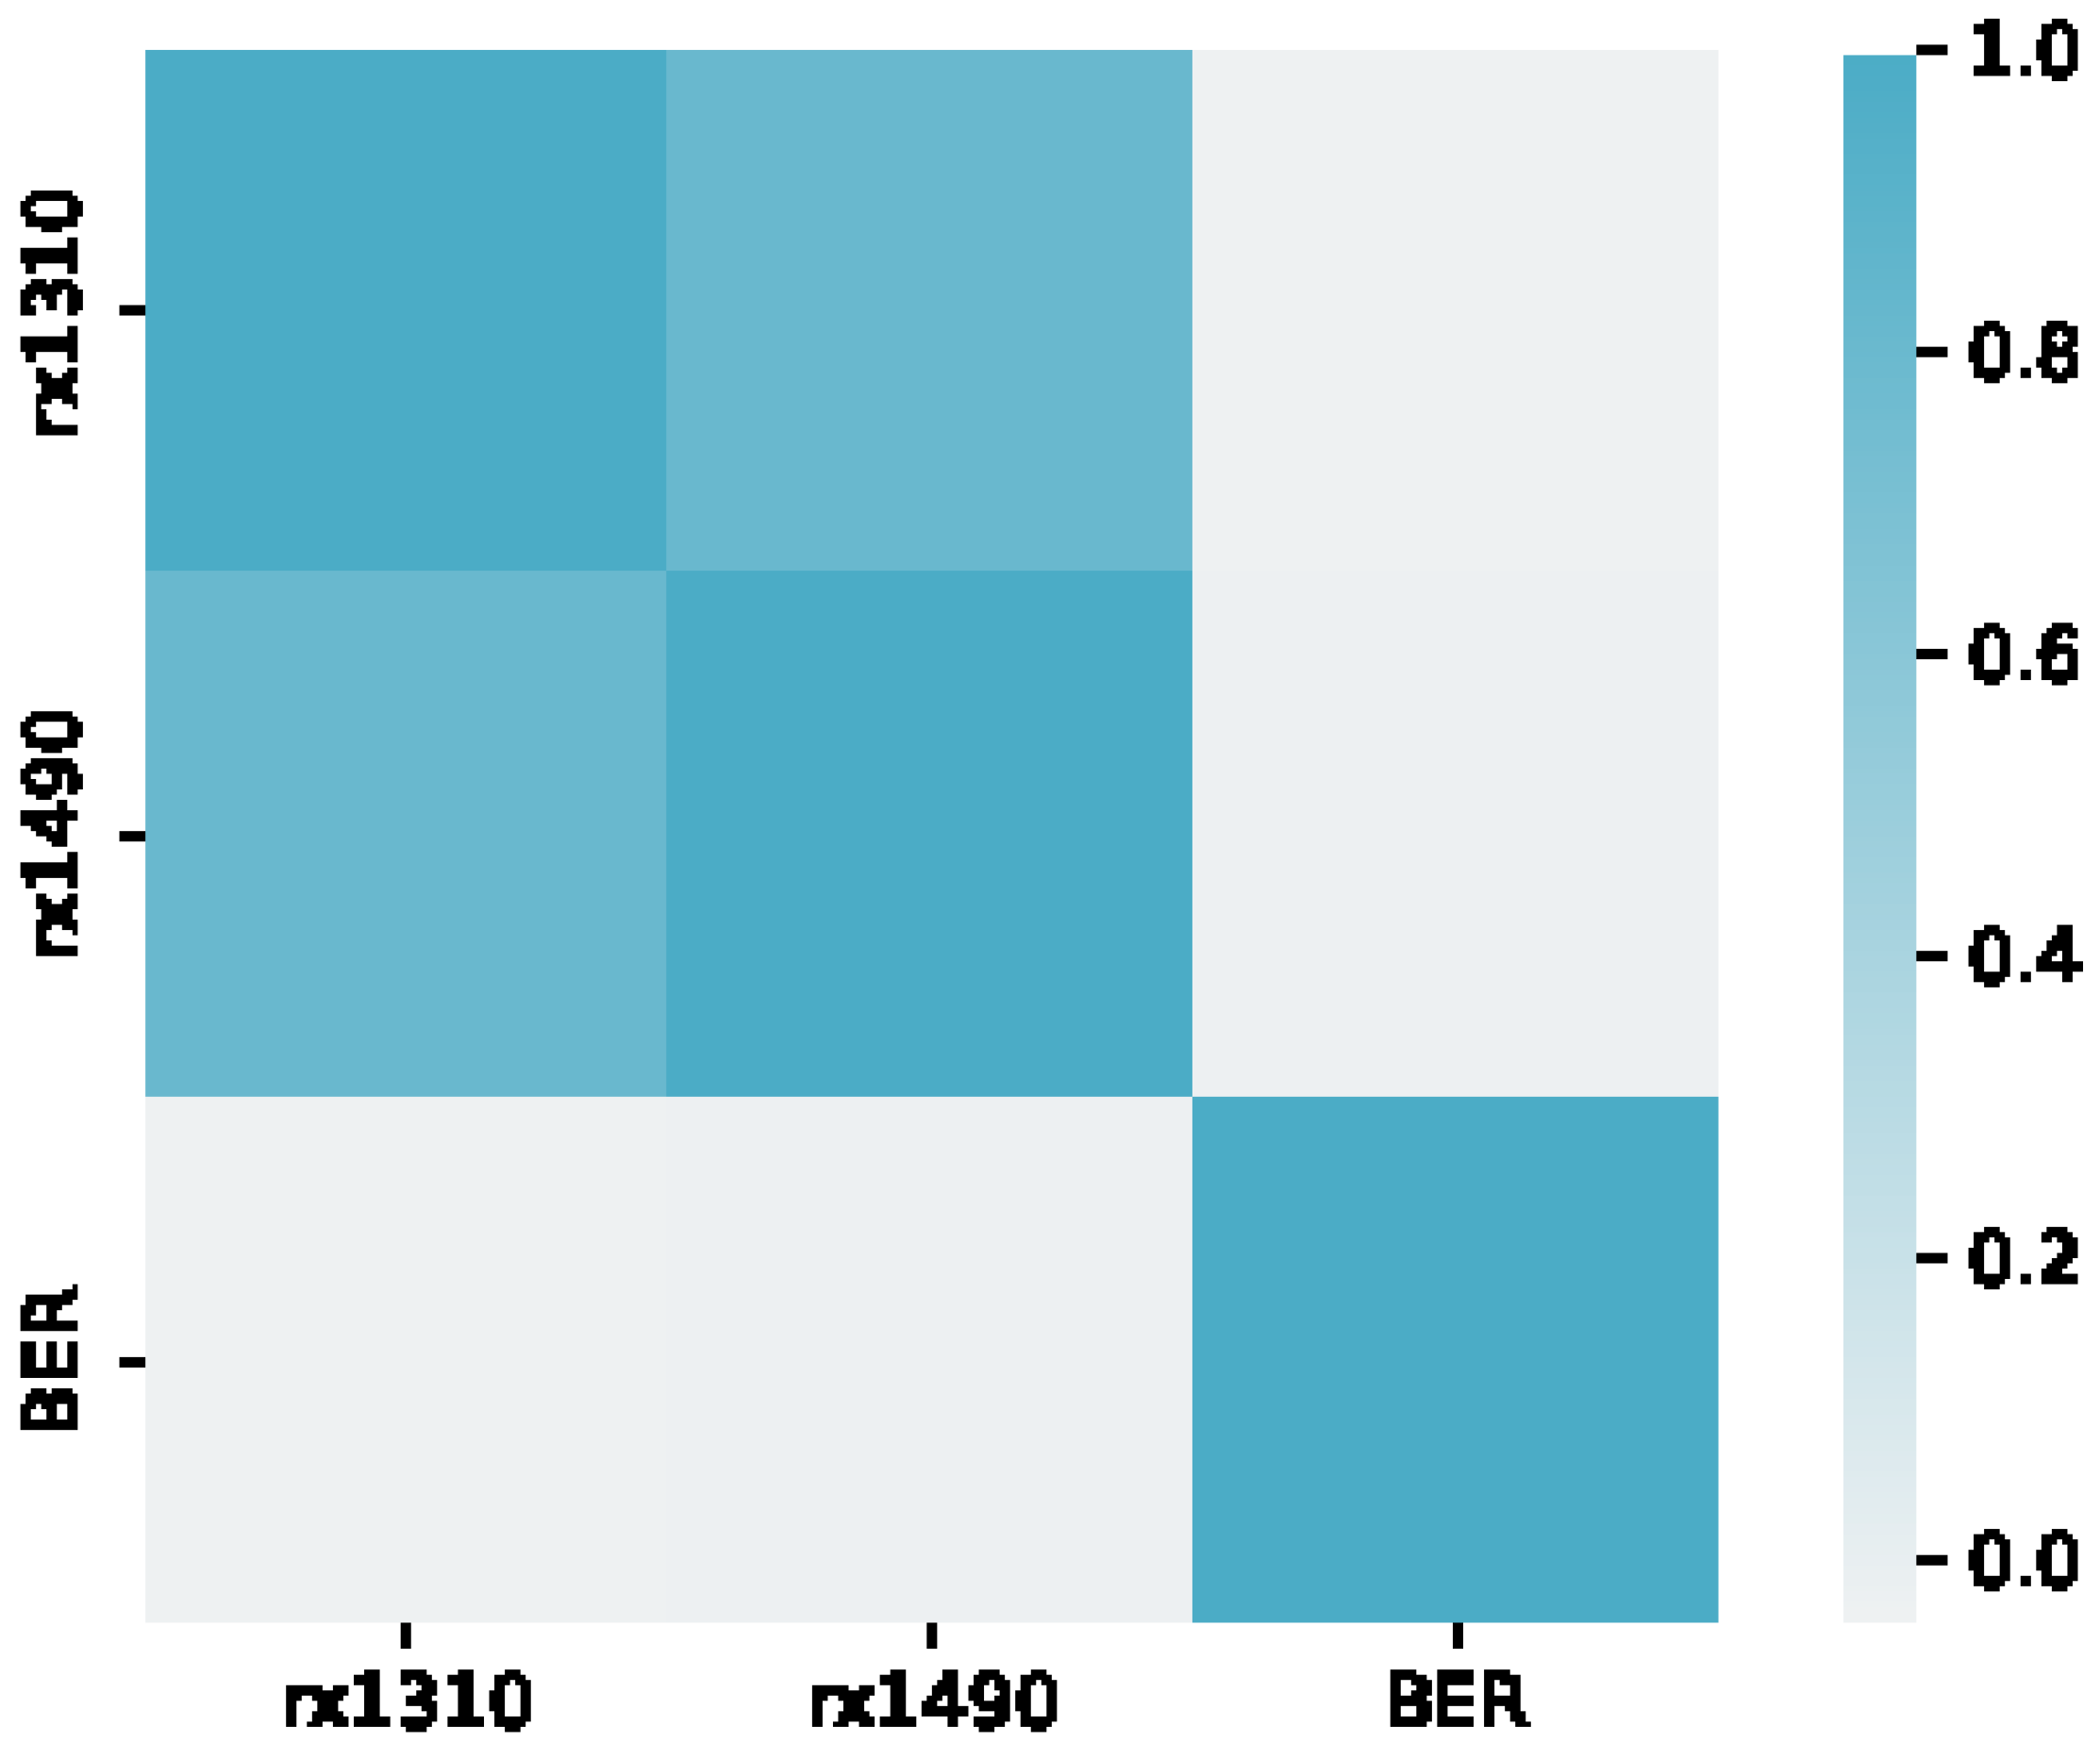
3.1. Infrastructure Layer
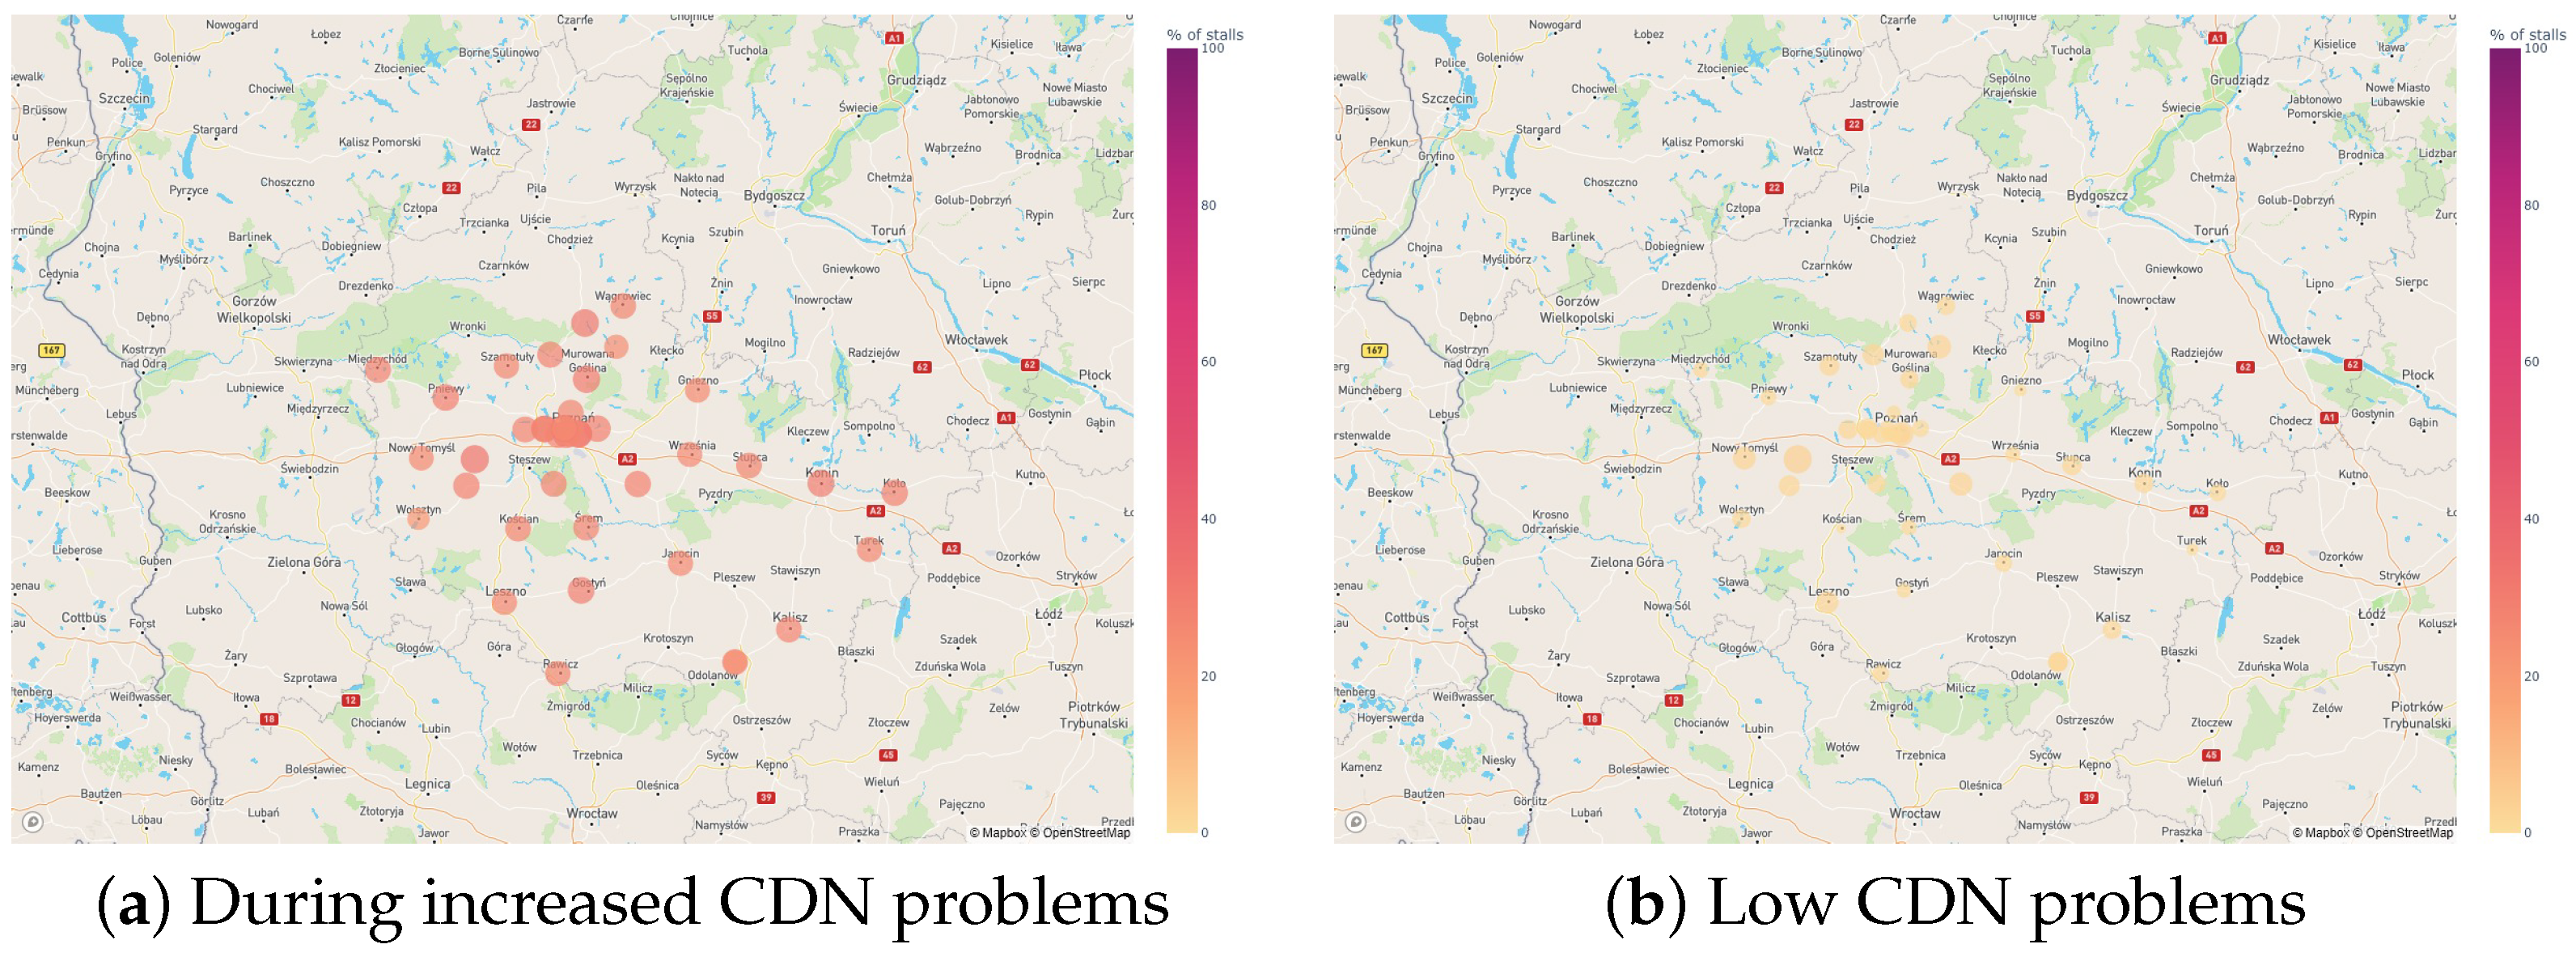
3.2. Internet Service Layer
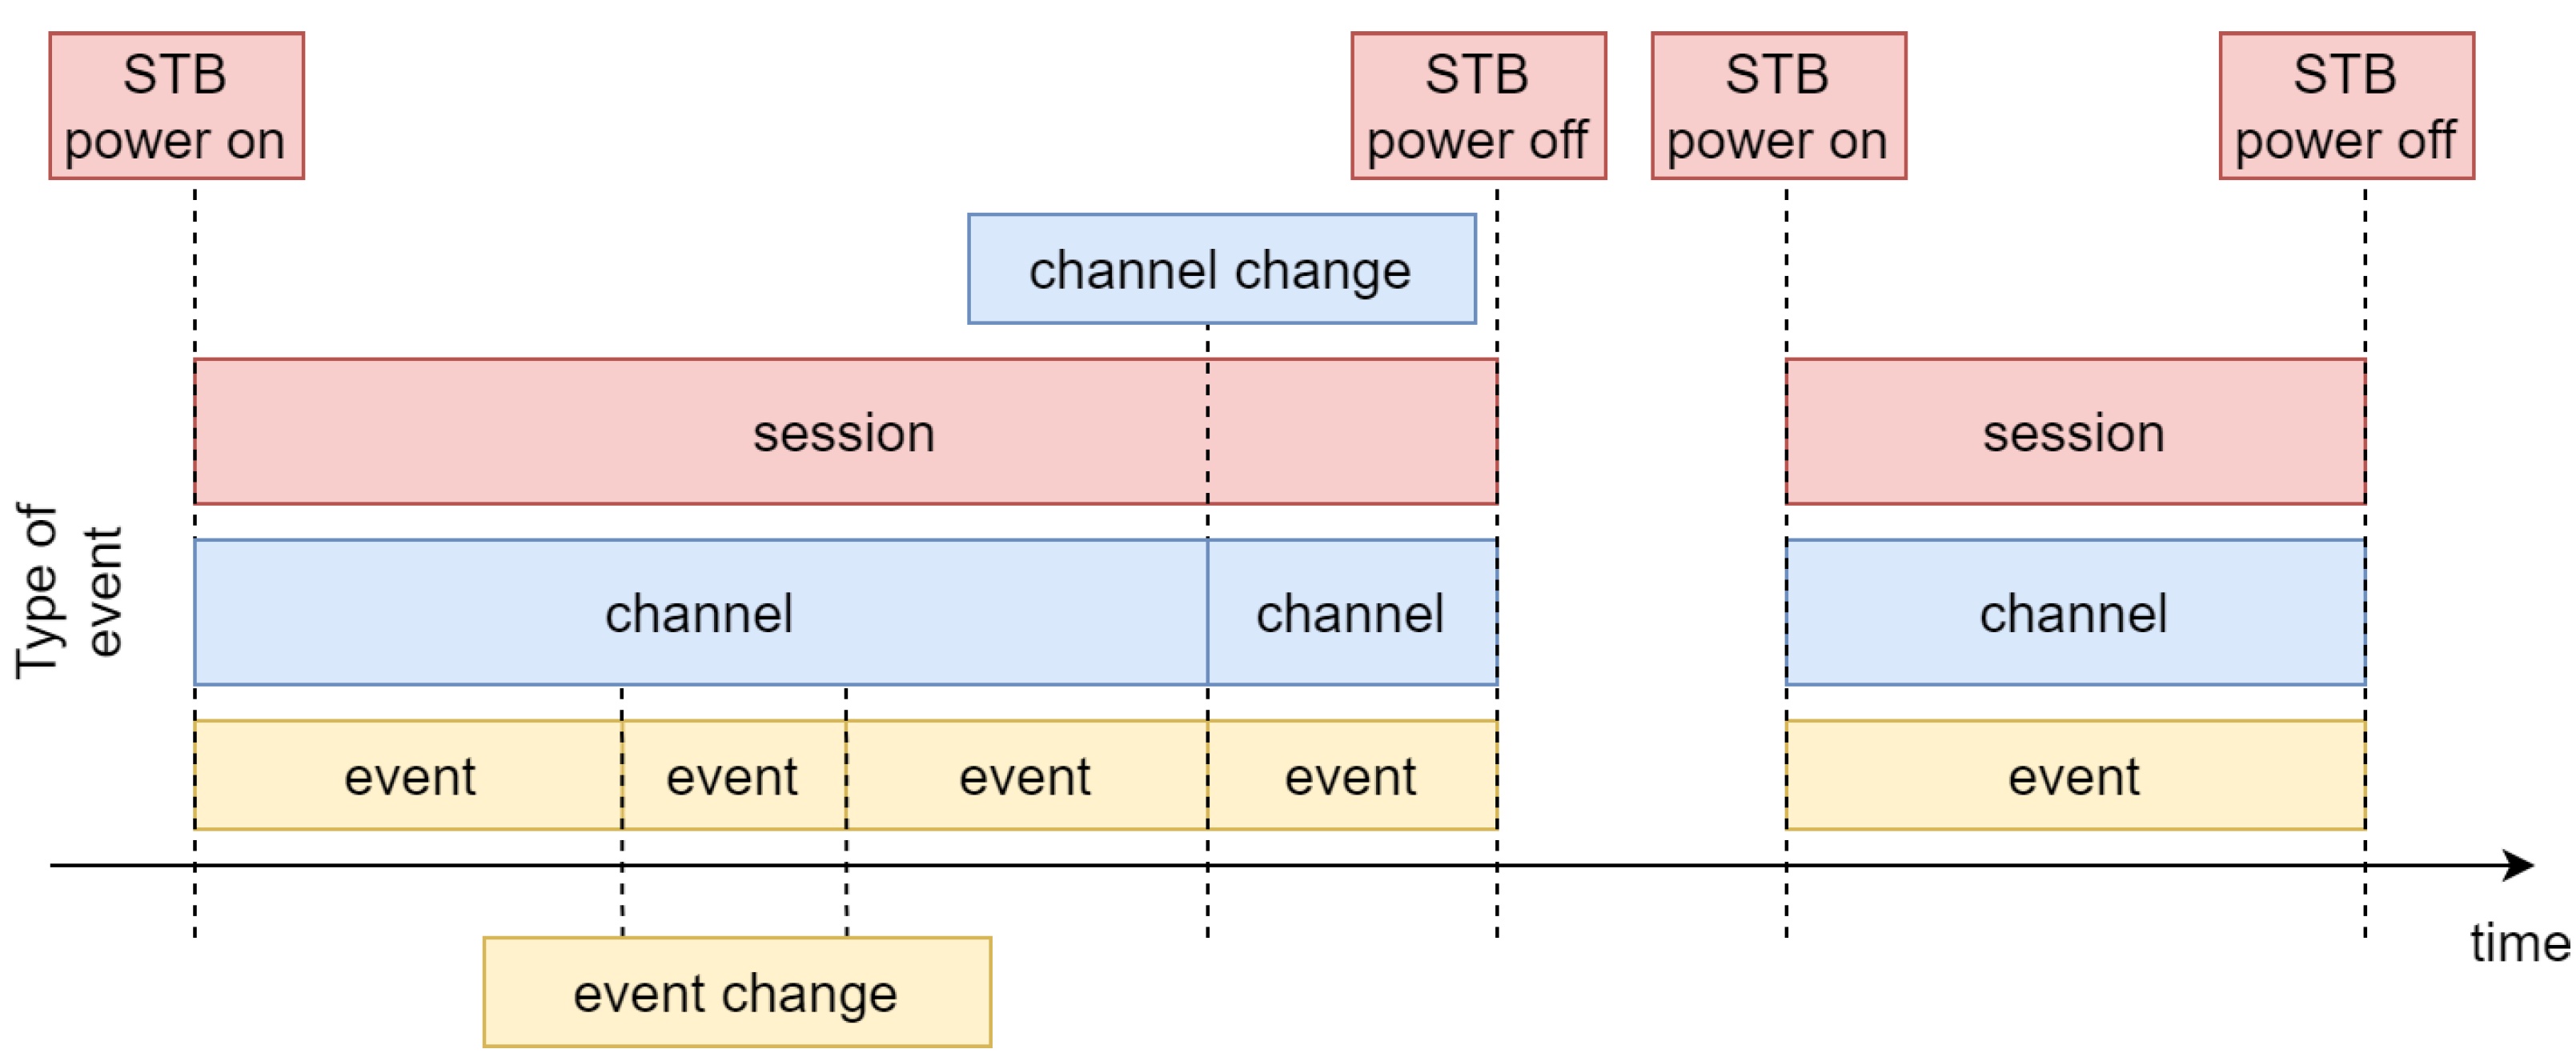
3.3. Tv Service Layer
3.4. Telephony Service Layer
4. Compound QoE Metric Used in Multi-Layer QoE assessment
5. Implementation of Unsupervised Learning
5.1. Outline of Unsupervised Part of System
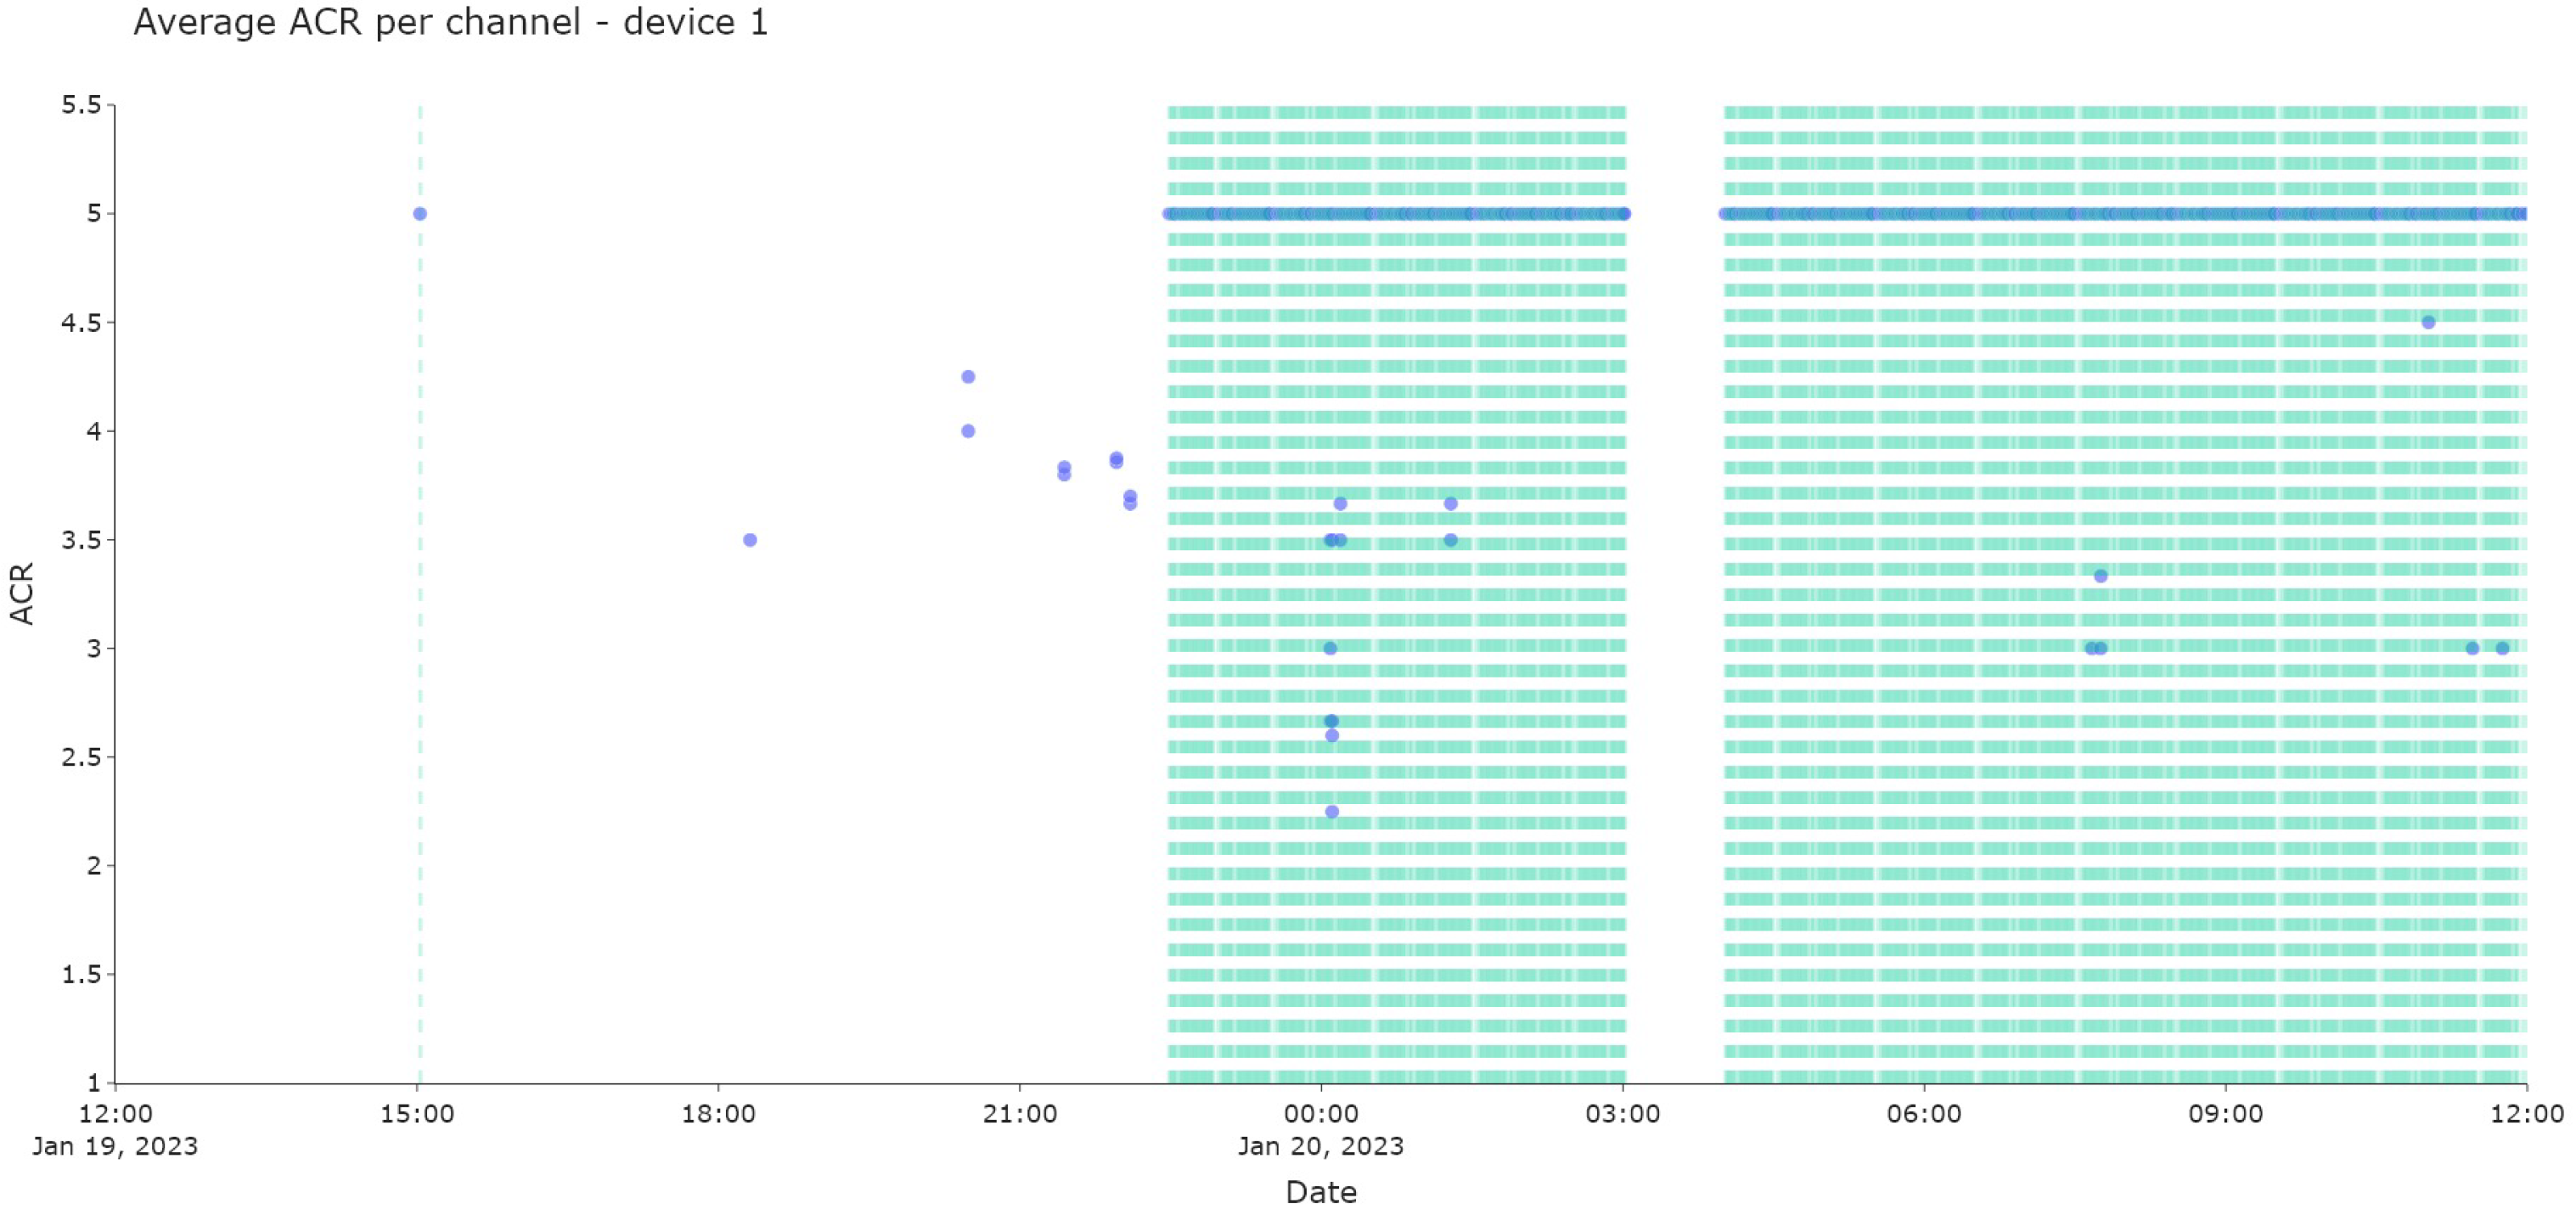
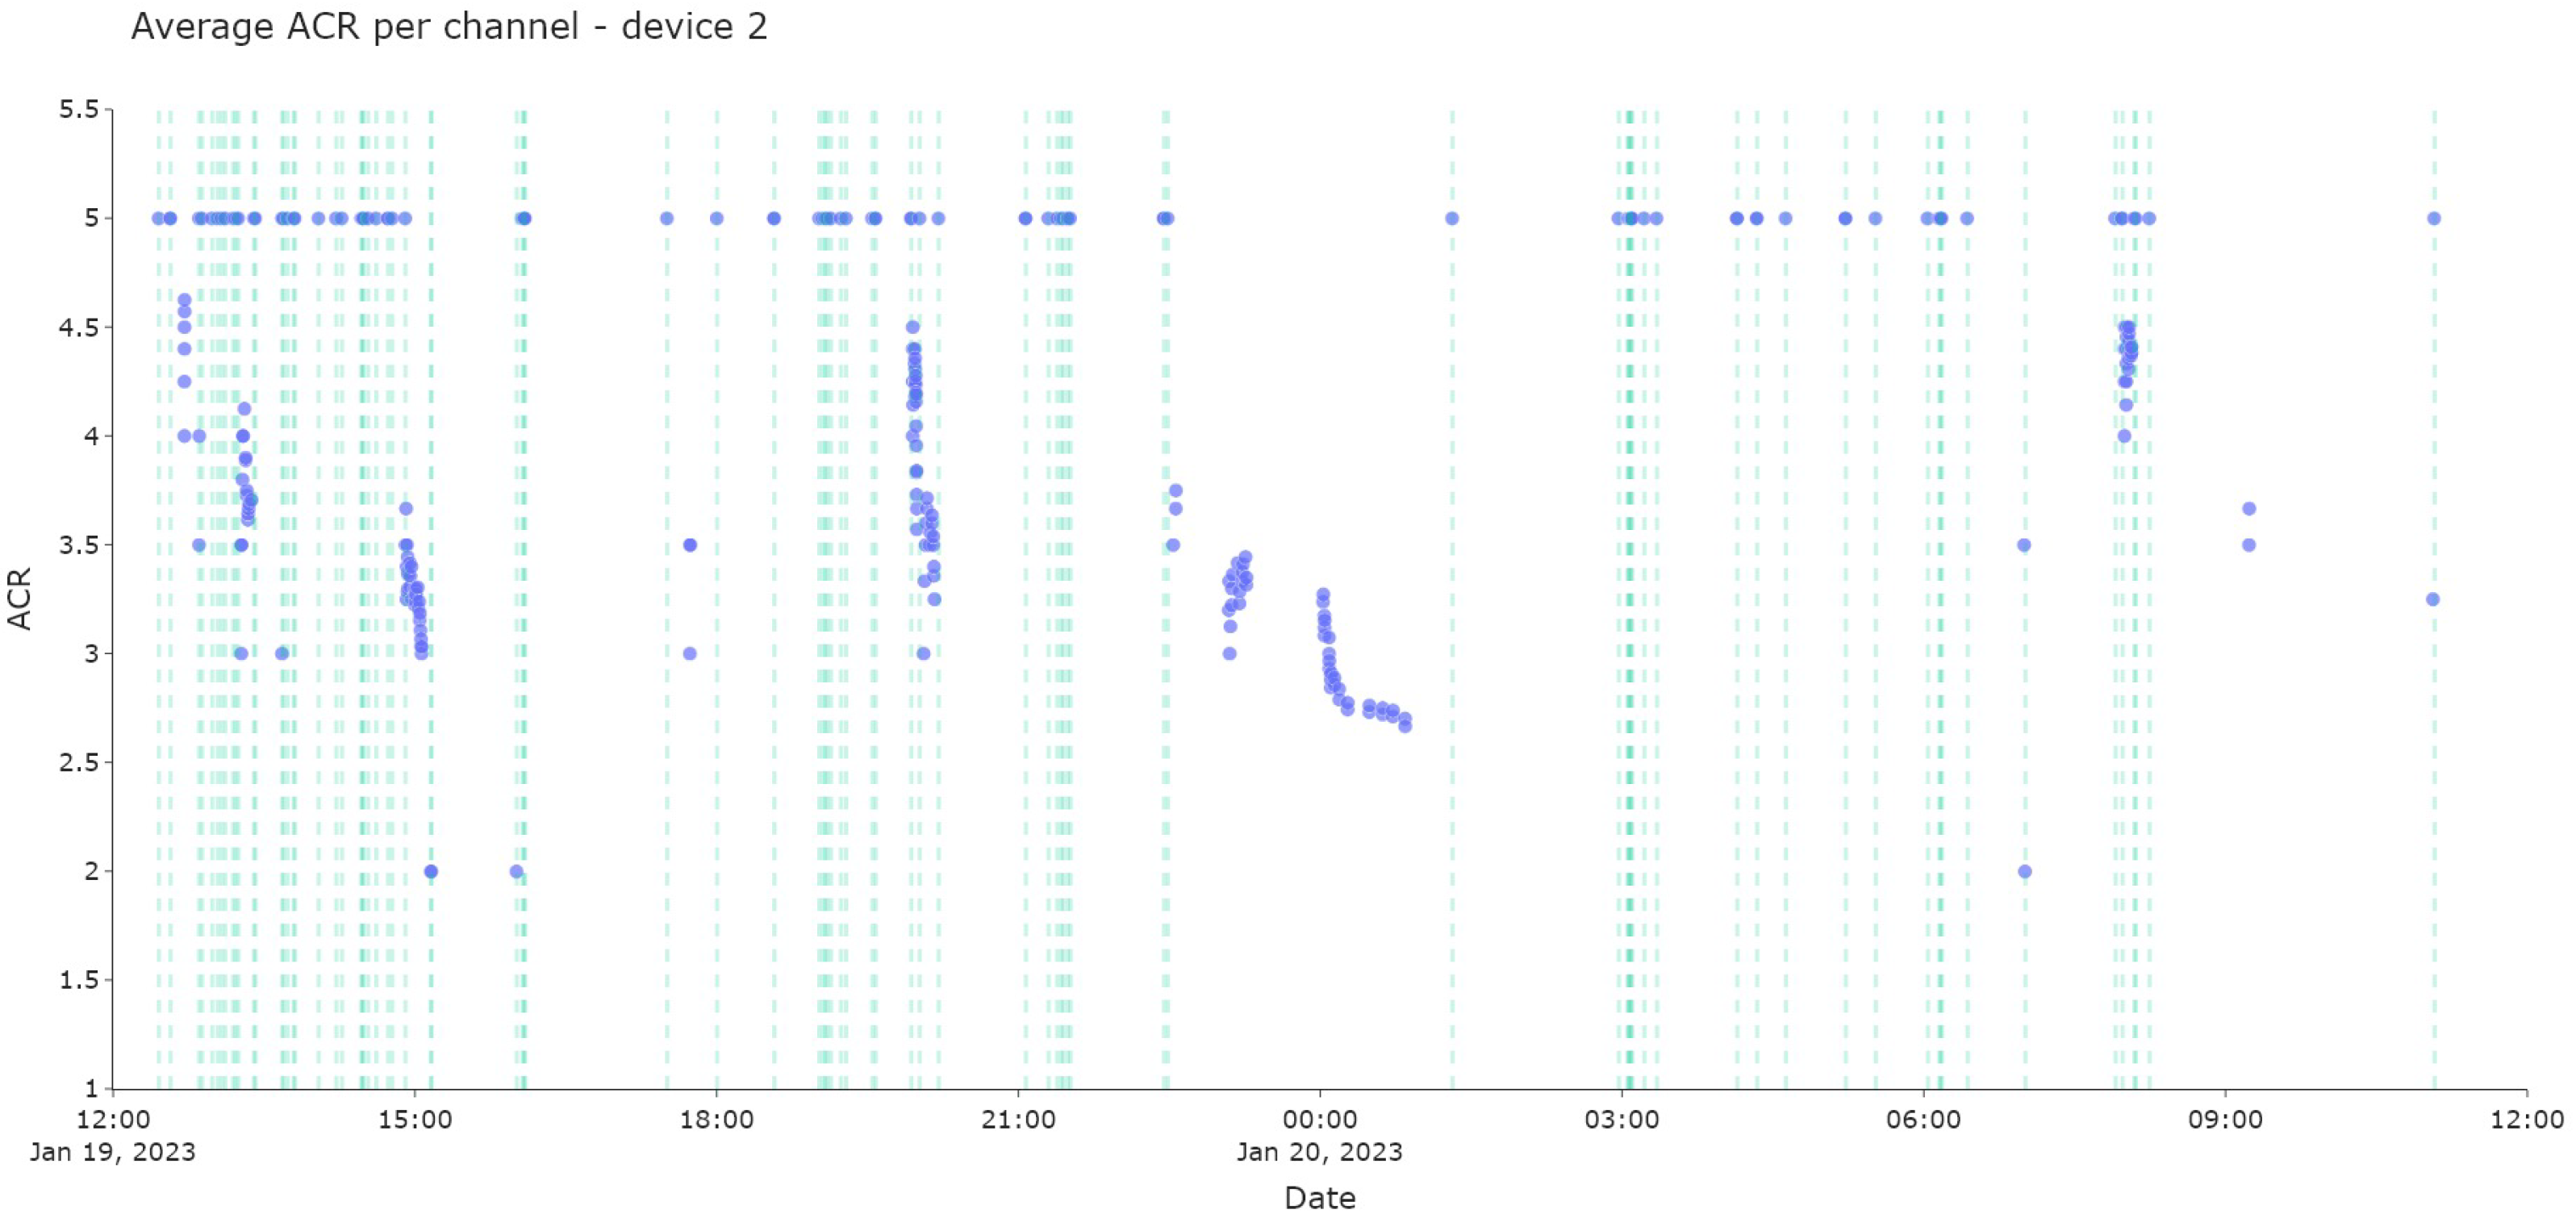
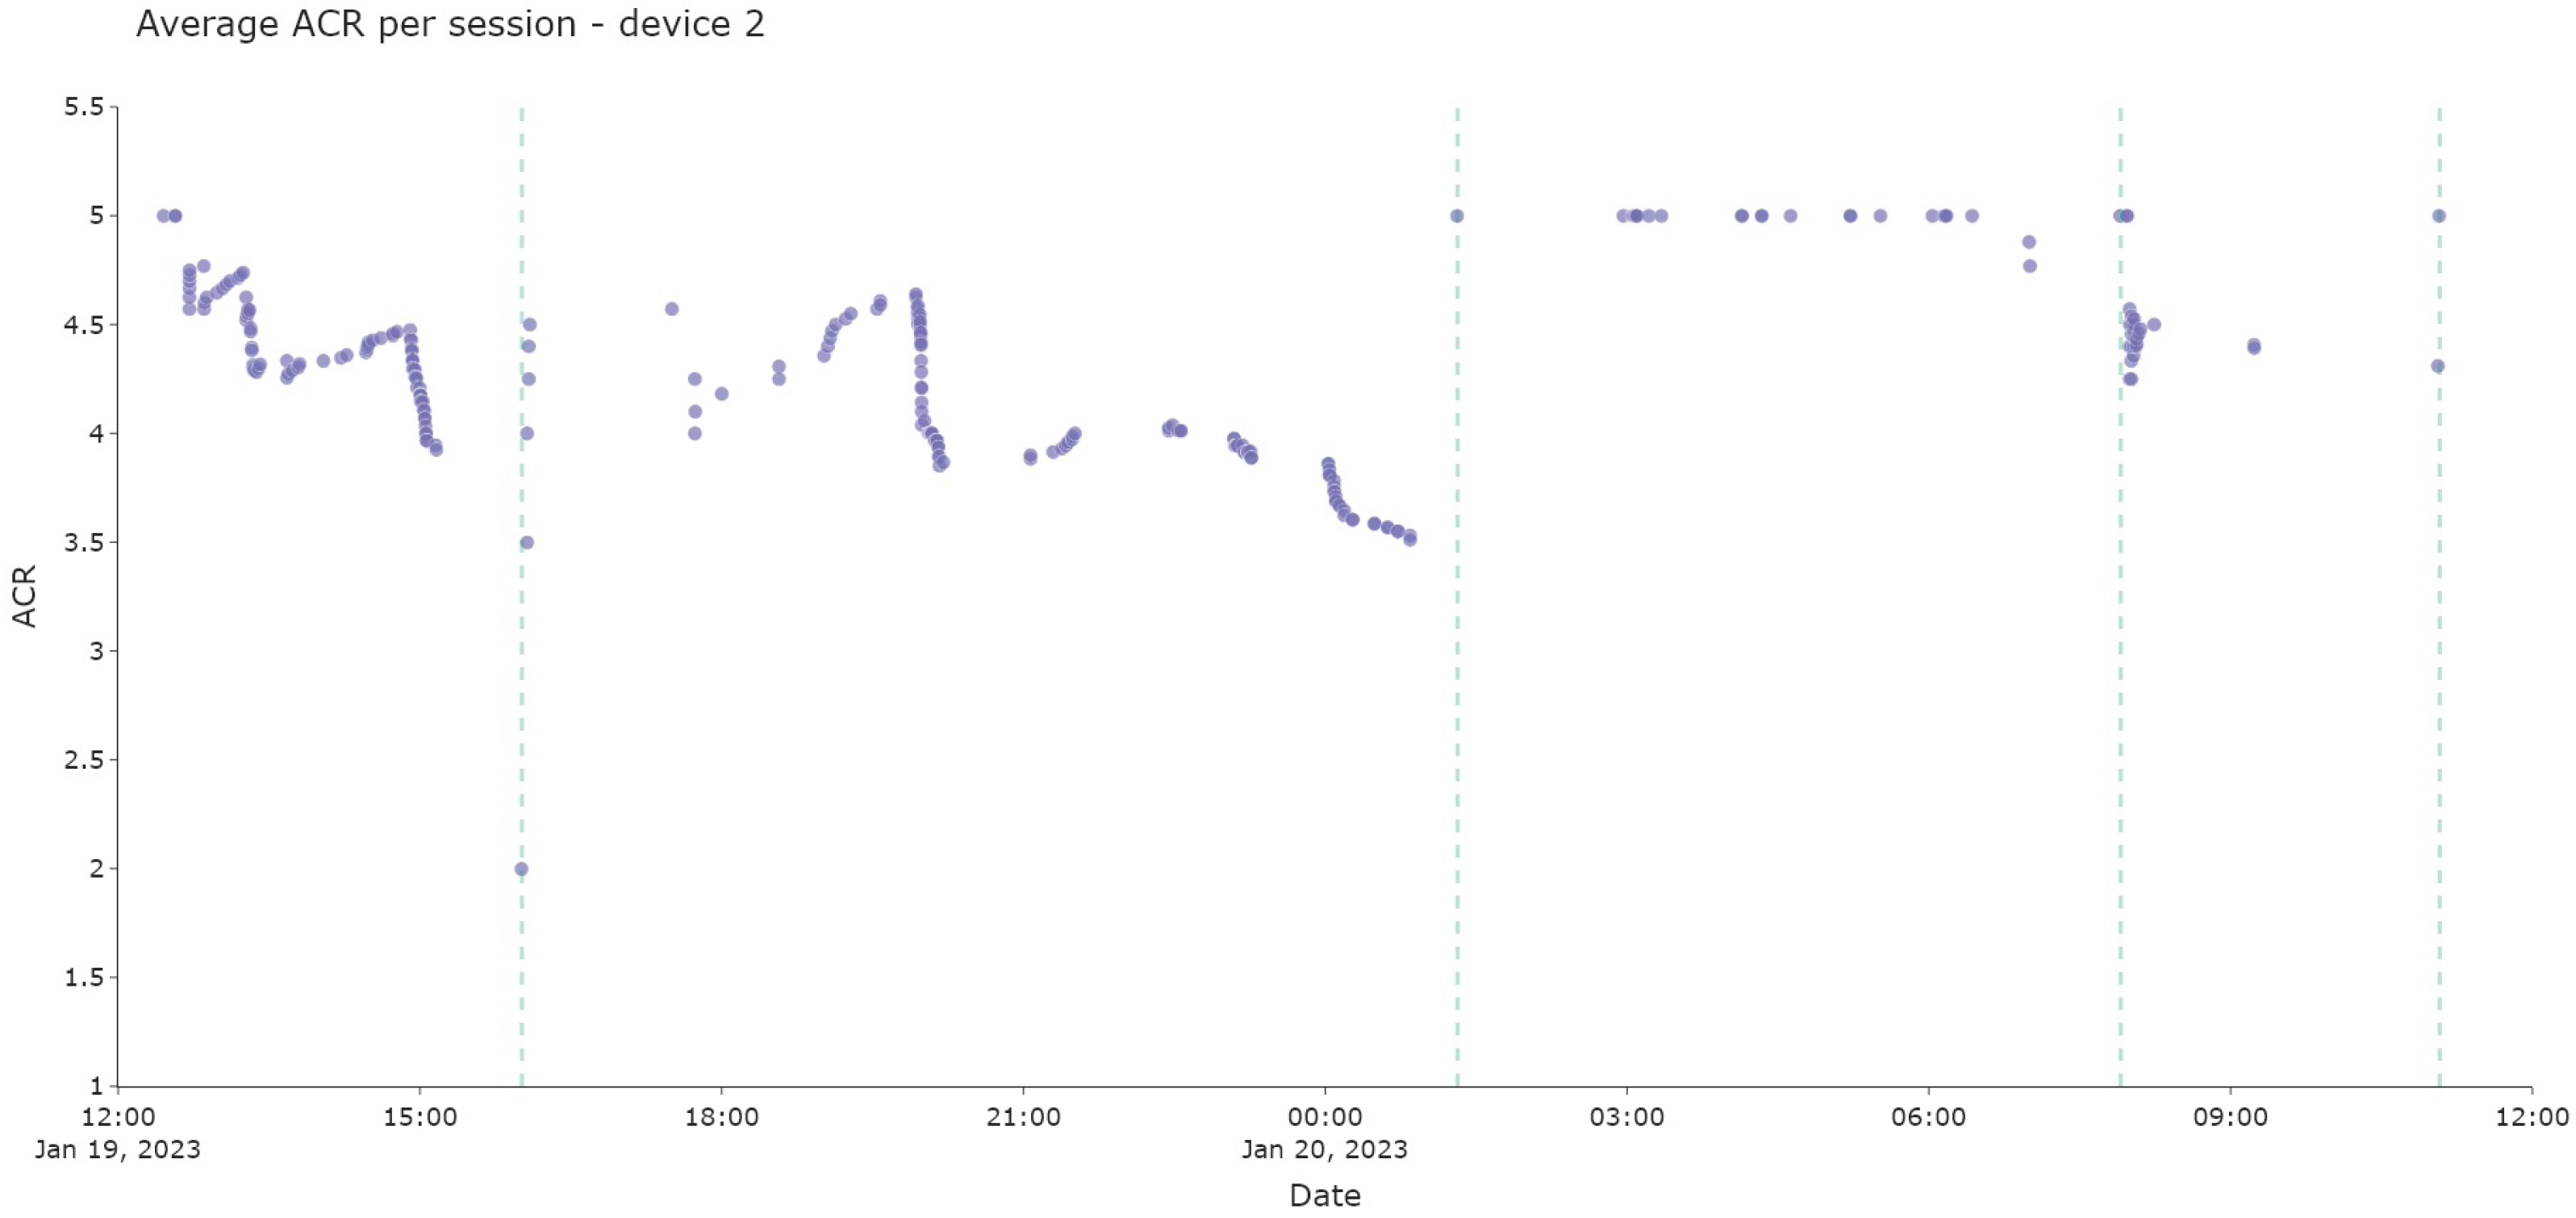
5.2. Clustering
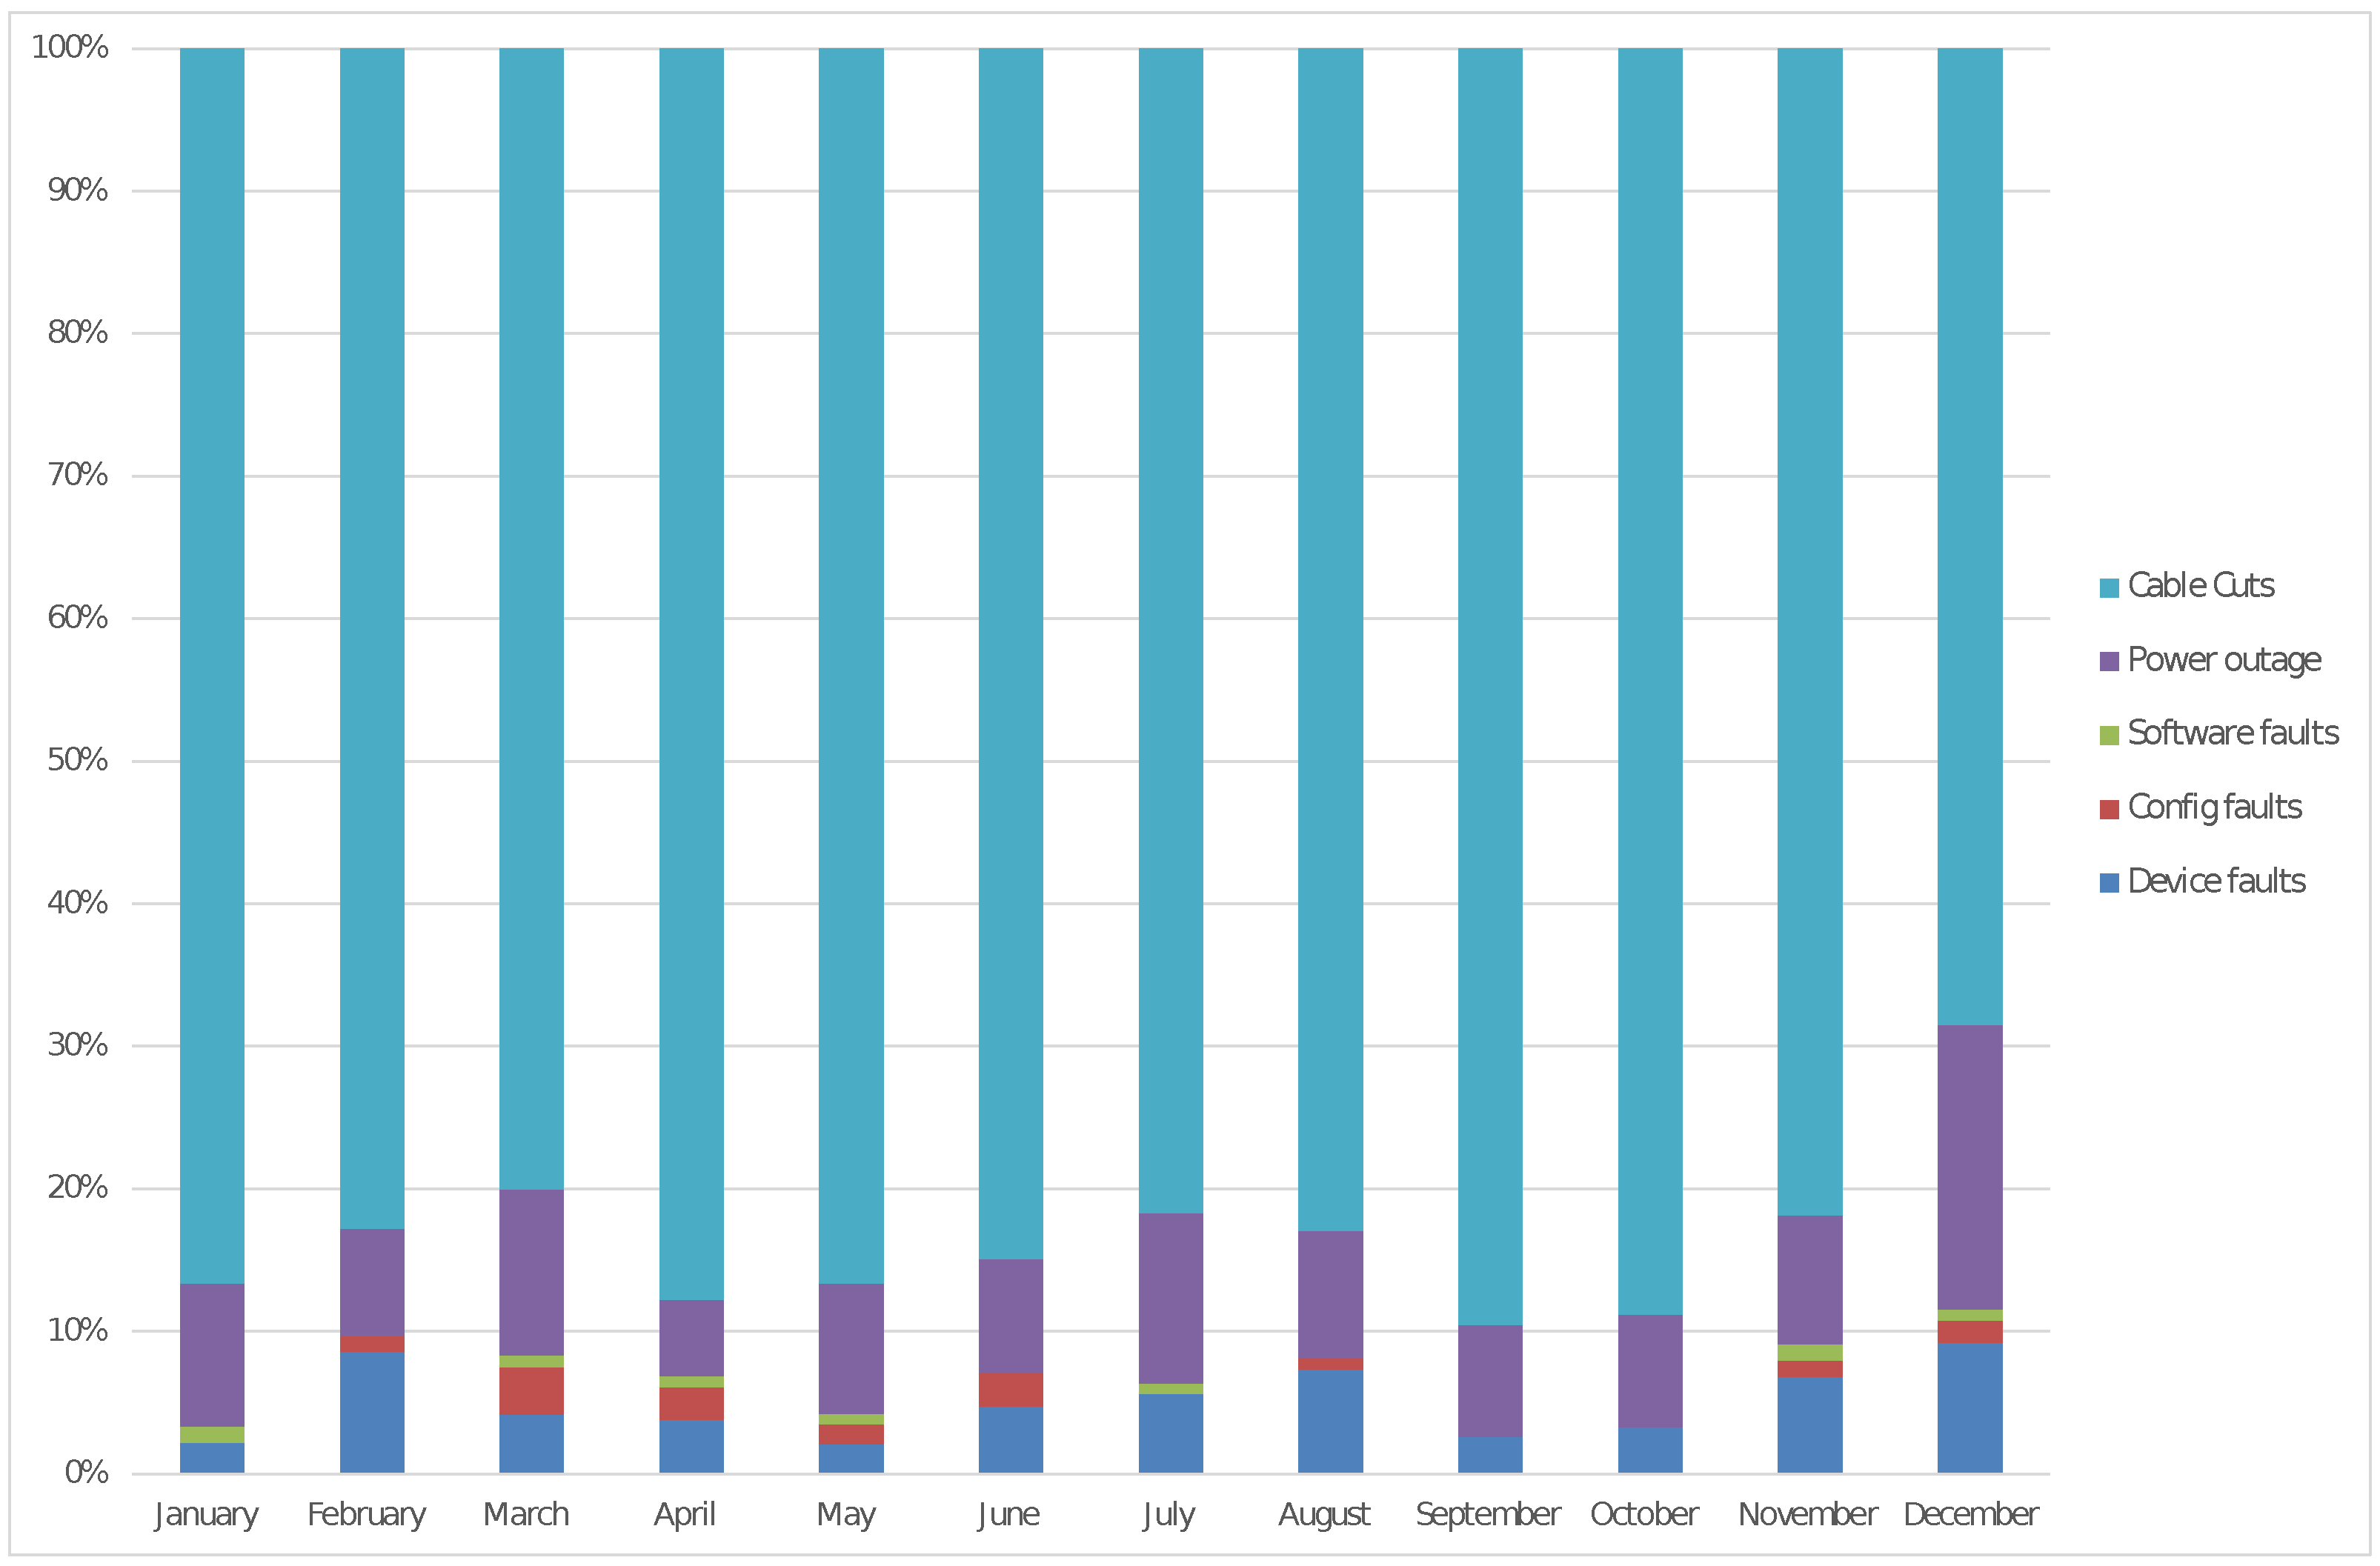
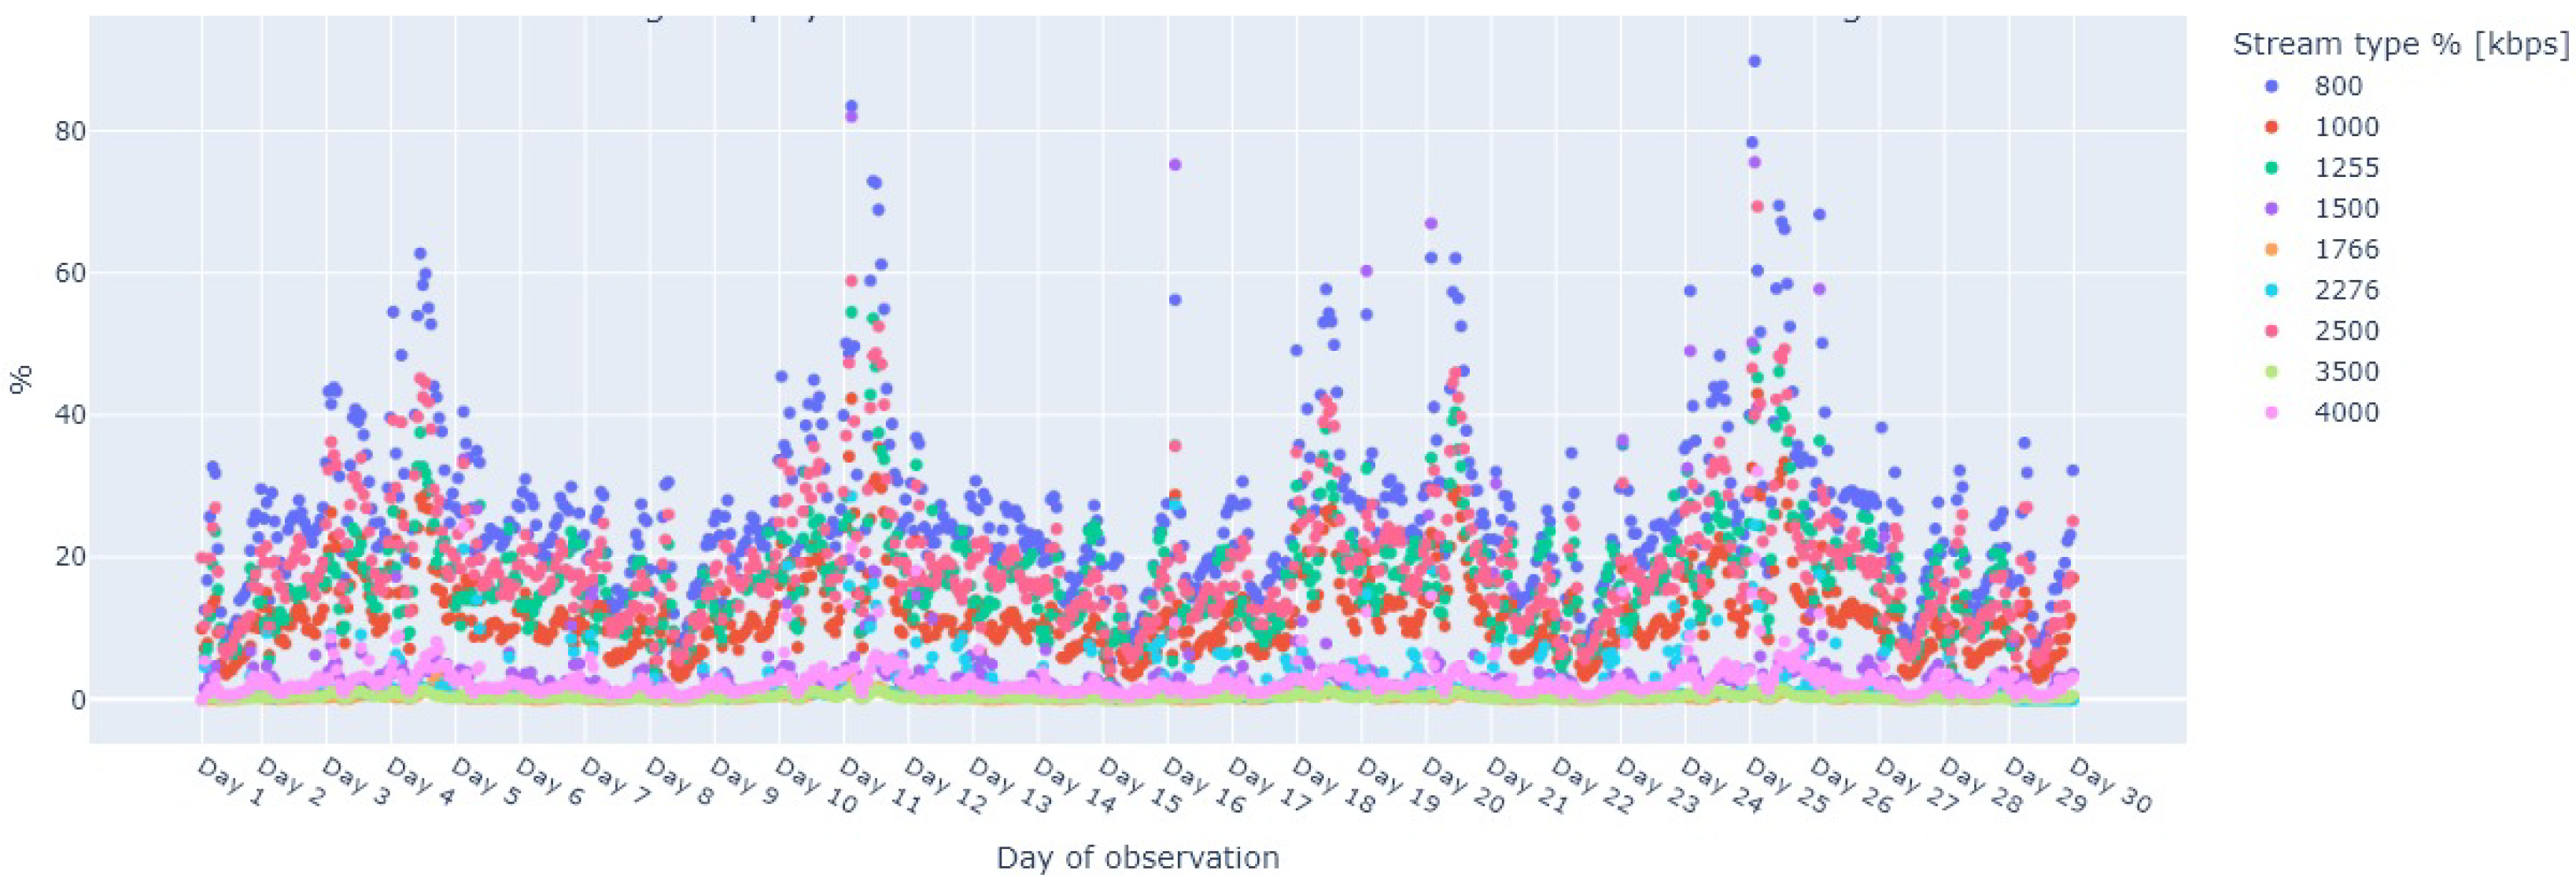
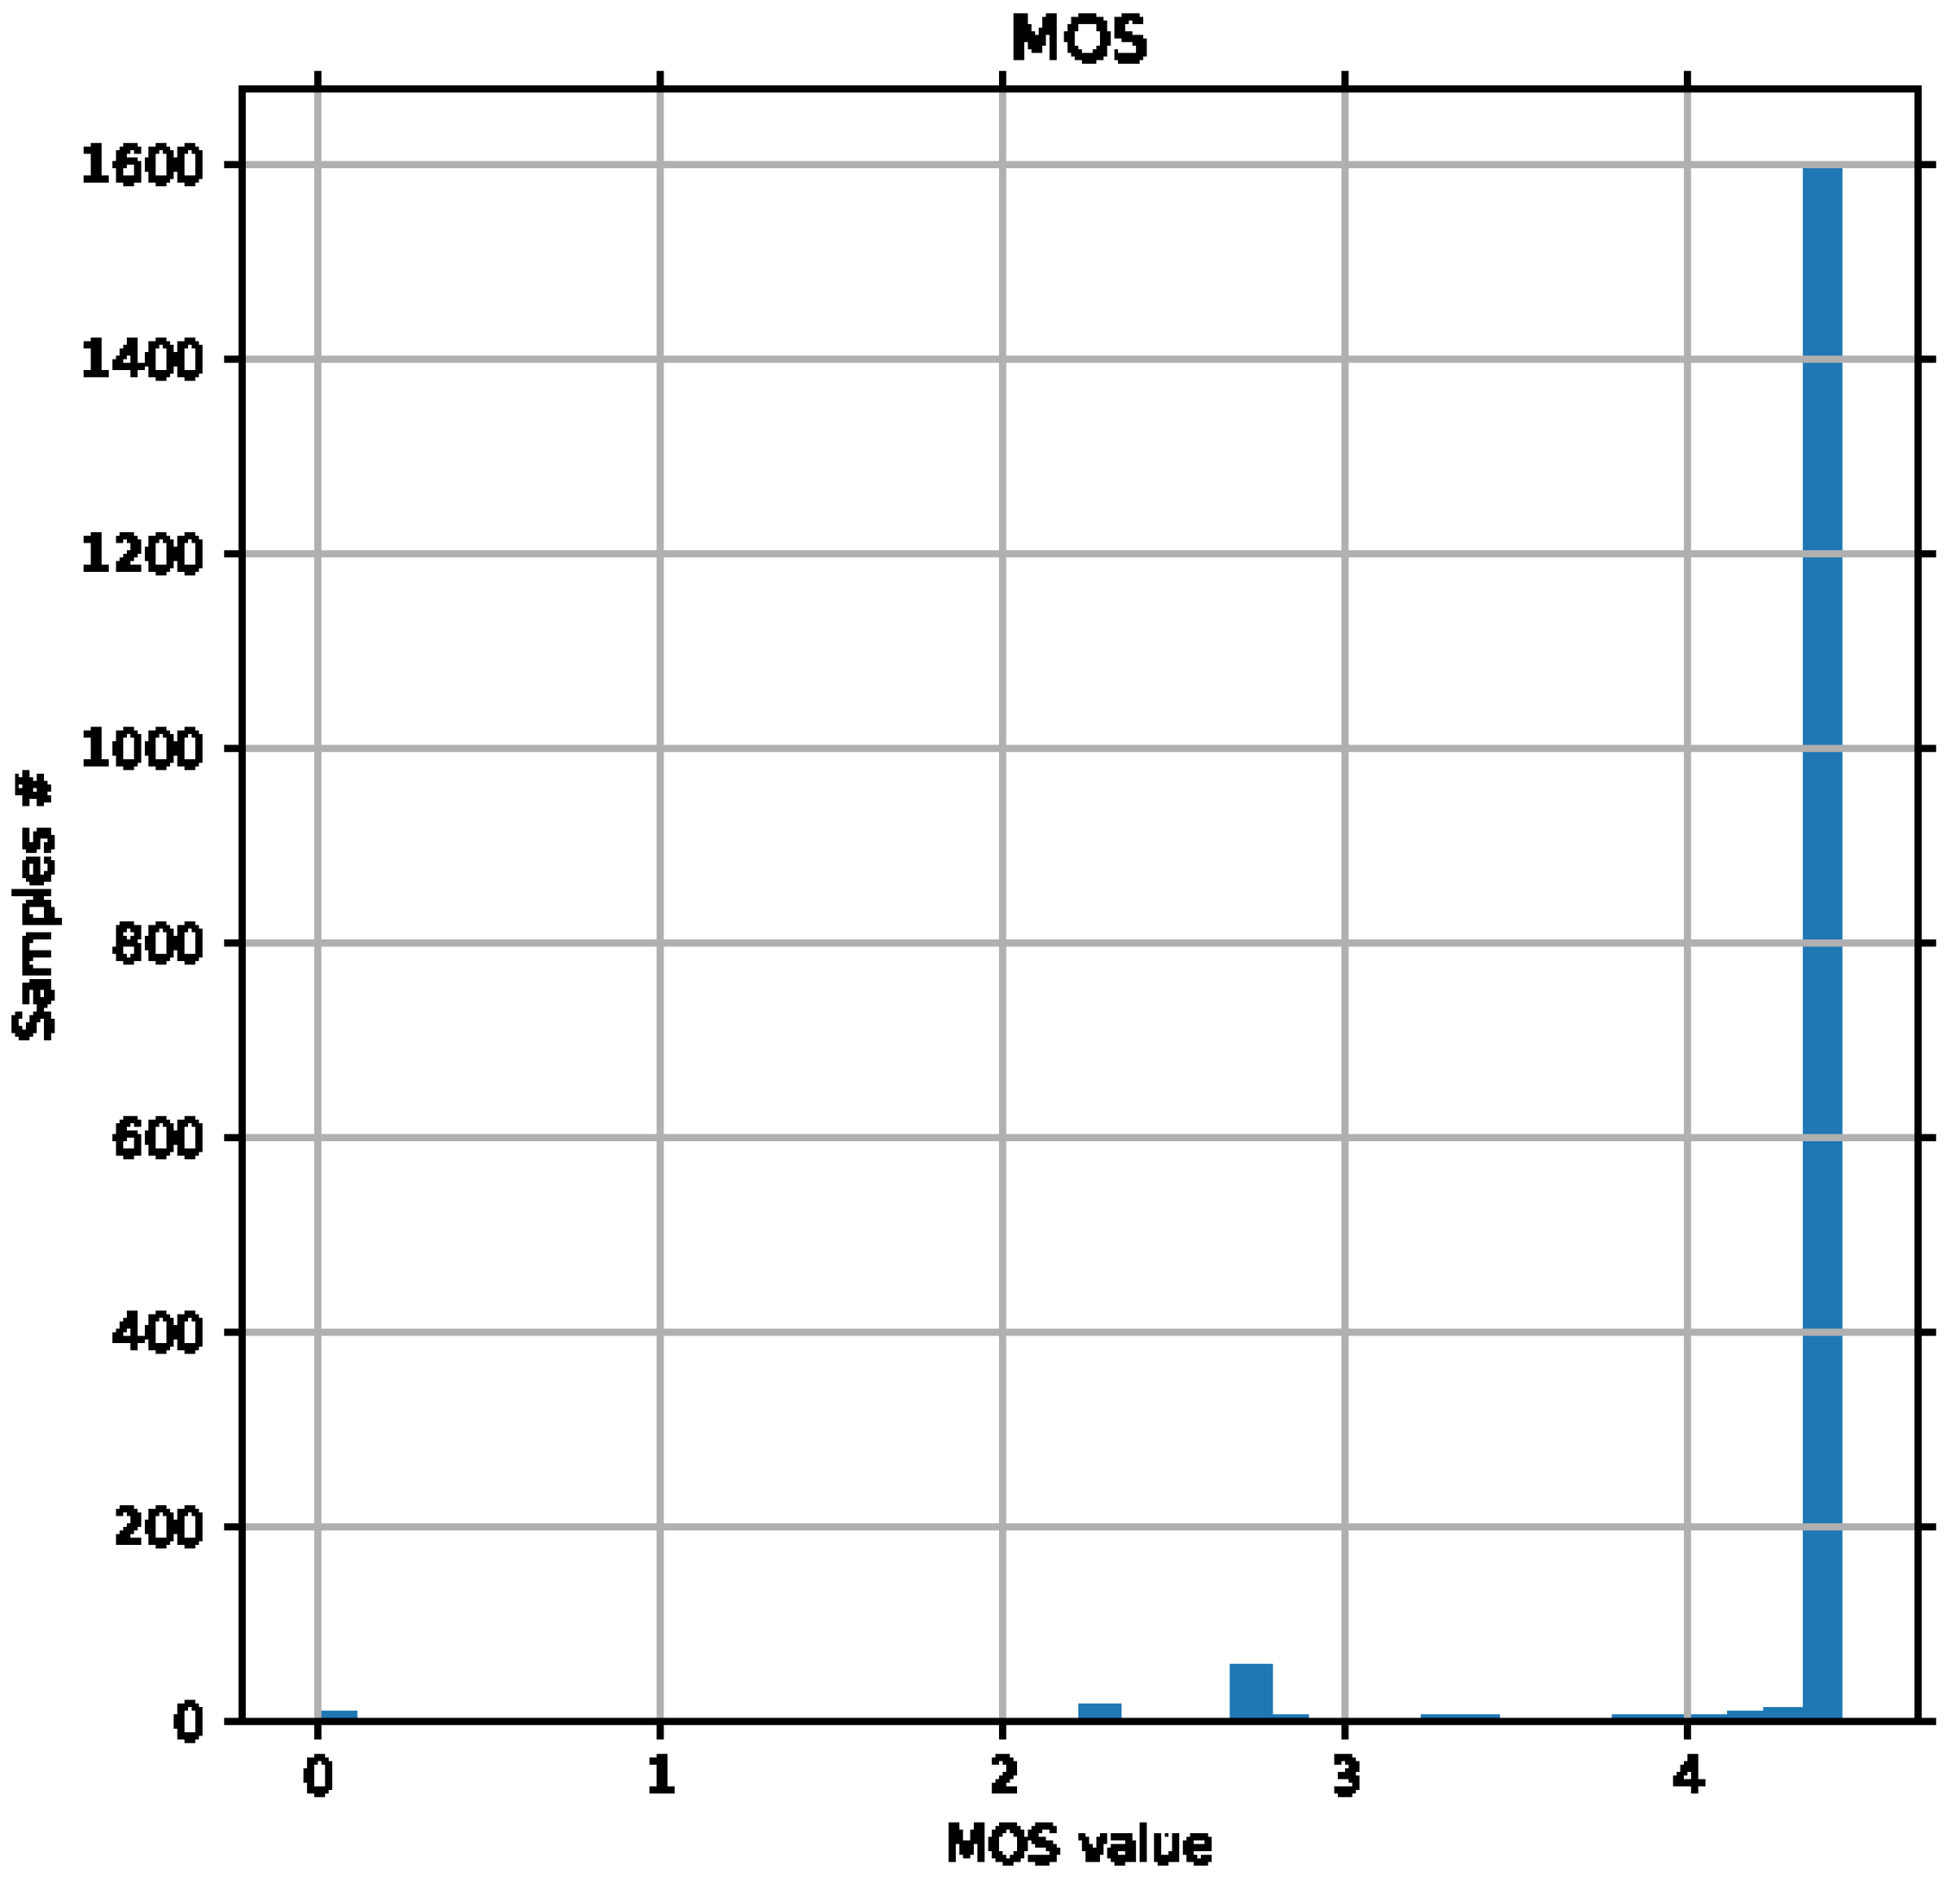
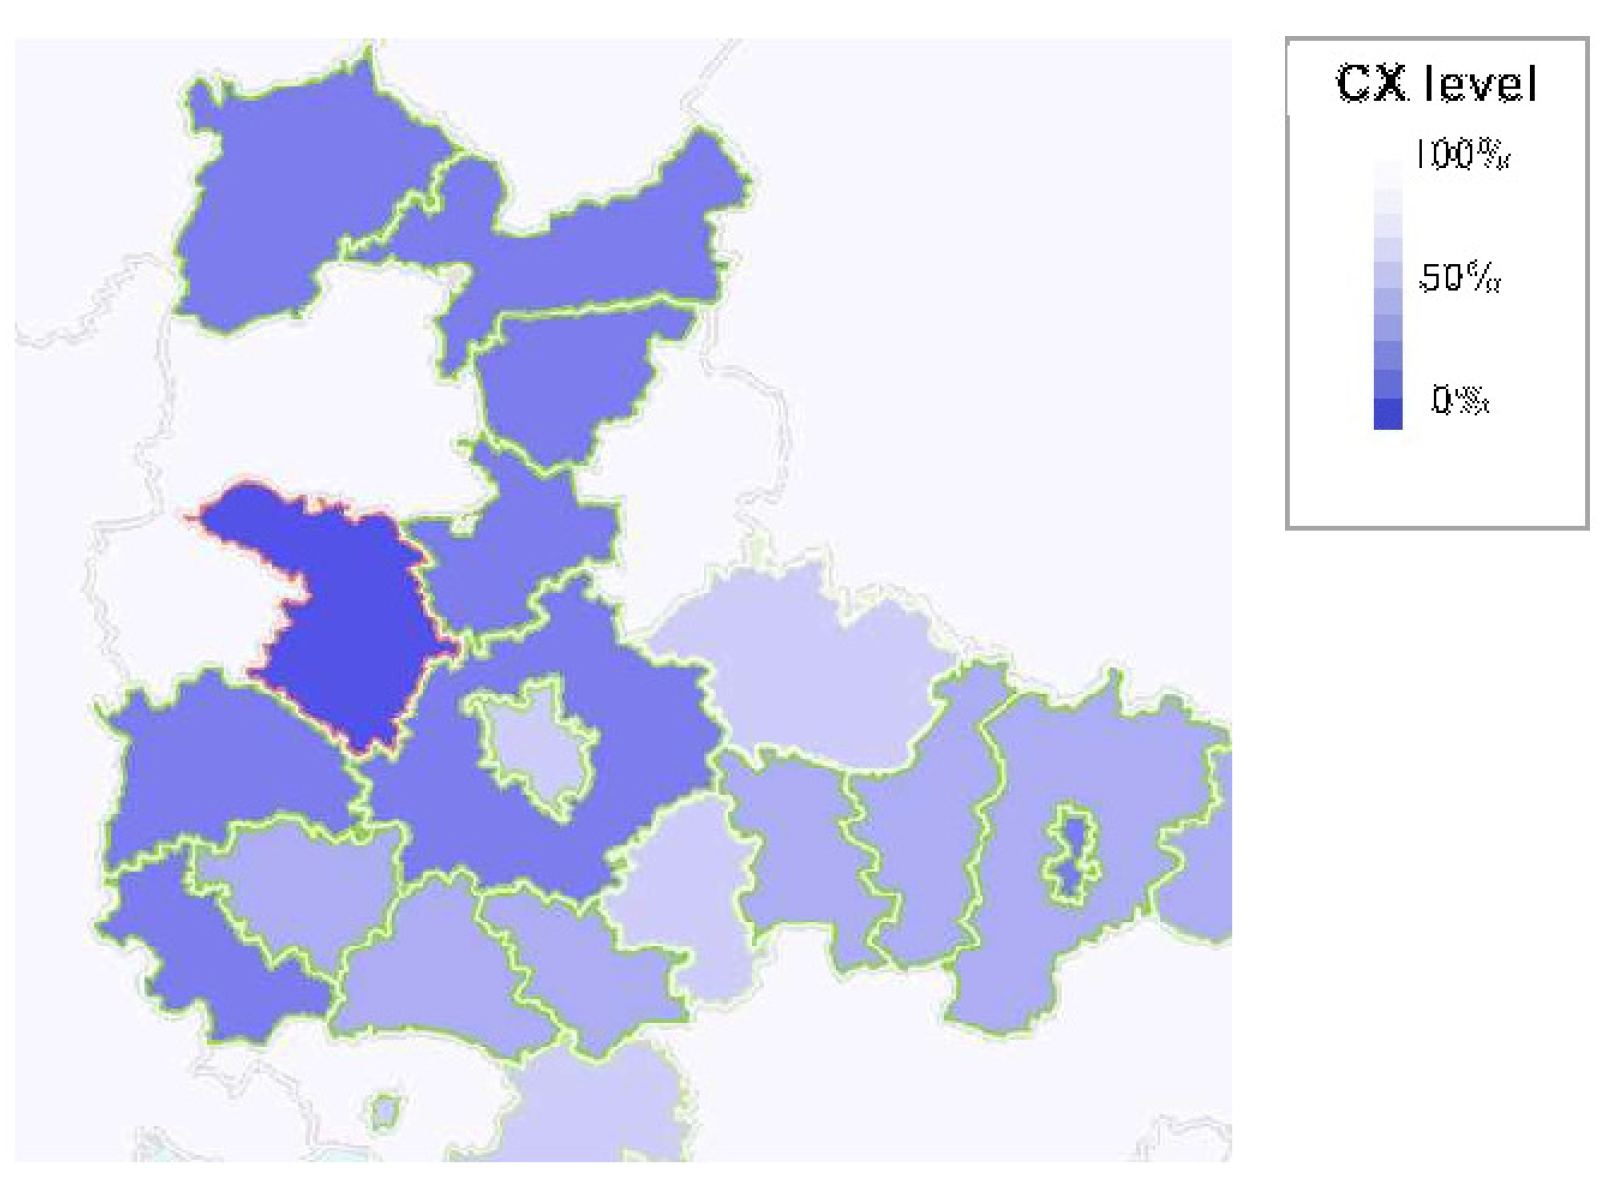
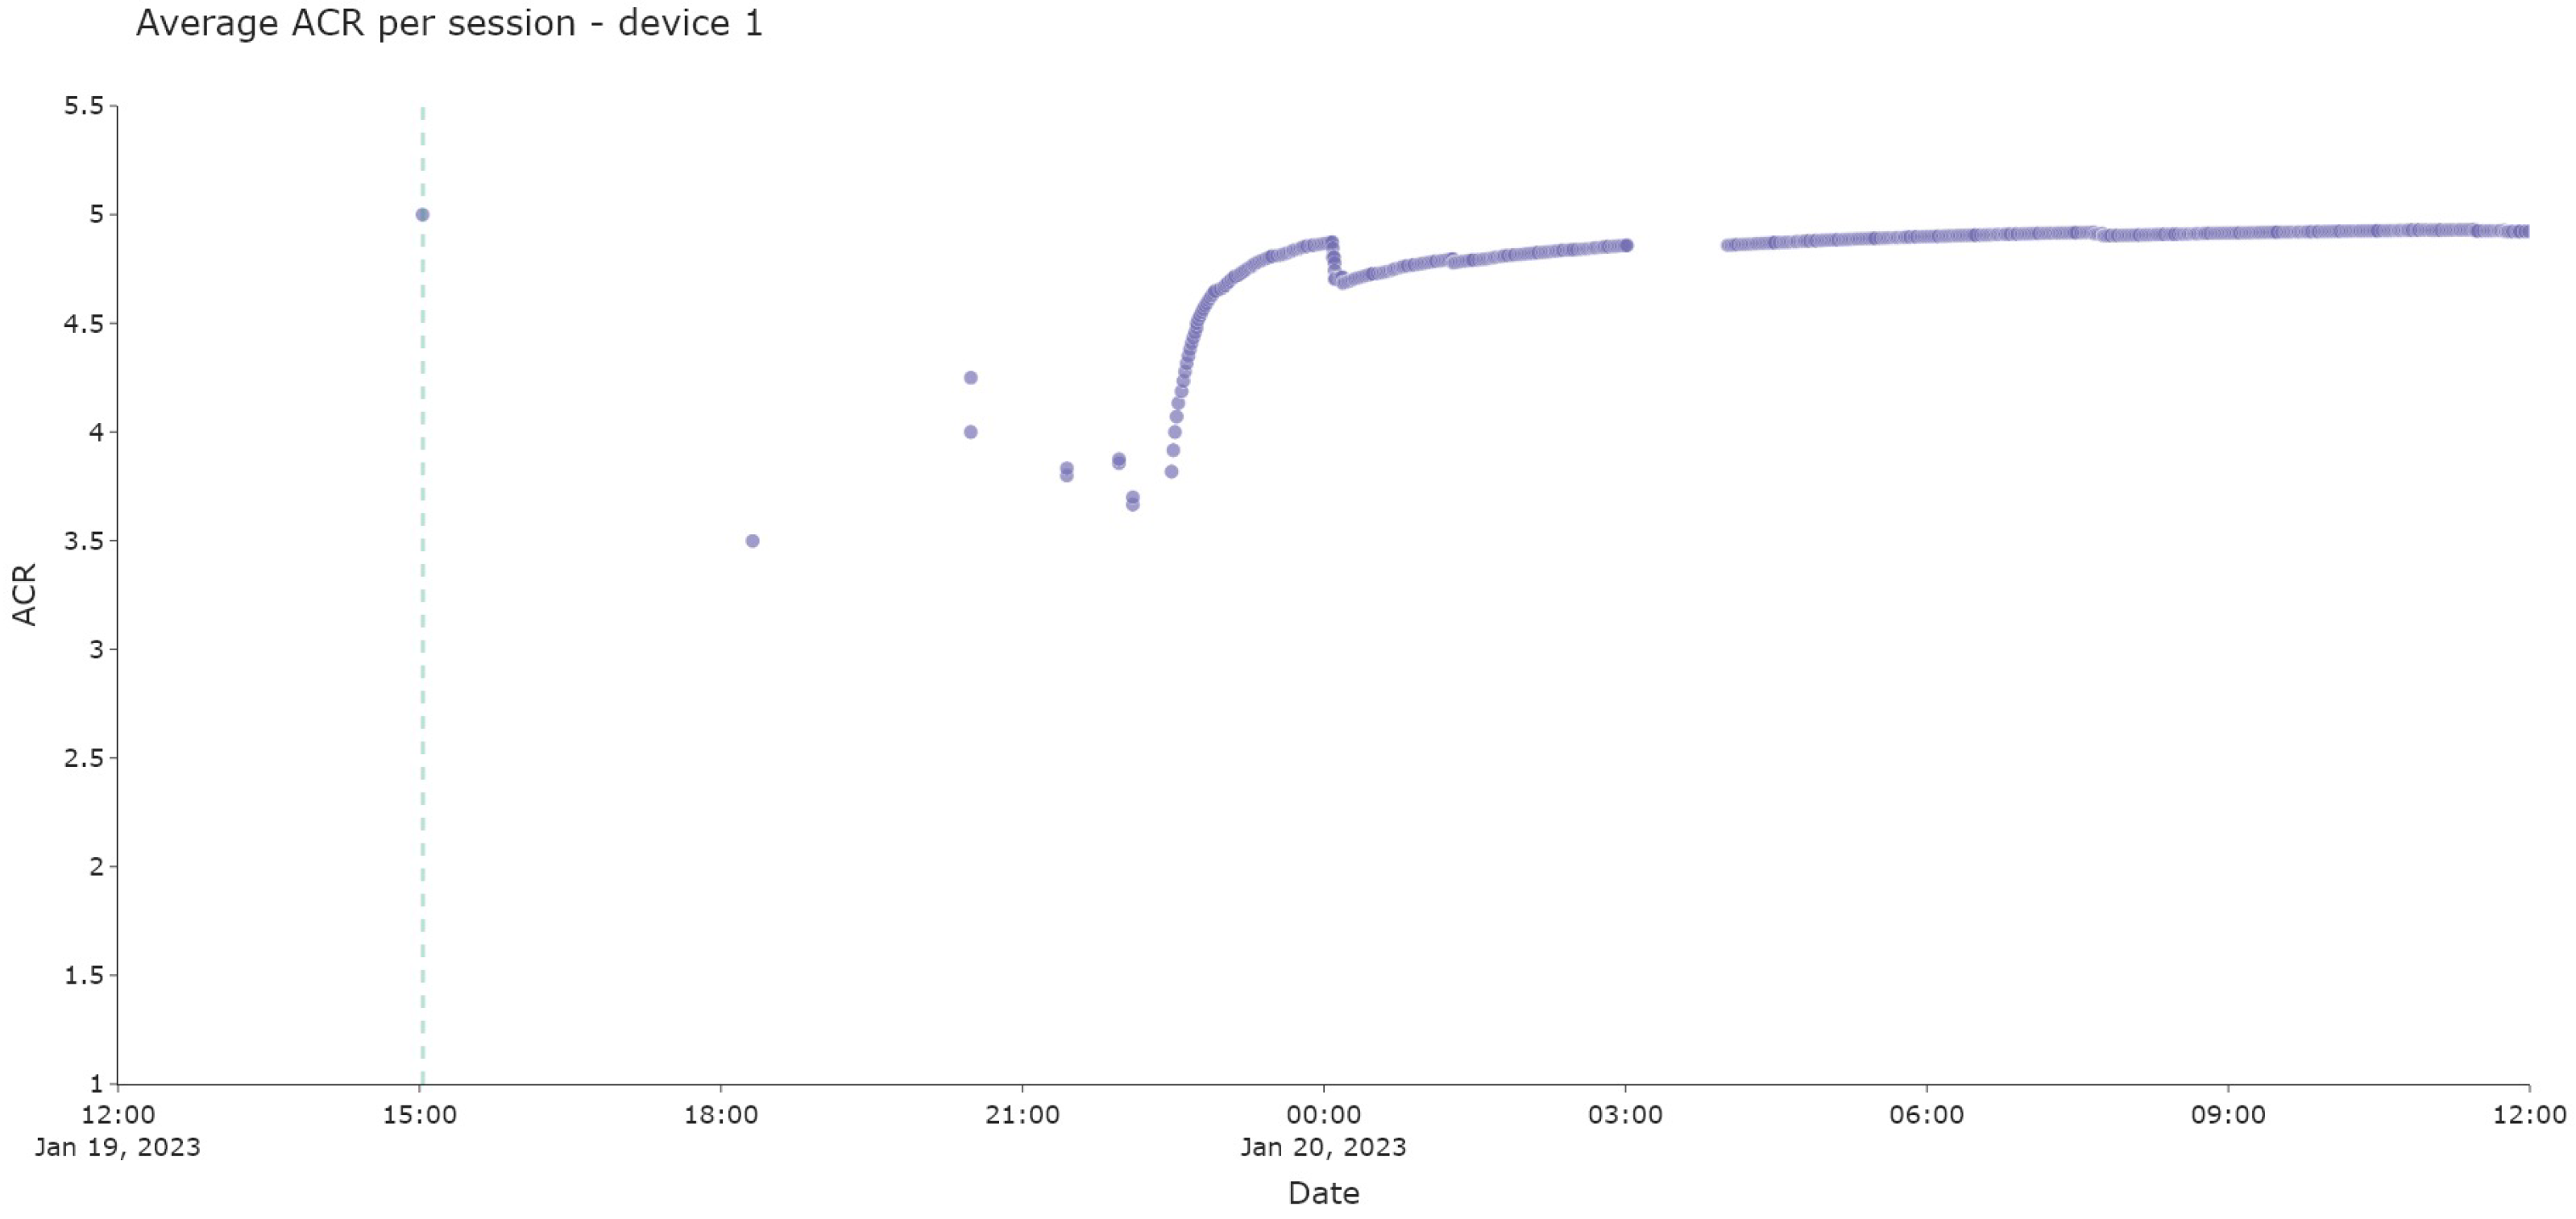
5.3. Results
6. Plans for Implementation of Supervised Learning
7. Conclusions
Author Contributions
Funding
Institutional Review Board Statement
Informed Consent Statement
Data Availability Statement
Conflicts of Interest
References
- Dynatrace. Available online: https://www.dynatrace.com/ (accessed on 31 October 2022).
- Huawei: IMaster NCE Autonomous Network Management and Control System. Available online: https://e.huawei.com/en/products/network-management-and-analysis-software (accessed on 31 October 2022).
- Nokia: Network Services Platform. Available online: https://www.nokia.com/networks/products/network-services-platform/ (accessed on 31 October 2022).
- Witbe. Available online: https://www.witbe.net/technology/ (accessed on 31 October 2022).
- New TestTree StreamProbe 2110 for 24/7 QoS & QoE Monitoring of IP-Based Media Production. Available online: https://www.enensys.com/product/streamprobe-2110-launch/ (accessed on 31 October 2022).
- Campanella, A. Intent Based Network Operations. In Proceedings of the 2019 Optical Fiber Communications Conference and Exhibition (OFC), San Diego, CA, USA, 3–7 March 2019; pp. 1–3. [Google Scholar]
- Han, Y.; Li, J.; Hoang, D.; Yoo, J.H.; Hong, J.W.K. An intent-based network virtualization platform for SDN. In Proceedings of the 2016 12th International Conference on Network and Service Management (CNSM), Montreal, QC, Canada, 31 October–4 November 2016; pp. 353–358. [Google Scholar] [CrossRef]
- Banjanin, M.K.; Stojčić, M.; Danilović, D.; Ćurguz, Z.; Vasiljević, M.; Puzić, G. Classification and Prediction of Sustainable Quality of Experience of Telecommunication Service Users Using Machine Learning Models. Sustainability 2022, 14, 17053. [Google Scholar] [CrossRef]
- Terra Vieira, S.; Lopes Rosa, R.; Zegarra Rodríguez, D.; Arjona Ramírez, M.; Saadi, M.; Wuttisittikulkij, L. Q-Meter: Quality Monitoring System for Telecommunication Services Based on Sentiment Analysis Using Deep Learning. Sensors 2021, 21, 1880. [Google Scholar] [CrossRef] [PubMed]
- Taha, M.; Canovas, A.; Lloret, J.; Ali, A. A QoE adaptive management system for high definition video streaming over wireless networks. Telecommun. Syst. 2021, 77, 1–19. [Google Scholar] [CrossRef]
- Laiche, F.; Ben Letaifa, A.; Aguili, T. QoE-aware traffic monitoring based on user behavior in video streaming services. Concurr. Comput. Pract. Exp. 2021, e6678. [Google Scholar] [CrossRef]
- Tao, X.; Duan, Y.; Xu, M.; Meng, Z.; Lu, J. Learning QoE of Mobile Video Transmission with Deep Neural Network: A Data-Driven Approach. IEEE J. Sel. Areas Commun. 2019, 37, 1337–1348. [Google Scholar] [CrossRef]
- Gadaleta, M.; Chiariotti, F.; Rossi, M.; Zanella, A. D-DASH: A Deep Q-Learning Framework for DASH Video Streaming. IEEE Trans. Cogn. Commun. Netw. 2017, 3, 703–718. [Google Scholar] [CrossRef]
- Zhang, H.; Dong, L.; Gao, G.; Hu, H.; Wen, Y.; Guan, K. DeepQoE: A Multimodal Learning Framework for Video Quality of Experience (QoE) Prediction. IEEE Trans. Multimed. 2020, 22, 3210–3223. [Google Scholar] [CrossRef]
- Vega, M.T.; Mocanu, D.C.; Famaey, J.; Stavrou, S.; Liotta, A. Deep Learning for Quality Assessment in Live Video Streaming. IEEE Signal Process. Lett. 2017, 24, 736–740. [Google Scholar] [CrossRef]
- Kossi, K.; Coulombe, S.; Desrosiers, C.; Gagnon, G. No-Reference Video Quality Assessment Using Distortion Learning and Temporal Attention. IEEE Access 2022, 10, 41010–41022. [Google Scholar] [CrossRef]
- Liu, X.; Song, W.; He, Q.; Mauro, M.D.; Liotta, A. Speeding Up Subjective Video Quality Assessment via Hybrid Active Learning. IEEE Trans. Broadcast. 2022, 1–14. [Google Scholar] [CrossRef]
- Motaung, W.; Ogudo, K.A.; Chabalala, C. Real-Time Monitoring of Video Quality in a DASH-based Digital Video Broadcasting using Deep Learning. In 2022 International Conference on Artificial Intelligence, Big Data, Computing and Data Communication Systems (icABCD), Durban, South Africa, 4–5 August 2022; IEEE: Piscataway, NJ, USA, 2022; pp. 1–6. [Google Scholar] [CrossRef]
- RFC 2544: Benchmarking Methodology for Network Interconnect Devices; RFC 2544, RFC Editor; IETF: Fremont, CA, USA, 1999. [CrossRef]
- Y.1564: Ethernet Service Activation Test Methodology; Recommendation Y. 1564; Telecommunication Standardization Section of ITU: Geneva, Switzerland, 2016.
- Fedor, M.; Schoffstall, M.L.; Davin, J.R.; Case, D.J.D. RFC 1157: Simple Network Management Protocol (SNMP); RFC 1157, RFC Editor; IETF: Fremont, CA, USA, 1990. [Google Scholar] [CrossRef]
- TR-069 CPE WAN Management Protocol; Technical Report Issue: 1 Amendment 6; The Broadband Forum: Fremont, CA, USA, 2018.
- Kowalik, K.; Partyka, B.; Andruloniw, P.; Zwierzykowski, P. Telecom Operator’s Approach to QoE. J. Telecommun. Inf. Technol. 2022, 2, 26–34. [Google Scholar] [CrossRef]
- Andruloniw, P.; Kowalik, K.; Zwierzykowski, P. Unsupervised Learning Data-Driven Continuous QoE Assessment in Adaptive Streaming-Based Television System. Appl. Sci. 2022, 12, 8288. [Google Scholar] [CrossRef]
- Zabbix. Available online: https://www.zabbix.com/ (accessed on 31 October 2022).
- TR 103-559 V1.1: Speech and multimedia Transmission Quality (STQ); Best Practices for Robust Network QoS Benchmark Testing and Scoring; Recommendation TR 103-559 V1.1; European Telecommunications Standards Institute (ETSI): Valbonne, France, 2019.
- Speech and Multimedia Transmission Quality (STQ); QoS Aspects for Popular Services in Mobile Networks; Part 2: Definition of Quality of Service Parameters and Their Computation; Technical Specification ETSI TS 102 250-2 V2.7.1; European Telecommunications Standards Institute (ETSI): Valbonne, France, 2019.
- Okerman, E.; Vounckx, J. Fast Startup Multicast Streaming on Operator IPTV Networks using HESP. In Proceedings of the 2021 IEEE International Symposium on Multimedia (ISM), Naple, Italy, 29 November–1 December 2021; pp. 79–86. [Google Scholar] [CrossRef]
- Doverspike, R.; Li, G.; Oikonomou, K.N.; Ramakrishnan, K.; Sinha, R.K.; Wang, D.; Chase, C. Designing a Reliable IPTV Network. IEEE Internet Comput. 2009, 13, 15–22. [Google Scholar] [CrossRef]
- Stockhammer, T. Dynamic Adaptive Streaming over HTTP –: Standards and Design Principles. In Proceedings of the Second Annual ACM Conference on Multimedia Systems, MMSys ’11, San Jose, CA, USA, 23–25 February 2011; Association for Computing Machinery: New York, NY, USA, 2011; pp. 133–144. [Google Scholar] [CrossRef]
- Seufert, M.; Egger, S.; Slanina, M.; Zinner, T.; Hoßfeld, T.; Tran-Gia, P. A Survey on Quality of Experience of HTTP Adaptive Streaming. IEEE Commun. Surv. Tutorials 2015, 17, 469–492. [Google Scholar] [CrossRef]
- P.1203: Parametric Bitstream-Based Quality Assessment of Progressive Download and Adaptive Audiovisual Streaming Services Over Reliable Transport; Recommendation P.1203; Telecommunication Standardization Section of ITU: Geneva, Switzerland, 2017.
- Bampis, C.G.; Bovik, A.C. Learning to Predict Streaming Video QoE: Distortions, Rebuffering and Memory. arXiv 2017. [Google Scholar] [CrossRef]
- Duanmu, Z.; Liu, W.; Chen, D.; Li, Z.; Wang, Z.; Wang, Y.; Gao, W. A Knowledge-Driven Quality-of-Experience Model for Adaptive Streaming Videos. arXiv 2019. [Google Scholar] [CrossRef]
- Li, Z.; Aaron, A.; Katsavounidis, I.; Moorthy, A.; Manohara, M. Toward A Practical Perceptual Video Quality Metric. 2016. Available online: https://netflixtechblog.com/toward-a-practical-perceptual-video-quality-metric-653f208b9652 (accessed on 31 October 2022).
- Bentaleb, A.; Begen, A.C.; Zimmermann, R. SDNDASH: Improving QoE of HTTP Adaptive Streaming Using Software Defined Networking. In Proceedings of the 24th ACM International Conference on Multimedia, MM ’16, Amsterdam, The Netherlands, 15–19 October 2016; Association for Computing Machinery: New York, NY, USA, 2016; pp. 1296–1305. [Google Scholar] [CrossRef]
- Mok, R.K.P.; Luo, X.; Chan, E.W.W.; Chang, R.K.C. QDASH: A QoE-Aware DASH System. In Proceedings of the 3rd Multimedia Systems Conference, MMSys ’12, Chapel Hill, NC, USA, 22–24 February 2012; Association for Computing Machinery: New York, NY, USA, 2012; pp. 11–22. [Google Scholar] [CrossRef]
- Xue, J.; Zhang, D.Q.; Yu, H.; Chen, C.W. Assessing quality of experience for adaptive HTTP video streaming. In Proceedings of the 2014 IEEE International Conference on Multimedia and Expo Workshops (ICMEW), Chengdu, China, 14–18 July 2014; pp. 1–6. [Google Scholar] [CrossRef]
- G.711: Pule Code Modulation (PCM) of Voice Frequences; Recommendation G.711; Telecommunication Standardization Section of ITU: Geneva, Switzerland, 1990.
- Berger, J.; Sochos, J.; Stoilkovic, M. Network Performance Score; Technical Report; Rohde & Schwarz: Munich, Germany, 2020. [Google Scholar]
- Chen, Y.; Tu, L. Density-Based Clustering for Real-Time Stream Data. In Proceedings of the 13th ACM SIGKDD International Conference on Knowledge Discovery and Data Mining, KDD ’07, San Jose, CA, USA, 12–15 August 2017; Association for Computing Machinery: New York, NY, USA, 2007; pp. 133–142. [Google Scholar] [CrossRef]
- P.913: Methods for the Subjective Assessment of Video Quality, Audio Quality and Audiovisual Quality of Internet Video and Distribution Quality Television in Any Environment; Recommendation P.913; Telecommunication Standardization Section of ITU: Geneva, Switzerland, 2021.
- Fifth Generation Fixed Network (F5G) F5G High-Quality Service Experience Factors Release #1; Group Specification ETSI GS F5G 005 V1.1.1; European Telecommunications Standards Institute (ETSI): Valbonne, France, 2022.


| Test Type | Bad Limit | Good Limit | Weight | Group |
|---|---|---|---|---|
| Video Test Success Ratio | 80% | 100% | 58% | Video |
| Average Video-MOS | 3 | 4.5 | 16.50% | |
| 10% Percentile Video-MOS | 2 | 4 | 16.50% | |
| Average Time to 1st Picture | 7 s | 2 s | 4.50% | |
| Time to Fires Picture > 10 s Ratio | 5% | 0% | 4.50% | |
| Website download test success ratio | 80% | 100% | 66.67% | WWW |
| Average Website transfer Time | 15 s | 3 s | 28.57% | |
| Website transfer Time > 15 s | 5% | 0% | 4.76% | |
| Social Media Success Ratio | 80% | 100% | 66.67% | Social media |
| Average Social Media Transfer | 15 s | 3 s | 28.57% | |
| Social Media Transfer > 15 s | 5% | 0% | 4.76% | |
| Transfer Success Ratio DL | 80% | 100% | 11% | Service |
| Download file avg speed | 1 Mbit/s | 100 Mbit/s | 14% | |
| Download file speed 10% percentile | 1 Mbit/s | 40 Mbit/s | 18% | |
| Download file speed 90% percentile | 10 Mbit/s | 240 Mbit/s | 7% | |
| Transfer Success Ratio UL | 80% | 100% | 11% | |
| Upload file avg speed | 0.5 Mbit/s | 50 Mbit/s | 14% | |
| Upload file speed 10% percentile | 0.5 Mbit/s | 30 Mbit/s | 18% | |
| Upload file speed 90% percentile | 5 Mbit/s | 100 Mbit/s | 7% |
| Aggregation Router | STBs with Stalls | All Devices | % |
|---|---|---|---|
| Aggregation-1 | 26 | 80 | 32.50 |
| Aggregation-2 | 53 | 170 | 31.18 |
| Aggregation-3 | 317 | 1018 | 31.14 |
| Aggregation-4 | 413 | 1337 | 30.89 |
| Aggregation-5 | 158 | 519 | 30.44 |
| Aggregation-6 | 216 | 711 | 30.38 |
| Aggregation-7 | 635 | 2124 | 29.90 |
| Aggregation-8 | 629 | 2132 | 29.50 |
| Aggregation-9 | 399 | 1363 | 29.27 |
| Aggregation-10 | 221 | 762 | 29.00 |
| Aggregation-11 | 756 | 2613 | 28.93 |
| Aggregation-12 | 1357 | 4699 | 28.88 |
| Aggregation-13 | 276 | 957 | 28.84 |
| Aggregation-14 | 150 | 525 | 28.57 |
| Aggregation-15 | 165 | 580 | 28.45 |
| Aggregation-16 | 260 | 915 | 28.42 |
| Aggregation-17 | 65 | 230 | 28.26 |
| Aggregation-18 | 132 | 472 | 27.97 |
| Aggregation-19 | 308 | 1112 | 27.70 |
| Aggregation-20 | 543 | 1973 | 27.52 |
| Aggregation-21 | 321 | 1167 | 27.51 |
| Aggregation-22 | 603 | 2196 | 27.46 |
| Aggregation-23 | 117 | 428 | 27.34 |
| Aggregation-24 | 263 | 966 | 27.23 |
| Aggregation-25 | 177 | 651 | 27.19 |
| Aggregation-26 | 112 | 412 | 27.18 |
| Aggregation-27 | 110 | 405 | 27.16 |
| Aggregation-28 | 136 | 502 | 27.09 |
| Aggregation-29 | 190 | 715 | 26.57 |
| Aggregation-30 | 279 | 1054 | 26.47 |
| Aggregation-31 | 150 | 567 | 26.46 |
| Aggregation-32 | 408 | 1545 | 26.41 |
| Aggregation-33 | 274 | 1039 | 26.37 |
| Aggregation-34 | 194 | 742 | 26.15 |
| Aggregation-35 | 318 | 1226 | 25.94 |
| Aggregation-36 | 188 | 737 | 25.51 |
| Aggregation-37 | 121 | 478 | 25.31 |
| Aggregation-38 | 7 | 28 | 25.00 |
| Aggregation-39 | 61 | 250 | 24.40 |
| Aggregation-40 | 131 | 555 | 23.60 |
| Aggregation-41 | 130 | 629 | 20.67 |
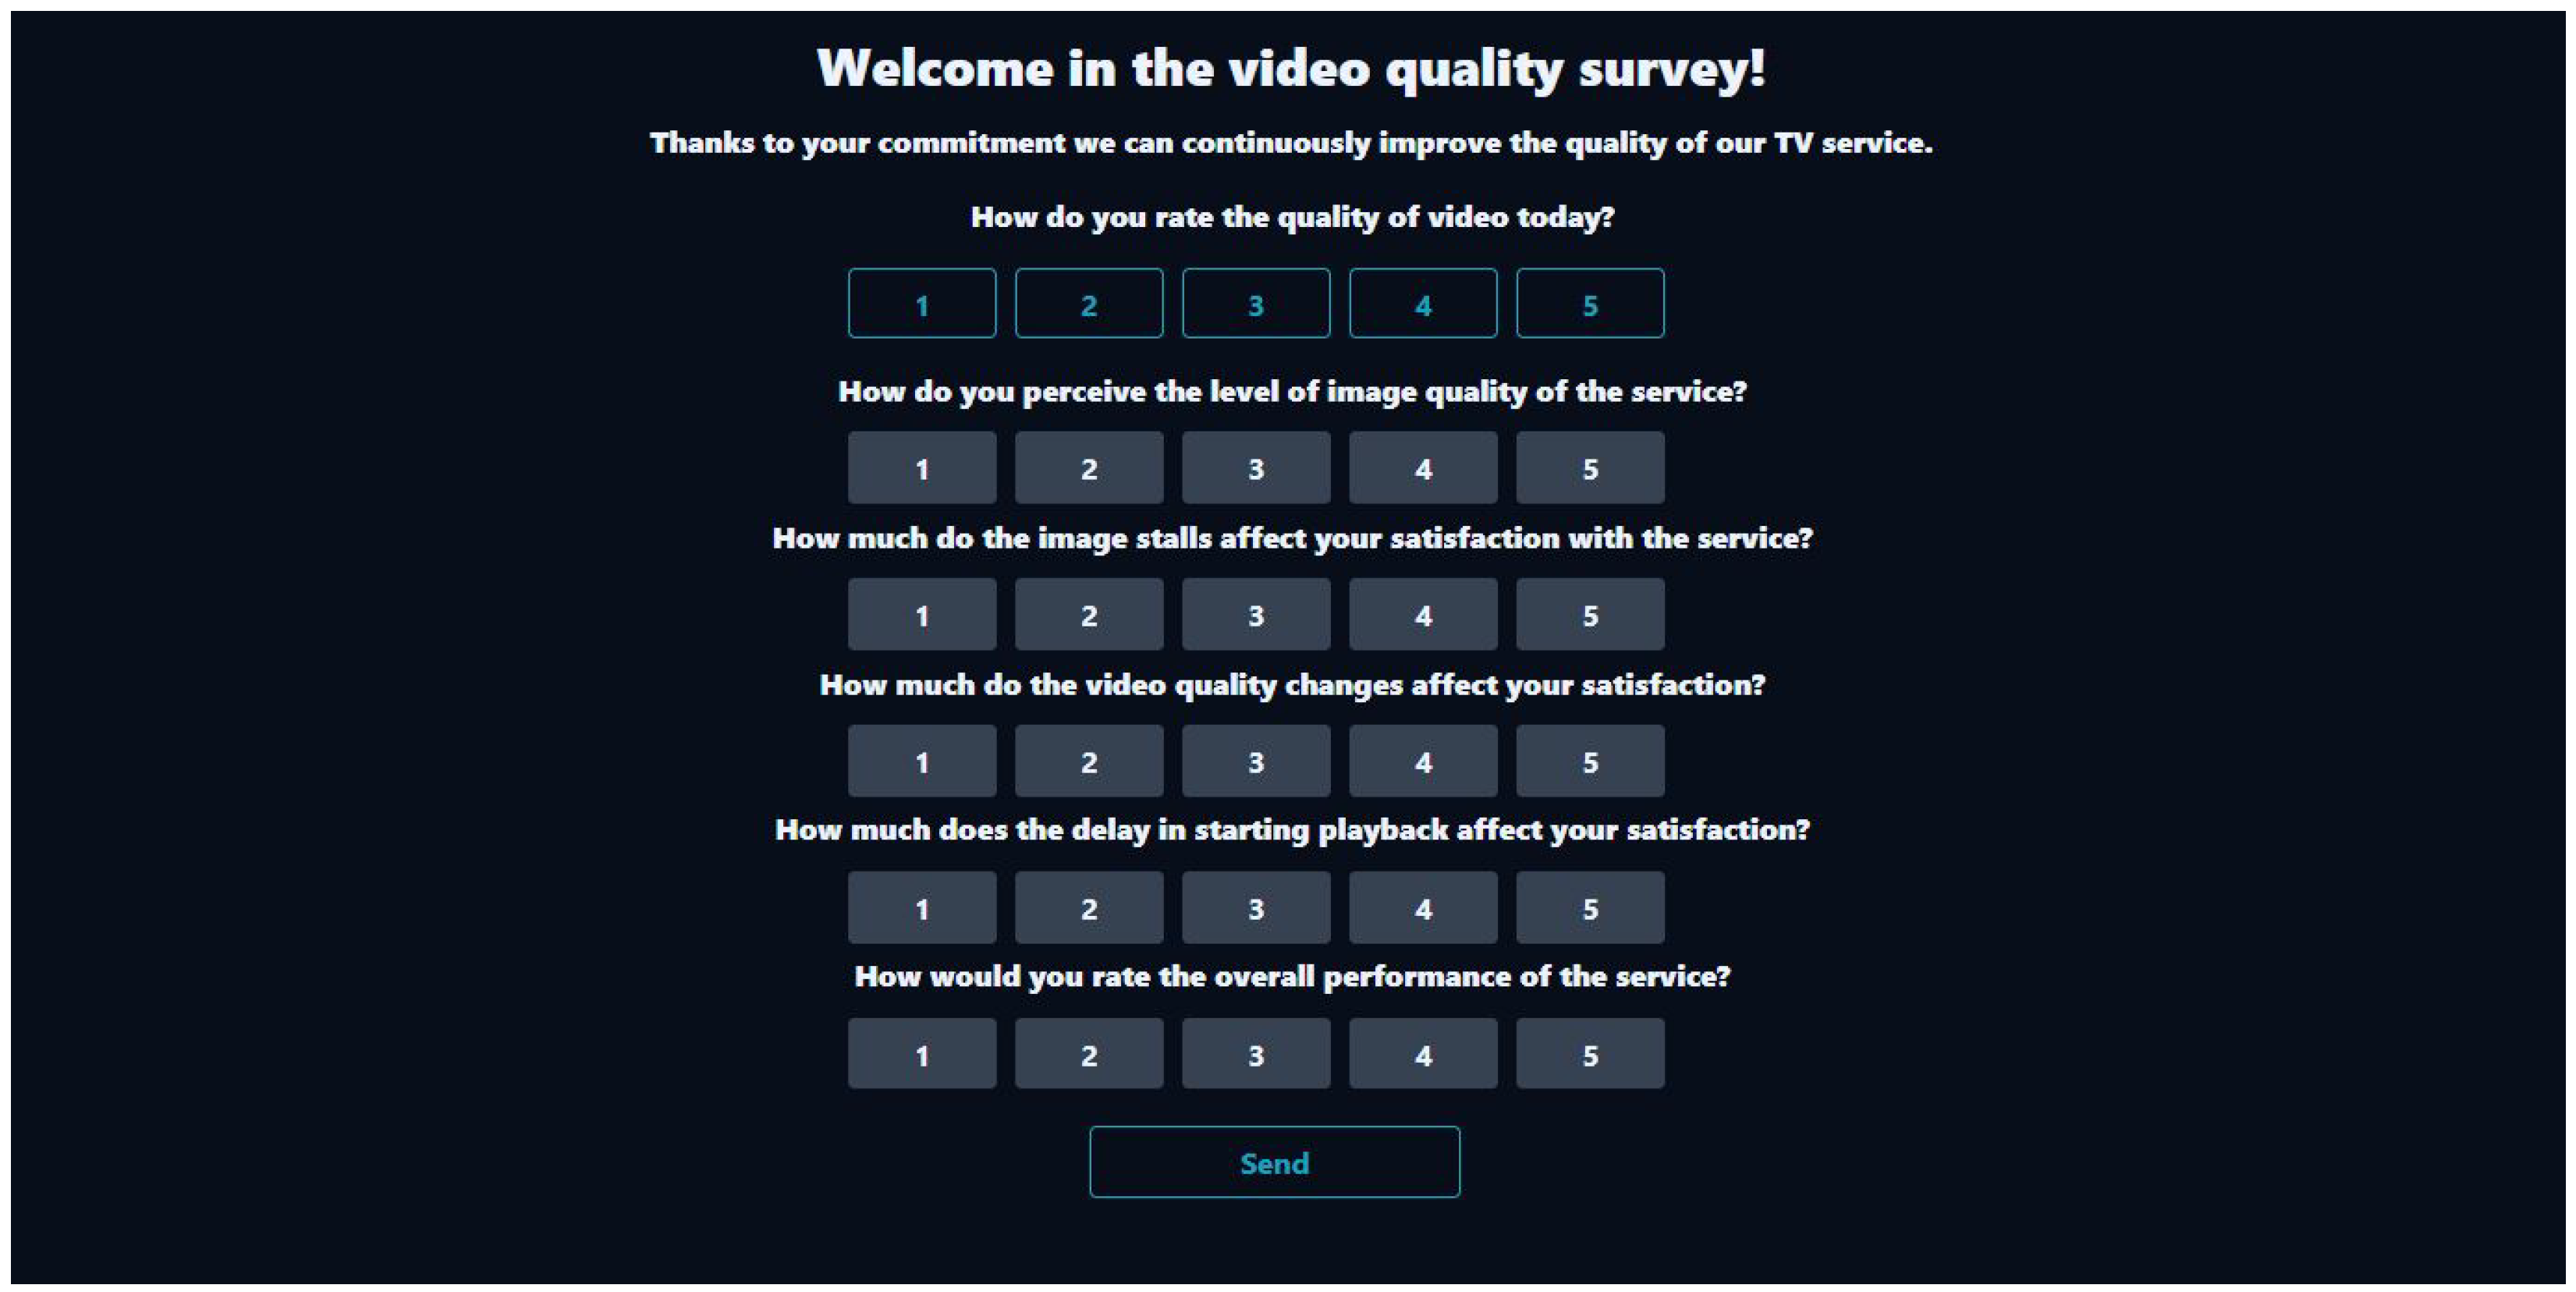
| Question |
|---|
| How do you rate the quality of video today? |
| How do you perceive the level of image quality on the service? |
| How much do image stalls affect your satisfaction with the service? |
| How much do video quality changes affect your satisfaction? |
| How much does the delay in starting playback affect your satisfaction? |
| How would you rate the overall performance of the service? |
| Grade | Estimated Quality (ACR) | Perceived Impairment (DCR) |
|---|---|---|
| 5 | Excellent | Imperceptible |
| 4 | Good | Perceptible but not annoying |
| 3 | Fair | Slightly annoying |
| 2 | Poor | Annoying |
| 1 | Bad | Very annoying |
Disclaimer/Publisher’s Note: The statements, opinions and data contained in all publications are solely those of the individual author(s) and contributor(s) and not of MDPI and/or the editor(s). MDPI and/or the editor(s) disclaim responsibility for any injury to people or property resulting from any ideas, methods, instructions or products referred to in the content. |
© 2023 by the authors. Licensee MDPI, Basel, Switzerland. This article is an open access article distributed under the terms and conditions of the Creative Commons Attribution (CC BY) license (https://creativecommons.org/licenses/by/4.0/).
Share and Cite
Andruloniw, P.; Kowalik, K.; Partyka, B.; Zwierzykowski, P. Multi-Layer QoE Learning System Implemented by Fiberhost. Appl. Sci. 2023, 13, 2300. https://doi.org/10.3390/app13042300
Andruloniw P, Kowalik K, Partyka B, Zwierzykowski P. Multi-Layer QoE Learning System Implemented by Fiberhost. Applied Sciences. 2023; 13(4):2300. https://doi.org/10.3390/app13042300
Chicago/Turabian StyleAndruloniw, Paweł, Karol Kowalik, Bartosz Partyka, and Piotr Zwierzykowski. 2023. "Multi-Layer QoE Learning System Implemented by Fiberhost" Applied Sciences 13, no. 4: 2300. https://doi.org/10.3390/app13042300
APA StyleAndruloniw, P., Kowalik, K., Partyka, B., & Zwierzykowski, P. (2023). Multi-Layer QoE Learning System Implemented by Fiberhost. Applied Sciences, 13(4), 2300. https://doi.org/10.3390/app13042300