
The Significance of Plant-Based Foods and Intense Physical Activity on the Metabolic Health of Women with PCOS: A Priori Dietary-Lifestyle Patterns Approach

 , , , and
Abstract
Featured Application
Abstract
1. Introduction
2. Materials and Methods
2.1. Study Participants
2.2. Body Composition Parameters
2.3. Food Frequency Intake and Lifestyle Habits
2.4. Biochemical Parameters
2.5. Statistics
3. Results
3.1. Lifestyle-Dietary Patterns and Patient’s Characteristics
3.2. Metabolic Parameters
3.3. Endocrine Parameters
4. Discussion
4.1. The Relation of DLPs with Metabolic and Endocrine Markers
4.2. Plant Products Intake
4.3. Meat Intake
4.4. Dairy Intake
4.5. Meal Frequency
4.6. Physical Activity
4.7. Limitations
5. Conclusions
Supplementary Materials
Author Contributions
Funding
Institutional Review Board Statement
Informed Consent Statement
Data Availability Statement
Acknowledgments
Conflicts of Interest
References
- Sirmans, S.M.; Pate, K.A. Epidemiology, diagnosis, and management of polycystic ovary syndrome. Clin. Epidemiol. 2013, 6, 1–13. [Google Scholar] [CrossRef] [PubMed]
- Azziz, R.; Carmina, E.; Dewailly, D.; Diamanti-Kandarakis, E.; Escobar-Morreale, H.F.; Futterweit, W.; Janssen, O.E.; Legro, R.S.; Norman, R.J.; Taylor, A.E.; et al. The Androgen Excess and PCOS Society criteria for the polycystic ovary syndrome: The complete task force report. Fertil. Steril. 2009, 91, 456–488. [Google Scholar] [CrossRef] [PubMed]
- Moran, L.J.; Ko, H.; Misso, M.; Marsh, K.; Noakes, M.; Talbot, M.; Frearson, M.; Thondan, M.; Stepto, N.; Teede, H.J. Dietary Composition in the Treatment of Polycystic Ovary Syndrome: A Systematic Review to Inform Evidence-Based Guidelines. J. Acad. Nutr. Diet. 2013, 113, 520–545. [Google Scholar] [CrossRef]
- Graff, S.K.; Mário, F.M.; Alves, B.C.; Spritzer, P.M. Dietary glycemic index is associated with less favorable anthropometric and metabolic profiles in polycystic ovary syndrome women with different phenotypes. Fertil. Steril. 2013, 100, 1081–1088. [Google Scholar] [CrossRef] [PubMed]
- Moran, C.; Arriaga, M.; Rodriguez, G.; Moran, S. Obesity Differentially Affects Phenotypes of Polycystic Ovary Syndrome. Int. J. Endocrinol. 2012, 2012, 317241. [Google Scholar] [CrossRef] [PubMed]
- Amirjani, S.; Asemi, Z.; Bazarganipour, F.; Aramesh, S.; Allan, H.; Sayadi, M.; Tabatabaei, M.-S.; Mohamadian, Z.; Zabti, F.; Iranpak, N.; et al. Dietary intake and lifestyle behaviour in different phenotypes of polycystic ovarian syndrome: A case-control study. J. Hum. Nutr. Diet. Off. J. Br. Diet. Assoc. 2019, 32, 413–421. [Google Scholar] [CrossRef]
- Huijgen, N.A.; Louwers, Y.V.; Willemsen, S.P.; de Vries, J.H.M.; Steegers-Theunissen, R.P.M.; Laven, J.S.E. Dietary patterns and the phenotype of polycystic ovary syndrome: The chance of ongoing pregnancy. Reprod. Biomed. Online 2017, 34, 668–676. [Google Scholar] [CrossRef]
- Barr, S.; Reeves, S.; Sharp, K.; Jeanes, Y.M. An Isocaloric Low Glycemic Index Diet Improves Insulin Sensitivity in Women with Polycystic Ovary Syndrome. J. Acad. Nutr. Diet. 2013, 113, 1523–1531. [Google Scholar] [CrossRef] [PubMed]
- Bykowska-Derda, A.; Czlapka-Matyasik, M.; Kaluzna, M.; Ruchala, M.; Ziemnicka, K. Diet quality scores in relation to fatness and nutritional knowledge in women with polycystic ovary syndrome: Case–control study. Public Health Nutr. 2020, 24, 3389–3398. [Google Scholar] [CrossRef]
- Eslamian, G.; Baghestani, A.R.; Eghtesad, S.; Hekmatdoost, A. Dietary carbohydrate composition is associated with polycystic ovary syndrome: A case–control study. J. Hum. Nutr. Diet. 2017, 30, 90–97. [Google Scholar] [CrossRef] [PubMed]
- Czlapka-Matyasik, M.; Lonnie, M.; Wadolowska, L.; Frelich, A. “Cutting Down on Sugar” by Non-Dieting Young Women: An Impact on Diet Quality on Weekdays and the Weekend. Nutrients 2018, 10, 1463. [Google Scholar] [CrossRef] [PubMed]
- Mehrabani, H.H.; Salehpour, S.; Amiri, Z.; Farahani, S.J.; Meyer, B.J.; Tahbaz, F. Beneficial effects of a high-protein, low-glycemic-load hypocaloric diet in overweight and obese women with polycystic ovary syndrome: A randomised controlled intervention study. J. Am. Coll. Nutr. 2012, 31, 117–125. [Google Scholar] [CrossRef] [PubMed]
- Venn, B.J.; Green, T.J. Glycemic index and glycemic load: Measurement issues and their effect on diet–disease relationships. Eur. J. Clin. Nutr. 2007, 61, S122–S131. [Google Scholar] [CrossRef]
- Esmaeilinezhad, Z.; Babajafari, S.; Sohrabi, Z.; Eskandari, M.-H.; Amooee, S.; Barati-Boldaji, R. Effect of synbiotic pomegranate juice on glycemic, sex hormone profile and anthropometric indices in PCOS: A randomised, triple blind, controlled trial. Nutr. Metab. Cardiovasc. Dis. 2019, 29, 201–208. [Google Scholar] [CrossRef] [PubMed]
- Pourteymour Fard Tabrizi, F.; Hajizadeh-Sharafabad, F.; Vaezi, M.; Jafari-Vayghan, H.; Alizadeh, M.; Maleki, V. Quercetin and polycystic ovary syndrome, current evidence and future directions: A systematic review. J. Ovarian Res. 2020, 13, 11. [Google Scholar] [CrossRef]
- Salek, M.; Clark, C.C.T.; Taghizadeh, M.; Jafarnejad, S. N-3 fatty acids as preventive and therapeutic agents in attenuating PCOS complications. EXCLI J. 2019, 18, 558–575. [Google Scholar] [CrossRef]
- Eslamian, G.; Hekmatdoost, A. Nutrient Patterns and Risk of Polycystic Ovary Syndrome. J. Reprod. Infertil. 2019, 20, 161–168. [Google Scholar]
- Cozzolino, M.; Vitagliano, A.; Pellegrini, L.; Chiurazzi, M.; Andriasani, A.; Ambrosini, G.; Garrido, N. Therapy with probiotics and synbiotics for polycystic ovarian syndrome: A systematic review and meta-analysis. Eur. J. Nutr. 2020, 59, 2841–2856. [Google Scholar] [CrossRef]
- Kant, A.K.; Graubard, B.I.; Schatzkin, A. Dietary Patterns Predict Mortality in a National Cohort: The National Health Interview Surveys, 1987 and 1992. J. Nutr. 2004, 134, 1793–1799. [Google Scholar] [CrossRef]
- Wu, P.-Y.; Chen, K.-M.; Tsai, W.-C. The Mediterranean Dietary Pattern and Inflammation in Older Adults: A Systematic Review and Meta-analysis. Adv. Nutr. 2021, 12, 363–373. [Google Scholar] [CrossRef]
- Mei, S.; Ding, J.; Wang, K.; Ni, Z.; Yu, J. Mediterranean Diet Combined with a Low-Carbohydrate Dietary Pattern in the Treatment of Overweight Polycystic Ovary Syndrome Patients. Front. Nutr. 2022, 9, 876620. [Google Scholar] [CrossRef] [PubMed]
- Czlapka-Matyasik, M.; Ast, K. Total Antioxidant Capacity and Its Dietary Sources and Seasonal Variability in Diets of Women with Different Physical Activity Levels. Pol. J. Food Nutr. Sci. 2014, 64, 267–276. [Google Scholar] [CrossRef]
- Czlapka-Matyasik, M. The Total Dietary Antioxidant Capacity, Its Seasonal Variability, and Dietary Sources in Cardiovascular Patients. Antioxidants 2023, 12, 292. [Google Scholar] [CrossRef]
- Lin, A.W.; Lujan, M.E. Comparison of Dietary Intake and Physical Activity between Women with and without Polycystic Ovary Syndrome: A Review. Adv. Nutr. 2014, 5, 486–496. [Google Scholar] [CrossRef] [PubMed]
- Sobas, K.; Wadolowska, L.; Slowinska, M.A.M.A.; Czlapka-Matyasik, M.; Wuenstel, J.; Niedzwiedzka, E. Like mother, like daughter? Dietary and non-dietary bone fracture risk factors in mothers and their daughters. Iran. J. Public Health 2015, 26, 632–642. [Google Scholar] [CrossRef]
- Steffen, L.M.; Hootman, K.C. A posteriori data-derived dietary patterns and incident coronary heart disease: Making sense of inconsistent findings. Curr. Nutr. Rep. 2016, 5, 168–179. [Google Scholar] [CrossRef]
- Panjeshahin, A.; Salehi-Abargouei, A.; Anari, A.G.; Mohammadi, M.; Hosseinzadeh, M. Association between empirically derived dietary patterns and polycystic ovary syndrome: A case-control study. Nutrition 2020, 79–80, 110987. [Google Scholar] [CrossRef]
- Moran, L.J.; Grieger, J.A.; Mishra, G.D.; Teede, H.J. The Association of a Mediterranean-Style Diet Pattern with Polycystic Ovary Syndrome Status in a Community Cohort Study. Nutrients 2015, 7, 8553–8564. [Google Scholar] [CrossRef]
- Woodward, A.; Klonizakis, M.; Broom, D. Exercise and Polycystic Ovary Syndrome. In Physical Exercise for Human Health; Xiao, J., Ed.; Springer: Singapore, 2020; pp. 123–136. ISBN 978-981-15-1792-1. [Google Scholar]
- Kałużna, M.; Czlapka-Matyasik, M.; Bykowska-Derda, A.; Moczko, J.; Ruchala, M.; Ziemnicka, K. Indirect Predictors of Visceral Adipose Tissue in Women with Polycystic Ovary Syndrome: A Comparison of Methods. Nutrients 2021, 13, 2494. [Google Scholar] [CrossRef]
- Tchernof, A.; Després, J.P. Pathophysiology of human visceral obesity: An update. Physiol. Rev. 2013, 93, 359–404. [Google Scholar] [CrossRef]
- Kałużna, M.; Czlapka-Matyasik, M.; Kompf, P.; Moczko, J.; Wachowiak-Ochmańska, K.; Janicki, A.; Samarzewska, K.; Ruchała, M.; Ziemnicka, K. Lipid ratios and obesity indices are effective predictors of metabolic syndrome in women with polycystic ovary syndrome. Ther. Adv. Endocrinol. Metab. 2022, 13, 1–13. [Google Scholar] [CrossRef] [PubMed]
- Shuster, A.; Patlas, M.; Pinthus, J.H.; Mourtzakis, M. The clinical importance of visceral adiposity: A critical review of methods for visceral adipose tissue analysis. Br. J. Radiol. 2012, 85, 1–10. [Google Scholar] [CrossRef] [PubMed]
- Kowalkowska, J.; Wadolowska, L.; Czarnocinska, J.; Czlapka-Matyasik, M.; Galinski, G.; Jezewska-Zychowicz, M.; Bronkowska, M.; Dlugosz, A.; Loboda, D.; Wyka, J. Reproducibility of a Questionnaire for Dietary Habits, Lifestyle and Nutrition Knowledge Assessment (KomPAN) in Polish Adolescents and Adults. Nutrients 2018, 10, 1845. [Google Scholar] [CrossRef]
- Kowalkowska, J.; Wadolowska, L.; Hamulka, J.; Wojtas, N.; Czlapka-Matyasik, M.; Kozirok, W.; Bronkowska, M.; Sadowska, J.; Naliwajko, S.; Dziaduch, I.; et al. Reproducibility of a Short-Form, Multicomponent Dietary Questionnaire to Assess Food Frequency Consumption, Nutrition Knowledge, and Lifestyle (SF-FFQ4PolishChildren) in Polish Children and Adolescents. Nutrients 2019, 11, 2929. [Google Scholar] [CrossRef] [PubMed]
- Lonnie, M.; Wadolowska, L.; Bandurska-Stankiewicz, E. Dietary-Lifestyle Patterns Associated with Adiposity and Metabolic Abnormalities in Adult Men under 40 Years Old: A Cross-Sectional Study (MeDiSH Project). Nutrients 2020, 12, 751. [Google Scholar] [CrossRef]
- Shahdadian, F.; Ghiasvand, R.; Abbasi, B.; Feizi, A.; Saneei, P.; Shahshahan, Z. Association between major dietary patterns and polycystic ovary syndrome: Evidence from a case-control study. Appl. Physiol. Nutr. Metab. 2019, 44, 52–58. [Google Scholar] [CrossRef]
- Cutillas-Tolín, A.; Arense-Gonzalo, J.J.; Mendiola, J.; Adoamnei, E.; Navarro-Lafuente, F.; Sánchez-Ferrer, M.L.; Prieto-Sánchez, M.T.; Carmona-Barnosi, A.; Vioque, J.; Torres-Cantero, A.M. Are Dietary Indices Associated with Polycystic Ovary Syndrome and Its Phenotypes? A Preliminary Study. Nutrients 2021, 13, 313. [Google Scholar] [CrossRef]
- Teede, H.J.; Misso, M.L.; Costello, M.F.; Dokras, A.; Laven, J.; Moran, L.; Piltonen, T.; Norman, R.J. Recommendations from the international evidence-based guideline for the assessment and management of polycystic ovary syndrome. Fertil. Steril. 2018, 110, 364–379. [Google Scholar] [CrossRef]
- Graff, S.K.; Mario, F.M.; Magalhães, J.A.; Moraes, R.S.; Spritzer, P.M. Saturated Fat Intake Is Related to Heart Rate Variability in Women with Polycystic Ovary Syndrome. Ann. Nutr. Metab. 2017, 71, 224–233. [Google Scholar] [CrossRef]
- Kennedy, A.; Martinez, K.; Chuang, C.-C.; LaPoint, K.; McIntosh, M. Saturated Fatty Acid-Mediated Inflammation and Insulin Resistance in Adipose Tissue: Mechanisms of Action and Implications. J. Nutr. 2009, 139, 1–4. [Google Scholar] [CrossRef]
- Farvid, M.S.; Malekshah, A.F.; Pourshams, A.; Poustchi, H.; Sepanlou, S.G.; Sharafkhah, M.; Khoshnia, M.; Farvid, M.; Abnet, C.C.; Kamangar, F.; et al. Dairy Food Intake and All-Cause, Cardiovascular Disease, and Cancer Mortality: The Golestan Cohort Study. Am. J. Epidemiol. 2017, 185, 697–711. [Google Scholar] [CrossRef] [PubMed]
- Janiszewska, J.; Ostrowska, J.; Szostak-Węgierek, D. Milk and Dairy Products and Their Impact on Carbohydrate Metabolism and Fertility-A Potential Role in the Diet of Women with Polycystic Ovary Syndrome. Nutrients 2020, 12, 3491. [Google Scholar] [CrossRef] [PubMed]
- Mozaffarian, D.; Hao, T.; Rimm, E.B.; Willett, W.C.; Hu, F.B. Changes in diet and lifestyle and long-term weight gain in women and men. N. Engl. J. Med. 2011, 364, 2392–2404. [Google Scholar] [CrossRef] [PubMed]
- Kok, C.R.; Hutkins, R. Yogurt and other fermented foods as sources of health-promoting bacteria. Nutr. Rev. 2018, 76, 4–15. [Google Scholar] [CrossRef] [PubMed]
- Mathur, H.; Beresford, T.P.; Cotter, P.D. Health Benefits of Lactic Acid Bacteria (LAB) Fermentates. Nutrients 2020, 12, 1679. [Google Scholar] [CrossRef]
- Khani, B.; Mehrabian, F.; Khalesi, E.; Eshraghi, A. Effect of soy phytoestrogen on metabolic and hormonal disturbance of women with polycystic ovary syndrome. J. Res. Med. Sci. 2011, 16, 297–302. [Google Scholar]
- Bykowska-Derda, A.; Kolay, E.; Kaluzna, M.; Czlapka-Matyasik, M. Emerging Trends in Research on Food Compounds and Women’s Fertility: A Systematic Review. Appl. Sci. 2020, 10, 4518. [Google Scholar] [CrossRef]
- Schoenfeld, B.J.; Aragon, A.A.; Krieger, J.W. Effects of meal frequency on weight loss and body composition: A meta-analysis. Nutr. Rev. 2015, 73, 69–82. [Google Scholar] [CrossRef]
- Patten, R.K.; Boyle, R.A.; Moholdt, T.; Kiel, I.; Hopkins, W.G.; Harrison, C.L.; Stepto, N.K. Exercise Interventions in Polycystic Ovary Syndrome: A Systematic Review and Meta-Analysis. Front. Physiol. 2020, 11, 606. [Google Scholar] [CrossRef]
- Ralph, J.L.; Von Ah, D.; Scheett, A.J.; Hoverson, B.S.; Anderson, C.M. Diet Assessment Methods. Clin. J. Oncol. Nurs. 2011, 15, E114–E121. [Google Scholar] [CrossRef]


| Mean | ±SD | Median | CI (95%) | ||
|---|---|---|---|---|---|
| Age (years) | 26 | 5 | 25 | 25 | 27 |
| Height (cm) | 165 | 15 | 167 | 163 | 168 |
| Body mass (kg) | 70.8 | 14.9 | 68.0 | 68.3 | 73.3 |
| BMI (kg/m2) | 25.4 | 5.2 | 24.1 | 24.5 | 26.3 |
| Waist circumference (cm) | 81.5 | 13.0 | 79.5 | 79.3 | 83.7 |
| Hips circumference (cm) | 100.5 | 11.4 | 100.0 | 98.6 | 102.4 |
| WHR (−) | 0.81 | 0.08 | 0.80 | 0.80 | 0.82 |
| FM (%) | 36 | 8 | 35 | 35 | 37 |
| VAT (g) | 467 | 530 | 283 | 378 | 555 |
| TC (mg/dL) | 178 | 31 | 176 | 173 | 184 |
| HDL (mg/dL) | 66 | 16 | 63 | 63 | 68 |
| LDL (mg/dL) | 95 | 30 | 93 | 90 | 100 |
| TG (mg/dL) | 87 | 58 | 69 | 77 | 97 |
| Fasting glucose (mg/dL) | 89 | 7 | 88 | 88 | 9 |
| Fasting insulin (uU/mL) | 11.09 | 7.15 | 8.89 | 9.84 | 12.34 |
| HOMA-IR (−) | 2.52 | 1.81 | 1.94 | 2.20 | 2.84 |
| FSH (mlU/mL) | 6.6 | 8.00 | 5.9 | 5.1 | 8.00 |
| LH ((mIU/mL) | 10.4 | 6.1 | 8.4 | 9.3 | 11.5 |
| LH/FSH (−) | 1.8 | 1.1 | 1.5 | 1.6 | 2.0 |
| T nmol/L | 1.9 | 0.9 | 1.6 | 1.7 | 2.0 |
| High Adherence to WDLP | Middle Adherence WDLP | Low Adherence to WDLP | ||||
|---|---|---|---|---|---|---|
| n | OR (CI95%), p | n | OR (CI95%), p | n | OR (CI95%), p | |
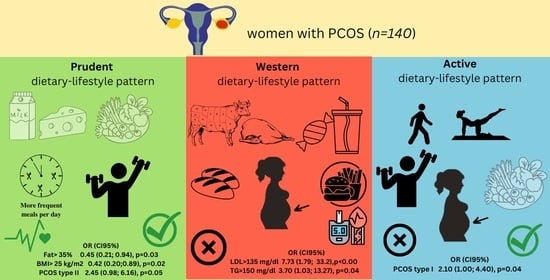
| BMI > 30 kg/m2 | 12 | 2.35 (0.94; 5.88), p = 0.06 | 8 | 1.13 (0.44; 2.92), p = 0.79 | 4 | 0.30 (0.09; 0.97), p = 0.04 * |
| BMI > 25 kg/m2 | 22 | 1.27 (0.62; 2.63), p = 0.51 | 22 | 1.58 (0.76; 3.30), p = 0.21 | 16 | 0.49 (0.23; 1.05), p = 0.06 |
| WHR > 0.80 | 24 | 1.69 (0.79; 3.60), p = 0.17 | 21 | 1.17 (0.55; 2.46), p = 0.68 | 18 | 0.51 (0.24; 1.09), p = 0.07 |
| WhtR > 0.5 | 21 | 1.37 (0.65; 2.87), p = 0.39 | 22 | 1.77 (0.84; 3.72), p = 0.12 | 14 | 0.40 (0.19; 0.88), p = 0.02 * |
| Fat > 35% | 24 | 1.17 (0.56;2.41), p = 0.66 | 24 | 1.47 (0.70; 3.08), p = 0.29 | 21 | 0.58 (0.28; 1.51), p = 0.15 |
| T. Chol. > 200 mg/dL | 11 | 1.91 (0.74; 4.92), p = 0.17 | 9 | 1.23 (0.48; 3.19), p = 0.66 | 6 | 0.40 (0.13; 1.15), p = 0.08 |
| LDL > 135 mg/dL | 8 | 7.73 (1.79; 33.2), p < 0.00 * | 1 | 0.19 (0.20; 1.64), p = 0.13 | 2 | 0.32 (0.06; 1.67), p = 0.17 |
| HDL < 50 mg/dL | 9 | 2.24 (0.80; 6.25), p = 0.12 | 7 | 1.49 (0.52; 4.20), p = 0.44 | 2 | 0.19 (0.04;0.89), p = 0.03 * |
| TG > 150 mg/dL | 7 | 3.70 (1.03; 13.27), p = 0.04 * | 3 | 0.71 (0.17; 2.90), p = 0.64 | 2 | 0.28 (0.05; 1.44), p = 0.12 |
| HOMA > 2.5 | 21 | 1.93 (0.91; 4.07), p = 0.08 | 16 | 1.11 (0.52; 2.38), p = 0.77 | 13 | 0.44 (0.20; 0.99), p = 0.04 * |
| Fasting gluc. > 100 mg/dL | 5 | 2.39 (0.62; 9.20), p = 0.19 | 3 | 0.95 (0.23; 4.04), p = 0.95 | 2 | 0.37 (0.07; 1.95), p = 0.24 |
| Fasting ins. > 10 mU/mL | 25 | 1.53 (0.75; 3.16), p = 0.24 | 24 | 1.75 (0.84; 3.66), p = 0.12 | 16 | 0.37 (0.17; 0.78), p = 0.01 * |
| LH > upper tertile | 14 | 1.05 (0.48; 2.31), p = 0.90 | 16 | 1.67 (0.76; 3.64), p = 0.19 | 11 | 0.56 (0.24; 1.28), p = 0.16 |
| FSH > upper tertile | 18 | 2.30 (1.03; 5.11), p = 0.04 * | 9 | 0.56 (0.24; 1.35), p = 0.19 | 13 | 0.72 (0.32; 1.63), p = 0.43 |
| LH/FSH > upper tertile | 14 | 0.98 (0.44; 2.17), p = 0.97 | 15 | 1.35 (0.62; 2.96), p = 0.44 | 13 | 0.74 (0.34; 1.65), p = 0.47 |
| T > upper tertile | 7 | 0.35 (0.15; 0.83), p = 0.01 * | 13 | 2.01 (0.94; 4.30), p = 0.07 | 8 | 1.28 (0.60; 2.71), p = 0.51 |
| A > upper tertile | 10 | 0.37 (0.16; 0.88), p = 0.02 * | 21 | 2.57 (1.21; 5.48), p = 0.01 * | 16 | 0.96 (0.45; 2.05), p = 0.99 |
| DHEA-s > upper tertile | 14 | 0.69 (0.32; 1.51), p = 0.35 | 18 | 1.68 (0.79; 3.57), p = 0.17 | 15 | 0.86 (0.40; 1.83), p = 0.68 |
| PCOS type 1 | 24 | 0.86 (0.42; 1.78), p = 0.69 | 22 | 0.90 (0.43; 1.88), p = 0.78 | 28 | 1.27 (0.61; 2.61), p = 0.51 |
| PCOS type 2 | 7 | 0.79 (0.29; 2.14), p = 0.65 | 9 | 1.58 (0.61; 4.04), p = 0.33 | 8 | 0.78 (0.29; 2.09), p = 0.62 |
| PCOS type 3 | 4 | 0.79 (0.22; 2.78), p = 0.71 | 4 | 1.01 (0.29; 3.56), p = 0.97 | 5 | 1.23 (0.37; 4.08), p = 0.73 |
| PCOS type 4 | 12 | 1.68 (0.70; 4.04), p = 0.24 | 7 | 0.75 (0.28; 1.97), p = 0.56 | 8 | 0.75 (0.30; 1.89), p = 0.54 |
| High Adherence to PDLP | Middle Adherence to PDLP | Low Adherence to PDLP | ||||
|---|---|---|---|---|---|---|
| n | OR (CI95%), p | n | OR (CI95%), p | n | OR (CI95%), p | |
| BMI > 30 kg/m2 | 6 | 0.60 (0.22; 1.65), p = 0.32 | 8 | 1.04 (0.40; 2.68), p = 0.93 | 10 | 1.52 (0.61; 3.79), p = 0.36 |
| BMI > 25 kg/m2 | 14 | 0.42 (0.20; 0.89), p = 0.02 * | 25 | 2.09 (1.00; 4.34), p = 0.04 * | 21 | 1.11 (0.54; 2.28), p = 0.77 |
| WHR > 0.80 | 23 | 1.24 (0.59; 2.58), p = 0.56 | 19 | 0.84 (0.40; 1.77), p = 0.64 | 21 | 0.95 (0.46; 1.98), p = 0.95 |
| WhtR > 0.5 | 15 | 0.54 (0.25; 1.14), p = 0.10 | 21 | 1.46 (0.70; 3.05), p = 0.30 | 21 | 1.25 (0.60; 2.59), p = 0.53 |
| Fat > 35% | 18 | 0.45 (0.21; 0.94), p = 0.03 * | 23 | 1.11 (0.54; 2.30), p = 0.76 | 28 | 1.97 (0.95; 4.10), p = 0.06 |
| T. Chol. > 200 mg/dL | 8 | 0.81 (0.30; 2.16), p = 0.68 | 4 | 0.29 (0.09; 0.94), p = 0.04 * | 14 | 3.27 (1.28; 8.39), p = 0.01 * |
| LDL > 135 mg/dL | 3 | 0.68 (0.16; 2.83), p = 0.59 | 3 | 0.77 (0.18; 3.16), p = 0.71 | 5 | 1.78 (0.49; 6.43), p = 0.37 |
| HDL < 50 mg/dL | 4 | 0.51 (0.16; 1.69), p = 0.27 | 5 | 0.77 (0.25; 2.33), p = 0.64 | 9 | 2.21 (0.80; 6.08), p = 0.12 |
| TG > 150 mg/dL | 4 | 0.94 (0.25; 3.47), p = 0.92 | 2 | 0.38 (0.08; 1.89), p = 0.23 | 6 | 2.22 (0.64; 7.67), p = 0.20 |
| HOMA > 2.5 | 14 | 0.59 (0.27; 1.29), p = 0.18 | 15 | 0.87 (0.40; 1.85), p = 0.71 | 21 | 1.88 (0.90; 3.95), p = 0.09 |
| Fasting gluc. > 100 mg/dL | 4 | 1.30 (0.69; 5.09), p = 0.70 | 2 | 0.50 (0.10; 2.52), p = 0.39 | 4 | 1.37 (0.35; 5.34), p = 0.64 |
| Fasting ins. > 10 mU/mL | 19 | 0.62 (0.30; 1.28), p = 0.19 | 23 | 1.33 (0.65; 2.75), p = 0.42 | 23 | 1.20 (0.59; 2.45), p = 0.61 |
| LH > upper tertile | 12 | 0.74 (0.33; 1.66), p = 0.46 | 15 | 1.29 (0.59; 2.81), p = 0.51 | 14 | 1.03 (0.47; 2.26), p = 0.93 |
| FSH > upper tertile | 12 | 0.69 (0.30; 1.58), p = 0.38 | 14 | 1.22 (0.55; 2.72), p = 0.61 | 14 | 1.15 (0.52; 2.56), p = 0.71 |
| LH/FSH > upper tertile | 15 | 1.13 (0.52; 2.45), p = 0.75 | 14 | 1.05 (0.48; 2.29), p = 0.90 | 13 | 0.83 (0.38; 1.84), p = 0.66 |
| T > upper tertile | 14 | 0.68 (0.31; 1.49), p = 0.32 | 17 | 1.34 (0.63; 2.86), p = 0.44 | 16 | 1.08 0.51; 2.30), p = 0.84 |
| A > upper tertile | 14 | 0.76 (0.35; 1.63), p = 0.47 | 16 | 1.12 (0.53; 2.38), p = 0.76 | 17 | 1.17 (0.55; 2.46), p = 0.67 |
| DHEA-s > upper tertile | 17 | 1.17 (0.55; 2.46), p = 0.68 | 15 | 0.98 (0.46; 2.08), p = 0.95 | 15 | 0.87 (0.41; 1.86), p = 0.72 |
| Pcos type 1 | 22 | 0.64 (0.31; 1.32), p = 0.22 | 25 | 1.08 (0.52; 2.24), p = 0.82 | 27 | 1.44 (0.69; 3.00), p = 0.32 |
| Pcos type 2 | 13 | 2.45 (0.98; 6.16), p = 0.05 * | 5 | 0.51 (0.17; 1.50), p = 0.22 | 6 | 0.67 (0.24; 1.87), p = 0.45 |
| Pcos type 3 | 6 | 1.72 (0.54; 5.53), p = 0.32 | 3 | 0.59 (0.15; 2.31), p = 0.45 | 4 | 0.89 (0.26; 3.11), p = 0.86 |
| Pcos type 4 | 7 | 0.60 (0.23; 1.58), p = 0.30 | 12 | 1.88 (0.78; 4.50), p = 0.15 | 8 | 0.82 (0.33; 2.09), p = 0.69 |
| High Adherence to ADLP | Middle Adherence to ADLP | Low Adherence to ADLP | ||||
|---|---|---|---|---|---|---|
| n | OR (CI95%), p | n | OR (CI95%), p | n | OR (CI95%), p | |
| BMI > 30 kg/m2 | 11 | 1.83 (0.74; 4.53), p = 0.18 | 9 | 1.35 (0.53; 3.41), p = 0.52 | 4 | 1.09 (0.42; 2.81), p = 0.80 |
| BMI > 25 kg/m2 | 23 | 1.39 (0.68; 2.87), p = 0.36 | 23 | 1.67 (0.80; 3.46), p = 0.16 | 14 | 0.87 (0.41; 1.81), p = 0.70 |
| WHR > 0.80 | 24 | 1.34 (0.64; 2.78), p = 0.43 | 21 | 1.22 (0.58; 2.57), p = 0.60 | 18 | 0.84 (0.40; 1.78), p = 0.65 |
| WhtR > 0.5 | 21 | 1.20 (0.58; 2.48), p = 0.62 | 24 | 2.37 (1.12; 5.01), p = 0.02 * | 12 | 0.97 (0.46; 2.03), p = 0.93 |
| Fat > 35% | 24 | 0.97 (0.47; 1.99), p = 0.94 | 29 | 2.71 (1.27; 5.77), p = 0.01 * | 16 | 1.60 (0.77; 3.33), p = 0.21 |
| Cholersterol > 200 mg/dL | 13 | 2.35 (0.93; 5.89), p = 0.07 | 4 | 0.32 (0.10; 1.06), p = 0.06 | 9 | 1.82 (0.72; 4.63), p = 0.20 |
| LDL > 135 mg/dL | 6 | 2.51 (0.70; 9.05), p = 0.15 | 1 | 0.20 (0.02; 1.68), p = 0.13 | 4 | 1.23 (0.33; 4.63), p = 0.75 |
| HDL < 50 mg/dL | 8 | 1.65 (0.60; 4.58), p = 0.32 | 7 | 1.42 (0.50; 4.01), p = 0.50 | 3 | 1.88 (0.68; 5.22), p = 0.22 |
| TG > 150 mg/dL | 5 | 1.39 (0.40; 4.84), p = 0.60 | 5 | 1.78 (0.50; 6.31), p = 0.36 | 3 | 1.60 (0.46; 5.60), p = 0.46 |
| HOMA > 2.5 | 18 | 1.03 (0.49; 2.18), p = 0.92 | 17 | 1.21 (0.58; 2.48), p = 0.61 | 15 | 1.09 (0.53; 2.27), p = 0.80 |
| Fasting gluc. > 100 mg/dL | 5 | 1.28 (0.33; 4.96), p = 0.71 | 1 | 0.22 (0.03; 1.92), p = 0.17 | 4 | 0.88 (0.21; 3.76), p = 0.81 |
| Fasting ins. > 10 mU/mL | 26 | 1.52 (0.75; 3.12), p = 0.24 | 21 | 1.05 (0.51; 2.17), p = 0.88 | 18 | 1.10 (0.53; 2.27), p = 0.79 |
| LH > upper tertile | 16 | 1.35 (0.63; 2.92), p = 0.43 | 11 | 0.70 (0.31; 1.61), p = 0.40 | 14 | 1.00 (0.47; 2.12), p = 0.99 |
| FSH > upper tertile | 14 | 0.93 (0.87; 2.09), p = 0.87 | 12 | 0.94 (0.41; 2.12), p = 0.88 | 14 | 1.10 (0.49; 2.48), p = 0.80 |
| LH/FSH > upper tertile | 16 | 1.28 (0.59; 2.77), p = 0.52 | 12 | 0.79 (0.35; 1.77), p = 0.57 | 14 | 0.80 (0.36; 1.80), p = 0.60 |
| T > upper tertile | 18 | 1.20 (0.57; 2.55), p = 0.62 | 13 | 0.77 (0.35; 1.69), p = 0.51 | 16 | 1.06 (0.49; 2.29), p = 0.87 |
| A > upper tertile | 17 | 1.17 (0.56; 2.47), p = 0.67 | 14 | 1.57 (0.47; 5.26), p = 0.46 | 16 | 1.01 (0.47; 2.17), p = 0.96 |
| DHEA-s > upper tertile | 16 | 1.02 (0.48; 2.17), p = 0.95 | 18 | 1.48 (0.70; 3.13), p = 0.30 | 13 | 0.75 (0.34; 1.64), p = 0.47 |
| Pcos type 1 | 31 | 2.10 (1.00; 4.40), p = 0.04 * | 18 | 0.46 (0.22; 0.96), p = 0.04 * | 25 | 1.83 (0.85; 3.90), p = 0.11 |
| Pcos type 2 | 6 | 0.47 (0.16; 1.39), p = 0.17 | 13 | 3.47 (1.37; 8.82), p = 0.00 * | 5 | 0.58 (0.19; 1.69), p = 0.31 |
| Pcos type 3 | 3 | 0.55 (0.14; 2.14), p = 0.39 | 5 | 1.35 (0.41; 4.44), p = 0.62 | 5 | 0.65 (0.17; 2.56), p = 0.54 |
| Pcos type 4 | 8 | 0.77 (0.30; 1.94), p = 0.58 | 8 | 0.86 (0.34; 2.17), p = 0.75 | 11 | 0.75 (0.29; 1.96), p = 0.56 |
Disclaimer/Publisher’s Note: The statements, opinions and data contained in all publications are solely those of the individual author(s) and contributor(s) and not of MDPI and/or the editor(s). MDPI and/or the editor(s) disclaim responsibility for any injury to people or property resulting from any ideas, methods, instructions or products referred to in the content. |
© 2023 by the authors. Licensee MDPI, Basel, Switzerland. This article is an open access article distributed under the terms and conditions of the Creative Commons Attribution (CC BY) license (https://creativecommons.org/licenses/by/4.0/).
Share and Cite
Bykowska-Derda, A.; Kaluzna, M.; Ruchała, M.; Ziemnicka, K.; Czlapka-Matyasik, M. The Significance of Plant-Based Foods and Intense Physical Activity on the Metabolic Health of Women with PCOS: A Priori Dietary-Lifestyle Patterns Approach. Appl. Sci. 2023, 13, 2118. https://doi.org/10.3390/app13042118
Bykowska-Derda A, Kaluzna M, Ruchała M, Ziemnicka K, Czlapka-Matyasik M. The Significance of Plant-Based Foods and Intense Physical Activity on the Metabolic Health of Women with PCOS: A Priori Dietary-Lifestyle Patterns Approach. Applied Sciences. 2023; 13(4):2118. https://doi.org/10.3390/app13042118
Chicago/Turabian StyleBykowska-Derda, Aleksandra, Malgorzata Kaluzna, Marek Ruchała, Katarzyna Ziemnicka, and Magdalena Czlapka-Matyasik. 2023. "The Significance of Plant-Based Foods and Intense Physical Activity on the Metabolic Health of Women with PCOS: A Priori Dietary-Lifestyle Patterns Approach" Applied Sciences 13, no. 4: 2118. https://doi.org/10.3390/app13042118
APA StyleBykowska-Derda, A., Kaluzna, M., Ruchała, M., Ziemnicka, K., & Czlapka-Matyasik, M. (2023). The Significance of Plant-Based Foods and Intense Physical Activity on the Metabolic Health of Women with PCOS: A Priori Dietary-Lifestyle Patterns Approach. Applied Sciences, 13(4), 2118. https://doi.org/10.3390/app13042118