Article

Bolt Loosening Detection Using Key-Point Detection Enhanced by Synthetic Datasets

1
School of Civil Engineering, Dalian University of Technology, Dalian 116024, China
2
State Key Laboratory of Coastal and Offshore Engineering, Dalian University of Technology, Dalian 116024, China
*
Author to whom correspondence should be addressed.
Appl. Sci. 2023, 13(3), 2020; https://doi.org/10.3390/app13032020
Submission received: 30 December 2022 / Revised: 29 January 2023 / Accepted: 1 February 2023 / Published: 3 February 2023
(This article belongs to the Special Issue Machine Learning–Based Structural Health Monitoring)

Abstract

:
Machine vision based on deep learning is gaining more and more applications in structural health monitoring (SHM) due to the rich information that can be achieved in the images. Bolts are widely used in the connection of steel structures, and their loosening can compromise the safety of steel structures and lead to serious accidents. Therefore, this paper proposes a method for the automatic detection of the bolt loosening angle based on the latest key point detection technology using machine vision and deep learning. First, we built a virtual laboratory in Unreal Engine5 that could automatically label and generate synthetic datasets, and the datasets with bolts were collected. Second, the datasets were trained using the YOLOv7-pose framework, and the resulting model was able to accurately detect key points of bolts in images obtained under different angles and lighting conditions. Third, a bolt loosening angle calculation method was proposed according to the detected key points and the position relationship between neighboring bolts. Our results demonstrate that the proposed method is effective at detecting the bolt loosening angle and that the use of synthetic datasets significantly improves the efficiency of datasets establishment while also improving the performance of model training.

1. Introduction

Threaded fasteners are a standard and essential part of the industry, providing connection, fastening, and sealing functions. Because of their low cost, interchangeability, and ease of installation and removal, they are used in a wide range of applications in mechanical, aerospace, civil, and marine engineering. Although threaded fasteners are often small and even inconspicuous, they play an important role in ensuring structural integrity and reliability [1]. Typical forms of threaded connections include bolts, nuts, and clamping components. In a bolted connection, the bolt usually has a preload, which is provided by the stress between the clamping member and the nut [2]. When the bolt or nut is tightened, the bolt elongates, and a preload is generated. An adequate preload is essential to ensure joint and fastening performance and to improve the reliability of the product [3]. Loosening is a critical problem faced by threaded fasteners. In engineering applications, threaded fasteners are exposed to a variety of operating environments and to various types of external loads, which results in a risk of loosening that is often unavoidable. Loose bolts can directly lead to a reduction in preload and cause mechanical failures, e.g., water, oil, and gas leaks in various engineering applications are mostly due to loose bolts.
In a strict sense, loosening can be defined as a process in which the inner and outer threads rotate in the opposite direction to the tightening direction, resulting in a reduction in the preload. This is also referred to as “self-loosening”. The magnitude of the reversed rotation angle can be used as an indicator of the severity of loosening [4]. Engineering experience and scientific studies have shown that retaining the preload during service is critical to maintaining the function of threaded fasteners and ensuring structural integrity and reliability. Therefore, the need to periodically check the tightness of the bolts is critical to avoid structural damage and accidents.
The manual inspection method is the most traditional and the most common method applied in engineering. One of the simplest methods is the “straight line marking method”, in which a marker is used to draw a marking line on the tightened bolt and nut. The inspector determines the tightness of the bolt by seeing if the marker line remains continuous. The other main method is to use a torque wrench. Using a wrench with a torque meter, the inspector checks the torque of the bolt at determined intervals and ensures that it has not dropped [5]. The manual method is cheaper and simpler compared to other inspection methods. However, the tension-to-torque ratio of bolt tightening is affected by many factors, leading to a high error rate in the torque wrench method, which limits the application of this method when the accuracy of the measurement is required. In addition, its performance depends on the level of the inspector and the regular inspection interval. Moreover, in some special cases, the inspector may not have access to the site for inspection.
In bolted connections, the bolt usually has a preload, which is provided by the stress between the clamping member and the nut, and there is a corresponding relationship between the bolt loosening and the force. Therefore, methods based on stress measurements have been proposed earlier, and these methods use different techniques to measure the strain or stress on the bolt, the nut, and the clamping components to determine whether the bolt is loose or not. Ultrasonic measurements based on the acoustoelastic principle, contact dynamic method through active sensing, impedance method, vibration-based methods, and other methods were applied [6]. Strain gauges, ultrasonic sensors [7], fiber optic Bragg gratings (FBG) [8], and piezoelectric ceramic transducers (PZT) [9] that can be used to measure stress or strain are frequently used. Methods to locate the loose parts of bolted connections based on changes in the overall vibration data of the structure have also been proposed by many authors [10,11]. The accuracy and reliability of these methods, which are achieved by the direct measurement of strain and stress, are quite high. However, the equipment used in these methods is often very expensive and is mainly used for experimental and special requirements, which makes it difficult to promote their use in practical engineering applications.
With the rapid development of machine vision technology, more and more research is being conducted to apply machine vision to bolt loosening detection. Considering the special vision, according to the object of detection, these methods can be divided into two categories: relative rotation recognition and relative length recognition. Relative rotation recognition is generally the rotation angle recognition of the bolt or the nut, while relative length recognition is usually the length of the bolt above the fastener, as shown in Figure 1.
Before the breakthrough of deep learning in the field of target detection, many researchers started to use traditional machine vision methods for bolt loosening detection. The detection methods mainly focus on bolt identification using a cascade bolt detector (CBD) [12], bolt or nut edge detection using Hough transform [13,14], bolt loosening state classification using feature extraction and matching [15,16], and bolt loosening state classification using support vector machines (SVM) [12,15]. These methods are limited by technology and usually cannot balance the accuracy and robustness of recognition. Moreover, these traditional machine vision methods, such as Hough line detection, usually require long running times that preclude their application in real-time monitoring. What is more, it is difficult to identify bolts from images with complex backgrounds using these methods.
Recently, with the rapid development of object detection convolutional neural networks (CNNs), such as Region-based CNN (RCNN) [17], Faster-RCNN [18], Mask RCNN [19], You Only Look Once (YOLO) [20], and Single Shot MultiBox Detector (SSD) [21], a much better bolt detection performance was achieved. Studies using CNN target detection algorithms to identify and extract individual bolt images followed by edge recognition using techniques such as the Hough transform to obtain bolt loosening angles are beginning to emerge [22,23,24]. Among them, Pham et al. [23] used Solidworks to model bolts for expanding the dataset. Some research determines bolt loosening by making manual marks on the bolt and nut and identifying the relationship between the bolt and the marks by a target detection algorithm [25,26,27,28,29]. Some research qualitatively judges whether a bolt is loose by the length of the bolt extension [30,31]. Pan et al. [32] integrated YOLOv3-tini with an optical flow-based KLT tracking algorithm to achieve the real-time detection of bolt loosening.
With the rapid development of face recognition and human pose recognition, key-point detection technology is also applied to bolt loosening recognition. The existing research is divided into two main directions: the identification of corner points of hexagonal bolts or nuts and the identification of overall key points of threaded fasteners. Li et al. [33] and Wu et al. [34] used top-down and bottom-up approaches, respectively, to identify six corner points of a bolt and to detect bolt loosening by comparing the key point feature information of the same bolt at different times through two measurements. Deng et al. [35] and Gong et al. [36] used a deep learning algorithm based on the convolutional neural networks of key-point regions to detect multiple key-points and locate the region of interest (RoI), and then derive the calculated bolt loosening angle or the length of the exposed bolt based on a geometric imaging theory.
Although there has been much research on vision-based bolt loosening detection, all of these methods face one or more of the following problems.
  • Many of these methods often have more critical requirements on the camera angle of view or the background where the bolt is located.
  • In order to locate the initial condition of the bolts, many methods require manual marks on the bolts or connection plates. This is a significant amount of work considering the large number of bolts applied to engineering projects. Additionally, these marks will gradually fade or even eventually miss out with time, causing them to be unrecognizable.
  • For methods using deep learning algorithms for bolt detection, it is well known that establishing sufficiently large datasets is a time and labor-consuming process, especially for key-point detection.
  • The accuracy and robustness of many methods are evaluated when detecting one single bolt, while, actually, when used in buildings or mechanical structures, the bolts are often in the form of a matrix of connection plates.
To solve the above problems, this paper proposes a method for the automatic detection of the bolt loosening angle based on the latest key-point detection technology. Here, the main contributions of this paper are as follows.
  • A virtual experiment platform is built based on Unreal Engine to solve the problem of laborious manual annotation in dataset establishment. The experimental platform can achieve automatic changes to the camera view, automatic saving of bolt images, and automatic labeling of key points. The platform can quickly build a large-scale synthetic dataset and significantly improve the efficiency of image dataset establishment;
  • Based on the latest key-point detection technology YOLOv7-pose [37], using different capacities of datasets, we can verify the effectiveness of the algorithm in the bolt key-point detection and verify the effectiveness of the synthetic dataset to improve the accuracy of the model;
  • Based on the information of key points obtained from the detection, a bolt loosening angle calculation method is proposed according to the position relationship between neighboring bolts. This method avoids the necessity of extra manual marks and can correct the perspective errors caused by camera view angle changes. Additionally, the accuracy and stability of the method are verified.

2. Materials and Methods
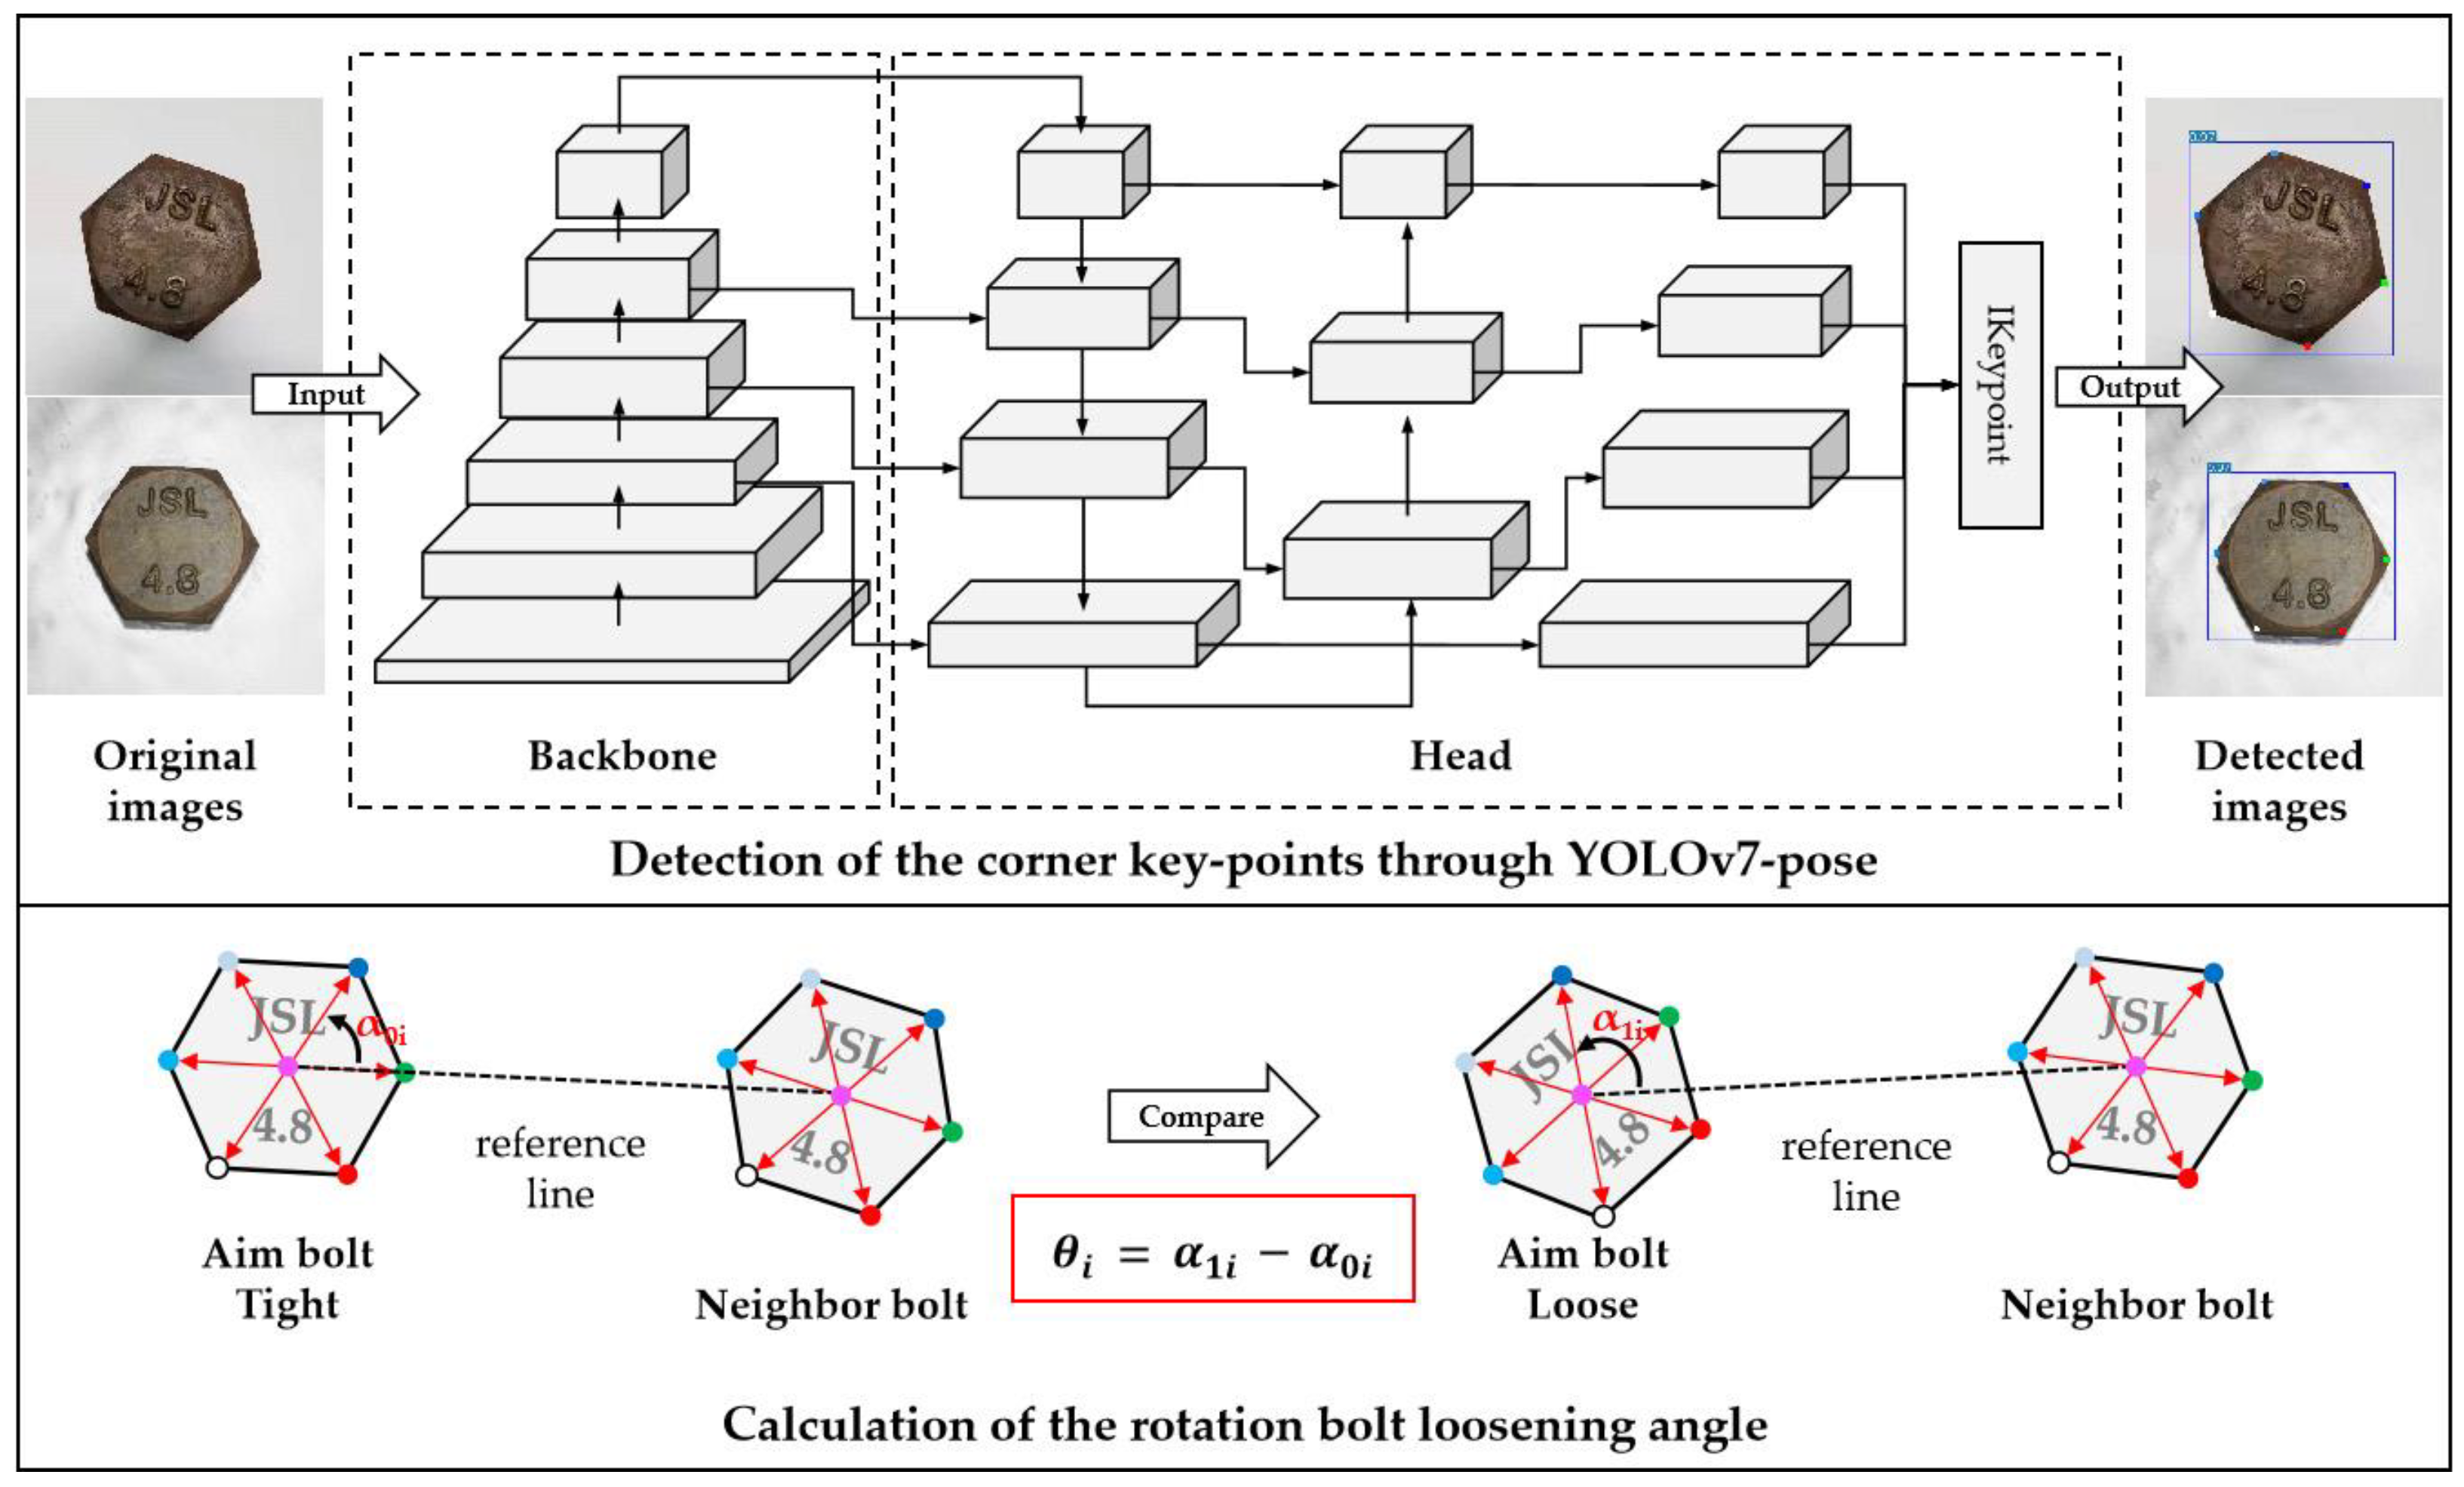
2.1. Overview

Figure 2 shows the proposed framework that consists of two main steps:
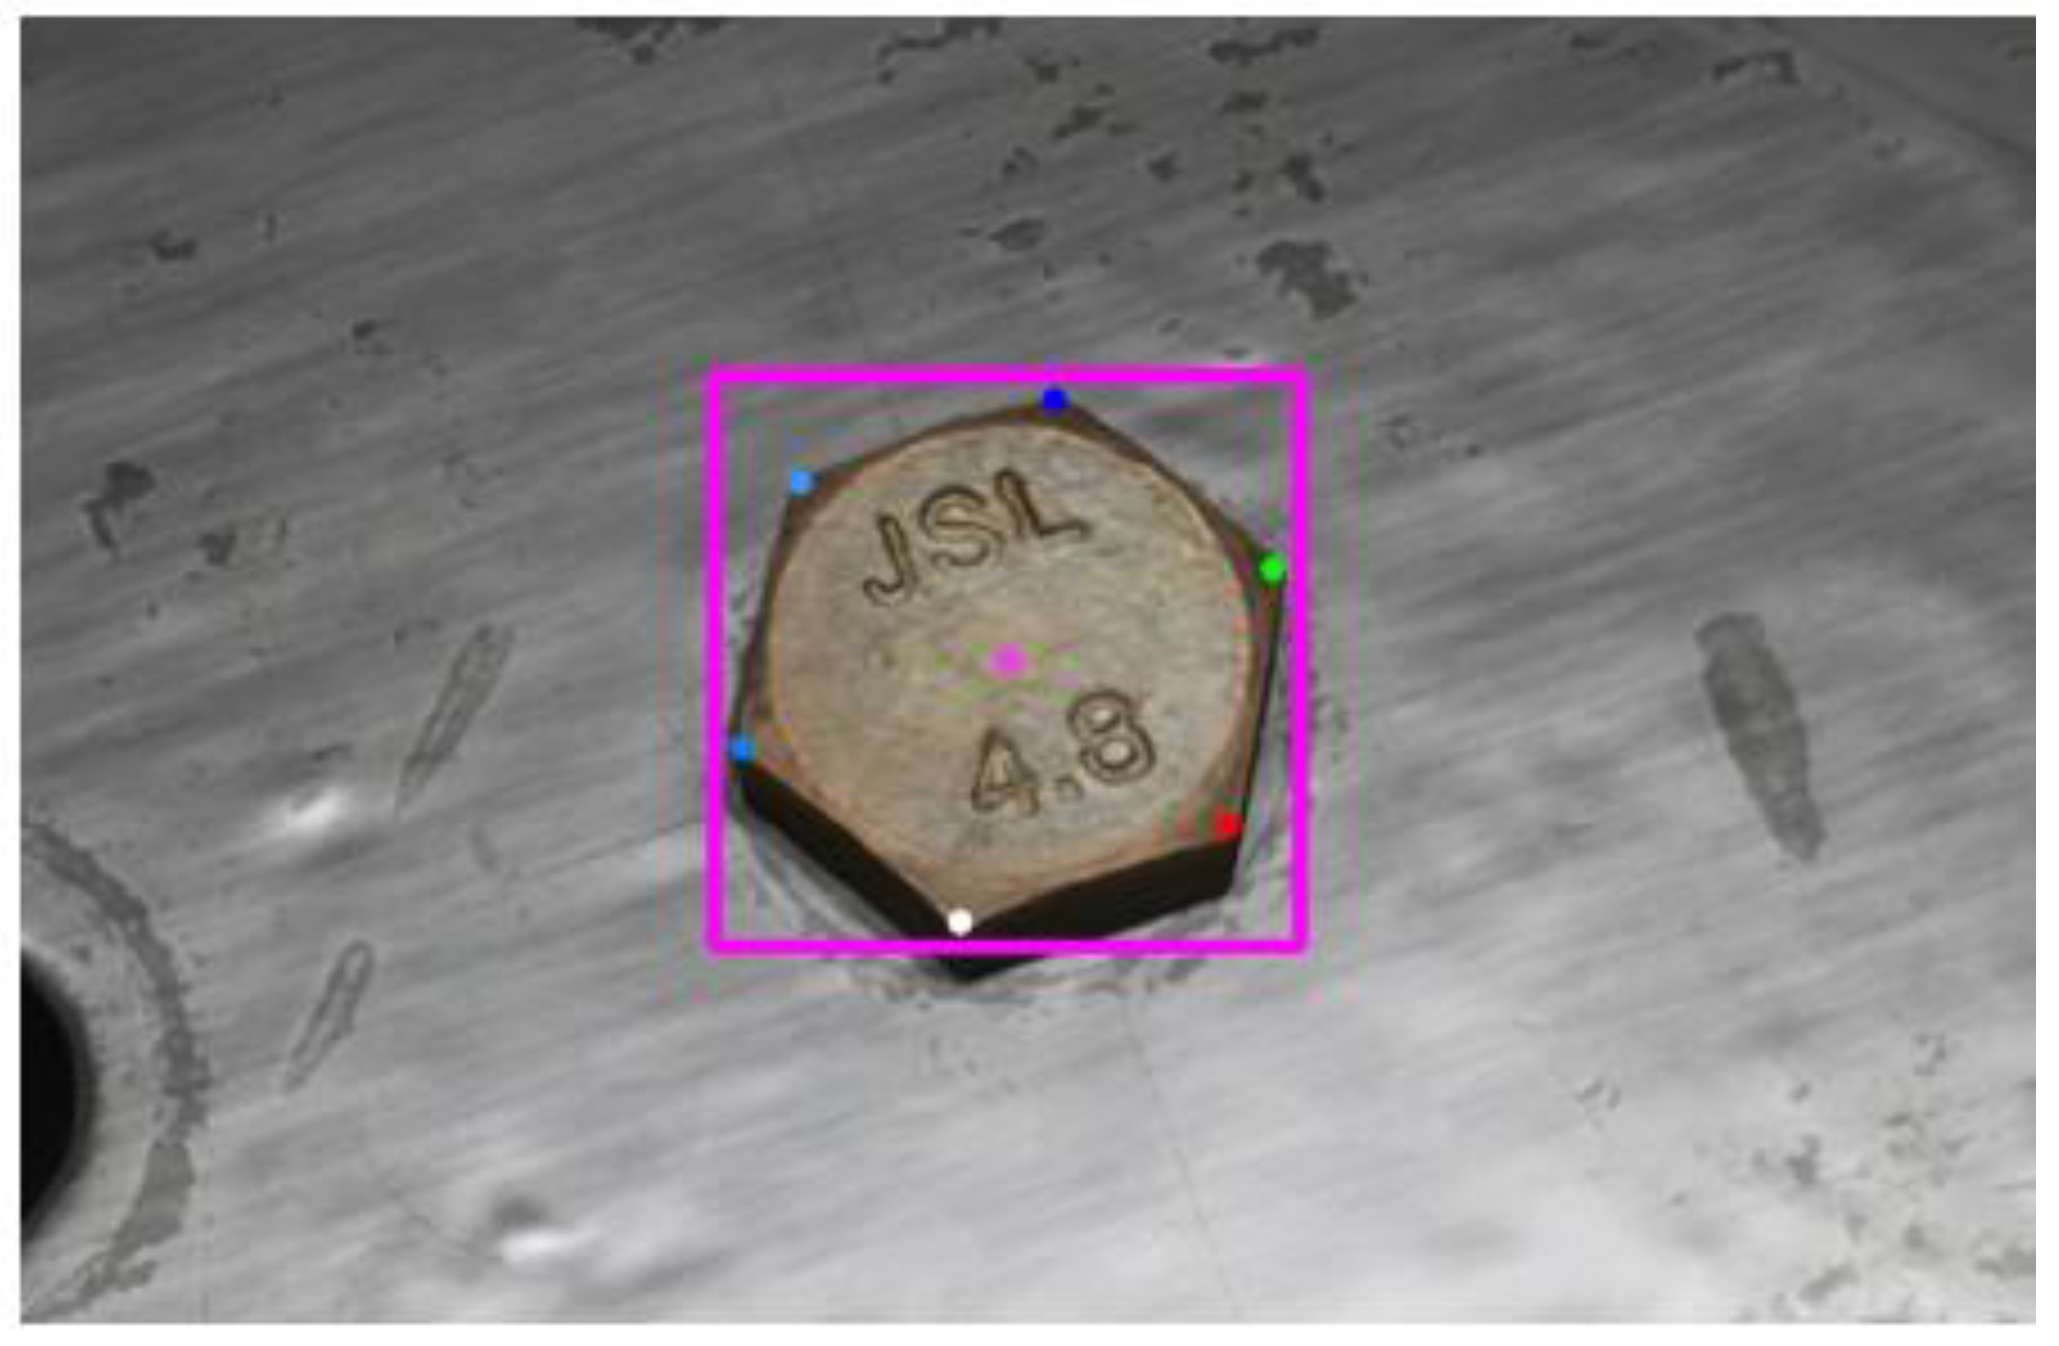
  • The detection of the corner key points through YOLOv7-pose. The average coordinates of 6 corner key points are regarded as the center of each bolt;
  • According to the position relationship between neighboring the bolts, calculate the rotation angles for the loose bolts.

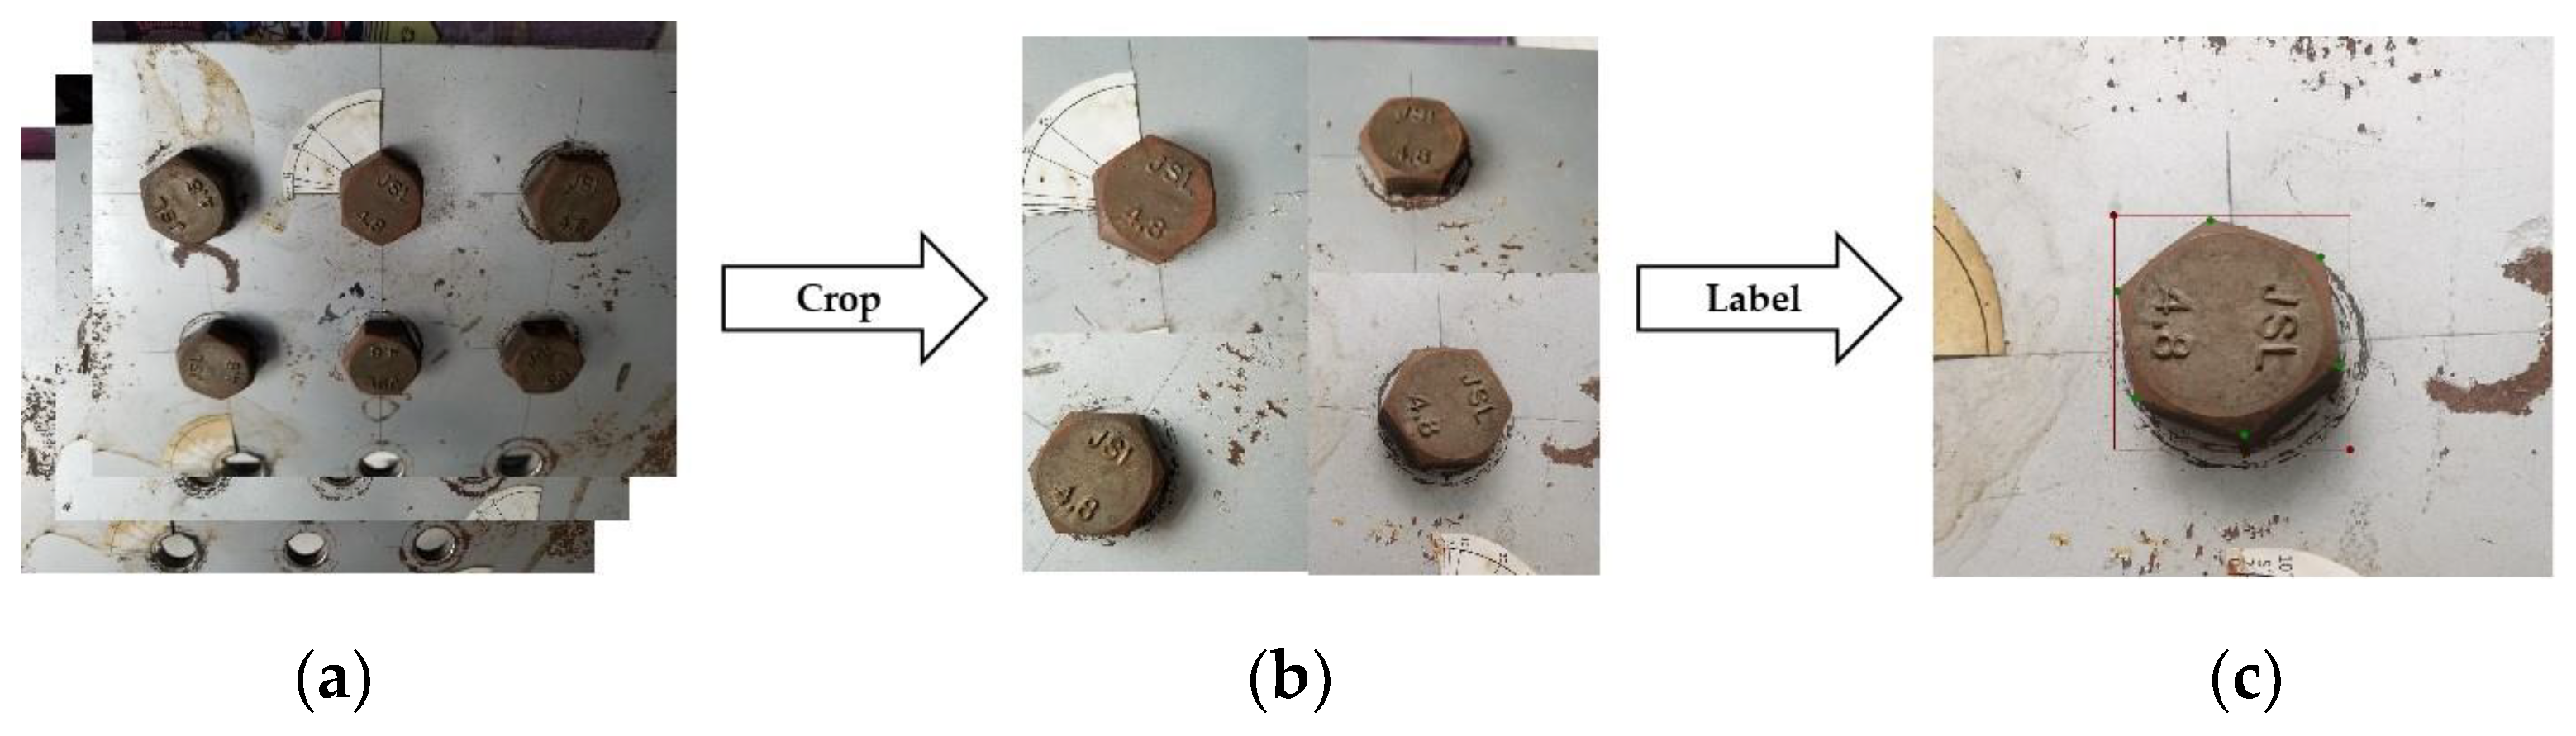
2.2. Datasets Establishment

The datasets used in this paper, collected by us, are divided into two main categories: real datasets and synthetic datasets.

2.2.1. Real Datasets

Figure 3 shows the test structure used, in which multiple bolts can be fitted at the same time. The test structure consists of three iron plates, two of which are used as supports, and a large horizontal plate for the installation of nine M28 bolts. The plate dimensions were 400 mm, 240 mm wide, and 10 mm thick. The spacing between the bolts was 70 mm. Smartphones were used to acquire images of the bolts, which were taken at different angles and distances. The specifications of the onboard camera of the smartphone are shown in Table 1. the photographs obtained (4032 × 3024 pixels) were cropped into several images containing only one bolt. A total of 300 bolt images were eventually obtained. In order to improve the training speed of the deep learning algorithm, the width of all the cropped obtained images was uniformly converted to 640 pixels. We used Labelme annotation software to annotate the bolt images with bolts and key points, as shown in Figure 4.
Because the bolt is a hexahedron, if the corner points are not sequentially numbered, there will be no difference for every 60 degrees of bolt rotation, and this would make it impossible to detect bolt loosening angles above 60 degrees. Therefore, we started with the first corner point on the right side of the “JSL” mark as a reference and labeled 6 corner points in a clockwise direction, as shown in Figure 5. In this way, the corner points labeled sequentially can one-by-one correspond to the results of key-point detection. The detection range of the bolt loosening angle can be extended from 0° to 360°.
The real dataset was divided into the training set (200 images), validation set (50 images), and test set (50 images) according to the ratio of 4:1:1.

2.2.2. Synthetic Datasets

Synthetic datasets, obtained with the help of data-enhancing techniques and game engines, have been used in important roles for pathological image recognition [38], 3D point cloud semantic recognition [39], and other fields because of their capability to effectively solve the problem of the shortage of real image data and the high time cost of manual labeling. In the field of key-point detection, it is time and labor costly for a research team to build a large-scale dataset independently for a specific target. In this paper, we established a method that could automatically generate synthetic datasets through the following 3 steps.
(1)
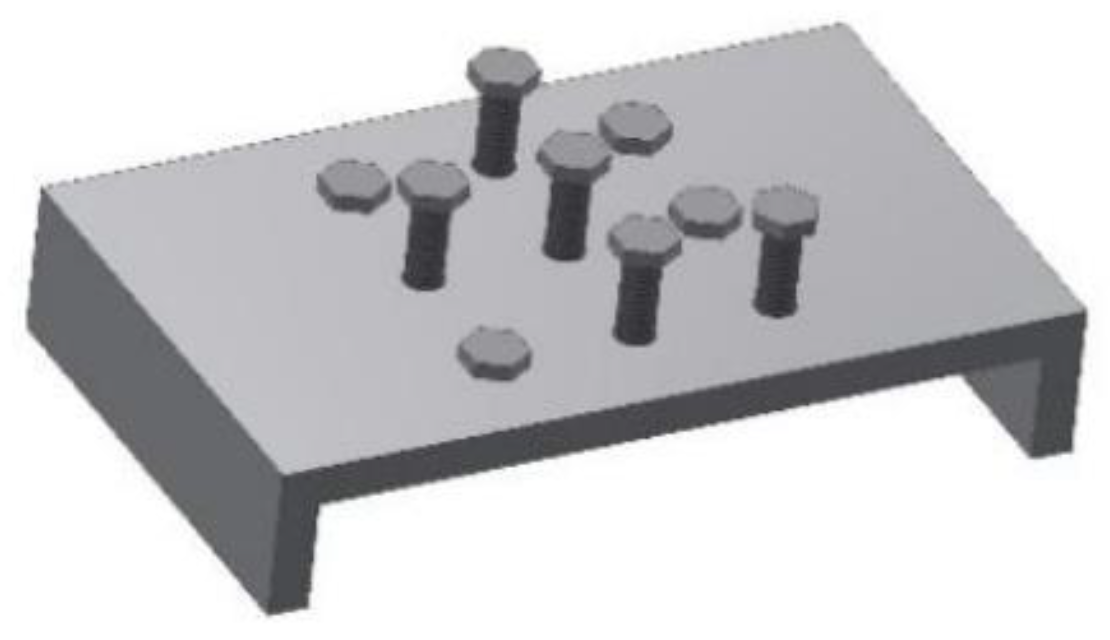
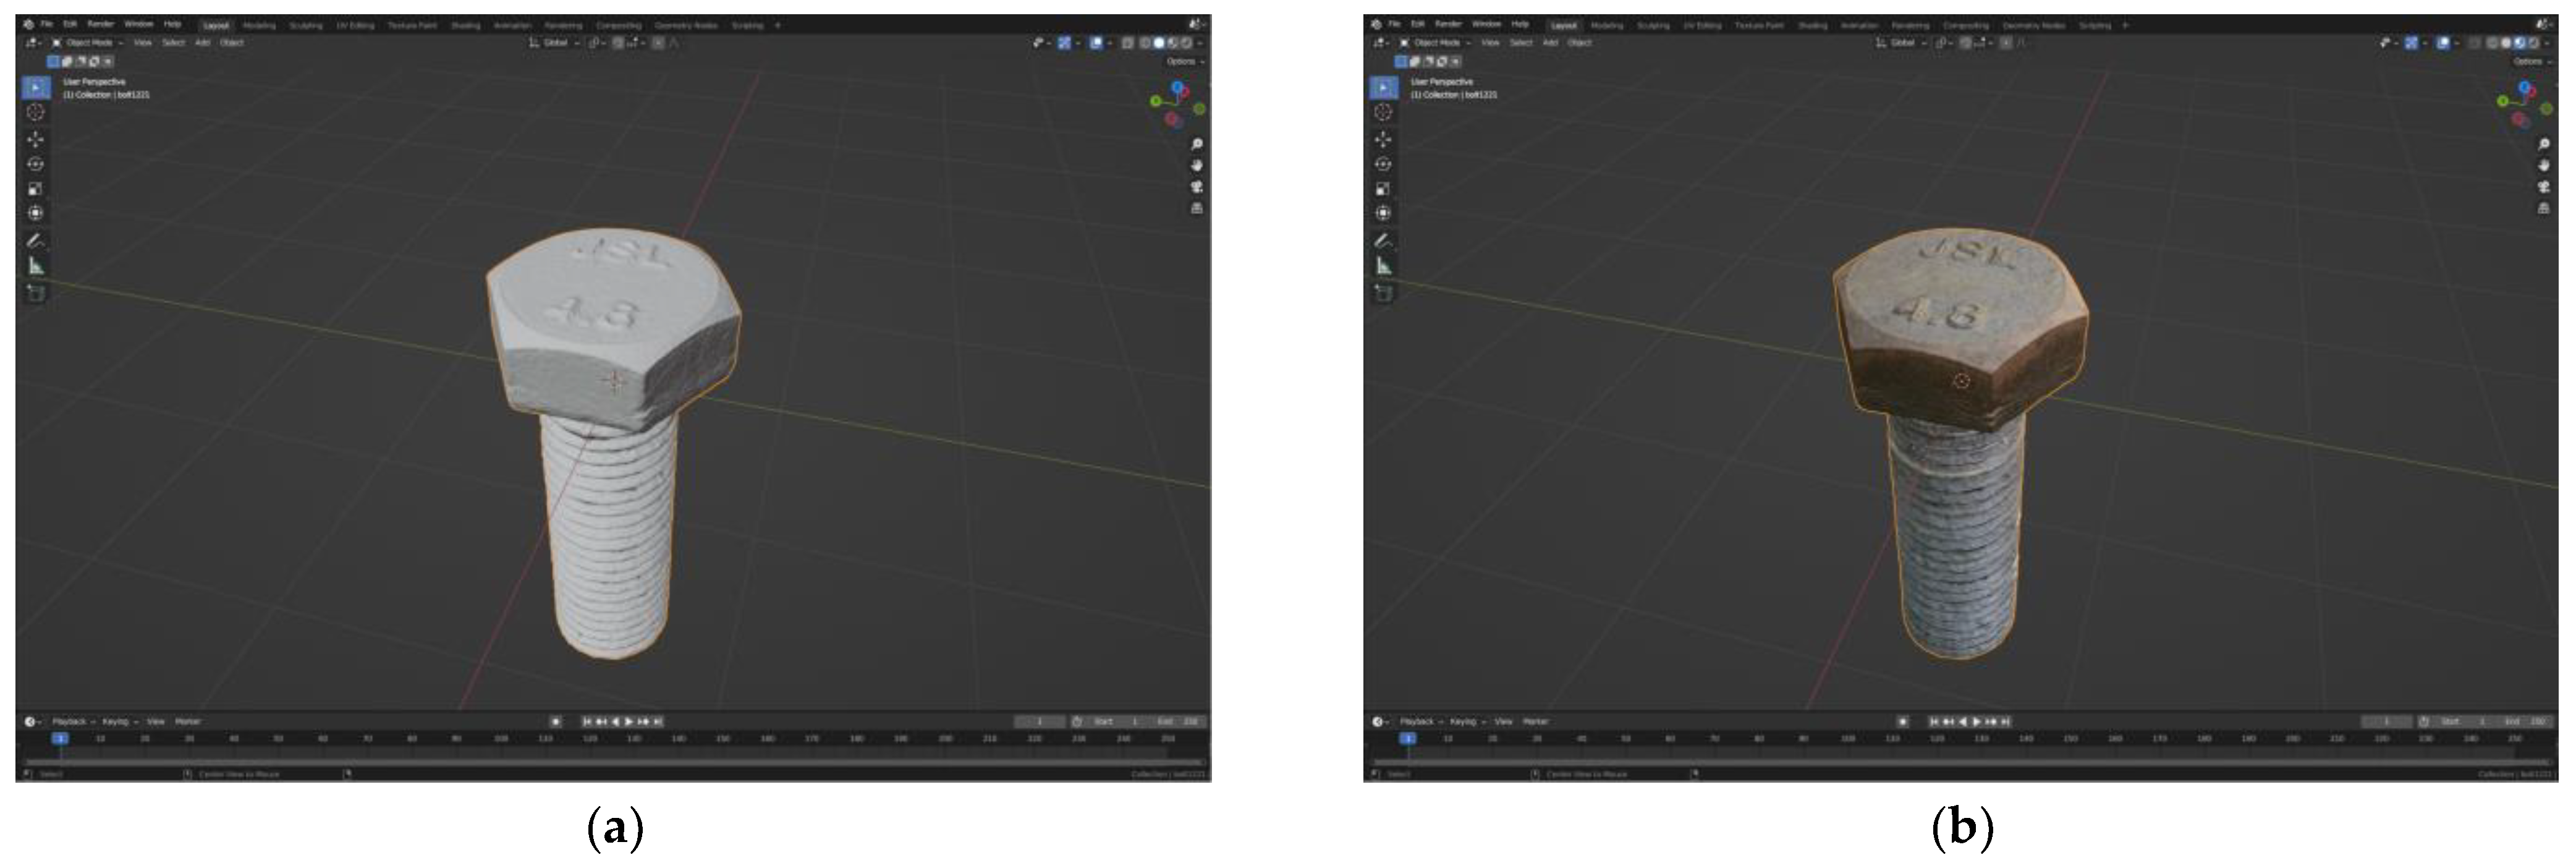
Bolt high-fidelity modeling
We used 3D scanning technology to convert a bolt into a digital model. The model was imported into Blender 3.4, the surface was smoothed, and the materials and mapping were adjusted. The bolt model was made to show the same color and glossiness as the real world under various lighting conditions. The bolt digital model is shown in Figure 6.
(2)
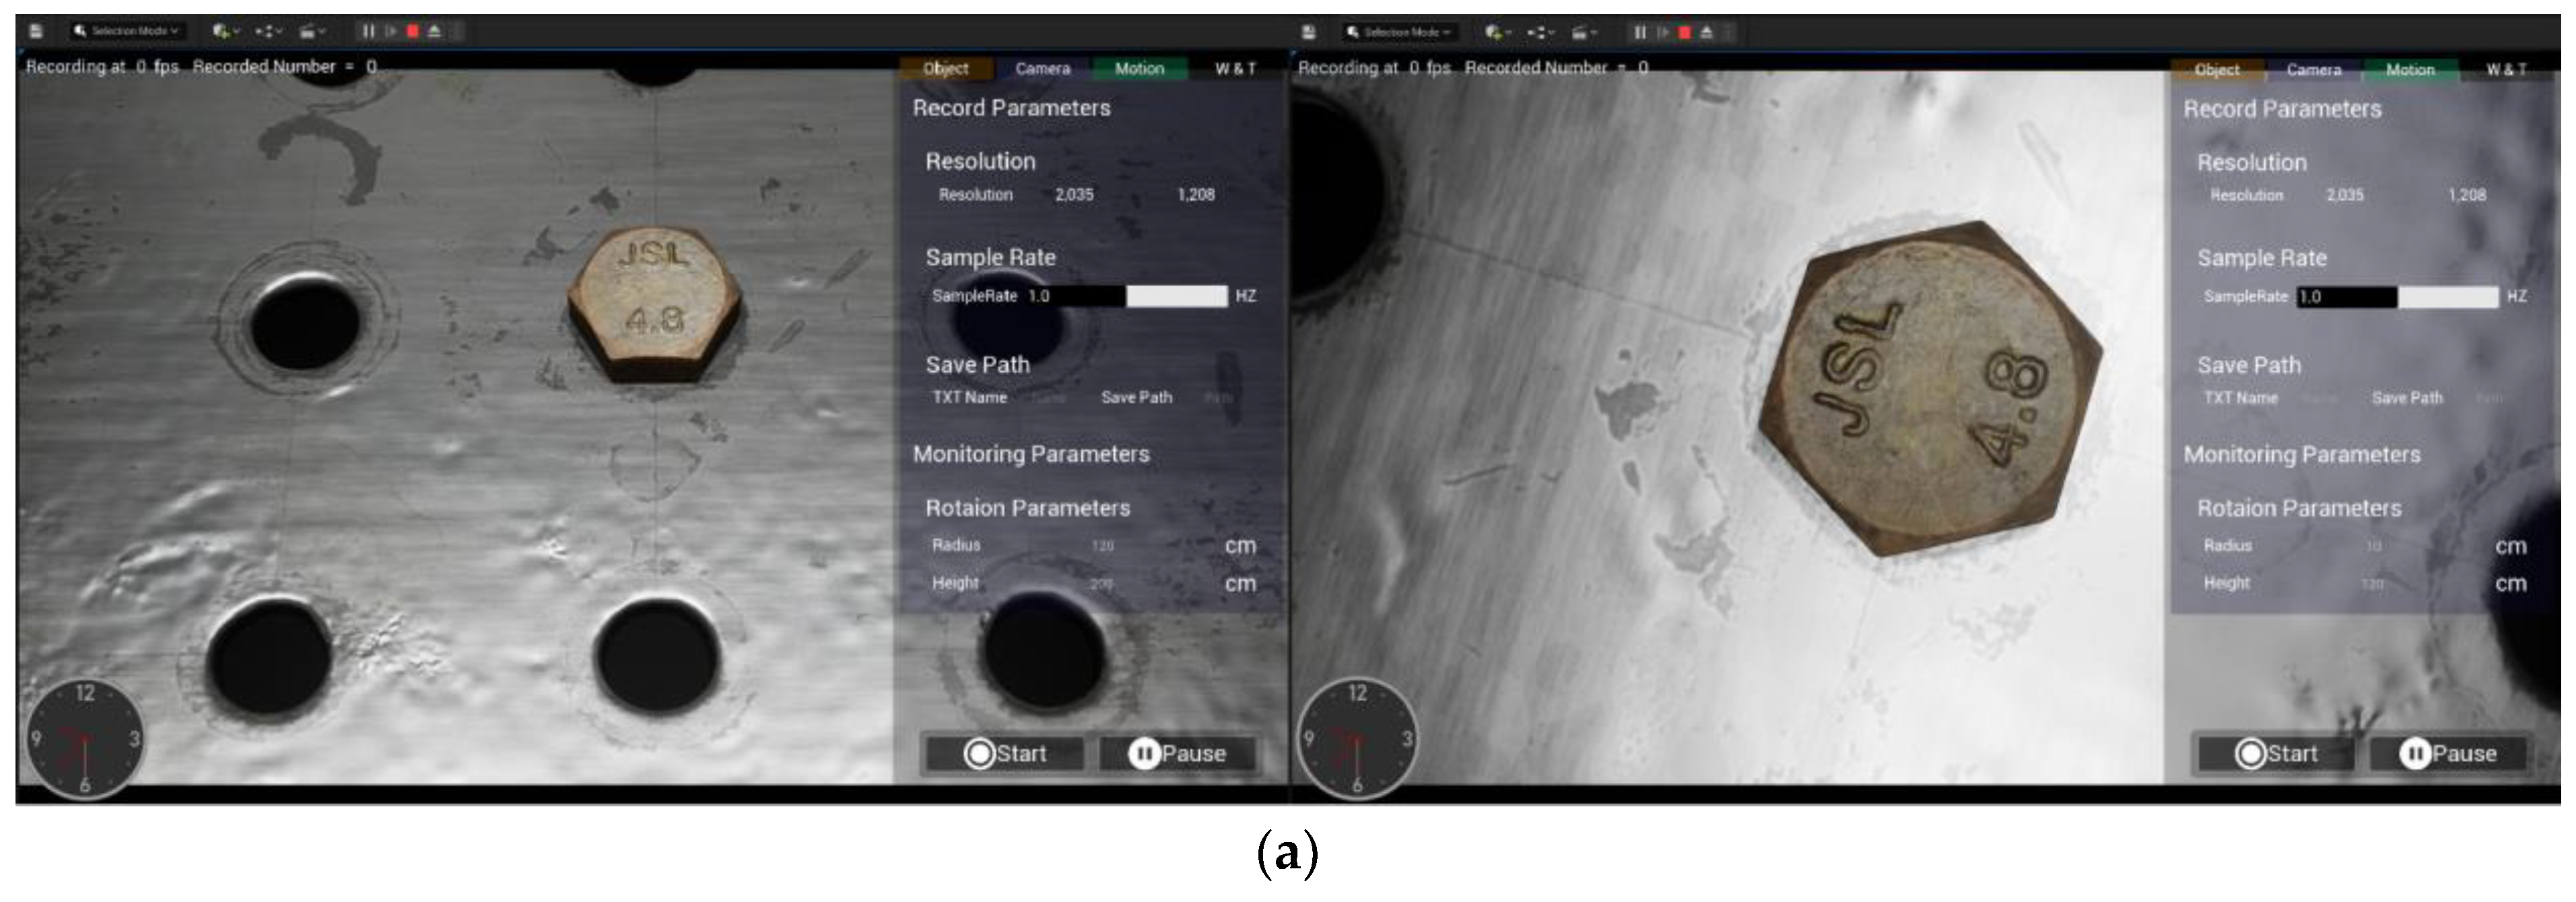
Virtual experiment platform
Unreal Engine 5.1.0 (UE5)’s excellent light and shadow representation capabilities allow computer simulations to obtain the same level of realism as real photos, even without long rendering sessions. This allows UE5 to easily output near-realistic virtual images, which is well-suited for synthetic dataset building.
The UI of the virtual experiment platform, built using UE5, is shown in Figure 7.
In this platform we can achieve the following functions:
  • Set the height and view angle of the camera, adjust the rotation angle of the bolt, and keep the camera aligned with the bolt to obtain images of the bolt from different angles, as shown in Figure 8.
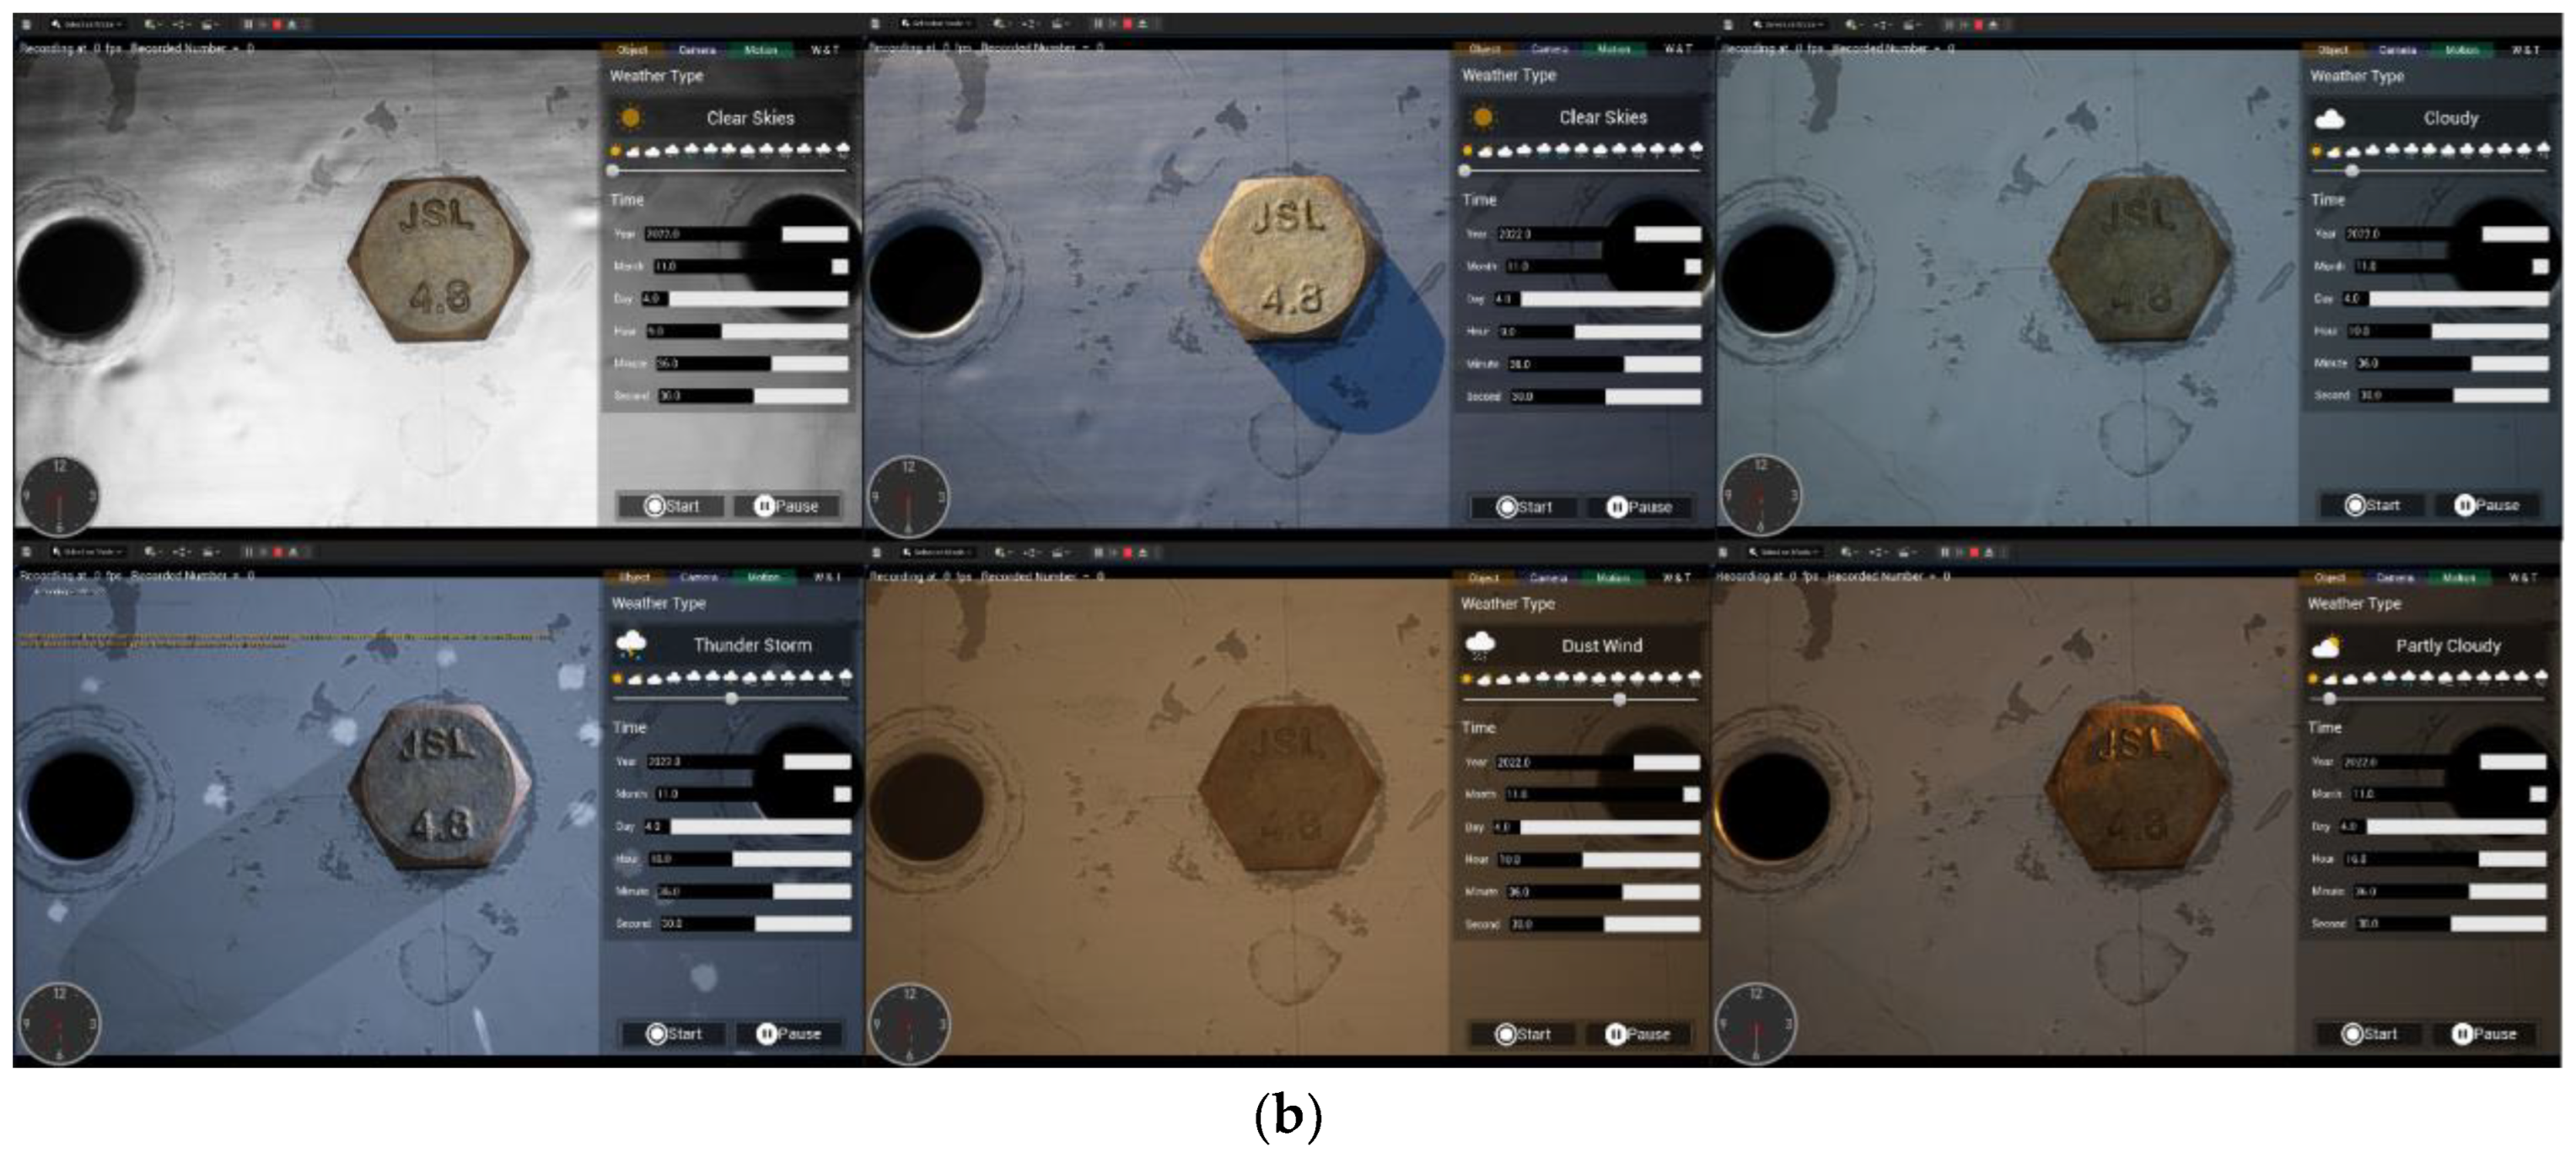
  • Change the different simulated weather and time in the site to obtain images of the bolts under different lighting conditions, as shown in Figure 8.
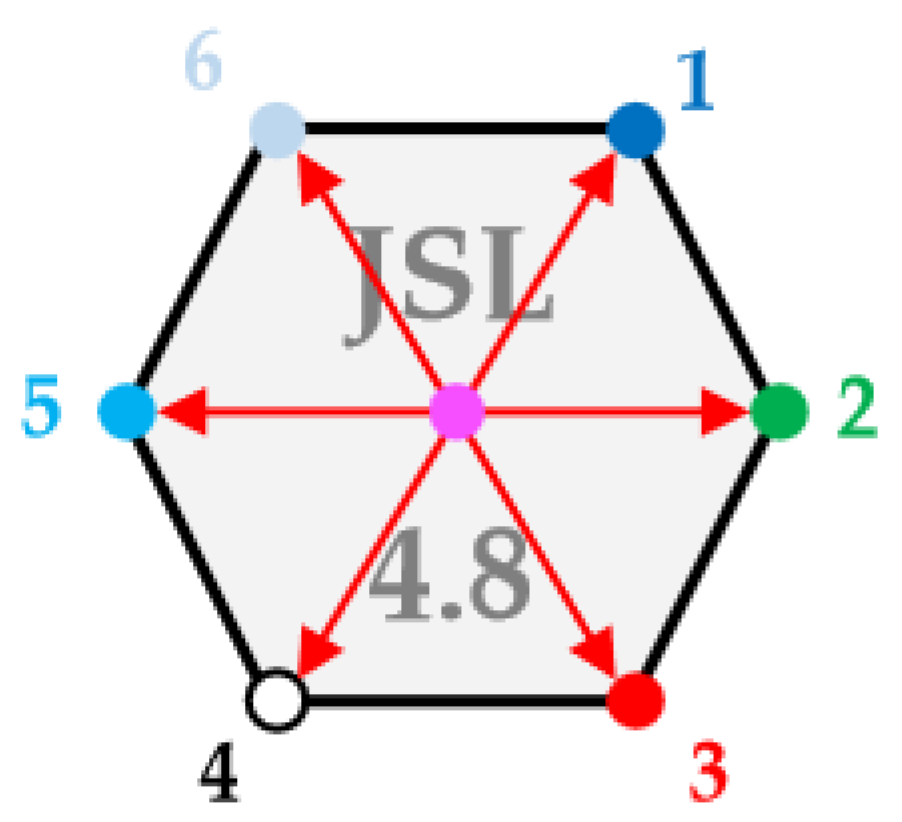
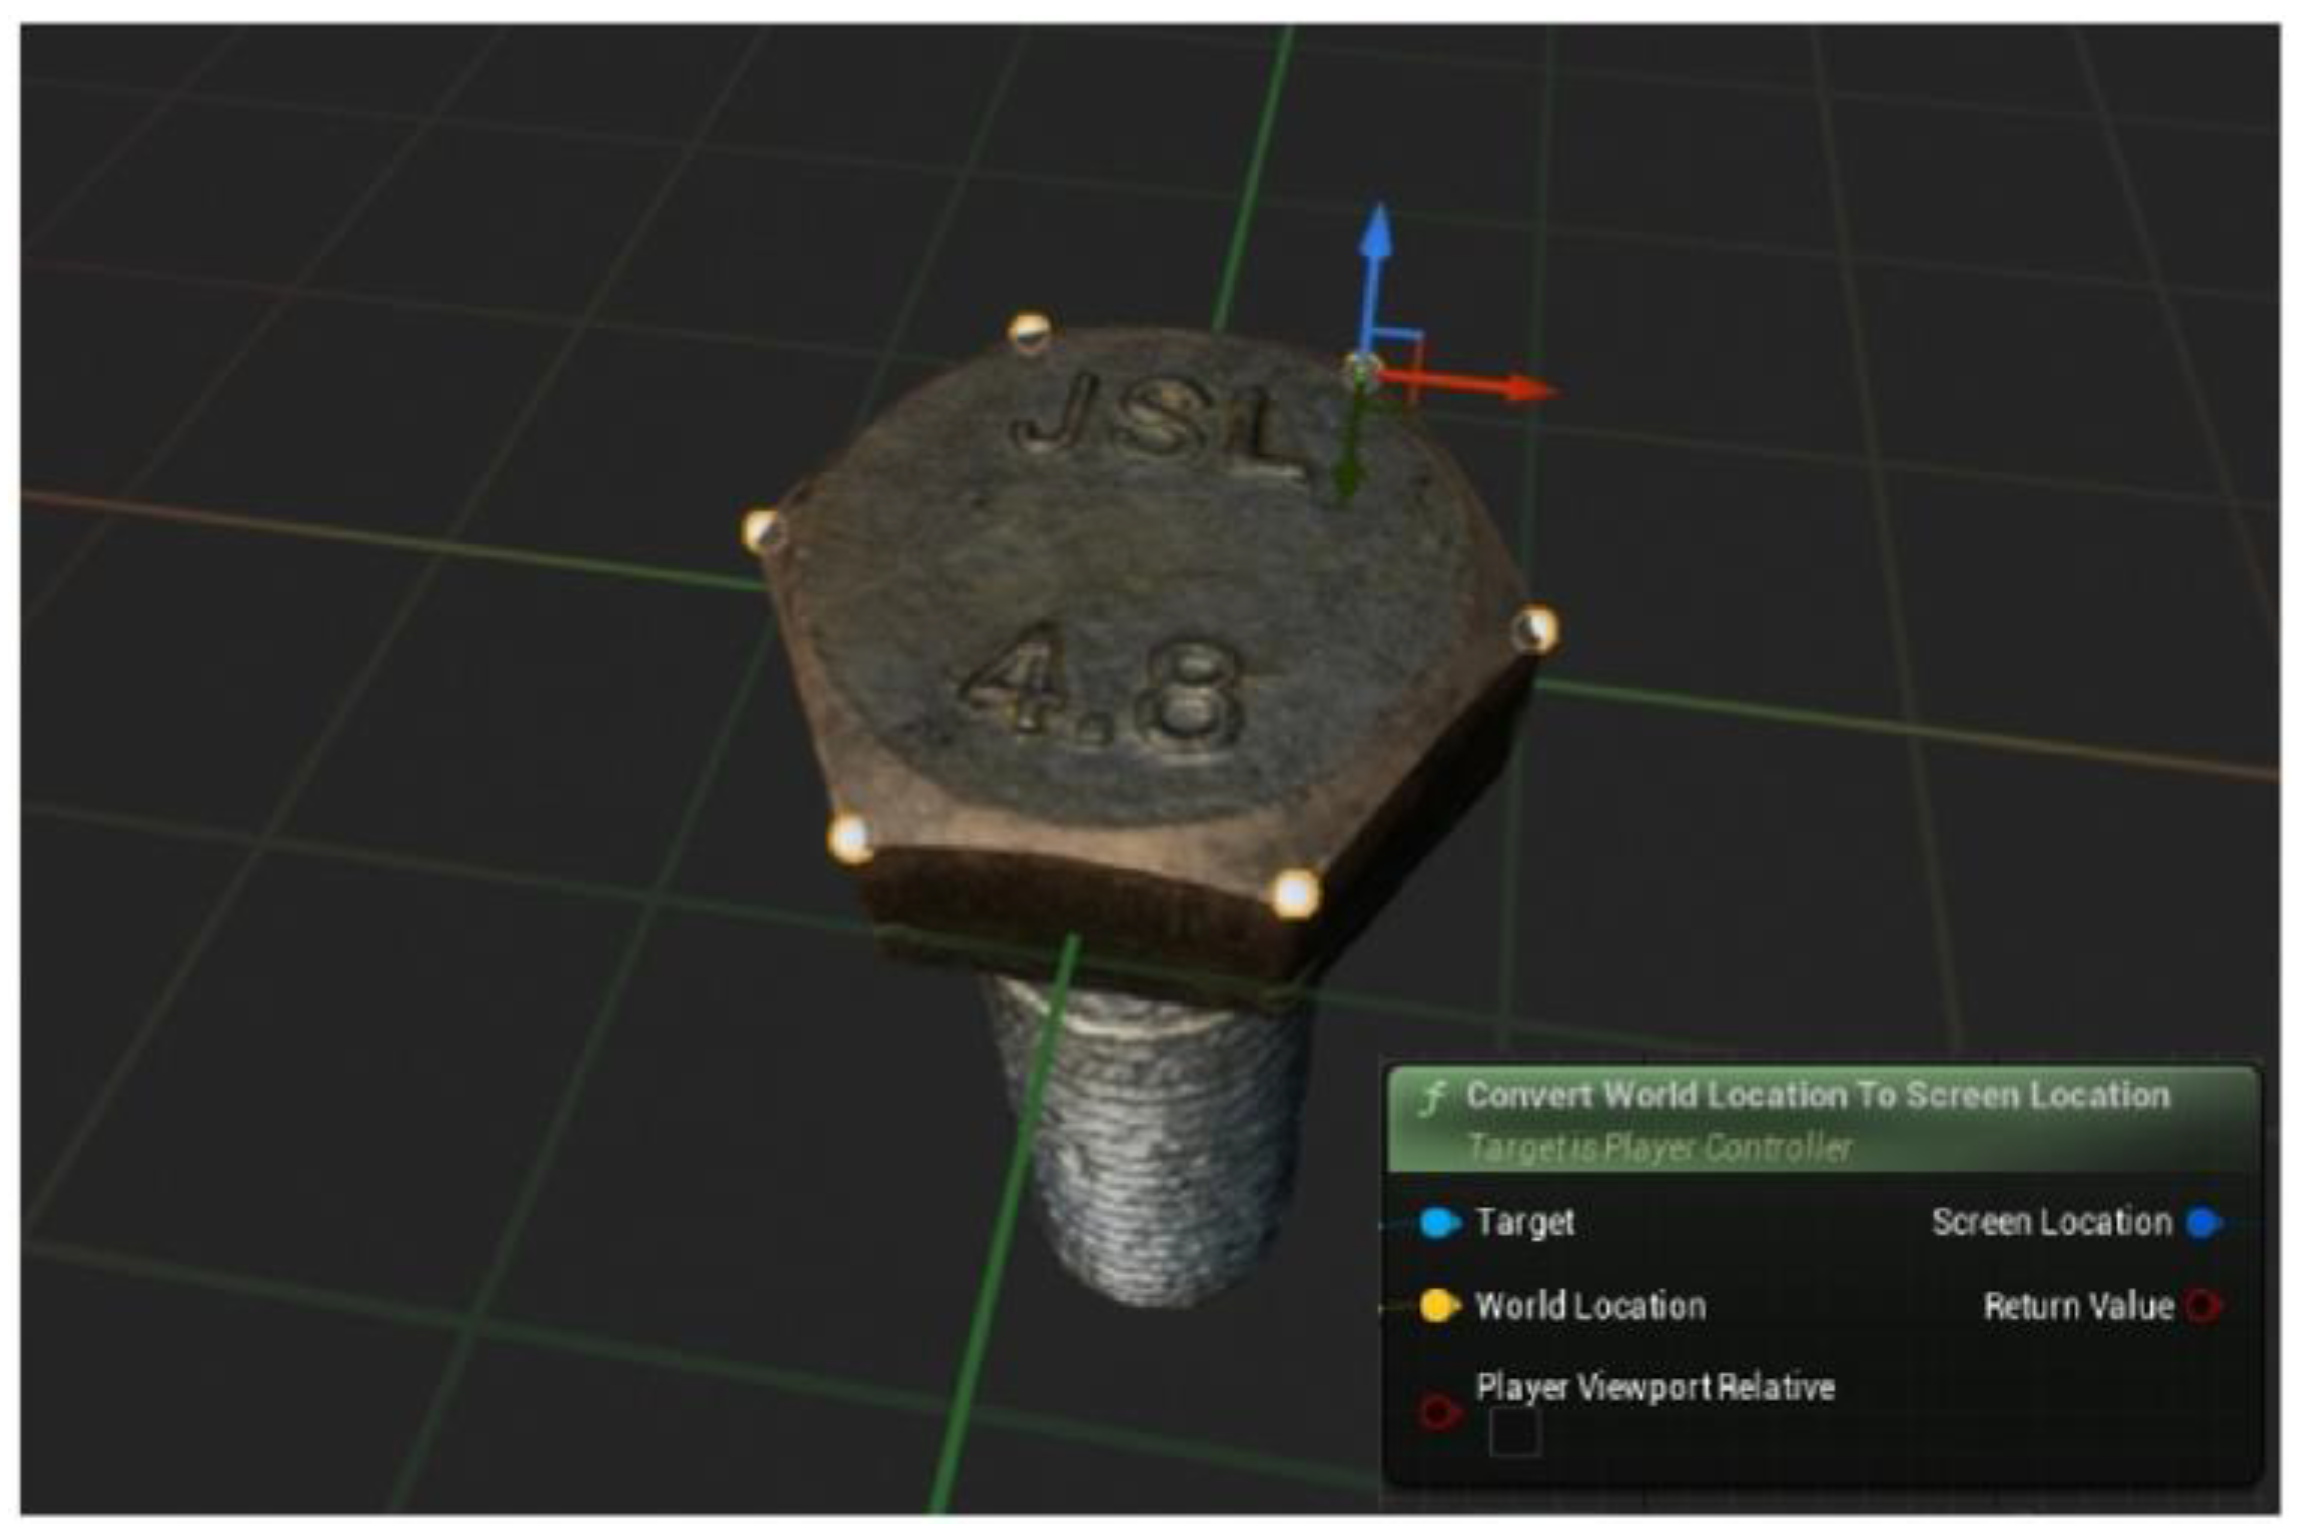
  • Six invisible marker objects are fixed on the six corner points of the bolt to label the key points, and the order of the markers is the same as the order of the key points, as shown in Figure 5. Additionally, through the coordinate conversion, the coordinates of the markers in the 3D scene are converted to the coordinates in the camera screen (this function is mainly realized by the function “Convert World Location to Screen Location”, which comes with ue5), as shown in Figure 9.
  • Let the camera rotate around the bolt at different angles and automatically take screenshots of the real-time rendered screen by a set time. While capturing the screenshot, the coordinates of the marked objects in the current screen are automatically saved.
(3)
Data processing
According to the coordinate data automatically saved by the virtual experiment platform, the position of the bolt recognition box is calculated. The result of key-point marking and recognition box generation is shown in Figure 10.
The data format was converted according to the training requirements. In this paper, a total of 1600 bolt images were generated and divided into the training set (1200 images), validation set (200 images), and test set (200 images) according to the ratio of 6:1:1. Meanwhile, to improve the training speed of the deep learning algorithm, the width of the images was uniformly converted to 640 pixels.

2.3. Training

We obtained trained datasets in different volumes based on YOLOv7-pose: the latest key-point detection technology.

2.3.1. YOLOv7-Pose

At present, the overall human pose estimation is divided into Top-down and Bottom-up. In order to solve the problem of traditional key-point detection algorithms, whether based on heat-map or detector-based processing, which are more dependent on computing resources and take a little longer time, the YOLO-based key-point detection algorithms that have emerged in recent years have been proven to have obvious speed and accuracy improvements in human posture recognition [40].
The latest YOLO-pose human pose estimation algorithm based on feature points [41] follows the bottom-up method [42,43,44]; that is, the exact location of the key points of the human body in the image is found through image post-processing, and then the key-points without the identity of each figure are classified in a single shot. Through YOLOv5’s object detection framework, key points were combined with character anchor points, and the character was divided into a single instance. This method can estimate human posture without relying on the heat map.
Based on the latest YOLO-pose human key-point detection algorithm, the YOLOv7-pose method adopted in this paper has two advantages:
  • The optimization of the loss function for evaluating the prediction. The target key-point similarity (OKS) is a common index to evaluate key points. L1 losses have traditionally been used to detect key points. However, L1 losses are not necessarily suitable for optimal OKS. Similarly, L1 losses do not take into account the scale of the target or the type of key points. Since heat map is a probabilistic map, it is not possible to use OKS as a loss in a pure heat map-based approach. OKS can be used as a loss function only when regressing to the key-point location. Therefore, the YOLOv7-pose uses scale-normalized L1 losses to perform key-point regression and obtain excellent accuracy.
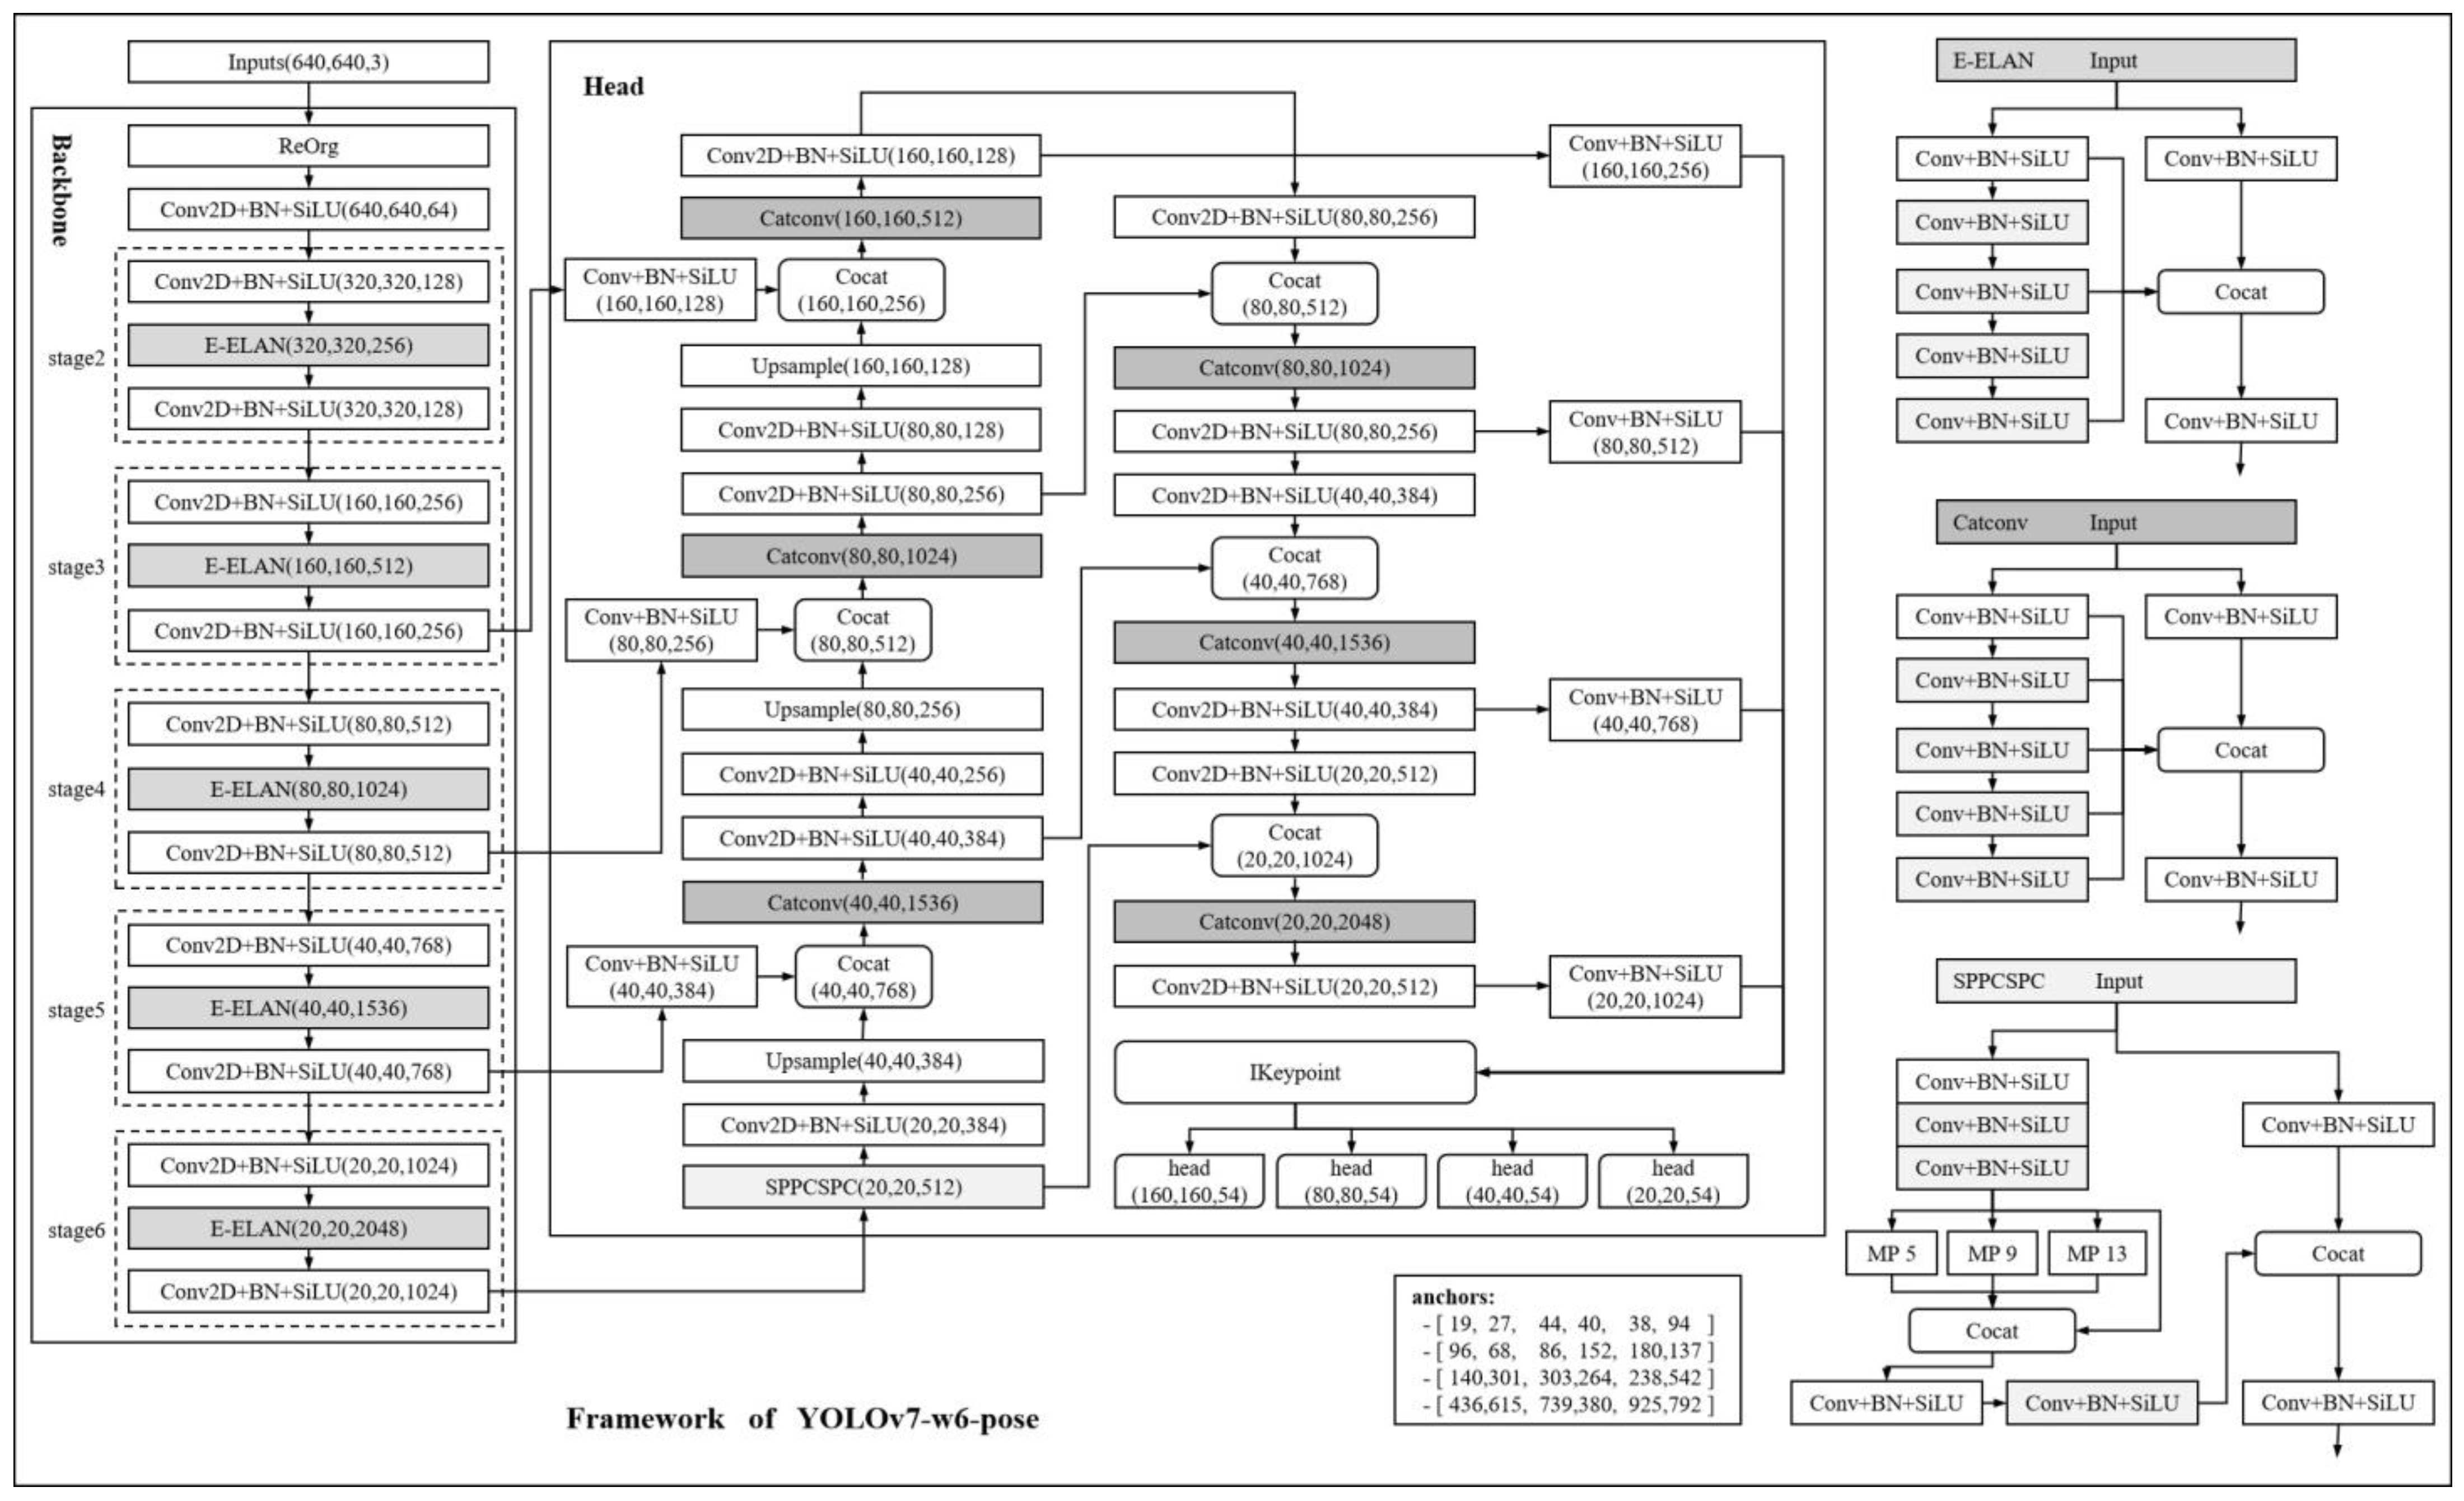
  • The optimization of the input layer structure. The YOLOv7, relative to YOLOv5, innovatively uses a multi-input stacked convolution structure to optimize the feature extraction in both the backbone and the enhanced feature extraction part (head). Additionally, the number of feature layers is increased from 3 to 4 on YOLOv7-pose, which improves the feature extraction ability of the algorithm at different scales. Finally, the extracted 4 feature maps are classified and regressed using the IKeypoint detection head to obtain the locations of key points. The framework of the YOLOv7-pose is shown in Figure 11.
In consideration of the above advantages, we chose YOLOv7-pose as the bolt key-point detection algorithm. Since the default human body detection framework of YOLOv7-pose uses 17 key points, in order to adapt it for the detection of bolts, we modified the algorithm with 6 key points.

2.3.2. Training Process

The workstation configurations used to train the model in this paper are shown in Table 2.
To improve the model training accuracy and to verify the effectiveness of synthetic datasets for improving the model training effect, we designed a total of five datasets containing different numbers of real and synthetic images. The official provided “YOLOv7-w6-pose.pt” model was applied as pre-training weights. Additionally, each dataset was trained with 400 Epochs. The composition of the five datasets is shown in Table 3. The hyp-parameters for training are shown in Table 4.
To evaluate the performance of the YOLOv7-pose, the “200 real + 1200 synthetic” datasets were also trained with 400 epochs using Keypoint-RCNN in this paper. Keypoint-RCNN (keypointrcnn_resnet50_fpn()) is a network model for key-point detection provided in Pytorch’s torch-vision library.
The training results are presented in Section 3.1.

2.4. Calculation of Bolt Loosening Angle

In the situation where the bolt is not taken by a fixed camera and without manual marking, even if the corner point information of the bolt is obtained, it is difficult to directly judge whether the bolt is loose or not, especially to calculate the angle of looseness. To solve the above problem, this paper proposes a method to calculate the bolt loosening angle based on the position information of the neighboring bolts, based on the fact that bolts are often used in multiple together to form a bolt matrix.

2.4.1. Bolt Corner Points Detection and Bolt Center Calculation

We used the model trained in Section 2.3 to detect key points on the newly captured bolt images. None of these bolt images were involved in the training, and we kept bolts appearing in pairs of two in the image. As shown in Figure 12, the corner points of the bolts can be accurately detected in the order in which they were labeled.
To each bolt, the average coordinates of the key points of the six corner points obtained from the detection are used as the center coordinates of the bolt. The formula for calculating the center point is shown in Equation (1):
{   c x =   x i 6 c y =   y i 6
where ( c x , c y ) is the coordinate of the center point of the bolt and ( x i , y i ) is the coordinate of each corner point.

2.4.2. Bolt Loosening Angle Calculation

By matching the center coordinates of the two bolts in the image, a reference line was obtained. This reference line represents the position relationship between neighboring bolts, which is fixed and does not change with the camera shooting angle. For each bolt corner point, the angle between the vector with the center pointing to the corner point and the reference line was calculated. The angle calculation formula is shown in Equation (2), which gives the angular state of the bolt to the reference line in the current state, as shown in Figure 13.
{   a n g 0 = t a n 1 ( c y 2     c y 1 c x 2     c x 1 ) a n g i = t a n 1 ( y i     c y 1 x i     c x 1 ) α i = a n g i a n g 0
where α i is the angle between the vector with the center pointing to the corner point and the reference line, ( c x 1 , c y 1 ) is the coordinate of the center point of the aim bolt, ( c x 2 , c y 2 ) is the coordinate of the center point of the neighbor bolt, and ( x i , y i ) is the coordinate of each corner point.
In this way, it is only necessary to obtain an image of a tightened bolt by undertaking the same process. Then, simply by comparing the current state of the bolt with the tightened state of the bolt at each corner point, you can accurately judge whether the bolt has loosened and calculate the angle of the bolt loosening, as shown in Figure 14. The bolt loosening angle calculation formula is shown in Equation (3).
{     θ i = α 1 i α 0 i θ =   θ i 6
where θ i is the rotation angle of each corner point and θ is the average of the rotation angle of all corner points and is used as the bolt loosening angle value.

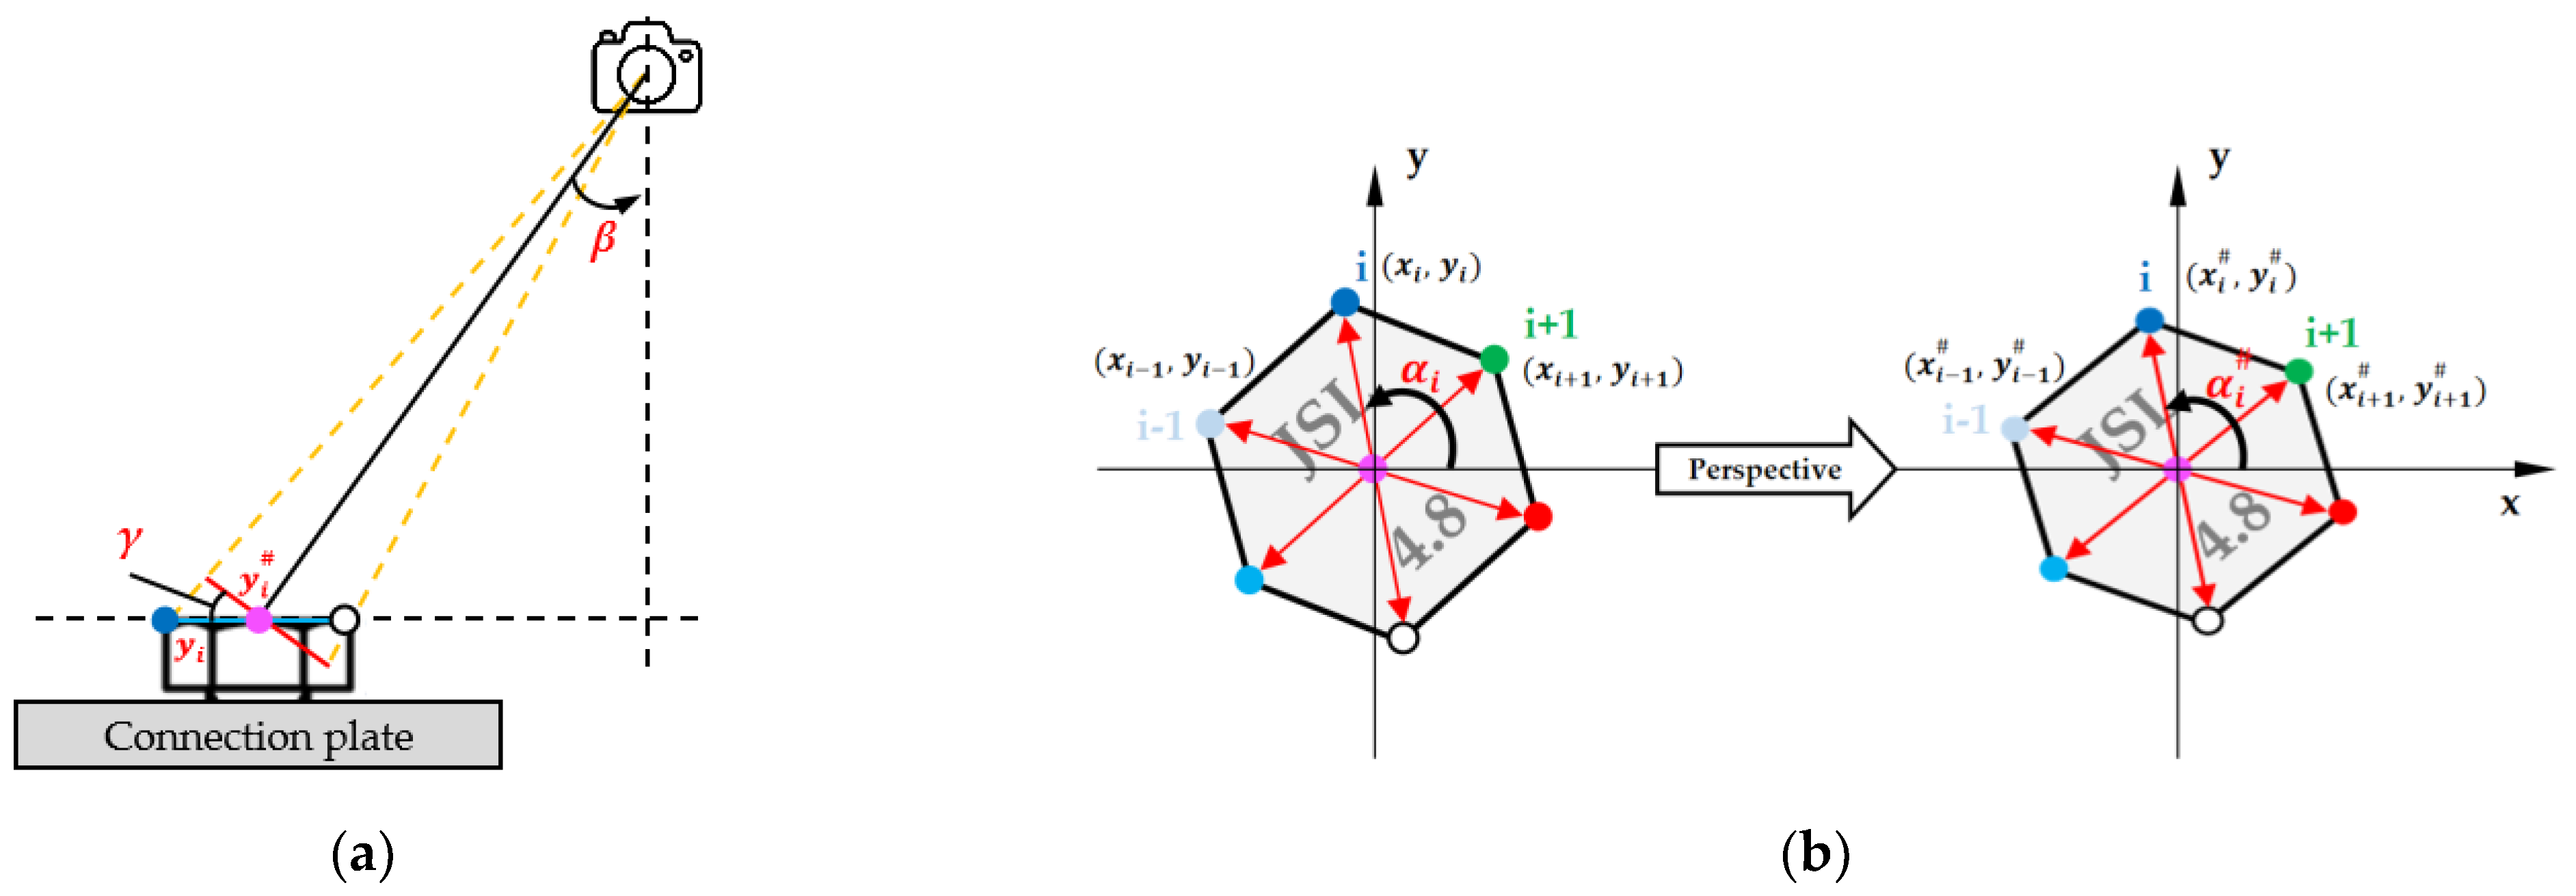
2.4.3. Analysis of Perspective Errors
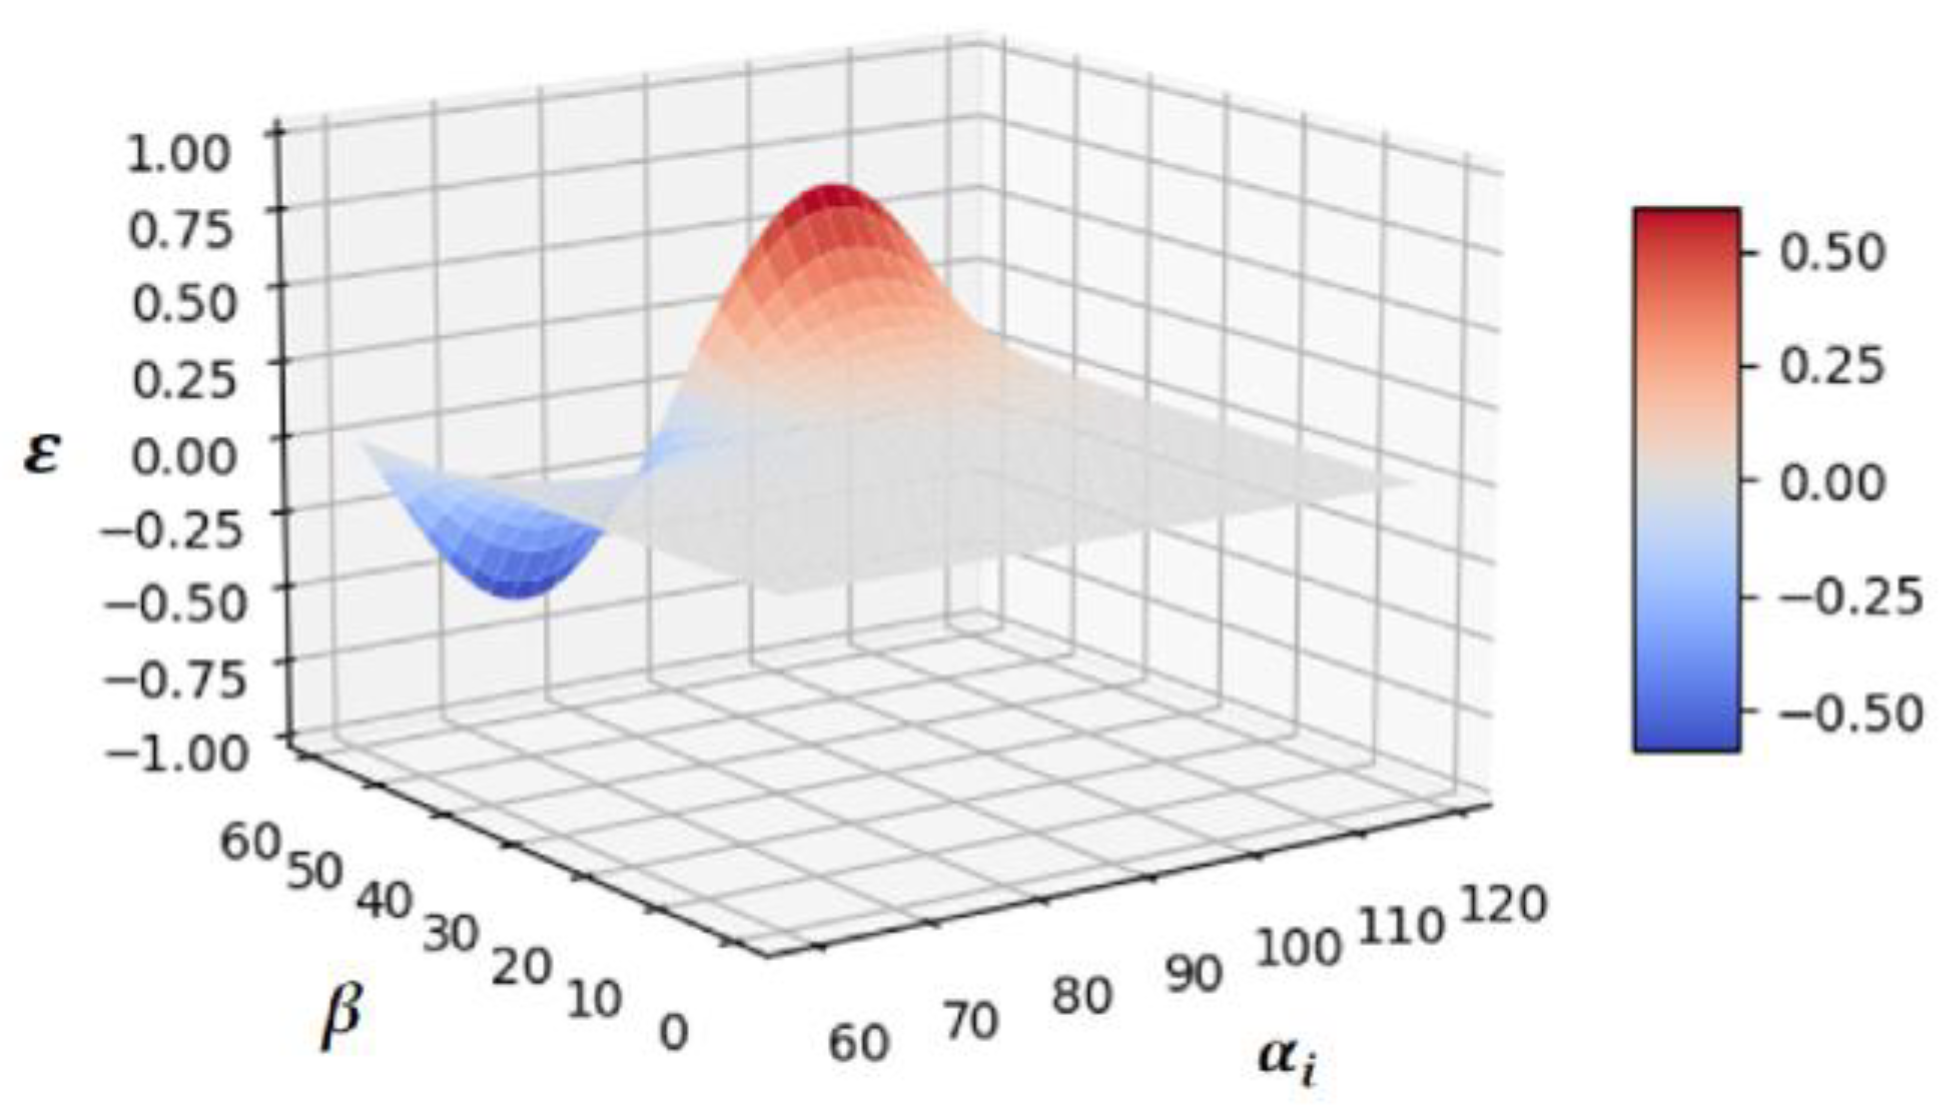
In this subsection, the theoretical perspective error analysis of the bolt loosening angle calculation method proposed in this paper is presented.
The bolt images obtained at different camera angles have different extents of perspective distortion. This kind of perspective distortion may lead to large errors in the calculation of the bolt loosening angle. The schematic diagram of the image perspective distortion caused by the camera angle is shown in Figure 15.
As shown in Figure 15a, when the camera shoots an object from a certain angle, the distance between two points on the actual object is changed in the camera frame according to the principle of perspective. Reflected in the image, the change in the distance leads to a change in the coordinates of the points. Coordinate changes to the corner points after perspective distortion is shown in Figure 15b. Since the width of the bolt is small in relation to the distance of the camera from the bolt, the coordinate change in the horizontal direction (x-axis) caused by the perspective distortion can be approximately ignored. Therefore, in the error analysis, this paper mainly considers the coordinate changes in the vertical direction (y-axis).
Take the horizontal axis passing through the center of the bolt as the x-axis and the vertical axis as the y-axis. In the images obtained with the camera shooting bolts directly above, the coordinates of the three corner points in the upper half of the x-axis are in order, ( x i 1 ,   y i 1 ) , ( x i ,   y i ) , ( x i + 1 ,   y i + 1 ) . The relationship between these coordinates, as in Equation (4), can be found.
{   x i = r × c o s α i ,     y i = r × s i n α i x i 1 = r × c o s α i 1 ,     y i 1 = r × s i n α i 1 ,     α i 1 = α i + 60 ° x i + 1 = r × c o s α i + 1 ,     y i + 1 = r × s i n α i + 1 ,     α i + 1 = α i 60 °
where r is the radius of the outer circle of the bolt hexagon.
In the image taken by the camera at angle β above, after perspective distortion, the coordinates of the three corner points in the upper half of the x-axis are, in order, ( x i 1 # ,   y i 1 # ) , ( x i # ,   y i # ) , ( x i + 1 # ,   y i + 1 # ) . The following equation can be achieved according to the geometric relationship in perspective distortion.
{     x i # = x i y i #   y i × c o s γ γ β
where γ is the angle of the camera imaging sensor plane across the plane of the bolt and is the approximately equal sign. Combining Equations (4) and (5), the result of the following equation can be calculated.
{   x i # = r × c o s α i ,     y i # = r × s i n α i × c o s β x i 1 # = r × c o s ( α i + 60 ° ) ,     y i 1 # = r × s i n ( α i + 60 ° ) × c o s β x i + 1 # = r × c o s ( α i 60 ° ) ,     y i + 1 # = r × s i n ( α i 60 ° ) × c o s β
Accordingly, the angle α i # between each corner point and the x-axis after perspective deformation can be calculated.
{   α i # = a r c t a n y i # x i # α i 1 # = a r c t a n y i 1 # x i 1 # α i + 1 # = a r c t a n y i + 1 # x i + 1 #
The calculation of the three corner points in the bottom half of the x-axis is the same as the process described above.
The same method as the bolt loosening angle calculation formula can be used to calculate the error angle caused by perspective.
{     ε i = α i # α i ε =   ε i 6
where ε i is the error angle of each corner point and ε is the average of the error angle for all the corner points and is used as the perspective error angle value. Combining Equations (6)–(8) demonstrates that the error is only related to α i and β . According to Figure 15b, the variation range of α i is [60 ° , 120 ° ). Based on engineering experience, the camera’s shooting angle β falls between [0, 60). In the above range, we calculated the error angle caused by the perspective, as shown in Figure 16.
The following conclusions can be obtained from the figure:
  • The perspective error increases as β increases and is almost zero at β [0, 20];
  • With constant β , the error shows a sinusoidal variation as α i varies. When α i is equal to 75 ° or 105 ° , the error is taken to the maximum value;
  • As β moves closer to 90 ° , the error becomes larger more rapidly;
  • When β is less than 60 ° , the error angle is less than 0.58 ° ; when β is less than 45 ° , the error angle is less than 0.09 ° .
In summary, using the bolt loosening angle calculation method proposed in this paper, in general, engineering scenarios, the perspective error caused by the camera angle is small enough to avoid additional processing.

3. Results

3.1. Training Results

In Section 2.3, we trained 400 epochs on five datasets containing different volumes of real and synthetic images, as shown in Table 3.

3.1.1. Training Performance

Figure 17 and Figure 18 show the evolution of the training loss and the mean precision (MP) of the YOLOv7-pose model with increasing epochs for different datasets, respectively. From the figures, we can draw the following conclusions:
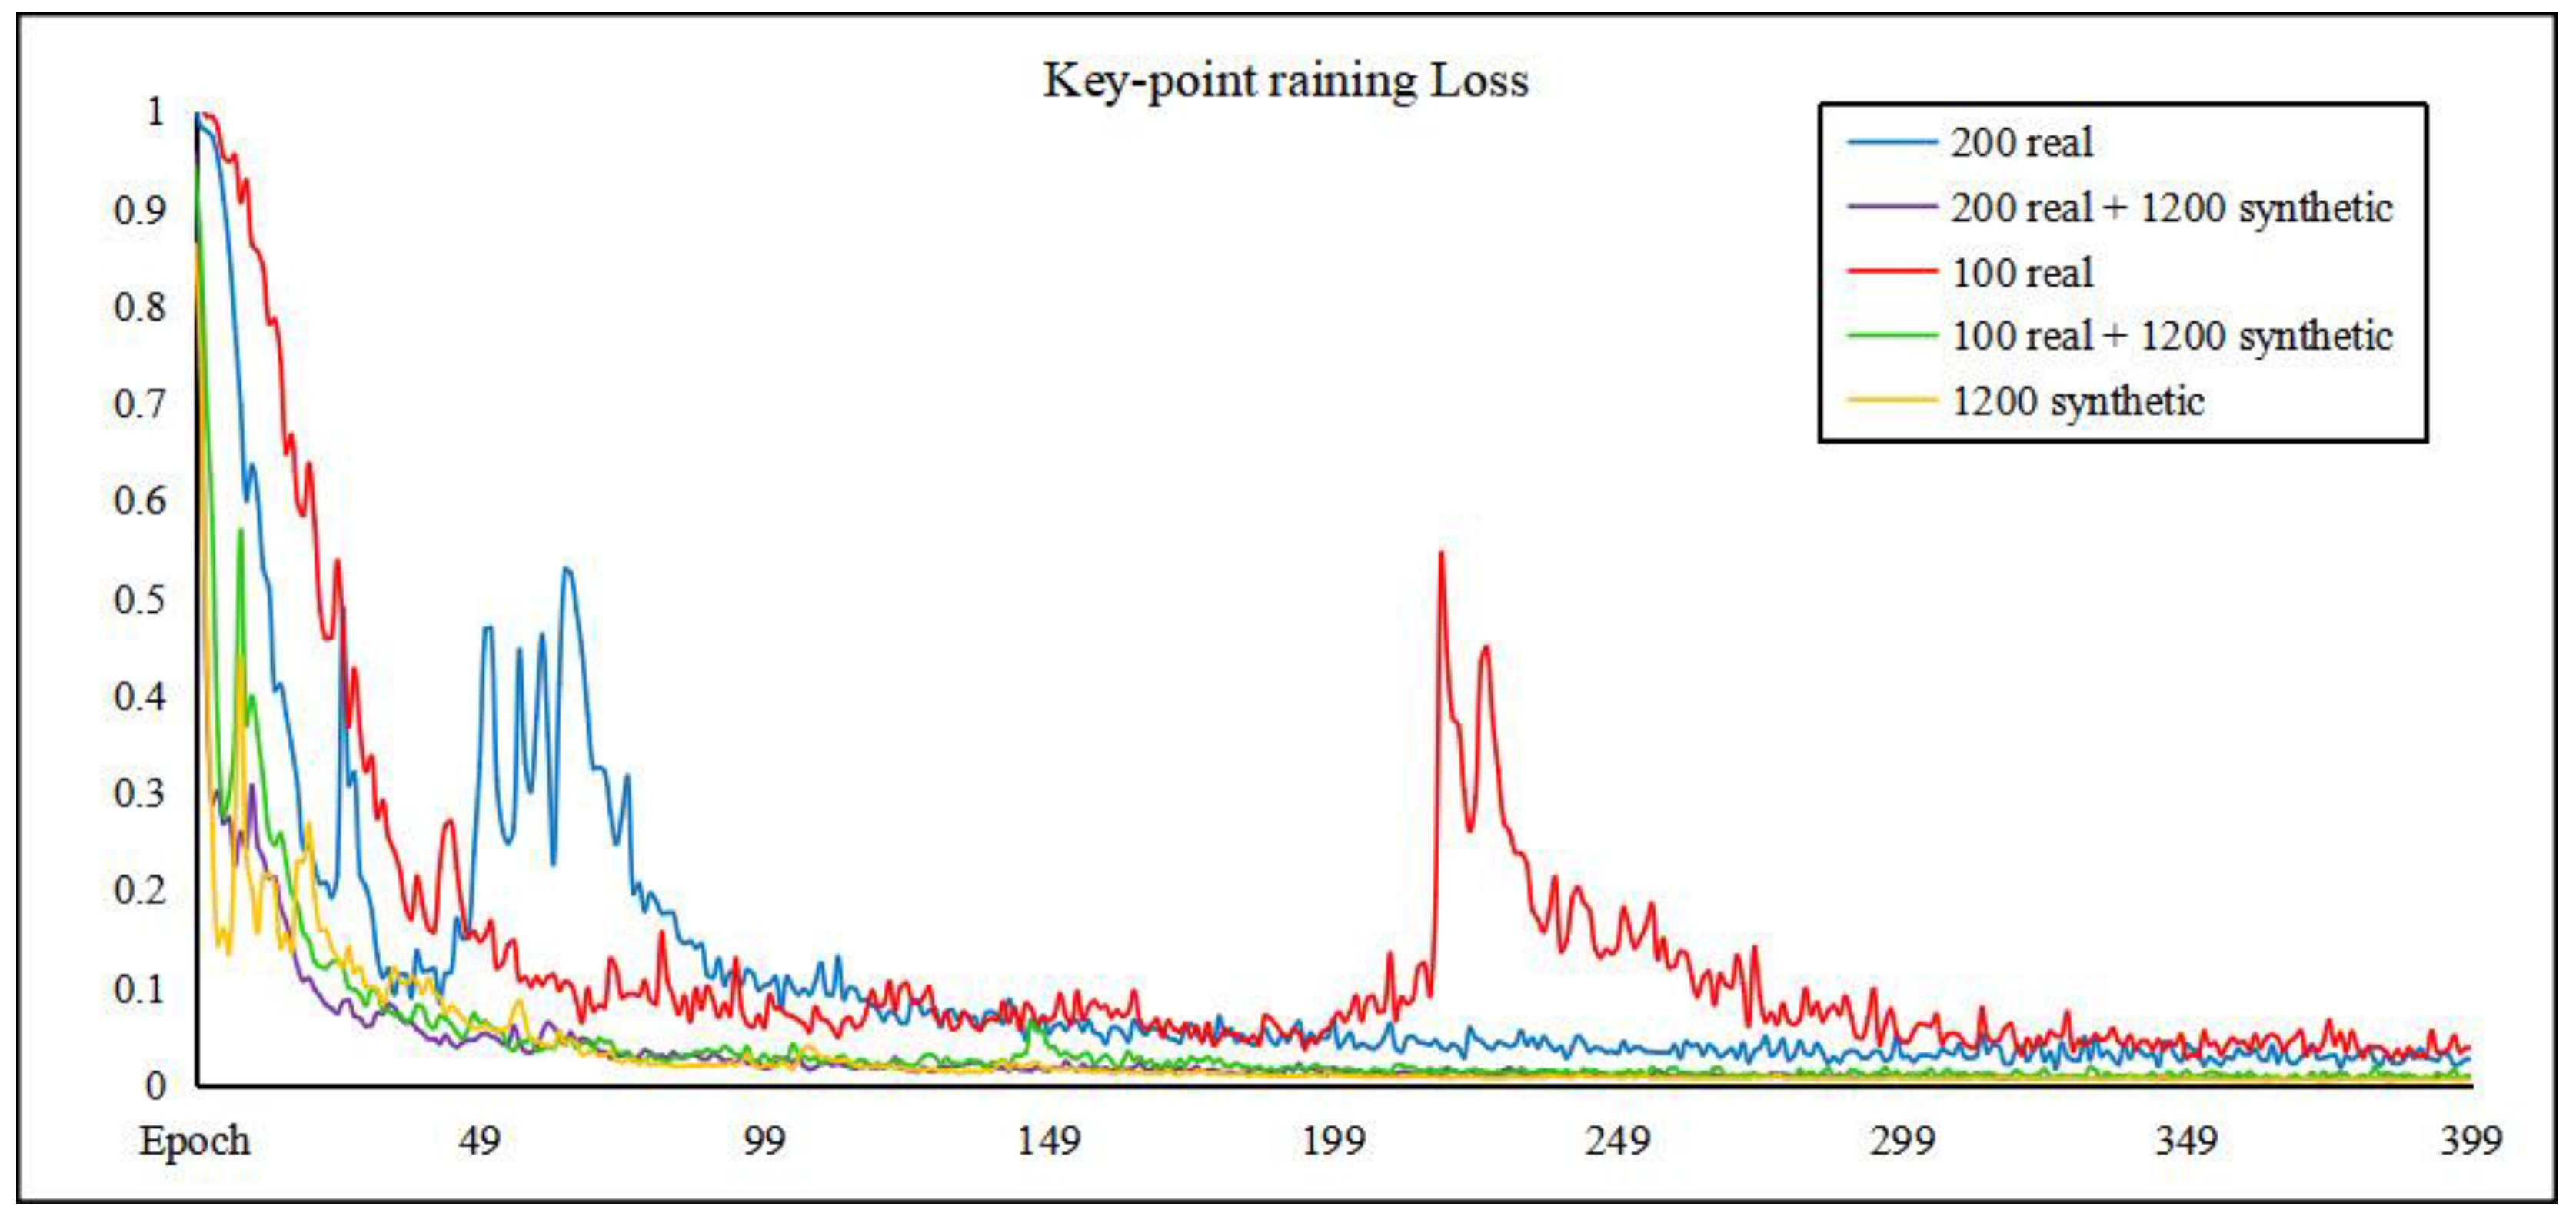
  • In the case of a small volume of images in the dataset, when the training is close to convergence, there is a situation where the loss does not fall steadily but suddenly rises, while the mean precision also suddenly falls accordingly, but as the epoch continues to increase, the loss is still able to converge;
  • As the dataset increases, the unstable loss decline only occurs in the early stages of training. Additionally, the larger the dataset is, the faster the training converges;
  • The “100 real + 1200 synthetic” dataset performs better than the “200 real” dataset in terms of stability and accuracy during training.
These indicate that the synthetic dataset can effectively improve the performance of the model training.

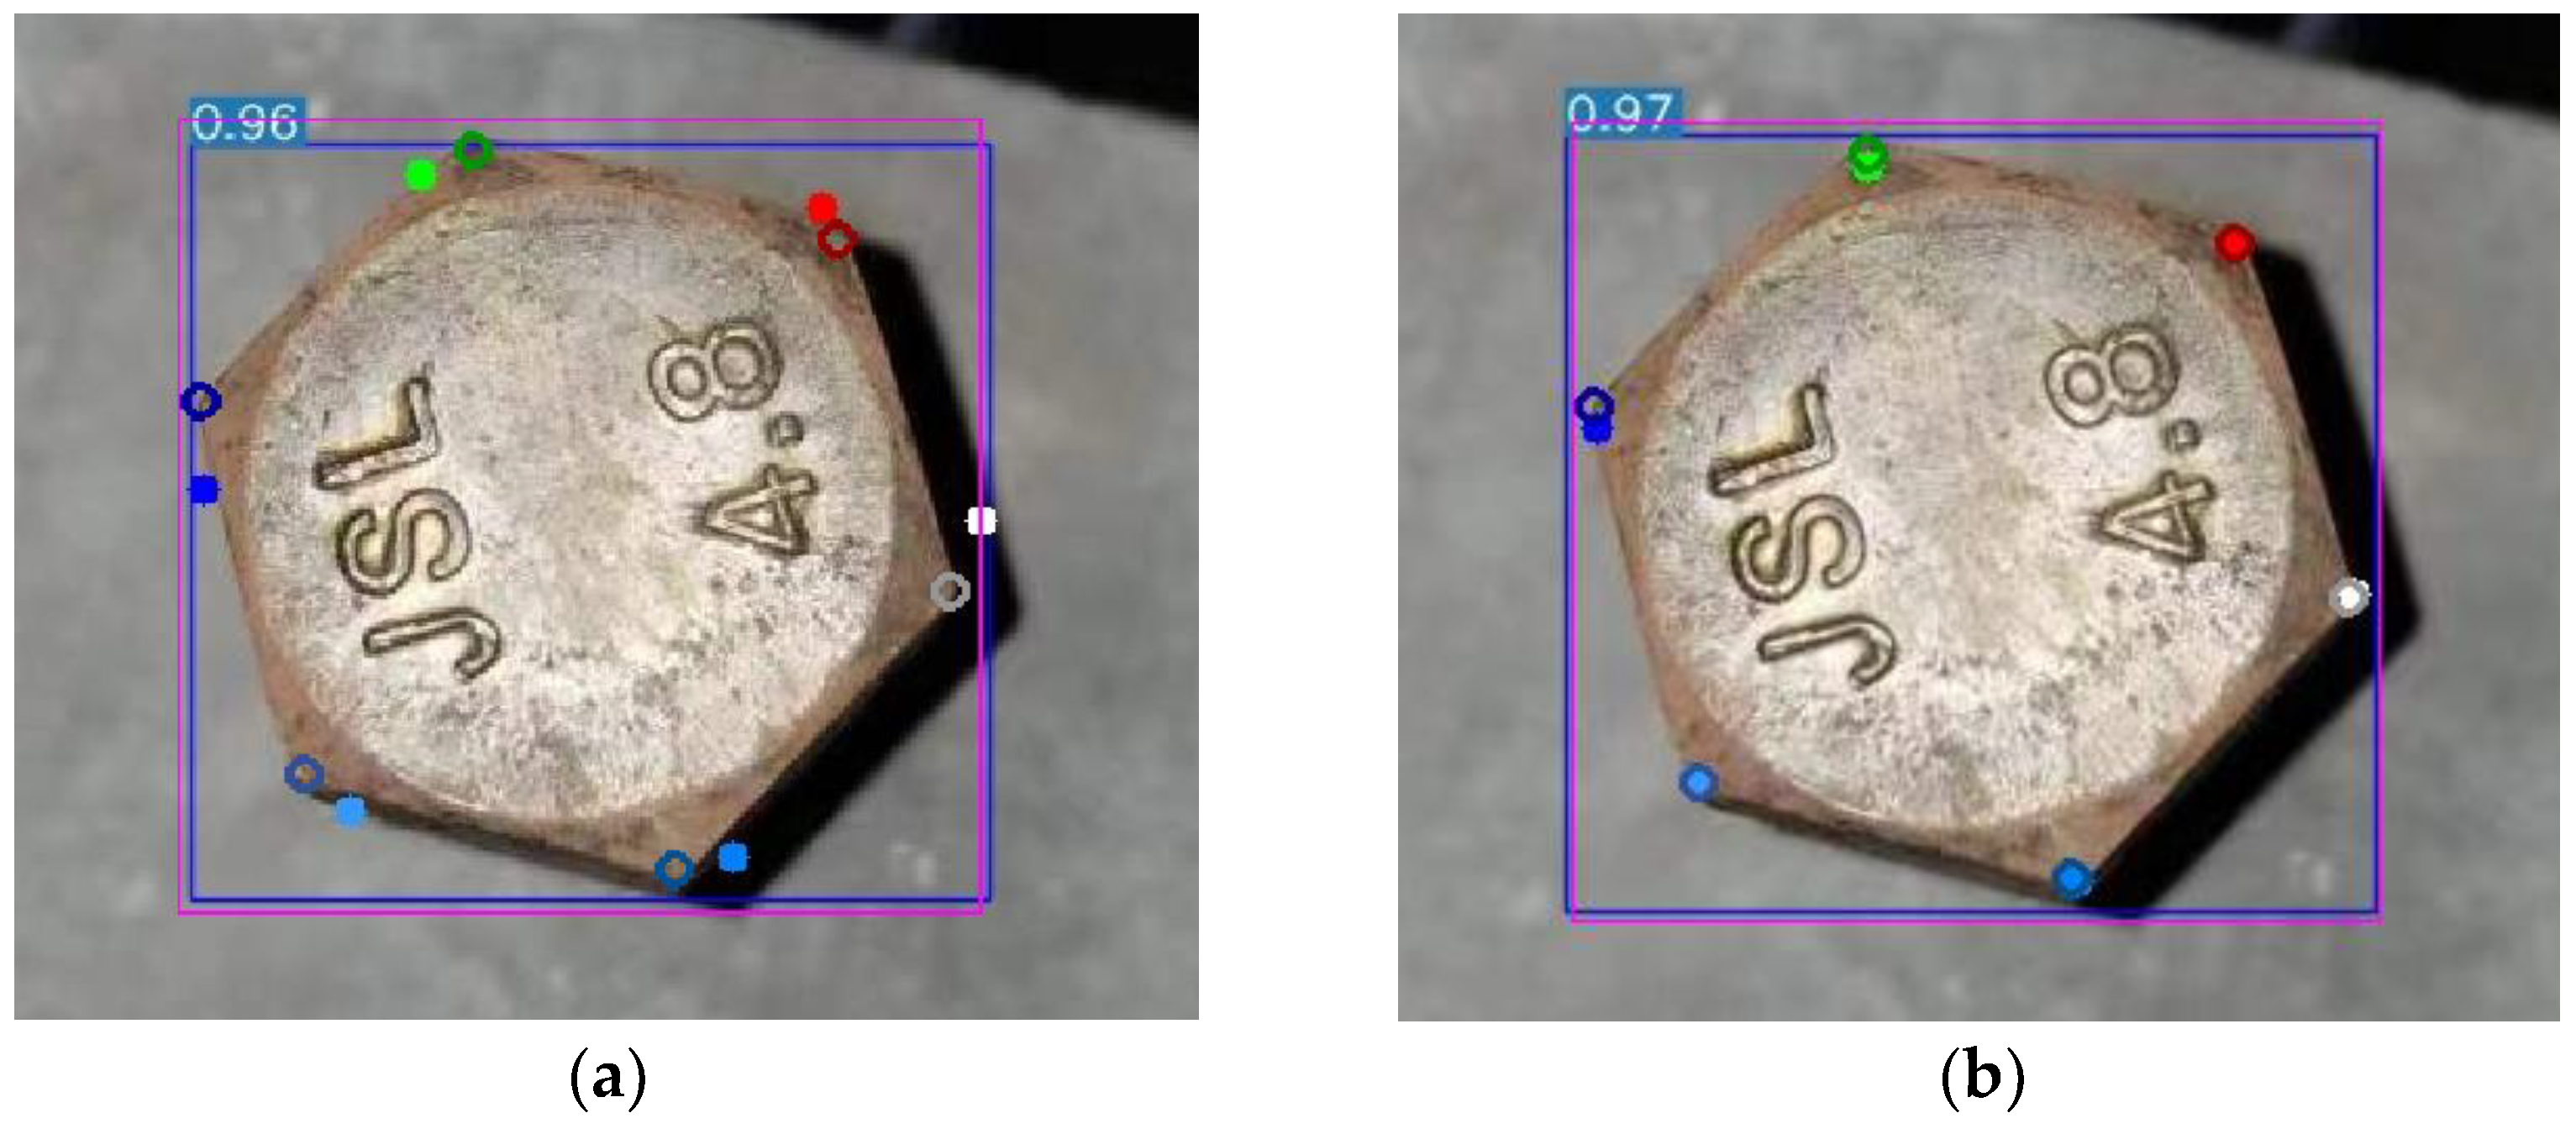
3.1.2. Training Effects

Using the same test set (50 images), the five models obtained from the training are evaluated. The bolt and bolt corner point detection was run on the test set with a confidence level requirement of 0.5. The average detection time per image was 0.020 s. The correct detection of bolts and the relatively accurate detection of key points were counted separately, and the detection results are shown in Table 5. The results in the table are the true number and the number of correct detections for each dataset. From the table, we can come to the following conclusions:
  • The YOLOv7-pose model has a very excellent detection performance; even if only 100 images are used for training, it can still obtain a high detection correct rate;
  • Without adding real images to the dataset, the model trained from a pure synthetic dataset can identify bolts and key points in real images with relative accuracy when the images are well-lit and clear;
  • Compared with Keypoint-RCNN, the YOLOv7-pose shows better performance in the key-point detection correct rate.
  • In the detection results of Keypoint-RCNN, there are individual cases where the same corner point is not detected as different and some corner points are not detected correctly, as shown in Figure 19. Such errors would have a significant impact on further angle calculations.

3.1.3. Error Analysis

We collected the results of the five models that detected the correct objects and computed the error of key-point detection. We visualized the manually labeled correct detection boxes and key points, along with the predicted boxes and predicted points detected by the models, on one image at the same time. The results in Figure 20 can be obtained in the case of larger and smaller detection errors, respectively. The hollow dots represent the manually labeled key points, and the solid dots represent the model-detected key points; the purple ones are the manually labeled detection boxes, and the blue ones are the model-detected boxes with the model-detected confidence levels on them.
In order to be able to evaluate quantitatively, we used the normalized mean error (NME) to evaluate the performance of different models. The error was calculated as Equation (9). To represent the error more intuitively, we also used Equation (10) to convert the NME into an angular form.
NME   =   ( x i *   x i ) 2 + ( y i *   y i ) 2   r i
where ( x i * , y i * ) and ( x i , y i ) are the manually labeled and model-detected coordinates of the corner points; r i is the distance from the center of the bolt to each corner point.
δ = NME π × 180 °
After calculating the recognition errors for individual images, we calculated the average error of the model for the overall test set, as shown in Table 6. From this, the following conclusions can be drawn:
  • The model trained on the “200 real + 1200 synthetic” dataset showed the best performance with not only the smallest error but also the smallest error variance, which is a significant performance improvement compared to the “200 real” model with only real images;
  • The performance of the “100 real + 1200 synthetic” model was close to that of the “200 real” model, while the “100 real” model showed poor recognition accuracy;
  • Even though the “1200 synthetic” model performed poorly in terms of overall precision, the key-point detection in the images where the bolts were successfully detected did not show large errors, and the accuracy was still relatively good.
  • Compared with Keypoint-RCNN, YOLOv7-pose showed better performance with a smaller error and much smaller error variance.

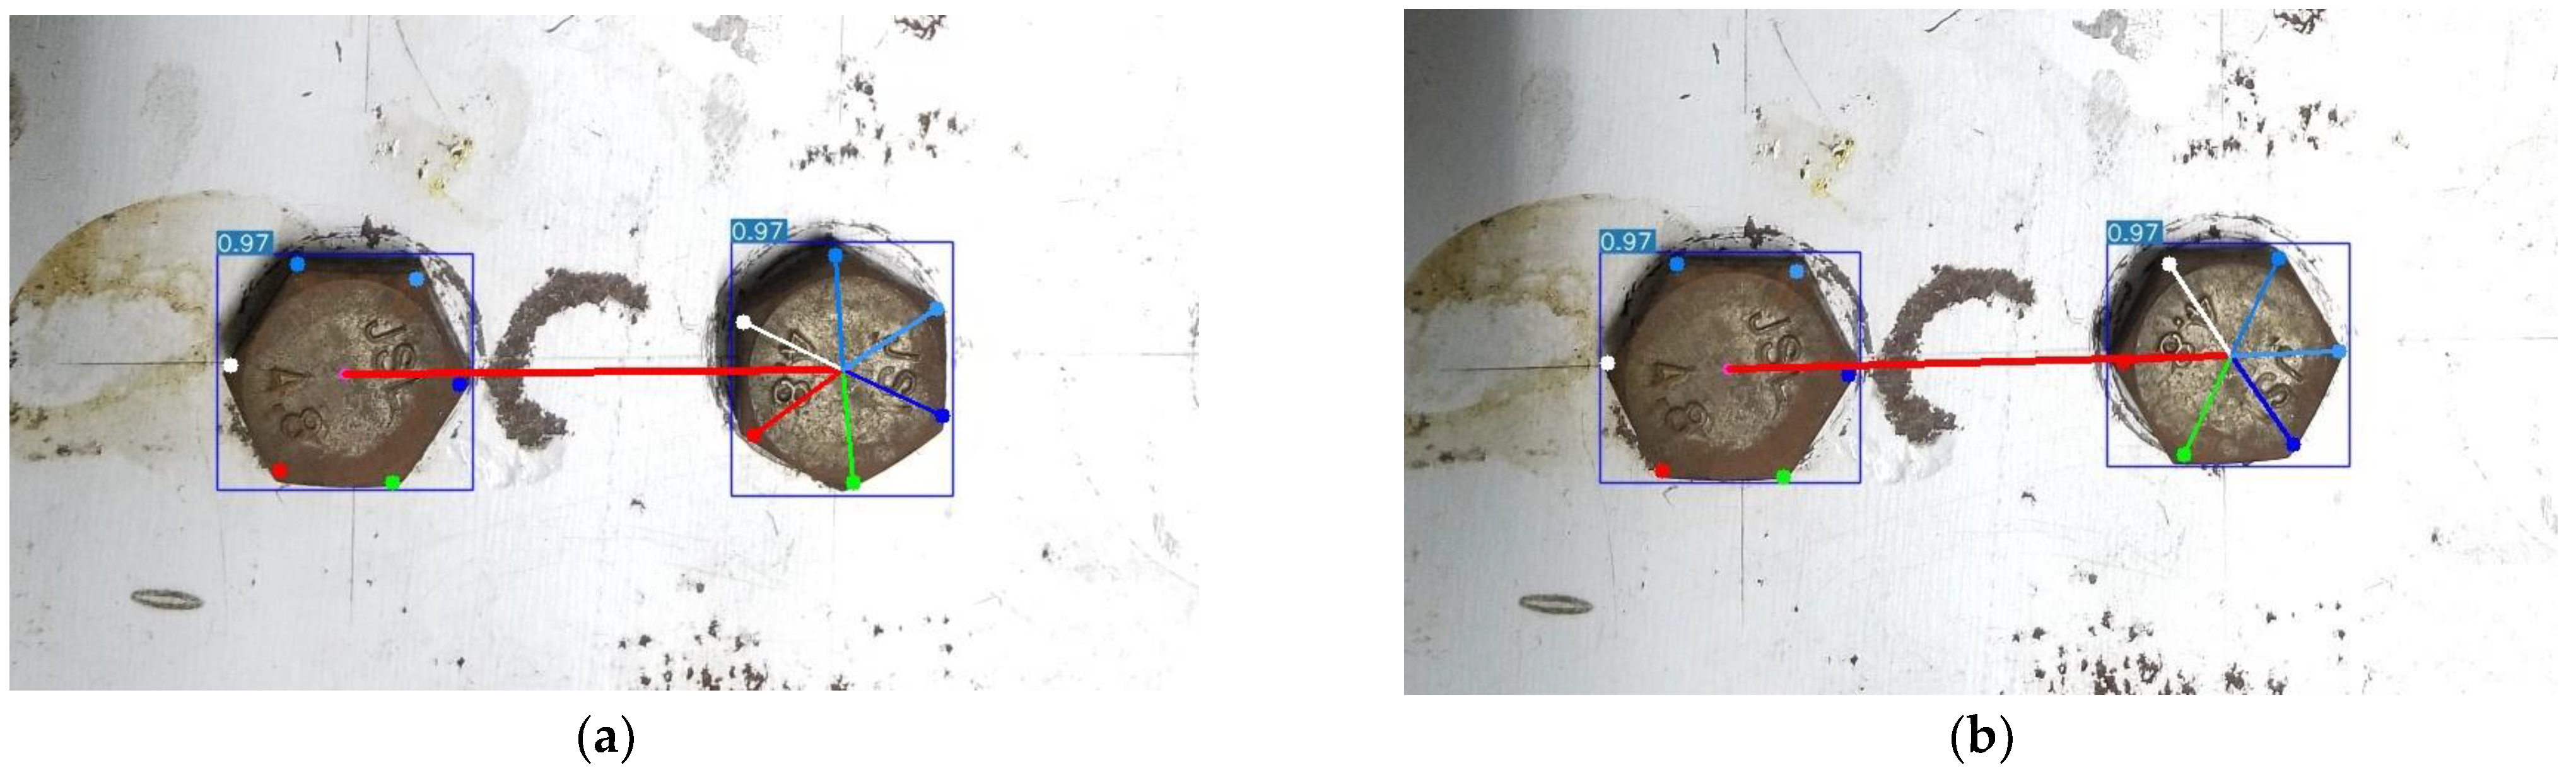
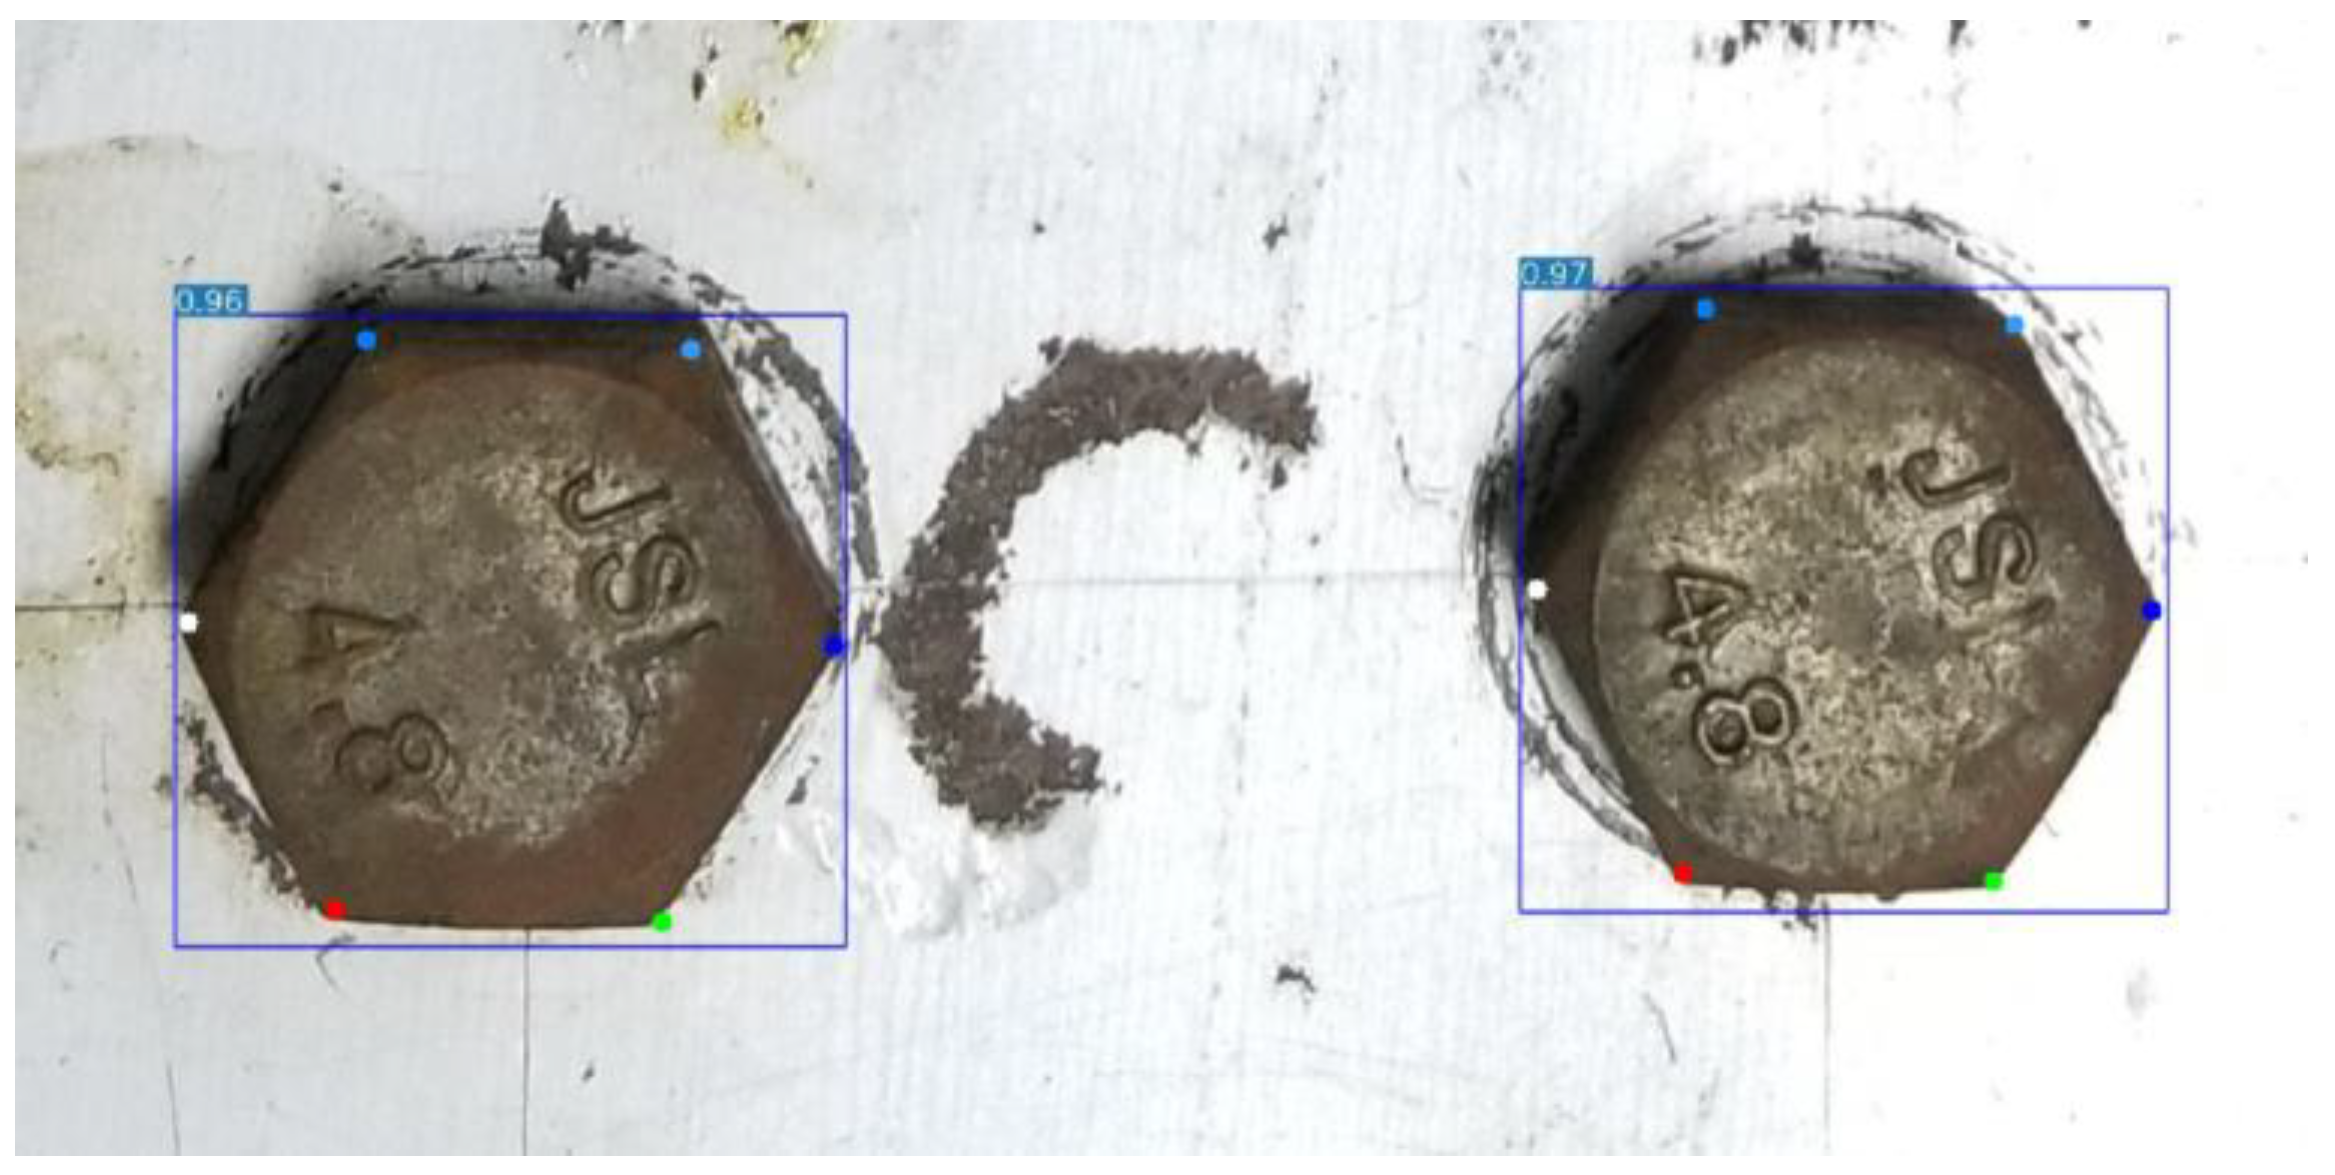
3.2. Result of Bolt Loosening Angle Detection

We detected the bolt loosening angle for 10 newly acquired images using the method proposed in Section 2.4. The average time for angle detection was 0.008 s per image. The visualized images of the detection results are shown in Figure 21, and the data results are recorded in Table 7.
As can be noticed from the table, the bolt loosening angle detection method used in this paper can achieve a 360° loosening angle detection and shows high accuracy in the test set, which can meet the requirements of bolt damage detection.

4. Discussion

The bolt loosening angle detection algorithm proposed in this paper successfully achieves the correct loosening angle with high precision and stability demonstrated. However, in the process of conducting the research and analyzing the results, we discovered several issues that could be solved with attention in subsequent studies.
  • Although the addition of synthetic datasets improves the performance of the model in all aspects of both training and detection, the actual improvement was not as significant as expected. There is still a lot of work ahead before the use of synthetic datasets can fully replace real datasets. This requires greater proficiency in modeling and game engines, as well as the development of deep learning algorithms with better generalization capabilities.
  • In order to avoid the use of manual markers, the method in this paper must be used with the neighboring bolt as a reference. However, in some engineering scenarios, there will be situations where only one bolt can be seen. At this time, the proposed method is no longer applicable.
  • In actual engineering conditions, when used in buildings or mechanical structures, the bolts are often in the form of a matrix of connection plates. Therefore, the obtained images often have more than two bolts in them. Although the present method is still applicable, the issue of how to efficiently identify and separate neighboring bolts still needs to be addressed in future studies.

5. Conclusions

In this paper, we built a virtual experiment platform based on Unreal Engine, which could achieve automatic changes in the camera view, automatic saving of bolt images, and the automatic labeling of key points. The platform enables the rapid establishment of large-scale synthetic datasets and significantly improves the efficiency of image dataset establishment. The method is not only applicable to the key-point datasets building of bolts but also has a broad application prospect for key-point annotation in various other fields.
In addition, this paper also initially verified the effectiveness of synthetic datasets for improving the model training performance as well as model detection accuracy and generalization ability by constructing datasets of different volumes. Additionally, the possibility of pure synthetic datasets on the detection of real images was explored, and the results showed that for the problem of extreme lack of datasets, synthetic datasets could help to a certain extent.
Overall, the effectiveness of the bolt loosening angle detection method based on key-point detection in this paper is verified by the above sections. The trained model accurately detected the bolt corner points, and the proposed method precisely detected the bolt rotation angle. The testing results show that this method has high detection accuracy and robustness. Due to the high functional integration and the mature software development capabilities of smartphones, there have been more and more practical projects using smartphones directly as inspection devices. Therefore, we believe that the proposed method can meet the actual situation of current industrial scenarios and can be well applied to engineering practice.

Author Contributions

Conceptualization, X.Z. and Q.L.; methodology, Q.L.; software, Q.L. and Y.J.; validation, Q.L.; formal analysis, X.Z. and Q.L.; investigation, X.Z. and Q.L.; resources, X.Z. and Q.L.; data curation, Q.L.; writing—original draft preparation, Q.L. and Y.J.; writing—review and editing, X.Z.; visualization, Q.L. and Y.J.; supervision, X.Z.; project administration, X.Z.; funding acquisition, X.Z. All authors have read and agreed to the published version of the manuscript.

Funding

This research received no external funding.

Institutional Review Board Statement

Not applicable.

Informed Consent Statement

Not applicable.

Data Availability Statement

Not applicable.

Conflicts of Interest

The authors declare no conflict of interest. The funders had no role in the design of the study; in the collection, analyses, or interpretation of data; in the writing of the manuscript; or in the decision to publish the results.

References

  1. Bickford, J.; Nassar, S. Handbook of Bolts and Bolted Joints; Taylor & Francis Group: Boca Raton, FL, USA, 1998. [Google Scholar]
  2. Pan, Y.; Ma, Y.L.; Dong, Y.Q.; Gu, Z.X.; Wang, D.L. A Vision-Based Monitoring Method for the Looseness of High-Strength Bolt. IEEE Trans. Instrum. Meas. 2021, 70, 5013914. [Google Scholar] [CrossRef]
  3. Huang, J.Y.; Liu, J.H.; Gong, H.; Deng, X.J. A comprehensive review of loosening detection methods for threaded fasteners. Mech. Syst. Signal Process. 2022, 168, 108652. [Google Scholar] [CrossRef]
  4. Gong, H.; Ding, X.; Liu, J.; Feng, H. Review of research on loosening of threaded fasteners. Friction 2021, 10, 335–359. [Google Scholar] [CrossRef]
  5. Nikravesh, S.M.Y.; Goudarzi, M. A Review Paper on Looseness Detection Methods in Bolted Structures. Lat. Am. J. Solids Struct. 2017, 14, 2153–2176. [Google Scholar] [CrossRef]
  6. Miao, R.S.; Shen, R.L.; Zhang, S.H.; Xue, S.L. A Review of Bolt Tightening Force Measurement and Loosening Detection. Sensors 2020, 20, 3165. [Google Scholar] [CrossRef]
  7. Chaki, S.; Corneloup, G.; Lillamand, I.; Walaszek, H. Combination of longitudinal and transverse ultrasonic waves for in situ control of the tightening of bolts. J. Press. Vessel Technol. 2007, 129, 383–390. [Google Scholar] [CrossRef]
  8. Chen, D.; Huo, L.; Li, H.; Song, G. A Fiber Bragg Grating (FBG)-Enabled Smart Washer for Bolt Pre-Load Measurement: Design, Analysis, Calibration, and Experimental Validation. Sensors 2018, 18, 2586. [Google Scholar] [CrossRef]
  9. Meher, U.; Mishra, S.K.; Sunny, M.R. Impedance-based looseness detection of bolted joints using artificial neural network: An experimental study. Struct. Control. Health Monit. 2022, 29, e3049. [Google Scholar] [CrossRef]
  10. Pal, J.; Sikdar, S.; Banerjee, S.; Banerji, P. A Combined Machine Learning and Model Updating Method for Autonomous Monitoring of Bolted Connections in Steel Frame Structures Using Vibration Data. Appl. Sci. 2022, 12, 11107. [Google Scholar] [CrossRef]
  11. Hou, X.L.; Guo, W.C.; Ren, S.J.; Li, Y.; Si, Y.; Su, L.Z. Bolt-Loosening Detection Using 1D and 2D Input Data Based on Two-Stream Convolutional Neural Networks. Materials 2022, 15, 6757. [Google Scholar] [CrossRef]
  12. Ramana, L.; Choi, W.; Cha, Y.J. Automated Vision-Based Loosened Bolt Detection Using the Cascade Detector. In Proceedings of the 35th IMAC Conference and Exposition on Structural Dynamics, Garden Grove, CA, USA, 30 Jnauary–2 February 2017; pp. 23–28. [Google Scholar]
  13. Nguyen, T.C.; Huynh, T.C.; Ryu, J.Y.; Park, J.H.; Kim, J.T. Bolt-loosening identification of bolt connections by vision image-based technique. In Proceedings of the Nondestructive Characterization and Monitoring of Advanced Materials, Aerospace, and Civil Infrastructure 2016, Las Vegas, NE, USA, 21–24 March 2016. [Google Scholar]
  14. Cha, Y.J.; You, K.; Choi, W. Vision-based detection of loosened bolts using the Hough transform and support vector machines. Autom. Constr. 2016, 71, 181–188. [Google Scholar] [CrossRef]
  15. Kong, X.X.; Li, J. An image-based feature tracking approach for bolt loosening detection in steel connections. In Proceedings of the Conference on Sensors and Smart Structures Technologies for Civil, Mechanical, and Aerospace Systems, Denver, CA, USA, 5–8 March 2018. [Google Scholar]
  16. Kong, X.X.; Li, J. Image Registration-Based Bolt Loosening Detection of Steel Joints. Sensors 2018, 18, 1000. [Google Scholar] [CrossRef]
  17. Girshick, R.; Donahue, J.; Darrell, T.; Malik, J. Rich feature hierarchies for accurate object detection and semantic segmentation. In Proceedings of the 27th IEEE Conference on Computer Vision and Pattern Recognition (CVPR), Columbus, OH, USA, 23–28 June 2014; pp. 580–587. [Google Scholar]
  18. Ren, S.Q.; He, K.M.; Girshick, R.; Sun, J. Faster R-CNN: Towards Real-Time Object Detection with Region Proposal Networks. IEEE Trans. Pattern Anal. Mach. Intell. 2017, 39, 1137–1149. [Google Scholar] [CrossRef]
  19. He, K.M.; Gkioxari, G.; Dollar, P.; Girshick, R. Mask R-CNN. IEEE Trans. Pattern Anal. Mach. Intell. 2020, 42, 386–397. [Google Scholar] [CrossRef]
  20. Redmon, J.; Divvala, S.; Girshick, R.; Farhadi, A. You Only Look Once: Unified, Real-Time Object Detection. In Proceedings of the 2016 IEEE Conference on Computer Vision and Pattern Recognition (CVPR), Las Vegas, NV, USA, 27–30 June 2016. [Google Scholar]
  21. Liu, W.; Anguelov, D.; Erhan, D.; Szegedy, C.; Reed, S.; Fu, C.-Y.; Berg, A.C. SSD: Single Shot MultiBox Detector; Springer International Publishing: Berlin/Heidelberg, Germany, 2016; pp. 21–37. [Google Scholar]
  22. Huynh, T.C.; Park, J.H.; Jung, H.J.; Kim, J.T. Quasi-autonomous bolt-loosening detection method using vision-based deep learning and image processing. Autom. Constr. 2019, 105, 102844. [Google Scholar] [CrossRef]
  23. Pham, H.C.; Ta, Q.B.; Kim, J.T.; Ho, D.D.; Tran, X.L.; Huynh, T.C. Bolt-Loosening Monitoring Framework Using an Image-Based Deep Learning and Graphical Model. Sensors 2020, 20, 3382. [Google Scholar] [CrossRef]
  24. Ta, Q.B.; Kim, J.T. Monitoring of Corroded and Loosened Bolts in Steel Structures via Deep Learning and Hough Transforms. Sensors 2020, 20, 6888. [Google Scholar] [CrossRef]
  25. Zhao, X.F.; Zhang, Y.; Wang, N.N. Bolt loosening angle detection technology using deep learning. Struct. Control. Health Monit. 2019, 26, e2292. [Google Scholar] [CrossRef]
  26. Yu, Y.B.; Liu, Y.; Chen, J.W.; Jiang, D.; Zhuang, Z.L.; Wu, X.L. Detection Method for Bolted Connection Looseness at Small Angles of Timber Structures based on Deep Learning. Sensors 2021, 21, 3106. [Google Scholar] [CrossRef]
  27. Wang, J.; Li, L.M.; Zheng, S.B.; Zhao, S.G.; Chai, X.D.; Peng, L.L.; Qi, W.W.; Tong, Q.Q. A Detection Method of Bolts on Axlebox Cover Based on Cascade Deep Convolutional Neural Network. Comput. Model. Eng. Sci. 2022, 134, 1671–1706. [Google Scholar] [CrossRef]
  28. Deng, X.; Liu, J.; Gong, H.; Huang, J. A novel vision-based method for loosening detection of marked T-junction pipe fittings integrating GAN-based segmentation and SVM-based classification algorithms. J. Intell. Manuf. 2022. [Google Scholar] [CrossRef]
  29. Sun, Y.H.; Li, M.X.; Dong, R.W.; Chen, W.Y.; Jiang, D. Vision-Based Detection of Bolt Loosening Using YOLOv5. Sensors 2022, 22, 5184. [Google Scholar] [CrossRef] [PubMed]
  30. Zhang, Y.; Sun, X.W.; Loh, K.J.; Su, W.S.; Xue, Z.G.; Zhao, X.F. Autonomous bolt loosening detection using deep learning. Struct. Health Monit. Int. J. 2020, 19, 105–122. [Google Scholar] [CrossRef]
  31. Yuan, C.; Chen, W.S.; Hao, H.; Kong, Q.Z. Near real-time bolt-loosening detection using mask and region-based convolutional neural network. Struct. Control. Health Monit. 2021, 28, e2741. [Google Scholar] [CrossRef]
  32. Pan, X.; Yang, T.Y. Image-based monitoring of bolt loosening through deep-learning-based integrated detection and tracking. Comput.-Aided Civ. Infrastruct. Eng. 2022, 37, 1207–1222. [Google Scholar] [CrossRef]
  33. Li, Y.; Ye, J.; Luo, J. Cascade convolutional neural network based abnormal detection of fasteners. J. Electron. Meas. Instrum. 2019, 33, 171–179. [Google Scholar]
  34. Wu, Y.; Sun, J.H. A novel bottom-up keypoints based hexagon bolts detection method. In Proceedings of the Applied Optics and Photonics China (AOPC) Conference—MEMS, THz MEMS, and Metamaterials and AI in Optics and Photonics, Beijing, China, 30 November–2 December 2020. [Google Scholar]
  35. Deng, X.J.; Liu, J.H.; Gong, H.; Huang, J.Y. Detection of loosening angle for mark bolted joints with computer vision and geometric imaging. Autom. Constr. 2022, 142, 104517. [Google Scholar] [CrossRef]
  36. Gong, H.; Deng, X.J.; Liu, J.H.; Huang, J.Y. Quantitative loosening detection of threaded fasteners using vision-based deep learning and geometric imaging theory. Autom. Constr. 2022, 133, 104009. [Google Scholar] [CrossRef]
  37. Wang, C.; Alexey, B.; Liao, M.H. YOLOv7: Trainable bag-of-freebies sets new state-of-the-art for real-time object detectors. arXiv 2022, arXiv:2207.02696. [Google Scholar]
  38. Zheng, C.; Bian, F.; Li, L.; Xie, X.; Liu, H.; Liang, J.; Chen, X.; Wang, Z.; Qiao, T.; Yang, J. Assessment of Generative Adversarial Networks for Synthetic Anterior Segment Optical Coherence Tomography Images in Closed-Angle Detection. Transl. Vis. Sci. Technol. 2021, 10, 34. [Google Scholar] [CrossRef]
  39. Hu, Q.; Yang, B.; Xie, L.; Rosa, S.; Guo, Y.; Wang, Z.; Trigoni, N.; Markham, A. Learning Semantic Segmentation of Large-Scale Point Clouds with Random Sampling. IEEE Trans. Pattern Anal. Mach. Intell. 2021, 44, 8338–8354. [Google Scholar]
  40. Geng, Z.; Sun, K.; Xiao, B.; Zhang, Z.; Wang, J. Bottom-Up Human Pose Estimation Via Disentangled Keypoint Regression. In Proceedings of the 2021 IEEE/CVF Conference on Computer Vision and Pattern Recognition (CVPR), Nashville, TN, USA, 20–25 June 2021; pp. 14671–14681. [Google Scholar]
  41. Maji, D.; Nagori, S.; Mathew, M.; Poddar, D. YOLO-Pose: Enhancing YOLO for Multi Person Pose Estimation Using Object Keypoint Similarity Loss. In Proceedings of the 2022 IEEE/CVF Conference on Computer Vision and Pattern Recognition Workshops (CVPRW), New Orleans, LA, USA, 19–20 June 2022. [Google Scholar]
  42. Cao, Z.; Simon, T.; Wei, S.E.; Sheikh, Y.; Ieee. Realtime Multi-Person 2D Pose Estimation using Part Affinity Fields. In Proceedings of the 30th IEEE/CVF Conference on Computer Vision and Pattern Recognition (CVPR), Honolulu, HI, USA, 21–26 July 2017; pp. 1302–1310.
  43. Papandreou, G.; Zhu, T.; Chen, L.C.; Gidaris, S.; Tompson, J.; Murphy, K. PersonLab: Person Pose Estimation and Instance Segmentation with a Bottom-Up, Part-Based, Geometric Embedding Model. In Proceedings of the 15th European Conference on Computer Vision (ECCV), Munich, Germany, 8–14 September 2018; pp. 282–299. [Google Scholar]
  44. Kreiss, S.; Bertoni, L.; Alahi, A. PifPaf: Composite Fields for Human Pose Estimation. In Proceedings of the 2019 IEEE/CVF Conference on Computer Vision and Pattern Recognition (CVPR), Long Beach, CA, USA, 15–20 June 2019; pp. 11969–11978. [Google Scholar] [CrossRef] [Green Version]
Figure 1. Two categories of bolt loosening detection. (a) Relative rotation recognition; (b) Relative length recognition.
Applsci 13 02020 g001
Figure 2. Overview of the bolt loosening angle detection method.
Applsci 13 02020 g002
Figure 3. The test structure.
Applsci 13 02020 g003
Figure 4. Image processing and labeling. (a) Original images; (b) Cropped images; (c) Labeled image.
Applsci 13 02020 g004
Figure 5. The labeling order of key-points.
Applsci 13 02020 g005
Figure 6. The bolt digital model. (a) White model; (b) Shading model.
Applsci 13 02020 g006
Figure 7. The UI of the virtual experiment platform in UE5.
Applsci 13 02020 g007
Figure 8. Bolt images generated in the virtual experiment platform. (a) Images from different angles; (b) Images from different lighting conditions.
Applsci 13 02020 g008aApplsci 13 02020 g008b
Figure 9. Marker objects fixed on the bolt model.
Applsci 13 02020 g009
Figure 10. The result of key-point labeling and recognition box generation.
Applsci 13 02020 g010
Figure 11. The framework of YOLOv7-pose.
Applsci 13 02020 g011
Figure 12. The result of key-point marking and recognition box generation.
Applsci 13 02020 g012
Figure 13. The angular state of the fist bolt corner to the reference line.
Applsci 13 02020 g013
Figure 14. Calculation of the rotation bolt loosening angle.
Applsci 13 02020 g014
Figure 15. Schematic diagram of image perspective distortion caused by camera angle. (a) Geometric principle of perspective distortion; (b) Coordinate changes in corner points after perspective distortion.
Applsci 13 02020 g015
Figure 16. The theoretical perspective error analysis of the proposed method.
Applsci 13 02020 g016
Figure 17. The training loss for different datasets.
Applsci 13 02020 g017
Figure 18. The mean precision for different datasets.
Applsci 13 02020 g018
Figure 19. A wrong detection result obtained by Keypoint-RCNN.
Applsci 13 02020 g019
Figure 20. Detection box and key-points visualization (a) Detection results of the “100 real” model; (b) Detection results of the “200 real + 1200 synthetic” model.
Applsci 13 02020 g020
Figure 21. Bolt loosening angle detection visualization (a) Bolt in the tight state; (b) Bolt of the current state.
Applsci 13 02020 g021
Table 1. Smart phone camera specifications.
ParametersValue
Size4032 × 3024 pixels
Vertical resolution72 dpi
Horizontal resolution72 dpi
Bit depth24
Aperturef/1.8
Table 2. The workstation configurations.
CategoryVersion
SoftwareSystemWindows 11
Virtual Environmentconda 4.13.0
ProgrammingPython 3.9.12
Deep Learning FrameworkPytorch 1.12.0
CUDACuda11.6/cuDNN8.0
HardwareGPUNVIDIA GeForce
RTX3080 Ti 12G
Memory32G
Table 3. The composition of the five datasets.
No.Training SetValidation Set
1200 real50 real
2200 real + 1200 synthetic50 real + 100 synthetic
3100 real50 real
4100 real + 1200 synthetic50 real + 100 synthetic
51200 synthetic100 synthetic
Table 4. Smart phone camera specifications.
Hyp-ParametersValueHyp-ParametersValue
lr00.005anchor_t4.0
lrf0.1fl_gamma0
momentum0.937hsv_h0.015
weight_decay0.0005hsv_s0.7
warmup_epochs0.3hsv_v0.4
warmup_momentum0.8degrees0.0
warmup_bias_lr0.1translate0.1
box gain0.05scale0.2
kpt gain0.30shear0.0
cls gain0.05perspective0.0
cls_pw1.0flipud0.0
obj gain0.5fliplr0.0
obj_pw1.0mosaic0.8
iou_t0.20mixup0.0
Table 5. Evaluation results of bolt and bolt corner point detection for the test set.
Training SetBoltsDetectKptsDetect
200 real50505050
200 real + 1200 synthetic5050
100 real4949
100 real + 1200 synthetic5050
1200 synthetic2421
200 real + 1200 synthetic
(Keypoint-RCNN)
50505045
Table 6. Evaluation results of bolt and bolt corner point detection for the test set.
Training SetNME δ (°) Var
200 real0.0437852.5104721.951742
200 real + 1200 synthetic0.0339031.9434731.304070
100 real0.0611443.5141309.047428
100 real + 1200 synthetic0.0473532.7175043.644367
1200 synthetic0.0701474.03801415.20069
200 real + 1200 synthetic
(Keypoint-RCNN)
0.0553953.24740824.88260
Table 7. Bolt loosening angle detection results.
No.True AngleDetected AngleError
100.475−0.475
21513.5541.446
31516.204−1.204
43030.598−0.598
53031.818−1.818
69088.6411.359
79091.208−1.208
8180182.875−2.875
9300299.2980.702
10330328.6971.303
Average *1.298
* The calculation uses an averaging of absolute values.
Disclaimer/Publisher’s Note: The statements, opinions and data contained in all publications are solely those of the individual author(s) and contributor(s) and not of MDPI and/or the editor(s). MDPI and/or the editor(s) disclaim responsibility for any injury to people or property resulting from any ideas, methods, instructions or products referred to in the content.

