1. Introduction
Today, we live in a world that could only be described as science fiction. With the rise of the Internet of Things (IoT), everything has become smarter and connected in a way that resembles the industrial revolution of the western world 35 years ago [
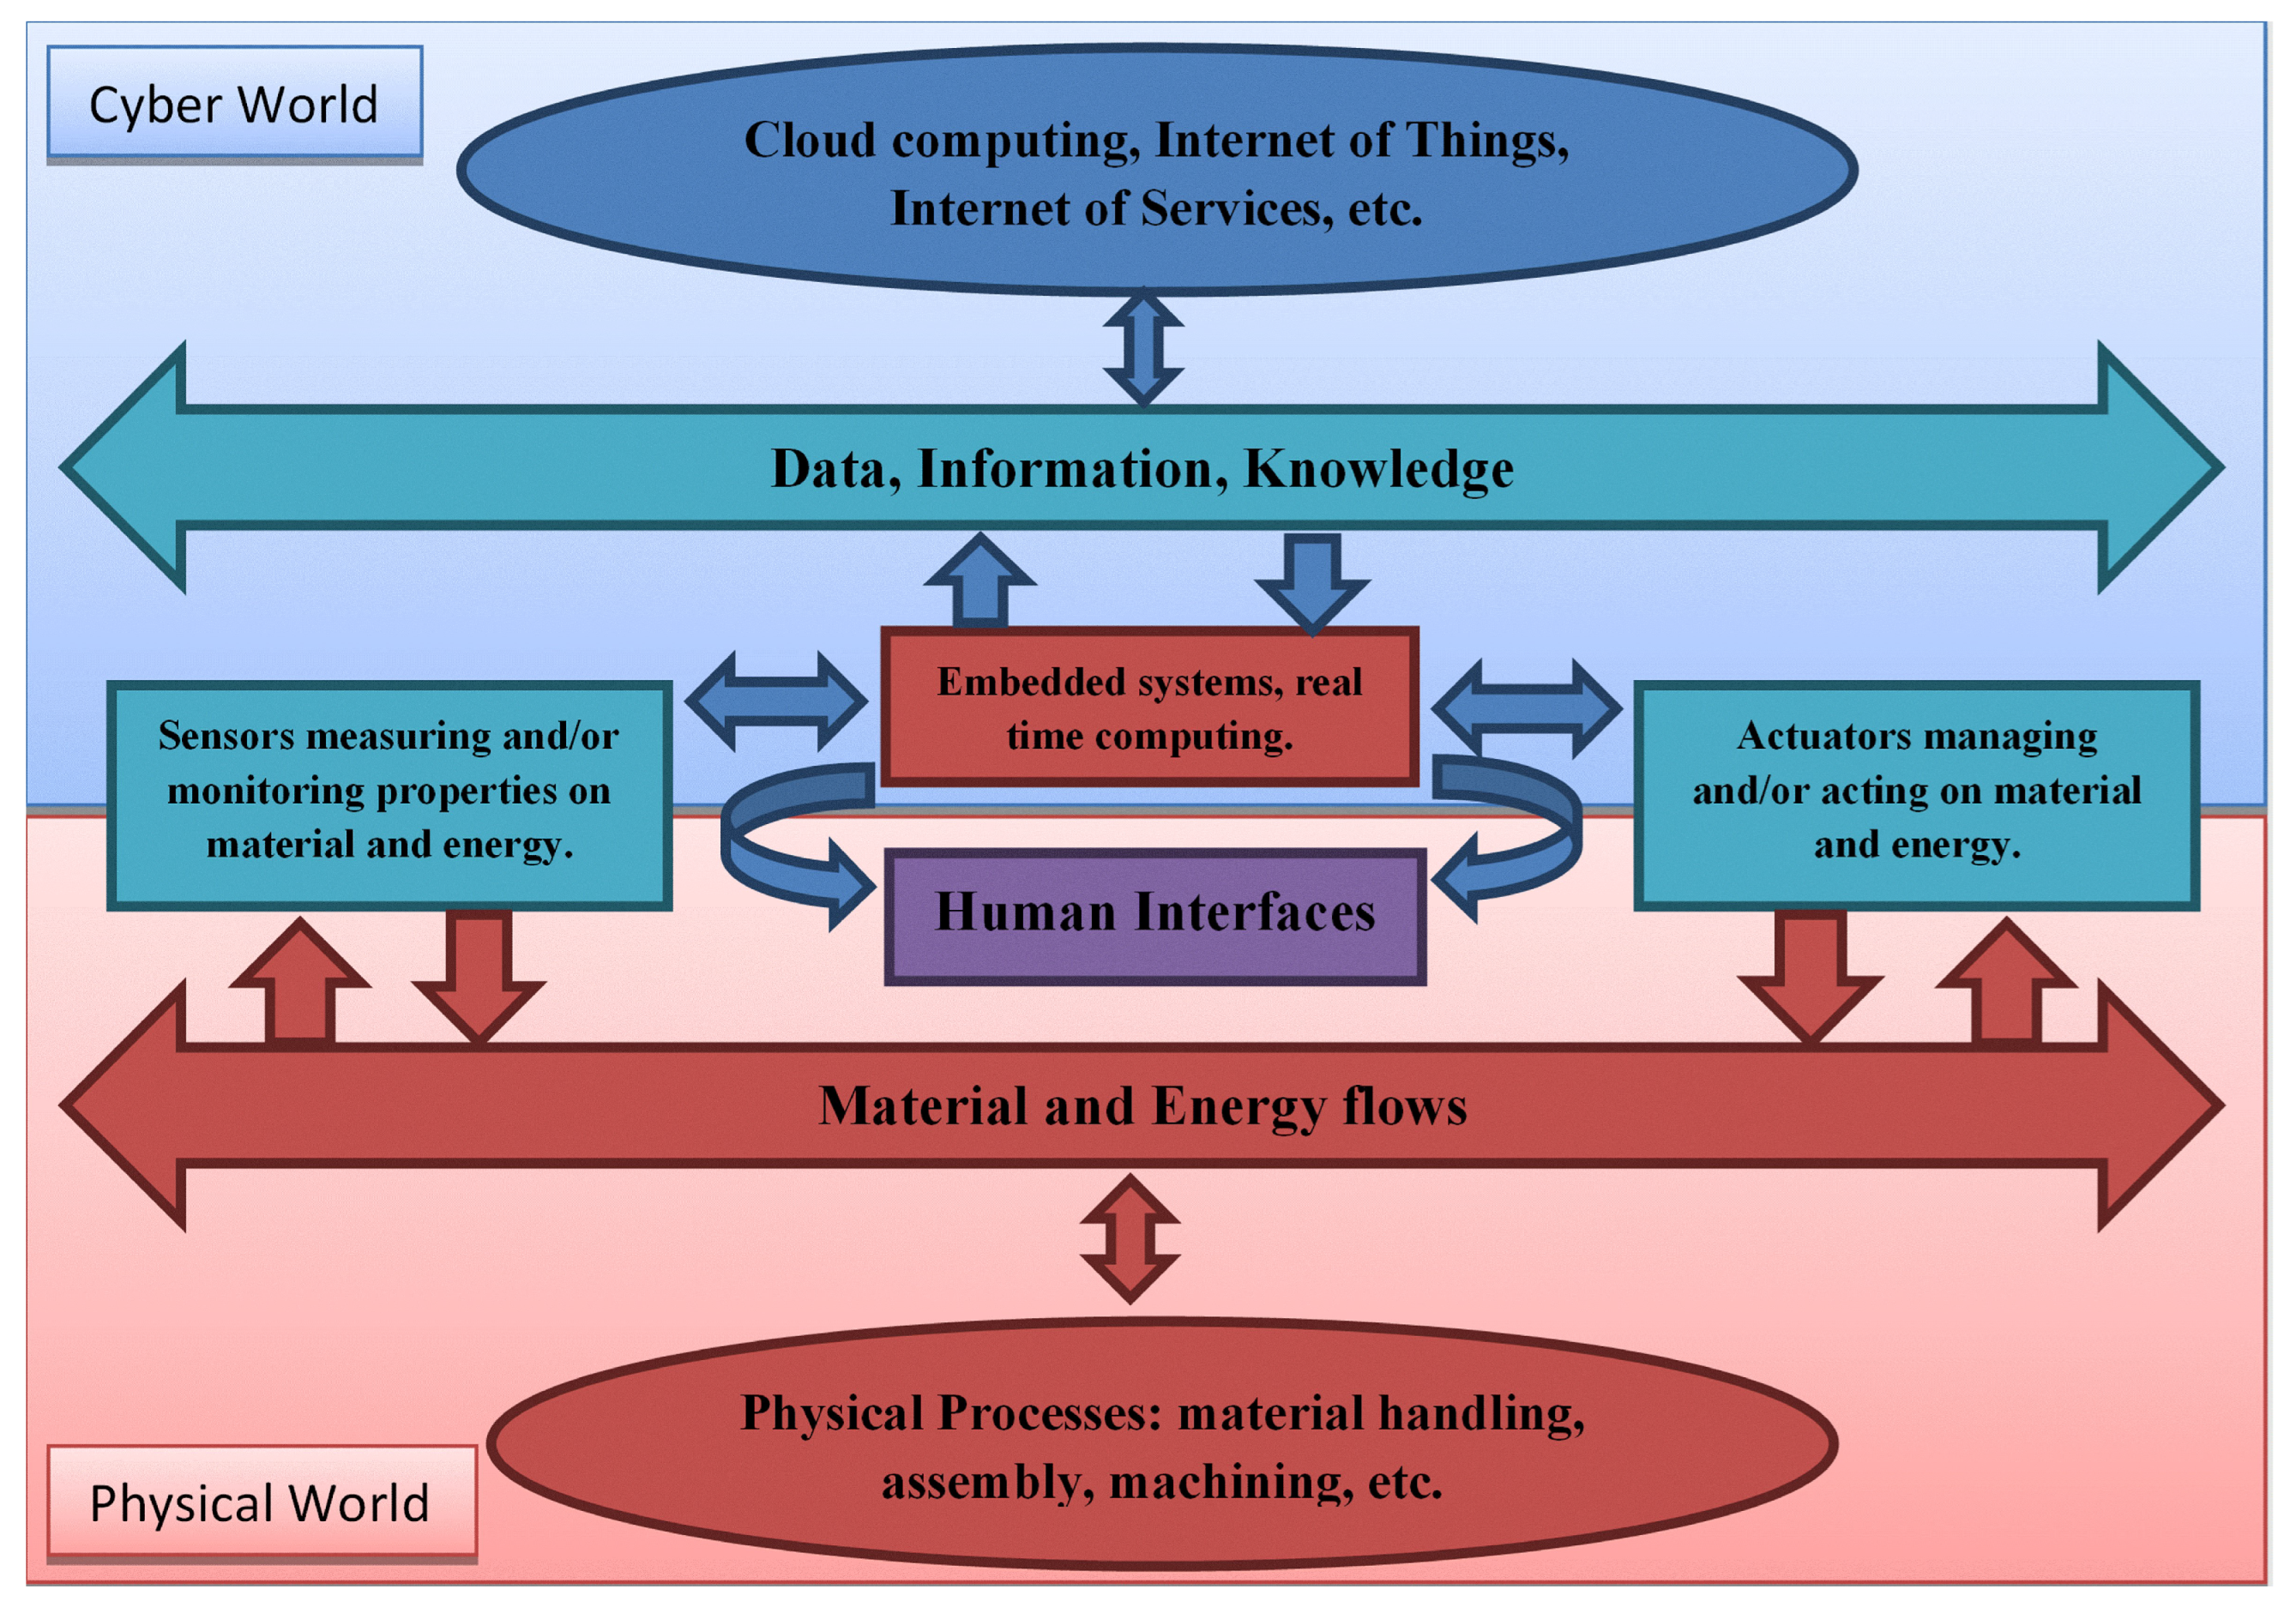
1]. The modern industry must adapt and maintain maximum efficiency while facing new challenges such as high reliability, low environmental risk, and human safety. This has led to the emergence of the digital economy, also known as Industry 4.0, which focusses on the logic that governs the entire manufacturing process rather than just technological advancements in manufacturing processes. The introduction of cyber-physical systems (CPS) has made each production resource (e.g., machines, equipment, and operators) a part of the “cyber production system” connected to the IoT. However, this new production scenario also presents challenges such as the need to build and standardise CPSs and the implementation of new communication standards among CPSs [
2].
On the other hand, this new industrial paradigm also offers numerous opportunities. A network of CPSs can help achieve goals such as product customisation, a reduction in production lead times, a more efficient control of manufacturing processes, and an increased product quality and reliability. In this CPS configuration, which aligns with the Industry 4.0 paradigm, machines and production equipment are connected at a higher level of awareness, allowing them to become aware of their process capabilities. One area of focus in auxiliary processes is maintenance activity, which “combines various methods, tools, and techniques to reduce maintenance costs while increasing equipment reliability, availability, and safety” [
3]. In fact, maintenance stops, whether expected or unexpected, account for a significant portion of operating expenses in various industry sectors, with nearly 30% of maintenance costs being attributed to inefficient policies (e.g., unscheduled downtime due to sudden failures) [
4]. Industry 4.0 technologies enable the development of new maintenance strategies, such as “smart maintenance”.
Since 1950, various maintenance logics have been developed, including time-based maintenance (TBM). TBM involves regularly scheduled preventive maintenance in order to slow down the deterioration process of components. The TBM maintenance strategy assumes that the system’s failure distribution is known either experimentally or statistically [
5]. However, the real evolution of maintenance has occurred in the past three decades with the emergence of condition-based maintenance (CBM), which is a “decision-making strategy that enables real-time diagnosis of failure and prognosis of future equipment health” [
6]. By integrating sensors into operating machines, the system’s health state can be quantified in a proactive manner. It is desirable for the CBM policy to evolve from a diagnostic approach based on fault detection to a prognostic approach based on degradation and fault prediction. The “prognostic process” allows for the prediction and anticipation of machine failure, resulting in numerous benefits in the fields of safety, economics, and resource management [
3].
Prognostics and health management (PHM) “refers specifically to the phase involved with predicting future behaviour, including remaining useful life (RUL), in terms of current operating state and the scheduling of required maintenance actions to maintain system health” [
7]. There have been many algorithms developed for predicting the health state of a machine within the context of PHM [
6,
8,
9]. However, to the best of our knowledge, only a limited number of approaches are currently available for estimating the probability that a monitored machine will successfully complete a predefined workload by integrating data about its historical behaviour and current health state. While the number of these algorithms has significantly increased in recent years, most of them are only suitable for machines operating under constant workload conditions. In manufacturing, it is important for a prognostic tool to consider both sensor data and information about previous and future workloads [
10].
The objective of this study is to explore the potential benefits and challenges of Industry 4.0 and its impact on maintenance strategies, specifically focusing on the integration of prognostics and health management (PHM) into the manufacturing process. In particular, this work aims to: (i) propose the integration of machine workload information, previously not considered in other studies, into a well-established PHM algorithm; (ii) formulate a methodology for integrating machine workload information into any given PHM algorithm in order to explore the potential benefits and challenges of Industry 4.0 on maintenance strategies and to contribute to the development of more efficient and effective maintenance strategies in the industry.
The relevance of this work to practitioners lies in the potential for improved decision-making in maintenance strategies for Industry 4.0 production systems. By incorporating machine workload information into a well-established prognostic model, practitioners can benefit from more accurate forecasting of failure probability, leading to more efficient utilisation of production resources and lower maintenance costs. Additionally, the proposed approach can be applied to various monitored machines and equipment without any specific constraints, making it a versatile solution for practitioners in various industrial contexts. Overall, this research aims to provide practitioners with a practical and effective solution for improving the autonomy of CPSs in accepting or declining scheduled jobs according to their forecasted health state, ultimately leading to improved production efficiency and cost savings.
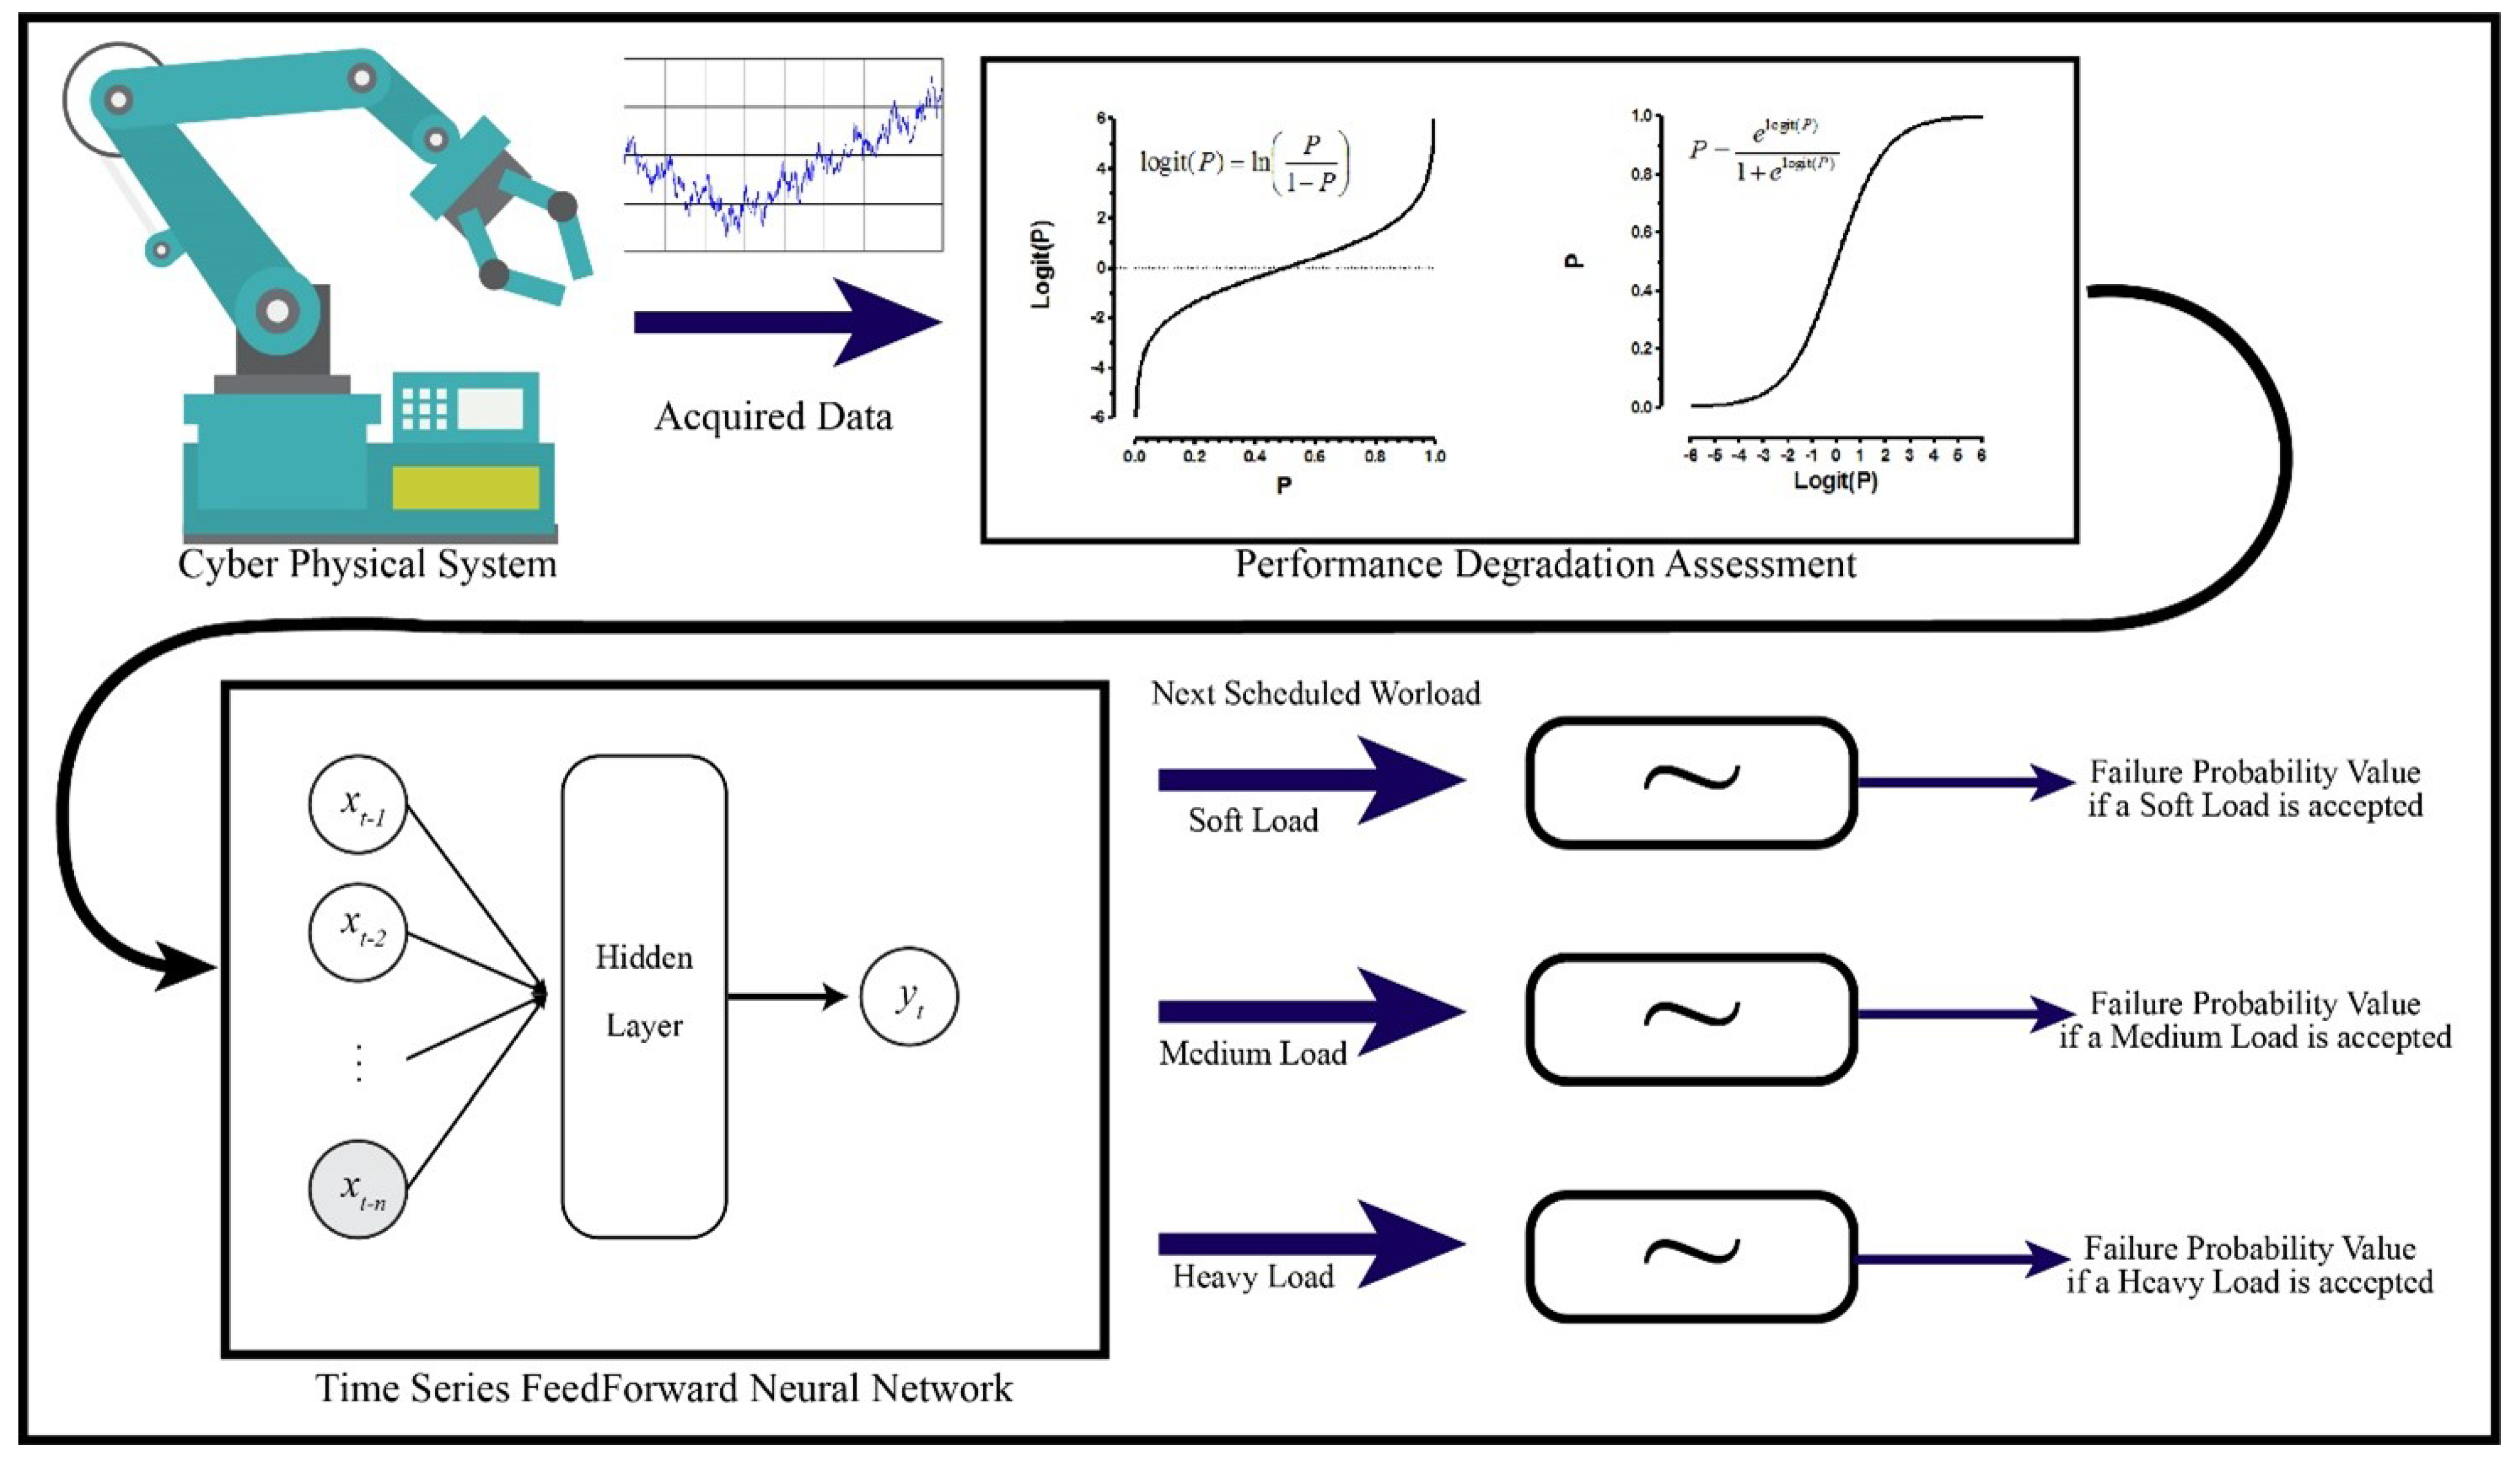
The proposed prognostic approach consists of four different phases. The first stage involves acquiring signals from the sensors of the monitored machine. In the second step, a degradation assessment model is developed using the logistic regression tool. In the third phase, a feed-forward neural network (FNN) is used to build the prognostic model. Finally, in the final step, a set of auxiliary artificial networks (ANNs) are added to the model to integrate workload information into the data. This model, due to the versatility of the analytical tools employed, can be applied to various monitored machines and equipment without any specific constraints or hypotheses on their behaviour or application context.
The remainder of this paper is organised as follows. In
Section 2, the related literature on prognostics and the digital industry is discussed.
Section 3 presents the context and formal description of the prognostic model, while in
Section 4, a case study is considered and all computational results are presented. Finally,
Section 5 concludes the work and discusses further research.
3. Problem Formulation and Proposed Model
3.1. Problem Definition, Hypothesis, and General Purpose of the Model
The interconnection opportunities introduced by Industry 4.0 show all their potentiality when continuous information exchange between CPSs is in place. The literature review declares that the most important feature of the fourth revolution is represented by the possibility of autonomous scheduling and (potentially) rescheduling in CPSs within a short period, to avoid, for instance, an unscheduled stop or a safety accident. In order to make this prospect concrete, it is essential to have in-depth knowledge of the CPS itself, with a prognostic tool able to predict the likelihood that an industrial asset may complete a predefined job.
Within the literature, the remaining useful life (RUL) is a well-established reference parameter in equipment prognostics. However, the Industry 4.0 capabilities agree to avoid the use of this parameter, uncertain of its nature, favouring the estimation of a failure probability value. This value, strictly related to the health state of the equipment, may allow a more efficient balancing between production and maintenance activities. Every component or equipment usually produces several kinds of signals when working conditions change over time (e.g., a higher temperature, different vibrations, or significant acoustic emissions). The problem is that there are many different equipment types, and, in a real vision, every equipment owns its history and its behaviour, due to previous unbalanced workload and uncertain material properties.
Therefore, the design of a prognostic algorithm, able to consider a different kind of workload reassuming it in a single value, is desirable. This value should reflect the failure probability of the future workload to be scheduled on the machine, resulting in a sort of equipment degradation indicator. This physical feature and, most of all, methodology to be calculated must be universally applicable on each CPS and not dependent on its specific technological processing, both for general reasons of plant maintenance management and certain reasons of communication policy between CPSs. From a theoretical perspective, it would be possible to conceive a particularised prognostics algorithm for each set of machines. However, this paper aims to derive a data-driven model that could be easily adapted to whatever machine and operational scenario, only by changing the involved training dataset.
The proposed self-detected condition-based maintenance (SdCBM) policy needs four main requirements to be developed [
Figure 2]:
Cyber-physical system signal acquisition;
Degradation modelling of the monitored machine/equipment;
Prognostics generation model;
Failure probabilities normalisation as a function of the next scheduled job.
In agreement with the previously discussed requirements for a widely applicable model that can be concretely implementable in a production plant, the main and most significant effort of this paper consists of achieving a model both able to respect all the emerged hypotheses and constraints, to be composed of tools largely used and computationally consolidated, and to provide a feature strictly related to the RUL, but innovatively defined by an appropriate combination of the selected computational tools.
3.2. The Proposed Model: CPS Signal Acquisition
From an operational perspective, the design and implementation of the CPS represent the most relevant concern of the proposed study, as they represent the connection between the physical world (the monitored machine/equipment) and the cyber world. As discussed in
Section 2, Lee et al. [
23] proposed a unified 5C-level architecture as a guideline for the implementation of CPSs in Industry 4.0 manufacturing systems (smart connector level). In this sense, the signal acquisition is part of the CPS architecture itself. Regarding the behaviour and structure of the monitored machine/equipment, it is essential to choose carefully:
The typology and features of the sensors to be used (e.g., accuracy and response time);
Their positioning within the system;
A standardised communication protocol for data transfer, such as MTConnect [
27].
By analysing the history of the failures of a generic system together with its design features, it is possible to derive some recurrent problems and critical components. It is worth noting that the analyst may also adopt more sophisticated top-down approaches, such as Failure Modes, Effects and Criticality Analysis. (FMECA, MIL-P-1629, 1949), to decompose the system into its constituent elements in order to identify system’s critical failures. The state of critical components must be monitored and analysed. Even if our approach can be applied to every machine/equipment, the initial definition, deployment, and setup of the CPS need to be conducted with the help of maintenance technicians. Their initial contribution, in fact, together with the design team’s support, turn out to be crucial for a successful implementation at least at the current stage of development. However, in the coming years, the achievements of big data analysis and the availability of data from different kinds of machines will permit an automatic or “supervised” choice of the sensors themselves.
3.3. The Proposed Model: Degradation Modelling of the Monitored Machine/Equipment
As discussed in the Literature Review section, the degradation assessment of industrial machines and equipment for maintenance purposes is often accomplished by means of logistic regression. For instance, Yan et al. [
48] applied logistic regression for the degradation assessment of the motor motion of an elevator door with the use of an ARMA-based model for the estimation of the remaining useful life. Caesarendra et al. [
49] instead proposed the use of logistic regression to estimate the failure degradation of bearings. While based on a run-to-failure data set, their research considered the result as target vectors of failure probabilities, exploiting an RVM (relevance vector machine) algorithm as an intelligent system for predicting the future failure probabilities. As a consequence of the previous studies and the flexibility of logistic regression, we adopted this regression model for the degradation assessment in the proposed algorithm. Logistic regression considers a binary “outcome”; that is, a binary dependent variable whose values are usually coded as zero for the negative outcome (no failure event) and as one for the positive outcome (failure event).
Equation (
1) gives the probability of this event:
where
is the input vector of independent variables reproducing the system’s state, while
,
,
, …,
represent the regression coefficients. The estimation of these coefficients is one of the critical activities of model fine-tuning (as the regression coefficients synthesise the physical knowledge and behaviour of the monitored machine/equipment). If an extensive database of historical data is available, these coefficients can be derived with the maximum likelihood estimation method by finding the estimator values that maximise the probability of making the input data given as parameters [
48,
50].
If historical data are not available, it is possible to acquire only the independent vector variables, without the knowledge of conditions linked to the regular behaviour of the monitored machine/equipment. This knowledge is not sufficient for performing a regression analysis. However, in this case, it is possible to take advantage of expert maintenance technicians’ expertise by running different tests on the monitored machine/equipment and setting in advance the corresponding performance level of the monitored condition. Another, and more intuitive, formulation of the logistic regression is shown in Equation (
2). It relates to the effect of the dependent variable, not to the probability of the event, but the “odd” of the event (the relationship between the probability of an event and the probability of a non-event):
In Equation (
2), the first term is the logarithm of the odds ratio, known as “logit”, i.e., the term “Logistic Regression”. In this form, there is an apparent linear association between the “logit” and the dependent variables, in contrast to the previous formulation (Equation (
1)). In this formulation, logistic regression returns the probability of a specific event as a value in the range 0–1. In the proposed model, it is necessary to build a degradation model, which summarises in a single dependent variable the failure probability of the machine. It is worth pinpointing that, at this stage, we are still in the diagnostic phase. The next step is the prediction of dynamic failure probabilities for the future periods, starting from the performance degradation model.
3.4. The Proposed Model: Prognostics Generation Model
In the prognostic literature, different data-driven techniques are available to predict future failure probabilities. However, the most used methods in this context are relevance vector machine (RVM), Gaussian process regression (GPR), and neural networks (NNs). The flexibility offered by neural networks in the feed-forward configuration is crucial for the entire project’s practical feasibility [
51]. In this paper, we developed the prognostic model through feed-forward neural networks. However, the general logic and the framework as a whole is still valid in the case of RVM and GPR. Therefore, in the prognostic stage, we used a feed-forward neural network in a time series prediction configuration. This type of neural network application is known as a multi-step prediction in which the network employs the previously predicted value to forecast the future values iteratively. In this way, it is possible to predict a series of values depending on the required number of time steps. The first value predicted from the network
is a function of the last
n recorded values at preceding time steps
:
In Equation (
3), each recorded value represents an input associated with a different node of the NN. In predicting the next value,
, the last
recorded values and the last predicted value are used:
Then, it is possible to predict all the future desired
h values iteratively:
In this context, it is essential to define and control each aspect of its development and implementation. As a consequence, each network, which is linked to certain equipment or machine with unique features, presents a different neural structure (specifically, the number of nodes and the activation function of each different node). However, thanks to the uniformity of the value that logistic regression provides, it is possible to standardise the input data activity for each neural network. In our approach, the architecture of the neural network consists of an output layer composed of only one output (the predicted value) and an input layer consisting of the first n recorded values. According to Tan et al. [
52], it is advisable to introduce nonlinearity into the network by using some nonlinear activation functions (i.e., the
tanh or
logit function) as a combination of functions from input to output layer.
Hence, it is important to find the dimension of the network (i.e., the number of nodes), the weight of nodes, and define each activation function. In particular, the number of active hidden neurons in the network is a critical factor. If the network has a small number of hidden nodes, the performance tends to be ineffective. Meanwhile, if the network has too many hidden nodes, the risk of data over-fitting arises and impedes the desired generalisation. In the literature, it is usual to define the dimension and the activation functions of a neural network with a trial and error strategy. When data acquisition takes place, a set of data is extracted and used for estimating the dimension of the neural network. Starting with the most straightforward network, composed of only one hidden and one output node, an iterative training of these networks (varying the number of nodes and the activation functions) is made with the previously collected data.
For each trial, root mean square deviation (RMSD), which represents a good measure of accuracy to compare forecasting errors of different models, is estimated until the minimum of this value is found. RMSD represents the standard deviation of the difference between the predicted and target value, and it can be calculated as follows:
where
n is the number of time series values,
is the predicted value, and
is the real monitored value. Once the dimension of the neural network is determined, the same dataset used for this estimation can be used for an optimal adjustment of each synaptic weight between neurons. It is worth mentioning here that these activities are to be personalised for each machine/equipment, as each has its own failure history and “standard” working conditions.
3.5. The Proposed Model: Failure Probability Normalisation as a Function of the Next Scheduled Job
The introduced model can be successfully applied in industrial settings to forecast the future failure probabilities of monitored machines/equipment, considering their performance history and without any information about their future workloads. Thus, the approach presented at this point is capable of functionally extending the prognostic algorithms already available in the literature. Indeed, while the previous steps of the introduced approach are easily replaceable with alternative algorithms and methodologies, we would like to concentrate here on further improving the quality of the predictions by providing these prognostic algorithms with a new piece of information, i.e., the workload, both completed and to be completed. For instance, while forecasting the failure probabilities of a machine whose recent workload has been considerably slight, the prevision error produced by the model could be relevant, especially in the case of value underestimation (e.g., due to a sudden increase in the mechanical load of next scheduled jobs).
For improved accuracy, it would be better to categorise machines into different categories according to the type of loads they are subject to. In the presence of stationary workloads, which may determine a slight or proportional change to a machine’s working conditions, the model does not require any amendment (the workload influence turns out to be negligible in this scenario). Under variable workloads, however, the consideration of previous and future workload values for the monitored machine/equipment could be relevant for accuracy enhancement. Potential better performance of the proposed prognostic approach would benefit the algorithm for machine/equipment job scheduling as well. It may consider, as a further variable, the failure probabilities of workloads associated with the various jobs to be scheduled. This may lead to a more efficient utilisation of machines while reducing their RUL under a controlled risk of failure. Hence, we must tackle the new issue of finding the relationship between the failure probabilities, as derived from the logistic regression, and the workload values corresponding to the future scheduled jobs of the monitored machine/equipment.
From an operational point of view, the scheduled job is only an indication of the operations the machine/equipment has to perform in the immediate future. Therefore, identifying and classifying all the possible jobs from a workload perspective turns out to be an important activity. An expert technician, with specialised knowledge of the considered machine/equipment, may complete this activity in the initial stage of project development. However, this same task could be carried out with the help of a pattern recognition neural network. As an example, in the case of three different workload values (soft, medium, and heavy load) for the monitored machine/equipment, it would be easy for the technician to find the relation between the various jobs and their expected workload (e.g., mechanical load) on the machine (
Table 1).
Although different classifications of machine workload values could be considered, once the relationship mentioned above is established, it will be necessary to introduce this information into the prognostic model. Among the several different technical opportunities, we chose neural networks as the tool to accomplish the task of identifying the link between the future expected workload values and one chosen as a reference. Taking the soft workload value as reference (
Table 1), two feed-forward neural networks would be necessary: the first one to find the relationship between the medium workload and the reference workload and the second one to find the other relationship between the heavy workload and the reference workload. The number of hidden neurons and the combination of activation functions for these new neural networks can be found with a trial and error approach similar to that cited in the previous subsection. These networks are structured with one input node and one output node, with a variable number of hidden neurons to be determined. The input node receives as input the value of prognostic failure probability under the medium or heavy workload values, while the output one provides the failure probability that a soft workload value would have produced under the same degradation conditions.
The difficulty of this activity is the identification of valid failure probability values for training these auxiliary networks. In addition, it should be noted that the effect of the workload on machine degradation might differ in different degradation stages. Hence, it is advisable to conduct some pre-tests on the monitored machines/equipment at the various degradation stages. As an example, by running three exemplars of a specific monitored machine/equipment, each one with a different workload value, it is possible to collect failure probability values under different workload values and within the various degradation stages. Although this approach may appear burdensome and expensive, it is worth noting that this data collection may occur during the regular operation of machines/equipment, as well as in future periods, allowing, in this way, a future update of the model itself.
Hence, during its operation, the model knows the current scheduled job for the monitored machine/equipment and, if this job has an expected soft workload, it directly uses the failure probabilities provided from logistic regression to forecast the future output value. Otherwise, if the current job has an expected medium or heavy workload, the output value is then normalised according to the reference value with the help of the two auxiliary neural networks introduced above. This value is then used in the time series feed-forward neural network for forecasting the future failure probability. The output value of the prognostic model thus obtained is referred to as the reference workload (i.e., soft load) and it is necessary, therefore, to adjust this value to the expected workload of the next job.
To this extent, two other auxiliary neural networks, trained to find the relationship between the reference workload value and the expected workload of the next scheduled job, may perform this adjustment. The final output of the model represents the forecasted failure probability values of the monitored machine/equipment. It effectively reproduces the continuous degradation process of the machine/equipment with the knowledge of the future scheduled workload. With this enhanced accuracy, the proposed tool may be integrated into the production schedule activity of Industry 4.0 manufacturing plants (or even into CPSs themselves in an M2M setting), leading to more balanced scheduling of production resources.
4. Logistic Cyber-Physical Systems: A Prototypal Case Study
In the following, we present a case study implementation on a prototypal system. The innovative context of the proposed approach, the substantial lack of algorithms, and the subsequent unavailability of test data (necessary to compare different design solutions), represented a great difficulty of this research. This case study comes from a project experience where a prototypal logistic CPS was built. The objective of this prototype was to demonstrate the potential of Industry 4.0 concerning the material handling problem of a typical job–shop production system. The considered prototype consists of four processing stations, each connected to an automatic conveyor belt by means of a system designed to withdraw/release baskets that are conceived to handle loads of various magnitude. When the scheduled basket is approaching the designed processing station, the system automatically activates the withdraw/release system. From a technical point of view, we used NXT Bricks as actuators groups for the motors of the withdraw/release systems and STM32F4 NUCLEO by ST Microelectronics for the data collection from the various sensors.
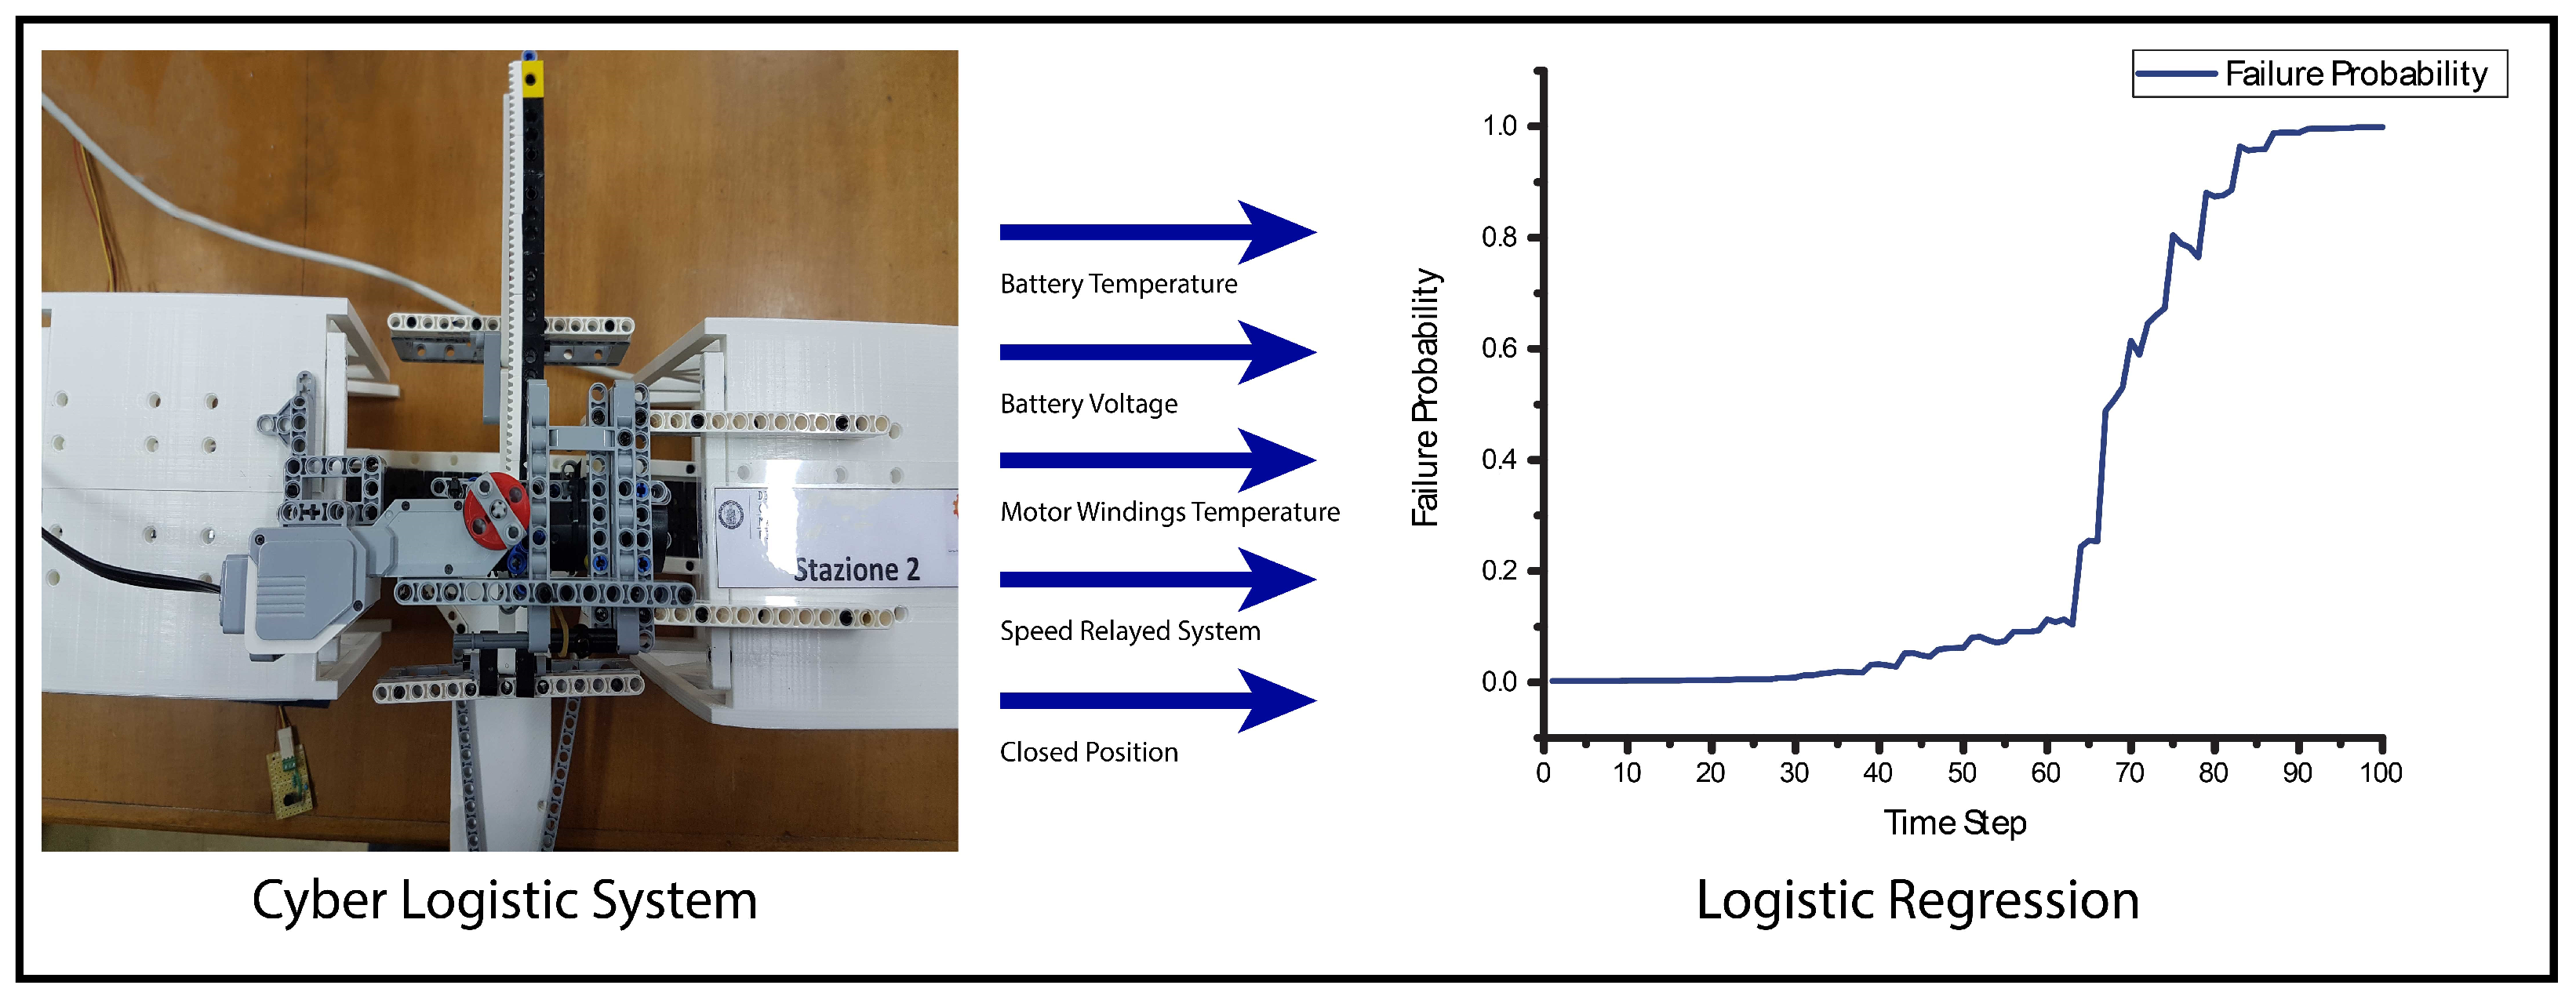
The behaviour of our prototype showed failures and malfunctioning due to several different causes, including wear of mechanical parts, insufficient motor thrust, insufficient power supplied by the battery pack of the NXT Brick, and system movements that were out of nominal tolerances. In particular, the power level delivered from the Li-ion accumulator of the brick and the insufficient thrust of the motor (due to the high temperature of its windings) turned out to be the leading causes of the withdraw/release system failure. With reference to these failure causes, the project team identified the physical variables to monitor for an accurate estimation of the failure probability: (i) battery temperature (gauged by a thermocouple); (ii) battery voltage (measured with ADC voltmeter); (iii) motor windings temperature (gauged by a thermocouple); and (iv) rest position and speed of the withdraw/release system (controlled by an encoder). We collected all this data from sensors by means of the above mentioned STM32F4 NUCLEO, which allowed us to transfer in real-time all the data to a PC through a virtual serial connection through USB.
Thus, for the degradation assessment model phase, we took advantage of the assistance of technical experts in electric motors, who specified the parameters to be monitored and included in the logistic regression model previously described. Having defined the parameters to be monitored, nine experimental cycles at the fixed operating parameters were performed until component failure was observed. Thus, the combined data aided the inferential process (based on the maximum likelihood estimation in
Section 3) of parameter estimation for the proposed logistic regression model. The considered model is shown in Equation (
7):
where
is the battery temperature,
is the battery voltage,
is the motor winding temperature, and
and
are, respectively, the rest position and the speed of the withdraw/release system (
Figure 3).
As expected, the estimated regression coefficients showed that the battery voltage () and the motor winding temperature () coefficients have the highest values (meaning that these parameters are the most important causes of failure). After the validation of the degradation model, the experiments continued with six other runs, in which the information about each workload being allocated by the production scheduler to the processing station at every time period was available. It should be noted that, in the considered prototype, the workload was represented by the weight of the handled material. However, during the experiments, the scheduler assigned the various jobs to the various stations only to minimise the lead time, disregarding the failure probability value estimated by the CPS.
In particular, data from six different runs in this configuration were collected until the material handling system failed to complete the assigned tasks (
Table 2). After each run, the battery was completely charged and the motor winding was replaced with a regenerated one. Regarding data collection, the following data were collected at a frequency of 4 Hz:
The battery temperature;
The battery voltage;
The motor winding temperature;
The rest position of the releasing system;
The speed of the releasing system.
From an accuracy point of view, data were collected with the in-built ADC of the above-mentioned NUCLEO STM32F401 with a resolution of 10 bit, and typical signal noise was removed from the registered data with the use of a low-pass filter. This phase is crucial to obtain smoother signals and hence allows the next phase’s algorithm to focus more qualitatively on trends rather than on isolated signal spikes. The total dataset for the next phase was over 17 thousand lines in length. It should be noted that this dataset was divided into three parts; the first part (70%) was used for training, the second part (20%) was used for validation, and the third part (10%) was used for testing. This subdivision is conventional for an artificial neural network algorithm. The training datasets are used to train the neural network, the validation datasets are used to determine the value of the retrofitted gradient, and the test datasets are used to estimate the RMSD value.
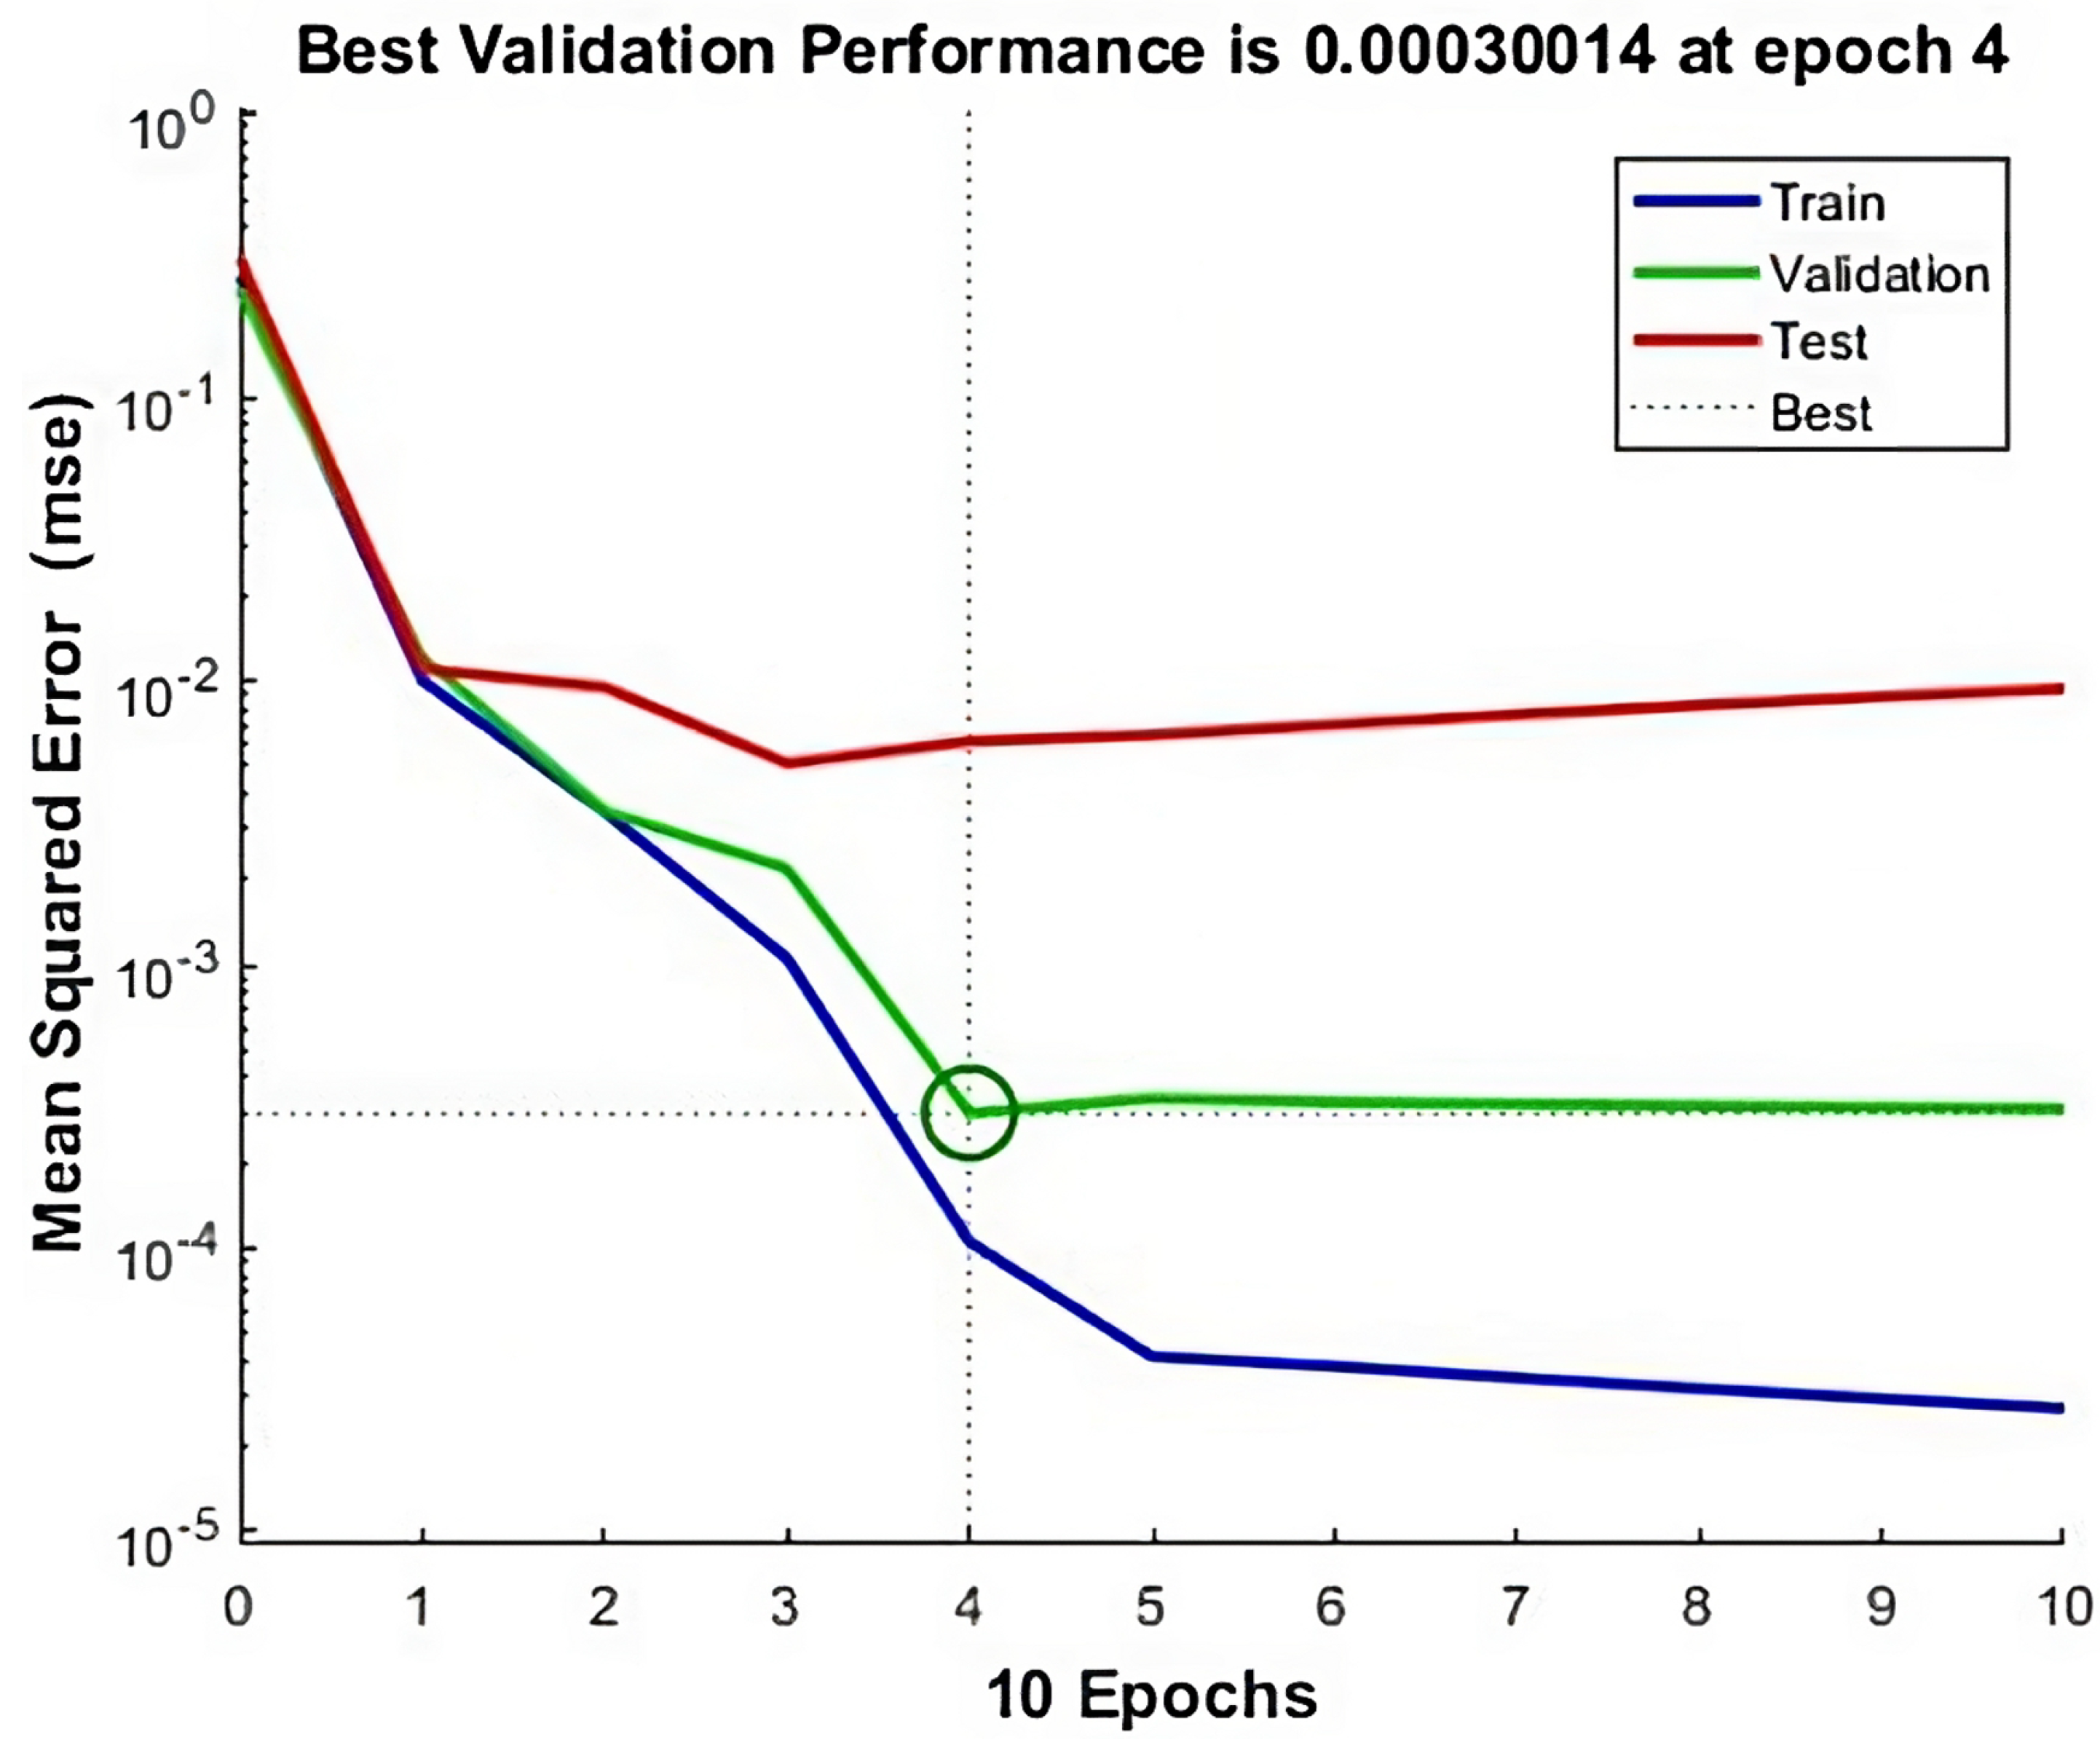
After collecting data, it was necessary to determine the ANN configuration (i.e., the number of neurons and the combination of activation functions) used for the prognostics generation model. Combining both sets of data (those collected for the degradation assessment model and those described previously), we started the training phase, in a trial and error fashion, with an ANN composed of one input and one hidden neuron, combining various activation functions (sigmoid, logit, tanh, etc.) and estimating the root mean square deviation (RMSD) for each trial. The best performance, in terms of the RMSD (e.g., a value of 10–4), was obtained in the considered case study with a neural network composed of ten input neurons and eleven hidden neurons all with a sigmoid activation function (
Figure 4). It should be noted that this configuration allowed for a consistent number of hidden neurons, thereby avoiding the typical ANN over-fitting problem. The MSE of this latter training phase of the artificial neural network is reported in
Figure 5. As the neural network under consideration operates in a regressive mode and not as a classifier, while precision, accuracy, and recall could be evaluated, they are not as relevant as the MSE and RMSD values. Regarding the estimation of synaptic weight, a conventional backpropagation algorithm was used during the training phase.
The resulting ANN was used to predict the future failure probability of the withdraw/release system neglecting the current and future workload. The next phase of the proposed approach is the workload normalisation, where new neural networks should be trained with the failure probability values obtained during the normalisation process, hence taking into consideration previous workload information. To this aim, it is necessary to categorise the possible workload into predefined categories. For the considered case, three different categories were identified: a soft load for baskets less than 300 g, a medium load for baskets between 300 and 600 g, and a heavy load for baskets greater than 600 g. As there are three distinct workloads in the case under consideration, we assume that the workload with the lowest load, or “soft load”, is the workload against which the others are normalised. Hence, two neural networks for normalisation purposes were implemented (each with a single input, three hidden nodes, and a single output). Then, two other additional neural networks (with the same structure) were constructed with the purpose of reconstructing the output for a total of four auxiliary neural networks. The training data for these neural networks were derived from the nine pre-test experiments conducted for the degradation assessment generation phase on three different prototypes of the same type, which operate under constant workloads. In fact, in these cases, the prototypes were used to collect data on operation under constant soft, medium, and heavy loads, respectively.
As a result, after constructing all necessary neural networks, we proceeded to test the proposed approach in an untrained scenario. The purpose of this study was to prove the benefits of including the workload information in the prognostic algorithm. To this aim, two distinct approaches were tested: the first, a traditional approach, in which the approach has been applied up to step 4, i.e., without incorporating workload information; and a second, the proposed approach, in which workload information was fully integrated. As it is possible to see from the results shown in
Table 3, both approaches performed well; however, with the normalisation process of the input and output, the algorithm forecasted the failure probability of the future state with a better performance by an order of magnitude.
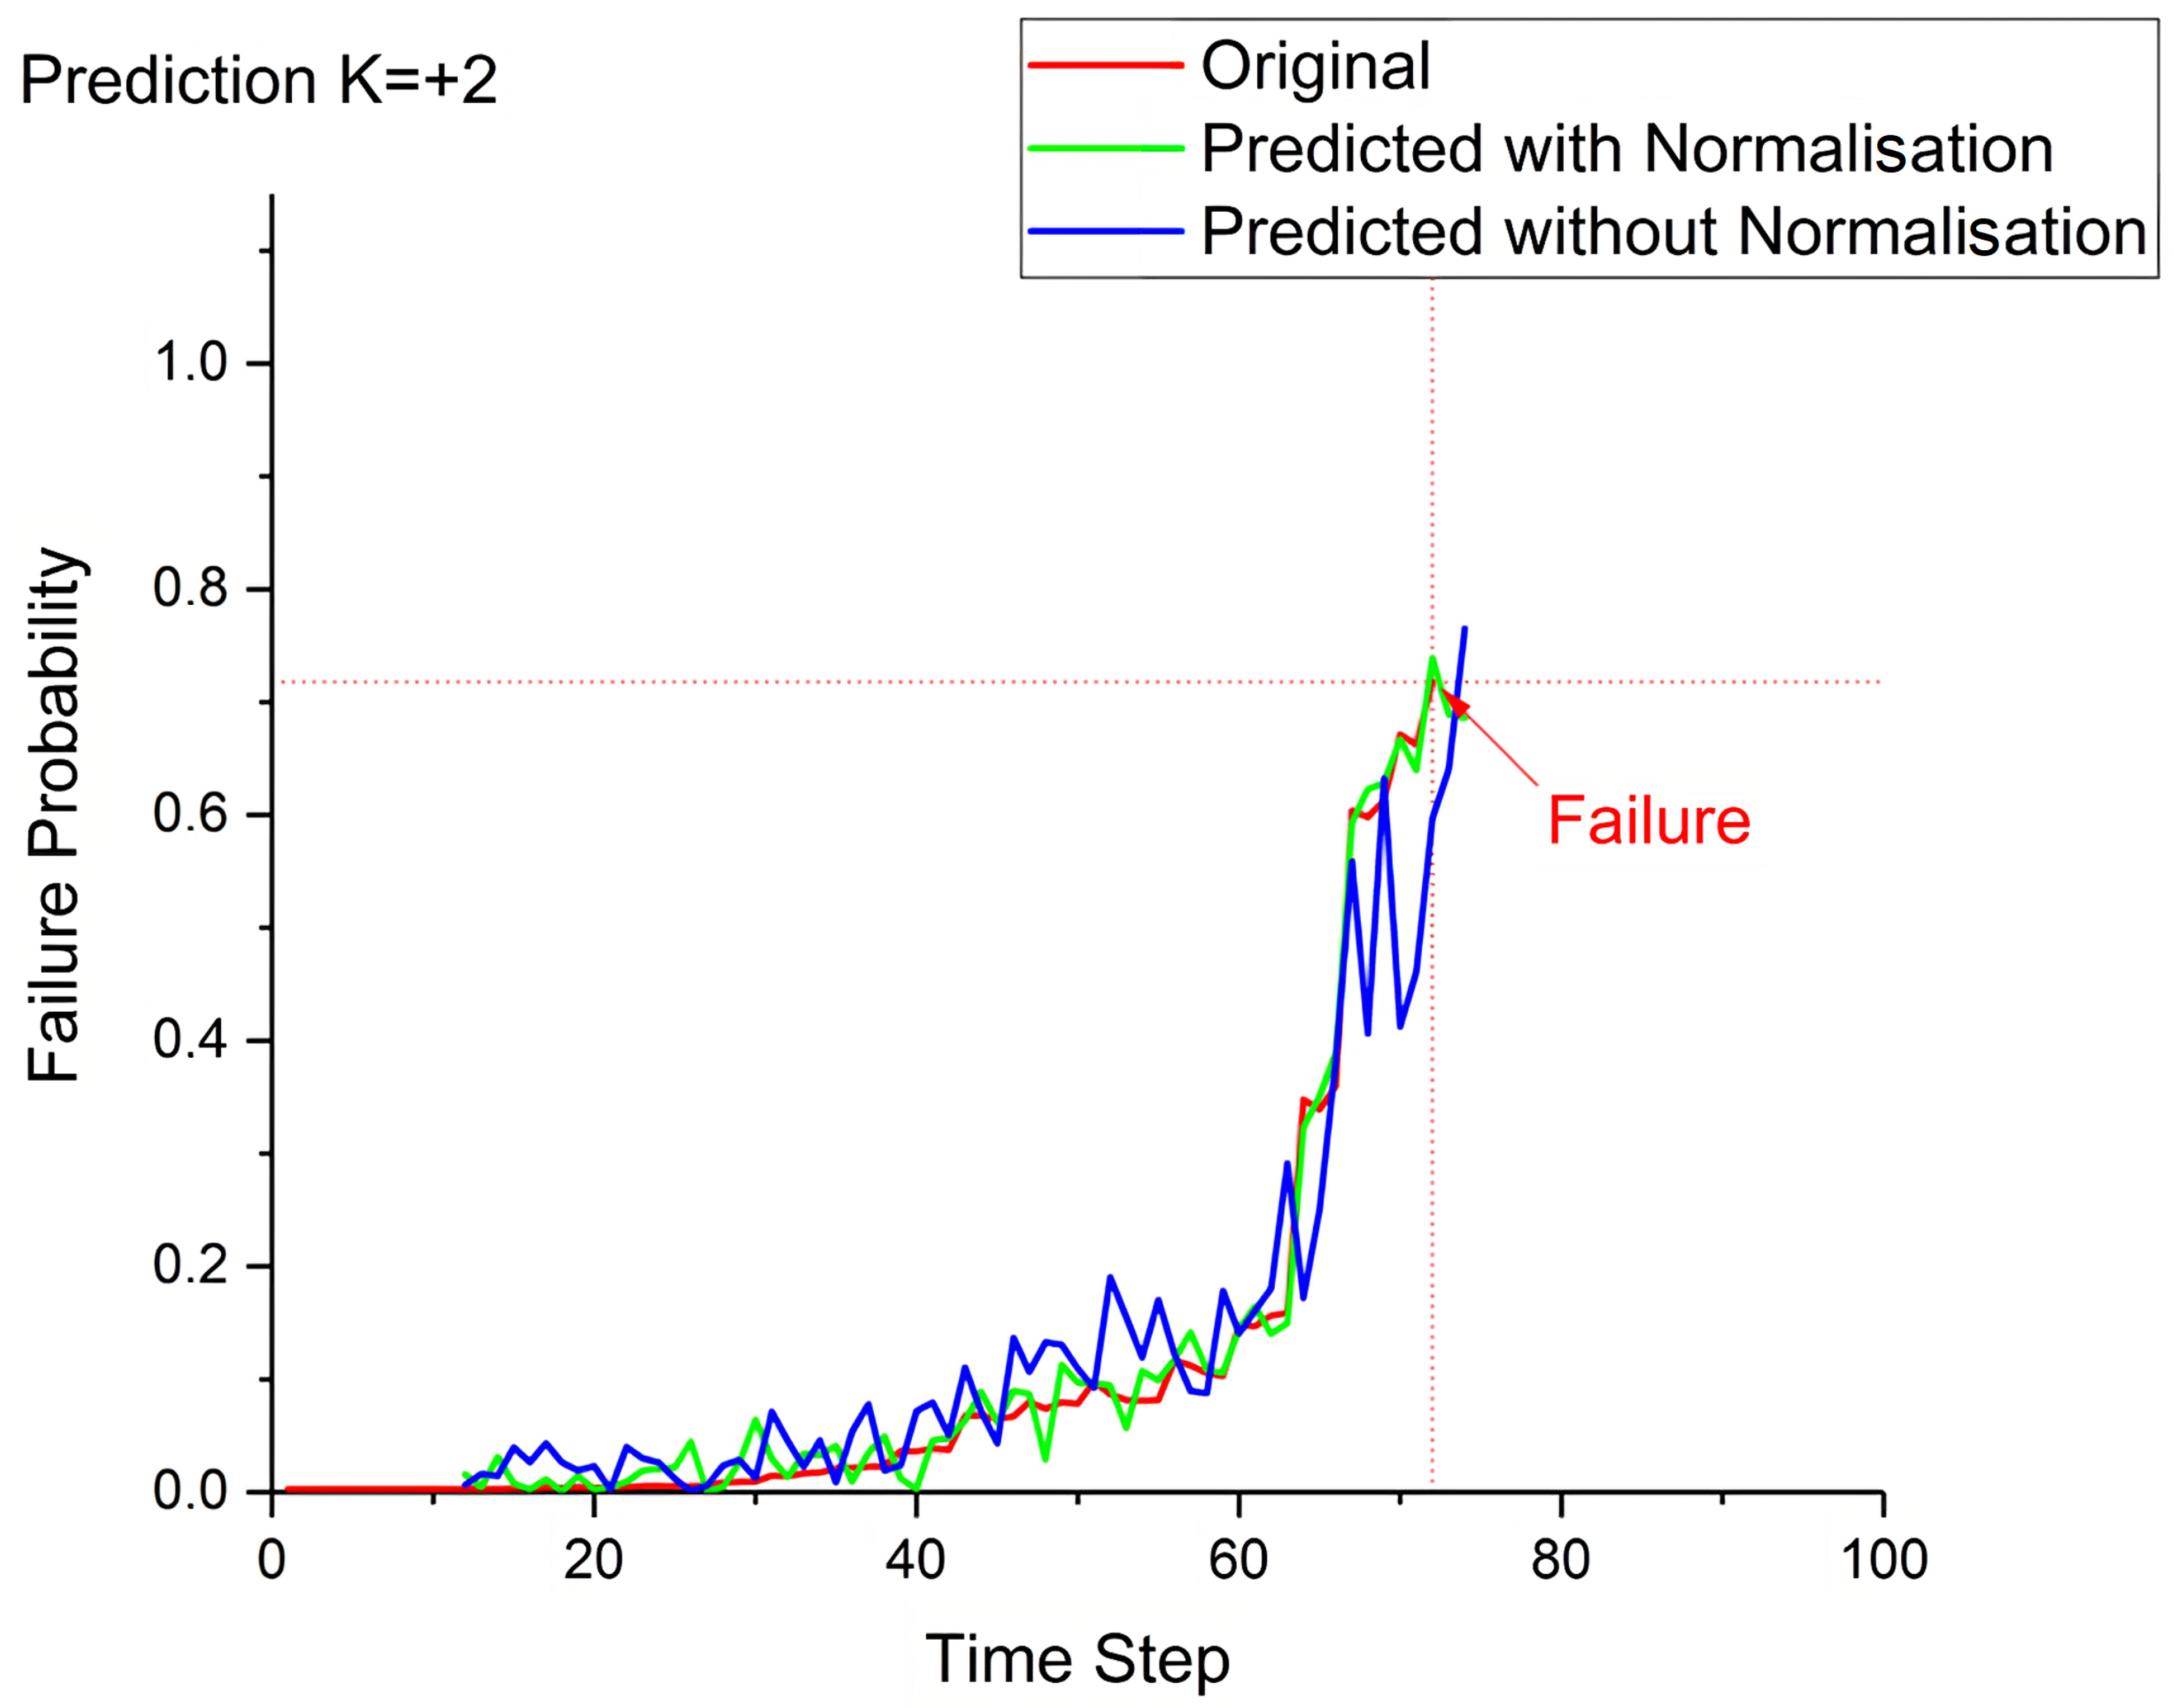
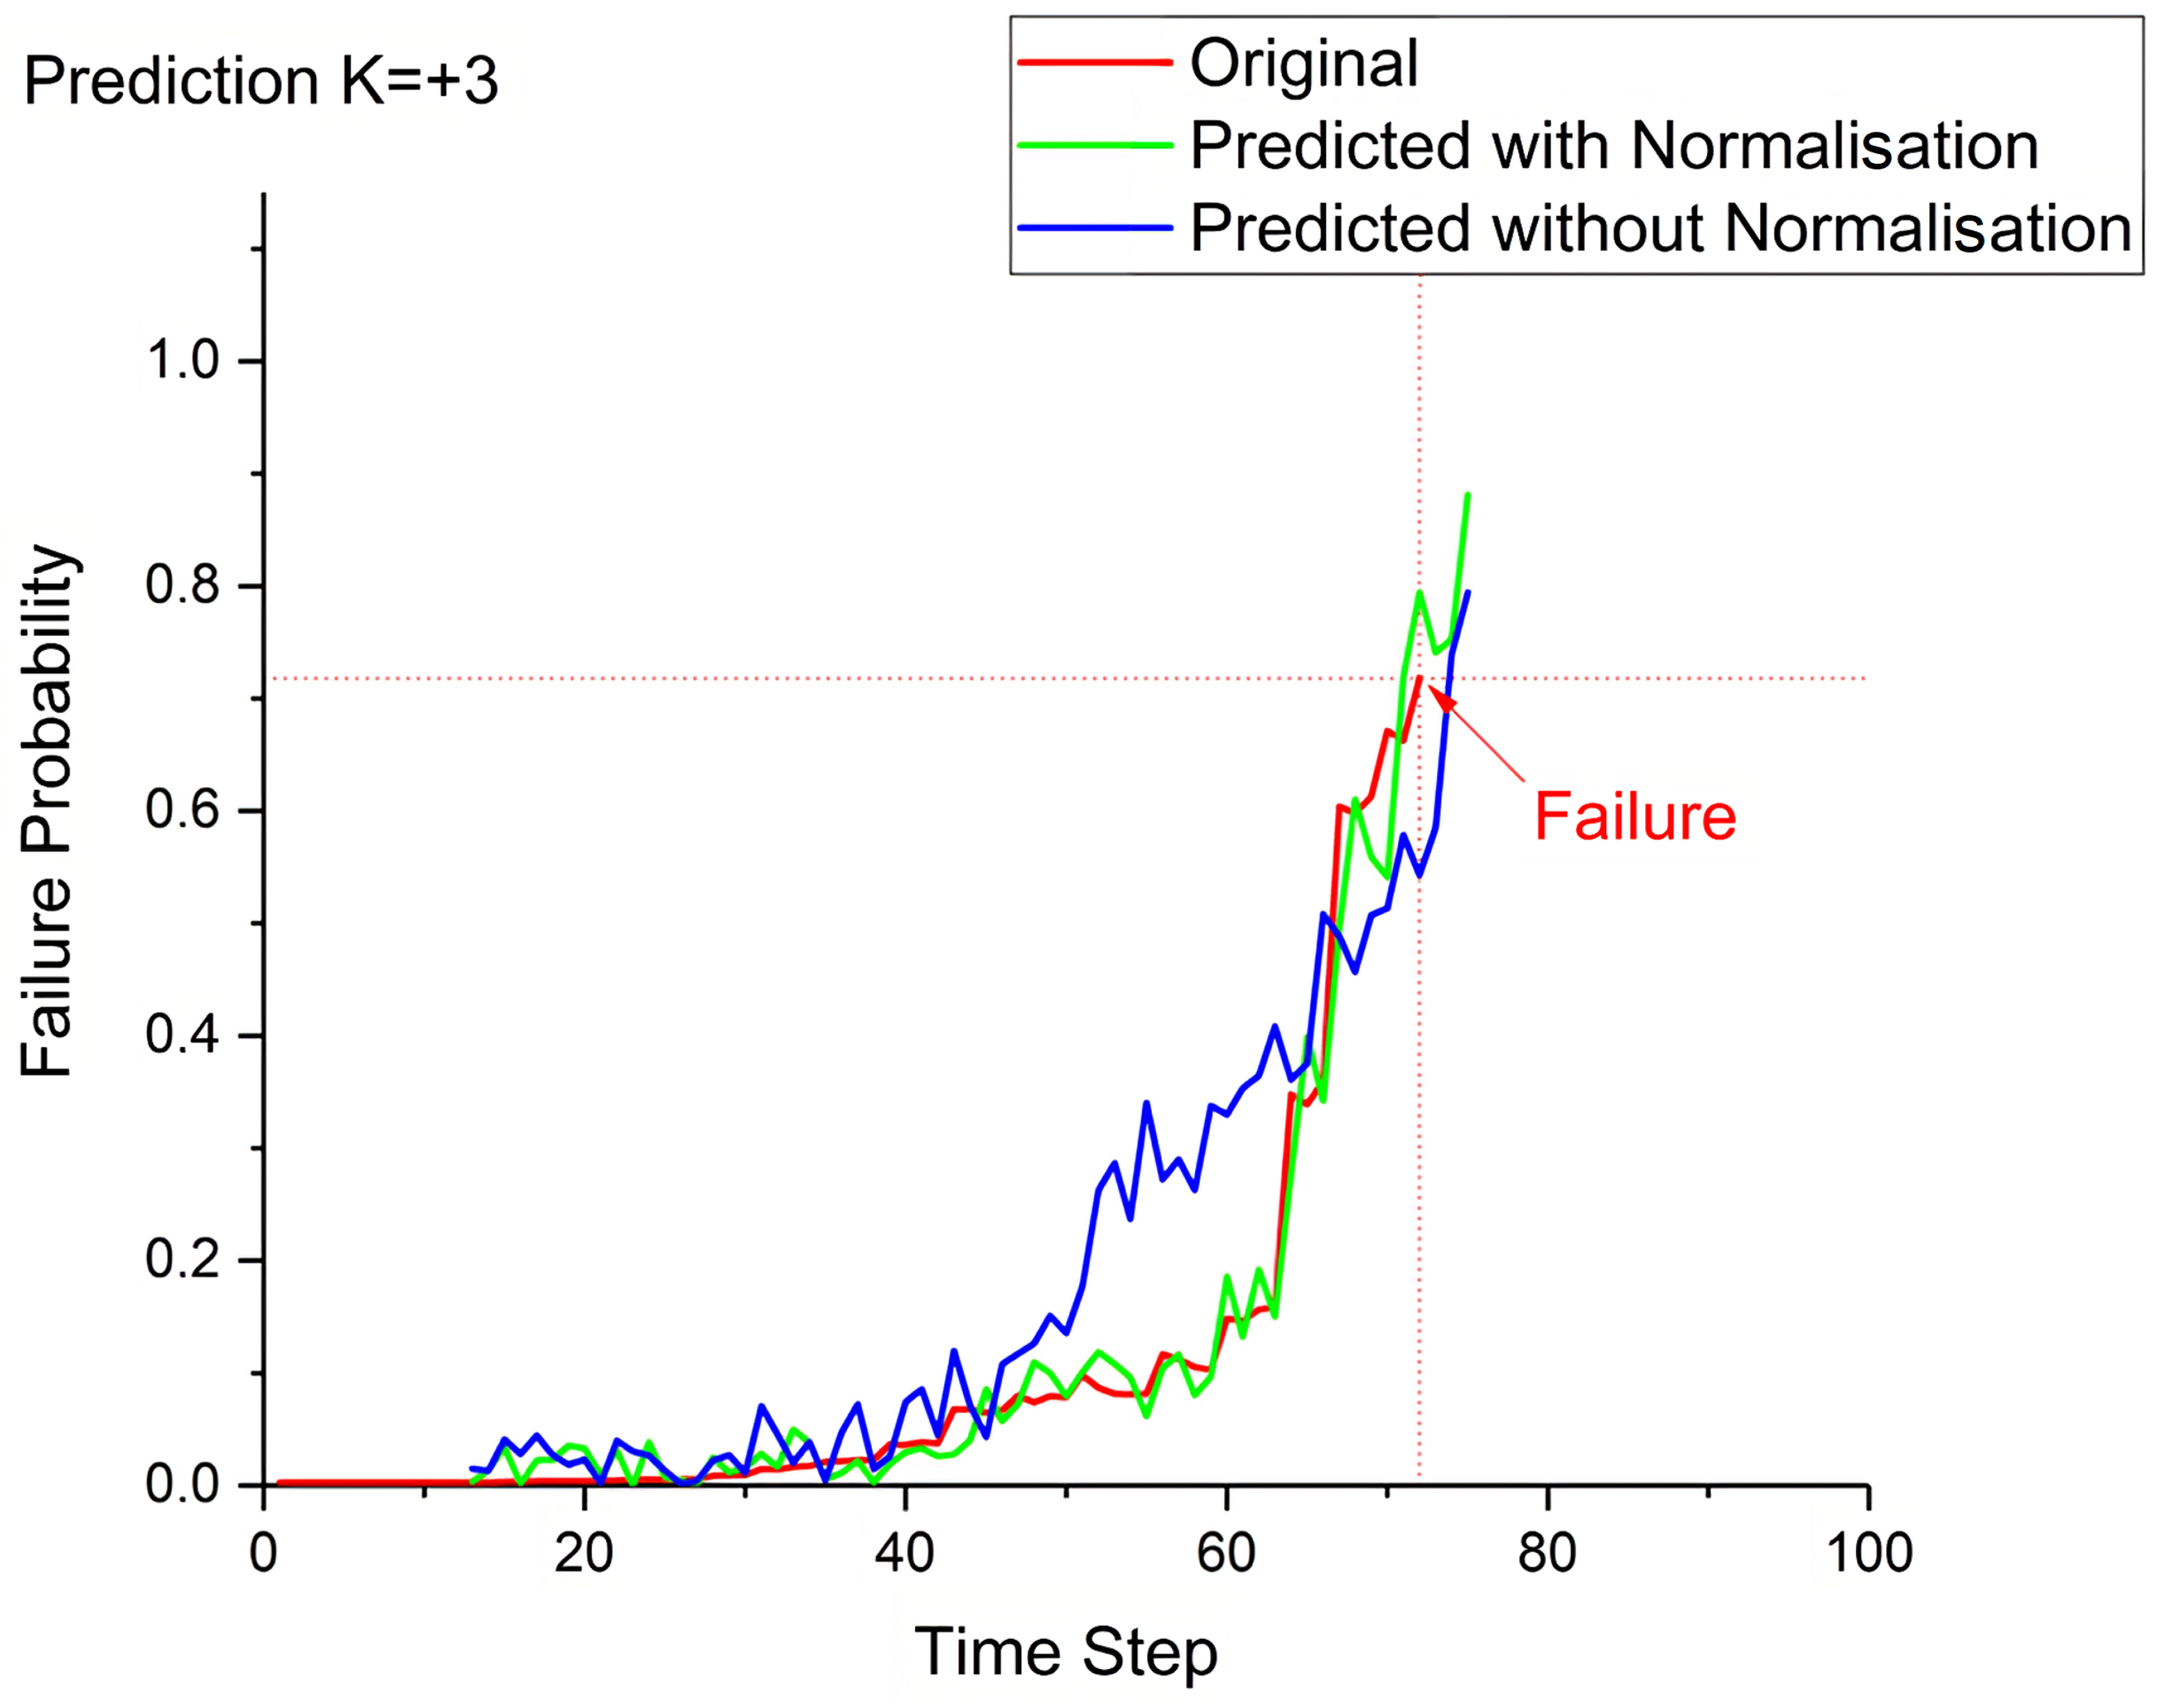
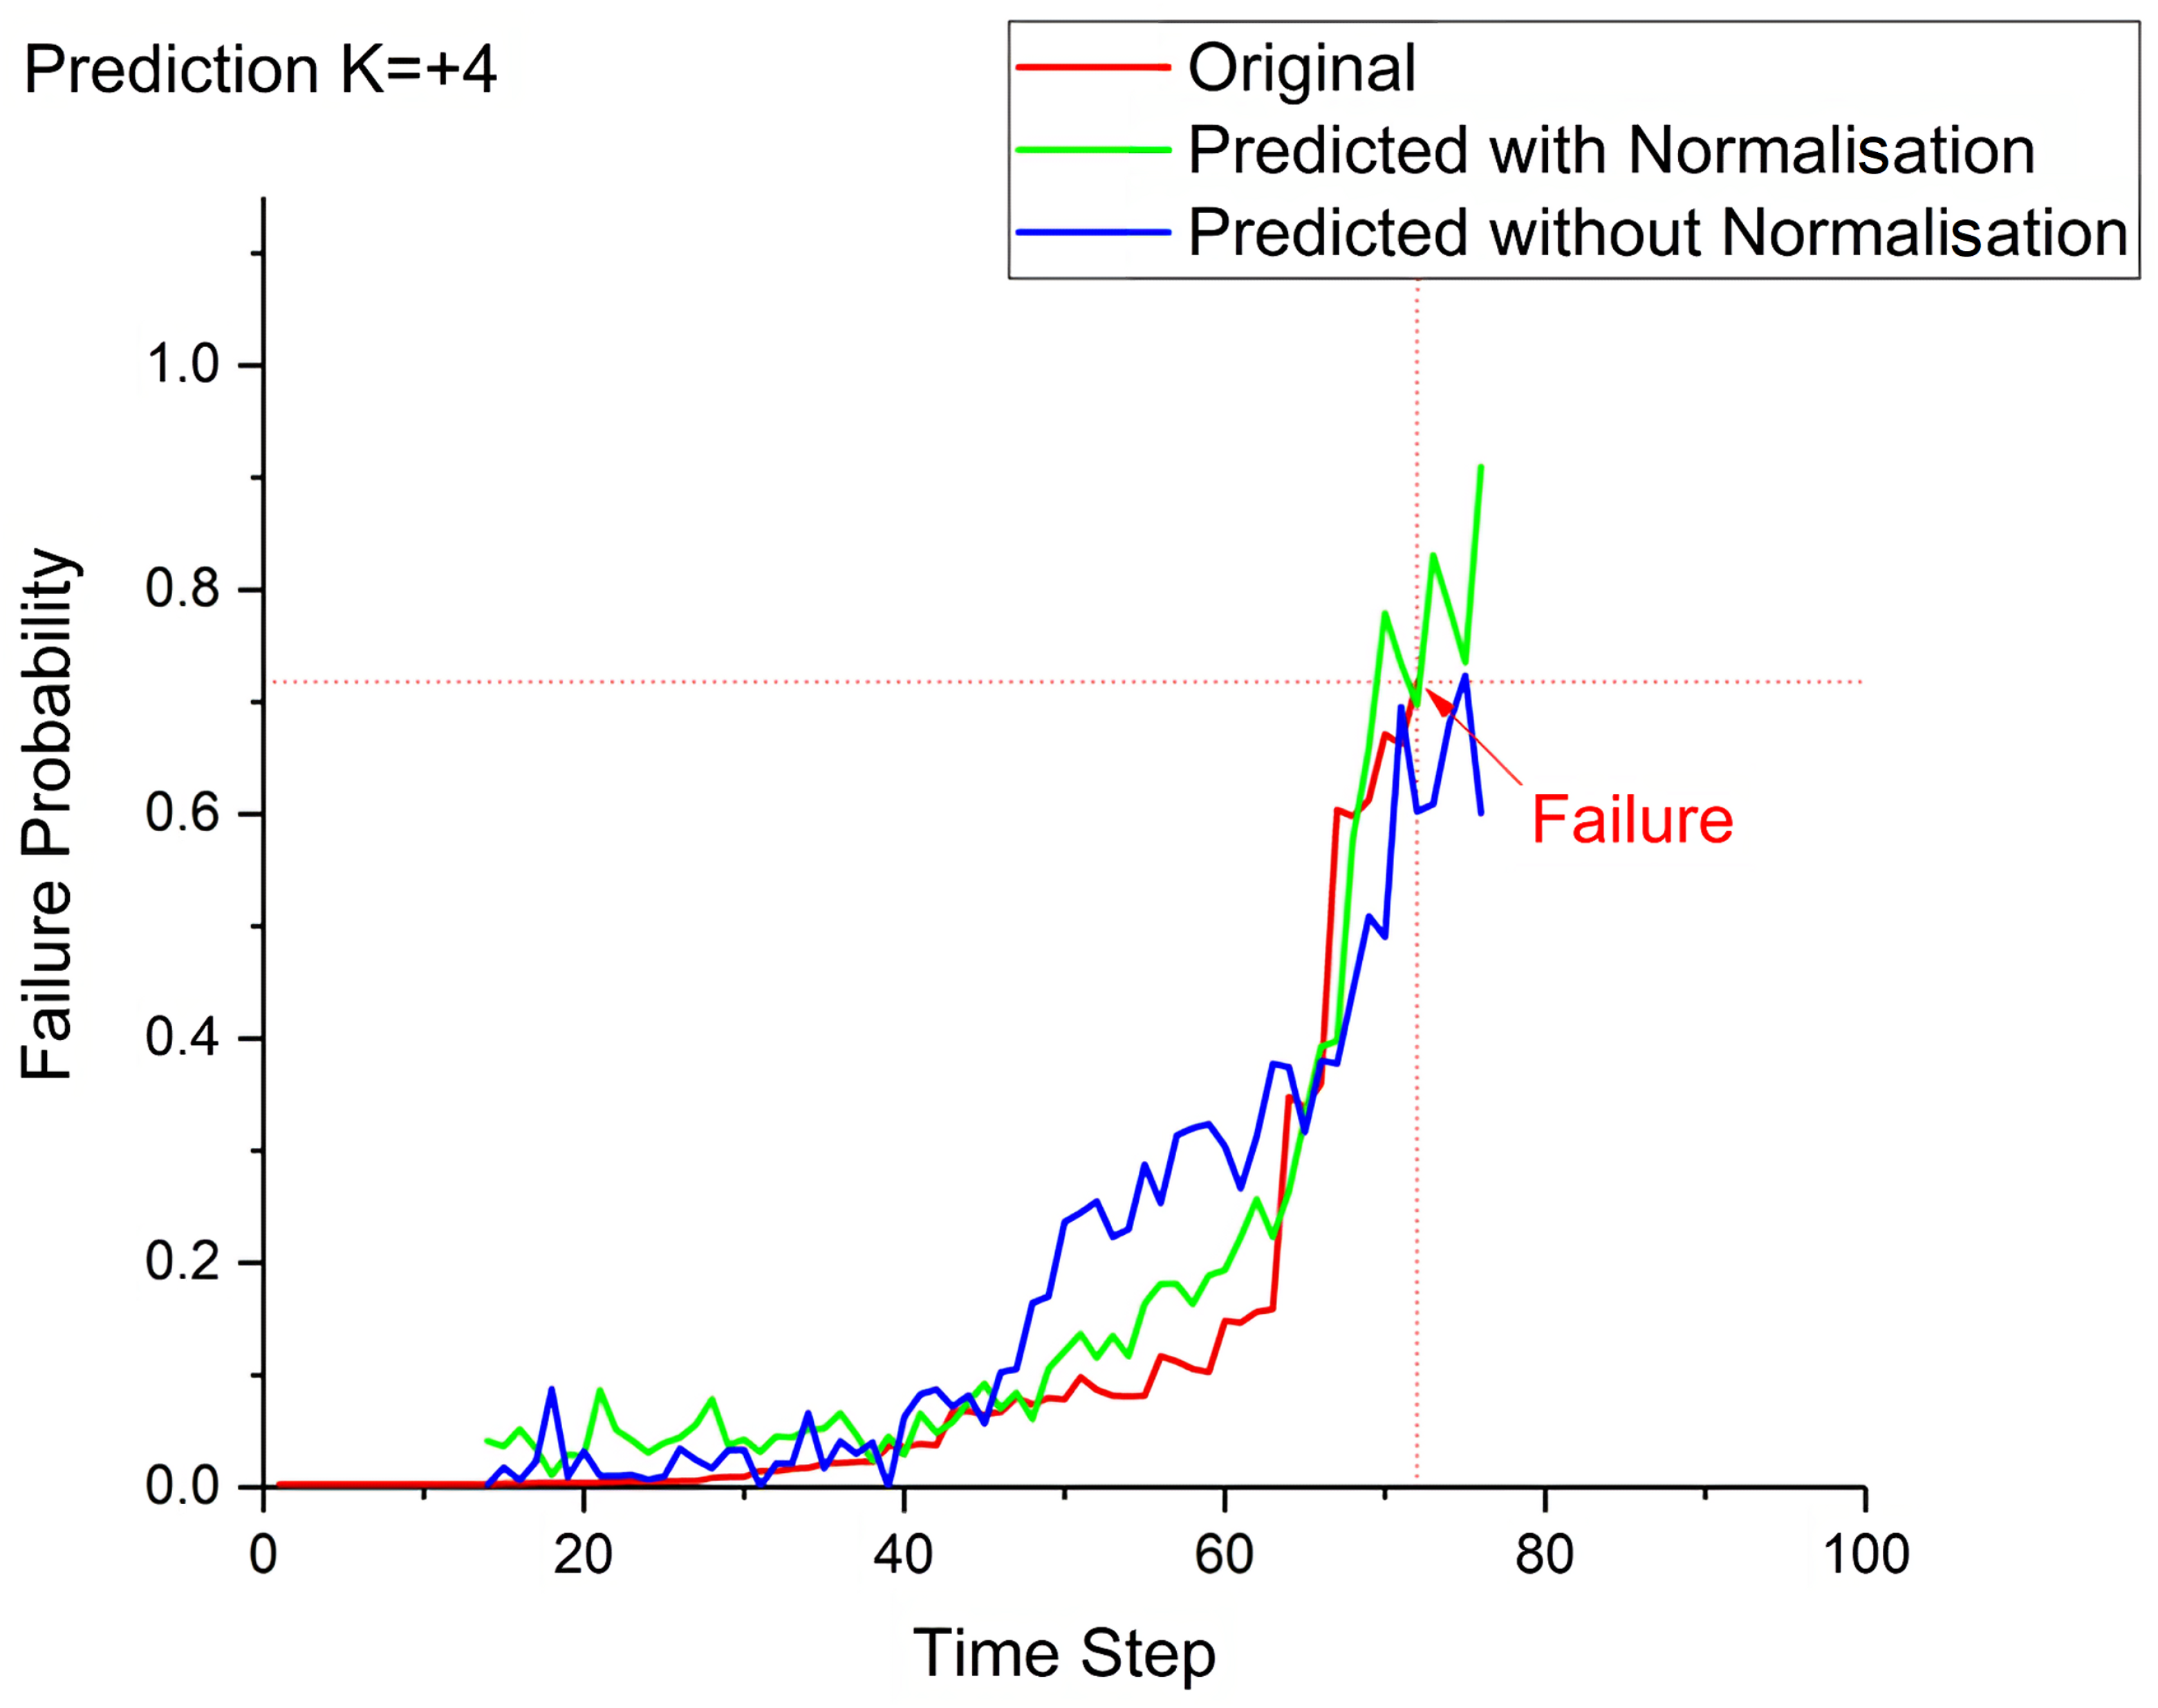
Figure 6,
Figure 7,
Figure 8 and
Figure 9 show the failure probabilities of the given tests with a different range of prediction while, as said,
Table 3 reports the RMSD values of the final estimation calculated according to Equation (
6). These results highlight the improved performance of the predictions in the presence of workload normalisation.
This approach showed that one can use the most traditional prognostic techniques (logistic regression and neural networks) in emerging possible prognostic techniques. However, based on the promising results obtained and demonstrated, it is clear that whenever possible, information on past and future workload is valuable information that is frequently already available for possible use but has not been utilised for this objective. As a result, this paper showed that the use of such information must be considered in future prognostic applications tasked with predicting the state of health of machines subjected to varying magnitudes of loads.
