
Influence of Resins on the Structure and Dynamics of SBR Compounds: A Solid-State NMR Study

 ,
,  , , ,
, , ,  and
and 
Abstract
1. Introduction
2. Materials and Methods
2.1. Samples
2.2. Differential Scanning Calorimetry and Equilibrium Swelling Experiments
2.3. SSNMR Experiments
3. Results and Discussion
3.1. Structural Characterization and Degree of Mixing
3.2. Characterization of Dynamics
4. Conclusions
Supplementary Materials
Author Contributions
Funding
Institutional Review Board Statement
Informed Consent Statement
Data Availability Statement
Acknowledgments
Conflicts of Interest
References
- Rodgers, B.; Waddell, W. Chapter 9—The Science of Rubber Compounding. In The Science and Technology of Rubber, 4th ed.; Mark, J.E., Erman, B., Roland, C.M., Eds.; Academic Press: Boston, MA, USA, 2013; pp. 417–471. [Google Scholar]
- Stuck, B. Tackifying, Curing, and Reinforcing Resins. In Rubber Technology; Carl Hanser Verlag GmbH & Co. KG: München, Germany, 2020; pp. 641–651. [Google Scholar]
- Powers, P.O. Resins Used in Rubber. Rubber Chem. Technol. 1963, 36, 1542–1570. [Google Scholar] [CrossRef]
- Kim, S.W.; Lee, G.H.; Heo, G.S. Identification of Tackifying Resins and Reinforcing Resins in Cured Rubber. Rubber Chem. Technol. 1999, 72, 181–198. [Google Scholar] [CrossRef]
- Aubrey, D.W. The Nature and Action of Tackifier Resins. Rubber Chem. Technol. 1988, 61, 448–469. [Google Scholar] [CrossRef]
- Vleugels, N.; Pille-Wolf, W.; Dierkes, W.K.; Noordermeer, J.W.M. Understanding the Influence of Oligomeric Resins on Traction and Rolling Resistance of Silica-Reinforced Tire Treads. Rubber Chem. Technol. 2015, 88, 65–79. [Google Scholar] [CrossRef]
- Indriasari; Noordermeer, J.; Dierkes, W. Incorporation of Oligomeric Hydrocarbon Resins for Improving the Properties of Aircraft Tire Retreads. Appl. Sci. 2021, 11, 9834. [Google Scholar] [CrossRef]
- Class, J.B.; Chu, S.G. The Viscoelastic Properties of Rubber–Resin Blends. I. The Effect of Resin Structure. J. Appl. Polym. Sci. 1985, 30, 805–814. [Google Scholar] [CrossRef]
- Class, J.B.; Chu, S.G. The Viscoelastic Properties of Rubber–Resin Blends. II. The Effect of Resin Molecular Weight. J. Appl. Polym. Sci. 1985, 30, 815–824. [Google Scholar] [CrossRef]
- Class, J.B.; Chu, S.G. The Viscoelastic Properties of Rubber–Resin Blends. III. The Effect of Resin Concentration. J. Appl. Polym. Sci. 1985, 30, 825–842. [Google Scholar] [CrossRef]
- L’Heveder, S.; Sportelli, F.; Isitman, N.A. Investigation of Solubility in Plasticised Rubber Systems for Tire Applications. Plast. Rubber Compos. 2016, 45, 319–325. [Google Scholar] [CrossRef]
- Lindemann, N.; Finger, S.; Karimi-Varzaneh, H.A.; Lacayo-Pineda, J. Rigidity of Plasticizers and Their Miscibility in Silica-Filled Polybutadiene Rubber by Broadband Dielectric Spectroscopy. J. Appl. Polym. Sci. 2022, 139, 52215. [Google Scholar] [CrossRef]
- Lindemann, N.; Schawe, J.E.K.; Lacayo-Pineda, J. Kinetics of the Glass Transition of Silica-Filled Styrene–Butadiene Rubber: The Effect of Resins. Polymers 2022, 14, 2626. [Google Scholar] [CrossRef]
- Liang, J.; Chang, S.; Feng, N. Effect of C5 Petroleum Resin Content on Damping Behavior, Morphology, and Mechanical Properties of BIIR/BR Vulcanizates. J. Appl. Polym. Sci. 2013, 130, 510–515. [Google Scholar] [CrossRef]
- Yin, C.; Zhao, X.; Zhu, J.; Hu, H.; Song, M.; Wu, S. Experimental and Molecular Dynamics Simulation Study on the Damping Mechanism of C5 Petroleum Resin/Chlorinated Butyl Rubber Composites. J. Mater. Sci. 2019, 54, 3960–3974. [Google Scholar] [CrossRef]
- Guo, Y.; Liu, J.; Lu, Y.; Dong, D.; Wang, W.; Zhang, L. A Combined Molecular Dynamics Simulation and Experimental Method to Study the Compatibility between Elastomers and Resins. RSC Adv. 2018, 8, 14401–14413. [Google Scholar] [CrossRef]
- Dae Han, C.; Kim, J.; Man Baek, D.; Gun Chu, S. Viscoelastic Behavior, Order-Disorder Transition, and Phase Equilibria in Mixtures of a Block Copolymer and an Endblock-Associating Resin. J. Polym. Sci. Part B Polym. Phys. 1990, 28, 315–341. [Google Scholar] [CrossRef]
- Harper, M.; Tardiff, J.; Haakenson, D.; Joandrea, M.; Knych, M. Tire Tread Performance Modification Utilizing Polymeric Additives. SAE Int. J. Veh. Dyn. Stab. NVH 2017, 2, 179–189. [Google Scholar] [CrossRef]
- Hu, X.; Zhang, R.; Wemyss, A.M.; Du, A.; Bao, X.; Geng, X.; Wan, C. Damping and Electromechanical Behavior of Ionic-Modified Brominated Poly(Isobutylene- Co -Isoprene) Rubber Containing Petroleum Resin C5. Ind. Eng. Chem. Res. 2022, 61, 3063–3074. [Google Scholar] [CrossRef]
- Ye, N.; Wu, Z.; Wu, X.; Lu, Y.; Zhang, L. Performance Enhancement of Polymerized, Functionalized Solution Styrene–Butadiene Rubber Composites Using Oligomeric Resin towards Extremely Safe and Energy-Saving Tires. Polymers 2022, 14, 2928. [Google Scholar] [CrossRef]
- Wu, C.; Wu, G.; Wu, C. Dynamic Mechanical Properties in Blends of Poly(Styrene-b-Isoprene-b-Styrene) with Aromatic Hydrocarbon Resin. J. Appl. Polym. Sci. 2006, 102, 4157–4164. [Google Scholar] [CrossRef]
- Schmidt-Rohr, K.; Spiess, H.W. Multidimensional Solid-State NMR and Polymers; Elsevier: Amsterdam, The Netherlands, 1994. [Google Scholar]
- Saalwächter, K.; Spiess, H.W. Solid-State NMR of Polymers. In Polymer Science: A Comprehensive Reference; Matyjaszewski, K., Möller, M., Eds.; Elsevier: Amsterdam, The Netherlands, 2012; pp. 185–219. [Google Scholar]
- Saalwächter, K.; Reichert, D. Polymer Applications of NMR. Encycl. Spectrosc. Spectrom. 2016, 695–708. [Google Scholar] [CrossRef]
- Zhang, R.; Miyoshi, T.; Sun, P. NMR Methods for Characterization of Synthetic and Natural Polymers; Royal Society of Chemistry: London, UK, 2019. [Google Scholar]
- Müller, K.; Geppi, M. Chapter 8—Application of SSNMR to Selected Classes of Systems. In Solid State NMR: Principles, Methods and Applications; Wiley-VCH: Weinheim, Germany, 2021; pp. 447–530. [Google Scholar]
- Saalwächter, K. Microstructure and Molecular Dynamics of Elastomers as Studied By Advanced Low-Resolution Nuclear Magnetic Resonance Methods. Rubber Chem. Technol. 2012, 85, 350–386. [Google Scholar] [CrossRef]
- Besghini, D.; Mauri, M.; Simonutti, R. Time Domain NMR in Polymer Science: From the Laboratory to the Industry. Appl. Sci. 2019, 9, 1801. [Google Scholar] [CrossRef]
- Geppi, M.; Harris, R.K.; Kenwright, A.M.; Say, B.J. A Method for Analysing Proton NMR Relaxation Data from Motionally Heterogeneous Polymer Systems. Solid State Nucl. Magn. Reson. 1998, 12, 15–20. [Google Scholar] [CrossRef] [PubMed]
- Forte, C.; Geppi, M.; Malvaldi, M.; Mattoli, V. Dynamics of an Amorphous Polymer by an Improved NMR Approach Based on the Simultaneous Analysis of 1H and 13C Relaxation Times. J. Phys. Chem. B 2004, 108, 10832–10837. [Google Scholar] [CrossRef]
- Martini, F.; Borsacchi, S.; Spera, S.; Carbonera, C.; Cominetti, A.; Geppi, M. P3HT/PCBM Photoactive Materials for Solar Cells: Morphology and Dynamics by Means of Solid-State NMR. J. Phys. Chem. C 2013, 117, 131–139. [Google Scholar] [CrossRef]
- TECHNICAL DATA SHEET Kristalex™ 5140 Hydrocarbon Resin. Available online: www.synthomer.com/Media/tds/Kristalex%205140%20Hydrocarbon%20Resin.pdf (accessed on 23 January 2023).
- Saville, B.; Watson, A.A. Structural Characterization of Sulfur-Vulcanized Rubber Networks. Rubber Chem. Technol. 1967, 40, 100–148. [Google Scholar] [CrossRef]
- Mathematica, Version 12; Wolfram Research, Inc.: Champaign, IL, USA, 2010.
- Maus, A.; Hertlein, C.; Saalwächter, K. A Robust Proton NMR Method to Investigate Hard/Soft Ratios, Crystallinity, and Component Mobility in Polymers. Macromol. Chem. Phys. 2006, 207, 1150–1158. [Google Scholar] [CrossRef]
- Papon, A.; Saalwächter, K.; Schäler, K.; Guy, L.; Lequeux, F.; Montes, H. Low-Field NMR Investigations of Nanocomposites: Polymer Dynamics and Network Effects. Macromolecules 2011, 44, 913–922. [Google Scholar] [CrossRef]
- Räntzsch, V.; Haas, M.; Özen, M.B.; Ratzsch, K.F.; Riazi, K.; Kauffmann-Weiss, S.; Palacios, J.K.; Müller, A.J.; Vittorias, I.; Guthausen, G.; et al. Polymer Crystallinity and Crystallization Kinetics via Benchtop 1H NMR Relaxometry: Revisited Method, Data Analysis, and Experiments on Common Polymers. Polymer 2018, 145, 162–173. [Google Scholar] [CrossRef]
- Borsacchi, S.; Sudhakaran, U.P.; Calucci, L.; Martini, F.; Carignani, E.; Messori, M.; Geppi, M. Rubber-Filler Interactions in Polyisoprene Filled with in Situ Generated Silica: A Solid State NMR Study. Polymers 2018, 10, 822. [Google Scholar] [CrossRef]
- Nardelli, F.; Martini, F.; Lee, J.; Lluvears-Tenorio, A.; La Nasa, J.; Duce, C.; Ormsby, B.; Geppi, M.; Bonaduce, I. The Stability of Paintings and the Molecular Structure of the Oil Paint Polymeric Network. Sci. Rep. 2021, 11, 1–13. [Google Scholar] [CrossRef]
- Perez, M.G.; Lima, A.P.; Moraes, T.B.; Chaves, E.G.; Ruiz, N.M.D.S.; dos Santos Teixeira, S.C.; Honorato, H.D.A.; de Menezes, S.M.C.; deAzevedo, E.R. 1H Time Domain NMR to Probe Microstructural and Mobility Changes in Polyamide 11 Exposed to H2S Scavengers. What Type of Information Can Be Assessed? Polym. Degrad. Stab. 2022, 202, 110001. [Google Scholar] [CrossRef]
- Schäler, K.; Roos, M.; Micke, P.; Golitsyn, Y.; Seidlitz, A.; Thurn-Albrecht, T.; Schneider, H.; Hempel, G.; Saalwächter, K. Basic Principles of Static Proton Low-Resolution Spin Diffusion NMR in Nanophase-Separated Materials with Mobility Contrast. Solid State Nucl. Magn. Reson. 2015, 72, 50–63. [Google Scholar] [CrossRef]
- Hansen, E.W.; Kristiansen, P.E.; Pedersen, B. Crystallinity of Polyethylene Derived from Solid-State Proton NMR Free Induction Decay. J. Phys. Chem. B 1998, 102, 5444–5450. [Google Scholar] [CrossRef]
- Abragam, A. The Principles of Nuclear Magnetism; Clarendon Press: Oxford, UK; London, UK, 1961. [Google Scholar]
- Doi, M.; Edwards, S.F. The Theory of Polymer Dynamics; Science Publication: Oxford, UK; London, UK, 1986. [Google Scholar]
- de Gennes, P.G. Reptation of a Polymer Chain in the Presence of Fixed Obstacles. J. Chem. Phys. 1971, 55, 572–579. [Google Scholar] [CrossRef]
- Rouse, P.E. A Theory of the Linear Viscoelastic Properties of Dilute Solutions of Coiling Polymers. J. Chem. Phys. 1953, 21, 1272–1280. [Google Scholar] [CrossRef]
- Kimmich, R.; Fatkullin, N. Polymer Chain Dynamics and NMR. Adv. Polym. Sci. 2004, 170, 1–113. [Google Scholar] [CrossRef]
- Stapf, S.; Lozovoi, A. Chapter 13. Field-Cycling Relaxometry of Polymers. In Field-Cycling NMR Relaxometry; Kimmich, R., Ed.; The Royal Society of Chemistry: Cambridge, UK, 2018; pp. 322–357. [Google Scholar]
- Kariyo, S.; Stapf, S. Influence of Cross-Link Density and Deformation on the NMR Relaxation Dispersion of Natural Rubber. Macromolecules 2002, 35, 9253–9255. [Google Scholar] [CrossRef]
- Kariyo, S.; Stapf, S. NMR Relaxation Dispersion of Vulcanized Natural Rubber. Solid State Nucl. Magn. Reson. 2004, 25, 64–71. [Google Scholar] [CrossRef]
- Kariyo, S.; Stapf, S. Restricted Molecular Dynamics of Polymer Chains by Means of NMR Field Cycling Relaxometry. Macromol. Chem. Phys. 2005, 206, 1300–1310. [Google Scholar] [CrossRef]
- Martini, F.; Carignani, E.; Nardelli, F.; Rossi, E.; Borsacchi, S.; Cettolin, M.; Susanna, A.; Geppi, M.; Calucci, L. Glassy and Polymer Dynamics of Elastomers by 1H Field-Cycling NMR Relaxometry: Effects of Cross-Linking. Macromolecules 2020, 53, 10028–10039. [Google Scholar] [CrossRef] [PubMed]
- Nardelli, F.; Martini, F.; Carignani, E.; Rossi, E.; Borsacchi, S.; Cettolin, M.; Susanna, A.; Arimondi, M.; Giannini, L.; Geppi, M.; et al. Glassy and Polymer Dynamics of Elastomers by 1H-Field-Cycling NMR Relaxometry: Effects of Fillers. J. Phys. Chem. B 2021, 125, 4546–4554. [Google Scholar] [CrossRef] [PubMed]
- Nardelli, F.; Calucci, L.; Carignani, E.; Borsacchi, S.; Cettolin, M.; Arimondi, M.; Giannini, L.; Geppi, M.; Martini, F. Influence of Sulfur-Curing Conditions on the Dynamics and Crosslinking of Rubber Networks: A Time-Domain NMR Study. Polymers 2022, 14, 767. [Google Scholar] [CrossRef] [PubMed]
- Ferry, J.D. Viscoelastic Properties of Polymers, 3rd ed.; John Wiley & Sons: New York, NY, USA, 1980. [Google Scholar]
- Ding, Y.; Sokolov, A.P. Breakdown of Time−Temperature Superposition Principle and Universality of Chain Dynamics in Polymers. Macromolecules 2006, 39, 3322–3326. [Google Scholar] [CrossRef]
- Blochowicz, T.; Gainaru, C.; Medick, P.; Tschirwitz, C.; Rössler, E.A. The Dynamic Susceptibility in Glass Forming Molecular Liquids: The Search for Universal Relaxation Patterns II. J. Chem. Phys. 2006, 124, 134503. [Google Scholar] [CrossRef]
- Kremer, F.; Schönhals, A. Broadband Dielectric Spectroscopy; Kremer, F., Schönhals, A., Eds.; Springer: Berlin/Heidelberg, Germany; New York, NY, USA, 2003. [Google Scholar]


| Component | SBR and vSBR | SBR_k and vSBR_k |
|---|---|---|
| Styrene/butadiene rubber | 100 | 100 |
| TDAE | 37.5 | 37.5 |
| Carbon black | 45 | 45 |
| Sulfur | 2 | 2 |
| CBS | 4 | 4 |
| Zinc oxide | 3.5 | 3.5 |
| Stearic acid | 2 | 2 |
| Kristalex™ 5140 | 0 | 15 |
| Sample | Tg (K) | 1/Mc (10−5 mol/g) |
|---|---|---|
| SBR | 246 | - |
| SBR_k | 249 | - |
| vSBR | 253 | 1.80 |
| vSBR_k | 257 | 1.38 |
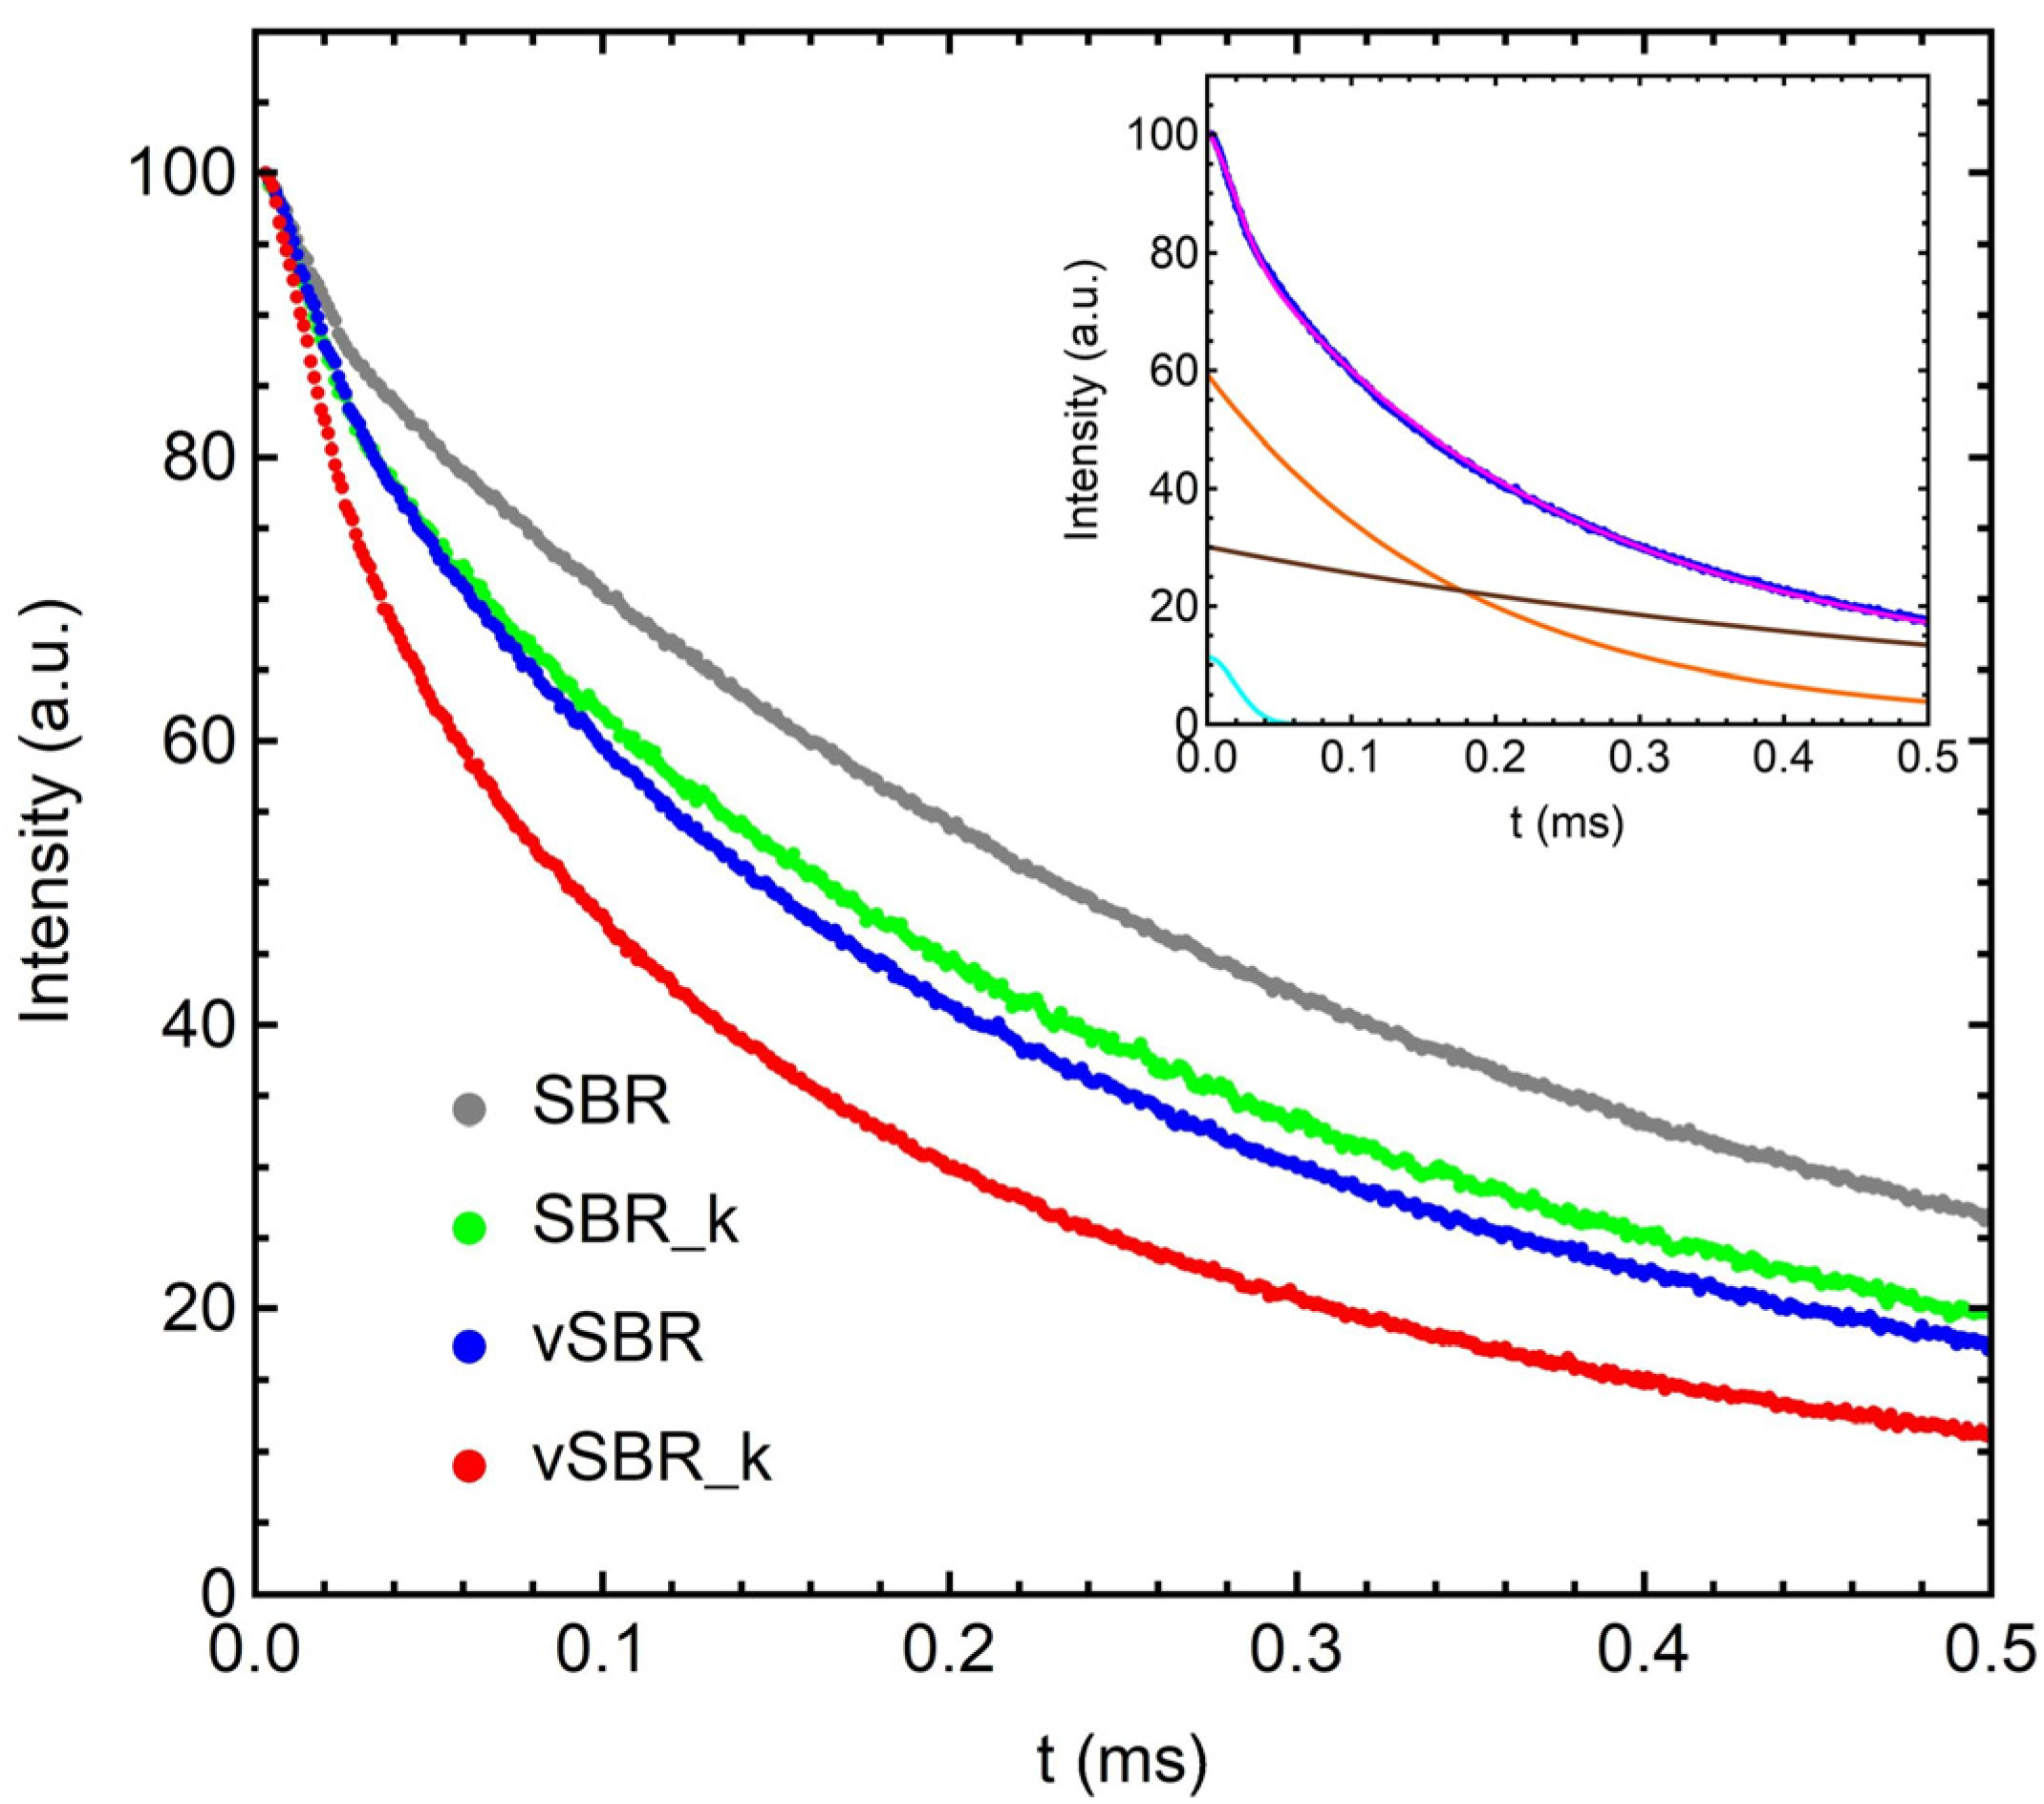
| Sample | Wg (%) | We1 (%) | We2 (%) | T2,g (μs) | T2,e1 (μs) | T2,e2 (μs) |
|---|---|---|---|---|---|---|
| SBR | 8 | 65 | 27 | 22 | 296 | 773 |
| SBR_k | 13 | 56 | 31 | 25 | 216 | 607 |
| vSBR | 11 | 59 | 30 | 27 | 183 | 615 |
| vSBR_k | 19 | 57 | 24 | 26 | 139 | 535 |
Disclaimer/Publisher’s Note: The statements, opinions and data contained in all publications are solely those of the individual author(s) and contributor(s) and not of MDPI and/or the editor(s). MDPI and/or the editor(s) disclaim responsibility for any injury to people or property resulting from any ideas, methods, instructions or products referred to in the content. |
© 2023 by the authors. Licensee MDPI, Basel, Switzerland. This article is an open access article distributed under the terms and conditions of the Creative Commons Attribution (CC BY) license (https://creativecommons.org/licenses/by/4.0/).
Share and Cite
Pierigé, M.; Nerli, F.; Nardelli, F.; Calucci, L.; Cettolin, M.; Giannini, L.; Geppi, M.; Martini, F. Influence of Resins on the Structure and Dynamics of SBR Compounds: A Solid-State NMR Study. Appl. Sci. 2023, 13, 1939. https://doi.org/10.3390/app13031939
Pierigé M, Nerli F, Nardelli F, Calucci L, Cettolin M, Giannini L, Geppi M, Martini F. Influence of Resins on the Structure and Dynamics of SBR Compounds: A Solid-State NMR Study. Applied Sciences. 2023; 13(3):1939. https://doi.org/10.3390/app13031939
Chicago/Turabian StylePierigé, Michele, Francesca Nerli, Francesca Nardelli, Lucia Calucci, Mattia Cettolin, Luca Giannini, Marco Geppi, and Francesca Martini. 2023. "Influence of Resins on the Structure and Dynamics of SBR Compounds: A Solid-State NMR Study" Applied Sciences 13, no. 3: 1939. https://doi.org/10.3390/app13031939
APA StylePierigé, M., Nerli, F., Nardelli, F., Calucci, L., Cettolin, M., Giannini, L., Geppi, M., & Martini, F. (2023). Influence of Resins on the Structure and Dynamics of SBR Compounds: A Solid-State NMR Study. Applied Sciences, 13(3), 1939. https://doi.org/10.3390/app13031939