Abstract
Periodontitis is one of the most prevalent diseases worldwide. The degree of radiographic bone loss can be used to assess the course of therapy or the severity of the disease. Since automated bone loss detection has many benefits, our goal was to develop a multi-object detection algorithm based on artificial intelligence that would be able to detect and quantify radiographic bone loss using standard two-dimensional radiographic images in the maxillary posterior region. This study was conducted by combining three recent online databases and validating the results using an external validation dataset from our organization. There were 1414 images for training and testing and 341 for external validation in the final dataset. We applied a Keypoint RCNN with a ResNet-50-FPN backbone network for both boundary box and keypoint detection. The intersection over union (IoU) and the object keypoint similarity (OKS) were used for model evaluation. The evaluation of the boundary box metrics showed a moderate overlapping with the ground truth, revealing an average precision of up to 0.758. The average precision and recall over all five folds were 0.694 and 0.611, respectively. Mean average precision and recall for the keypoint detection were 0.632 and 0.579, respectively. Despite only using a small and heterogeneous set of images for training, our results indicate that the algorithm is able to learn the objects of interest, although without sufficient accuracy due to the limited number of images and a large amount of information available in panoramic radiographs. Considering the widespread availability of panoramic radiographs as well as the increasing use of online databases, the presented model can be further improved in the future to facilitate its implementation in clinics.
1. Introduction
Periodontitis is a chronic, complex, multifactorial, inflammatory disease of the periodontium and is caused by dysbiosis between the microbial biofilm and the host inflammatory response [1]. The clinical feature, in addition to the inflammatory changes, is the regression of the tooth attachment apparatus (attachment loss, clinical attachment loss; CAL) [2]. Periodontitis is one of the most prevalent diseases in the world [3]. As a result of alveolar bone loss and tooth loss as well as disorders and limitations of chewing ability, the health care system is faced with high socioeconomic costs [4,5].
A common method used to assess the progression of the disease is the measurement of clinical attachment loss (CAL), which is determined by utilizing the pocket depth and the marginal gingival level [2]. There are, however, differences in methodologies, instruments, applied forces, and techniques that limit the reproducibility of this method [6,7]. Although the reproducibility of this method can vary between examiners, there are rules that clinicians should/must follow to standardize those values as much as possible. There is also a range of discrepancies established from classic papers in the field of periodontology considering various parameters such as the diameter, the force used, the angle, the positioning of the probe, and the current state of inflammation of the tissue examined [7,8]. The radiological measurement can be a valuable tool for a more objective diagnosis for planning therapy. Radiological examination of bone loss alterations often include the measurement of the length from the marginal alveolar bone to the tooth apex or the measurements from the cementoenamel junction to the tooth apex [9]. These measurements are characterized by better predictability and a more accurate examination modality in certain cases [2,10]. However, in the early phase of periodontal disease, it is not a reliable method to detect the first signs or small changes due to the delayed bone reaction and the necessary extent of demineralization that has occurred [2,10]. Panoramic radiographs are one of the most commonly used imaging techniques in dentistry. Compared with three-dimensional imaging, it offers many advantages such as widespread availability, low radiation exposure, and a good overview of the most important structures in the maxilla and mandible [11,12]. The use of two-dimensional radiographic images is a common diagnostic tool in the assessment of periodontitis [13], a disease that results in the loss of periodontal attachment, and consequently, visible bone loss. The degree of radiographic bone loss can be used to assess the course of therapy or the severity of the disease [14]. It is necessary to initiate or adjust treatment if the bone loss exceeds a certain level within a specified period of time. Various factors can contribute to bone loss around teeth and implants including prosthetic restorations, infections, or an imbalance of the immune system, leading to proinflammatory reactions [15,16]. An assessment of severity based on clinical radiograph images requires both radiological and clinical experience as well as a standardized methodology. Radiographic measurements must be accurate, as even a difference of one to two millimeters is considered a significant deviation in bone loss measurements [15,17]. Cone beam computer tomography (CBCT) enables a more precise assessment of bone morphology via three-dimensional imaging [18]. However, two-dimensional imaging remains the most common imaging modality in clinical practice due to the advantages outlined above. Therefore, improving the assessment of radiographic bone loss via two-dimensional imaging in clinics is necessary. Inexperienced clinicians are more likely to make diagnostic errors and misdiagnoses based on their learning curve. Consequently, a computerized approach with standardized procedures would be highly beneficial [19].
Artificial intelligence is constantly finding new applications in everyday clinical practice [20]. Generally, artificial intelligence is the result of algorithms that are designed to mimic the decision-making processes of humans [21]. Algorithms of this type are often applied to complex and time-consuming tasks such as risk stratification, diagnostics, and object detection [15,22]. Artificial intelligence has already been found to be capable of recognizing and classifying many structures in dentistry, ranging from teeth and bone to soft tissues [23,24,25]. Aside from its use in identifying structures and patterns, it is increasingly being used to assess a prognosis, determine risk, and predict complications [24,26,27]. Based on a systematic review by Khanagar et al. (2021), AI has already been incorporated into many different areas of dentistry [20]. A particular focus was placed on the treatment of dental diseases and the examination of dental implants [20,28,29,30]. It has been shown that computer-aided diagnosis in radiology can assist clinical users in addressing complex problems by providing a valuable second opinion or objective support [31]. Nevertheless, studies investigating the use of deep learning in maxillofacial imaging are still lacking [10]. Several studies have already demonstrated radiographic bone loss (RBL) measurements using dental imaging [32,33]. However, in some studies, only the site of bone loss was detected, and no automated distance measurements were taken to document the progression of the loss. A rough direction of disease progression has already been determined using percentage data [10]. With the aid of artificial intelligence-based algorithms, it would be possible to monitor the progression of the disease and to perform faster interventions following tooth extraction. In fact, such sophisticated algorithms can even be used for comparing treatment approaches by examining how bone loss changes over time for pairwise comparisons. The algorithms are also expected to save a significant amount of time and effort in the clinical assessment process as well as potentially reduce health care costs in the long run. The use of artificial intelligence-based assessments of panoramic radiographs has been shown to be a promising method for monitoring periodontitis in recent studies [32,34,35]. However, the algorithms employed in these studies were intended to classify periodontal bone loss cases and stagings, rather than to provide absolute measurements of bone loss for monitoring over time. As far as we know, no other study has applied AI-based algorithms to estimate the absolute bone loss or heights for purposes of monitoring.
Since automated bone loss detection has many benefits, our goal was to develop a multi-object detection algorithm based on artificial intelligence that would be able to detect and quantify radiographic bone loss using standard two-dimensional radiographic images in the maxillary posterior region.
2. Materials and Methods
2.1. Study Design
This retrospective cross-sectional study was conducted in accordance with the current versions of the Declaration of Helsinki and the Professional Code of Conduct for Physicians of the Bavarian Medical Association. Prior to the start of this study, the Ethics Committee of the University of Würzburg approved the study and gave authorization under authentication number 2022011702.
This study was conducted by combining three recent online databases and validating the results using an external validation dataset from our organization. These databases consist of the Tufts Dental Database (1000 images) [36], the Panoramic Radiograph Database (598 images) [37], and the Panoramic Dental Radiograph Database (116 images). The databases were all published between 2020 and 2022. The metrics were assessed in accordance with the Guidelines for Developing and Reporting Machine Learning Models in Biomedical Research [38] using a validation dataset from our institute (357 images). From 2010 to 2022, all panoramic radiographs of consecutive patients who underwent tooth extractions in the posterior region of the upper jaw at the University Hospital Würzburg were included in the study. The rationale of this inclusion criteria was to extract a validation dataset that can be compared with the metrics of the online datasets obtained. We focused on the posterior region of the upper jaw as the measurement of additional areas (e.g., mandibular regions) would not be feasible due to the small amount of images and the extent of information available in panoramic radiographs. Due to the online databases not being restricted to specific age cohorts, the dataset did not include explicit stratification by age. However, we restricted the cohort to patients ≥18 years as the detection algorithm might be affected by tooth germs present in the panoramic radiographs. In the next step, all images were reviewed by two reviewers for quality assessment. Before the start of the study, reviewers were briefed on the keypoints to be defined and on the necessary quality criteria that the radiograph must meet in order to be considered. Both reviewers assessed the image quality and the keypoint settings in the same setting. A discussion with a third reviewer solved disagreements. Images that were severely distorted, images that did not contain maxillary molars (at least the first and second molars) as well as images that contained artifacts in the region of interest (ROI) (such as implants or other metallic structures) were excluded from the study.
2.2. Image Processing
We utilized the VIA annotator software [39] to draw polygons around each molar (first, second, and third). There were no polygons drawn around the third molars unless they reached the occlusion plane (the occlusal surface of the third molar was approximately the same level as the occlusal surface of the second molar) (Figure 1). The blue line in Figure 1 indicates the approach for a simple measurement of bone heights from the mesial keypoint (alveolar bone–tooth contact) to the apex in the case a reference line is present.
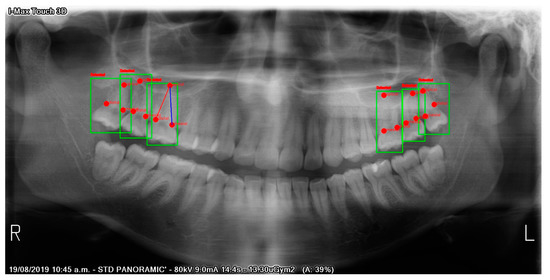
Figure 1.
Automatic detection of upper molars and keypoints. The blue reference line illustrates the possibility of automatic distance measurements (e.g., in millimeters) in the case a reference line is available. Green boxes indicate detection (red text above green box: “Detected”). Red points indicate “mesial”, “distal”, and “apical” keypoints.
Each tooth was assigned three keypoints (apical, mesial, distal). Apical keypoints were set at the most apical region of the root that could be identified. Mesial and distal keypoints were placed at the intersections of the radiographic bone and the teeth. All dataset images were then resized (224 × 224). Using the Albumentation class in Python, random changes in brightness (brightness limit: 30%) and contrast (contrast limit: 30%) were applied as data augmentation techniques. To obtain more precise box drawings for the molars, polygons were converted to boundary boxes using Python code. Figure 2 illustrates an example of the analyzed image structure.
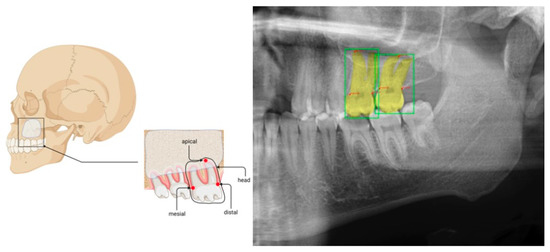
Figure 2.
Illustration of molar (boxes) and keypoint (mesial, distal, and apical) settings. Boundary boxes were set according to the polygons drawn by two dentists with more than three years of experience in dental radiograph examinations. The whole panoramic radiographic image was used as the image input. The shown figure was limited to the region of interest for better visualization.
2.3. Model
Feature extraction over an entire image was performed using a backbone network. Our backbone network was based on Mask R-CNN [40]. In particular, as shown in Figure 3, we employed ResNet50 [41] as well as another more effective backbone network proposed by Lin et al. [42], the feature pyramid network (FPN). An entire input image was analyzed by our backbone network, which extracted a set of convolutional features from the image, and the convolutional features were then used to extract the ROI. Therefore, ResNet-50-FPN formed our backbone network. We utilized the same ResNet-50-FPN backbone structure as described previously [43]. As opposed to Mask R-CNN, keypoint RCNN encodes a keypoint (instead of the entire mask) of the detected object. Figure 3 illustrates the architecture of the keypoint R-CNN. A box head performed object classification and bounding box regression using the feature maps provided by the backbone network, and a mask head performed object segmentation using the feature maps provided by the backbone network. The model can be used to predict specific keypoints on the objects detected by the box head by attaching a keypoint detection head and properly training the network. A previous study showed that this method with a keypoint head could be used to estimate human poses by picking some key points of the body such as eyes, elbows, and knees [44]. We adopted the following architecture in this study, the Mask R-CNN based on ResNet-FPN with a keypoint detection module. This allowed us to identify the boundary boxes (upper molars) and the three keypoints within each box. The hyperparameters were tuned using Ray Tune [40]. In Ray Tune, cutting-edge optimization algorithms were leveraged at scale to accelerate hyperparameter tuning. As a Ray-based platform, it was designed to remove friction from scalability and allow for hyperparameter tuning during the experiments. We tuned the batch size and the learning rate utilizing 5-fold cross-validation. Afterward, we trained our model with 5-fold cross-validation, a learning rate scheduler, and an optimizer (step size = 1; gamma = 0.3; momentum = 0.9; weight decay = 0.0005), with the learning rate set at 0.0600. For the training of the model, we used a batch size of eight for a total of ten epochs. During the evaluation process, the CrossEntropyLoss was used as the criterion. The weights of the model were then saved for evaluation purposes. The code in the data availability section describes the specific characteristics of each model and all of the preprocessing steps.
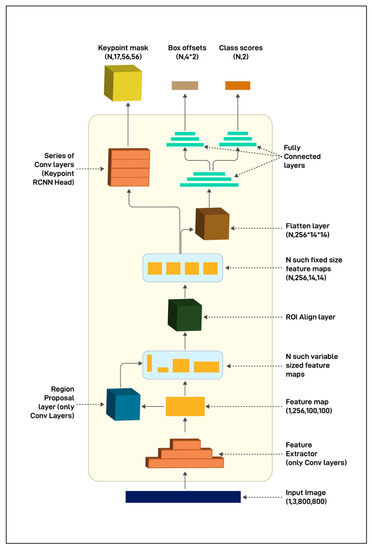
Figure 3.
The architecture of keypoint R-CNN. The architecture of keypoint RCNN resembles the Mask-RCNN and only differ in the output size and the way the keypoints are encoded in the keypoint mask.
2.4. Model Evaluation and Statistical Analysis
An objective metric that measures how closely the model’s bounding box is to the ground truth bounding box is required in order to evaluate the model’s performance in detecting teeth. The Jaccard index, also known as the intersection over union (IoU), was used in order to accomplish this. The IoU was calculated by dividing the overlap between the ground truth box (A) and the model-predicted box (B) by the total area of the two boxes’ coverage.
Model precision (AP) and recall (AR) were determined at different values of the IoU threshold.
An object keypoint similarity (OKS) measure was used to assess the model’s performance in detecting keypoints [27]. A similar concept to IoU was used here. For each object, an OKS value was calculated. The OKS value ranged between 0 and 1. In general, OKS values tend to be closer to 1 as the model’s prediction is closer to the ground truth. As with IoU, this metric was used for assessing tasks related to object detection. In keypoint detection, OKS serves as a threshold to determine precision and recall. In the case of keypoint detection, only those values whose OKS value were higher than the OKS threshold were considered as true positives. It was possible to obtain AP and AR curves as well as precision–recall curves by adjusting the OKS thresholds. Additionally, we integrated a code snippet to indicate a possible automatic measurement (e.g., in mm for documentation purposes) if a reference line was available on the radiograph image by visualizing the connection line between the mesial keypoint and the apical keypoint.
AP and AR on the detection of molars were obtained by varying the threshold for the model’s confidence scores on bounding box regression using different IoU thresholds (IoU threshold 0.50–0.95, increased by 0.05). AP and AR were also calculated using different thresholds for the model’s confidence scores on keypoint detection (OKS threshold of 0.50–0.95, increased by 0.05). In this study, algorithms were constructed and evaluated using the Python (Python version: 3.10.4 (64-bit)) libraries OpenCV, NumPy, Pillow, Seaborn, Matplotlib, TensorFlow, Keras, and scikit-learn. Experiments were performed on a computer (Windows 10 OS) with an AMD Ryzen 9 5950X 16-Core Processor CPU, 64 GB RAM, and an NVIDIA Geforce RTX 3090 GPU.
3. Results
3.1. Testing
There were 1414 images for training and testing and 341 for external validation in the final dataset. The evaluation of boundary box metrics showed a moderate overlap with the ground truth, revealing an average precision of up to 0.758. The average precision and recall over all 5-folds were 0.694 and 0.611, respectively. The mean average precision and recall for the keypoint detection were 0.632 and 0.579, respectively. Figure 1 illustrates the detection of the keypoints including the reference line for automatic measurements. Notably, the evaluation metrics were determined by considering varying IoU thresholds from 0.50 to 0.95 (Table 1). This means that we considered true positive cases when the overlap between the prediction and the ground truth was over 50%. Lower thresholds would lead to higher AP and AR metrics.

Table 1.
Evaluation of the training dataset.
The intersection over union (IoU), average precision (AP) per fold, average recall (AR) per fold, and mean average precision (mAP) and recall (mAR) over all folds of cross-validation are shown for the box (molar) and keypoint (apical, mesial, distal) detections. maxDets: a given number of maximum detections. IoU = 0.50:0.95: varying thresholds within the given range.
3.2. Validation
The validation of the boundary box metrics with our institutional dataset showed a similar average precision of up to 0.815. The average precision and recall over all five folds were 0.677 and 0.643, respectively. The mean average precision and recall for the keypoint detection were 0.555 and 0.585, respectively (Table 2).
Table 2.
Evaluation of the testing dataset.
Intersection over union (IoU), average precision (AP) per fold, average recall (AR) per fold, and mean average precision (mAP) and recall (mAR) over all folds of cross-validation are shown for the box (molar) and keypoint (apical, mesial, distal) detections. maxDets: a given number of maximum detections. IoU = 0.50:0.95: varying thresholds within the given range.
4. Discussion
An automated method for assessing and quantifying radiographic bone loss in the upper molar area was presented in this study. The evaluation of the boundary box metrics showed a moderate overlap with the ground truth, revealing an average precision of up to 0.758. The average precision and recall over all five folds were 0.694 and 0.611, respectively. The mean average precision and recall for the keypoint detection were 0.632 and 0.579, respectively. Despite only using a small and heterogeneous set of images for training, our results indicate that the algorithm was able to learn the objects of interest, although without sufficient accuracy due to the limited number of images and a large amount of information available in the panoramic radiographs. Considering the widespread availability of panoramic radiographs as well as the increasing use of online databases, the presented model can be further improved in the future to facilitate its implementation in clinics.
Panoramic radiographs are the most commonly used dental imaging technique. As a diagnostic tool, it is used to evaluate dental hard tissues, bones, and soft tissues in the maxillofacial region. Danks et al. showed that periapical radiographic imaging with the aid of an AI could detect landmarks well and diagnose periodontal bone loss on the basis of these [45]. The amount of bone loss in the alveolar region was underestimated by all radiographic methods. In bitewing radiographs, the underestimation ranged from 11 to 23% [46]. There were some advantages to intraoral and panoramic radiographs over bitewing radiographs when diagnosing bone loss; however, the differences were minimal in the premolar and molar regions [46]. Panoramic imaging, bitewing, and periapical radiographs have fairly similar sensitivities but significant differences in specificities [47]. In comparison with the periapical and bitewing radiographs, panoramic imaging resulted in the lowest specificity values. The use of vertical bitewings rather than horizontal bitewings was recommended in periodontal treatment planning [13]. A major advantage of panoramic and bitewing radiographs is their precise resolution in the region to be examined. While this method is effective, it does have the disadvantage of being able to image only a small area, which may result in lower reproducibility between different time points. A panoramic radiograph, which is also commonly used as a diagnostic tool in clinics, provides a more comprehensive view, can also reduce the probability of missing potentially significant areas. In addition to providing information regarding the periodontal bone situation, periapical lesions, and continuity breaks in the bone, it is widely used among clinics [11,12,25]. According to Personn et al., a high degree of agreement was found between intraoral dental films and panoramic radiographs in determining the cemento-enamel junction (CEJ) plane distances and periodontal bone loss [46]. In light of the shorter time required for panoramic radiographs, it can be concluded that it can serve as a partial substitute for a full-mouth dental film evaluation to assess periodontal health [46]. It is very time-consuming and resource-intensive to manually determine the radiological bone loss, which is why automation such as through artificial intelligence is essential for an accurate and reproducible recording of bone loss progression [46]. When image features are combined with a deep learning model that detects both objects and keypoints, examiner-specific differences can be eliminated, and high reproducibility can be ensured for diagnostics and treatment [33]. Aside from providing objective quality findings, such algorithms can be used to recognize and number the teeth and the region to be examined, thereby saving a great deal of time when completing the treatment card [48].
Although two-dimensional imaging has many advantages, it also has certain limitations. In comparison to single-tooth images, the large field of view reduces the resolution of individual teeth [33]. Although a 3-dimensional body can be represented on a 2-dimensional image, there are certain limitations. Bouquet et al., for example, were able to demonstrate that roots that protruded into the maxillary sinus in a 2D image did not make contact with it when viewed in 3D. Additionally, teeth may appear to be inclined when they are not. All of these variations are explained by the fact that a volume is represented on a flat plane [49]. A second limitation of artificial intelligence is that its complex algorithms do not represent the decision-making process in an obvious manner, obscuring information that might be useful to practitioners for making their own choices compared to a human-based detection approach [33,50].
A well-known bias in studies investigating machine learning is the use of the same dataset for both validation and training. Therefore, we applied a five-fold cross-validation and used an independent validation dataset to prevent this error [24,51,52]. Machine learning has the disadvantage of requiring a large amount of comparable data to implement its algorithms. In order for artificial intelligence to be able to make a final decision, it is necessary for it to receive very precise instructions on what it should recognize or classify. The annotation of an image is required in order to identify and classify specific areas within it. Artificial intelligence implementation in clinical practice, however, is challenging due to the time-consuming nature of this step. The resolution of problems by algorithms will be impacted by unreliable annotations, inhomogeneous, or too homogeneous (e.g., overfitting) image inputs for the learning process [21]. Our goal has been to generate the most extensive dataset possible for the training process by using several databases in order to take these aspects into consideration.
It is worth noting that the training dataset consists of three separate datasets, which were created using different hardware, software, and hospital standards. The model metrics may have been adversely affected by these factors. In spite of this, it has also led to a more generalizable approach compared to a methodology where only one institution is involved. Insufficiently annotated data may lead to worse results in a new validation set if the algorithm learns this error within the training dataset [53]. To validate the model’s performance, we used a separate database that was collected within our institute. It is necessary to collect further large datasets in order to be able to overcome individual factors such as the different imaging characteristics of scanners or different recording standards and create uniform data. The relationship with clinically implemented scores such as the PSI as well as other periodontal measurements should also be addressed in further clinical studies in a prospective design. It has already been demonstrated by Danks et al. that AI-based algorithms are capable of diagnosing periodontal tissue loss using periapical radiographs [45]. In comparison to this study, periapical radiographs contain significantly less image information than panoramic radiographs, so a smaller dataset was required for the AI learning process. A panoramic radiograph can provide a great deal of additional information. The same algorithm can be applied to a wide range of clinical research questions once a sufficiently large dataset has been obtained. By setting new objects and keypoints, other structures of interest can be detected. In the case of the provided approach, a major disadvantage is that a large amount of data is required for adequate object detection, as panoramic radiographs contain a substantial amount of information that must be learned by the algorithm [54]. The dataset obtained in our clinics and the databases were further reduced by excluding images of teeth with fillings, implants, and artifacts. This limits the current applicability further, as these cases are often seen in clinics. An open-access database and multicenter studies with a larger amount of data including all cases despite fillings, implants, and artifacts are necessary to retrain the algorithm and increase its precision when detecting objects of interest.
The clinical decision should, at the end of the day, take all factors that influence the patient into account in order to establish a causal decision chain. In the end, this decision needs to be made by a clinically experienced practitioner. With the aid of the provided methodological approach, this decision chain can be supported with an objective analysis, resulting in a significant improvement in quality as well as a reduction in the amount of work required [24]. The implementation of the provided algorithm into a software platform could facilitate time savings for the practitioner, along with the documentation of the radiograph images in a sufficient manner in the future. In this instance, it would be possible to document and visualize the patient’s bone loss at regular intervals to avoid missing the best possible time to intervene. In addition, implant planning can be initiated directly in the event of tooth loss. Through the precise documentation of AI, additional benefits will be possible as a result of increasing digitalization such as interdisciplinary cooperation between departments and within different locations. As a result, different doctrinal perspectives could be generalized within a software framework.
5. Conclusions
This study developed an artificial intelligence-based automated method for assessing and quantifying radiographic bone loss in the upper molar area. Despite the small number of images used for the training process and the fact that panoramic radiographs contain a considerable amount of information, our results indicate that the algorithm is capable of learning the objects of interest for the detection tasks. Through the widespread availability of panoramic radiographs, collaborative efforts between institutions and online databases, large amounts of panoramic radiographs can be collected to retrain the provided algorithm and facilitate its implementation in clinics.
Author Contributions
Data curation, A.V.; Formal analysis, B.S.; Investigation, A.V. and B.S.; Methodology, A.V. and B.S.; Software, B.S.; Supervision, A.K., R.C.B. and S.H.; Validation, M.V., A.S. and B.S.; Visualization, B.S.; Writing—original draft, A.V.; Writing—review & editing, M.V., G.L., A.S., A.K., S.G., R.C.B., S.H. and B.S. All authors have read and agreed to the published version of the manuscript.
Funding
This research received no external funding.
Institutional Review Board Statement
The study was conducted in accordance with the Declaration of Helsinki and approved by the Institutional Review Board (or Ethics Committee) of the Ethics Committee of the Faculty of Medicine University of Wuerzburg (2022011702 and date of approval; Würzburg 17 February 2022).
Informed Consent Statement
Patient consent was waived due to the anonymization of the radiograph data.
Data Availability Statement
The raw images were anonymized and are available from the corresponding author upon reasonable request. The python code and machine learning algorithm structures are available from: https://github.com/Freiburg-AI-Research (accessed on 10 August 2022).
Conflicts of Interest
The authors declared no conflict of interest.
References
- Kinane, D.F.; Stathopoulou, P.G.; Papapanou, P.N. Periodontal Diseases. Nat. Rev. Dis. Primers 2017, 3, 17038. [Google Scholar] [CrossRef] [PubMed]
- Tonetti, M.S.; Greenwell, H.; Kornman, K.S. Staging and Grading of Periodontitis: Framework and Proposal of a New Classification and Case Definition. J. Periodontol. 2018, 89, S159–S172. [Google Scholar] [CrossRef] [PubMed]
- Nazir, M.; Al-Ansari, A.; Al-Khalifa, K.; Alhareky, M.; Gaffar, B.; Almas, K. Global Prevalence of Periodontal Disease and Lack of Its Surveillance. Sci. World J. 2020, 2020, 2146160. [Google Scholar] [CrossRef] [PubMed]
- Lang, N.P.; Bartold, P.M. Periodontal Health. J. Periodontol. 2018, 89, S9–S16. [Google Scholar] [CrossRef]
- Tonetti, M.S.; Jepsen, S.; Jin, L.; Otomo-Corgel, J. Impact of the Global Burden of Periodontal Diseases on Health, Nutrition and Wellbeing of Mankind: A Call for Global Action. J. Clin. Periodontol. 2017, 44, 456–462. [Google Scholar] [CrossRef]
- Trombelli, L.; Farina, R.; Silva, C.O.; Tatakis, D.N. Plaque-Induced Gingivitis: Case Definition and Diagnostic Considerations. J. Periodontol. 2018, 89 (Suppl. 1), S46–S73. [Google Scholar] [CrossRef]
- Garnick, J.J.; Silverstein, L. Periodontal Probing: Probe Tip Diameter. J. Periodontol. 2000, 71, 96–103. [Google Scholar] [CrossRef]
- Hefti, A.F. Periodontal Probing. Crit. Rev. Oral Biol. Med. 1997, 8, 336–356. [Google Scholar] [CrossRef]
- Machado, V.; Proença, L.; Morgado, M.; Mendes, J.J.; Botelho, J. Accuracy of Panoramic Radiograph for Diagnosing Periodontitis Comparing to Clinical Examination. JCM 2020, 9, 2313. [Google Scholar] [CrossRef]
- Chang, H.-J.; Lee, S.-J.; Yong, T.-H.; Shin, N.-Y.; Jang, B.-G.; Kim, J.-E.; Huh, K.-H.; Lee, S.-S.; Heo, M.-S.; Choi, S.-C.; et al. Deep Learning Hybrid Method to Automatically Diagnose Periodontal Bone Loss and Stage Periodontitis. Sci. Rep. 2020, 10, 7531. [Google Scholar] [CrossRef]
- Su, N.; van Wijk, A.; Berkhout, E.; Sanderink, G.; De Lange, J.; Wang, H.; van der Heijden, G.J.M.G. Predictive Value of Panoramic Radiography for Injury of Inferior Alveolar Nerve After Mandibular Third Molar Surgery. J. Oral Maxillofac. Surg. 2017, 75, 663–679. [Google Scholar] [CrossRef] [PubMed]
- Suomalainen, A.; Pakbaznejad Esmaeili, E.; Robinson, S. Dentomaxillofacial Imaging with Panoramic Views and Cone Beam CT. Insights Imaging 2015, 6, 1–16. [Google Scholar] [CrossRef] [PubMed]
- Corbet, E.; Ho, D.; Lai, S. Radiographs in Periodontal Disease Diagnosis and Management. Aust. Dent. J. 2009, 54, S27–S43. [Google Scholar] [CrossRef] [PubMed]
- Vigil, M.S.A.; Bharathi, V.S. Detection of Periodontal Bone Loss in Mandibular Area from Dental Panoramic Radiograph Using Image Processing Techniques. Concurr. Comput. Pract. Exp. 2021, 33, e6323. [Google Scholar] [CrossRef]
- Liu, M.; Wang, S.; Chen, H.; Liu, Y. A Pilot Study of a Deep Learning Approach to Detect Marginal Bone Loss around Implants. BMC Oral Health. 2022, 22, 11. [Google Scholar] [CrossRef]
- Albrektsson, T.; Dahlin, C.; Reinedahl, D.; Tengvall, P.; Trindade, R.; Wennerberg, A. An Imbalance of the Immune System Instead of a Disease Behind Marginal Bone Loss Around Oral Implants: Position Paper. Int. J. Oral Maxillofac. Implant. 2020, 35, 495–502. [Google Scholar] [CrossRef]
- Serino, G.; Sato, H.; Holmes, P.; Turri, A. Intra-Surgical vs. Radiographic Bone Level Assessments in Measuring Peri-Implant Bone Loss. Clin. Oral Implant. Res. 2017, 28, 1396–1400. [Google Scholar] [CrossRef]
- Al-Okshi, A.; Paulsson, L.; Rohlin, M.; Ebrahim, E.; Lindh, C. Measurability and Reliability of Assessments of Root Length and Marginal Bone Level in Cone Beam CT and Intraoral Radiography: A Study of Adolescents. Dentomaxillofac. Radiol. 2019, 48, 20180368. [Google Scholar] [CrossRef]
- Cassetta, M.; Altieri, F.; Giansanti, M.; Bellardini, M.; Brandetti, G.; Piccoli, L. Is There a Learning Curve in Static Computer-Assisted Implant Surgery? A Prospective Clinical Study. Int. J. Oral Maxillofac. Surg. 2020, 49, 1335–1342. [Google Scholar] [CrossRef]
- Khanagar, S.B.; Al-ehaideb, A.; Maganur, P.C.; Vishwanathaiah, S.; Patil, S.; Baeshen, H.A.; Sarode, S.C.; Bhandi, S. Developments, Application, and Performance of Artificial Intelligence in Dentistry—A Systematic Review. J. Dent. Sci. 2021, 16, 508–522. [Google Scholar] [CrossRef]
- Saravi, B.; Hassel, F.; Ülkümen, S.; Zink, A.; Shavlokhova, V.; Couillard-Despres, S.; Boeker, M.; Obid, P.; Lang, G.M. Artificial Intelligence-Driven Prediction Modeling and Decision Making in Spine Surgery Using Hybrid Machine Learning Models. J. Pers. Med. 2022, 12, 509. [Google Scholar] [CrossRef]
- Wong, S.H.; Al-Hasani, H.; Alam, Z.; Alam, A. Artificial Intelligence in Radiology: How Will We Be Affected? Eur. Radiol. 2019, 29, 141–143. [Google Scholar] [CrossRef] [PubMed]
- Bindushree Artificial Intelligence: In Modern Dentistry. Available online: https://www.jdrr.org/article.asp?issn=2348-2915;year=2020;volume=7;issue=1;spage=27;epage=31;aulast=Bindushree (accessed on 25 August 2022).
- Vollmer, A.; Saravi, B.; Vollmer, M.; Lang, G.M.; Straub, A.; Brands, R.C.; Kübler, A.; Gubik, S.; Hartmann, S. Artificial Intelligence-Based Prediction of Oroantral Communication after Tooth Extraction Utilizing Preoperative Panoramic Radiography. Diagnostics 2022, 12, 1406. [Google Scholar] [CrossRef] [PubMed]
- Vollmer, A.; Vollmer, M.; Lang, G.; Straub, A.; Kübler, A.; Gubik, S.; Brands, R.C.; Hartmann, S.; Saravi, B. Performance Analysis of Supervised Machine Learning Algorithms for Automatized Radiographical Classification of Maxillary Third Molar Impaction. Appl. Sci. 2022, 12, 6740. [Google Scholar] [CrossRef]
- Fazal, M.I.; Patel, M.E.; Tye, J.; Gupta, Y. The Past, Present and Future Role of Artificial Intelligence in Imaging. Eur. J. Radiol. 2018, 105, 246–250. [Google Scholar] [CrossRef]
- Artificial Intelligence in Healthcare: Past, Present and Future|Stroke and Vascular Neurology. Available online: https://svn.bmj.com/content/2/4/230.abstract (accessed on 25 August 2022).
- Sukegawa, S.; Yoshii, K.; Hara, T.; Yamashita, K.; Nakano, K.; Yamamoto, N.; Nagatsuka, H.; Furuki, Y. Deep Neural Networks for Dental Implant System Classification. Biomolecules 2020, 10, 984. [Google Scholar] [CrossRef] [PubMed]
- Cha, J.-Y.; Yoon, H.-I.; Yeo, I.-S.; Huh, K.-H.; Han, J.-S. Peri-Implant Bone Loss Measurement Using a Region-Based Convolutional Neural Network on Dental Periapical Radiographs. J. Clin. Med. 2021, 10, 1009. [Google Scholar] [CrossRef] [PubMed]
- Lerner, H.; Mouhyi, J.; Admakin, O.; Mangano, F. Artificial Intelligence in Fixed Implant Prosthodontics: A Retrospective Study of 106 Implant-Supported Monolithic Zirconia Crowns Inserted in the Posterior Jaws of 90 Patients. BMC Oral Health. 2020, 20, 80. [Google Scholar] [CrossRef]
- Schmidhuber, J. Deep Learning in Neural Networks: An Overview. Neural Netw. 2015, 61, 85–117. [Google Scholar] [CrossRef]
- Krois, J.; Ekert, T.; Meinhold, L.; Golla, T.; Kharbot, B.; Wittemeier, A.; Dörfer, C.; Schwendicke, F. Deep Learning for the Radiographic Detection of Periodontal Bone Loss. Sci. Rep. 2019, 9, 8495. [Google Scholar] [CrossRef]
- Kim, J.; Lee, H.-S.; Song, I.-S.; Jung, K.-H. DeNTNet: Deep Neural Transfer Network for the Detection of Periodontal Bone Loss Using Panoramic Dental Radiographs. Sci. Rep. 2019, 9, 17615. [Google Scholar] [CrossRef] [PubMed]
- Jiang, L.; Chen, D.; Cao, Z.; Wu, F.; Zhu, H.; Zhu, F. A Two-Stage Deep Learning Architecture for Radiographic Staging of Periodontal Bone Loss. BMC Oral Health. 2022, 22, 106. [Google Scholar] [CrossRef] [PubMed]
- Alotaibi, G.; Awawdeh, M.; Farook, F.F.; Aljohani, M.; Aldhafiri, R.M.; Aldhoayan, M. Artificial Intelligence (AI) Diagnostic Tools: Utilizing a Convolutional Neural Network (CNN) to Assess Periodontal Bone Level Radiographically—A Retrospective Study. BMC Oral Health. 2022, 22, 399. [Google Scholar] [CrossRef] [PubMed]
- Panetta, K.; Rajendran, R.; Ramesh, A.; Rao, S.; Agaian, S. Tufts Dental Database: A Multimodal Panoramic X-Ray Dataset for Benchmarking Diagnostic Systems. IEEE J. Biomed. Heal. Inf. 2022, 26, 1650–1659. [Google Scholar] [CrossRef] [PubMed]
- Román, J.C.M.; Fretes, V.R.; Adorno, C.G.; Silva, R.G.; Noguera, J.L.V.; Legal-Ayala, H.; Mello-Román, J.D.; Torres, R.D.E.; Facon, J. Panoramic Dental Radiography Image Enhancement Using Multiscale Mathematical Morphology. Sensors 2021, 21, 3110. [Google Scholar] [CrossRef] [PubMed]
- Luo, W.; Phung, D.; Tran, T.; Gupta, S.; Rana, S.; Karmakar, C.; Shilton, A.; Yearwood, J.; Dimitrova, N.; Ho, T.B.; et al. Guidelines for Developing and Reporting Machine Learning Predictive Models in Biomedical Research: A Multidisciplinary View. J. Med. Internet Res. 2016, 18, e323. [Google Scholar] [CrossRef]
- Dutta, A.; Zisserman, A. The VIA Annotation Software for Images, Audio and Video. arXiv 2019, arXiv:1904.10699. [Google Scholar]
- He, K.; Gkioxari, G.; Dollar, P.; Girshick, R. Mask R-CNN. In Proceedings of the 2017 IEEE International Conference on Computer Vision (ICCV), Venice, Italy, 22–29 October 2017; pp. 2980–2988. [Google Scholar]
- He, K.; Zhang, X.; Ren, S.; Sun, J. Deep Residual Learning for Image Recognition. In Proceedings of the 2016 IEEE Conference on Computer Vision and Pattern Recognition (CVPR), Las Vegas, NV, USA, 27–30 June 2016; pp. 770–778. [Google Scholar]
- Lin, T.-Y.; Dollár, P.; Girshick, R.; He, K.; Hariharan, B.; Belongie, S. Feature Pyramid Networks for Object Detection. arXiv 2016, arXiv:1612.03144. [Google Scholar]
- Lee, I.; Kim, D.; Wee, D.; Lee, S. An Efficient Human Instance-Guided Framework for Video Action Recognition. Sensors 2021, 21, 8309. [Google Scholar] [CrossRef]
- Xiao, B.; Wu, H.; Wei, Y. Simple Baselines for Human Pose Estimation and Tracking. arXiv 2018, arXiv:1804.06208v2. [Google Scholar] [CrossRef]
- Danks, R.P.; Bano, S.; Orishko, A.; Tan, H.J.; Moreno Sancho, F.; D’Aiuto, F.; Stoyanov, D. Automating Periodontal Bone Loss Measurement via Dental Landmark Localisation. Int. J. Comput. Assist. Radiol. Surg. 2021, 16, 1189–1199. [Google Scholar] [CrossRef] [PubMed]
- Persson, R.E.; Tzannetou, S.; Feloutzis, A.G.; Brägger, U.; Persson, G.R.; Lang, N.P. Comparison between Panoramic and Intra-Oral Radiographs for the Assessment of Alveolar Bone Levels in a Periodontal Maintenance Population. J. Clin. Periodontol. 2003, 30, 833–839. [Google Scholar] [CrossRef] [PubMed]
- Douglass, C.W.; Valachovic, R.W.; Wijesinha, A.; Chauncey, H.H.; Kapur, K.K.; McNeil, B.J. Clinical Efficacy of Dental Radiography in the Detection of Dental Caries and Periodontal Diseases. Oral Surg. Oral Med. Oral Pathol. 1986, 62, 330–339. [Google Scholar] [CrossRef] [PubMed]
- Tuzoff, D.V.; Tuzova, L.N.; Bornstein, M.M.; Krasnov, A.S.; Kharchenko, M.A.; Nikolenko, S.I.; Sveshnikov, M.M.; Bednenko, G.B. Tooth Detection and Numbering in Panoramic Radiographs Using Convolutional Neural Networks. Dentomaxillofac. Radiol. 2019, 48, 20180051. [Google Scholar] [CrossRef]
- Bouquet, A.; Coudert, J.-L.; Bourgeois, D.; Mazoyer, J.-F.; Bossard, D. Contributions of Reformatted Computed Tomography and Panoramic Radiography in the Localization of Third Molars Relative to the Maxillary Sinus. Oral Surg. Oral Med. Oral Pathol. Oral Radiol. Endodontol. 2004, 98, 342–347. [Google Scholar] [CrossRef]
- Shan, T.; Tay, F.R.; Gu, L. Application of Artificial Intelligence in Dentistry. J. Dent. Res. 2021, 100, 232–244. [Google Scholar] [CrossRef]
- Gianfrancesco, M.A.; Tamang, S.; Yazdany, J.; Schmajuk, G. Potential Biases in Machine Learning Algorithms Using Electronic Health Record Data. JAMA Intern. Med. 2018, 178, 1544–1547. [Google Scholar] [CrossRef]
- England, J.R.; Cheng, P.M. Artificial Intelligence for Medical Image Analysis: A Guide for Authors and Reviewers. Am. J. Roentgenol. 2019, 212, 513–519. [Google Scholar] [CrossRef]
- Shorten, C.; Khoshgoftaar, T.M. A Survey on Image Data Augmentation for Deep Learning. J. Big Data 2019, 6, 60. [Google Scholar] [CrossRef]
- Waring, J.; Lindvall, C.; Umeton, R. Automated Machine Learning: Review of the State-of-the-Art and Opportunities for Healthcare. Artif. Intell. Med. 2020, 104, 101822. [Google Scholar] [CrossRef]
Disclaimer/Publisher’s Note: The statements, opinions and data contained in all publications are solely those of the individual author(s) and contributor(s) and not of MDPI and/or the editor(s). MDPI and/or the editor(s) disclaim responsibility for any injury to people or property resulting from any ideas, methods, instructions or products referred to in the content. |
© 2023 by the authors. Licensee MDPI, Basel, Switzerland. This article is an open access article distributed under the terms and conditions of the Creative Commons Attribution (CC BY) license (https://creativecommons.org/licenses/by/4.0/).