Article

A Multi-Domain Model for Variable Gap Iron-Cored Wireless Power Transmission System

1
Mechanical Engineering Department, Politecnico di Milano Via Giuseppe La Masa, 1, 20156 Milano, Italy
2
Microhard Srl, Iseo Serrature Spa, Via S. Girolamo, 13, 25055 Pisogne, Italy
3
Iseo Serrature Spa, Via S. Girolamo, 13, 25055 Pisogne, Italy
*
Author to whom correspondence should be addressed.
Appl. Sci. 2023, 13(3), 1820; https://doi.org/10.3390/app13031820
Submission received: 9 January 2023 / Revised: 23 January 2023 / Accepted: 27 January 2023 / Published: 31 January 2023
(This article belongs to the Special Issue Wireless Power Transfer Systems)

Abstract

:
Wireless power transfer (WPT) devices represent one of the most efficient and increasingly used technologies for the transfer of data and power in the near-field range. This work analyzes and describes a new type of device: a ferrite-cored, variable gap, high-frequency power and data transfer system. The classic theoretical models existing in the literature for near-field communication (NFC) and WPT devices have foreseen a lumped-parameters characterization based on the representation of an equivalent circuit model (ECM). The strict interdependence between the different physical domains has clearly increased the difficulty in predicting the behavior of the device, due to the unwanted continuous and chaotic variation of the parameters. The proposed paper aims to provide a general and reliable multi-physics model based on the co-simulation of a Spice®-based ECM analysis and the ESRF Radia®-based 3D finite volume methodology (3DFVM), placing particular emphasis on the intrinsic sensitivity with respect to variables that cannot be directly controlled, such as the variation of the air gap between the coupled coils interfaces. Furthermore, this work outlines a detailed and effective experimental methodology for the estimation of static and dynamic electro-magnetic parameters and the validation of the numerical models in both the time and frequency domain, through the analysis of a real coupled WPT device.

1. Introduction

Wireless power technologies represent a growing industry and research field due to the increasing employment of battery-powered devices. As described in [1,2,3], the main technologies for wireless power devices in the near field are inductive power transfer (IPT) and capacitive power transfer (CPT).
Studies [4,5,6] describe how these types of applications are already heavily used in the automotive and telecommunication field, generally on systems that are capable of disposing of high amounts of energy on the primary side, thus, compensating for possible efficiency losses during coupled communication [7,8].
In systems where the amount of available energy on the transmitter is significantly contained, or in applications where the gap presents a continuous chaotic fluctuation that drastically affects the transmission performances—such as in tiny mechatronic application, implanted medical devices or, more generally, in small portable electronic devices—the optimization of the coupling factor is decisive.
In the literature, the current standard approach sees an equivalent circuit-based analysis; this simplification is acceptable since NFC devices have a light coupling between the two air-cored coils [9,10]. Some further effort can be found in automotive applications where the necessity of transferring energy at frequencies higher than tens of MHz [4], and the necessity to embed the devices in an external medium [11,12], push the analysis towards the integration of finite element analysis (FEA) models [13].
Instead, this paper aims to introduce a co-simulation methodology and define a different characterization procedure for the analysis and evaluation of the dynamic and energetic performances of cored-coil IPT devices subjected to gap fluctuations.
Figure 1 presents an explicative schematization of the device taken under analysis. The apparatus can essentially be described as a ferrite core coupled inductor used in high-frequency applications, in which the unwanted chaotic variation of the air gap, due to the geometric application characteristics of the assembly schematized here with Body 1 and Body 2, greatly influences the energy transmission performances.
From a mathematical point of view, the main objective is to provide a general and reliable multi-physics model based onto the co-simulation of a Spice-based ECM analysis and ESRF Radia-based 3DFVM analysis, placing particular emphasis on the intrinsic sensitivity with respect to variables that cannot be directly controlled, such as the variations in transmission efficiency induced by undesirable changes in the coupling factor.
This behavior pushes towards the introduction of a co-simulation architecture capable of integrating variations imposed in the electrical and magnetic domains, resulting from a modification of the mechanical and geometric properties of the device, and introducing in the numerical model an analytical-based characterization of the static and dynamic phenomena, such as: self/mutual inductance, coupling factor, stray capacitive behavior, and parasitic core and copper losses related to high-frequency phenomena.
Furthermore, this work provides a detailed outline of a smart and effective experimental methodology for the estimation of the previously reported parameters and the validation of numerical models, giving particular importance to the reconstruction of the transfer performances in the time domain and frequency domain as a result of an imposed and controlled variation of the air gap through a dedicated actuation and measurement apparatus.
The paper is structured as follows: Section 2 evaluates the mutual induction mathematical models, focusing on the description of the static parameters and the method by which they were obtained. Section 3 highlights the state-of-the-art mathematical models available in the literature for the modeling and analysis of dynamic coupling aspects such as high-frequency AC core and copper losses. Section 4 discusses the main co-simulation techniques adopted for the implementation of the multi-physics model, placing particular emphasis on the description of the magneto-electronic domain co-simulation. Section 5 describes the experimental campaign carried out for the validation of the numerical model, defining the measuring set-up, the sample analyzed and the comparison among the numerical and experimental outcomes. Finally, appropriate conclusions are drawn in Section 6 .

2. Mutual Induction Model: The Static Aspects

2.1. Preliminary Considerations

In IPT applications, the mathematical modeling approach of high-frequency electromagnetic coupling, with lumped parameters, allows two categories of parameters to be distinguished; these describe two different classes of phenomena: static phenomena and dynamic phenomena.
The parameters that are capable of modeling static phenomena are those that have a negligible dependence on the excitation frequency and are only able to vary their own value consequent to an induced variation of the intrinsic geometric configuration of the application. Among these are the parameters of self-inductance L i i and L j j , mutual-inductance L i j and L j i and, consequently, the coupling coefficient K i j .
On the other hand, parameters classified as dynamic are those that are able to describe phenomena highly dependent on the excitation frequency of the primary coil. These are the ferrite core losses and the copper losses in the wound wires.
This section presents an in-depth analysis of the governing equations and modeling techniques used during the research to define the static parameters, while Section 3 discusses the most fitting mathematical models available in the literature for the estimation of the dynamic aspects.

2.2. The Governing Equations

The inductive coupling between n ferrite core windings can be modeled starting from the description of the flux linkage λ i j , which is defined as the product between the number of turns of the transmitting coil N i times the total magnetic flux Φ i j of the loop formed by both cores of the two coils; this is equal to the product between the magnetic flux density B j generated by the coil i and measured through coil j times the average cross section of the core i  A i , supposing that all the magnetic flux lines crossing the winding loop are completely contained inside the ferrite core.
λ i j = N i Φ ij
Φ i j = B j d A i = A i B j
L i j = λ i j I j
Merging all the possible combinations of the coefficients i and j from 1 to n through the ratio between the flux linkage and the circulating current I j reported in (3), it is possible to reconstruct the inductive coupling square matrix reported in (4).
L = [ L 11 L 12 L 1 n L 21 L 22 L 2 n L ( n 1 ) n L n 1 L n 2 L n ( n 1 ) L n n ]
where the diagonal terms define the auto-inductance parameters, and the non-diagonal terms define the mutual-inductance one. Defining the equality between the same combinations of i and j of the extra diagonal terms is possible to obtain the coupling coefficient K i j through Equation (5).
L i j = L j i = K i j L i i L j j

3. Mutual Induction Model: The Dynamic Aspects

3.1. Core Losses

Power losses in electro-magnetic components are important design parameters, which limit many high-frequency designs. The high-frequency magnetic field variation induces eddy currents in the core loops, according to Faraday’s law of induction.
As summarized by Dobrzański et al. in [14] and by Corti et al. in [15], different geometric and material parameters can influence the induced core losses in ferrites, as well as the related physical non-linear phenomena, such as the permeability of the material, the magnetic saturation point, the core masses and the geometric properties.
On the other hand, losses also depend on the type of application, such as the frequency operating range, temperature, waveform and amplitude of the magnetic flux density excitation, as well as its DC offset [16].
The literature contains several standard-based Steinmetz models for studying the power losses in ferro-ceramic or iron-based cores [17,18]; however, the majority of them have been developed to work in a limited frequency range and temperature, and low magnetic flux [19].
Thanks to its ease of use and standardization, manufacturers provide core-losses documentation under the form of an experimentally obtained set of curves, which is based on the reported Steinmetz equation (SE) (6).
P ¯ v = k f α B ^ β
where P ¯ v is the time-averaged power loss per unit volume, f is the excitation frequency, B ^ is the amplitude of the magnetic flux density and, finally, α , β and k are the so-called Steinmetz parameters (SP).
Due to its simplicity, the equation has two main drawbacks that limit its usage for general applications: its ineffectiveness when handling non-sinusoidal excitations, and its non-sensitivity with respect to applications with the presence of DC bias.
Further improvements to the SE model are proposed in [20,21] up to the last formulation of a revised generalized Steinmetz equation (RGSE) model proposed by Abramovitz and Yaakov in [22]. In their work, the authors provide a mathematically based approach for core loss estimation implemented through the PSpice engine for the equivalent circuit simulation.
The proposed generalized RGSE mathematical model is based on the standard Steinmetz equation and some further geometrical data. The reported set of Equations (7)–(9) allows a behavioral Spice-based current source to be implemented for the equivalent circuit estimation. More detailed information along with the full mathematical demonstration can be found in [22].
As previously introduced, the equivalent Spice-based current source power loss P c presents a similar formulation with respect to the standard SE, but with the introduction of new terms that can handle a general exciting waveform and DC bias. k 1 , described in (8), maintains its independence with respect to the operating frequency and is simply related with the standard SP; B A C , whose formulation is reported in (9), presents an amplitude voltage v ( t ) and frequency f = 1 T dependency, as expected by the standard magnetic flux density formulation, and it also introduces the DC bias dependency through the term B D C ; finally, A e ,  V e and N represent, respectively, the effective cross section and volume of the core, and the number of turns of the exciting coil.
P c ( t ) = V e   k 1 | ( v ( t ) N   A e ) α B A C β α ( t ) |
k 1 = k ( 2 π ) α 1 0 2 π | c o s θ | α | s i n θ | β d θ
B A C ( t ) = B ( t ) B D C = 1 N   A e 0 t v ( t ) d t 1 T t T t ( 1 N   A e 0 t v ( t )   d t ) d t
As proposed in [22], the formulation reported herein is implemented into a Spice-based equivalent circuit model through the implementation of a behavioral current source and defined on the basis of the set of Equations reported in (10)–(11), where the introduced loss has the form of a controlled current obtained according to the Ohm’s law and is defined based on the transconductance g ( t ) in Equation (11).
i ( t ) = g ( t ) v ( t )
g ( t ) = 1 τ   ( P c   ( t ) v ( t ) i ( t ) ) d t
The term 1 τ in (11) allows for controlling the speed of response of the feedback loop. τ = 1 identifies a slow response. In our analysis, the response parameter is set equal to 0.0001 to reduce the computational cost of the model, due to the high frequency of the application and the reduced time window that is analyzed.

3.2. Copper Losses

High-frequency excitation induces various loss phenomena in copper; the most critical of these are direct current (DC) and alternating current (AC) resistance, and the more dangerous skin and proximity effects.
According to Bartoli et al. in [23], one of the most common ways to counteract this phenomenon is to design the device wound through Litz wires, due to the reduced dimensions of the device under analysis and the necessity to maintain cheap production costs. The authors′ work intended to formulate a numerical model that considers a generic type of standard round wire.
In his work [24], Professor Allan Payne proposes a series of models for circular and rectangular conductors, which allow a reliable solution to be obtained for any considered frequency without making use of the complex Bessel functions.
Another simple alternative to the Bessel functions is reported by Shen et al. in [25]. The proposed work introduces a complete characterization of the Faraday shield losses of a transformer, giving a detailed mathematical modeling of Dowell’s derived equations of an equivalent resistor to introduce in circuit simulation.
The proposed Dowell formulation tries to summarize all the AC, DC, proximity and skin effects that characterize the loss of the conductor into a single expression for the equivalent ohmic resistance.
As described in the above paragraph for the core losses, the following reports a set of equations for the equivalent mathematical formulation used in the implementation of a behavioral Spice-based resistance.
The equivalent AC resistance expression R A C i for the i-th winding is formulated as a combination of different hyperbolic functions ζ i and ξ i .
R A C i = R D C i   F r i = R D C i   Δ i [ ζ i + 2 3 ( p i 2 1 ) ξ i ] ,   i = 1 , 2
The DC resistance of the windings R D C i is directly experimentally measured. The proximity ξ i and skin ζ i effect instead need to be numerically calculated through Equations (13) and (14) through a combination of harmonic functions of the penetration ratio Δ i .
ξ i = sinh Δ i sin Δ i cosh Δ i + cos Δ i
ζ i = sinh ( 2 Δ i ) + sin ( 2 Δ i ) cosh ( 2 Δ i ) cos ( 2 Δ i )
According to Equations (15)–(17) the penetration depth Δ i is essentially a function of the physical and geometric parameters of the material.
Δ i = η i d w i δ i
η i = t i k i d w i h c
δ i = ρ i π μ f
where:
  • η i is the porosity factor of the material;
  • d w i is the equivalent thickness of the material and for a round wire is equal to π d i 2 , where d i is the diameter of the wire;
  • δ i is the skin depth in the wire;
  • t i is the number of turns per layer;
  • k i is the amount of Litz wire that is 1 for round wire;
  • h c is the height of the core window;
  • ρ i is the resistivity of the wire material;
  • μ is the permeability constant equal to μ r μ 0 ;
  • f is the principal operating frequency;
  • p i is the equivalent number of layers.
A more in-depth description and identification of the parameters as well as the whole mathematical demonstration can be found in [25].

3.3. Intra-Winding Equivalent Capacitance

Another important parameter that needs to be characterized for a better description of the phenomenon is the equivalent intra-winding capacitance. The best schematization of a single coil is represented by a series between the equivalent high-frequency AC resistance of the conductor and an inductor, which are connected in parallel with the self-capacitance of the coil. Thus, this R-L-C circuit allows us to define the natural frequency of the stand-alone coil. In detail, Massarini et al. in [26] propose a clever formulation for the estimation of the equivalent capacitor both for cored and non-cored coils.
The final stray capacitance C s ( n ) formulation for an n-winding cored coil is obtained through a combination of the turn-to-turn capacitance C t t and the turn-to-core capacitance C t c .
The turn-to-turn capacitance presents a dependence on the electrical parameters of the material expressed under the form of relative permittivity ϵ r and the constitutive geometric characteristic of the coil, such as D o and D c , which represent the diameter of the conductor including the insulator material and not, respectively.
C t t = ϵ 0 l t [ ϵ r θ * ln D o D c + cot ( θ * 2 ) cot ( π 12 ) ]
θ * = arcos ( 1 ln D o D c ϵ r )
C s ( n ) = C t t 2 + C t t C s ( n 2 ) + C t t
Due to the presence of the term C s ( n 2 ) that represents the stray capacitance at n 2 turns, for the mathematical implementation of the above-reported Equations, the formulation of the stray capacitance at n = 2 and n = 3 is defined in Equation (21) and Equation (22), respectively.
C s ( n = 2 ) = 2 C t t
C s ( n = 3 ) = 3 2 C t t

3.4. Induced Electro-Motive Force

Finally, in order to provide a complete description of the whole mathematical formulation that is introduced in the co-simulation numerical model, it is necessary to define how the dynamic inductive coupling phenomena has been modeled.
The auto and mutual electro-motive force (e.m.f.) induced among the coupled n-coils, can be defined on the basis of Equations (3) and (4); thus, according to the Faraday–Neumann–Lenz law, the induced e.m.f. V i i on the i-coil is equal to minus the derivative of the flux linkage (23).
V i i = ( d ( λ i j ) d t )
Matching all the possible combinations of i and j, where i, j are cycled between 1 and n-coils, the general formulation of (23) results in Equation (24). For the sake of completeness, the resultant formulation in the case of n = 2 coupled coils is reported in Equations (25) and (26).
V i i = ( n i , j = 1 L i i d i i i d t + i i i d L i i d t + L i j d i j j d t + i j j d L i j d t )
V 11 = ( L 11 d i 11 d t + i 11 d L 11 d t + L 12 d i 22 d t + i 22 d L 12 d t )
V 22 = ( L 22 d i 22 d t + i 22 d L 22 d t + L 21 d i 11 d t + i 11 d L 21 d t )
Due to the complexity of the phenomenon, the behavior depicted in (25) and (26) cannot be directly implemented through a classic Spice-based formulation of mutual inductor, since Spice does not take into account the inductance variation in the induced voltage formulation; thus, it is necessary to integrate the inductance variation phenomenon through a co-simulation approach. Further clarification on the complete co-simulation multi-domain model can be found in Section 4.

4. Multi-Physics Numerical Model

4.1. The Proposed Multi-Domain Co-Simulation Model

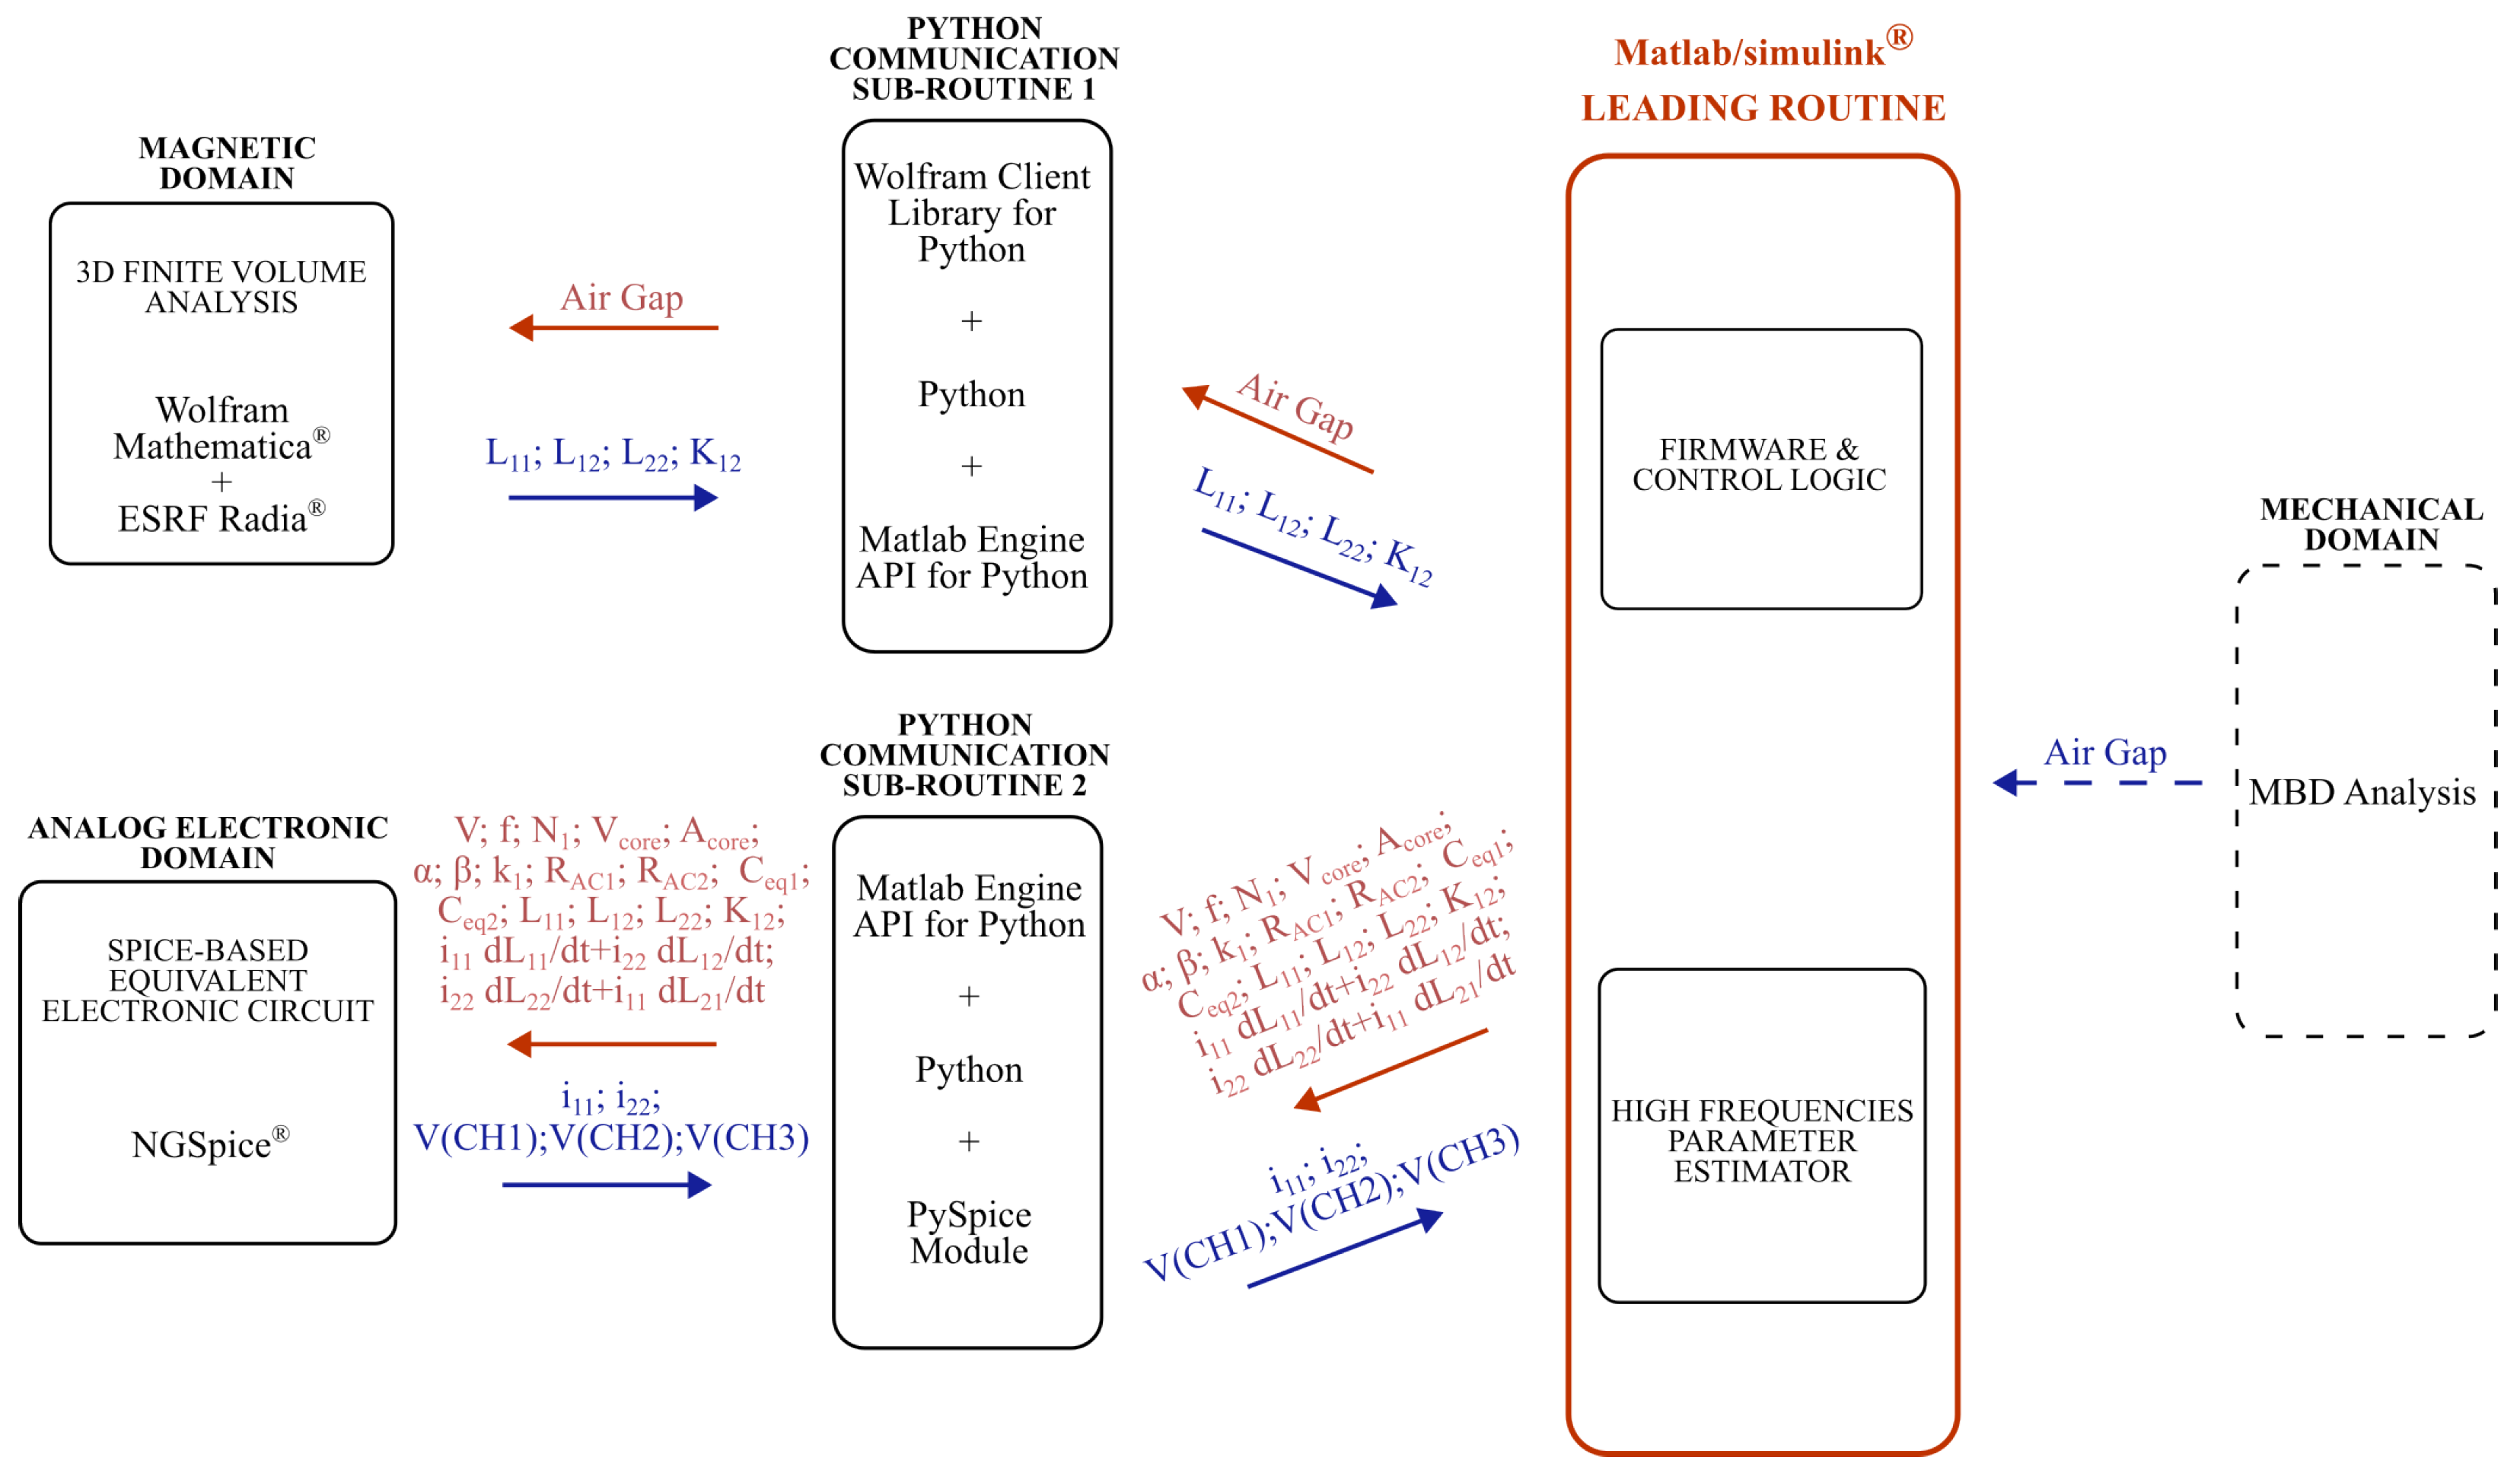
Figure 2 depicts the co-simulation model architecture, the core of the model developed in MATLAB/Simulink®, which discretizes the time of the simulation interfacing the different physical domains. This communication process between the various environments is discretized for each physical domain through a dedicated sample frequency, in order to coherently represent all the characteristic behaviors of the entire phenomenon and to improve the computation performances, while avoiding the risk of aliasing. Inside the MATLAB/Simulink master ambient, two main functions are also implemented: the high-frequency parameter estimator that computes the needed static and dynamic electro-magnetic parameters based on the Equations introduced in Section 2 and Section 3, and the firmware and control logic routine; this last task allows a control routine to be defined in the case that the excitation on the emitter side is governed by a microcontroller.
The magnetic domain block receives as an input the interface air gap and updates the magnetostatic model on the base of the reached configuration. The solution of the volume-based discretized analysis of the 3D magnetic field at each simulation instant is used to compute the parameters of auto and mutual inductance and the coupling factor.
At the same integration time step, the above information is used by the analog electronic domain to update the NETLIST and to solve the set of PDE/ODE describing the circuit, as well as to return all the voltage and current waveforms to the leading routine at every node and branch.
The co-simulation of these magnetic and analog electronic domains is allowed by the implemented Python-based communication algorithms, which, through dedicated API, allow the integration of the ESRF RADIA package and the NGSpice solvers. In detail, Spice, which over the years has been consolidated as the standard tool for the simulation of analog electronic circuits for both industry and research, has greatly improved the design capabilities of the electronics domain. The development of this routine aims to extend this design boost to those circuits, which, due to the application complexity, require a direct interaction between different physical domains, as in the case of mechatronic applications.
Finally, the reported architecture also proposes the integration of the mechanical domain. This is because, despite the case of the system under analysis, which presents a simple and basic assembly replica of the experimental measurement apparatus, from a broad point of view of a general application, the two coils could be mounted on a real coupling device exhibiting uncontrollable and random gap variation. The possibility of introducing an integration of the mechanical domain through multibody dynamics (MBD) would, thus, allow the model’s prediction capabilities to be extended, and enable a better understanding of the behavior of the device in a real case scenario.

4.2. Implemented MATLAB/Python-Based Co-Simulation Routines

As previously introduced, the core of the proposed co-simulation architecture is represented by the two novel MATLAB/Python-based co-simulation algorithms. In the following are listed the main steps and features constitutive of these routines.
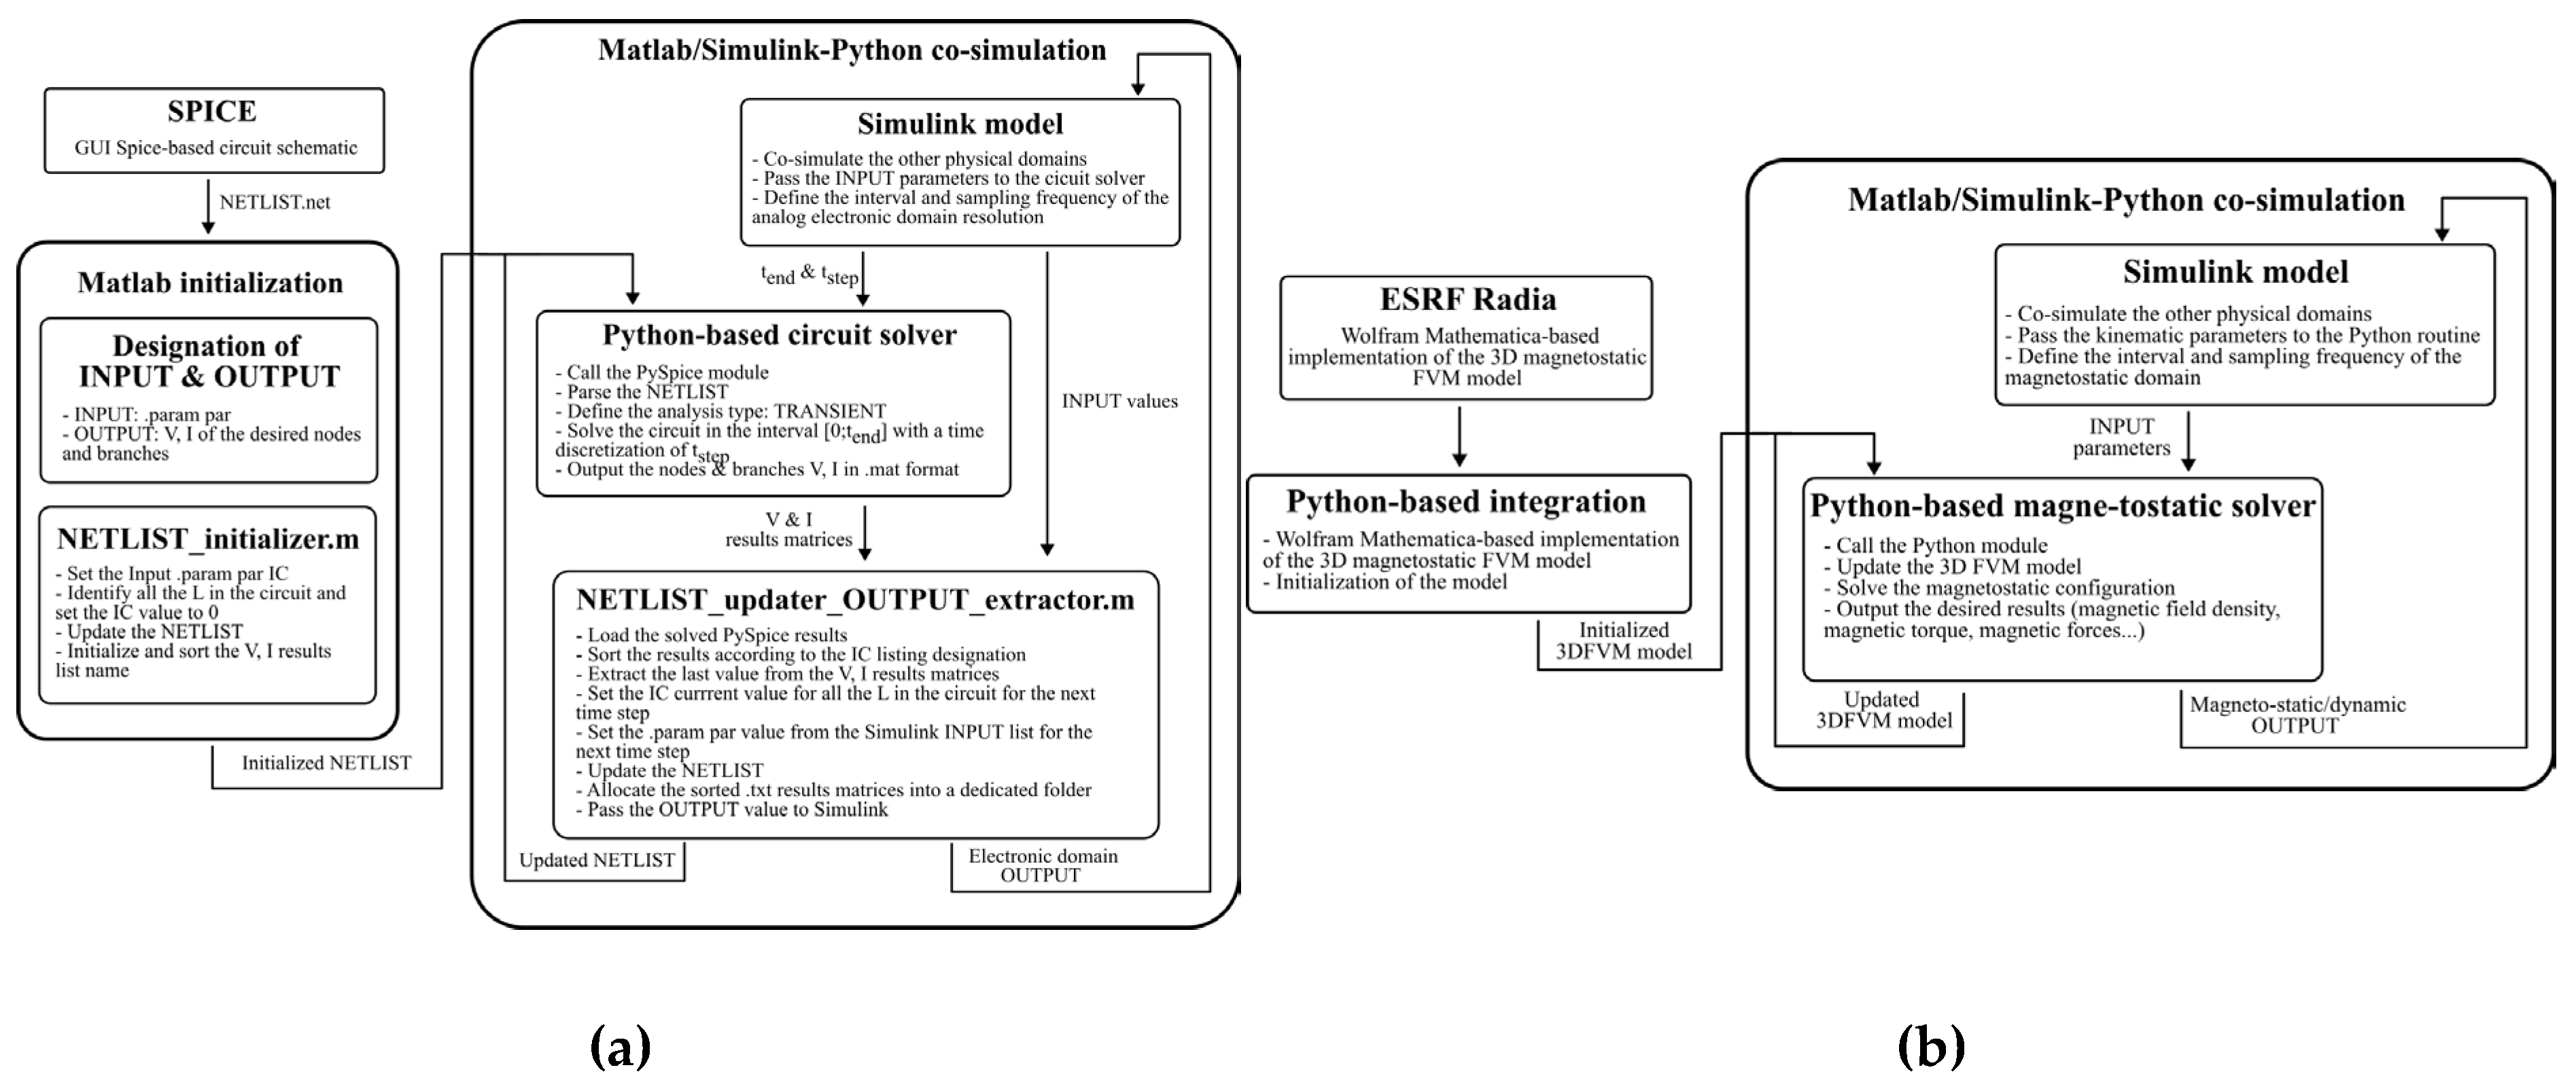
Figure 3a shows the logic behind the co-simulation of the Spice-based circuit engine and MATLAB/Simulink, which is defined on the basis of the following steps: (I) initialize the equivalent circuit model through the NETLIST set-up; (II) call off the Spice solver based on the open source PySpice module, which allows the NGSpice® simulator to be run in server mode; (III) extract the last V/I Spice discretization results as Spice samples of the electronic phenomena at a higher frequency (i.e., 10 9   Hz ), compared to the Simulink leading routine call; (IV) initialize the circuit NETLIST updated on the last extracted Spice results and on the solved and updated INPUT parameters that derive from the interaction with the other domains (e.g., mechanical, magnetic, etc.); (V) close the loop transferring the resulting effort and flow variables to the co-simulated domains. Figure 3b instead shows the algorithmic logic behind the magnetic domain integration. The logic exploits a closed-loop process similar to the one described for the previous case, keeping the sampling frequencies decoupled from that of the leading routine. This allows the characterization of the phenomena to be optimized and, at the same time, to maximize the computational performances. The main steps behind such co-simulation are listed as follows: (I) initialize the 3D finite volume model; (II) call the 3D FVM ESRF Radia solver; (III) update and solve the 3D FVM model based on the achieved configuration; (IV) extract the obtained results (e.g., magnetic fields intensity, magnetic forces/torques, etc.); and, finally, (V) close the loop transferring the resulting magnetic effort and flow variables to the other physical domains.

4.3. The 3D Finite Volume Model of the Coupled Inductor

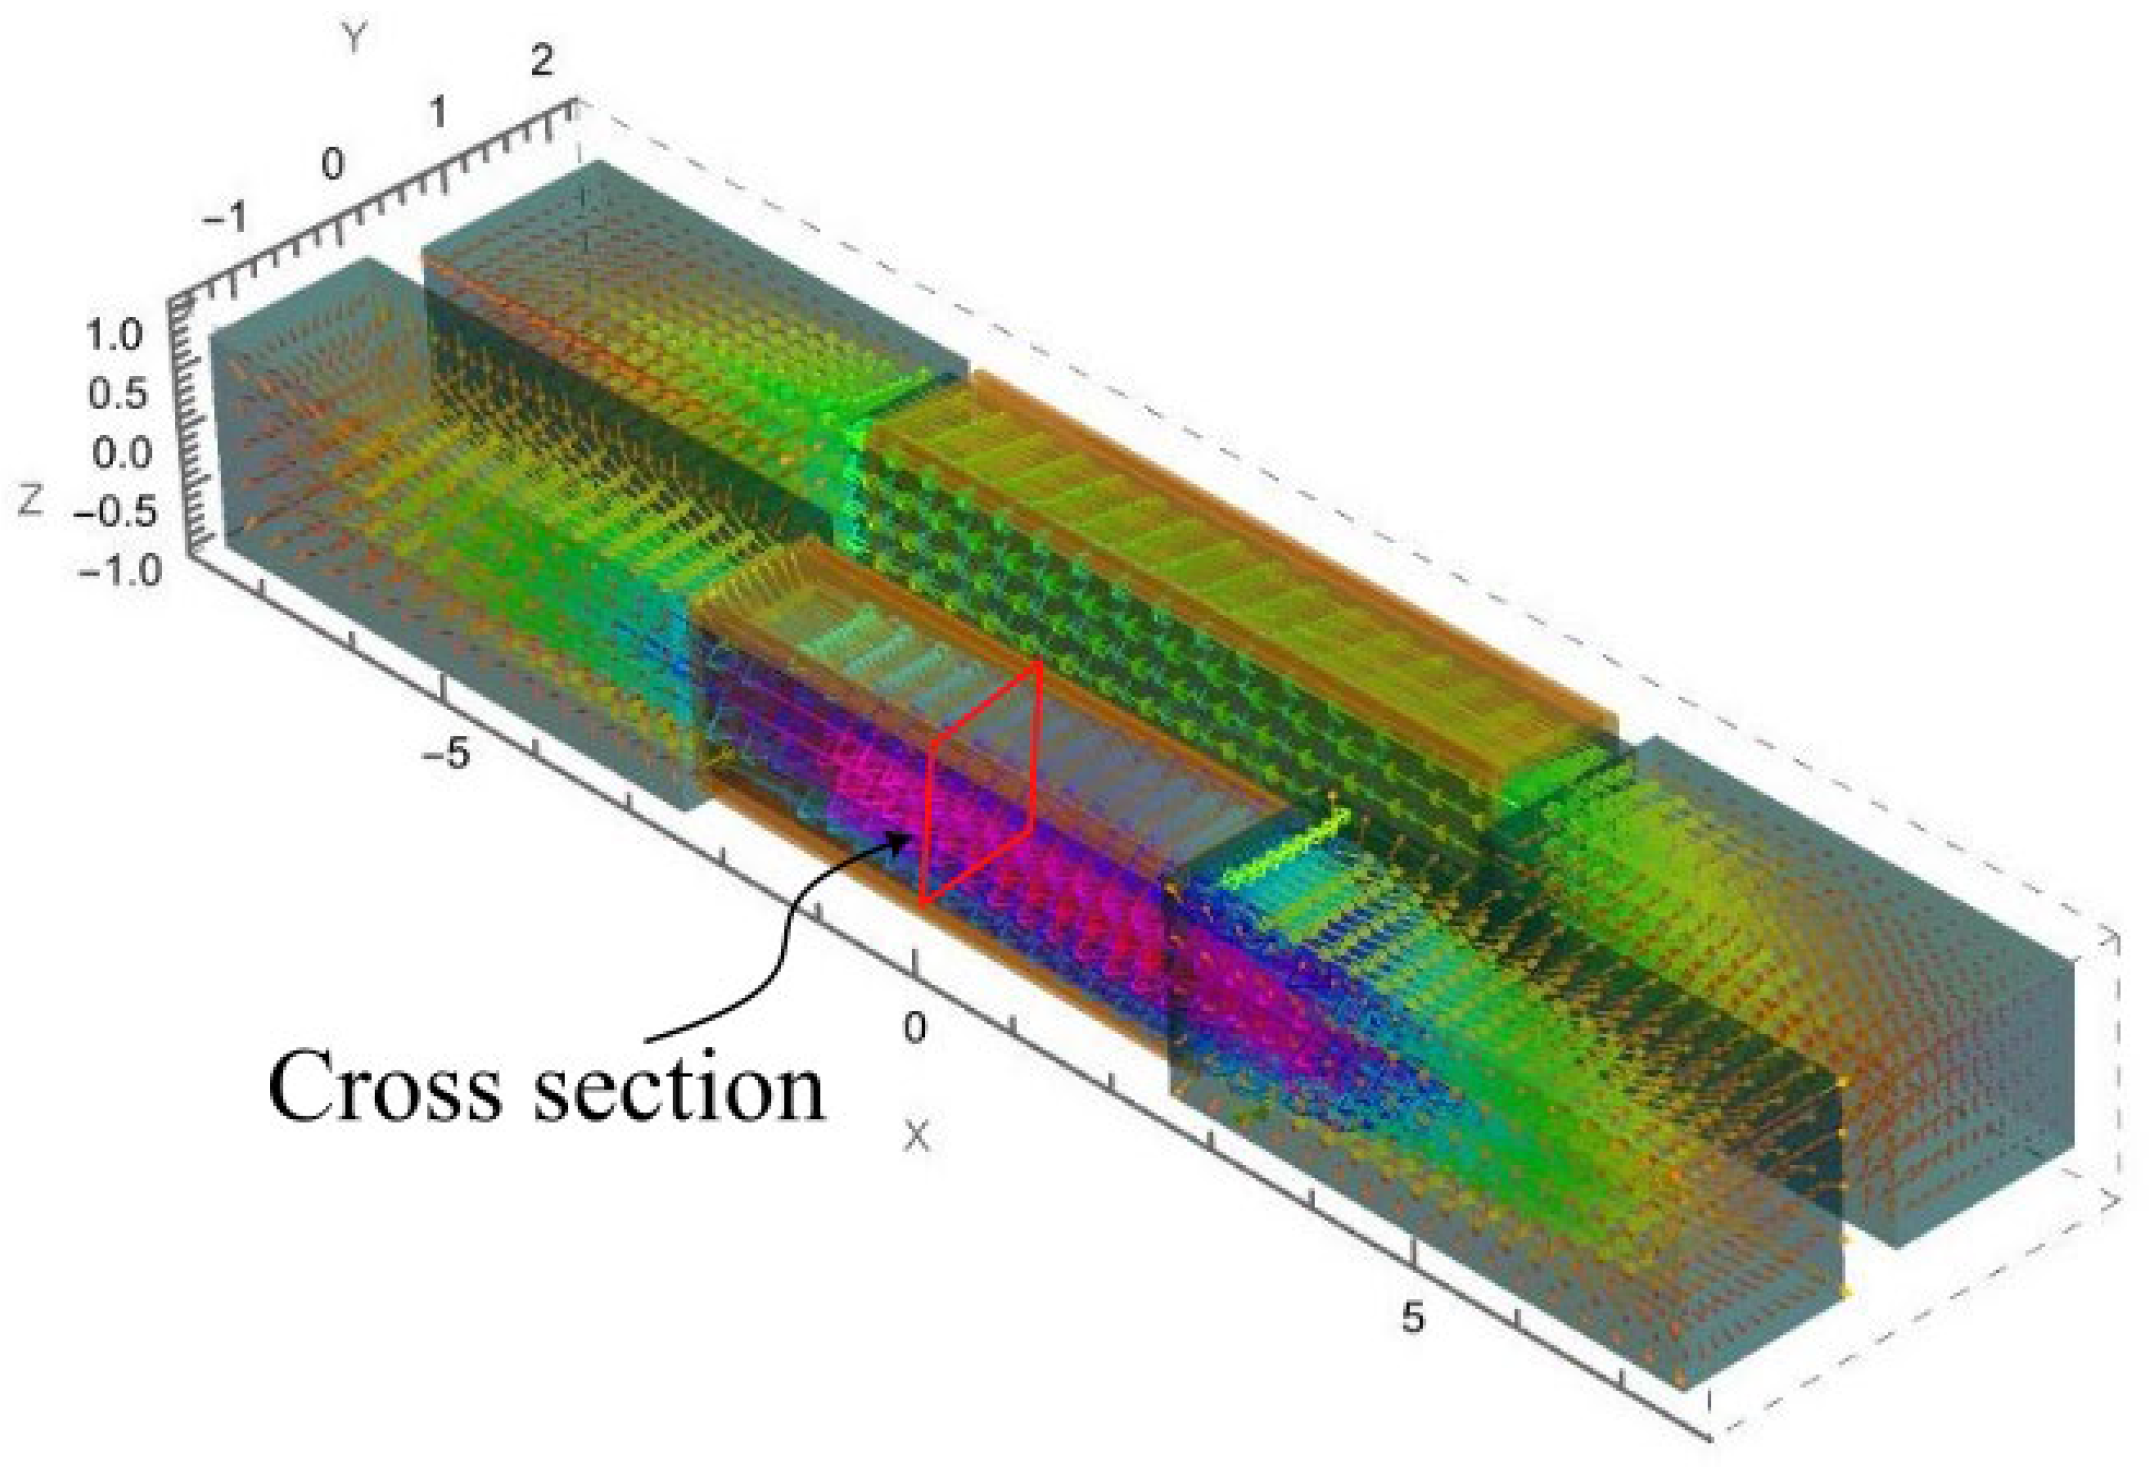
Figure 4 shows the implemented numerical model of the coupled coils developed through the ESRF Radia [27] package and solved through the 3D finite volume method.
The necessity of implementing such a model arose from the lack of information provided by the manufacturer about the technical operating characteristics of the individual coils. The system, as shown in Figure 1, consists of two coils (n = 2) separated by an air gap, whose variation can only occur in the direction that is normal to the coupled faces.
To obtain a detailed description of the parameters constituting the static inductive coupling phenomena, it is necessary to reconstruct, for each air gap configuration reached by the system, the entire inductance matrix reported in Equation (4).
The air gap range equal to X a i r   g a p = [ 0 ;   0.7 ]   mm is discretized with a step interval of 0.02 mm. For each of these air gap configurations, the numerical 3DFVM model is solved iteratively for n times, where n is equal to the total number of coils evaluated in the inductive coupling, individually energizing a different coil for each n-th iteration.
In detail, for the single air gap value and the single resolutive iteration of the numerical model, the n-th winding is energized through a constant current, with a value that generates an induced electromagnetic field sufficiently far from the material saturation. The Finite Volume Model is solved numerically, and the inductance parameters’ values L i j are solved according to Equations (1)–(3) through the average magnetic flux density B j , which is measured across the core cross section delimited by the winding.
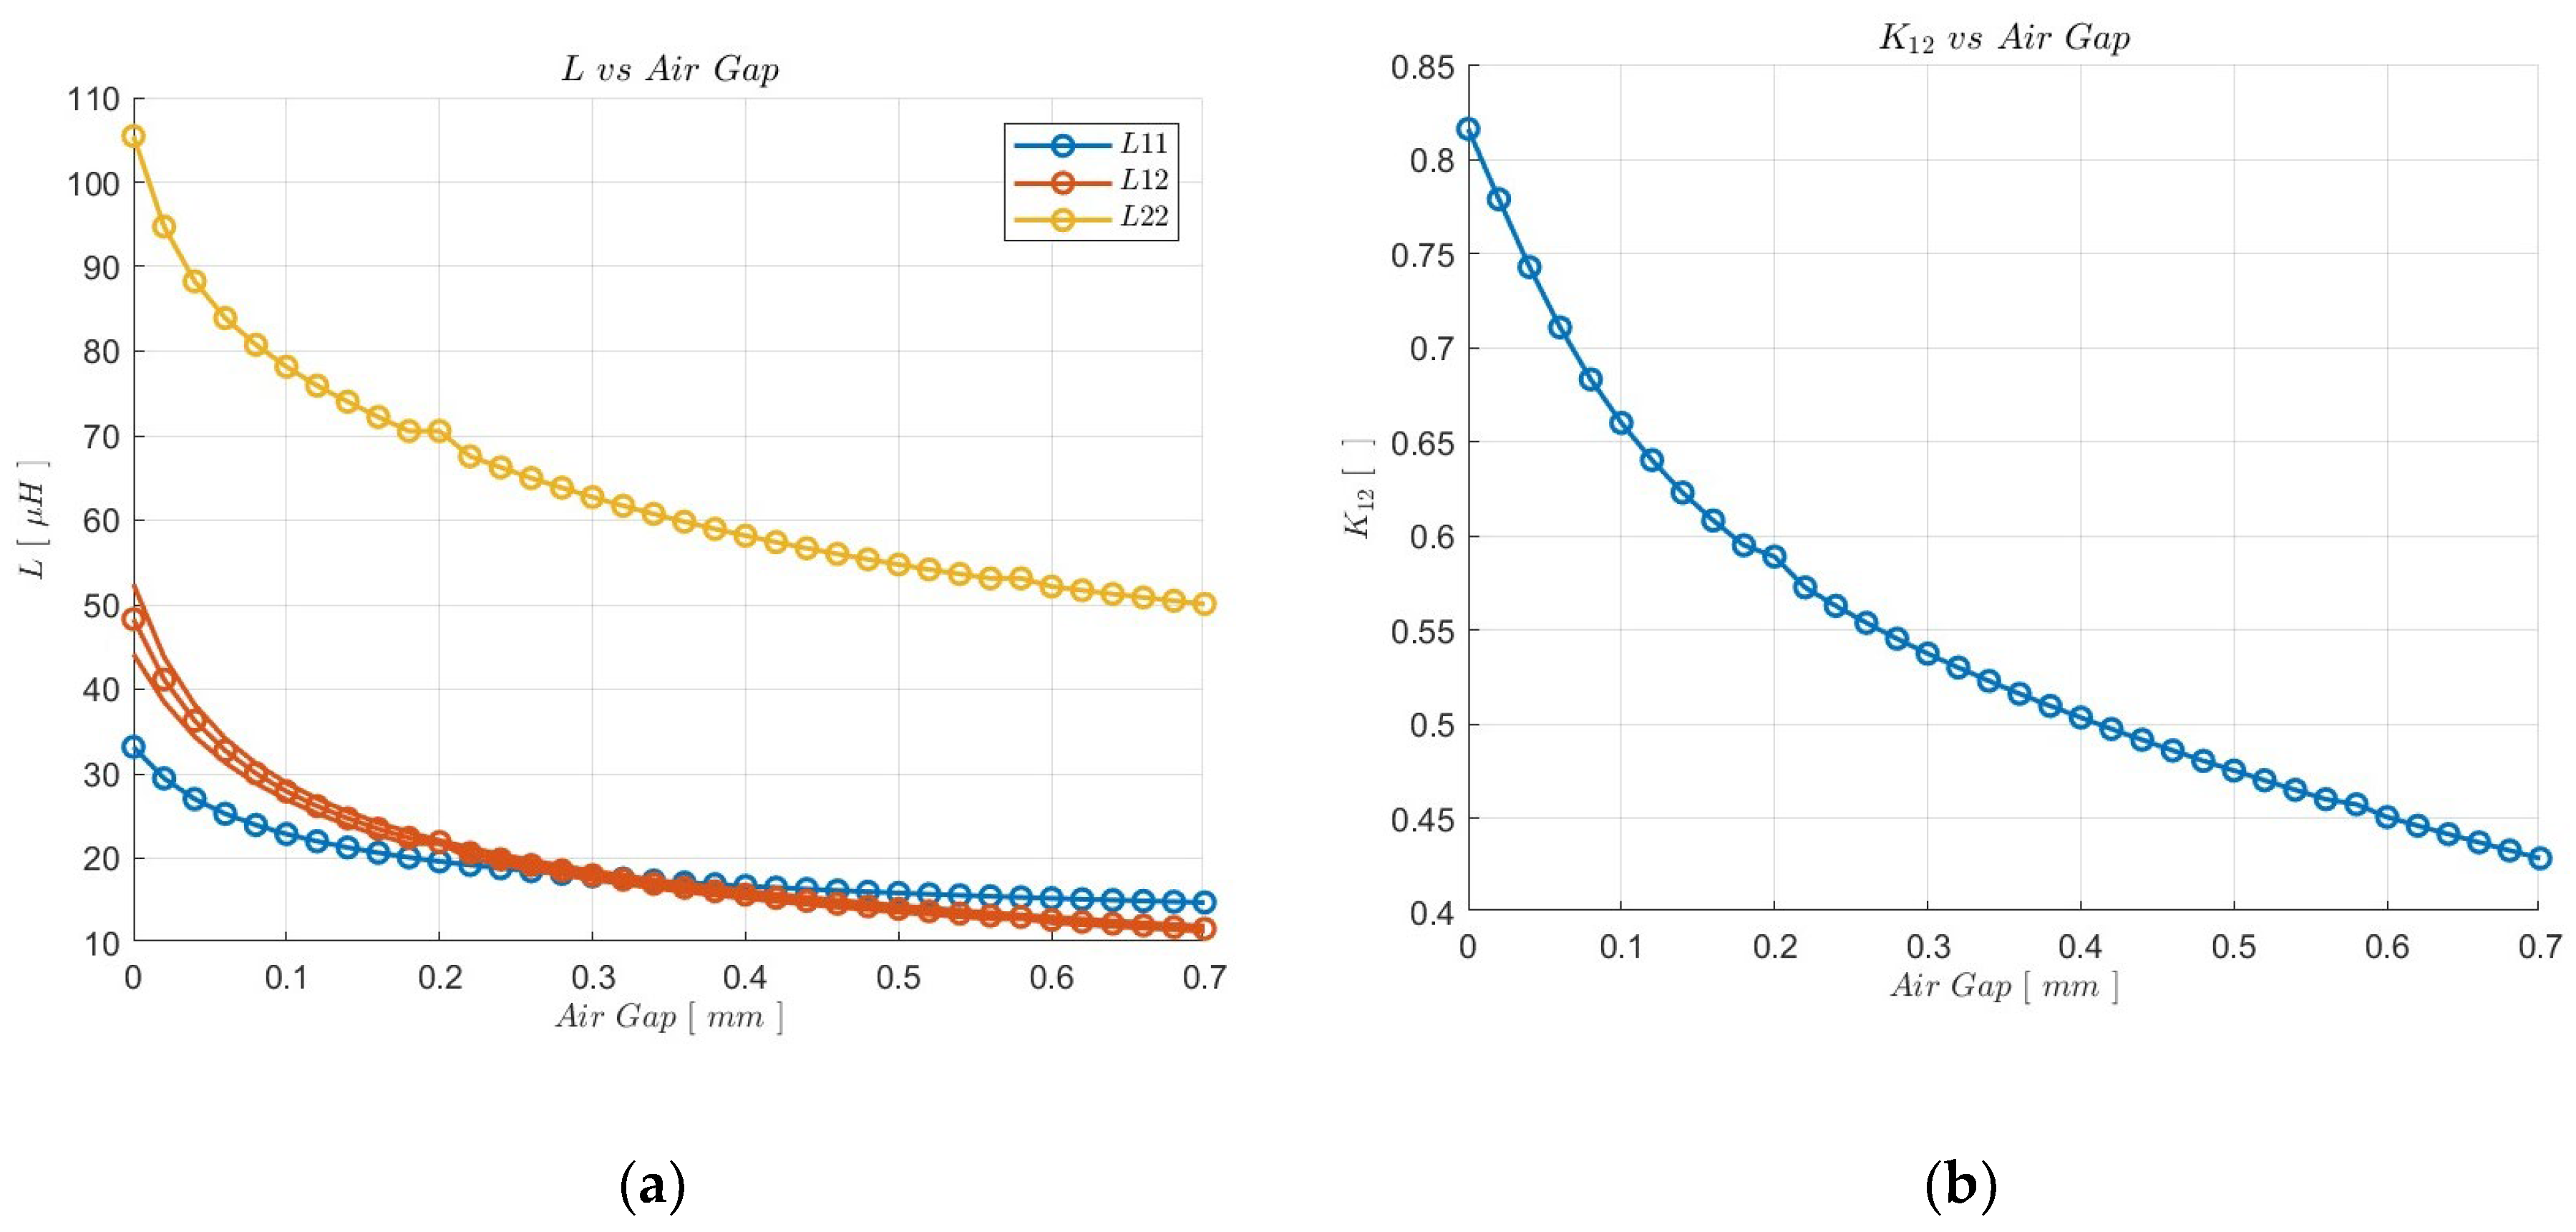
Figure 5a,b depict, respectively, the inductance and coupling coefficient trend along a gap variation from 0 to 0.7 mm.
It is necessary to note that for the mutual inductance trend L 12 , two slightly different curves are reported, which are obtained from two different iterations of the model. This discrepancy is due to an intrinsic error of the resolution of Maxwell’s equations through the finite volume method. For the sake of simplicity, the final value adopted during further calculations is obtained as the average of the two curves.
The coupling coefficient trend instead highlights the close dependence between the performances and the air gap; the graph depicts a 19.5% reduction in transmission properties only after a tenth of a mm.
In detail, to obtain a stable and reliable resolution of the magnetic field presented in Figure 4 as well as high fidelity of the reported results, according to the FVM modelling approach, the core material is partitioned as follows:
  • Along X-axis: 51 subdivisions;
  • Along Y-axis: 13 subdivisions;
  • Along Z-axis: 5 subdivisions.
This deviation in the parameters is due to the fact that the magnetic field lines inside the core material are mainly arranged parallel to the X-Y plane. This aspect introduces the necessity to refine the volumes′ subdivision along these main axes to obtain a better solution, even where the field lines tend to curve, such as at the ends of the ferrites where the core material is not wound by the coil.
Instead, the copper windings are modeled as a racetrack coil of 28 turns for the emitter side and 53 turns for the receiver, with a wire diameter of 0.1   mm for both inductors. From the point of view of the simulation, the resulting inductance values as well as the coupling factor obtained from a specific air gap configuration can be processed through two main different strategies: the real time co-simulation or the pre-simulation, and look-up table interpolation.
In the case that the real application of the device presents a strict correlation between the coupling aspects with two or more kinematic variables, a real time co-simulation is considered necessary; this is the case in which the inductors are mounted onto a mechanical assembly that allows a variation of the gap not only along the direction normal to the face of the core, but also along some other random directions.
On the contrary, as for the experimental case under analysis, if the dependency presents a single kinematic correlation, it is possible to pre-simulate the whole 3D magnetostatic behavior for all 1D air gap variation and to pass these L i j and K i j trends to the co-simulation model in the form of an interpolated look-up table. This last case allows the computation performances of the entire multi-domain model to considerably increase.

4.4. SPICE-Based Equivalent Analog Electronic Circuit: Time Domain Analysis

Figure 6 reports the graphic user interface (GUI) schematics of the SPICE-based equivalent circuit model (ECM). In detail, the main sections of the ECM are the emitter side and the receiver side.
In the emitter side are implemented the emitter inductor with all the equivalent stray components, such as the high-frequency AC resistance, the intra-winding capacitance, the auto and mutual inductance, as well as a behavioral current source that, as proposed by Abramovitz and Yaakov in [22], solves Equations (7)–(11). To improve the computational performances and solve the NETLIST through the NGSpice solver, the integrals that are present in the previously reported equations are settled through two analog electronics R-C integrators. On the receiver side, the previously presented emitter modeling is implemented in the receiver inductor with all the stray equivalent components.
The function generator, the shunt resistor and the load are implemented in the ECM schematics in order to replicate the experimental set-up that is presented in Section 5.
It is important to notice that the majority of the components have been parametrized on the basis of the lumped parameters defined and obtained by the set of equations reported during the discussion of the paper. The list of parameters and the relative initial condition values are found under the so-called parameters table. This table represents the heart of the analog electronics co-simulation, as it allows solving the dynamic behavior of the coupling aspects affected by the other domains through continuous updating; this is on the basis of the inter-exchange architecture reported in Figure 2 for each configuration achieved at any single time instant of the simulation.

4.5. SPICE-Based Equivalent Analog Electronic Circuit: Frequency Domain Analysis

The model presented herein (Figure 7) depicts the GUI schematization of the circuit implemented for the frequency domain analysis. From a schematic point of view, it differs from the previous circuit (Figure 6) only in the so-called load and function generator sections.
Under the function generator, the voltage source is only parametrized on the base of its signal amplitude to allow the frequency sweep; on the other side, the load section reports the introduction of a capacitor to fully replicate the experimental set-up used in the frequency domain analysis. The maximum operating frequency that the function generator used during the experimental champaign was able to supply is equal to 1 MHz. The introduction of a 1   [ nF ] capacitor allows the natural frequencies of the resonator to move into a range that is practically excitable during the experimental activities; more information is provided in the dedicated section (see Section 5).
From the point of view of the simulation, the model continues to follow the co-simulation architecture shown in Figure 2; however, unlike in the previous case, the system is not dynamically evaluated on the basis of the time scale, but the dynamic response of the device is investigated under the frequency domain through a frequency sweep.

5. Experimental Validation and Results Comparisons

5.1. Introduction

The experimental activities described in this section are carried out to derive an accurate estimation of the measurable constituting parameters of the model, and to provide a comparison and validation of the behavior predictions obtained from the numerical co-simulation analysis.
In detail, the section is subdivided as follows: the first paragraph describes the WPT device; one paragraph is dedicated to the description of the experimental set-up with particular focus on the controlled gap variation apparatus; and, finally, a paragraph is allocated to a numerical–experimental comparison of the voltage and current trends on both the source and load sides in the time domain, as well as in the frequency domain.

5.2. The Wireless Power Transfer Device

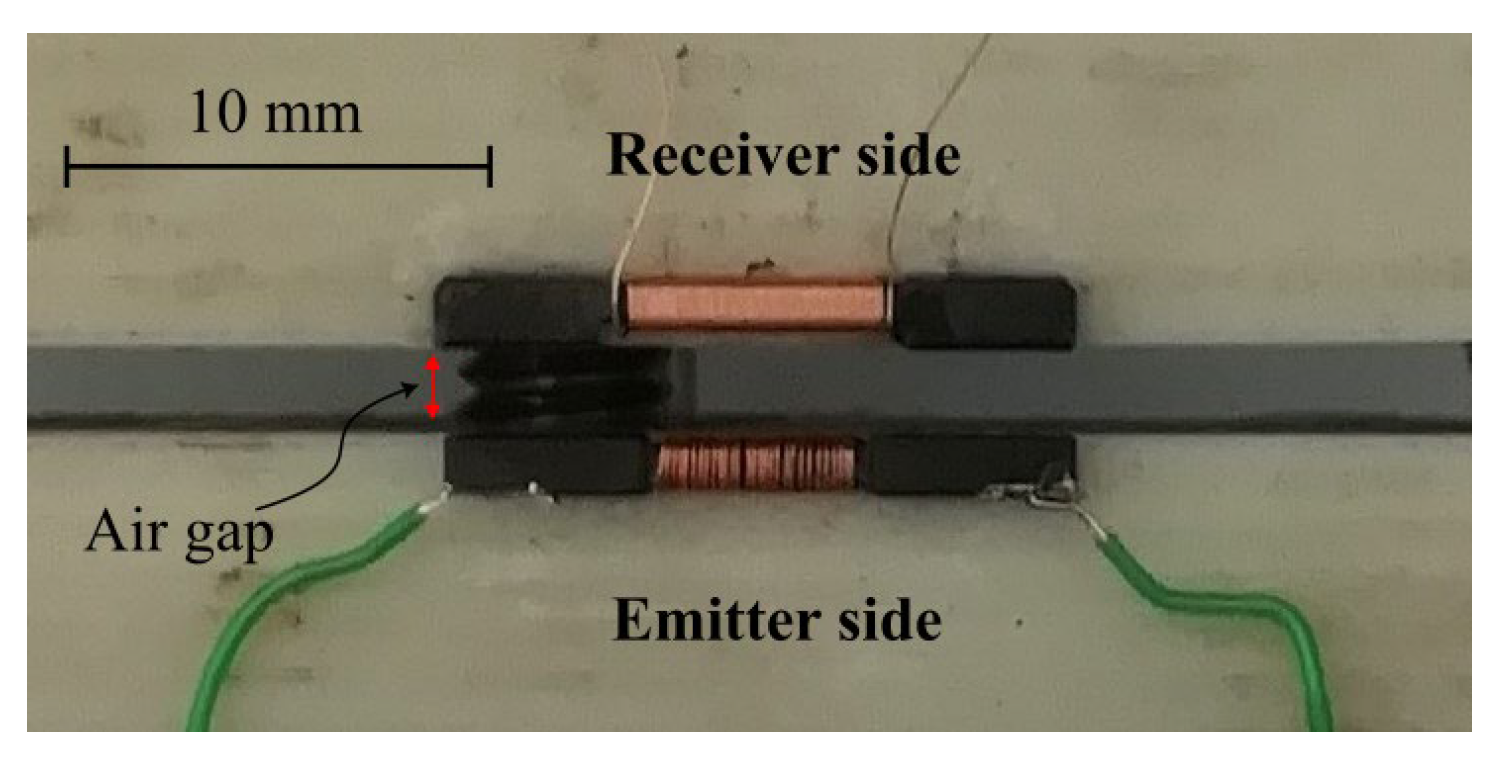
Figure 8 depicts the tested coupled resonator; the device is mounted over a designed set-up facing the two inductors through a controlled variable air gap. The main constitutive characteristics of the device are:
  • Emitter side: 28 turns 0.1 mm of insulated copper wire wound over an ACME-H5 core material.
  • Receiver side: 53 turns 0.1 mm of insulated copper wire wound over an ACME-D28 core material.
In order to provide a detailed description of the device, the most significant and directly measurable lumped parameters are provided in Table 1.

5.3. The Experimental Apparatus

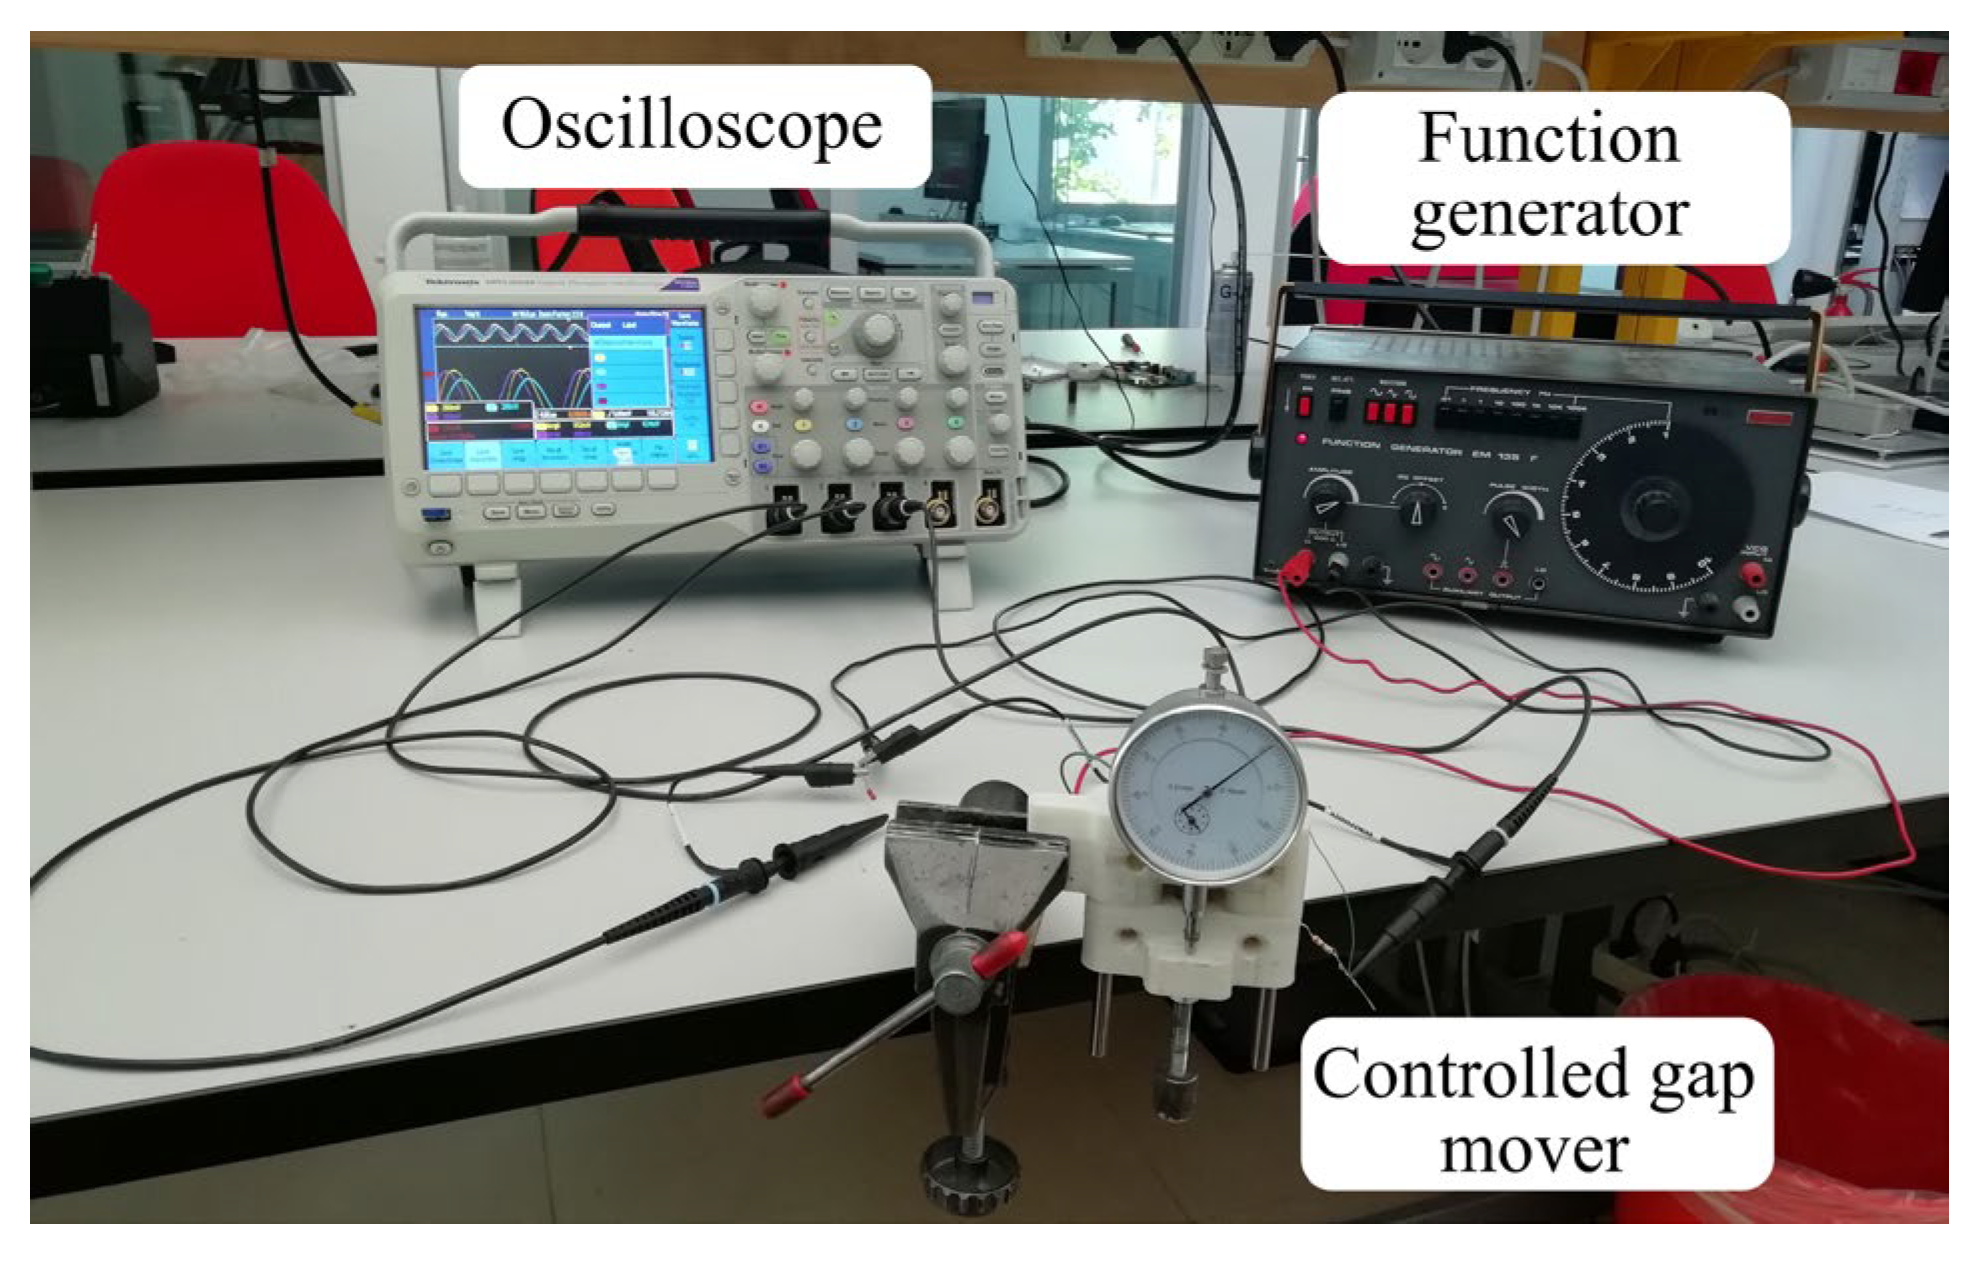
The experimental apparatus used during the dynamic analysis of the campaign is reported in Figure 9. Figure 10 shows a schematic representation of the two main measured circuits. The two reported schematics essentially present the same component connection, with the only exception being a capacitor on the load side. Figure 10a identifies the schematic used for the validation of the co-simulation model under the time domain, while Figure 10b depicts the circuit used for the frequency domain validation. The apparatus is composed of a function generator that introduces an AC sinusoidal voltage excitation on the emitter side, sampled through so-called Channel 1 of the oscilloscope. The current circulating in the primary side is measured by the Channel 2 probe through the voltage drop across a shunt resistor. The introduced excitation induces a voltage through the coupled WPT that is measured across the receiver via the probe called Channel 3. Depending on the measuring circuit, this induced power is absorbed by the load side, which can only consist of a resistor or a parallel between a resistor and a capacitor. The most significant features of the electric parameters are reported below in Table 2.
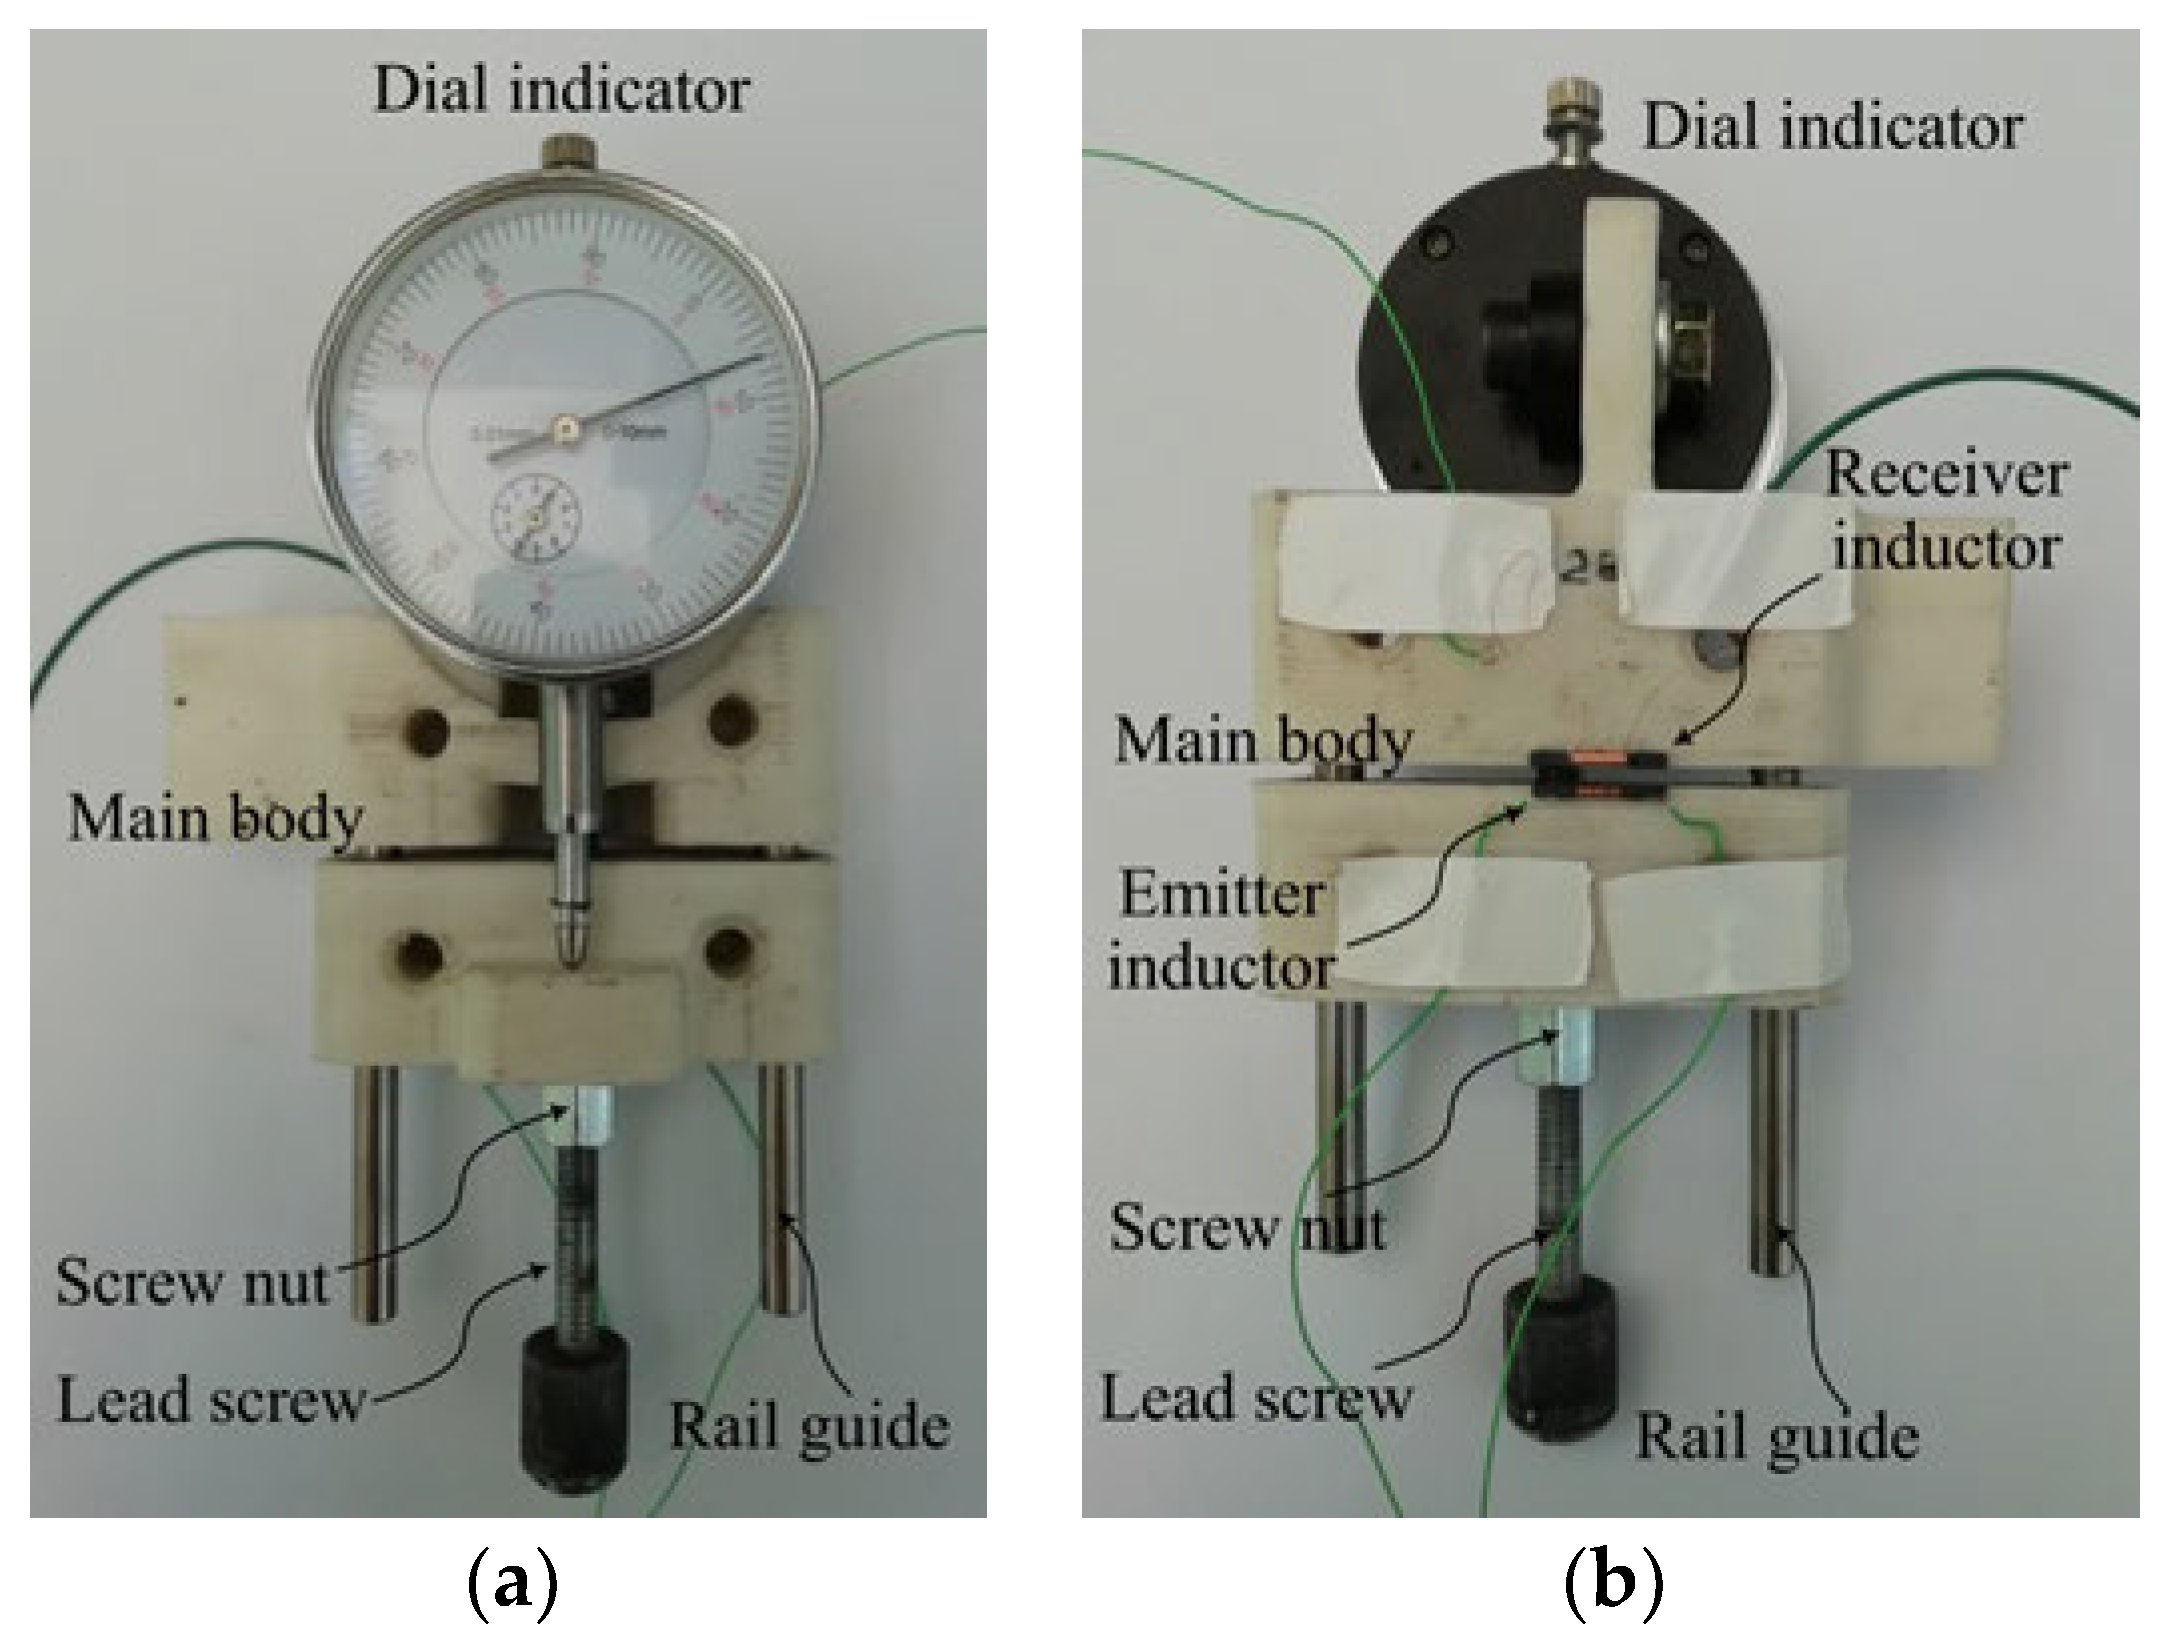
Finally, in order to provide an appropriate explanation of the used experimental apparatus, it is important to describe the controlled gap mover device. The main body of the system consists of a stationary frame and a mobile frame guided by two parallel round rail lines. The mobile part is driven by a nut-screw coupling which, through a controlled rotation of the lead screw, allows the fine adjustment of the air gap. This parameter is measured using a centesimal dial indicator, which is mounted on side A of the device (Figure 11a). On the other hand, on side B (Figure 11b) the two cored coils are mounted one on the stationary frame and one on the mobile frame, respectively. This WPT coupling resonator is fed and tested by the previously described experimental set-up.

5.4. Tests and Results

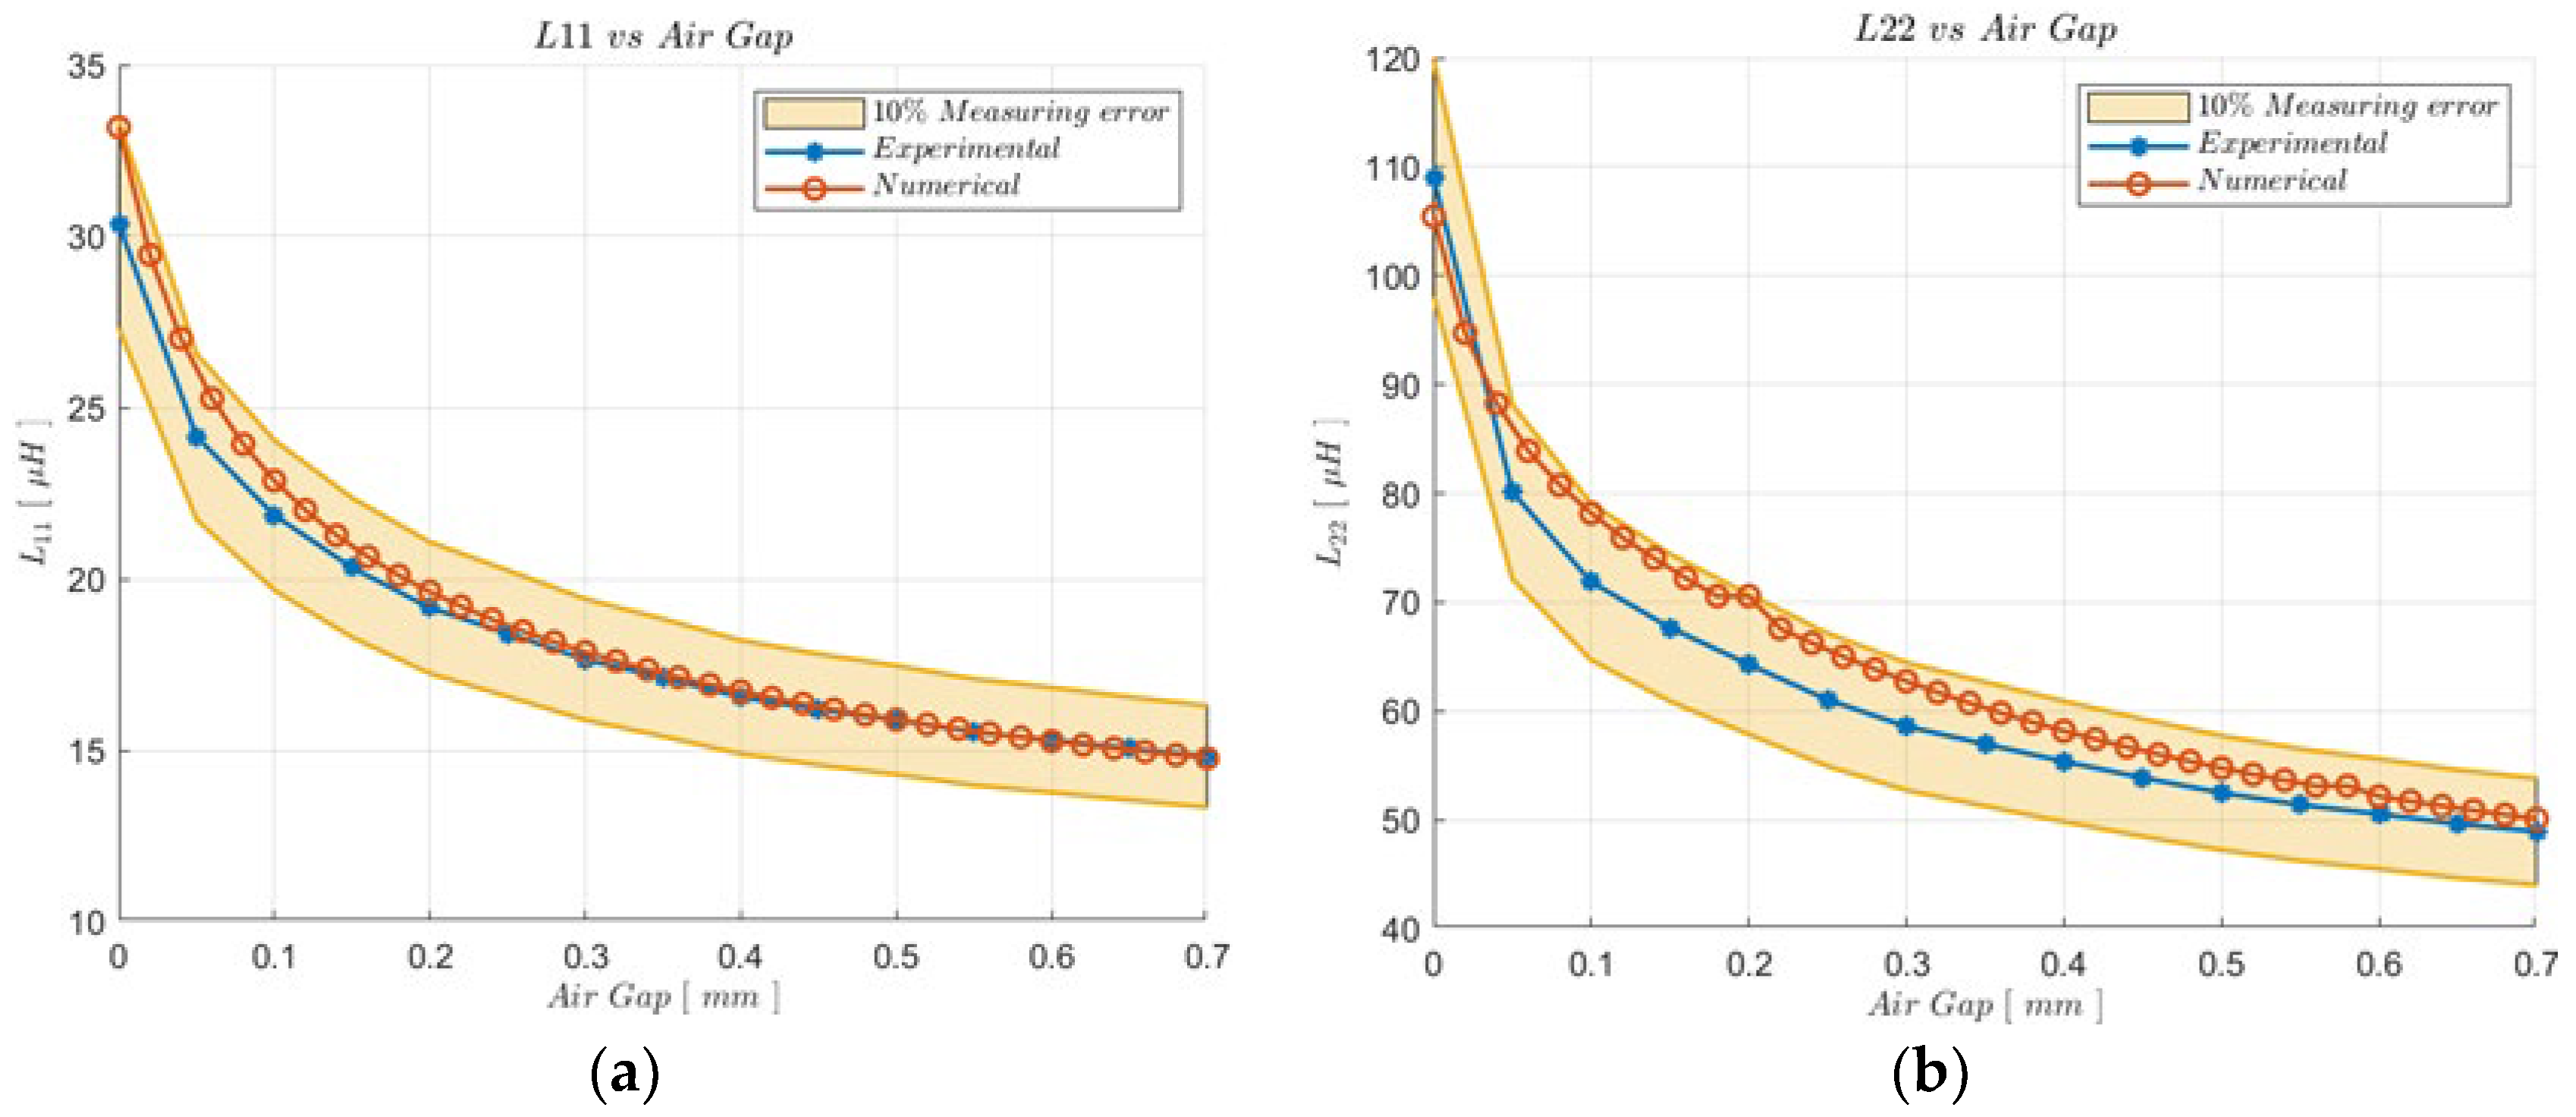
The first experimental activity performed concerns the characterization of the self-inductance parameters of the coupled coils. In detail, the reported measurement campaign is performed identically for both the coils and for all the imposed air gap configurations. The terminals of one of the two coils are connected in parallel to a digital multimeter, which returns the measured value of auto-inductance for each measured gap configuration. To avoid influencing the obtained results, the terminals of the unconnected coil are left free.
Figure 12 depicts the auto inductance of the coupled cores for the emitter and receiver side, respectively, consequent to a gap variation. The blue line identifies the measured trend with a discretization on the gap variation of 0.05 mm, due to the uncertainty on the measurement, and the possible errors introduced by the whole apparatus are considered a ± 10 % deviation that is delimitated by the yellow area reported in the graph. The red line represents the numerical results estimated by the previously described 3D FVM model. As can be noticed, the numerical results are quite accurate for the entire considered gap window within the ± 10 % error. This numerical–experimental comparison made it possible to validate the magnetostatic model and obtain, with a fair degree of reliability, the purely numerical estimation of the trends of mutual inductance and coupling factor consequent to a variation of the gap, as reported in Figure 5.
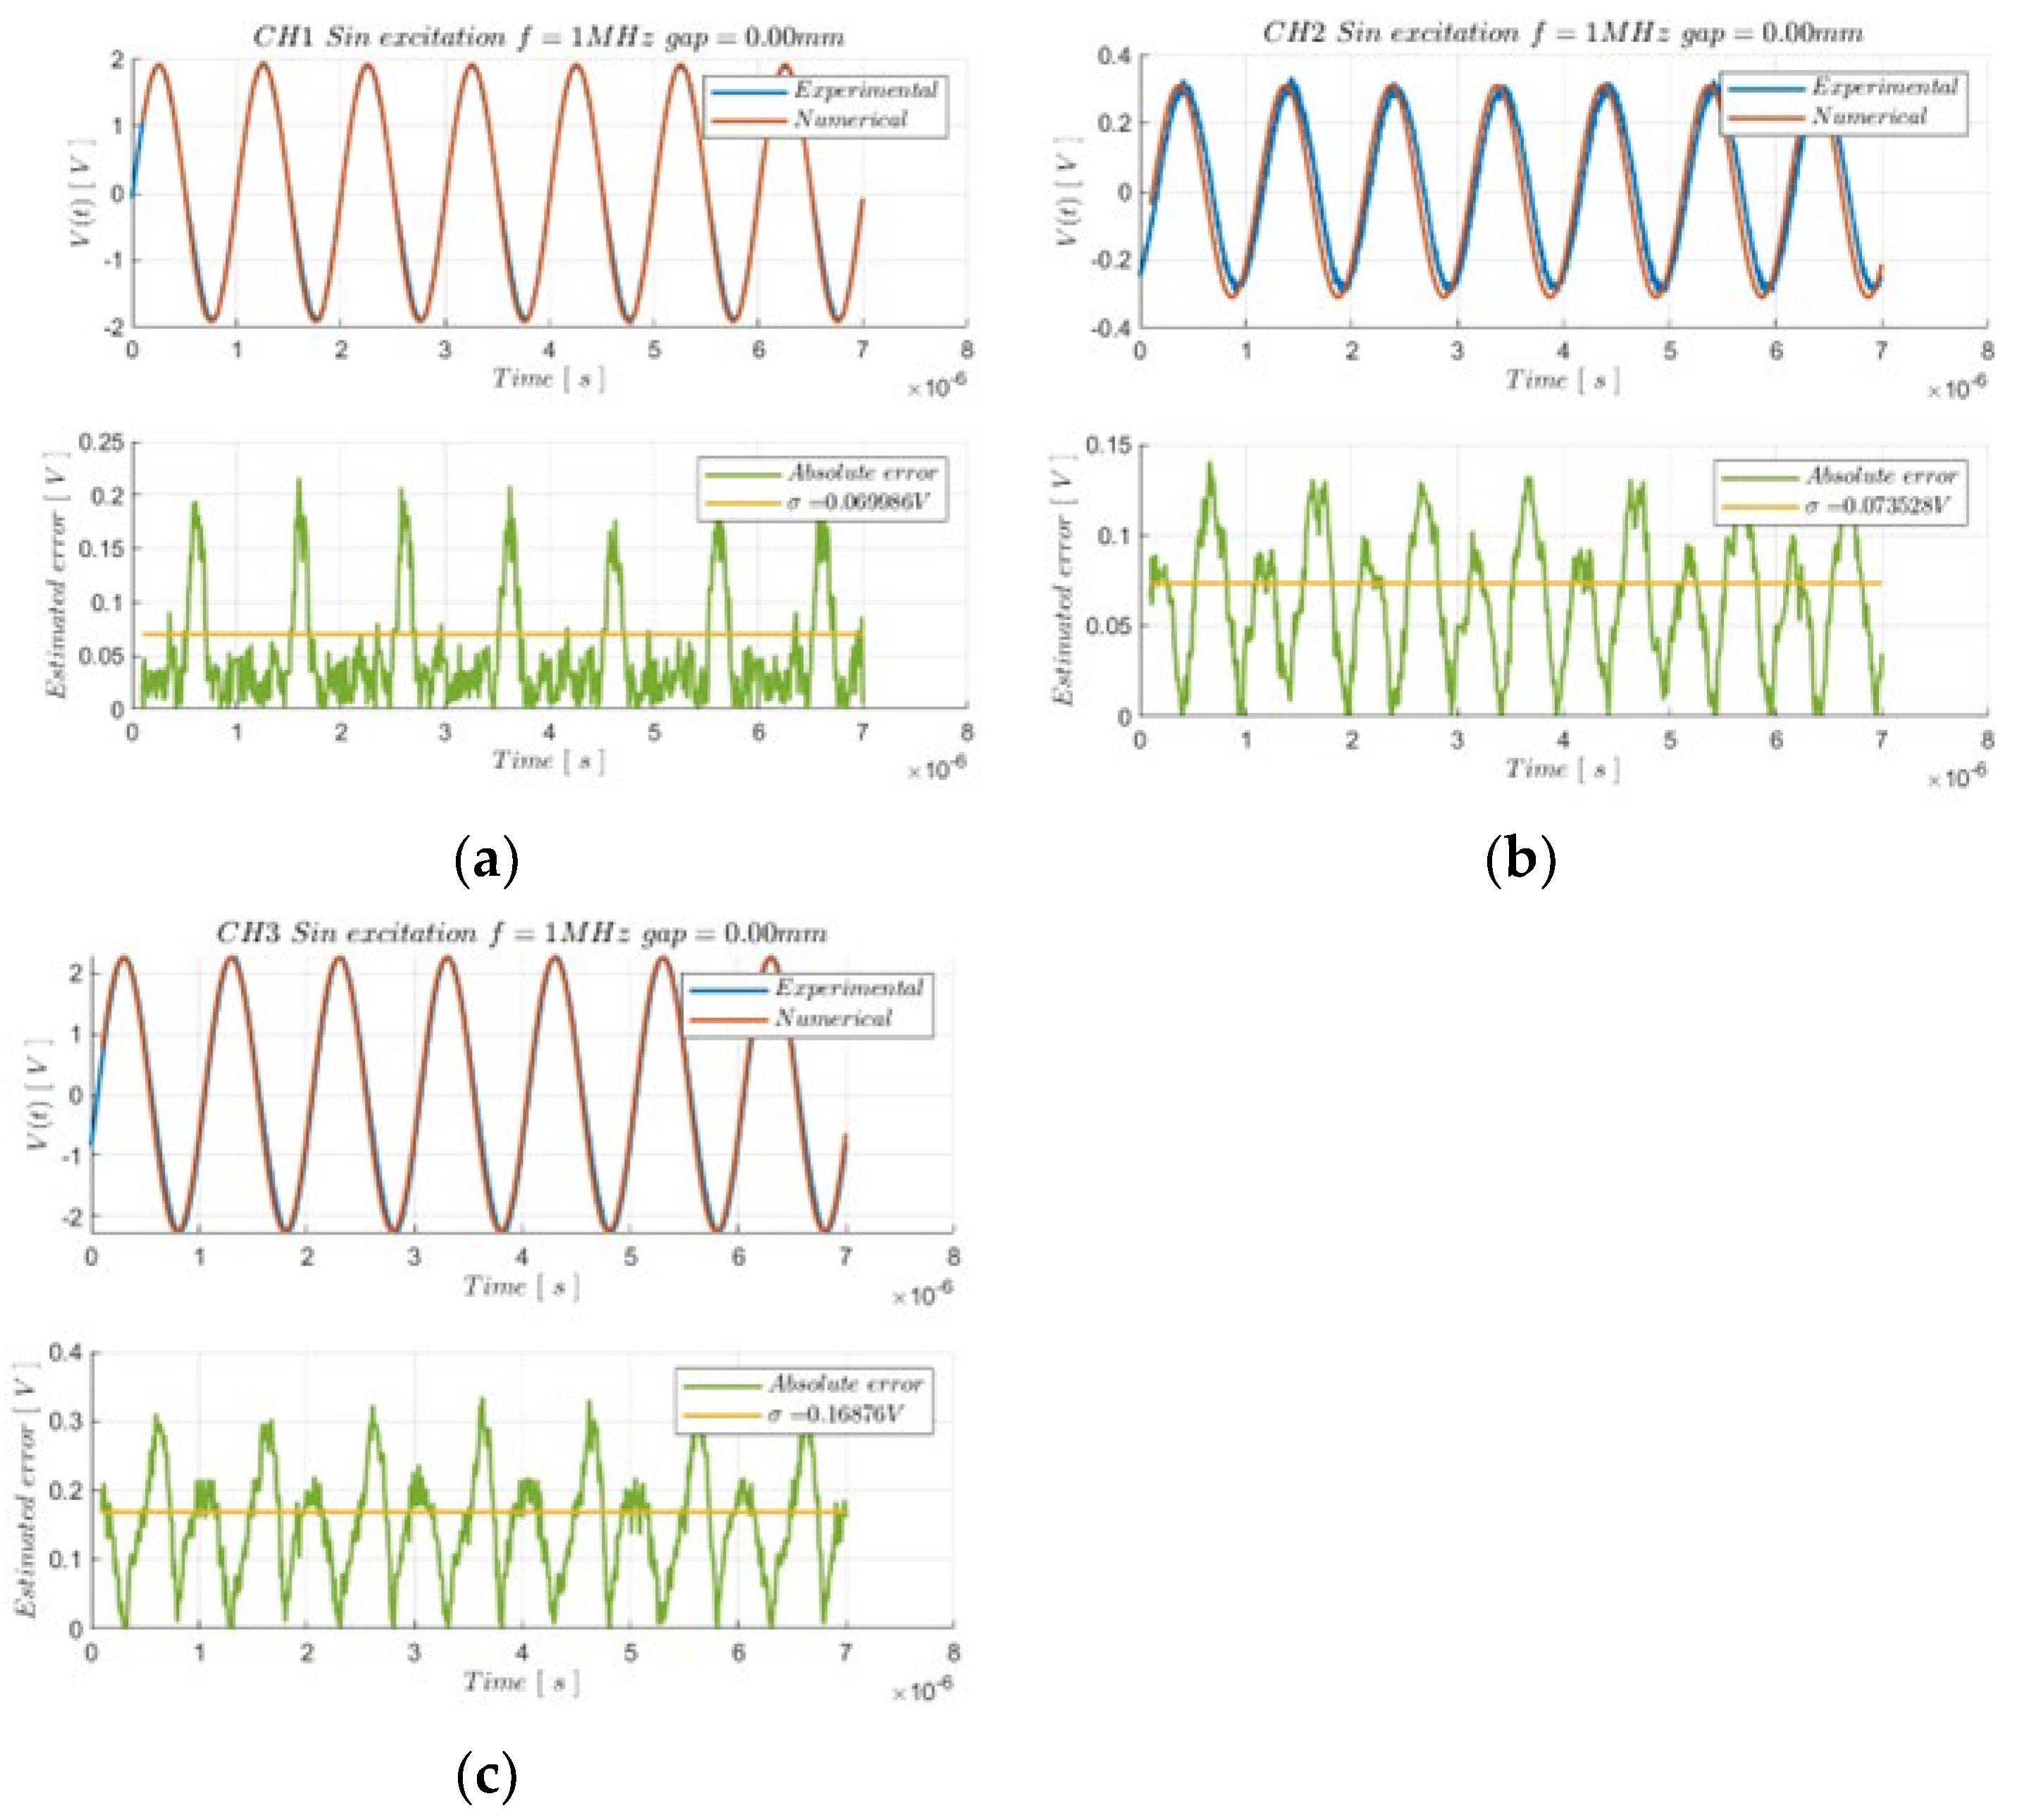
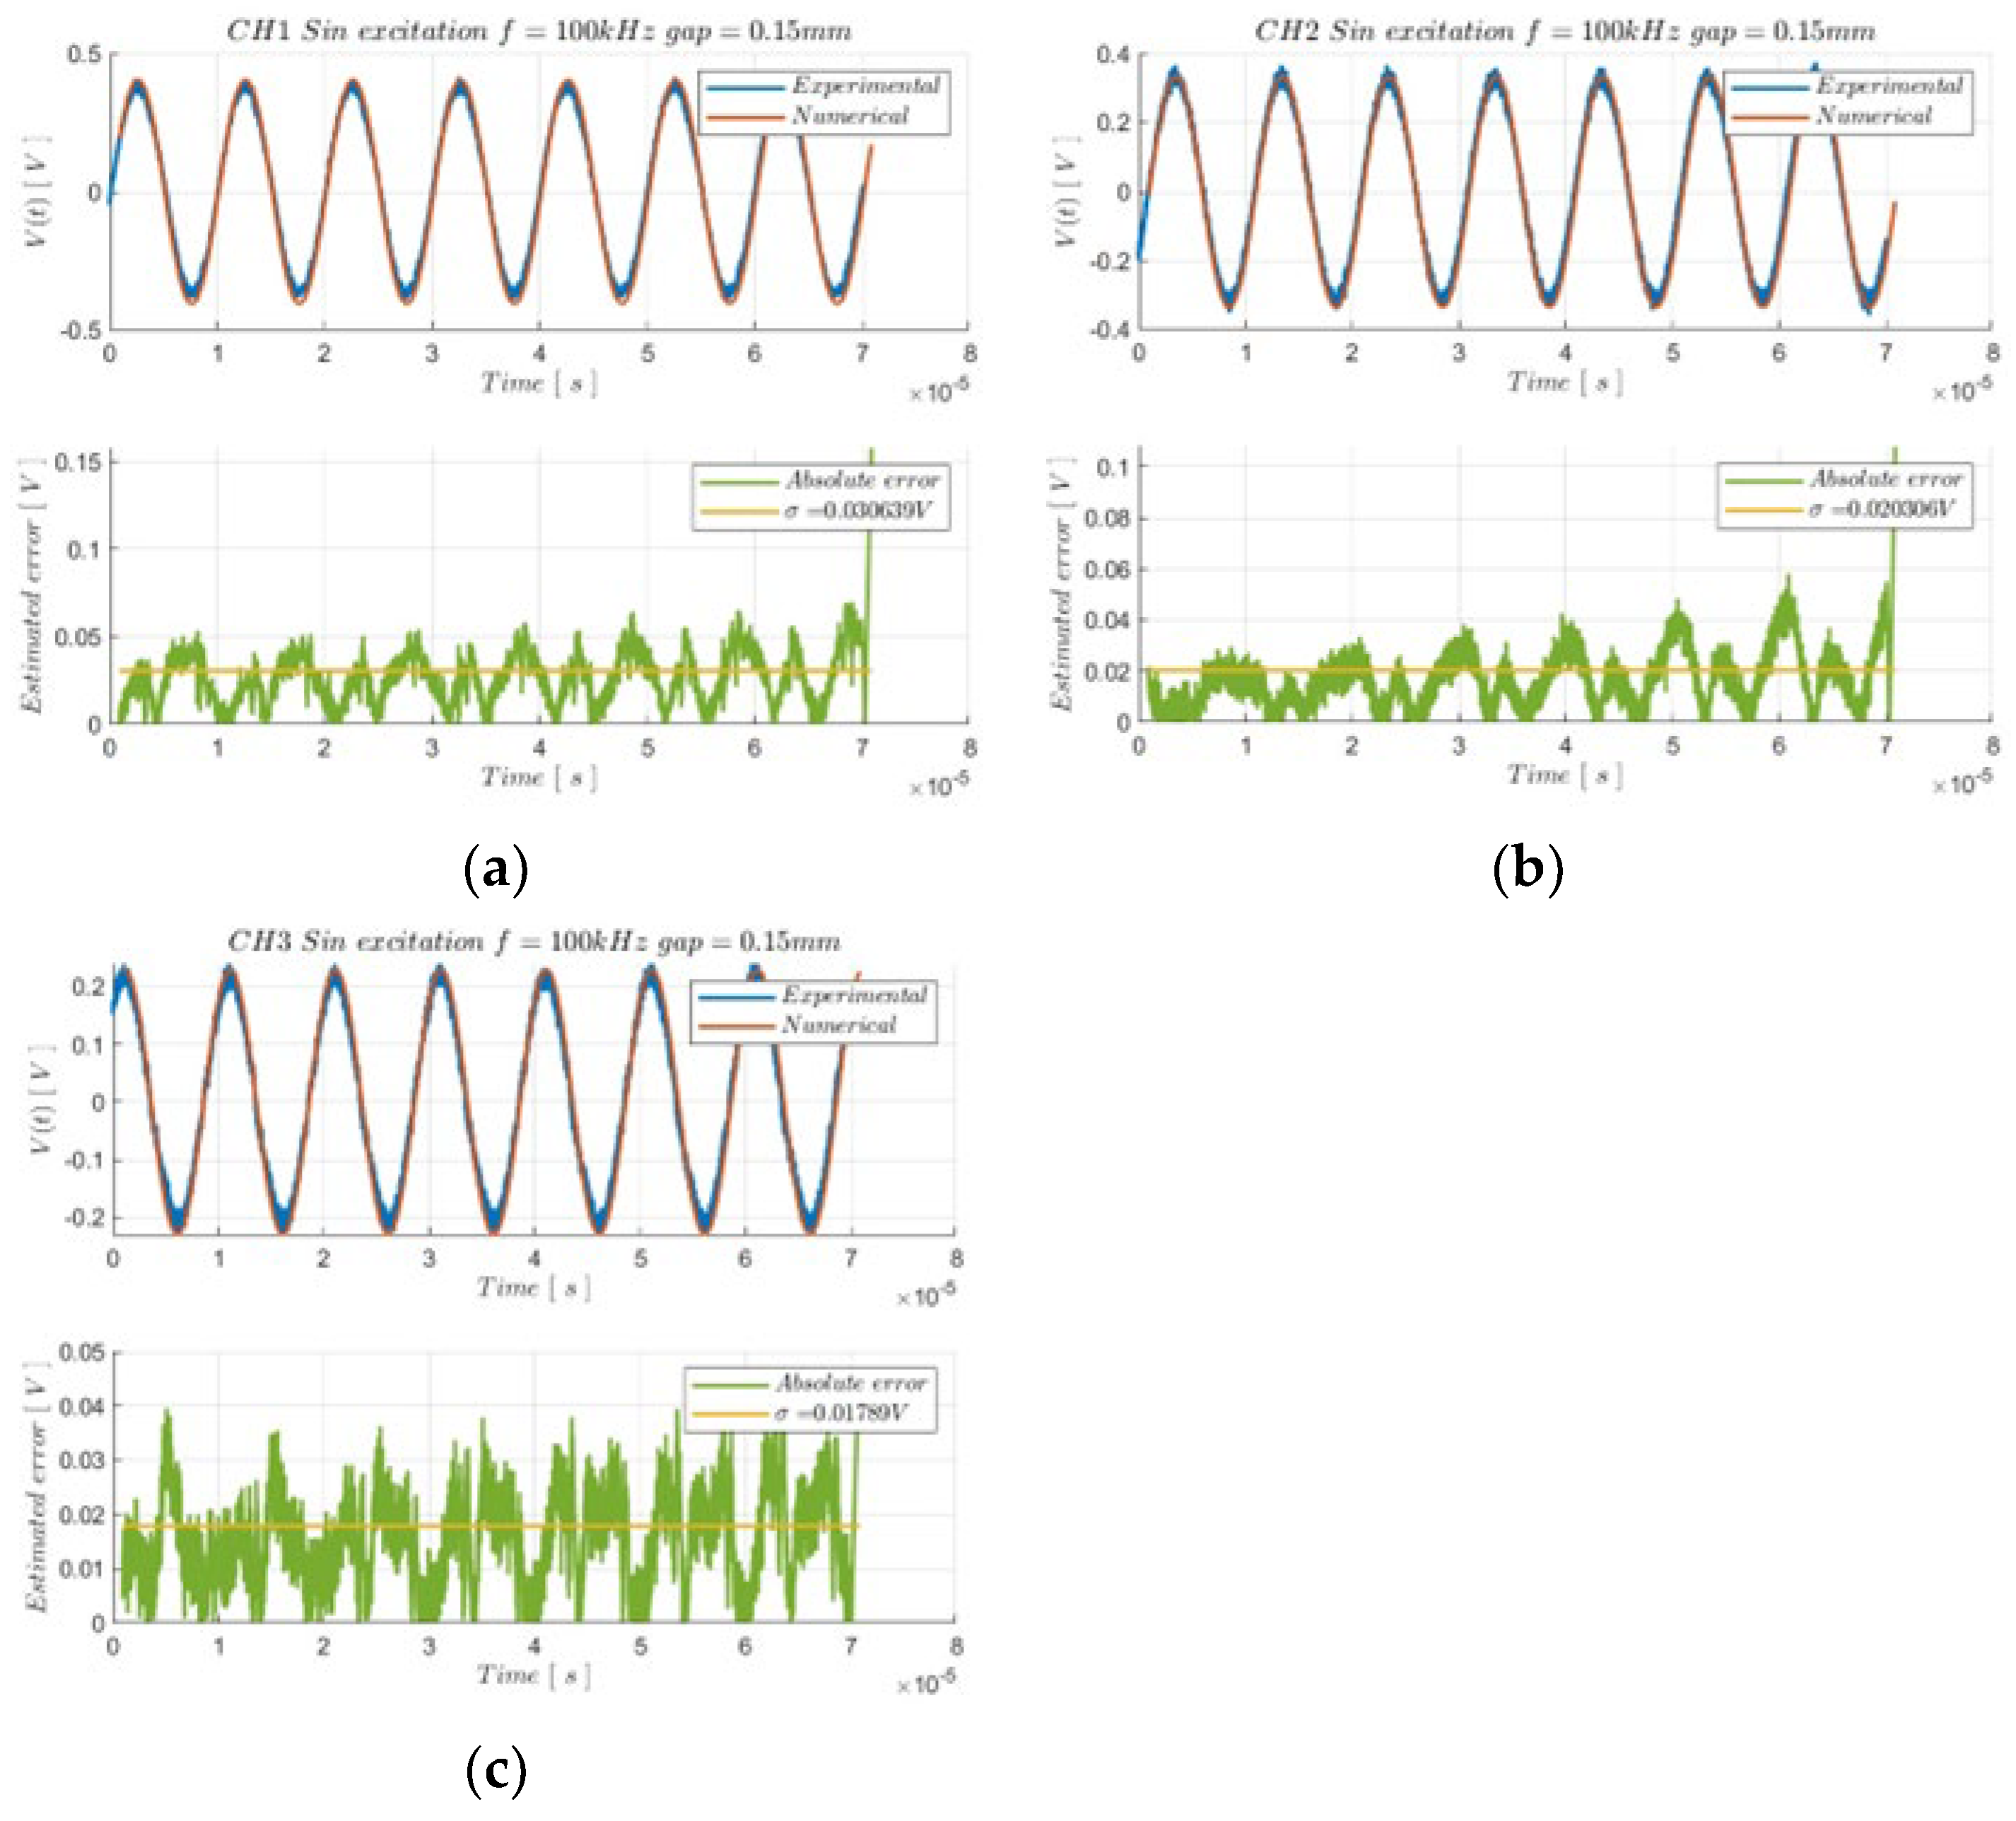
The validation of the entire multi-domain co-simulation model took place through a comparison of the imposed end-resulting current and voltages for both the time domain and the frequency domain. The results of the time validation obtained over the three measurement channels are reported below. To keep the treatment as concise as possible but demonstrate the robustness of the co-simulation model, the experimental comparisons are reported for excitations equal to 1 MHz and 0.00 mm gap (see Figure 13), and excitations at 100 kHz with a 0.15 mm airgap (see Figure 14).
The reported comparisons are obtained on the basis of the circuit depicted by Figure 10a, where CH1 represents the imposed voltage excitation, CH2 represents the current circulating on the primary side through the voltage drop across the shunt resistor and, finally, CH3 represents the voltage across the secondary side. Apart from the imposed signaldepicted by CH1, the resulting response of the model (CH2 and CH3) replicates with a good grade of approximation the real physical behavior for both the applied frequencies and the imposed gap. It is important to notice that for the probe named CH2, although the amplitude voltage of the estimated signal is practically identical to the real case, there is a slight phase shift between the numerical and experimental results. This is due to the quality of approximation of the intra-winding capacitance parameter of the coils, which obviously influences the natural frequencies of the coupled and non-coupled resonator.
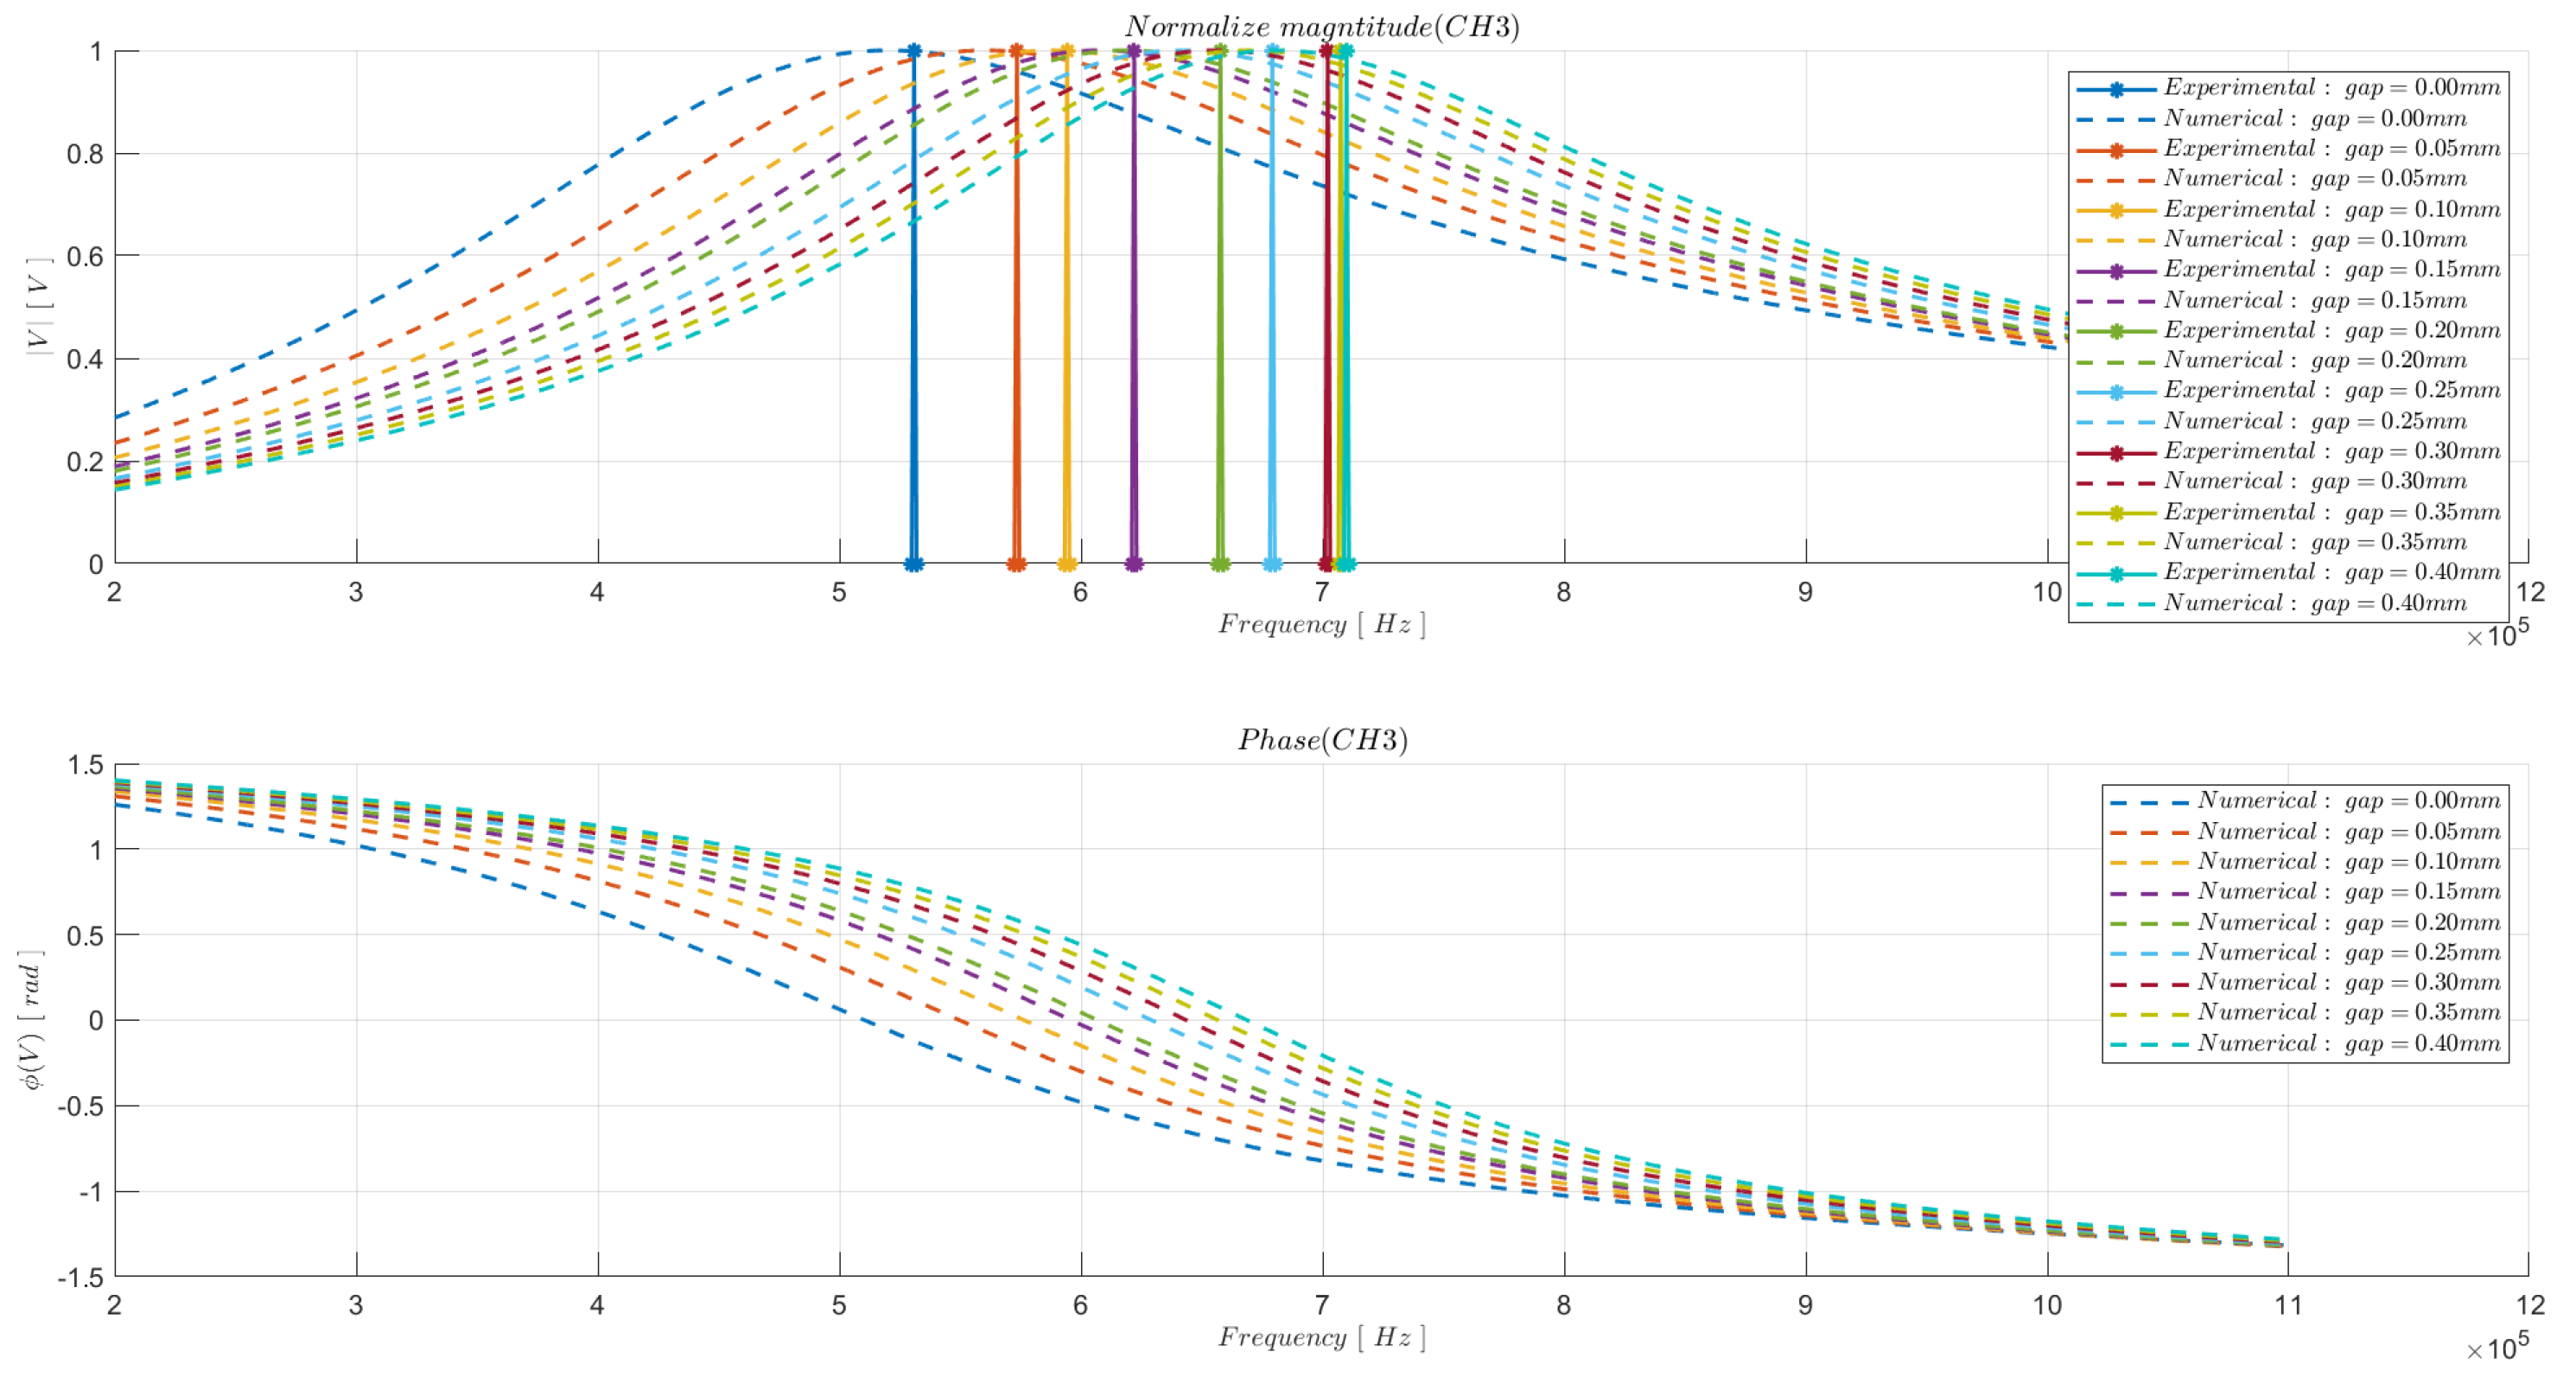
Finally, to complete the discussion about the experimental measurement activities, it is necessary to comment on and provide the resulting comparisons in the frequency domain (circuit shown in Figure 10b). The integration of a 1   n F capacitor allows the overall natural frequency to shift, therefore, enabling the resonance phenomenon for the coupled R-L-C circuit to be appreciated.
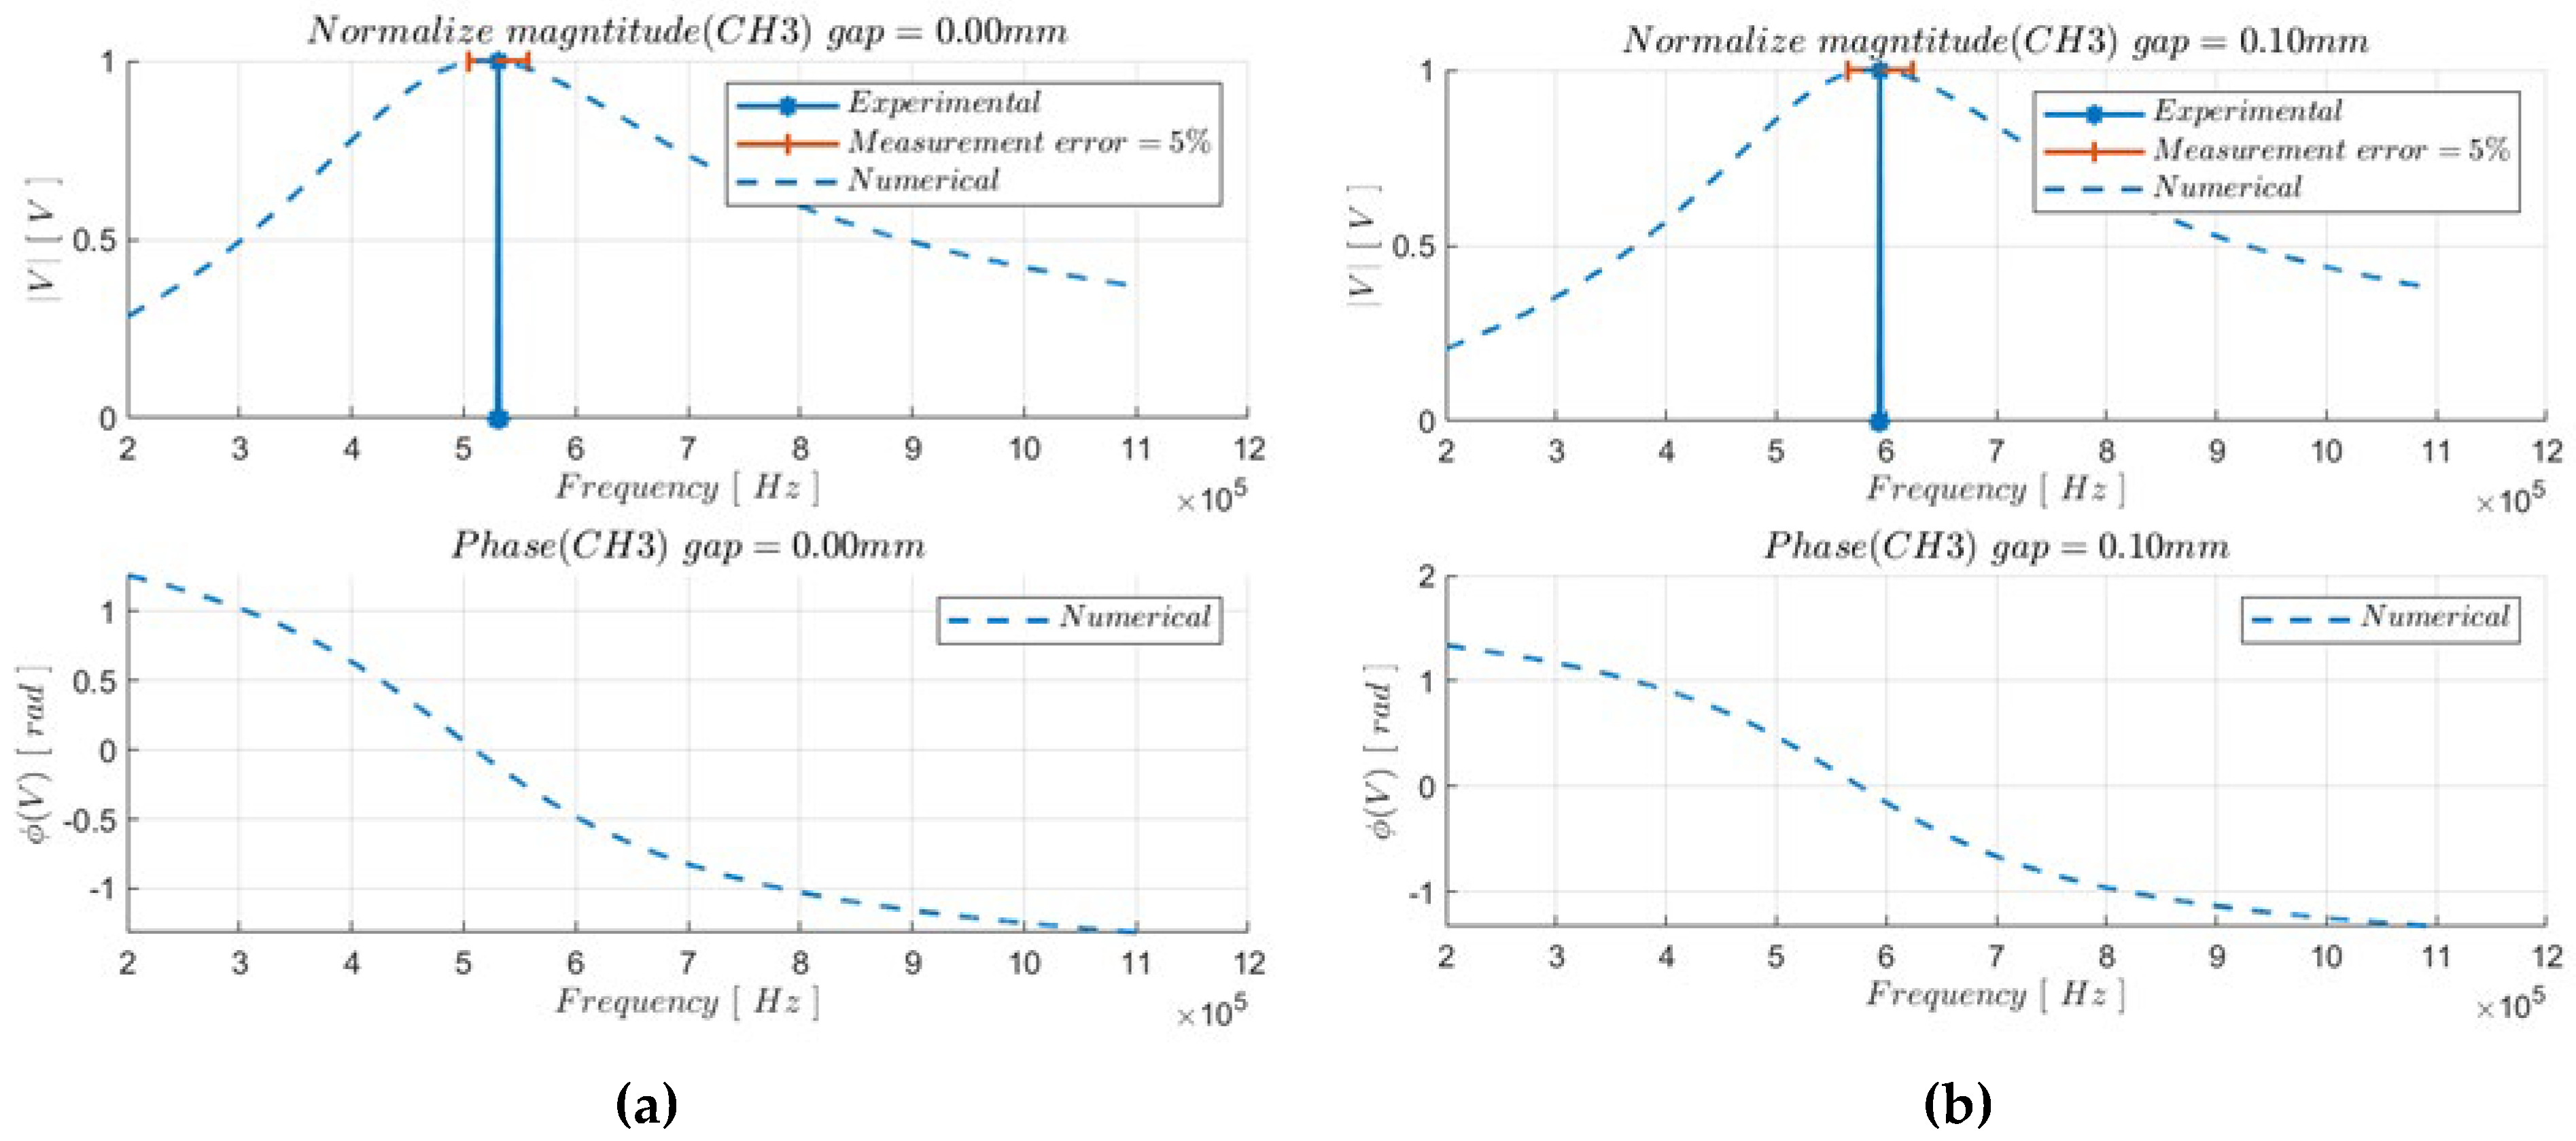
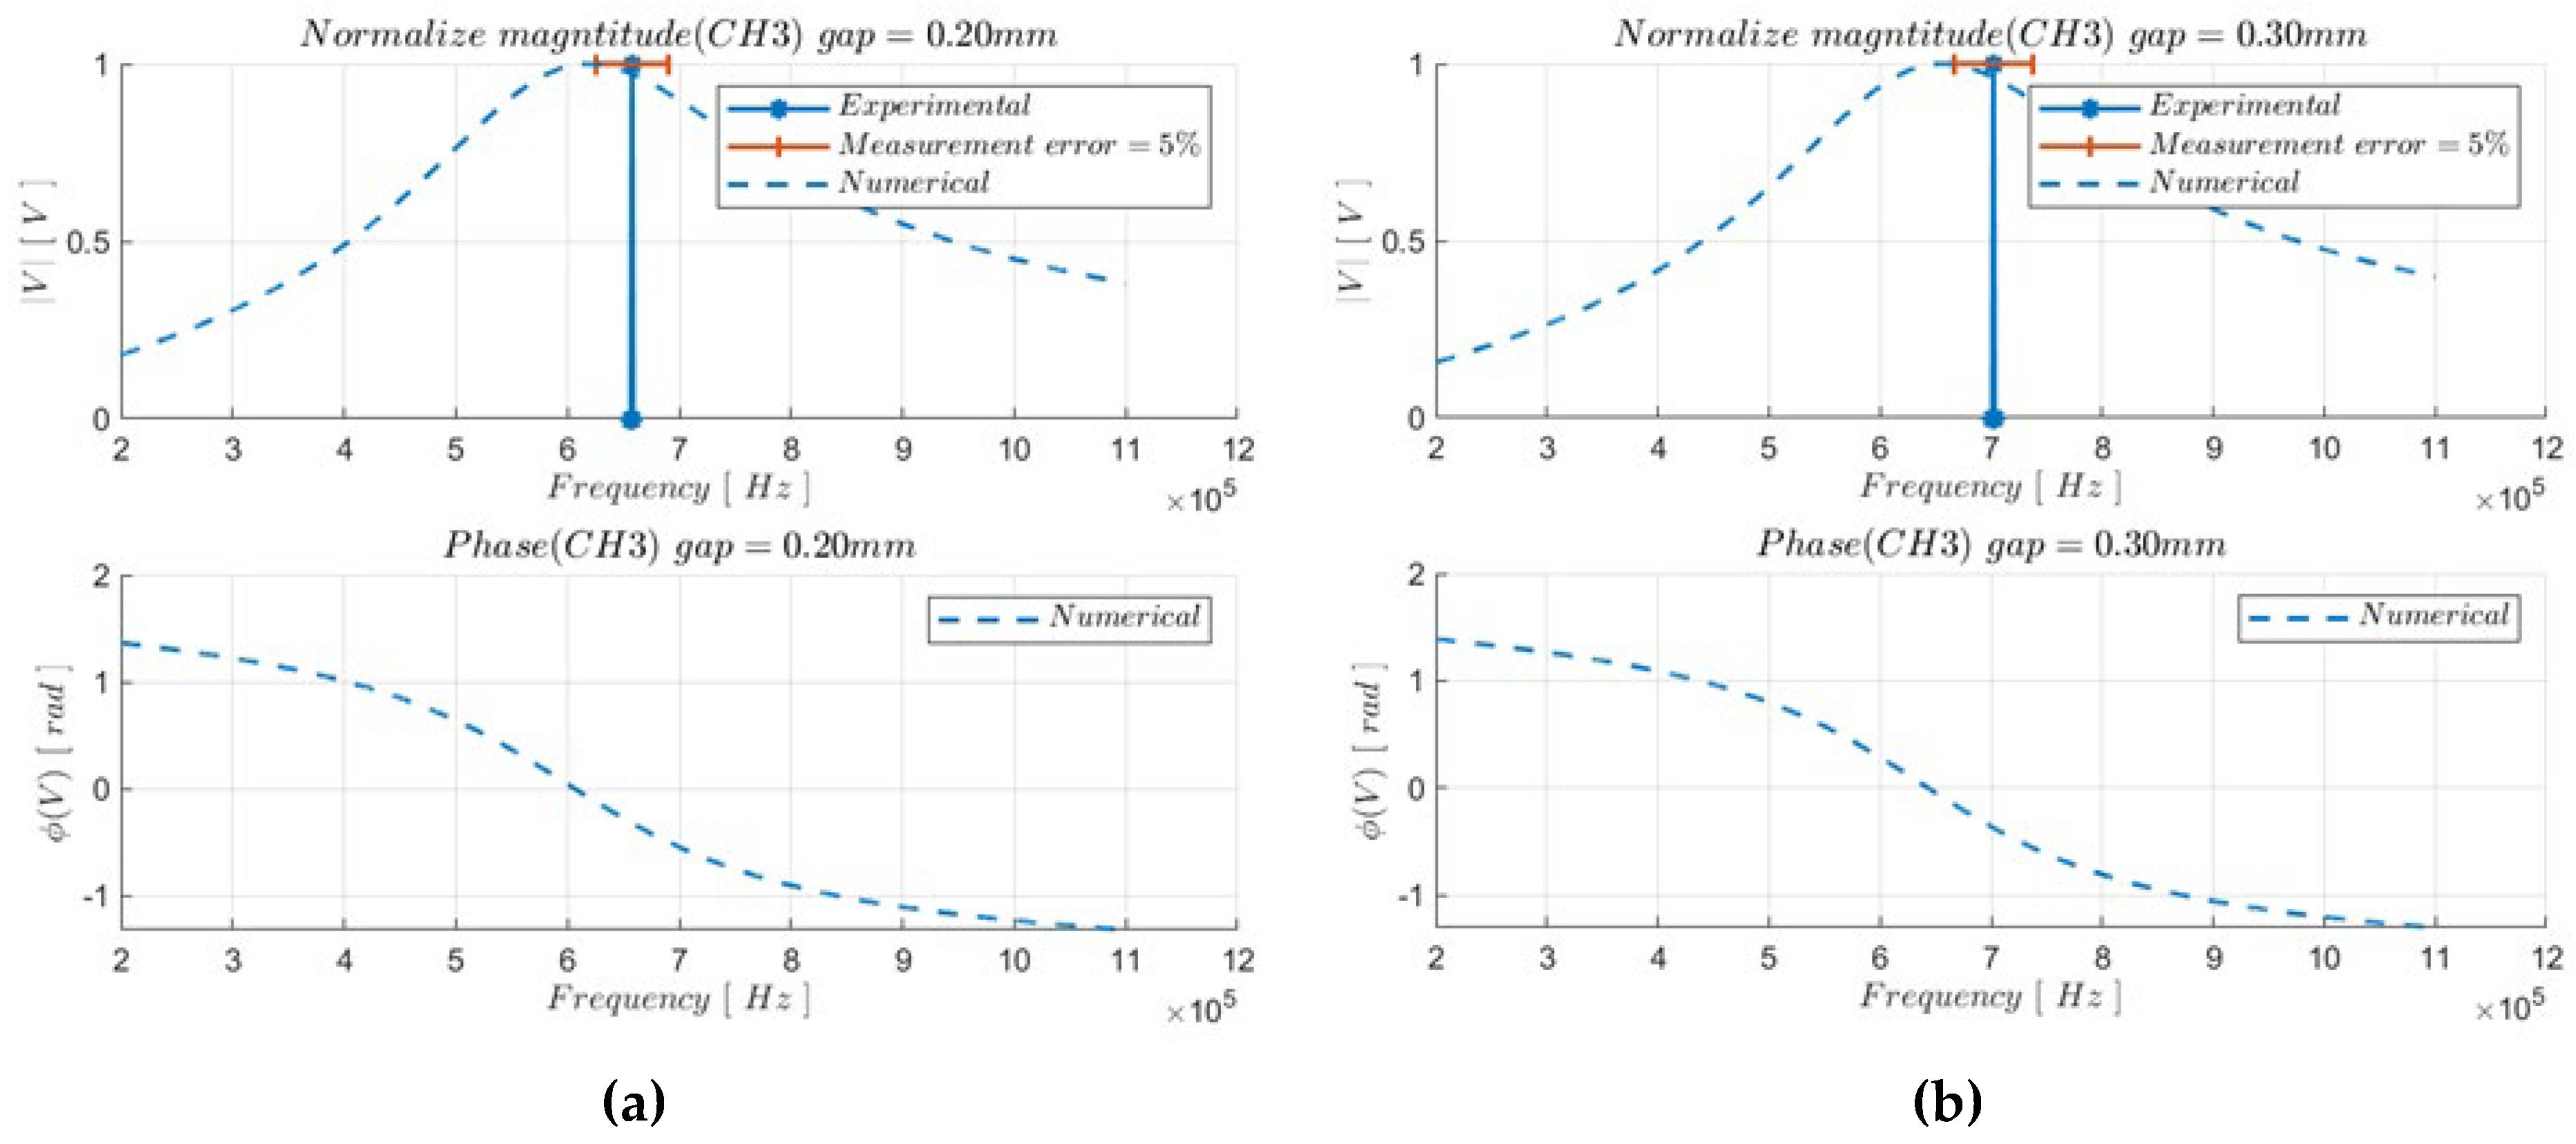
Figure 15 depicts the CH3 normalized response for both the model and for the real device, consequent to a gap variation in the interval [0.00; 0.40] mm with a discretization step of 0.05 mm. The frequency range in which the sweep is calculated is [0.2; 1.1] MHz. Figure 16 and Figure 17 instead represent a focus of the responses for the air gap equal to 0.00 mm, 0.10 mm, 0.20 mm and 0.30 mm. This is to highlight how the discrepancy in magnitude peak estimation tends to increase at a higher gap, but still remaining inside the acceptance range of the 5% measuring error.

6. Conclusions

WPT devices represent a promising solution for data and power transfer applications, both for devices that dispose of a discrete quantity of energy, but also for devices that are applied in behavior where the total amount of energy is strictly reduced. The proposed paper analyses a new type of device: a ferrite-cored, variable gap, high-frequency power and data transfer system.
The standard circuit-based model proposed in the literature can be considered reliable for NFC application where the devices present two air core coils that communicate through light coupling. In the case of n-cored coils coupled through a fluctuating and uncontrollable air gap, the previously cited model can no longer be considered accurate. A complete multi-scale, multi-domain model is proposed herein, which is based on the integrated co-simulation of the Spice-based equivalent circuit modeling analysis and the ESRF Radia-based 3D finite volume methodology, placing particular emphasis on the intrinsic sensitivity with respect to unwanted mechanical and geometric variations.
Furthermore, a detailed experimental methodology is outlined for both the estimation of the main electro-magneto-mechanical static and dynamic parameters, and for the validation of the proposed co-simulation architecture.
The numerical simulation results and measures obtained from a real device are compared, showing that the co-simulation model correctly predicts the dynamic behavior in both the time and frequency domain analysis.
In conclusion, this research work aims not only to introduce an improvement in the modeling of wireless communication applications, but also to provide a guideline for all those who are interested in the numerical characterization and experimental identification of the constitutive parameters useful for understanding the dynamics of a ferrite-cored variable gap WPT device.

Author Contributions

Conceptualization, F.M.R., C.R., S.C. and J.M.; methodology, F.M.R. and C.R.; software, F.M.R.; validation, M.C. and J.M.; formal analysis, F.M.R.; investigation, F.M.R. and C.R.; resources, M.C. and J.M.; data curation, F.M.R. and S.C.; writing—original draft preparation, F.M.R.; writing—review and editing, F.M.R. and S.C.; visualization, F.M.R.; supervision, C.R. and S.C.; project administration, C.R. and S.C. All authors have read and agreed to the published version of the manuscript.

Funding

This research received no external funding.

Institutional Review Board Statement

Not applicable.

Informed Consent Statement

Not applicable.

Data Availability Statement

Data are unavailable due to privacy.

Conflicts of Interest

The authors declare no conflict of interest.

References

  1. Khan, S.R.; Pavuluri, S.K.; Cummins, G.; Desmulliez, M.P.Y. Wireless Power Transfer Techniques for Implantable Medical Devices: A Review. Sensors 2020, 20, 3487. [Google Scholar] [CrossRef] [PubMed]
  2. Lu, X.; Wang, P.; Niyato, D.; Kim, D.I.; Han, Z. Wireless charging technologies: Fundamentals, standards, and network applications. IEEE Commun. Surv. Tutor. 2016, 18, 1413–1452. [Google Scholar] [CrossRef] [Green Version]
  3. Barbruni, G.L.; Ros, P.M.; Demarchi, D.; Carrara, S.; Ghezzi, D. Miniaturised Wireless Power Transfer Systems for Neurostimulation: A Review. IEEE Trans. Biomed. Circuits Syst. 2020, 14, 1160–1178. [Google Scholar] [CrossRef] [PubMed]
  4. Qin, R.; Li, J.; Costinett, D. A 6.6-kW High-Frequency Wireless Power Transfer System for Electric Vehicle Charging Using Multilayer Nonuniform Self-Resonant Coil at MHz. IEEE Trans. Power Electron. 2022, 37, 4842–4856. [Google Scholar] [CrossRef]
  5. Li, G.; Jo, C.-H.; Shin, C.-S.; Jo, S.; Kim, D.-H. A Load-Independent Current/Voltage IPT Charger with Secondary Side-Controlled Hybrid-Compensated Topology for Electric Vehicles. Appl. Sci. 2022, 12, 10899. [Google Scholar] [CrossRef]
  6. Wireless Power Transfer—An Overview|IEEE Journals & Magazine|IEEEXplore. Available online: https://ieeexplore.ieee.org/abstract/document/8357386 (accessed on 22 November 2022).
  7. Niu, M.; Sun, X.; Ma, H.; Zhu, Z.; Huang, T.; Song, K. Analysis and Design of Wireless Power Transfer System for Rotational Inertial Navigation Application. Appl. Sci. 2022, 12, 6392. [Google Scholar] [CrossRef]
  8. Liang, B.; Mao, Z.; Zhang, K.; Liu, P. Analysis and Optimal Design of a WPT Coupler for Underwater Vehicles Using Non-Dominated Sorting Genetic Algorithm. Appl. Sci. 2022, 12, 2015. [Google Scholar] [CrossRef]
  9. Wang, M.; Guo, Y.-X.; Wu, W. Equivalent circuit analysis of inductively coupled NFC antennas. In Proceedings of the 2014 IEEE Antennas and Propagation Society International Symposium (APSURSI), Memphis, TN, USA, 6–11 July 2014; pp. 1540–1541. [Google Scholar] [CrossRef]
  10. Strömmer, E.; Jurvansuu, M.; Tuikka, T.; Ylisaukko-Oja, A.; Rapakko, H.; Vesterinen, J. NFC-Enabled Wireless Charging. In Proceedings of the 2012 4th International Workshop on Near Field Communication, Helsinki, Finland, 13 March 2012; pp. 36–41. [Google Scholar] [CrossRef]
  11. Modelling of Road-Embedded Transmitting Coils for Wireless Power Transfer|Elsevier Enhanced Reader. Available online: https://reader.elsevier.com/reader/sd/pii/S0045790620307035?token=5E7C4F69FA7C9D3937C8734B5BAB5590C8313201B19F7AA6F8CDEDCB243535B5DCE2F23EF095E4F94A90F952CE2B0BD2&originRegion=eu-west-1&originCreation=20221123151127 (accessed on 23 November 2022).
  12. Skovierova, H.; Pavelek, M.; Okajcekova, T.; Palesova, J.; Strnadel, J.; Spanik, P.; Halašová, E.; Frivaldsky, M. The Biocompatibility of Wireless Power Charging System on Human Neural Cells. Appl. Sci. 2021, 11, 3611. [Google Scholar] [CrossRef]
  13. Dionigi, M.; Mongiardo, M. Numerical electromagnetic modeling of a wireless power transfer system. In Proceedings of the 2014 International Conference on Numerical Electromagnetic Modeling and Optimization for RF, Microwave, and Terahertz Applications (NEMO), Pavia, Italy, 14–16 May 2014; pp. 1–4. [Google Scholar] [CrossRef]
  14. Dobrzański, L.A.; Drak, M.; Ziębowicz, B. Materials with specific magnetic properties. J. Achiev. Mater. Manuf. Eng. 2006, 17, 37–40. [Google Scholar]
  15. Corti, F.; Reatti, A.; Lozito, G.M.; Cardelli, E.; Laudani, A. Influence of Non-Linearity in Losses Estimation of Magnetic Components for DC-DC Converters. Energies 2021, 14, 6498. [Google Scholar] [CrossRef]
  16. Ji, H.N.; Lan, Z.W.; Xu, Z.Y.; Zhang, H.W.; Yu, J.X.; Li, M.Q. Effects of Second Milling Time on Temperature Dependence and Improved Steinmetz Parameters of Low Loss MnZn Power Ferrites. IEEE Trans. Appl. Supercond. 2014, 24, 1–4. [Google Scholar] [CrossRef]
  17. Reinert, J.; Brockmeyer, A.; De Doncker, R. Calculation of losses in ferro- and ferrimagnetic materials based on the modified Steinmetz equation. IEEE Trans. Ind. Appl. 2001, 37, 1055–1061. [Google Scholar] [CrossRef]
  18. Ayachit, A.; Kazimierczuk, M.K. Steinmetz Equation for Gapped Magnetic Cores. IEEE Magn. Lett. 2016, 7, 1–4. [Google Scholar] [CrossRef]
  19. Ben-Yaakov, S.S. SPICE simulation of ferrite core losses and hot spot temperature estimation. In Proceedings of the 2017 24th IEEE International Conference on Electronics, Circuits and Systems (ICECS), Batumi, Georgia, 5–8 December 2017; pp. 107–110. [Google Scholar] [CrossRef]
  20. Muhlethaler, J.; Biela, J.; Kolar, J.W.; Ecklebe, A. Improved Core-Loss Calculation for Magnetic Components Employed in Power Electronic Systems. IEEE Trans. Power Electron. 2012, 27, 964–973. [Google Scholar] [CrossRef]
  21. Venkatachalam, K.; Sullivan, C.R.; Abdallah, T.; Tacca, H. Accurate prediction of ferrite core loss with nonsinusoidal waveforms using only Steinmetz parameters. In Proceedings of the 2002 IEEE Workshop on Computers in Power Electronics, 2002, Mayaguez, PR, USA, 3–4 June 2002; pp. 36–41. [Google Scholar] [CrossRef] [Green Version]
  22. Abramovitz, A.; Ben-Yaakov, S.S. RGSE-Based SPICE Model of Ferrite Core Losses. IEEE Trans. Power Electron. 2018, 33, 2825–2831. [Google Scholar] [CrossRef]
  23. Bartoli, M.; Noferi, N.; Reatti, A.; Kazimierczuk, M. Modeling Litz-wire winding losses in high-frequency power inductors. In Proceedings of the PESC Record. 27th Annual IEEE Power Electronics Specialists Conference, Baveno, Italy, 23–27 June 1996; Volume 2, pp. 1690–1696. [Google Scholar] [CrossRef]
  24. Payne, A. Skin Effect, Proximity Effect and the Resistance of Circular and Rectangular Conductors. 2016. Available online: https://coil32.net/files/Alan_Payne/Skin-Effect-Proximity-Loss-and-the-Resistance-of-Circular-and-Rectangular-Conductors-Issue-4.pdf (accessed on 10 December 2022).
  25. Shen, Z.; Kaymak, M.; Wang, H.; Hu, J.; Jin, L.; Blaabjerg, F.; De Doncker, R.W. The Faraday Shields Loss of Transformers. IEEE Trans. Power Electron. 2020, 35, 12194–12206. [Google Scholar] [CrossRef]
  26. Massarini, A.; Kazimierczuk, M. Self-capacitance of inductors. IEEE Trans. Power Electron. 1997, 12, 671–676. [Google Scholar] [CrossRef] [Green Version]
  27. Elleaume, P.; Chubar, O.; Chavanne, J. Computing 3D magnetic fields from insertion devices. In Proceedings of the 1997 Particle Accelerator Conference (Cat. No.97CH36167), Vancouver, BC, Canada, 16 May 1997; Volume 3, pp. 3509–3511. [Google Scholar] [CrossRef]
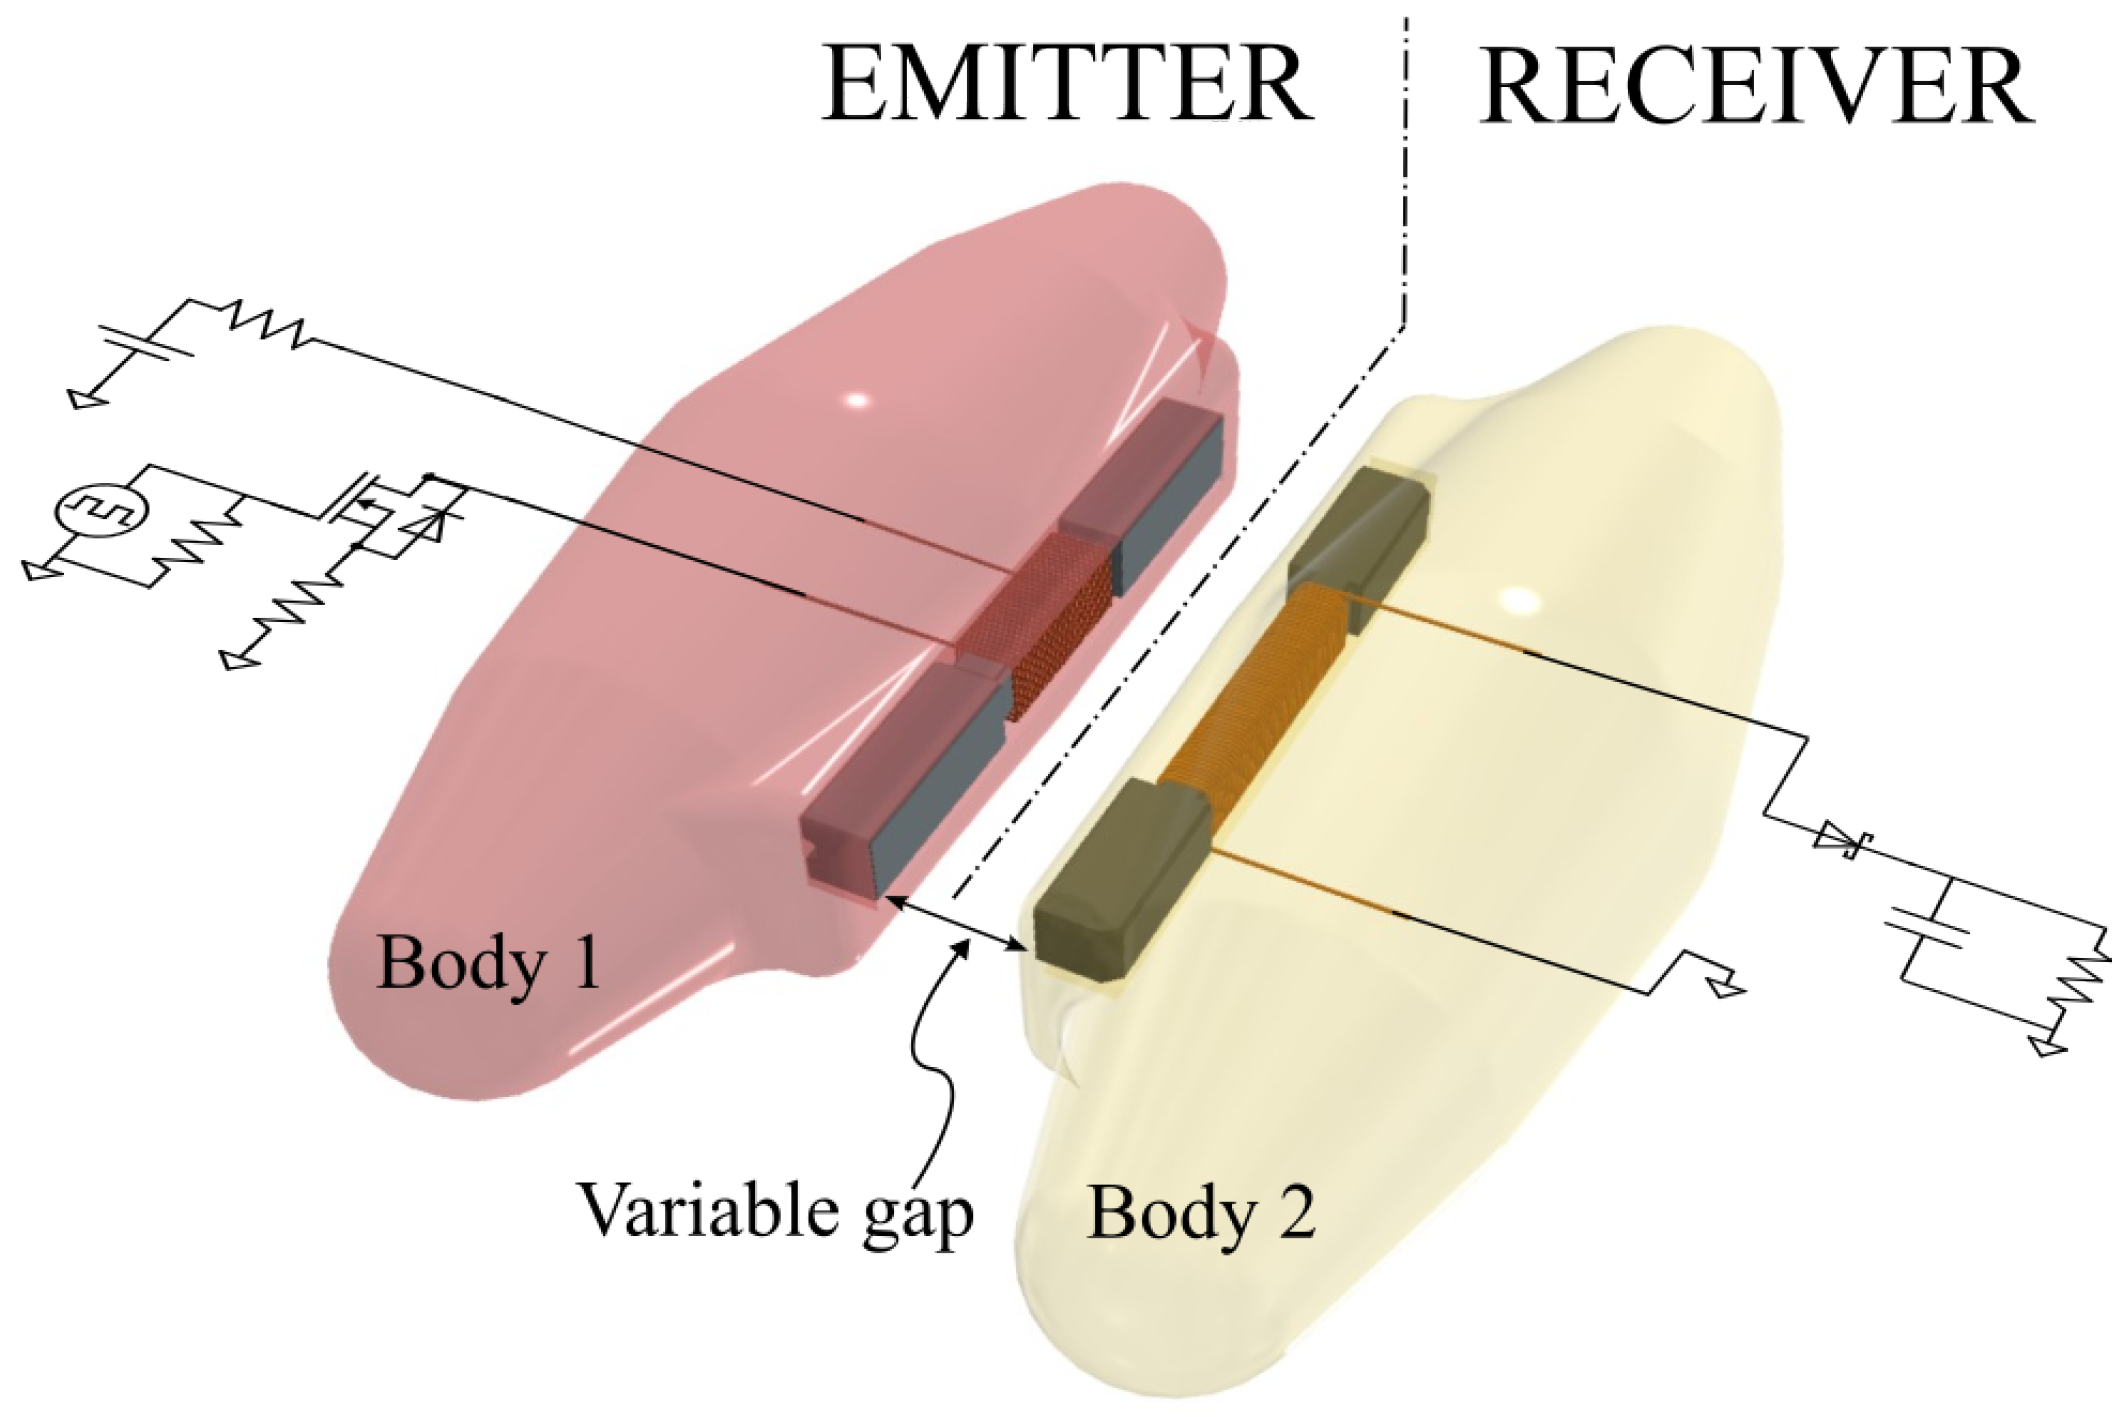
Figure 1. Conceptual schematization of the device.
Applsci 13 01820 g001
Figure 2. Complete multi-domain architecture for the co-simulation of the WPT device.
Applsci 13 01820 g002
Figure 3. (a) PySpice–MATLAB/Simulink co-simulation logic; (b) ESRF Radia–MATLAB/Simulink co-simulation logic.
Applsci 13 01820 g003
Figure 4. Three-dimensional magneto-static finite volume model.
Applsci 13 01820 g004
Figure 5. (a) Auto and mutual-inductance parameters vs air gap variation; (b) coupling factor vs air gap variation.
Applsci 13 01820 g005
Figure 6. Equivalent circuit model for the time domain analysis.
Applsci 13 01820 g006
Figure 7. Equivalent circuit model for the frequency domain analysis.
Applsci 13 01820 g007
Figure 8. Wireless power transfer device under analysis.
Applsci 13 01820 g008
Figure 9. Experimental apparatus.
Applsci 13 01820 g009
Figure 10. (a) Equivalent schematic of the experimental circuit for the time domain analysis; (b) equivalent schematic of the experimental circuit for the frequency domain analysis.
Applsci 13 01820 g010
Figure 11. (a) Side A of the controlled gap mover apparatus; (b) side B of the controlled gap mover apparatus.
Applsci 13 01820 g011
Figure 12. (a) L 11 vs. air gap; (b) L 22 vs. air gap.
Applsci 13 01820 g012
Figure 13. (a) CH1 signal comparison on a 7   μ s time window; (b) CH2 signal comparison on a 7   μ s time window; (c) CH3 signal comparison on a 7   μ s time window.
Applsci 13 01820 g013
Figure 14. (a) CH1 signal comparison on a 70   μ s time window; (b) CH2 signal comparison on a 70   μ s time window; (c) CH3 signal comparison on a 70   μ s time window.
Applsci 13 01820 g014
Figure 15. CH3 normalized numerical vs. experimental frequency response in an excitation range of [0.2; 1.1] MHz and an imposed gap variation from 0.00 mm to 0.40 mm.
Applsci 13 01820 g015
Figure 16. (a) Focus of the CH3 frequency response at 0.00 mm; (b) focus of the CH3 frequency response at 0.10 mm.
Applsci 13 01820 g016
Figure 17. (a) Focus of the CH3 frequency response at 0.20 mm; (b) focus of the CH3 frequency response at 0.30 mm.
Applsci 13 01820 g017
Table 1. Measured values of the stand-alone inductors.
Lumped Parameters
DescriptionParameterValueUnit
Measured DC resistance of the emitter side coil R D C 1 0.514 [ Ω ]
Measured DC resistance of the receiver side coil R D C 2 0.9370 [ Ω ]
Measured inductance of the stand-alone emitter inductor L 11 11.74 [ μ F ]
Measured inductance of the stand-alone receiver inductor L 22 38.14 [ μ F ]
Table 2. Nominal value properties of the components used during the experimental campaign.
Lumped Circuit Parameters
ComponentValueUnit
Function generator amplitude range0–10 [ V ]
Function generator frequency range0–1 [ MHz ]
Rshunt122 [ Ω ]
Rshunt2600 [ Ω ]
Cload1 [ n F ]
Disclaimer/Publisher’s Note: The statements, opinions and data contained in all publications are solely those of the individual author(s) and contributor(s) and not of MDPI and/or the editor(s). MDPI and/or the editor(s) disclaim responsibility for any injury to people or property resulting from any ideas, methods, instructions or products referred to in the content.