Abstract
A tunable diode laser absorption spectroscopy (TDLAS)-based spectrometer employing a mid-infrared (Mid-IR) interband cascade laser (ICL) was developed and used to determine pressure broadening coefficients of two NO absorption transitions at 1914.98 cm−1 and 1915.76 cm−1 in the fundamental (1←0) band (R11.5 Ω1/2 and Ω3/2) for CO2, N2, Ar, O2, He, and H2. For the first time, a reliable and consistent set of six different pressure-broadening coefficients for the NO line has been measured by a consistent approach covering pressures from 100 to 970 mbar at a temperature of 294 K. Air pressure broadening has been calculated based on N2 and O2 coefficients. The stated pressure-broadening coefficients for N2, CO2, Ar, H2, O2, He, and Air have relative errors in the 0.5–1.5% range. For CO2 and H2, broadening results of NO (1←0) band (R11.5 Ω1/2 and Ω3/2) lines are reported for the first time. The results are also compared to previously available literature data. It was found that the broadening coefficients for O2 and Air are in agreement with literature values, whereas results for Ar and He show larger differences.
1. Introduction
Nitric oxide (NO) is a major polluting chemical species in the atmosphere and has a special role in the destruction of the stratospheric ozone layers, as sunlight helps NO to react with the Ozone to form oxygen [1,2,3,4]. NO can be produced from different sources, such as natural, biogenic and industrial processes [5,6,7].
When coming from natural sources, NO is mainly produced inside thunderstorms. In the case of biogenic origin, it can be produced from agricultural fertilization. Moreover, three pathways of NO formation from industrial sources exist, namely, thermal NO, fuel NO and prompt NO. In the case of thermal NO, the major source is the high-temperature combustion of, say, natural gas in the air. The major contribution of NO comes from transportation fuel. Regarding the formation of prompt NO, it occurs mainly in low-temperature oxidation of hydrocarbons under rich conditions, which are prominent in non-premixed combustion, such as in diesel engines [8,9].
NO is an essential component when it comes to air pollution caused by thermal power plants, combustion engines (e.g., vehicle emission) and aero engines [6,7]. The effect of NO formation in heated air or in the exhaust gases produced by the oxidative reaction of nitrogen has been well elaborated [8]. The effect of high-temperature NO formation can be significantly seen in the form of photochemical smog. The NO, in turn, combines with water vapor in the air to form nitric acid, which is one component of acid rain. As is known from the eminent Zeldovich equations [8,9] regarding temperature, the formation of NO above 1593 K is limited by the availability of the oxygen content in the air, while in temperatures below 1033 K, there is either no formation of NO or an extremely low concentration. NO is largely generated by human activity, where combustion-based mobility contributes about half of the total NO emissions. The accurate quantification of NO is of paramount interest. Sensitive, selective and online laser-based trace gas detection is an effective method for non-invasive diagnostics [10,11]. NO sensors based on tunable laser absorption spectroscopy (TDLAS) have been proven to be a suitable candidate to monitor NO levels because of their capability to provide sensitive, accurate, in situ and absolute measurements for various conditions, even in harsh environments [12]. Accurate spectral line parameters of the targeted molecule (such as pressure broadening coefficient and line strength) are critical for TDLAS spectrometers in the context of a precise amount of fraction monitoring of trace species with a low signal-to-noise ratio [13,14,15].
For example, fixed wavelength TDLAS has been normally used in shock tube experiments, and the spectral line parameters (pressure broadening or cross-section) are essential for species quantification. The pressure-broadening coefficient of NO has been investigated by many researchers, including both theoretical and experimental aspects [16,17,18,19,20]. In 1982, Lundqvist attempted to measure the pressure-broadening coefficient for R-branch lines of NO near 5.4 µm using a computerized tunable diode laser spectrometer [17]. Further, Vyrodov et al. measured the lineshape parameters of NO (0,0) transitions broadened by Ar, He and N2 using Laser Induced Fluorescence (LIF) at room temperature [21]. In another study, Chang et al. utilized a rapid tuning intracavity-doubled continuous-wave (CW) dye laser to resolve absorption lineshapes in the NO band at 226 nm and obtain the room-temperature broadening coefficient for argon as 0.503 cm−1 atm−1 and for nitrogen as 0.583 cm−1 atm−1, respectively [22]. So, an accurate and consistent spectroscopic database is needed for quantitative species measurements. For the exact quantification of NO, it is important to carefully measure the spectral line parameters [11,22]. The current study focuses on the measurement of NO (R11.5) Ω3/2 and Ω1/2 transition lines in the 1-0 band. Six pressure broadening coefficients for NO—CO2, -O2, -N2, -He, -H2 and -Ar—are obtained based on the same experimental set-up and the data evaluation methodology.
2. Methodology
We have used the well-known TDLAS approach to precisely quantify the pressure-broadening coefficient of the NO transition line in the mid infrared (Mid-IR) band. For the TDLAS, the transmitted intensity through a gaseous sample can be estimated using the renowned Beer–Lambert’s law [23,24]:
with E(t) being the background emission at time t, I0() being the initial laser intensity, and T(t) representing the losses due to broadband transmission, which is simultaneously derived from the individual raw signals and absorption profiles, respectively. The absorption line strength at gas temperature T is represented by the term in the exponential term, which is S(T); g(− 0) is the normalized (integrated area = 1) line shape function with a centered wavenumber of 0, n is the absorber number density, and L is the optical path length. Finally, one can compute the absorbance spectrum from the following equation as stated:
To model the absorbance spectrum’s lineshape in Equation (2), the Voigt function was taken, as it considers the combined effects on the spectral line caused due to Doppler and collisional broadening. Its effect is distinguished by the Doppler broadening full width at half maximum (FWHM), Δ𝜈D and the collisional-broadening FWHM, Δ𝜈L, given by
in which x represents the NO amount fraction, kB is the Boltzmann constant, M is the molecular mass of the absorbing species, c is the speed of light, p is the total pressure, and the coefficients γself and γf are the self and foreign broadening coefficients that depend on the gas temperature T, respectively. Since the gas temperature is measured in the experiment, the Doppler broadening coefficient can be determined using Equation (3). It is also important to keep in mind that the broadening coefficients (γself, γf) determined by applying Equation (4) are the corresponding values at an experimental temperature, T, and have not been modified to the reference temperature T0 = 296 K, which is utilized in HITRAN [25]. The broadening coefficients must be converted to a specific temperature using the self- and foreign-temperature dependency coefficients (nself and nf). Typically, nself and nf often have values between 0.4 and 0.9 [25].
3. Technical Details of the Experiments
Figure 1 depicts the experimental setup for determining the NO pressure broadening coefficients, which is similar to the setup used in other studies [23,26]. To measure the transition lines in the NO 1←0 fundamental band, a 5.2 µm interband cascade laser (ICL) (Nanoplus GmbH) was used. To capture the targeted transition lines using the wavelength scanned TDLAS technique, the NO laser current was scanned by a 140 Hz linear saw-tooth-shaped signal generated by a function generator (Agilent, 33220B). A low-noise laser current driver (Thorlabs, LDC8002) controls the laser current, while a Peltier-element controlled by a temperature controller stabilizes the laser temperature (Thorlabs TEC8020). In this study, a 7 cm long stainless-steel single-pass gas cell with two CaF2 windows was used. The laser beam was focused onto a photodetector after passing through the gas cell (VIGO, PVI-4TE-5). A 16-bit 625 kSps DAQ card was used to record the detector output signal (National Instruments, PXI-6363). An absolute capacitance manometer (AA02A Baratron by MKS, range 1000 mbar) was used to measure gas pressure. A Pt100 sensor was used to measure the temperature of the gas cell. Both temperature and pressure sensors were calibrated and are traceable to the SI using PTB’s national pressure and temperature standards.
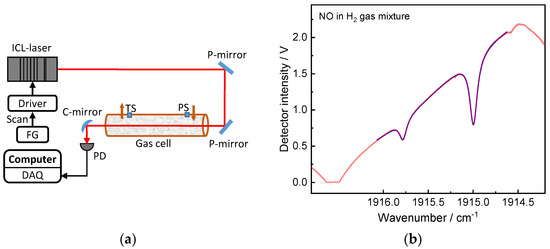
Figure 1.
(a) The spectrometer’s experimental configuration for determining the pressure broadening coefficients, where PS: pressure sensor; PD: photodetector; FG: function generator; DAQ: data acquisition card; (b) Measured typical laser intensity with two NO absorption peaks.
The optical set-up is depicted in detail in Figure 1a, showing the alignment of the laser beam. The absorbing beam shown in red was coupled into the gas cell via two mirrors and projected onto the detector surface by another concave mirror. Before each experiment, a Germanium crystal etalon (Q-MACS, Length 76.25 mm) was placed in the beam path to generate the interference signal that was used to calculate the optical frequency domain of the scanned frequency range (i.e., to convert the x-axis domain to wavenumber).
4. Results and Discussion
High-quality pure NO and buffer gas cylinders (purity 5.0, Linde, Dublin, Ireland) were used in the experiments of measuring the foreign broadening coefficients. The manometric gas mixtures were configured via partial pressure that follows Dalton’s law. The gas mixture preparation procedure is as follows: (1) evacuate the whole system (<10−3 mbar), including the gas cell and all components in the gas manifold up to the gas cylinder; (2) flush the gas cell with pure NO and then evacuate the system; (3) repeat step 2 for 3 times; (4) filling pure NO into the gas cell with the pressure less than 0.5 mbar; (5) fill the buffer gas (e.g., Ar, O2, N2, H2, He and CO2) to the pre-defined value. The exhaust pump and gas cell outlet valve both control the cell’s gas pressure. The resulting cell pressure was lying in the range of 100 to 1000 mbar. The measured temperature stayed at 294 K throughout the measurement campaign. In Figure 1b, there are two NO absorption peaks within the spectral window. The line list from HITRAN is shown in Table 1 [25]. To perform the lineshape fitting for the measured spectrum, 10 NO lines in each absorption peak are fitted using the Voigt profile. Within Peak 1 (Ω1/2) or Peak 2 (Ω3/2) transition lines, the 10 NO lines have the same broadening coefficient, temperature dependence and lower state energy. The transition lines as shown in Table 1 are valid for the newly identified broadening coefficients in this study.

Table 1.
The HITRAN database’s line list.
4.1. CO2 Broadening Coefficient
A NO/CO2 gas mixture was prepared using the above-mentioned gas mixture preparation procedure to derive the NO-CO2 broadening coefficient. Figure 2a depicts a subset of the measured NO/CO2 gas mixture line profiles at two pressures. The measured lines were averaged across 20 scans, and the Voigt model was fitted with a third-order background polynomial and a non-linear Levenberg–Marquart technique. Two absorption peaks were fitted simultaneously as well as a CO2 line between two NO peaks.
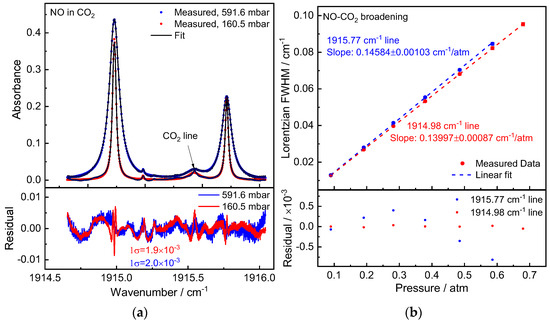
Figure 2.
(a) Measured NO absorption spectra (averaged over 20 scans) in CO2 at pressures of 160.5 mbar and 591.6 mbar. Below is a display of the residual between the measured and fitted values. (b) A linear fitted model utilized to measured CO2-induced pressure broadening of two NO absorption peaks. Shown below are the residual between fit and data.
The spectra fitting residuals were around (1σ) 2 × 10⁻³ optical density, as shown in Figure 2a. The signal-to-noise-ratio (SNR) was close to 200 when compared to the absorption peak. In our spectra fitting algorithm, the Gaussian width was calculated according to Equation (3) using the gas temperature measured by the temperature sensor. The Lorentzian line width was set as a fitting parameter. A linear regression was used to calculate the pressure broadening coefficient γf from the fitted Lorentzian line widths at different pressures. According to the calibration certificate from PTB, the uncertainty (k = 1) of the pressure values was in the range of 0.1–0.15 mbar. As shown in Figure 2b, the pressure uncertainty was used as the x-error bar in the linear regression. The 1 standard deviation of the Lorentzian line width results (multiple measurements, typical 50–100 spectra) at each pressure step was used as the y-error bar, along with the uncertainty of the relative laser wavelength. As described in Equation (4), the fitted Lorentzian line widths exhibit very good linearity with pressures (only the second term, as the self-broadening contribution is negligible due to the trace NO level in the gas cell). Thus, we determined NO-CO2 broadening coefficients of γco2 = 72.92(52) × 10−3 cm−1/atm and 79.99(44) × 10−3 cm−1/atm for Peak 1 and 2, respectively.
4.2. N2 Broadening Coefficient
NO/N2 gas mixtures were prepared in the gas cell in the same manner as the NO/CO2 experiment to determine the N2 broadening coefficient. Figure 3a depicts a measured absorption spectrum at pressures of 896.1 mbar and 198.6 mbar, respectively. The residuals of the fitting were in the neighborhood of (1σ) 5 × 10⁻³ optical density. With pressures falling within the measurement pressure range, the measured Lorentzian widths exhibit very good linearity. The measured NO-N2 broadening coefficients are γN2 = 58.13(31) × 10−3 cm−1/atm and 50.80(27) × 10−3 cm−1/atm for Peak 1 and 2.
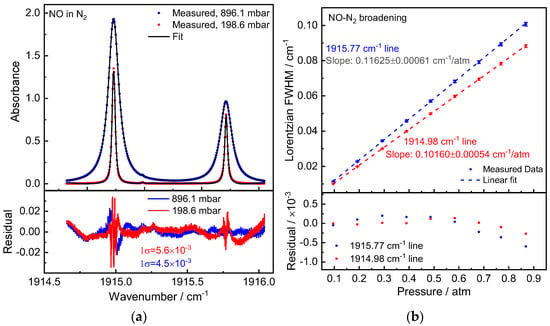
Figure 3.
(a) Measured NO absorption spectra in N2 at pressures of 896.1 mbar and 198.6 mbar (20-scan averaged). The residual between the measured and fitted data is depicted below, yielding an SNR of ~300. (b) Experimentally obtained N2-induced pressure broadening of the NO absorption lines with a linear fitting model. The residual between fit and data is depicted in the graph below.
4.3. Broadening Coefficient, Ar
The same method was used to conduct the measurements of NO-Ar broadening. The spectrum treatment was the same as for measurements of CO2 and N2 broadening. Figure 4a shows the measured NO absorption spectrum in Ar (938.3 mbar and 143.4 mbar, 294 K), the fitting residuals were around (1σ) 3–4 × 10⁻³ (optical density). Figure 4 displays the measured Lorentzian widths at various pressures (b). For Peaks 1 and 2, respectively, the measured NO-Ar broadening coefficients from the linear fit slopes are γAr = 42.64(22) × 10−3 and 37.67(19) × 10−3 cm−1/atm. Additionally, the NO concentration measurement in the gas-phase oxidation of ammonia under 90% argon dilution determined in the temperature range of 1581–2720 K near 3 bar is being used and well validated with the evaluated Ar broadening coefficient data. More details on the measurement are available in the reference [27].
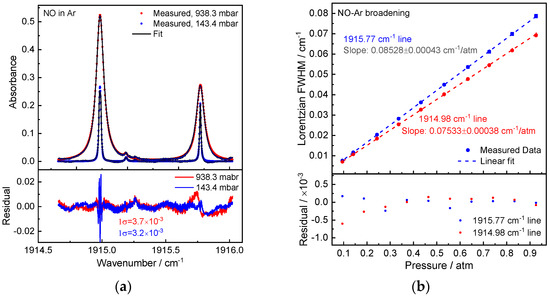
Figure 4.
(a) Measured NO absorption spectra (20-scan averaged) in Ar at pressures 938.3 mbar and 143.4 mbar. (b) Experimentally obtained Ar-induced pressure broadening of the NO absorption lines fitted with a linear model. The residual between the data and the fit is displayed below.
4.4. Broadening Coefficient, O2
The measuring process for NO-O2 broadening was the same as for the other studies. Pure O2 was employed as the buffer gas here (purity 5.0, Linde). NO will react with O2 to form NO2 during the experiment as well as the gas mixture preparation process. NO concentration deduction was observed when filling O2 into the gas cell. The maximum pressure used in NO-O2 broadening measurement was less than 400 mbar. As an example, Figure 5a depicts an absorption spectrum of NO in O2 measured at total pressures of 144.1 mbar and 295.9 mbar. The observed spectrum was averaged over 20 scans, and the Voigt profile was used to fit it. The obtained NO-O2 broadening coefficient is γO2 = 57.68(66) × 10−3 cm−1/atm and 50.88(53) × 10−3 cm−1/atm for Peak 1 and Peak 2 according to the slopes of the linear regression of the Lorentzian widths versus pressures.
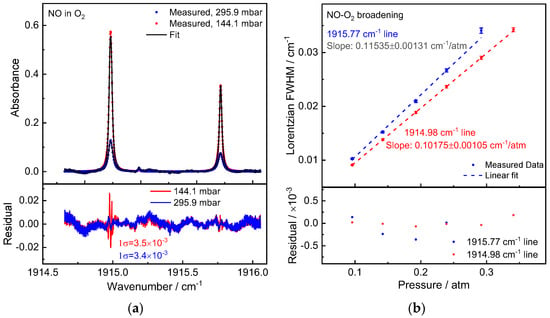
Figure 5.
(a) Measured NO absorption spectra (20-scan average) in O2 at pressures 144.1 mbar and 295.9 mbar. Below is a display of the residual between the measured and fitted values. (b) Obtained NO P(5) (1←0) pressure broadening absorption line caused by O2 and fitted with a linear model. Below is a display of the fit-to-data residual.
4.5. Broadening Coefficient, He
Figure 6a shows the measured NO absorption spectrum at pressures of 929.1 mbar and 294.3 mbar. The corresponding Lorentzian widths exhibit excellent pressure linearity. The experiments yielded the NO-He broadening coefficients γHe = 44.17(23) × 10−3 cm−1/atm and 37.79(22) × 10−3 cm−1/atm for Peak 1 and Peak 2, respectively.
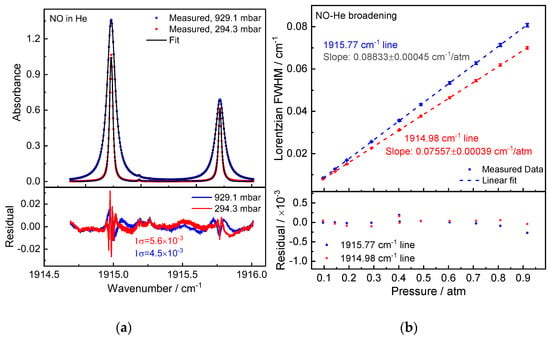
Figure 6.
(a) Measured NO absorption spectra (20-scan average) in He at pressures of 929.1 mbar and 294.3 mbar. Below is a comparison of the residual between measured and fitted data, which results in an SNR of about 200. (b) Measured He-induced pressure broadening of the NO absorption lines fitted with a linear model. Below is a display of the residual between fit and data.
4.6. Broadening Coefficient, H2
Pure H2 was utilized as the buffer gas in this measurement of the NO-H2 broadening coefficient (purity 5.0, Linde). Figure 7a provides an illustration of a measured NO in O2 absorption spectra at total pressures of 167.9 mbar and 671.4 mbar. The Voigt profile was used to fit the NO in the H2 spectrum after it had been averaged over 20 scans. The optical density (spectral fitting residuals) was close to (1σ) 3 × 10⁻³. According to the slope of the linear regression of the Lorentzian widths vs. pressures, the measured NO-H2 broadening coefficients for Peaks 1 and 2 are γH2 = 71.67(43) ×10−3 cm−1/atm and 62.77(38) × 10−3 cm−1/atm.
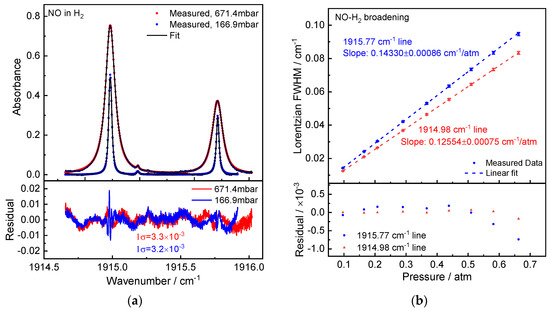
Figure 7.
(a) Measured NO absorption spectra (20-scan averaged) in H2 at pressures of 671.4 mbar and 166.9 mbar. Below is a comparison of the residual between measured and fitted data, which results in an SNR of over 200. (b) Measured H2-induced pressure broadening of the NO absorption lines fitted linearly. Below is a display of the fit-to-data residual.
4.7. Literature Comparison
Table 2 summarizes our results at 294 K, along with the literature values of the NO (1←0) R11.5 (Ω3/2 and Ω1/2) lines from various published papers [20,28,29,30,31]. Note that we did not convert the broadening coefficients to the same temperature (at 300 K) as those in the literature for this comparison. The tabulated broadening coefficients are also shown in Figure 8. The different buffer gas means a different atom/molecule, and a different molecule has different collision frequency, energy and efficiency, which lead to different collision effects, and therefore, different broadening behavior. From the measurement results, the Ar broadening coefficient is the smallest, and the largest is the CO2 broadening coefficient. For NO-CO2 and NO-H2 broadening coefficients, there are no available reference data to compare. To the best of our knowledge, these two coefficients have not been reported before.

Table 2.
Comparison of our findings with information from the literature regarding the NO (1←0) R (11.5) absorption lines’ broadening coefficients when combined with N2, CO2, Ar, H2, O2, He, and Air.
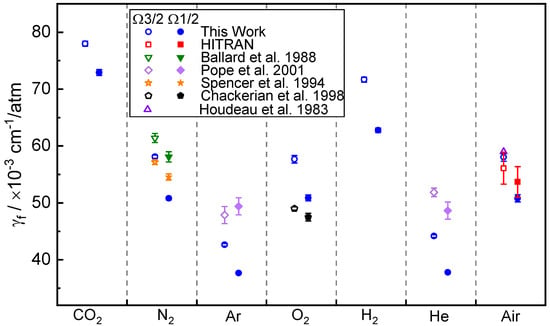
Figure 8.
Comparison of our findings to published data from the literature. Solid points: R11.5 Ω3/2, Open points: R11.5 Ω1/2 [20,28,29,30,31].
N2:O2 = 79:21 is used to determine the NO-air broadening coefficient in Table 2 based on the measured NO-N2 and NO-O2 broadening coefficients. Peaks 1 and 2 have computed NO-Air broadening coefficients of 58.04(71) × 10−3 cm−1/atm and 50.82(63) × 10−3 cm−1/atm, respectively, at 294 K. Within the measurement uncertainty, the NO-air broadening coefficient determined by our study and based on our measured NO-O2 and NO-N2 values agrees well with HITRAN and Ref. [31].
The relative difference to [30] for the O2-induced pressure broadening coefficient is 15% for R11.5 Ω3/2 and 6.7% for R11.5 Ω1/2, while the measured temperatures in this reference were 299 K, 5 K higher than our result. The measured NO-N2 broadening coefficient shows a better agreement with the literature value in Ref. [28] than the value in Ref. [29].
There are significant deviations of about 10 to 20% for NO-Ar and NO-He broadening coefficients compared to the measured results in Ref. [20]. This is due to the temperature difference. The broadening coefficients reported in Ref. [20] are for 300 K. Moreover, in this work as well as in the literature [20], the broadening coefficients of R11.5 Ω3/2 lines should be larger than R11.5 Ω1/2. However, in Ref. [20], the reported R11.5 NO-Ar broadening coefficients are the opposite.
5. Conclusions
We report the pressure broadening coefficients of the NO R(11.5) Ω3/2 and Ω1/2 lines in the 1←0 bands at 1915.77 cm−1 and 1914.98 cm−1 caused by N2, CO2, Ar, H2, O2, He and Air, measured using a Mid-IR ICL-based TDLAS spectrometer. The NO-CO2, NO-N2, NO-Ar, NO-O2, NO-H2 and NO-He pressure broadening coefficients were measured for the pressure range of 100–970 mbar at 294 K using high-quality gases. The measured NO-N2 and NO-O2 data were used to compute the NO-Air broadening coefficients. Using the MID-IR TDLAS spectrometer, including both hardware and software, as well as the calibrated pressure and temperature sensors (SI traceable), the experimental findings provide accurate and repeatable results utilizing the same equipment and evaluation procedure. We analyzed the newly measured results to existing data from the literature and addressed the discrepancy. When compared to published data, the relative precision of the measured pressure broadening coefficients show significant improvement. For the first time, the newly measured NO-CO2 and NO-H2 broadening coefficients were reported. The obtained broadening coefficients in this work have been used for quantifying the NO amount fraction in a recent publication of a gas-phase study of ammonia in a shock tube reactor which employed a fixed wavelength TDLAS spectrometer. The broadening coefficients can also be used in all industrial and energy gas applications, especially for monitoring the combustion process as well as the NO emission quantification.
Author Contributions
Conceptualization, S.A. and Z.Q.; methodology, S.A. and Z.Q.; formal analysis, S.A. and Z.Q.; writing—original draft preparation, S.A. and D.Z.; writing—review and editing, all authors. All authors have read and agreed to the published version of the manuscript.
Funding
We (Denghao Zhu and Sumit Agarwal) would like to acknowledge the Alexander von Humboldt (AvH) Foundation for financial support. The State of Lower Saxony/Germany’s funding within the H2-WaVe project Grant number ZN3772 is gratefully acknowledged.
Institutional Review Board Statement
Not applicable.
Informed Consent Statement
Not applicable.
Data Availability Statement
Not applicable.
Conflicts of Interest
The authors declare no conflict of interest.
References
- Lu, X.; Ye, X.; Zhou, M.; Zhao, Y.; Weng, H.; Kong, H.; Li, K.; Gao, M.; Zheng, B.; Lin, J.; et al. The Underappreciated Role of Agricultural Soil Nitrogen Oxide Emissions in Ozone Pollution Regulation in North China. Nat. Commun. 2021, 12, 5021. [Google Scholar] [CrossRef] [PubMed]
- Logan, J.A. Nitrogen oxides in the troposphere: Global and regional budgets. J. Geophys. Res. Atmos. 1983, 88, 10785–10807. [Google Scholar] [CrossRef]
- Price, C.; Penner, J.; Prather, M. NOx from lightning: 1. Global distribution based on lightning physics. J. Geophys. Res. Atmos. 1997, 102, 5929–5941. [Google Scholar] [CrossRef]
- Ravishankara, A.R.; Daniel, J.S.; Portmann, R.W. Nitrous oxide (N2O): The dominant ozone-depleting substance emitted in the 21st century. Science 2009, 326, 123–125. [Google Scholar] [CrossRef] [PubMed]
- Yienger, J.J.; Levy, H. Empirical model of global soil-biogenic NOχ emissions. J. Geophys. Res. Atmos. 1995, 100, 11447–11464. [Google Scholar] [CrossRef]
- Steinfeld, J.K. Atmospheric chemistry and physics: From air pollution to climate change. Environ. Sci. Policy Sustain. Dev. 1998, 40, 26. [Google Scholar] [CrossRef]
- Delmas, R.; Serça, D.; Jambert, C. Global inventory of NOx sources. Nutr. Cycl. Agroecosys. 1997, 48, 51–60. [Google Scholar] [CrossRef]
- Aithal, S.M. Modeling of NOx Formation in Diesel Engines Using Finite-Rate Chemical Kinetics. Appl. Energy 2010, 87, 2256–2265. [Google Scholar] [CrossRef]
- Miller, J.A.; Bowman, C.T. Mechanism and Modeling of Nitrogen Chemistry in Combustion. Prog. Energy Combust. Sci. 1989, 15, 287–338. [Google Scholar] [CrossRef]
- Menzel, L.; Kosterev, A.; Curl, R.; Tittel, F.; Gmachl, C.; Capasso, F.; Sivco, D.; Baillargeon, J.; Hutchinson, A.; Cho, A.; et al. Spectroscopic detection of biological NO with a quantum cascade laser. Appl. Phys. B Laser Opt. 2001, 72, 859–863. [Google Scholar] [CrossRef]
- Almodovar, C.A.; Spearrin, R.M.; Hanson, R.K. Two-Color Laser Absorption near 5 Μm for Temperature and Nitric Oxide Sensing in High-Temperature Gases. J. Quant. Spectrosc. Radiat. Transf. 2017, 203, 572–581. [Google Scholar] [CrossRef]
- Chao, X.; Jeffries, J.B.; Hanson, R.K. Wavelength-Modulation-Spectroscopy for Real-Time, in Situ absorption sensor for NO in Combustion Gases with a 5.2 µm Quantum-Cascade Laser. Proc. Comb. Inst. 2011, 33, 725–733. [Google Scholar] [CrossRef]
- Qu, Z.; Schmidt, F.M. In Situ H2O and Temperature Detection Close to Burning Biomass Pellets Using Calibration-Free Wavelength Modulation Spectroscopy. Appl. Phys. B 2015, 119, 45–53. [Google Scholar] [CrossRef]
- Qu, Z.; Ghorbani, R.; Valiev, D.; Schmidt, F.M. Calibration-Free Scanned Wavelength Modulation Spectroscopy—Application to H_2O and Temperature Sensing in Flames. Opt. Express 2015, 23, 16492. [Google Scholar] [CrossRef] [PubMed]
- Qu, Z.; Steinvall, E.; Ghorbani, R.; Schmidt, F.M. Tunable Diode Laser Atomic Absorption Spectroscopy for Detection of Potassium under Optically Thick Conditions. Anal. Chem. 2016, 88, 3754–3760. [Google Scholar] [CrossRef]
- Liu, Y.; Lin, J.; Guo, Y. Measurement of the Pressure-Broadening Coefficient of NO by Saturation Spectroscopy of LMR. Can. J. Phys. 2000, 78, 989–995. [Google Scholar] [CrossRef]
- Lundqvist, S.; Margolis, J.; Reid, J. Measurements of Pressure-Broadening Coefficients of NO and O_3 Using a Computerized Tunable Diode Laser Spectrometer. Appl. Opt. 1982, 21, 3109. [Google Scholar] [CrossRef]
- Spencer, M.N.; Chackerian, C.; Giver, L.P.; Brown, L.R. Temperature Dependence of Nitrogen Broadening of the NO Fundamental Vibrational Band. J. Mol. Spectrosc. 1997, 181, 307–315. [Google Scholar] [CrossRef]
- Pine, A.S.; Maki, A.G.; Chou, N.Y. Pressure Broadening, Lineshapes, and Intensity Measurements in the 2 ← 0 Band of NO. J. Mol. Spectrosc. 1985, 114, 132–147. [Google Scholar] [CrossRef]
- Pope, R.S.; Wolf, P.J. Rare Gas Pressure Broadening of the NO Fundamental Vibrational Band. J. Mol. Spectrosc. 2001, 208, 153–160. [Google Scholar] [CrossRef]
- Vyrodov, A.O.; Heinze, J.; Meier, U.E. Collisional Broadening of Spectral Lines in the A-X System of NO. J. Quant. Spectrosc. Radiat. Transf. 1995, 53, 277–287. [Google Scholar] [CrossRef]
- Chang, A.Y.; DiRosa, M.D.; Hanson, R.K. Temperature Dependence of Collision Broadening and Shift in the NO A ← X (0, 0) Band in the Presence of Argon and Nitrogen. J. Quant. Spectrosc. Radiat. Transf. 1992, 47, 375–390. [Google Scholar] [CrossRef]
- Qu, Z.; Nwaboh, J.A.; Li, G.; Werhahn, O.; Ebert, V. Measurements of N2, CO2, Ar, O2 and Air Pressure Broadening Coefficients of the HCL p(5) Line in the 1–0 Band Using an Interband Cascade Laser. Appl. Sci. 2021, 11, 5190. [Google Scholar] [CrossRef]
- Qu, Z.; Werhahn, O.; Ebert, V. Thermal Boundary Layer Effects on Line-of-Sight Tunable Diode Laser Absorption Spectroscopy (TDLAS) Gas Concentration Measurements. Appl. Spectrosc. 2018, 72, 853–862. [Google Scholar] [CrossRef] [PubMed]
- Gordon, I.E.; Rothman, L.S.; Hargreaves, R.J.; Hashemi, R.; Karlovets, E.V.; Skinner, F.M.; Conway, E.K.; Hill, C.; Kochanov, R.V.; Tan, Y.; et al. The HITRAN2020 Molecular Spectroscopic Database. J. Quant. Spectrosc. Radiat. Transf. 2022, 277, 107949. [Google Scholar] [CrossRef]
- Qu, Z.; Nwaboh, J.; Werhahn, O.; Ebert, V. Towards a DTDLAS-Based Spectrometer for Absolute HCl Measurements in Combustion Flue Gases and a Better Evaluation of Thermal Boundary Layer Effects. Flow. Turbul. Combust. 2021, 106, 533–546. [Google Scholar] [CrossRef]
- Zhu, D.; Qu, Z.; Li, M.; Agarwal, S.; Fernandes, R.; Shu, B. Investigation on the NO formation of ammonia oxidation in a shock tube applying tunable diode laser absorption spectroscopy. Combust. Flame 2022, 246, 112389. [Google Scholar] [CrossRef]
- Spencer, M.N.; Chackerian, C.; Giver, L.P.; Brown, L.R. The Nitric Oxide Fundamental Band: Frequency and Shape Parameters for Rovibrational Lines. J. Mol. Spectrosc. 1994, 165, 506–524. [Google Scholar] [CrossRef]
- Ballard, J.; Johnston, W.B.; Kerridge, B.J.; Remedios, J.J. Experimental Spectral Line Parameters in the 1-0 Band of Nitric Oxide. J. Mol. Spectrosc. 1988, 127, 70–82. [Google Scholar] [CrossRef]
- Chackerian, C.; Freedman, R.S.; Giver, L.P.; Brown, L.R. The NO Vibrational Fundamental Band: O2-Broadening Coefficients. J. Mol. Spectrosc. 1998, 192, 215–219. [Google Scholar] [CrossRef]
- Houdeau, J.P.; Boulet, C.; Bonamy, J.; Khayar, A.; Guelachvili, G. Air Broadened NO Linewidths in a Temperature Range of Atmospheric Interest. J. Chem. Phys. 1983, 79, 1634–1640. [Google Scholar] [CrossRef]
Disclaimer/Publisher’s Note: The statements, opinions and data contained in all publications are solely those of the individual author(s) and contributor(s) and not of MDPI and/or the editor(s). MDPI and/or the editor(s) disclaim responsibility for any injury to people or property resulting from any ideas, methods, instructions or products referred to in the content. |
© 2023 by the authors. Licensee MDPI, Basel, Switzerland. This article is an open access article distributed under the terms and conditions of the Creative Commons Attribution (CC BY) license (https://creativecommons.org/licenses/by/4.0/).