Article

Structural Evaluation of Cable Bolts under Static Loading

1
School of Civil Engineering, The University of Sydney, Sydney, NSW 2006, Australia
2
Faculty of Civil Engineering and Resource Management, AGH University of Science and Technology, Mickiewicza 30 Av., 30-059 Krakow, Poland
*
Authors to whom correspondence should be addressed.
Appl. Sci. 2023, 13(3), 1326; https://doi.org/10.3390/app13031326
Submission received: 25 November 2022 / Revised: 11 January 2023 / Accepted: 12 January 2023 / Published: 19 January 2023
(This article belongs to the Special Issue Tunneling and Underground Engineering: From Theories to Practices)

Abstract

:
Rock bursts are a natural phenomenon that are caused by high stresses and faults within the deep geological profile. The framework within deep mining excavations, comprising various rock and face supports such as cable bolts, is required to withstand rock bursts. These mechanisms are subject to static and dynamic loading conditions which possess unique challenges. This study focused on the shearing impact of static loads on cable bolts, a key structural support mechanism designed to absorb energy and investigate the impacts of bolt diameter and strength. A double shear test was modelled using the Finite Element Analysis (FEA) software ABAQUS/Explicit. A double shear test was modelled using Finite Element Modelling (FEM) by creating individual parts, assigning material and contact properties and applying a load directly on the central block. Because ABAQUS/Explicit was used, a primarily dynamic analysis tool, quasi-static loading, was applied to negate the natural time scale. A total of six bolt diameters and six bolt strengths were tested. A positive correlation was exhibited between the bolt diameter, yield strength and the maximum force and displacement.

1. Introduction

The application of cable bolts was first introduced in the 1960s as part of a temporary support system [1]. Due to the large demands of societal growth, the need for deep mining excavation has exceeded the technological and testing capabilities to facilitate a safe mining procedure. Civil tunnelling methods have ultimately been incorporated into deep mining excavations; thus, cable bolts are considered as a critical permanent support element [2]. Cable bolts are an effective method to provide reinforcement for the rock mass combined with a face support such as shotcrete and steel meshing [3,4]. A cable bolt is a flexible steel tendon made up of twisted steel wires that are inserted within a duct and anchored by a plate to the rock surface [5]. They are often used in conjunction with a pre-stressing and grouting system to provide additional tensile forces and have been used as the primary reinforcement method for deep mining excavation. Whilst there are many factors that contribute to the overall strength of the combined support system, the cable bolt is notably of greater influence when considering the reinforcement of the rock capacity [6]. Tahmasebinia et al. (2018) [5] stated that whilst cable bolts are an effective method for reinforcement, there is much that is unknown about the nature of cable bolts subject to dynamic loading. This is due to the inaccessibility and restrictions of deep mining in situ testing and drop testing methods failing to capture in situ conditions. Bolts under static loading are well understood; however, in deep mining excavations, the presence of rock bursts induces sudden dynamic loading conditions and presents an additional potential failure mechanism. Therefore, it is important to understand cable bolt behaviour under dynamic loading conditions. This study conducted a parametric test examining the shear force, displacement and energy absorption capacity of a cable bolt subjected to loading through a double shear test using Finite Element Analysis (FEA) and the Finite Element Modelling (FEM) software ABAQUS/Explicit. As a relatively unexplored field of study, the insights obtained from this study will significantly improve industrial understanding of cable bolt behaviour under static loading. The goal of the study was to test and draw valuable conclusions about the influence of various parameters when subject to a static and dynamic load. The development of the model is detailed with explanations for each design criterion that was required in developing this model. Considerations of various design parameters are discussed, followed by a summary of the results of the testing according to each parameter. A discussion is provided to examine the fundamental implications of the results and its consistency with current literature. This compares experimental data against existing literature and experimental results. Finally, a discussion of the limitations of the testing is undertaken and final conclusions and recommendations for further investigation are presented.

2. Literature Review

A rock burst is defined by Kabwe and Wang (2015) [7] as a mining-induced seismic event that causes destruction to excavations. It occurs due to dynamic rock failure, where the rapid release of stored strain energy with the rock results in displacement and violent ejection of rock mass [8]. Due to the complexity and unpredictability of rock bursts, it is considered as one of the most hazardous geological disasters, being responsible for excavation and equipment damage, injury and fatalities [8].
The urgency to further understand and mitigate rock and coal bursts is reflective of the current international research effort, which includes countries such as Australia, China, South Africa and Canada, devoting resources to advance rock burst management and prevention [9]. Despite the number of resources invested in researching rock bursts over multiple decades, the mechanics of rock burst failure are not well understood, and therefore are difficult to control [10]. Therefore, as a safeguard to all workers, equipment and excavation operations, an effective rock support system is necessary and is currently deemed the most effective mitigation strategy.
Rock burst management currently involves utilising capable ground support systems, which incorporate both surface support systems and reinforcement support systems. A surface support system, including steel mesh, rope lacings, shotcrete, etc., provides reaction forces to the face of the excavation [11], while reinforcement support systems, including rock bolts, cable bolts and anchors, are elements that are bored into excavation faces to enhance the overall strength of the rock mass [12]. However, current design procedures do not place enough focus on the connections between surface support and reinforcement systems, resulting in the failure of the support system before both the surface and reinforcement elements reach their full capacity [13].
From South African gold mine investigations, it was observed that approximately 70% of rock ejections due to rock bursts occurred due to failure of connecting elements, where the majority of reinforcement bolts were still intact [14]. Currently, a main objective of the international research effort is to analyse and design existing ground support systems as an integrated system rather than individual elements, such that support systems used in burst-prone excavations can reach their maximum potential capacity. This aligns with Cai and Champaigne (2009)’s [15] rock burst design principles, which place a heavy emphasis on addressing the weakest link of a support system and utilising an integrated system.
This literature review thoroughly investigates the existing state of rock burst management such that contributions, evidence and gaps in the existing literature can be identified to provide a relevant understanding of current rock burst management. This includes a further analysis of rock bursts to understand what must be considered when designing a support system, the existing reinforcement and surface elements currently used in the industry, the current testing methods and facilities used to test support systems elements and the validity of numerical analysis as a means of testing ground support systems.

2.1. Rock Bursts

The first rock burst was recorded in South Africa at the Witwatersrand Gold Mines in the early 1900s, where sudden failure of rock masses occurred. Since this incident, there has been a clear link between mining activities, particularly at greater depths, and rock burst incidents, where it has been established that rock bursts are highly associated with hard rocks and geological faults [16].
Initially, W. D. Ortlepp and Stacey (1994) [17] proposed a classification of differing rock burst types, categorising them into five main types, which were strain bursting, buckling, face crushing (now known as fault slips), shear ruptures and fault slips. However, these rock burst types have more recently been refined into three distinct categories by Kaiser and Cai (2012) [9], which are strain bursts, where high stress concentrations at the edge of excavations exceed rock strength; pillar bursts, where support pillars fail violently due to large volume of rock failure; and fault slip bursts, where failure occurs due to slippage between existing faults and newly generated shear ruptures within the rock mass.
To manage and create ground support systems capable of mitigating rock burst damage, it is necessary to understand the damage mechanisms of rock bursts. Rock burst damage mechanisms and their causes have been classified into three types by Kaiser et al. (1996): rock bulking, where rock mass with high stress but low stored stress energy fractures; rock ejection, where rock with excess stored energy ruptures or remote seismic events transfer dynamic stress creating a strain burst; and seismically induced rock fall, where rock strength is inadequate to resist forces that are accelerated due to seismic waves [9].
Therefore, to design a support system that adequately negates the damage mechanisms of rock bursts, Kaiser et al. (1996) devised three necessary support functions that must operate concurrently: reinforce the rock mass to strengthen it, such that it can support itself and control bulking [18]; retain broken rock mass to prevent unravelling and further failure by using surface supports; and holding rock, reinforcement and surface elements securely to allow for the dissipation of dynamic energy [16]. These three support functions have been further built upon, and Cai and Champaigne (2009) [15] advise that an effective rock support system must also account for dynamic energy absorption capacity, large displacement capacity and large load carrying capacity simultaneously, and thus created seven rock burst design principles. As burst-prone excavations cannot always be avoided, especially as mining depth increases, the next best thing is utilising effective and capable ground support systems.

2.2. Ground Support System Elements

Existing ground support systems in prone-burst areas are composed of a reinforcement system that utilises yielding energy-absorbent tendons and flexible surface support elements such as shotcrete, straps, lacing, mesh and screens [19]. These elements that have been incorporated into current designs have improved over time through experimental testing, numerical analysis and field experience.

2.2.1. Reinforcement Support Elements

Since the development of rock reinforcement systems, yielding bolts were only widely accepted from the early 2000s. This was due to misbelief of the effectiveness of reinforcement bolts that were designed to purposely yield [16]. Despite W. Ortlepp (1992) [20] conducting a field test in 1969 that clearly demonstrated the effectiveness of yielding reinforcement, it was not until multiple mines that were prone to rock bursting displayed the success of yielding reinforcement, such as the Big Bell Mine in Australia [21] and Brunswick Mine in Canada [22], did yielding bolts become widely used in burst-prone excavations.
Conventional rock bolts have been categorised into three major categories, which are mechanical bolts, fully grouted rebar bolts and frictional bolts [23]. These types of conventional bolts are utilised to deal with rock instability in areas with relatively low in situ stress. However, in burst-prone mines, energy-absorbing rock bolts (also known as yielding bolts) are more suitable due to their shear resistance under dynamic loading conditions that rock burst creates.
When there are more attune to burst-prone environments, energy-absorbing rock bolts are better suited due to their large deformation capacity [24].
The Cone Bolt was the first energy-absorbing rock bolt designed, which consisted of a smooth bar with a flattened conical shape on the far end of the bolt [25]. The original cone bolt was designed to be grouted using cement, but the cone bolt was later adapted to function with resin by adding a threaded section and mixing blade [26]. The bolt was designed such that when displacement occurs, the conical end ploughs through the resin or grout to conduct work and absorb energy released from the rock. After Lindfors (2000) carried out dynamic testing on modified cone bolts, it was recorded that the bolts were only effective when ploughing occurred. Further dynamic analysis by Cai, Champaigne and Kaiser (2010) [3] showed an average dynamic yield loading between 50 and 216 kN when a kinetic energy of 33 kJ was inputted, presenting a large spread of values due to different failure mechanisms, including ploughing, steel stretching or a combination of the two.
Currently, common dynamic rock bolts used in the Australian mining industry include the Yield Lok Bolt and the J-Tech All Thread Bar, which are produced by Jennmar Australia. The Yield Lok Bolt typically consists of a smooth steel bar with a portion of threaded bar (for resin mixing) with an upset, a type of anchor that is coated in an engineered polymer. Like the cone bolt, the Yield Lok bolt absorbs energy via bolt shank slippage through ploughing in grout/resin. The J-Tech bolt consists of a bolt that has a small pitch thread along the entirety of its length with exceptional static and dynamic capacity.
In addition to rock bolts, cable bolts research and usage in burst-prone grounds are increasing. Cable bolts perform like rock bolts, but cable bolts consist of flexible tendons with higher tensile strength to further strengthen rock mass [27]. Plain strand cables had poor load transfers properties when first introduced in ground support systems, which is reflective of their initial use as a secondary reinforcing member. However, after modifications such as indentation, double strands, birdcage strands, bulbed strands, fiberglass cable bolts and nut-caged cable bolts, the load transferring and energy absorption capacity has improved [2]. Currently, SUMO (9 wire strand) and Secta (7 wire strand) dynamic cable bolts with bulbed strands are popular in the Australian Mining industry.

2.2.2. Surface Supports

Surface supports act as external support to excavations that are installed on the surface of excavations to hold and retain failing rock mass. In burst-prone environments, due to the dynamic loading of rock bursts, the interaction between surface elements and reinforcement elements is critical to ensure that no weak links are created [28]. Surface support elements can consist of fibre-reinforced shotcrete, mesh, straps and nuts/plates that connect reinforcing bolts to the surface support elements.
Fibre-reinforced shotcrete provides early support to prevent the early deterioration of the rock surface, but it begins to crack under minimal deformation. Thus, shotcrete in burst-prone grounds is not cost-efficient, as the surface will need to be retained by mesh [29].
Many burst-prone mines in Canada favour the use of mesh and mesh straps due to the ability of mesh to undergo high deformity and not fail. A common weakness of mesh, where mesh overlaps, is solved by using straps, preventing mesh from failing as a retaining element without the failure of individual mesh wires [9]. The type of mesh used in burst-prone excavations has advanced over time, where steel wire weld mesh was the industry standard; however, after further investigation by Roberts, Talu and Wang (2018) [30], it was experimentally and numerically proven that woven weld mesh and chain link mesh with closed wire loops have greater deforming and loading capacity under static and dynamic loading.

2.3. Testing of Ground Support Systems

Methodologies of studying and testing ground support systems for burst-prone excavation can be summarised into five categories: analytical, experimental, empirical, data-based and numerical testing [8]. Data-based testing methods are accurate only if a large sample size is available; however, due to differing in situ rock stresses and conditions in differing excavations and the complexity of rock bursts, such data are not available [31]. Empirical methods are confined to the specific site they are conducted, limiting their ability to generalise and standardise results [32]. Each method of testing has its limitations due to the complexity of rock bursts, and thus only experimental and numerical testing are explored in further detail here, including blast testing, drop tests, double shear tests and applications of numerical modelling with these testing methods.

2.3.1. Blast Testing

Blasting is a form of experimental in situ testing that investigates rock mass discontinuity, stress conditions on rock burst damage and the influence of in situ dynamic loads on a ground support system by simulating a rock burst [33]. A blast test involves drilling blast holes parallel to an excavation face, that are separately charged and detonated sequentially such that dynamic loading can be applied. Mapping of the test site with a 3D photography system both before and after blasting is carried out to identify areas of rock bulking and ejection, and additionally measure deformations of both surface and reinforcement support elements [34]. However, due to movement of mapped control points after blasting occurs, errors in measurements of angles and displacements on digital images are likely to occur.
This test is extremely limited due to being a destructive form of testing that requires vacant excavation walls that will become redundant, with suitable access. For a test that is situational based on site conditions and thus is not easily generalised, the test is extremely costly. Other limitations that can impact the accuracy of results include loss of access due to excessive damage and blasting misfires resulting in abandoning blast holes. Despite its limitations, in comparison with all other experimental testing, blast testing is the only test that can accurately imitate the in situ stresses and environment of rock in excavations.

2.3.2. Drop Test

The drop test is another dynamic experimental test method, which simulates dynamic loading patterns by dropping a known mass (with controlled drop speed and height) onto the support elements under testing [13] In general, drop tests are relatively simple to perform, provide the opportunity to obtain repeatable results and are suitable for quality control and comparative testing. However, impact and direct loading do not represent the true nature of rock burst loading. The lateral continuity of reinforcement support cannot be appropriately represented and in situ stresses that occur in burst-prone grounds cannot be accounted for accurately [11]. Globally, many different drop test facilities exist which all employ varying dynamic loading mechanisms.
The SRK Drop Weight Test Facility was developed to determine surface support dynamic loading capacities in South African mines, with the capability of inputting 70 kJ of energy [35]. The advantages of this facility include its relatively inexpensive set-up cost and its ability to undergo consistent and repeatable tests due to its configuration. However, after further analysis, it was concluded that transmission losses of up to 50% input energy occurred [36]. The facility is no longer in operation.
The CANMET Drop Test Facility was developed in Canada, which functions by dropping a hammer, that can have a weight of up to three tonnes, from a height of two metres onto the test element, directly applying a dynamic load [36]. The testing rig can dynamically input up to 60 kJ of energy, and thus is used by suppliers to test existing and experiment new products dynamically.
The WASM Dynamic Testing Facility was developed in Western Australia and involves dropping integrated rock mass and supporting elements on buffers to generate momentum energy transfer; Ref. [37] verified that it can be utilised to determine the energy absorption capacity of support elements. The WASM Testing rig is well instrumented as it is equipped with load cells, motion sensors and high-speed digital video cameras utilised for post processing. Due to its ability to test reinforcement and support systems unified, the WASM Testing facility is very active and used in the more recent publications [35].

2.3.3. Double Shear Test

Another form of experimental testing is single or double shear test, which is used to replicate rock bolt shear strength in jointed rock masses. Although single shear tests are cheaper due to less operation and set-up costs, double shear tests are more reliable as they avoid utilising asymmetric loading [38]. Double shear tests can be arranged in varying ways; however, a typical set-up involves three concrete blocks reinforced with full grouted rock bolts that can be positioned in varying angles [38].
The concrete blocks represent rock planes found in excavations, where the boundary blocks are fixed and a static load is applied to the middle block, applying a shear load to reinforcement bolts. Double shear tests can also conduct dynamic testing, where an impact load is applied to the centre block, such that the momentum of the applied load transfers the energy through the concrete block to the bolt under investigation. Like the drop test, the double shear test offers the opportunity to obtain repeatable results, and thus excels for quality control and comparative testing. Although it cannot accurately represent in situ conditions like blast testing, it can account for rock fault lines and thus is widely accepted as a rock and cable bolt shear test.

2.3.4. Numerical Analysis

Numerical analysis has been utilised in studying and developing rock burst support systems since the 1970s. In 1972, the first finite different method model was developed to simulate the elastic pulse propagation problem in the Split Hopkinson pressure bar technique [39]. In the same year, Blake (1972) [40] utilised finite element analysis to study and model pillar bursts, allowing him to predict probable rock burst locations. In 1979, the first boundary element method was carried out to propose the complete plane strain concept and used to study pillar bursts [41]. Since the introduction of multiple different numerical methods, numerical approaches have been classified into three approaches, namely continuum, discontinuum and the hybrid approach [42]. Due to the complexity regarding rock burst phenomena, Wang et al. (2021) [8] stressed the importance of selecting the correct numerical analysis methodology to achieve accurate results, where the specific engineering problem should define the numerical method selected. Thus, Wang et al. (2021) [8] summarised the strengths and weaknesses of each numerical methodology, which has been adapted below in Table 1.
Since the introduction of these analysis types, numerical analysis has become extremely popular due to its advantages of being cost-efficient and flexible, as it does not require specific testing facilities to carry out. Furthermore, as it is not a destructive form of testing, unlike blast, drop and the double shear tests, it is a safe methodology that can be easily repeated. However, numerical analysis results are only valid if verified using analytical and experimental data. Furthermore, similar to laboratory tests, numerical analysis is forced to make assumptions to produce accurate results, and thus it struggles to account for the in situ stresses of rock and the exact loading pattern of rock burst loading [8].

3. Materials and Methods

The method encompasses the entire design and calibration process of generating the FEA double shear test model. Prior to any testing, the calibration of the model was required. This is considered the most crucial aspect of numerical modelling. The development of the model includes creating of the geometric parts, inputting material properties, applying boundary conditions and interactions, assembling the model and meshing the parts.

3.1. ACARP and Jennmar
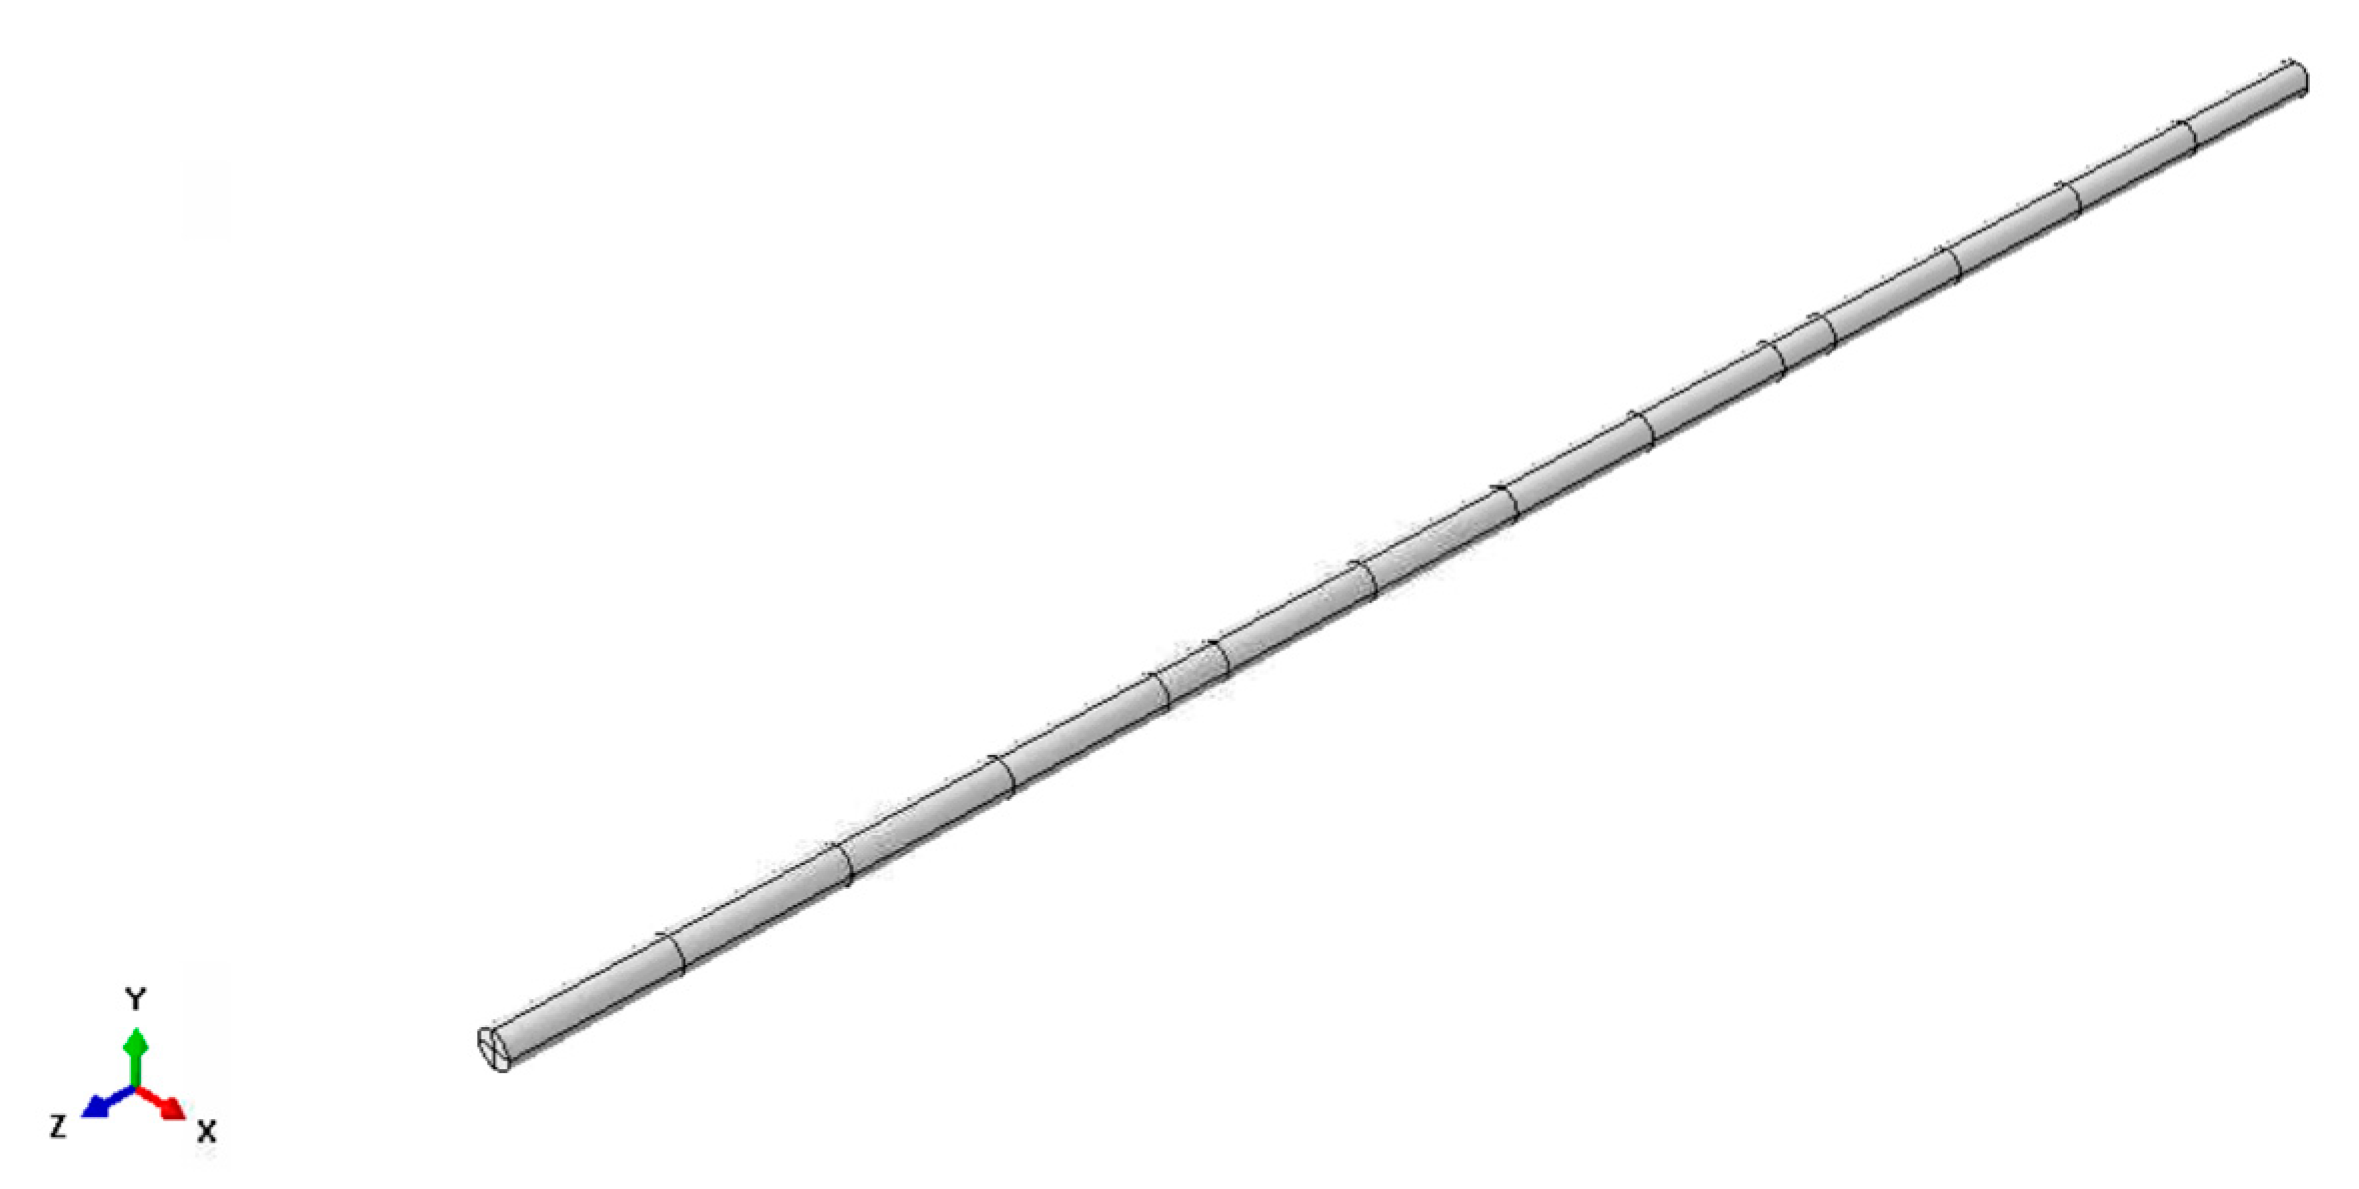
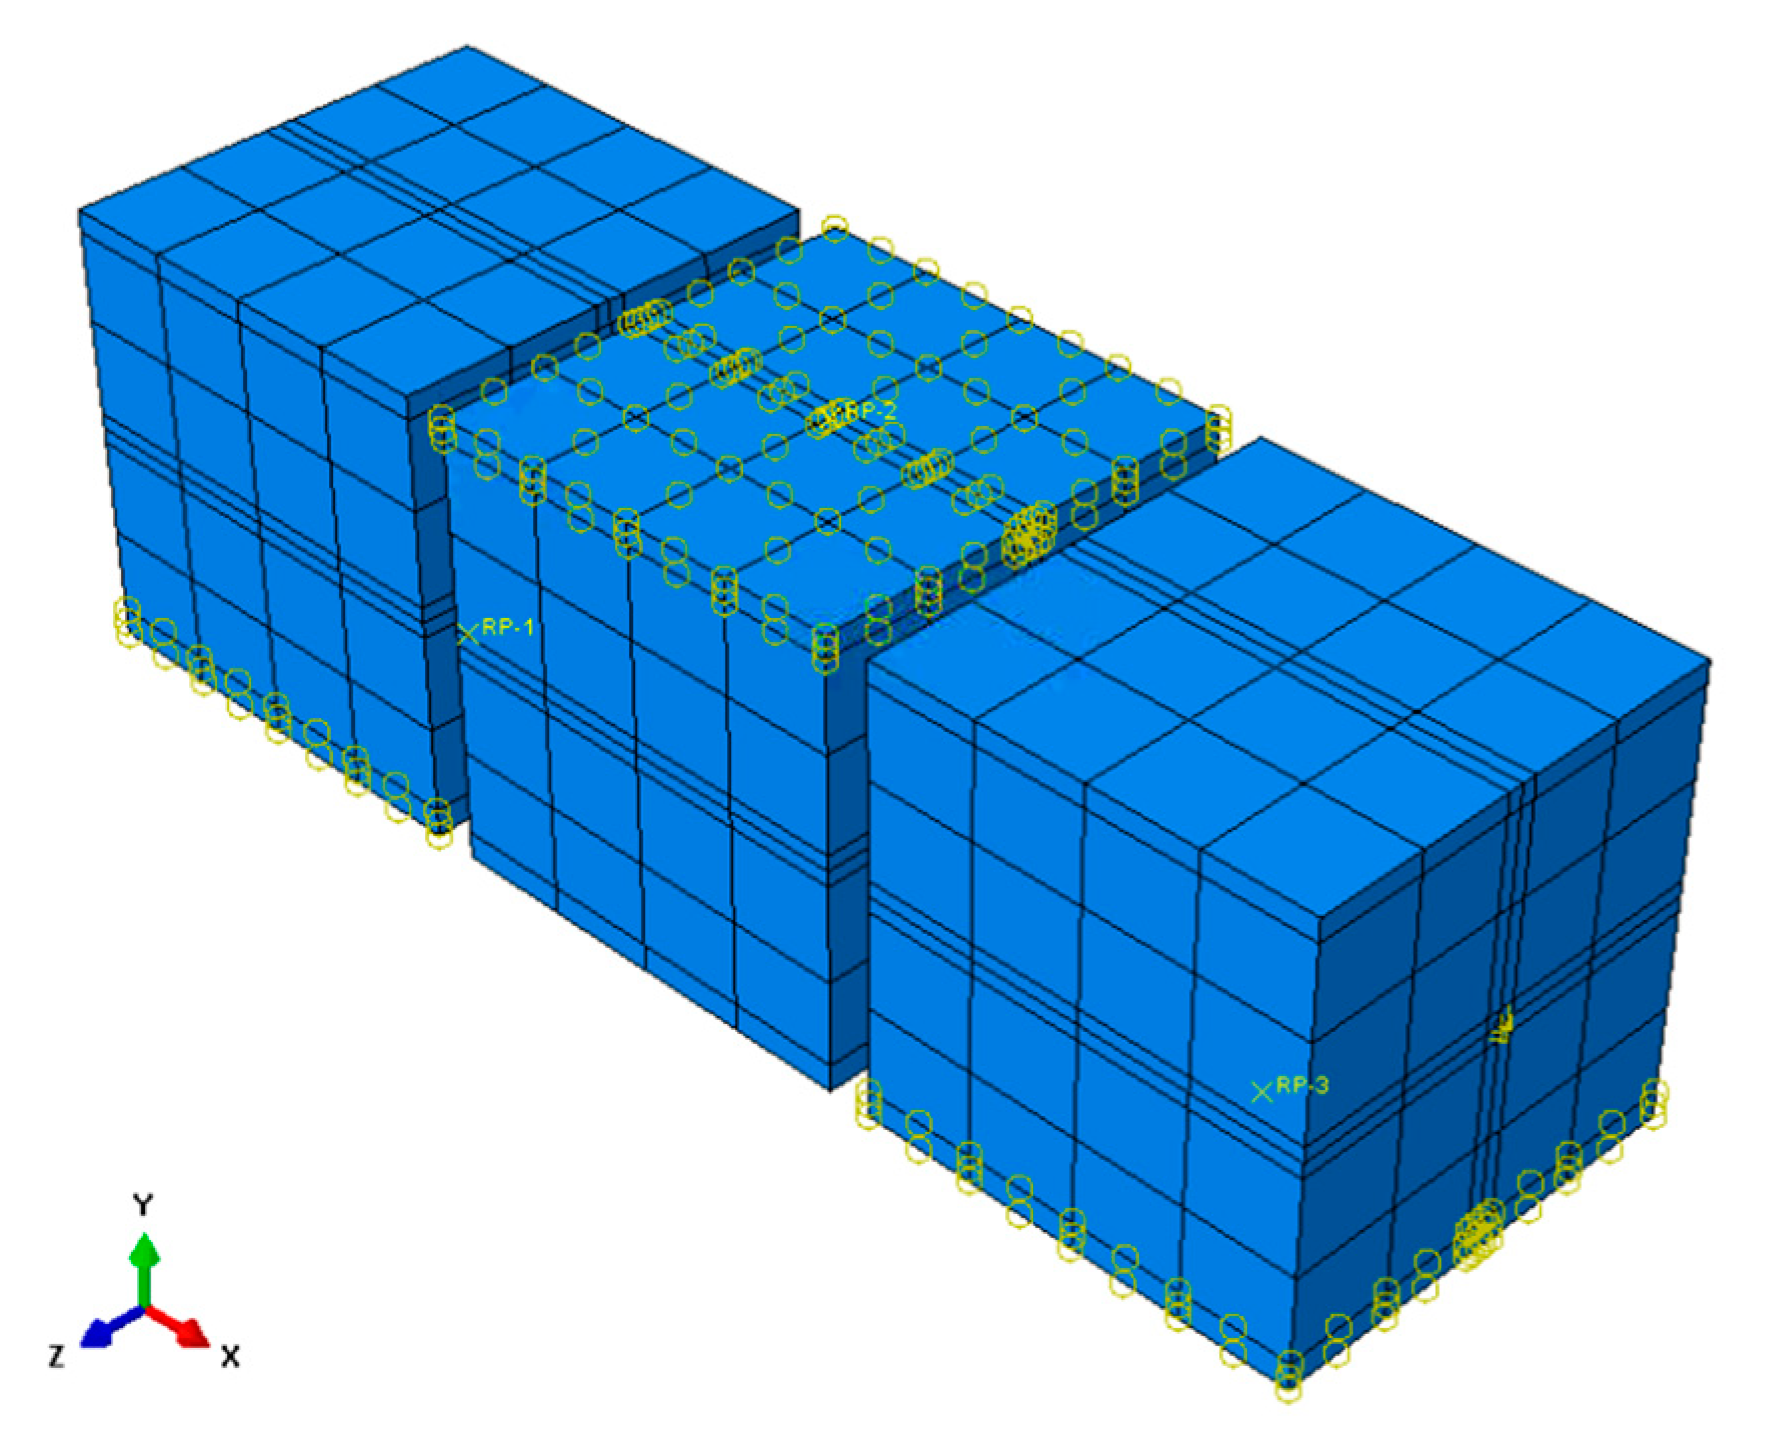
To gain an understanding of the intricacies around cable bolts and their properties, the Australian Coal Industry Research Program (ACARP) and Jennmar papers were consulted. This provided a comparative model for which the model could be calibrated against for static loading, as ACARP had completed a similar study. The dynamic model was calibrated against Tahmasebinia et al. (2018) [5], which a built upon Mirzaghorbanali et al. (2017)’s [2] work. Practical testing of bolts was obtained by extracting data from Jennmar, a steel bolt manufacturing company.
Jennmar Civil is a cable bolt manufacturing company that widely produces cable bolts designed for deep mining excavation. The bolts they manufacture have been an industry standard and are therefore referenced within the investigation. By modelling the cable bolts for the double shear test based on these bolts, the following tests yielded reliable results that are consistent with industry practice and manufacturing capabilities. The mechanical and geometrical properties were obtained from Jennmar. The bolts that have been considered by Jennmar are summarised below, in Table 2.
Similarly to ACARP’s 2021 study, a Ø28 Indented (ID) SUMO cable bolt was used to calibrate the static model. Jennmar has developed various types of bolt configurations such as the Yield Lok Bolt, J-Tech bolt and the Sumo Cable Bolt, which have unique functions and purposes. The configuration of the bolt serves a unique purpose, with each possessing notable distinguishing factors. The Yield Lok Bolt contains a lock nut at the end which acts as a locking plate with the bolt and the rock face. This was designed for high seismic conditions due to its polymer ploughing design. The J-Tech Bolt is a more generic bolt model that is suitable with either resin capsule or grout. The threads can be made finer to achieve higher tension for a given torque. The Sumo bolt contains a bulb-like structure which is bird-caged throughout the entire bolt. This increases flexibility in handling, making it more advantageous around confined areas and contains smooth wires for optimum performance in shear.
The specific configuration and layout of the bolt contribute to each respective bolts’ shear capacity and its overall behaviour under the double shear test. Within the scope of this investigation, the configuration is not a parameter that will be tested, and therefore, all bolts will be reduced to a single metal rod. This will also assist in the modelling procedure and will be further elaborated on in the following section.

3.2. Model Geometry

To create the model, each individual geometric component was constructed. The double shear test comprises 2 key components, the box and the bolt. Mirzaghobanali et al. (2017) modelled a double shear test which consisted of 300 mm cubic end blocks with a central block of 450 mm (L) × 300 mm (W) × 300 mm (H) and a 1050 mm cable bolt with no gap between the blocks. Tahmasebinia, Zhang, Canbulat, Vardar and Saydam (2018) [5] followed a similar construction for the double shear test, but incorporated dynamic loading to further build upon the model. Both studies were developed from a relatively similar model and hence, the following model was similarly constructed.
As the various types of bolts that were to be modelled are complex in geometry and possess a unique layout, the bolts were simplified to be a single cylindrical smooth bolt. Although this does not accurately reflect the actual design of the bolt type, this was a reasonable simplification to avoid excessive modelling complexities. Each bolt was of 1600 mm length with a diameter of 18, 20, 23, 25, 28 or 31 mm. Figure 1 illustrates the 28 mm bolt.
Mirzaghobanali et al. (2017) [2] differentiated between the geometry of the end and middle blocks; the blocks here are considered as having the same geometry. The blocks are representative of the individual rock layers within the geological rock profile and remain fixed at the ends, allowing only the middle block to move in the vertical, y, plane. The blocks were 500 mm (L) × 500 mm (W) × 500 mm (H). A hole with a diameter equal to the bolt under investigation was extruded through the centre of the cube in the ZY plane. Figure 2 illustrates the concrete box with a 28 mm extruded hole.
To aid ABAQUS in developing an efficient mesh, localised subdivisions were introduced by creating partitions around areas of concern. Focal areas where partitions were created included contact points, and areas where loading would be applied. ABAQUS develops a mesh by seeding the part, followed by auto-meshing. This develops a generic meshing model which cannot specifically refine meshing around boundary locations. This is further discussed in mesh generation.

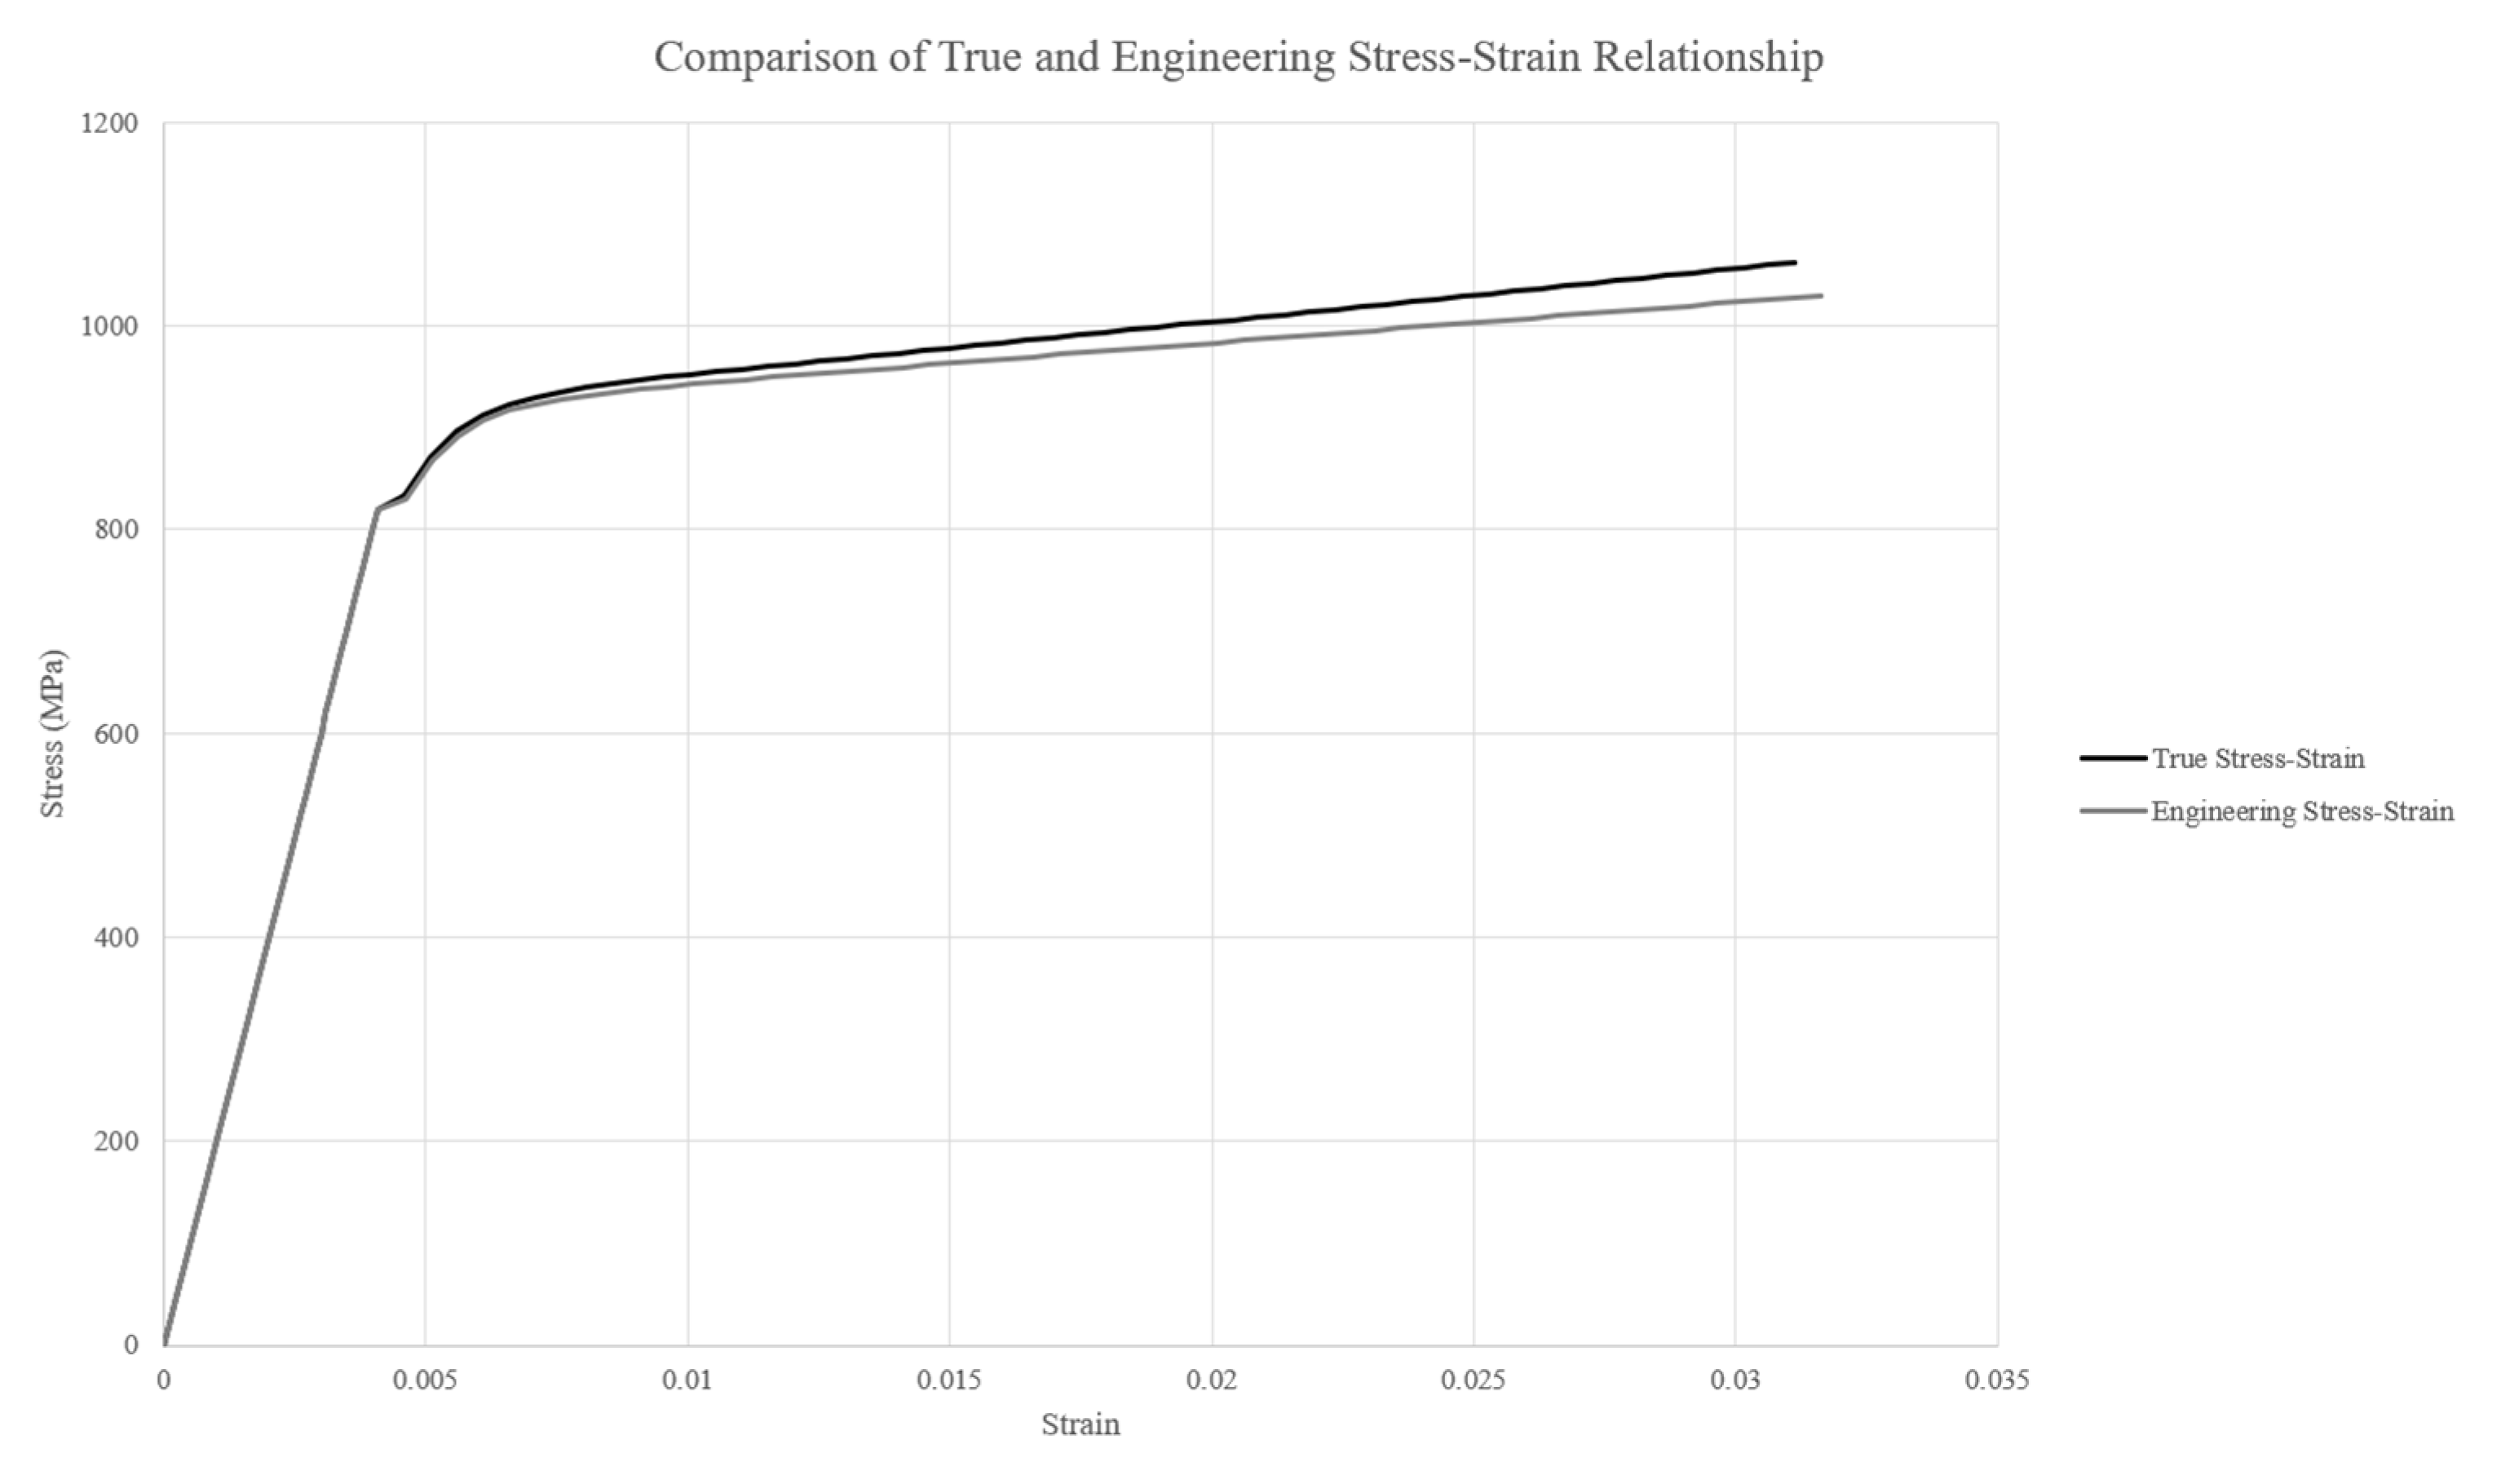
3.3. Material Properties

Material properties were defined for the steel bolt and concrete. The parametric study included the analysis of varying steel yield and ultimate strength. Therefore, as part of the calibration, the primary material properties that were included in the ACARP C27040 paper are referenced. The ID SUMO Cable Bolt material properties are summarised below in Table 3.
ABQAUS requires yield strength, fy, and ultimate strength, fu, as a pressure load. To convert force loads to a pressure, the yield strength was divided by the undeformed cross-sectional area.
The steel bolt has been defined to fracture; hence, elastic, plastic and shear damage material properties were defined. Furthermore, the steel density, Young’s modulus and Poisson’s ratio were also defined. The basic steel properties have been obtained through the OneSteel 7th edition steel catalogue [43]. Please see Table 4.
To replicate actual stress–strain plastic deformation, the Giuffre–Menegotto–Pinto model with isotropic strain hardening was utilised to describe the transition from the elastic slope to the plastic deformation region. Zafar and Andrawes (2012) [44] adopted this equation to model steel behaviour of various steels.
σ * = b ε * + ( 1 b ) ε * ( 1 + ε * R ) 1 R
The steel elastic and plastic behaviour was calculated in accordance with the AS4100:2020 Steel Structures codes. To accurately reflect the actual behaviour of steel undergoing plastic deformation, the true stress and strain must be utilised. The engineering stress–strain relationship fails to factor in the constantly changing cross-sectional area of the material and hence is simply applied to the initial cross-sectional area prior to any deformation. The following equations were utilised to account for the reducing cross-sectional area, thus giving the true stress and true strain equations [45,46].
σ T = σ E ( 1 + ε E )
ε T = ln ( 1 + ε E )
where the subscript E represents engineering stress/strain and the subscript T represents true stress/strain. As part of achieving calibration, this was necessary to ensure the accuracy of testing as it was compared with the experimental results obtained from ACARP Project C27040. A comparison of the engineering and true stress–strain curve for the calibrated model can be seen below in Figure 3.
To induce a fracture, ABAQUS requires shear damage properties for damage for ductile metals to be defined and hence, a fracture energy is required. Fracture energy is defined as the required energy per unit area to change a fracture surface from an initial unloaded state to complete separation [47]. This is calculated as the work carried out to achieve fracture and effectively calculate the area underneath the respective stress–strain curve [48]. A Python code was written to determine the specific fracture energy for all steel grades (see Appendix A). The fracture energy for the calibrated model was calculated as 336,302 N/mm. The fracture energy will vary according to the steel grade.
Concrete was selected as a substitute material for the rock layers as they possess relatively similar material properties. The various blocks are representative of layers of rocks which the cable bolt penetrates. Within the actual geological profile, the nature of the rock, faults and strength of the rock will affect the behaviour of the cable bolt subject to shear; this model provides a simplification of this and therefore, the same concrete properties have been applied across all three blocks. The following concrete properties have been calculated in accordance with AS3600:2018 [49]. Please see Table 5.
The concrete damage plasticity (CPD) is defined in ABAQUS to model concrete and other quasi-brittle material inelastic behaviour. It assumes that there are two primary failure mechanisms, tensile cracking and compressive crushing. As the load is applied from the load cell and is transferred to the bolt, the concrete is expected to absorb energy and hence experience a compressive and tensile force. Sumer and Aktas (2015) [50] defined the uniaxial tensile and compressive stress–strain relationships which were used to determine the concrete damage properties. This was consistent with Xiao, Chen, Zhou, Leng and Xia (2017)’s [51] understanding of CPD and therefore was utilised in this model.

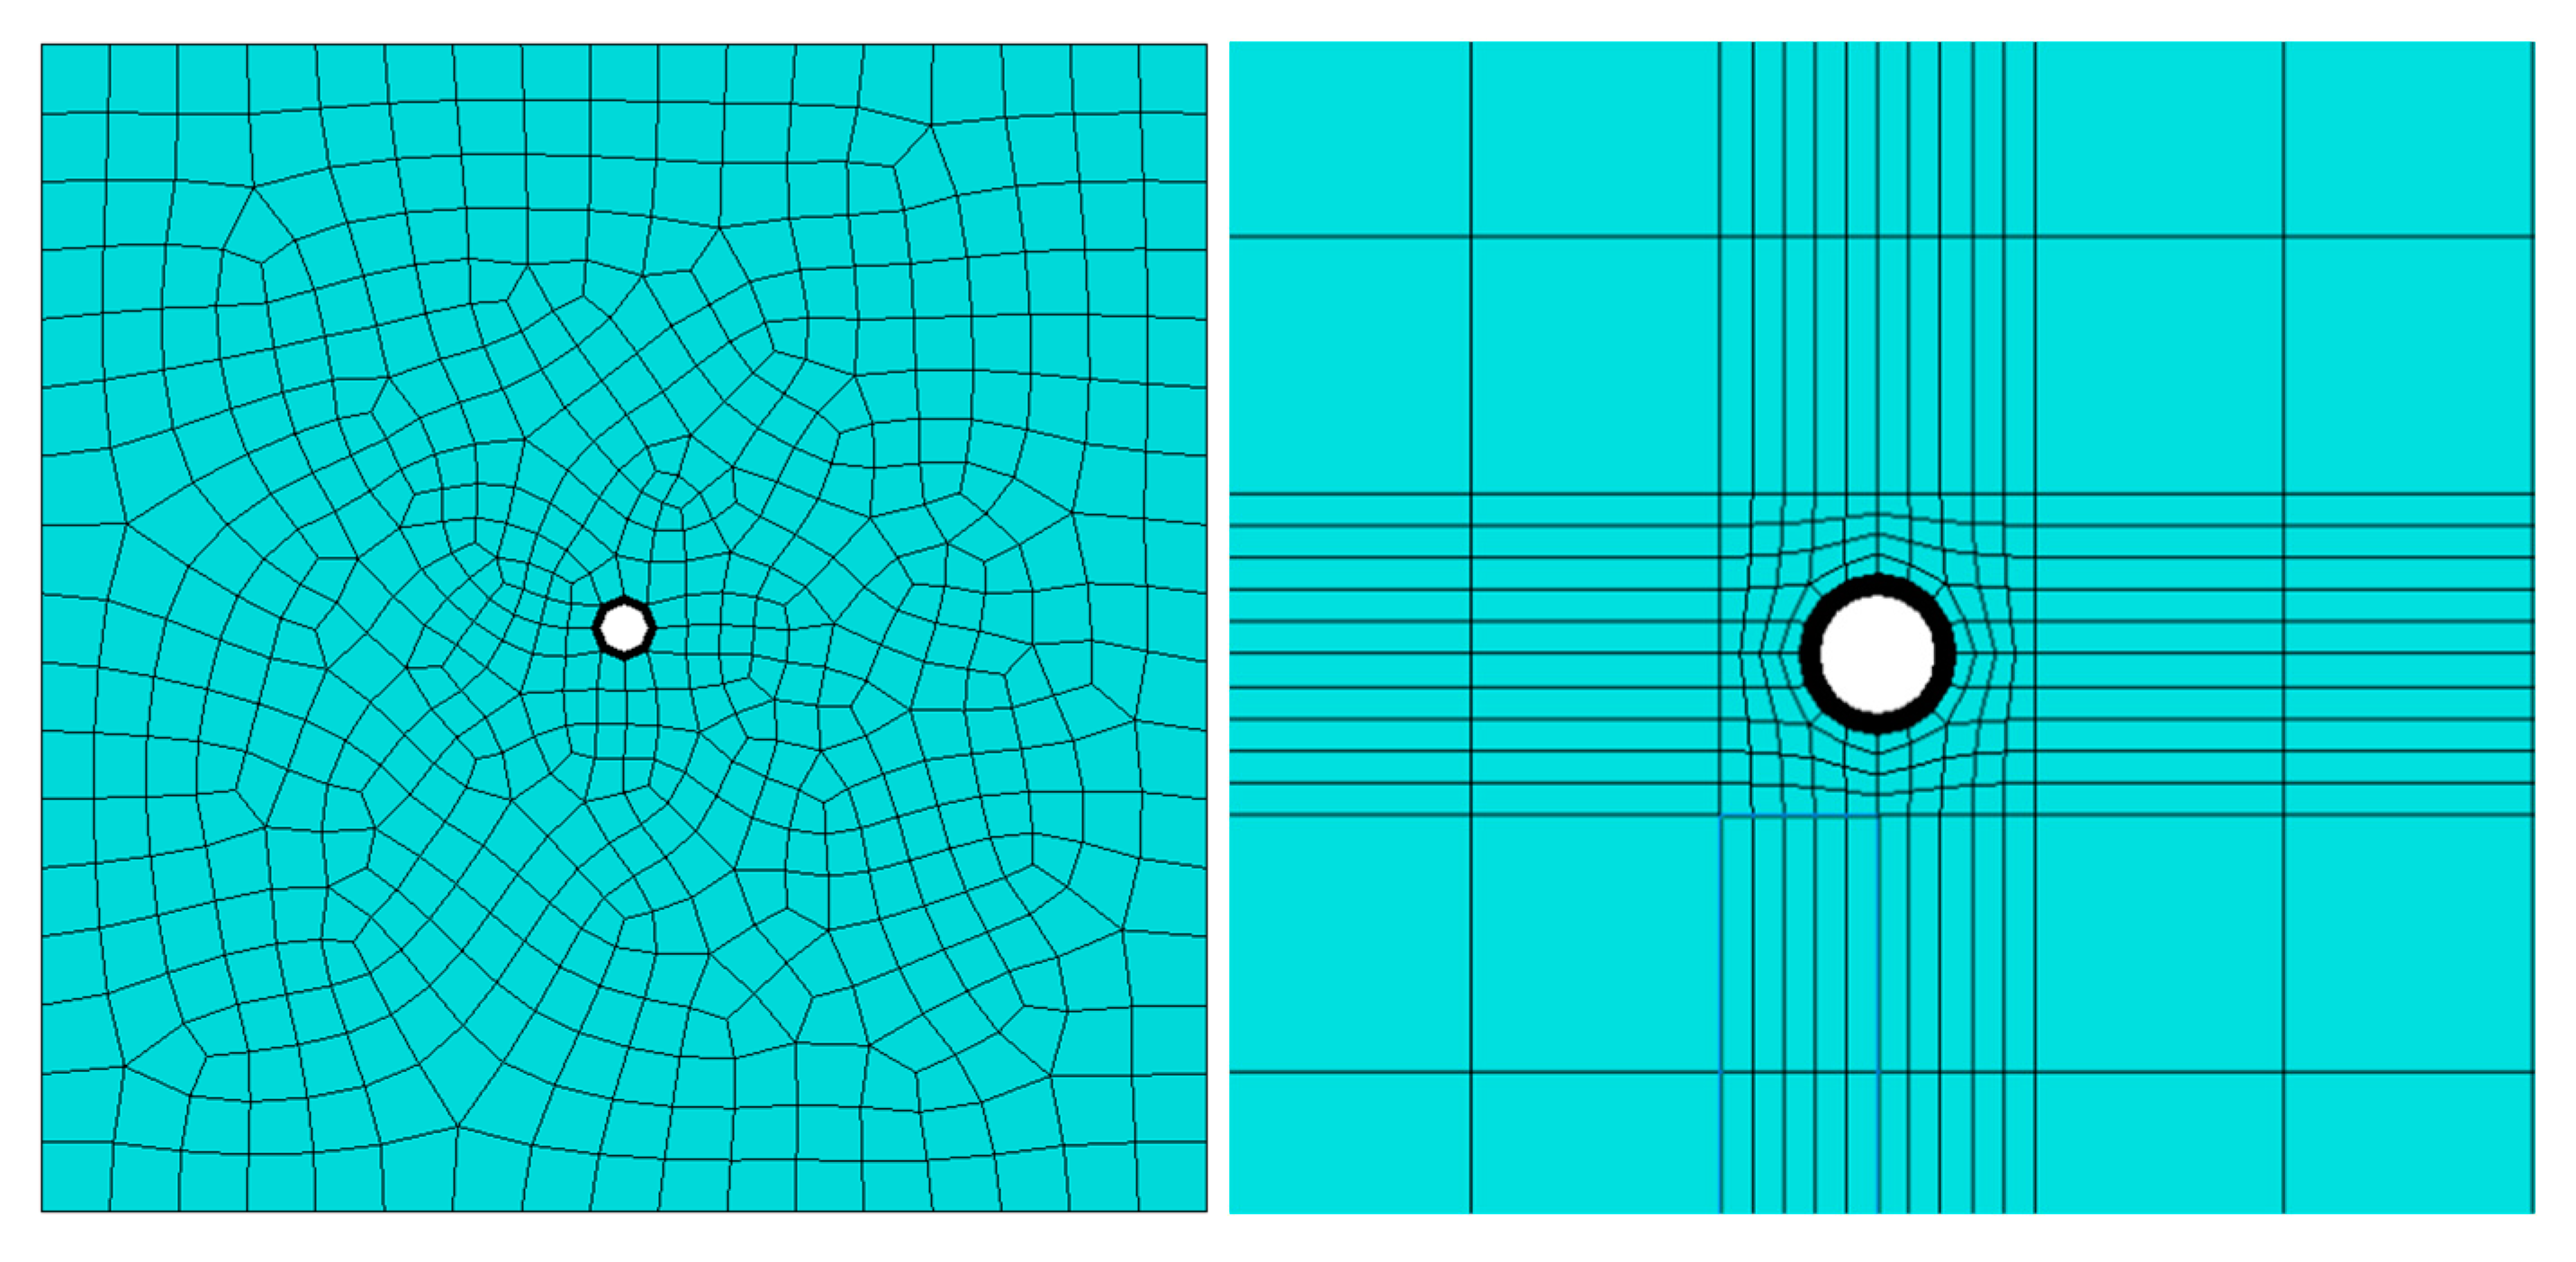
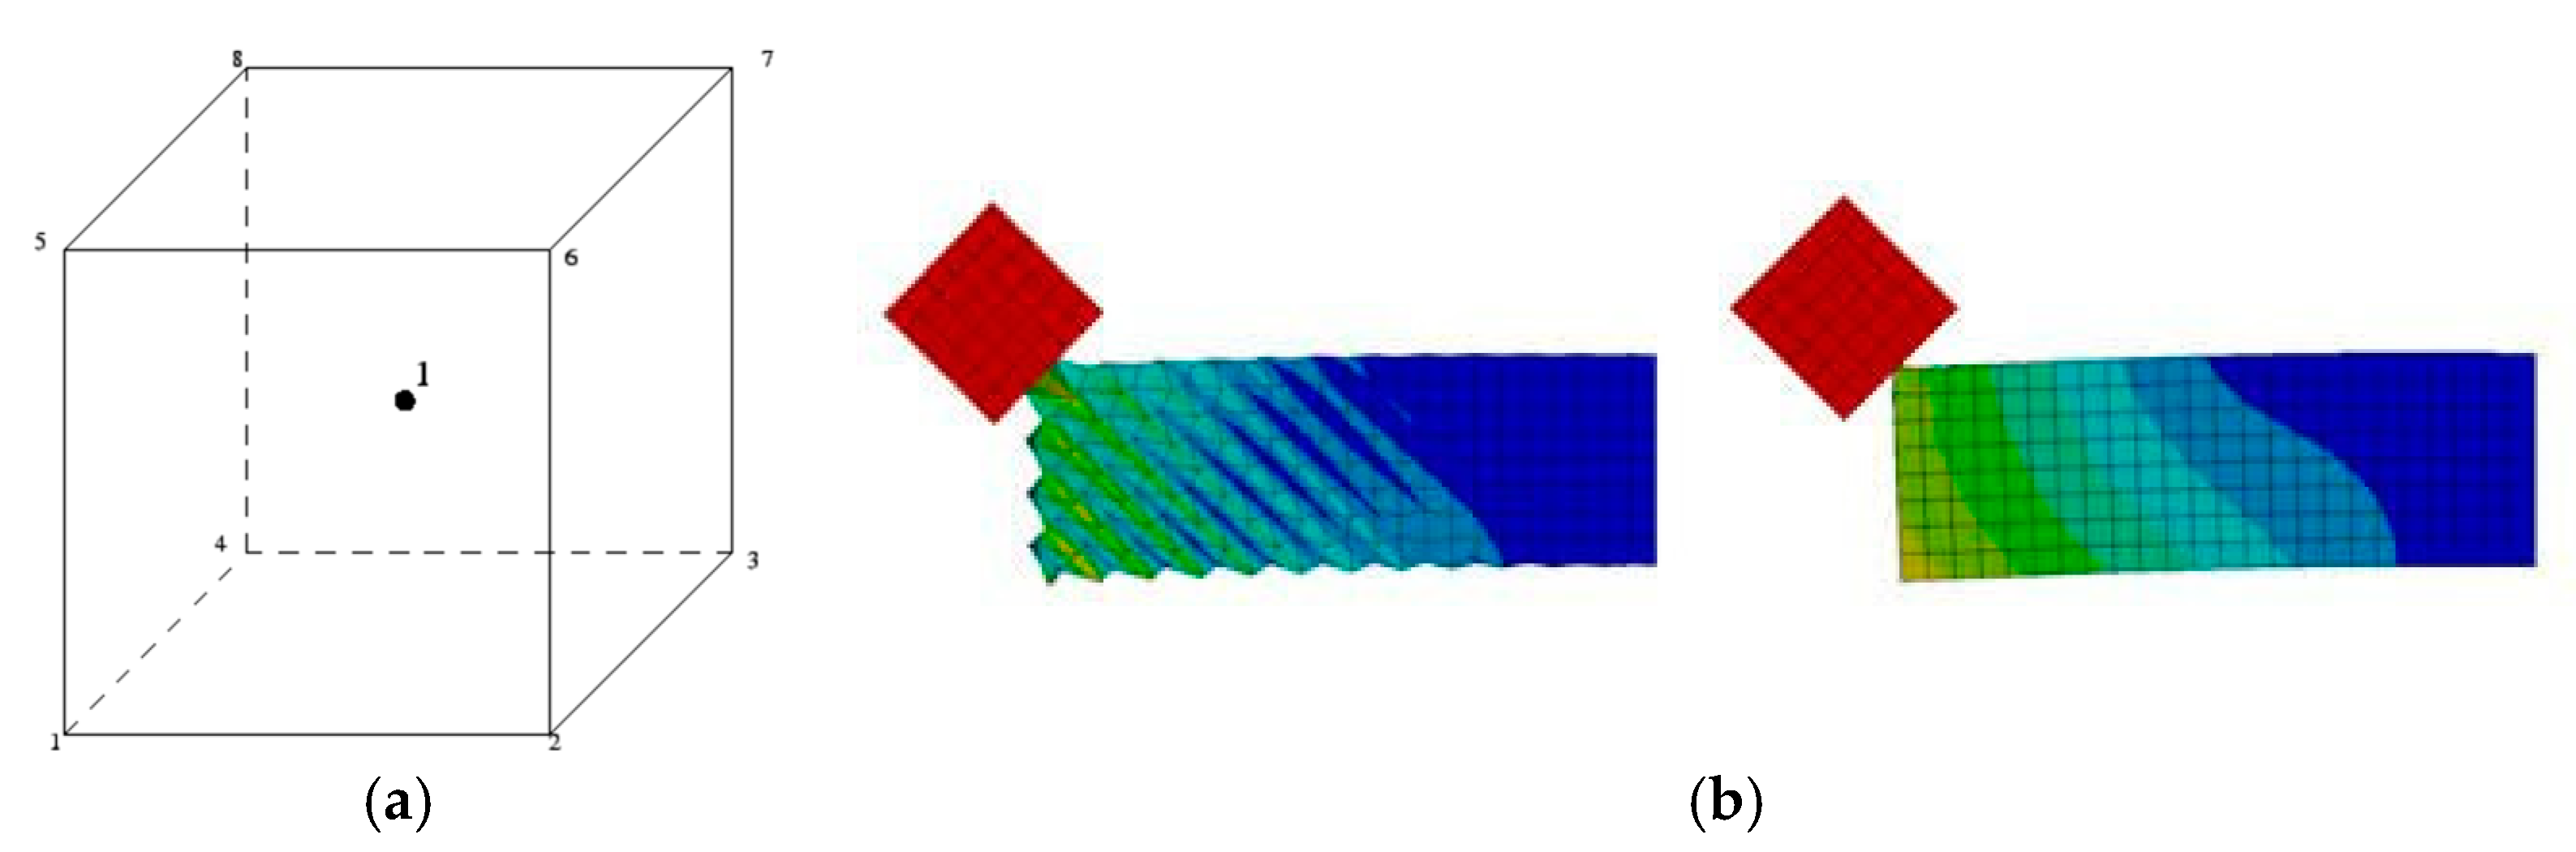
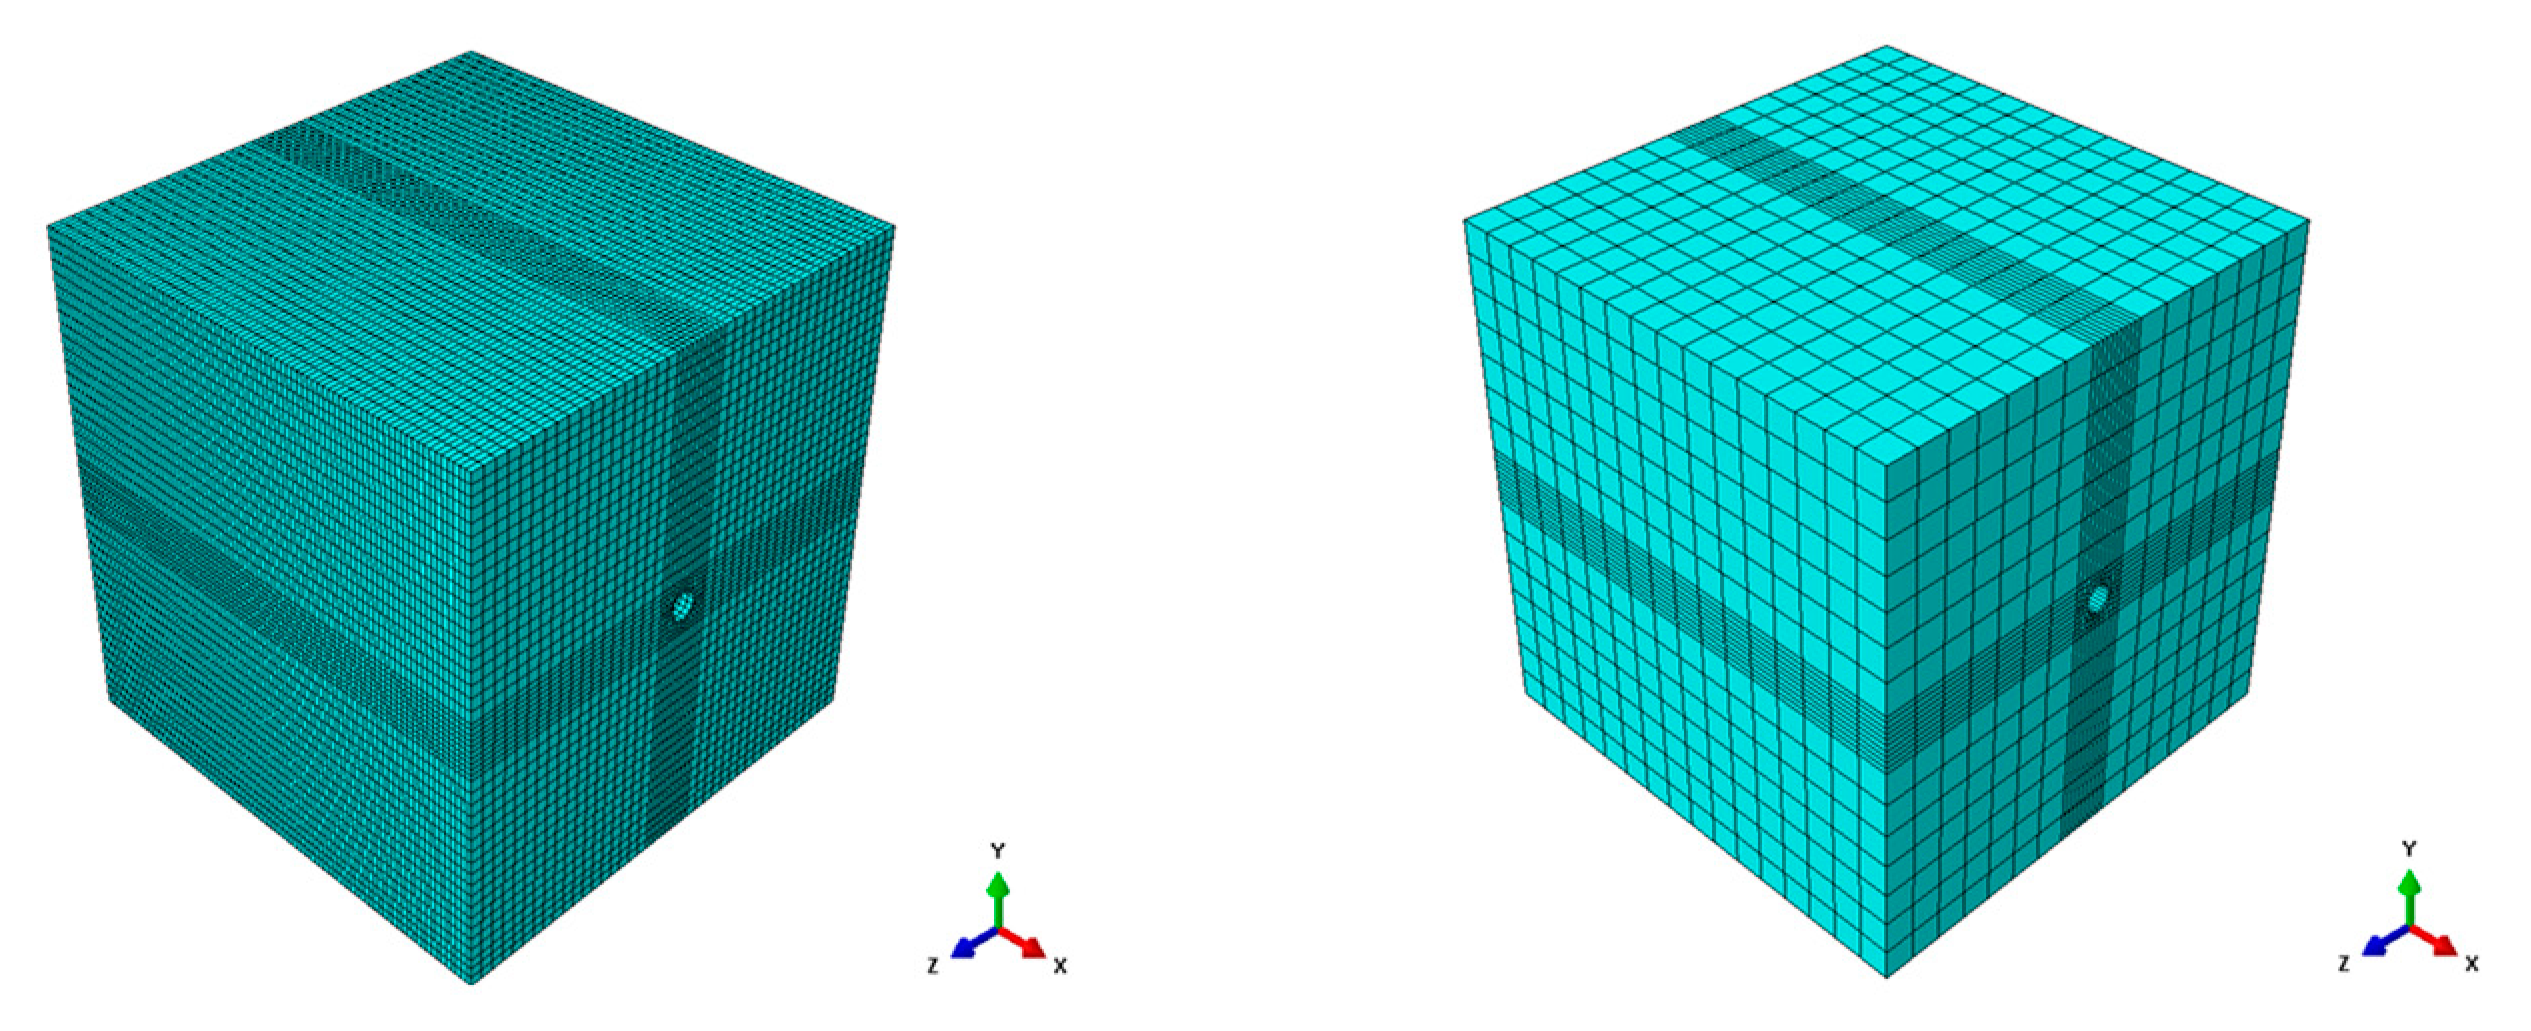
3.4. Mesh Generation

Detailed meshing is crucial in developing an accurate model that will produce accurate results. Effectively, by reducing the size of the mesh, ABAQUS can process the behaviour of individual elements more precisely as interpolation is utilised across a lesser distance to calculate stresses and deformations, thus eliminating imprecise estimations. However, by increasing the fineness of the mesh, more elements are created, and thus the computational time is inevitably increased as the FEA needs to run more equations. Therefore, is it important to differentiate between parts of the model which require a fine mesh and parts that require a coarse mesh.
The inbuilt ABAQUS auto-meshing function generates a mesh based on the seeding size that is specified. This creates a mesh size of specified seed size that does not consider the irregularity of the mesh. Therefore, partitions were manually added around areas of greater concern such as contact points, areas of significant deformation and high stress concentrations to create an ideal mesh. Figure 4 displays the difference in mesh regularity between the auto-meshing function with and without any partitions.
As the mid-section of the bolt is the primary region of concern as it deflects, the mesh around this area was made twice as fine as the first and last third of the bolt. Furthermore, this was extended to the 50 mm gap between the concrete blocks. The mesh can be seen in Figure 5 below.
When modelling steel and concrete members with ABAQUS, one of the main issues is addressing convergence due to the extensive number of contacts. This is particularly prevalent in the double shear test model at the contacts between the cable bolt and the concrete boxes. Therefore, the 8-node linear brick element, C3D8R, with reduced integration and built-in hourglass control will be used. The linear brick element contains a single integration point at the centre of the brick with 8 nodes forming the 1 × 1 × 1 cube. The reduced integration model is ideal when subject to plastic behaviour [52]. However, in conjunction with this, it is necessary to apply hourglass control because of the reduced stiffness of the reduced integration model. This will aid the meshing process and the overall run time of the model. Figure 6 shows the schematic diagram of the C3D8R model whilst highlighting the effects of hourglass control.
Mesh size was determined by comparing the trends of numerical and experimental data. The coarsest mesh that would minimise computational time and produce accurate results was selected. Seeding sizes of 10%, 15%, 20% and 25% of the bolt’s diameter were selected as the fine mesh portion, whilst the outer boundary was assigned double this value for static testing. For dynamic testing, an optimal mesh was selected by considering seeding sizes of the dynamic load. The results of various seeding were compared against the experimental results and can be seen in Figure 7.
The computational times for various seeding sizes were recorded in Table 6 below.
Final mesh sizes were chosen based on the effects of a finer mesh and computational times. Excess deflections were observed when meshes of 5% and 10% were applied to the sphere. Despite reduced computational times, the coarse mesh presented too many inaccuracies. A 2% mesh size was selected due to the excessive computational time of 1% with little difference in deflection. A summary of seed sizing of the calibrated model is given below in Table 7.

3.5. Interactions and Rigid Bodies

Interactions were created between the contact points between the bolt and the box. One of the primary advantages of using ABAQUS is its ability to define contact interaction properties. Three general surface-to-surface interactions were created between the steel bolt and the concrete boxes. There are 3 defining characteristics that were utilised to determine which surface would be the master and slave.
  • The larger surface should be the master;
  • If approximately the same size, the stiffer body should be the master;
  • If similar size and stiffness, the surface with the coarser mesh should be the master.
In this instance, the concrete was determined to be the master as the surface is larger than the bolt and will have a coarser mesh overall since the deflection of the load cell is measured. A penalty contact method was applied with mechanical, tangential and normal properties defined (see Table 8). These values are applied to account for slip conditions and are necessary to reflect the natural pulling that will occur due to the cable bolt undergoing a shear force.
Rigid bodies have been applied to sections of the model. To apply the rigid body, a set of reference elements, in this case body elements, was captured by a single reference point. By defining elements of the model as a rigid body, the shape does not deform, and therefore is not impacted when the load is applied. Rigid bodies have been placed at the base of the end blocks and at the top block. Figure 8 below shows the rigid body elements of the static and dynamic model.

3.6. Boundary Conditions and Loads

The double shear test involves fixing the end blocks and applying a vertical load to the middle block. Therefore, when simulating the double shear test in ABAQUS, it is necessary to apply boundary conditions to reflect this. The concrete end blocks were fixed in all directions and fixed in all rotational axes, whilst the middle block was fixed in all directions except the vertical plane and fixed in all rotational planes. The boundary conditions were applied on reference nodes that contained the whole surface face set as defined when applying rigid bodies. All boundary conditions were placed as an initial condition (see Figure 9).
To prevent the bolt from slipping, it was fixed at the ends in all displacement and rotational planes. A loading rate was defined for the middle block. The loading rate was applied to the central reference node of the load cell and assumed to be 100 mm/s. This was applied at Step 1 of the test as it was not an initial condition. For calibration purposes, this was set to 200 m/s, as defined by Tahmasebinia et al. (2018) [5].

3.7. Assembly

The model was assembled such that the bolt fit perfectly within the box with a 50 mm gap between each box. The purpose of this was to simulate a test whereby the frictional forces of the boxes would not impact the shear analysis. Each block was 50 mm apart from the next block. As the model was assembled as such, no frictional forces will contribute to the measured shearing force of the bolt which would be measured by the load cell.

3.8. Step

A single step was generated for the analysis. To obtain accurate deflection information, it is important to allow the test to run for an acceptable time step. Initially, a single second time step was set up. This showed a deflection pattern that continually was rising, suggesting that a longer time step was to be utilised. This was changed to 1.5 s. The force vs. deflection graph agreed with the calibrated test study. It was also necessary to define the number of outputs that ABAQUS would return to provide effective data that did not span across a significant time step.
The analysis procedure of the static test was dynamic explicit. However, to conduct a valid test for this model, mass scaling was applied, so a quasi-static test was observed. Because the simulation includes rate-independent material behaviour, the natural time scale can be ignored. By artificially applying mass-scaling to the entire model, the mass is increased, thus omitting any consideration of the natural time scale and achieving a quasi-static analysis. Table 9 below tabulates the quasi-static mass scaling criteria. The maximum displacement can only be considered at the ultimate load resisted by the load cell as displacement reflects the load cell displacement.

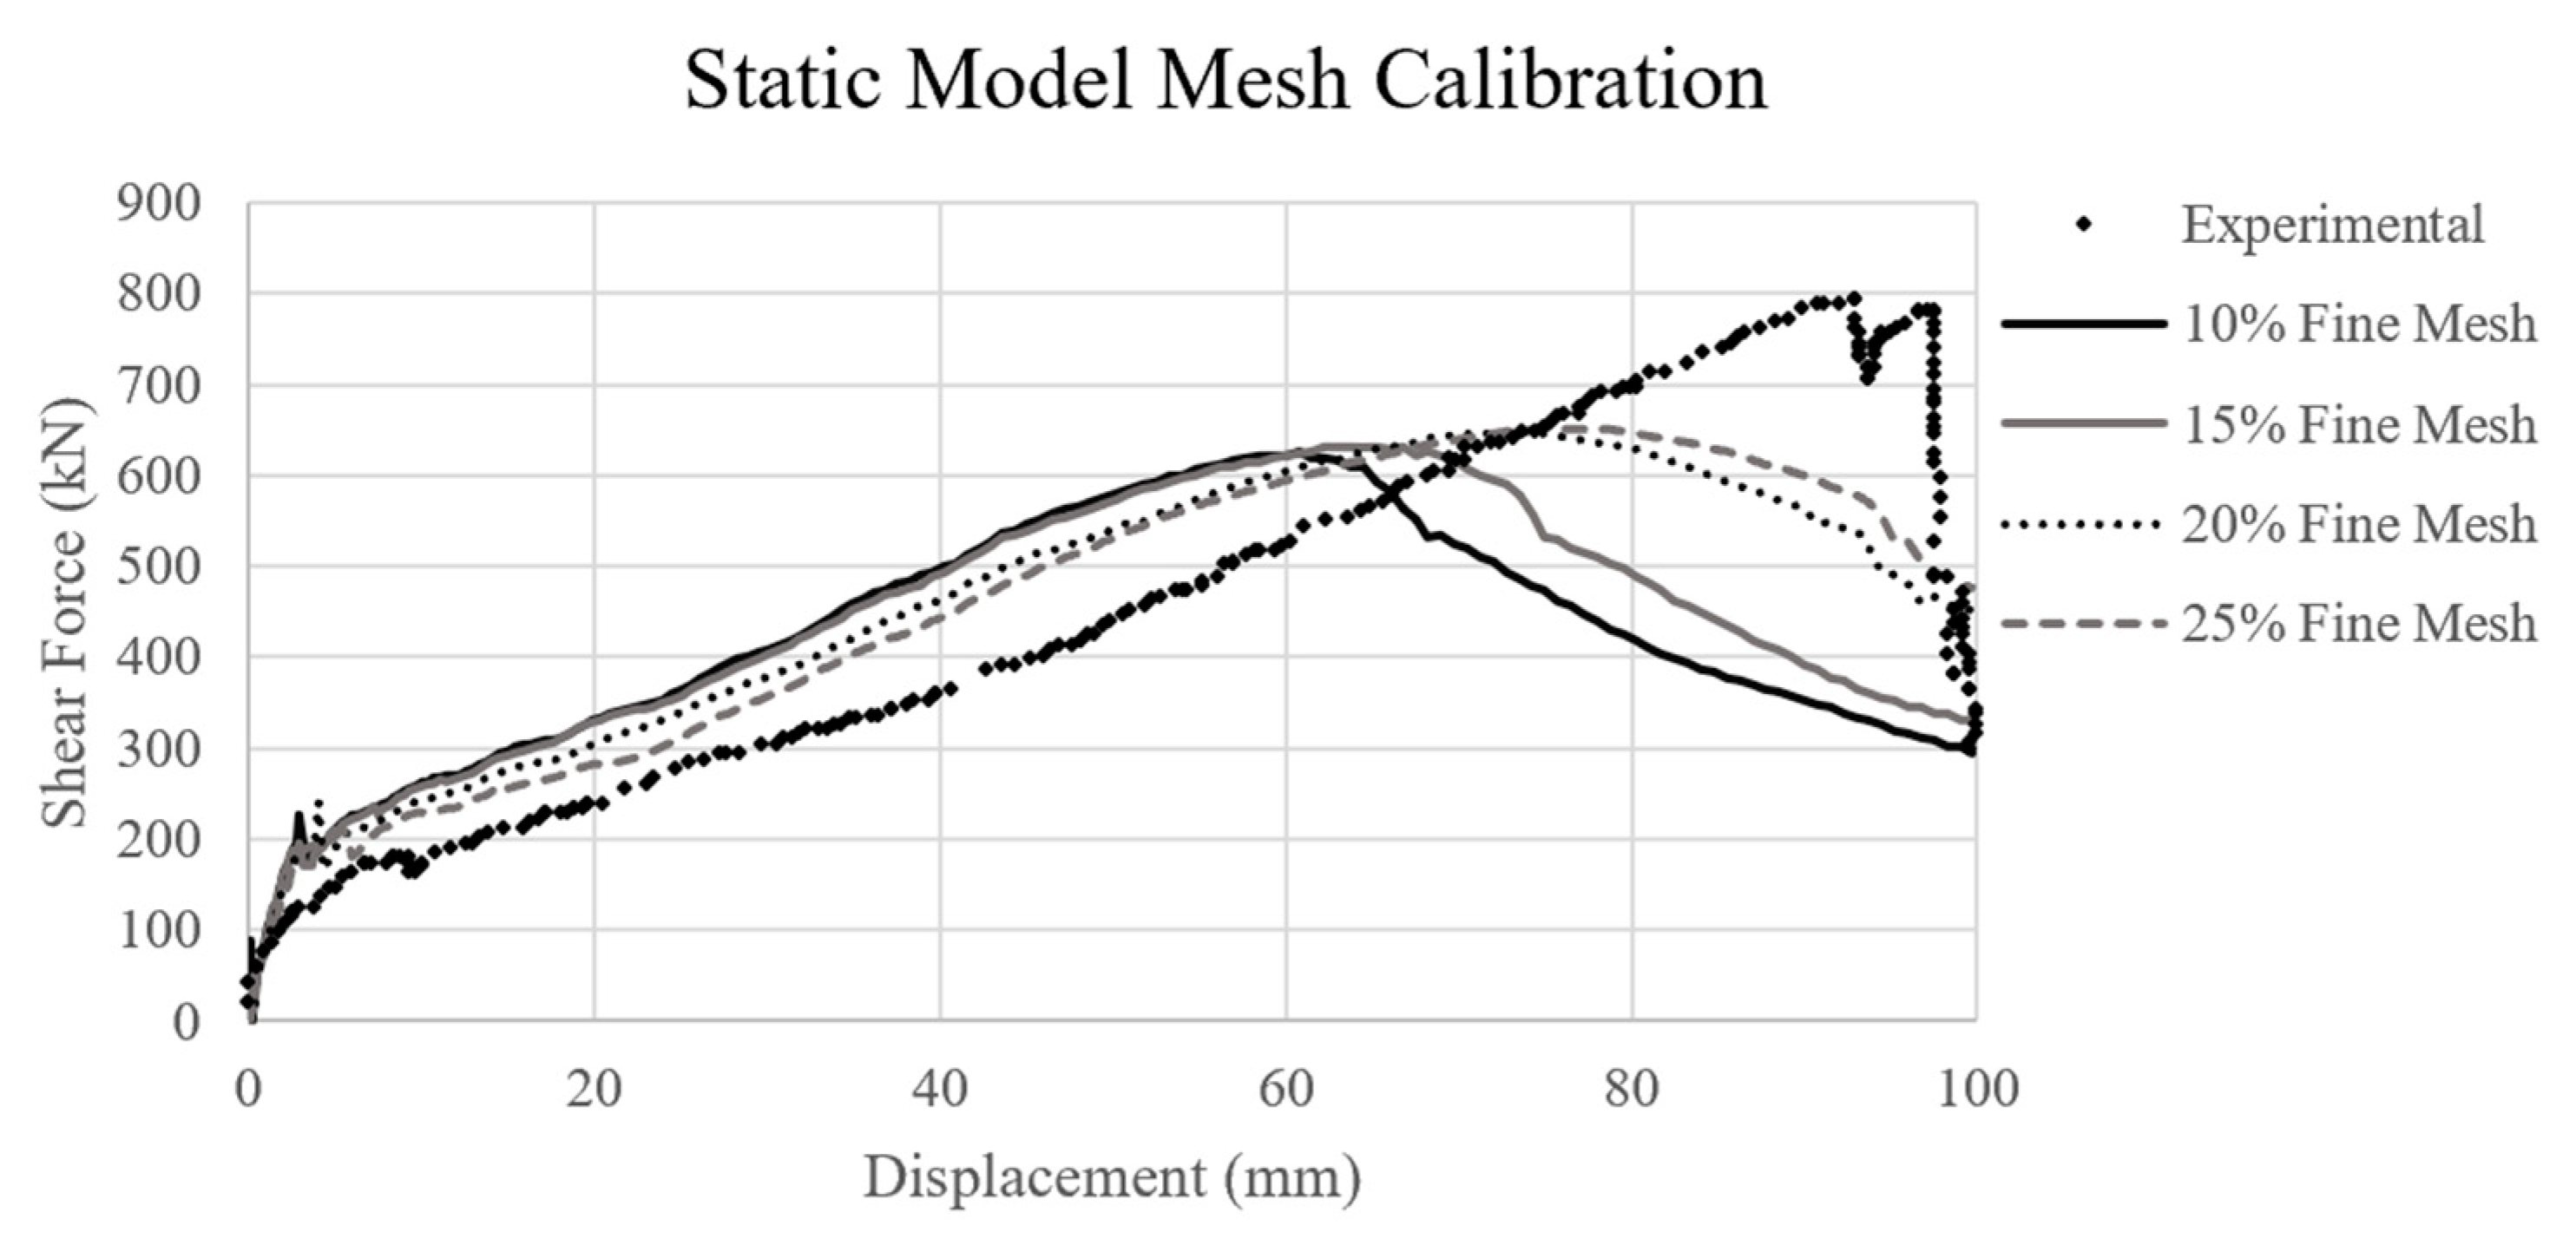
3.9. Calibration of the Model

Prior to performing any analysis, the model first required calibration. This is to show that the results that were obtained from the model are consistent with proven experimental studies and various academic literature. The static model was calibrated against the results obtained from the ACARP C27040 paper using the double shear test on a 63 T Indented Sumo bolt with 0 tonne pretension and angled perpendicular to the shearing plane. Whilst the dynamic model was not calibrated against an experimental result, it was compared against Tahmasebinia et al. (2018) [5] dynamic model, which measured impact loading against deflection.
The development of the model required the simplification of geometrical and material properties such as defining the cable bolt as a smooth single rod. Furthermore, as the experimental testing includes manufacturing defects within the steel that is measured, this contributes to the inaccuracies of simplifying the model. Whilst there are numerous factors that contribute to the simplified inaccuracies of the model, the output is deemed to be valid, and the model will be calibrated if the results display a similar pattern deflection force pattern, and the maximum results for displacement and force are within 25% of the calibrated data.
The Drucker–Prager model was initially investigated as a parameter to increase the overall accuracy of the model; however, it was omitted from testing as it significantly increased the computational time without significant variation in the results.
The calibration of the model involved an iterative process which required constant revision of the model by varying different parameters. The iteration process required careful consideration of how variables were applied. For example, a first pass iteration of the model did not consider applying boundary loads to the ends of the bolt, fixing them to be restricted in all translations and rotations. This resulted in slipping of the bolt and observing large deflections. The meshing process was considered to determine the appropriate balance between a fine and coarse mesh when examining the impact on the validation of the model.
The static calibration model was obtained from the analysis with results graphed against the experimental data. A visual assessment was conducted to compare the force vs. displacement pattern of the graph to ensure consistency, whereas a quantitative analysis was conducted to confirm that calibration was achieved. A comparison between the maximum displacement at ultimate force and maximum force of the model and experimental data was completed.
D i s p l a c e m e n t S t a t i c ,   C a l i b r a t e d D i s p l a c e m e n t S t a t i c , E x p e r i m e n t a l = 73.5 92.82 = 0.79 = 79 %   c a l i b r a t i o n F o r c e S t a t i c , C a l i b r a t e d F o r c e S t a t i c , E x p e r i m e n t a l = 647 795 = 0.81 = 81 %   c a l i b r a t i o n
F o r c e S t a t i c , C a l i b r a t e d F o r c e S t a t i c , E x p e r i m e n t a l = 647 795 = 0.81 = 81 %   c a l i b r a t i o n
The calibrated force vs. displacement graph was plotted against the ACARP C27040 experimental data. As seen below in Figure 10, the calibrated model follows a similar curvature to the experimental data, particularly up to the ultimate load. A key difference, however, is the post-failure behaviour. The FEA data obtained show a gradual failure. This is inconsistent with existing steel behaviours which show that steel exhibits a much more brittle failure, shown in the experimental data. The corresponding displacement for the maximum force occurs at different stages. The FEA model was calibrated and validated to 80% and is deemed acceptable.
The different modes of failure have also been successfully replicated by the FEA model. Initially, a shear failure occurs where the force suddenly experiences a dip, followed by a gradual increase in applied force to induce bending. Finally, fracture is shown at the sudden drop where both shear and bending have both completely failed.

3.10. Testing

Once the model was calibrated, testing was conducted to obtain results for the parametric study. Testing involved examining the impacts of variables against deflection. The test involved examining 6 cable bolt diameters and 6 steel strengths, totalling 36 test variations. The parameters have been summarised below in Table 10.
The results from the testing are presented in the next section, followed by a discussion of the validity and trends of the data. Finally, conclusions from the test are obtained and recommendations are provided for further study.

4. Results

4.1. Bolt Diameter

The results from the static double shear test when measuring the effect of varying the diameter of the bolt are summarised in the graph below. A comparison of the effects of increasing the diameter was modelled for the varying yield strengths of the bolt to ensure consistency within the bolt deflection pattern. Figure 11 compares the force vs. deflection when yield strength is 550 MPa and 922 MPa.
The varying bolt diameters show a consistent trend across all yield strengths, whereby by increasing the bolt diameter, the bolt can absorb a larger energy capacity before failure. All bolts experience the same deflection pattern. However, the larger the bolt, the greater capacity it can withstand before failure.

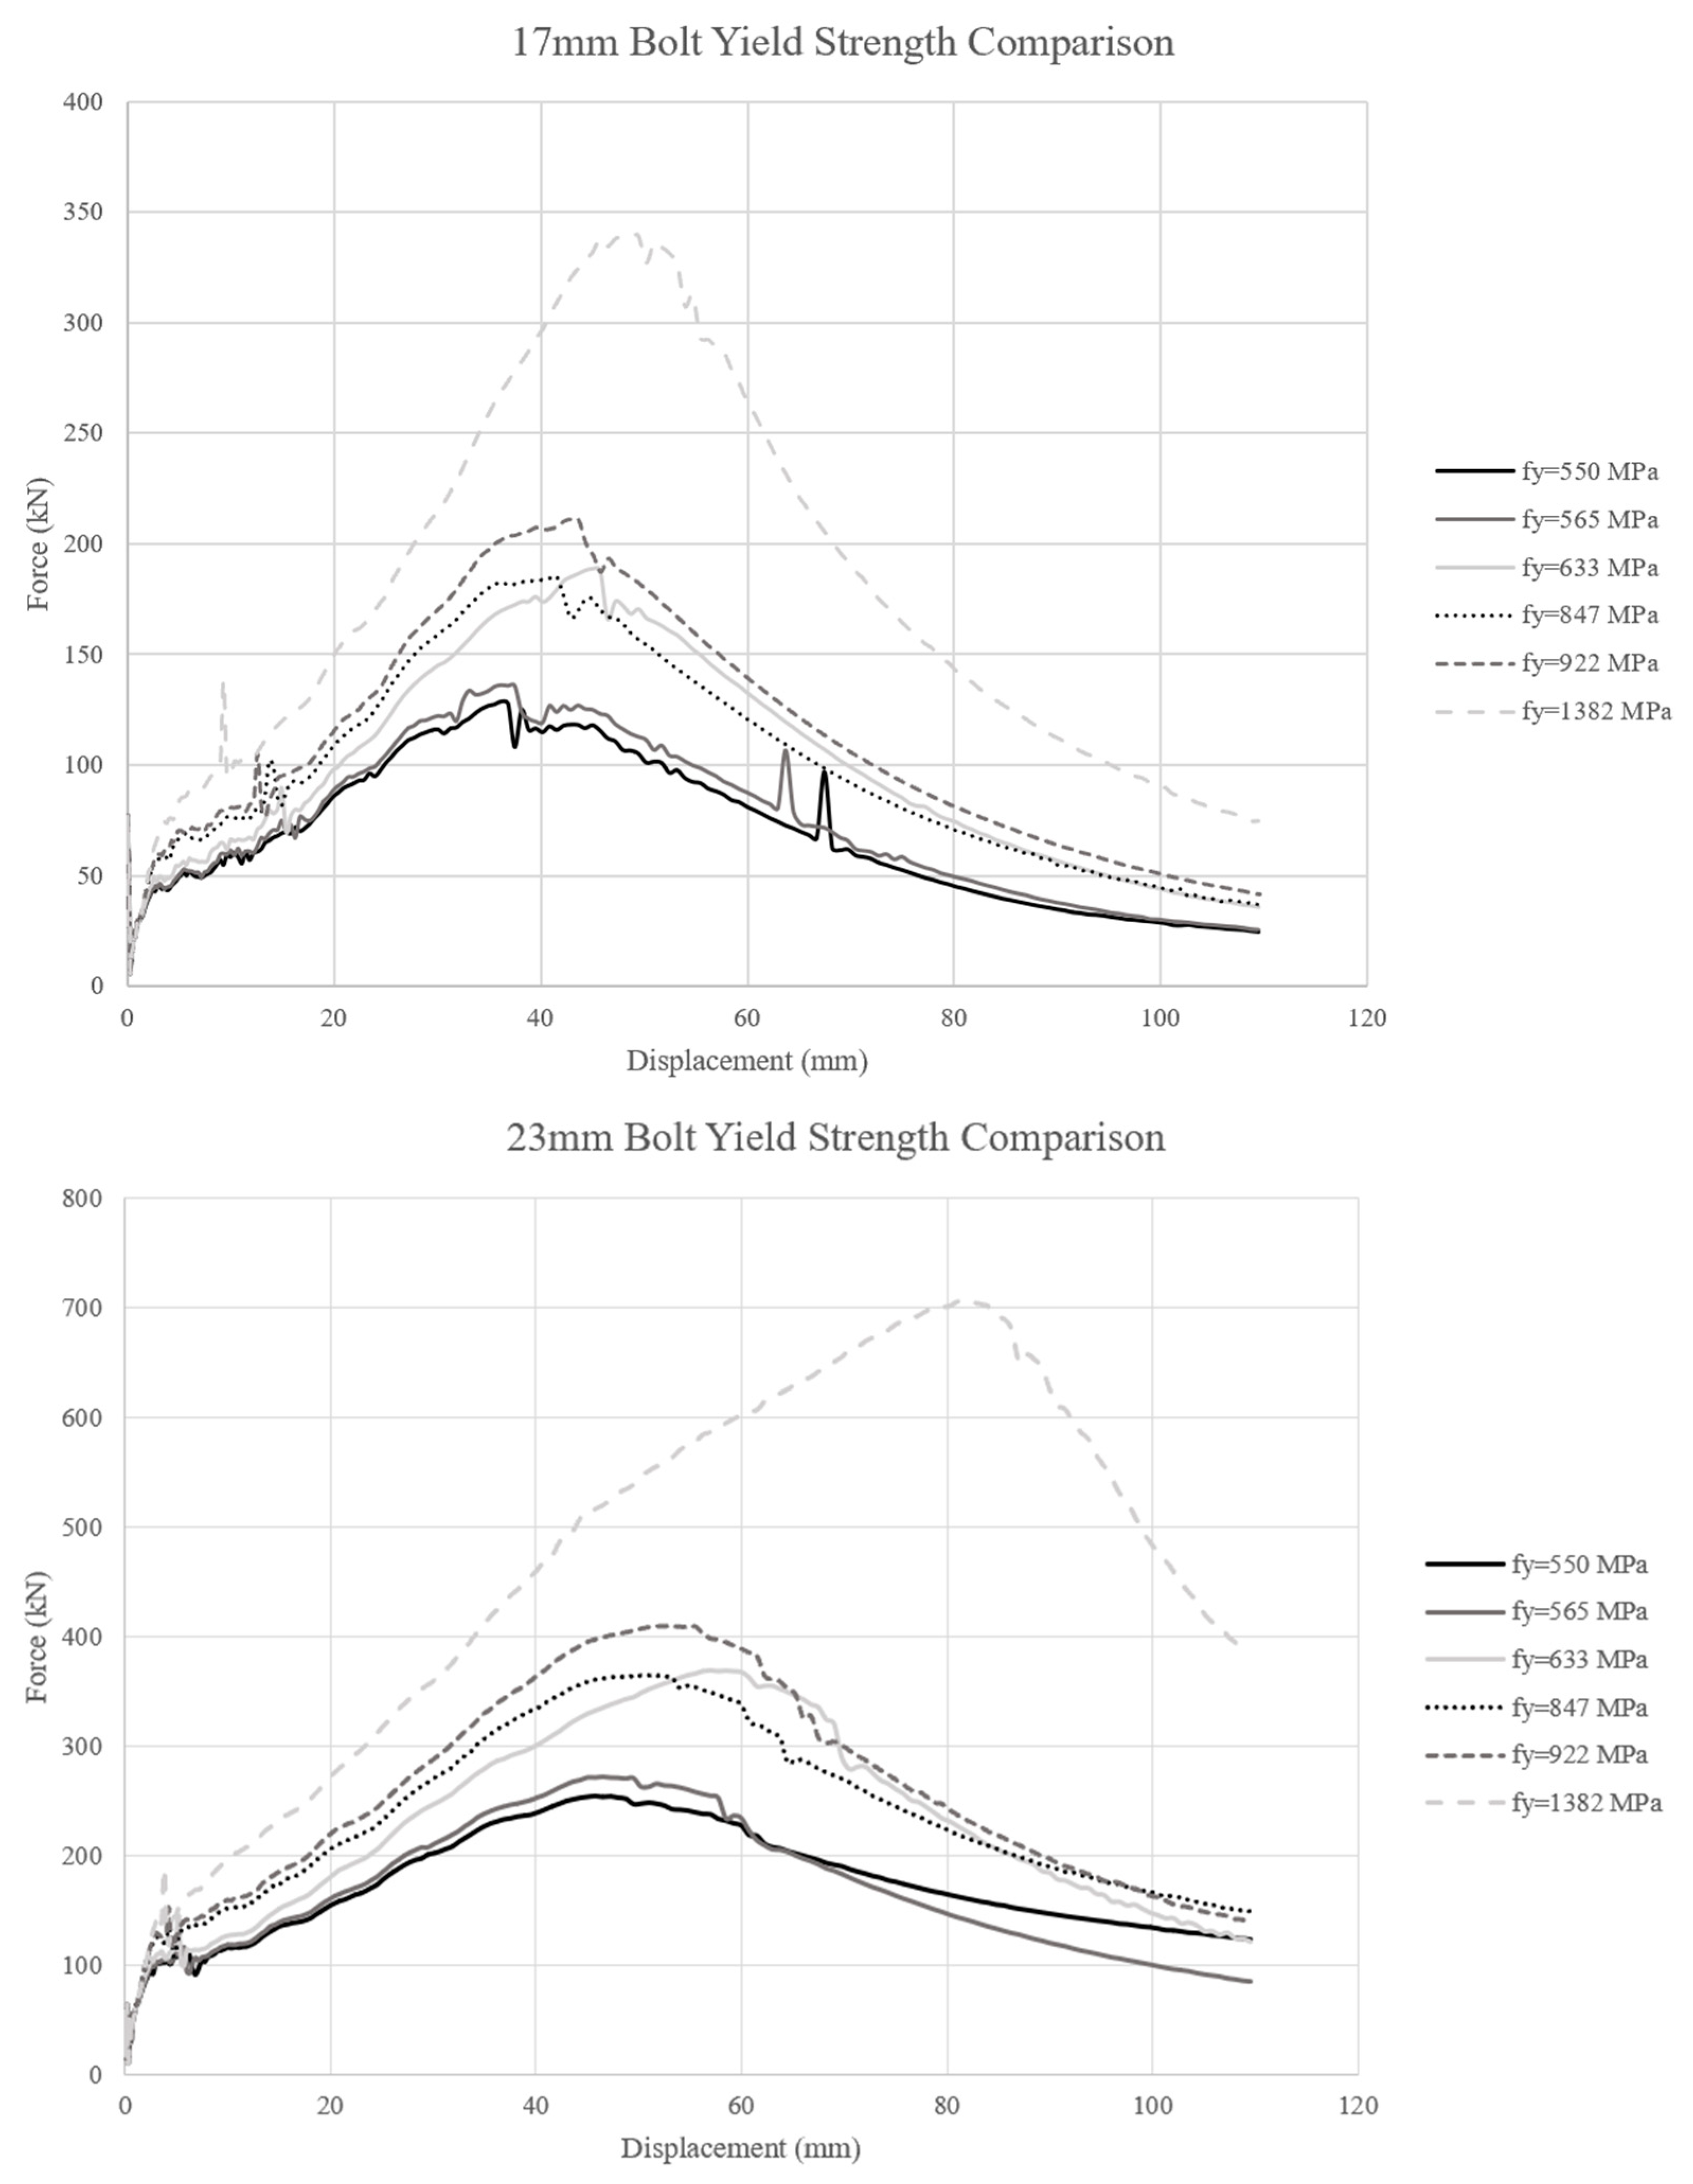
4.2. Yield and Ultimate Strength

A comparison of the effect of yield and ultimate stress was conducted. The below Figure 12 shows a comparison of the force displacement graph of an 18 mm diameter bolt and a 23 mm diameter bolt.

5. Discussion

The static model investigated the effects of varying the bolt diameter and bolt strengths. The results show a net positive correlation between bolt energy capacity absorbed. The deflection patterns when varying the bolt diameters and yield strengths agree with the results obtained by Tahmasebinia et al. (2021) [13] and Mirzaghorbanali et al. (2017) [2]. Due to the use of quasi-static testing and the application of mass scaling throughout the entire model, this renders the entire model time independent. Therefore, only time-independent analyses can be accurately extracted from the test. Energy absorption cannot be obtained from the analysis. An initial shear failure can be seen in the initial phase of the test, where a sudden spike in force is followed by a sudden reduction. Here, the cable bolt experiences a shear failure. The bolt continues to resist deformation due to the combined shear and bending actions resisting the load. This pattern can be seen when both varying the bolt diameter and the yield strength. This behaviour is most pronounced when the yield strength is 1382 MPa. There are three primary stages of bolt stresses: initial shear failure, combination of shear and bending failure and complete failure (see Figure 13).
It was expected that the peak force and displacement would be observed when the yield strength and bolt diameter were at a maximum. Interestingly, when yield strength was increased from 633 Mpa to 847 Mpa, little to no change was seen. This was likely due to an input error, and thus is considered an outlier. The displacement of the bolt at failure increases, but the overall max. energy capacity does not make a significant increase despite increasing the yield strength by 34%. Whilst the data obtained from the FEA illustrate a gradual failure of the cable bolt, this is due to inaccuracies with modelling. Therefore, the bolt will be considered completely failed once the bolt reaches a peak force. A summary of the maximum shear load corresponding to its respective shear strengths is tabulated below in Table 11. Similarly, Table 12 compares the maximum displacement at failure for the respective bolt diameters and yield strengths.
There is a positive correlation between the yield strength and bolt diameter and the maximum force and displacement. This result is expected, as by increasing the yield strength, the bolt increases the amount of force required to induce plastic deformation. Similarly, this principle also applies to deformation. It is expected that as the bolt diameter increases, the second of moment of area also increases. Furthermore, as deflection is inversely proportional to the second moment of area, the greater the diameter, the lesser the deflection. As area and steel strength are directly proportional to the shear capacity, by increasing the overall area and shear strength, the overall shear capacity increases. The results obtained from the analysis agree with current literature, whereby increasing the bolt size and yield strength results in a greater shear capacity at a larger displacement. The results obtained from the static test align with the current literature and experimental data modelling the double shear test [2,5].

6. Limitations of the Study

The model simulated the effects of a rock burst impacting a cable bolt. Whilst it yielded valid results, the model and testing methods could be improved. The primary limitation of the study is the simplification of the model itself. The configuration and embedment of the cable bolt are critical parts of the cable bolt design. As seen in Figure 2, there are various geometrical arrangements for the bolt. The purpose of this is to provide various gripping strengths and additional tensile capacities. By reducing the bolts to a simple cylindrical cable bolt and manually applying slip conditions, this does not provide an accurate depiction of the effect of the cable bolt design. To improve the model, careful construction of the cable bolt design should be conducted. Interwoven mesh bolts contain the intentional design to increase tensile and shearing capacities by increasing the number of contact surfaces. The purpose of the bulbed cable bolt is to allow energy to be suddenly dissipated if stresses reach a capacity. This effectively increases the overall energy dissipation of the bolt, which cannot be replicated using this simplification. Ultimately, these design factors are significant factors that contribute to the bolt capacity that are omitted from testing.
The calibration of the model was not ideal as it was not precisely calibrated against an identical test. The model it was calibrated against included the contact properties between the concrete blocks. This condition was omitted and instead included a 50 mm gap to effectively reduce the number of contact points. Without proper definition of contact properties over a large contact surface area, the model is likely to experience convergence issues, resulting in a greater computational time and potentially invalid results. Aziz et al. (2021) [53] partially attributes the dissipation of shear forces to overcome frictional forces. By using the Mohr–Coulomb and Fourier series relationship, he estimated that approximately 30% of the shear force was redirected to overcome the frictional forces of the contact surfaces.
Cable bolts need to be correctly anchored into the rock mass to allow for the induced axial tension load from rock deformation to bind the rock mass together [54]. This is achieved by three techniques, namely grouting using resin or cement, friction and a mechanical device. They all share the same purpose of increasing the contact surface area between the cable bolt and the rock surface to ultimately provide a binding action between the two materials. The anchoring process is unique to the bolt and manufacturer. This model does not account for any grouting, as it was assumed that this connection would be fully frictional. By assuming the bolt to be perfectly cylindrical and the box to have a perfectly rounded hole, the bolt will be in full contact with the box. This is unrealistic as it bypasses the need for the grout. To improve the testing conditions, simulating the grouting conditions and its interaction between the bolt and box would be necessary.
Ideally, a more refined mesh would yield more accurate results as the FEA gives a truer representation of the behaviour of each part. This can be seen when examining the cross-sectional area of the bolt and box. As the concrete box was meshed using a coarse and fine mesh, the localised region around the bolt at the box formed a rectangular mesh. A finer mesh could have been utilised around this region to enhance the accuracy of the overall analysis. Additionally, mesh grading could have been applied to allow for a smooth transition from regions of finer meshing to regions of course meshing.
A finer concrete mesh resulted in a smoother curve with fewer oscillations. Additionally, the inertial spike is also minimised when the mesh is refined. By introducing a finer mesh, the computational time significantly increases. Figure 14 below compares the mesh size of the original mesh against the finer concrete mesh. This posed a significant limitation, as a balanced mesh which was compatible with computational power and yielded reasonable results required balancing. As part of a preliminary investigation, meshing was set at 2 mm. This resulted in a computational time that exceeded half an hour and was therefore both ineffective and impractical. A test was conducted to examine the effects of refining the mesh. This resulted in a computational time that was 12 times more than the original mesh sizing. Whilst the results obtained from the fine mesh are more accurate, it would not be feasible to run over 600 tests at this capacity.
Calibration for the model was against the experimental data from the ACARP 2021 study. Calibration for valid data was limited to this paper. By increasing the number of comparative studies used for calibration, a more accurate calibrated model could be achieved. A variety of results will provide a greater verification of the data and hence the results obtained will be more consistent with all data.

7. Recommendations

As stated in the discussion, many limitations arise from issues with complex modelling in the FE study. These can be rectified in future modelling attempts. The following recommendations for improving the modelling are briefly outlined below:
  • Incorporate specific bolt patterns and configurations when modelling the bolt, as the design itself is a crucial aspect of understanding how various bolts are suited for different conditions.
  • Explore various surface contact conditions such as frictional slip coefficients and the physical structure between the embedded bolt and block to simulate in situ rock imperfections. Include grouting as a bolt to grout to rock surface binding medium.
  • Utilise regression analysis to develop a comprehensive understanding of the relationship between bolt diameter, yield strength, loading velocity and mass of load.
Whilst these recommendations pertain to improving the model to return results of a greater accuracy, the following recommendations focus on the overall improvement of mining and geotechnical engineering literature to ensure safety in design in future endeavours:
  • Utilise greater cross-calibration between physical testing methods such as drop testing and FEA tools. Utilise various FEA packages to conduct specialised testing methods to also ensure consistency and validity of results.
  • Conduct reliable experimental testing to validate FEA modelling. Develop repeatable and reliable experimental testing methods at scales.
  • Develop modelling techniques that can holistically incorporate the entire support network and be able to apply testing techniques at large scales.

8. Conclusions

The generation of an acceptable static model of the double shear test to simulate the effects of rock bursts using the FEM software ABAQUS has been successfully modelled. In line with the aims and methods outlined in the study, the model was developed and calibrated against existing experimental data. Results from the model agreed with existing literature and hence, a successful model was created.
The FEA investigated the influence of the following parameters, bolt diameter, steel yield and ultimate strength against the measured force and displacement. Through this, the energy absorption was calculated to understand bolt capacity. The comparison of bolt behaviour subject to static loading conditions showed an overall positive correlation between geometrical and mechanical properties of the bolt as well as external loading conditions to the bolt energy absorption capacity.
The measured mechanical responses of the bolt subject to various loading conditions bridge the knowledge gap of cable bolt behaviour in precarious mining conditions. Whilst the study provides valuable data results, improving upon the limitations of the study by introducing more complex modelling techniques and addressing key assumptions may allow the characterisation of cable bolt behaviour subject to dynamic loading to a higher degree of accuracy.

Author Contributions

Conceptualization, F.T., A.Y. and P.F.; Methodology, F.T., A.Y. and P.F.; Software, F.T., A.Y. and P.F.; Validation, F.T., A.Y. and P.F.; Formal analysis, F.T., A.Y. and P.F.; Investigation, F.T., A.Y., P.F. and K.S.; Resources, F.T. and K.S.; Data curation, F.T. and K.S.; Writing—original draft, F.T., A.Y. and P.F.; Writing—review & editing, F.T. and K.S.; Project administration, K.S. All authors have read and agreed to the published version of the manuscript.

Funding

This research received no external funding.

Data Availability Statement

Not applicable.

Conflicts of Interest

The authors declare no conflict of interest.

Appendix A

Python code to obtain fracture energy:
from google.colab import drive
drive.mount(‘/content/gdrive’)
import numpy as np
import pandas as pd
import matplotlib.pyplot as plt
import csv
dataset_path = “gdrive/My Drive/Colab Notebooks/thesis/stressstrain.csv”
import csv
with open(dataset_path, newline=‘‘) as csvfile:
data = list(csv.reader(csvfile, delimiter=‘\n’))
new_array = []
for thing in data:
for string in thing:
string = string.split(“,”)
for element in string:
element.strip(“,”)
string[:] = [x for x in string if x]
new_array.append(string)
new_array = [x for x in new_array if x]
newer_array = []
for line in new_array:
if len(line) == 144:
line = [val for val in line for _ in (0, 1)]
newer_array.append(line)
else:
try:
line = [float(x) for x in line]
newer_array.append(line)
except ValueError:
continue
coords_with_names = newer_array
list_t_names = np.array(coords_with_names).T.tolist()
coords = newer_array [1:]
list_t = np.array(coords).T.tolist()
from scipy import integrate
table = []
i = 0
while True:
if i > 286:
break
table_row = []
table_sums = []
x = list_t[i]
y = list_t[i+1]
y_int = integrate.cumtrapz(y, x, initial = 0)
y_int_sum = np.trapz(y, x)
name = list_t_names[i]
table_row.append(name [0])
for integral in y_int:
table_row.append(integral)
table.append(table_row)
table_sums.append(y_int_sum)
plt.plot(x, y_int, ‘r’, label=‘test 1’)
plt.legend(loc=‘best’)
plt.show
i += 2
np_table = np.array(table).T.tolist()
file = open(‘gdrive/My Drive/Colab Notebooks/thesis/fractureresults.csv’, ‘w’)
writer = csv.writer(file)
for row in np_table:
writer.writerow(row)
file.close()

References

  1. Fuller, P.G.; O’Grady, P. FLEXIBOLT Flexible Roof Bolts: A New Concept for Strata Control. In Proceedings of the 12th Conference on Ground Control in Mining, Morgantown, WV, USA, 3–5 August 1993; Available online: https://miningone.com.au/wp-content/uploads/2017/04/Flexibolt-Flexible-Roof-Bolts-A-New-Concept-for-Strata-Control-Peter-Fuller.pdf (accessed on 10 January 2023).
  2. Mirzaghorbanali, A.; Rasekh, H.; Aziz, N.; Yang, G.; Khaleghparast, S.; Nemcik, J. Shear strength properties of cable bolts using a new double shear instrument, experimental study, and numerical simulation. Tunn. Undergr. Space Technol. 2017, 70, 240–253. [Google Scholar] [CrossRef]
  3. Cai, M.; Champaigne, D.; Kaiser, P. Development of a Fully Debonded Cone Bolt for Rockburst Support; Australian Centre for Geomechanics (ACG), The University of Western Australia: Crawley WA, Australia, 2010. [Google Scholar]
  4. Kang, Y.; Liu, Q.; Gong, G.; Wang, H. Application of a combined support system to the weak floor reinforcement in deep underground coal mine. Int. J. Rock Mech. Min. Sci. 2014, 71, 143–150. [Google Scholar] [CrossRef]
  5. Tahmasebinia, F.; Zhang, C.; Canbulat, I.; Vardar, O.; Saydam, S. Numerical and analytical simulation of the structural behaviour of fully grouted cable bolts under impulsive loading. Int. J. Min. Sci. Technol. 2018, 28, 807–811. [Google Scholar] [CrossRef]
  6. Guo, X.H.; Wang, M.S. Analysis of efficacy of rock bolt for tunnel support structure. Rock Soil Mech. 2007, 28, 2234–2239. [Google Scholar]
  7. Kabwe, E.; Wang, Y. Review on Rockburst Theory and Types of Rock Support in Rockburst Prone Mines. Open J. Saf. Sci. Technol. 2015, 5, 18. [Google Scholar] [CrossRef] [Green Version]
  8. Wang, J.; Apel, D.B.; Pu, Y.; Hall, R.; Wei, C.; Sepehri, M. Numerical modeling for rockbursts: A state-of-the-art review. J. Rock Mech. Geotech. Eng. 2021, 13, 457–478. [Google Scholar] [CrossRef]
  9. Kaiser, P.K.; Cai, M. Design of rock support system under rockburst condition. J. Rock Mech. Geotech. Eng. 2012, 4, 215–227. [Google Scholar] [CrossRef] [Green Version]
  10. Mark, C.; Gauna, M. Evaluating the risk of coal bursts in underground coal mines. Int. J. Min. Sci. Technol. 2015, 26, 47–52. [Google Scholar] [CrossRef]
  11. Stacey, T.R. Review of membrane support mechanisms, loading mechanisms, desired membrance performance, and appropriate test methods. J. South. Afr. Inst. Min. Metall. 2001, 101, 343–351. [Google Scholar] [CrossRef]
  12. Windsor, C.R. Rock reinforcement systems. Int. J. Rock Mech. Min. Sci. 1997, 34, 919–951. [Google Scholar] [CrossRef]
  13. Tahmasebinia, F.; Zhang, C.; Wei, C.; Canbulat, I.; Saydam, S.; Sepasgozar, S. A new concept to design combined support under dynamic loading using numerical modelling. Tunn. Undergr. Space Technol. 2021, 117, 104132. [Google Scholar] [CrossRef]
  14. Güler, G.; Kuijpers, J.S.; Wojno, L.; Milev, A.; Haile, A. Determine the Effect of Repeated Dynamic Loading on the Performance of Tunnel Support systems. Safety in Mines Research Advisory Committee, GAP 616, March 2001; pp 1–107. Available online: http://researchspace.csir.co.za/dspace/handle/10204/1794 (accessed on 10 January 2023).
  15. Cai, M.; Champaigne, D. The Art of Rock Support in Burstprone Ground. Keynote Lecture; Rinton Press: Princeton, NJ, USA, 2009; Volume 7. [Google Scholar]
  16. Cai, M. Principles of rock support in burst-prone ground. Tunn. Undergr. Space Technol. 2013, 36, 46–56. [Google Scholar] [CrossRef]
  17. Ortlepp, W.D.; Stacey, T.R. Rockburst mechanisms in tunnels and shafts. Tunn. Undergr. Space Technol. 1994, 9, 59–65. [Google Scholar] [CrossRef]
  18. Brown, E. Underground Excavations in Rock; CRC Press: Boca Raton, FL, UA, 1980. [Google Scholar]
  19. Li, C.C.; Mikula, P.; Simser, B.; Hebblewhite, B.; Joughin, W.; Feng, X.; Xu, N. Discussions on rockburst and dynamic ground support in deep mines. J. Rock Mech. Geotech. Eng. 2019, 11, 1110–1118. [Google Scholar] [CrossRef]
  20. Ortlepp, W. The design of support for the containment of rockburst damage in tunnels: An engineering approach. In Rock Support in Mining and Underground Construction; Kaiser, P.K., McCreath, D.R., Eds.; Balkema: Rotterdam, The Netherlands, 1992; pp. 593–609. [Google Scholar]
  21. Turner, M.H.; Player, J.R. Seismicity at Big Bell Mine. Proc. Massmin 2000, 889, 791–797. [Google Scholar]
  22. Simser, B.; Joughin, W.; Ortlepp, W.D. The performance of Brunswick Mine’s rockburst support system during a severe seismic episode. J. South Afr. Inst. Min. Metall. 2002, 102, 217–223. [Google Scholar]
  23. Li, C.C.; Stjern, G.; Myrvang, A. A review on the performance of conventional and energy-absorbing rockbolts. J. Rock Mech. Geotech. Eng. 2014, 6, 315–327. [Google Scholar] [CrossRef] [Green Version]
  24. Chunlin Li, C. A new energy-absorbing bolt for rock support in high stress rock masses. Int. J. Rock Mech. Min. Sci. 2010, 47, 396–404. [Google Scholar] [CrossRef]
  25. Jager, A. Two new support units for the control of rockburst damage. In Proceedings of the International Symposium on Rock Support, Sudbury, ON, Canada, 16 June 1992; pp. 621–631. [Google Scholar]
  26. Simser, B. Geotechnical Review of the 29th July 2001 West Ore Zone Mass Blast and the Performance of the Brunswick/NTC Rockburst Support System. Technical report. 2001; 46p. [Google Scholar]
  27. Hutchinson, D.; Diederichs, M. Cable Bolting in Underground Mines. 406 pp. Richmond; BiTech Publishers: Richmond, BC, Canada, 1996. [Google Scholar]
  28. Simser, B. The weakest link-Ground support observations at some Canadian Shield hard rock mines. In Deep Mining 2007: Proceedings of the Fourth International Seminar on Deep and High Stress Mining; Potvin, Y., Ed.; Australian Centre for Geomechanics: Perth, Australia, 2007; pp. 335–348. [Google Scholar]
  29. Potvin, Y. Surface support in extreme ground conditions—HEA Mesh™. In Paper Presented at the SRDM 2009: Proceedings of the First International Seminar on Safe and Rapid Development Mining; Australian Centre for Geomechanics: Perth, Australia, 2009; pp. 111–119. [Google Scholar]
  30. Roberts, T.; Talu, S.; Wangoooo, Y. Design and Testing of High Capacity Surface Support. 2018. Available online: https://www.ausimm.com/publications/conference-proceedings/the-fourth-australasian-ground-control-in-mining-conference-ausrock/design-and-testing-of-high-capacity-surface-support/ (accessed on 10 January 2023).
  31. Zhou, J.; Li, X.; Mitri, H.S. Evaluation method of rockburst: State-of-the-art literature review. Tunn. Undergr. Space Technol. 2018, 81, 632–659. [Google Scholar] [CrossRef]
  32. Wu, Y.; Gao, F.; Chen, J.; He, J. Experimental Study on the Performance of Rock Bolts in Coal Burst-Prone Mines. Rock Mech. Rock Eng. 2019, 52, 3959–3970. [Google Scholar] [CrossRef]
  33. Hagan, D.M.; Milev, T.O.; Spottiswoode, A.M.; Hidyard, S.M.; Grodner, M.W.; Rorke, M.; Finnie, A.J.; Reddy, G.J.; Haile, N.; Le Bron, A.T. Simulated rockburst experiment—An overview. J. South. Afr. Inst. Min. Metall. 2001, 101, 217–222. [Google Scholar] [CrossRef]
  34. Heal, D.; Hudyma, M.; Potvin, Y. Assessing the in-situ performance of ground support systems subjected to dynamic loading. In Ground Support in Mining and Underground Construction; CRC Press: Boca Raton, FL, USA, 2004. [Google Scholar]
  35. Hadjigeorgiou, J.; Potvin, Y. A Critical Assessment of Dynamic Rock Reinforcement and Support Testing Facilities. Rock Mech. Rock Eng. 2011, 44, 565–578. [Google Scholar] [CrossRef]
  36. Human, J. Testing of the Saturn Prop and Buffalo Headboard at the Savuka Stope Support Test Facility. SRK Rep. 2004, 344720, 11. [Google Scholar]
  37. Player, J.; Villaescusa, E.; Thompson, A. Dynamic testing of friction rock stabilisers. In Proceedings of the 3rd Canada-US Rock Mechanics Symposium and 20th Canadian Rock Mechanics Symposium, Toronto, ON, Canada, May 2009; Available online: https://geogroup.utoronto.ca/wp-content/uploads/RockEng09/PDF/Session11/4027%20PAPER.pdf (accessed on 10 January 2023).
  38. Li, L.; Hagan, P.C.; Saydam, S.; Hebblewhite, B.; Li, Y. Parametric Study of Rockbolt Shear Behaviour by Double Shear Test. Rock Mech. Rock Eng. 2016, 49, 4787–4797. [Google Scholar] [CrossRef]
  39. Miranda, E.E. Deformation and fracture of concrete under uniaxial impact loading. Ph.D Thesis, University of Missouri, Rolla, MO, USA, 1972. [Google Scholar]
  40. Blake, W. Rock-burst mechanics. Q. Colo. Sch. Mines 1972, 1–67. Available online: https://www.osti.gov/biblio/5298057 (accessed on 10 January 2023).
  41. Brady, B.H.G. Boundary Element Methods for Mine Design. Ph.D. Thesis, University of London, London, UK, 1979. [Google Scholar]
  42. Jing, L.; Hudson, J.A. Numerical methods in rock mechanics. Int. J. Rock Mech. Min. Sci. 2002, 39, 409–427. [Google Scholar] [CrossRef]
  43. OneSteel. Hot Rolled and Structural Steel Products; HRSSP: Sydney, Australia, 2014. [Google Scholar]
  44. Zafar, A.; Andrawes, B. Incremental dynamic analysis of concrete moment resisting frames reinforced with shape memory composite bars. Smart Mater. Struct. 2012, 21, 025013. [Google Scholar] [CrossRef]
  45. Arasaratnam, P.; Sivakumaran, K.S.; Tait, M.J. True Stress-True Strain Models for Structural Steel Elements. ISRN Civ. Eng. 2011, 2011, 1–11. [Google Scholar] [CrossRef] [Green Version]
  46. Zhang, Z.L.; Hauge, M.; Ødegård, J.; Thaulow, C. Determining material true stress–strain curve from tensile specimens with rectangular cross-section. Int. J. Solids Struct. 1999, 36, 3497–3516. [Google Scholar] [CrossRef]
  47. Ardalany, M.; Deam, B.; Fragiacomo, M. Experimental results of fracture energy and fracture toughness of Radiata Pine laminated veneer lumber (LVL) in mode I (opening). Mater. Struct. 2012, 45, 1189–1205. [Google Scholar] [CrossRef]
  48. Hajikarimi, P.; Moghadas Nejad, F. Chapter 7—Application of viscoelasticity for experimental tests. In Applications of Viscoelasticity; Hajikarimi, P., Moghadas Nejad, F., Eds.; Elsevier: Amsterdam, The Netherlands, 2021; pp. 141–180. [Google Scholar] [CrossRef]
  49. AS3600:2018; Concrete Structures. Standards Australia Office: Sydney, Australia, 2018.
  50. Sumer, Y.; Aktas, M. Defining parameters for cocnrete damage plasticity model. Chall. J. Struct. Mech. 2015, 1, 149–155. [Google Scholar] [CrossRef]
  51. Xiao, Y.; Chen, Z.; Zhou, J.; Leng, Y.; Xia, R. Concrete plastic-damage factor for finite element analysis: Concept, simulation and experiment. Adv. Mech. Eng. 2017, 9, 1–10. [Google Scholar] [CrossRef]
  52. ABAQUSinc. ABAQUS Analysis User’s Manuals. 2009. (Version 6.14). from Dassault Systemes Simulia. Available online: http://130.149.89.49:2080/v6.14/books/usb/default.htm (accessed on 10 January 2023).
  53. Aziz, N.; Anzanpour, S.; Khaleghparast, S.; Mirzaghorbanali, A.; Rastegarmanesh, A.; Si, G.; Oh, J.; Hagan, P.; Li, X. Development of a Numerical Modelling Approach to Better Understand the Effect of Cable Bolt Performance on Roof Failure Mechanisms in Varying Rock Mass Conditions; ACARP Australia: Brisbane City, Australia, 2021. [Google Scholar]
  54. He, L.; An, X.M.; Zhao, Z.Y. Fully Grouted Rock Bolts: An Analytical Investigation. Rock Mech. Rock Eng. 2015, 48, 1181–1196. [Google Scholar] [CrossRef]
Figure 1. The 28 mm bolt.
Applsci 13 01326 g001
Figure 2. A 500 mm × 500 mm × 500 mm concrete box.
Applsci 13 01326 g002
Figure 3. Engineering vs. true stress–strain curve.
Applsci 13 01326 g003
Figure 4. Without partitions (left); with partitions (right).
Applsci 13 01326 g004
Figure 5. Overall mesh of the bolt (left); cross-section of the bolt (right).
Applsci 13 01326 g005
Figure 6. C3D8R linear brick element (a) and effects of hourglass control (b).
Applsci 13 01326 g006
Figure 7. Static force vs. displacement graph of various fine meshes.
Applsci 13 01326 g007
Figure 8. Rigid bodies of the static test.
Applsci 13 01326 g008
Figure 9. Base (top) and fixed end (bottom) boundary conditions.
Applsci 13 01326 g009
Figure 10. Static calibration model deflection behaviour.
Applsci 13 01326 g010
Figure 11. Comparison of fy = 550 MPa (top) and fy = 922 MPa (bottom).
Applsci 13 01326 g011
Figure 12. Comparison of 18 mm bolt (top) 23 mm bolt (bottom).
Applsci 13 01326 g012
Figure 13. Three stages of bolt failure under static loading conditions.
Applsci 13 01326 g013
Figure 14. Comparison of a fine concrete mesh (left) and coarse concrete mesh (right).
Applsci 13 01326 g014
Table 1. Advantages and disadvantages of numerical methods in modelling rock burst mechanism.
Numerical MethodAdvantagesDisadvantages
Continuum Method (BEM)Capability of 3D modelling
Allow the rapid assessment of stress concentration, deformation and designs
Normally elastic analysis only
Calculation time increases exponentially with number of elements
Continuum Method (FEM, FDM)Capability of 3D modelling
Easily handle material heterogeneity and geometric nonlinearity
Simulate complex behaviour of rock/rock masses with various constitutive models
Allows dynamic loading
Input limitations, e.g., some critical input parameters are difficult to determine
Interfaces can model simple structures, but are not suitable for highly jointed block media
Rich experience in using numerical analysis is essential
Calculation time increases exponentially with number of elements
Discontinuum Method (DEM)Capability of 3D modelling
Easy to model jointed rock systems
Able to model complex behaviour of rock/rock masses with various constitutive models
Allows the large deformation and detachment of blocks
Allows dynamic loading
Limited data on joint properties are available and the calibration of parameters might be needed
Rich experience in using numerical analysis is essential
2D modelling is usually used due to the great calculation cost of 3D models
Hybrid Method (FEM/DEM)Able to model the extension of existing fractures and creation of new fractures in intact rocks
3D modelling is possible
Allows dynamic loading
Few data are available for contact properties and fracture mechanics properties
The calibration of parameters is needed
Extremely long run times will require the use of parallel processing for large models
2D modelling is usually used
Table 2. Jennmar bolt properties.
Jennmar Bolt Type Bolt Diameter (mm)Typical Yield Strength (kN)Typical Ultimate Tensile Strength (kN)
17.8 Yield Lok Bolt 18147196
J-Tech® 20mm Bolt20170200
Yield Lok® Bolt 23mm23245328
J-Tech® 25mm24245294
63T Sumo Cable Bolt28560630
70T 12 Wire Sumo Cable Bolt31640705
Table 3. ID SUMO bolt material properties.
Strand Diameter (mm)Typical Strand Yield Strength (kN)Typical Breaking Load (kN)Elongation at Strand Failure
ID Sumo285606305–7%
Table 4. Steel bolt material properties.
Density
(kg/m3)
ElasticShear Damage
Elastic Modulus (MPa)Poisson’s RatioFracture StrainShear Stress RatioStrain Rate
Value7800200,0000.30.130.70.0001
Table 5. Concrete material properties.
Density (kg/m3)Elastic
Elastic Modulus (MPa)Poisson’s Ratio
Value240033,3460.2
Table 6. Computational times.
Fine Mesh Seed Size (%)Computational Time (s)
101746
151025
20618
25431
Table 7. Summary of seed sizes.
PartCoarse Mesh Seed Size (mm)Fine Mesh Seed Size (mm)
Bolt11.25.6
Box305.6
Table 8. Interaction properties.
MasterSlaveConstraintSliding Formulation
ConcreteSteelPenalty ContactFinite Sliding
Tangential BehaviourNormal Behaviour
Friction CoefficientPressure Overclose
0.5Hard Contact
Table 9. Quasi-static mass scaling settings.
RegionTypeFrequency/IntervalFactorTarget Time Increment
Whole ModelTarget Time Inc.Beginning of StepNone1 × 10−5
Table 10. Testing parameters.
Bolt Diameter (mm)Steel Yield/Ultimate fy/fu (MPA)
18550/650
20565/685
23633/844
25847/934
28922/1031
311382/1553
Table 11. Maximum static shear load of bolts.
Maximum Shear Load (kN)
Bolt Diameter (mm)fy = 500 Mpafy = 565 Mpafy = 633 Mpafy = 847 Mpafy = 922 Mpafy = 1382 Mpa
18129.0136.4189.0185.0211.3339.3
20186.4197.5269.4270.5302.0492.5
23254.8272.3369.2364.5409.8705.7
25305.1325.8443.1441.3497.8848.0
28394.8423.0582.6575.4647.01084.5
31498.1535.5721.3716.6818.41301.5
Table 12. Maximum static displacement of bolts.
Maximum Displacement at Failure (mm)
Bolt Diameter (mm)fy = 500 Mpafy = 565 Mpafy = 633 Mpafy = 847 Mpafy = 922 Mpafy = 1382 Mpa
1836.236.945.141.643.049.5
2043.644.351.045.145.860.7
2345.846.557.051.052.581.0
2551.053.363.855.560.091.5
2857.861.576.568.272.0109.5
3165.270.587.076.585.5120.5
Disclaimer/Publisher’s Note: The statements, opinions and data contained in all publications are solely those of the individual author(s) and contributor(s) and not of MDPI and/or the editor(s). MDPI and/or the editor(s) disclaim responsibility for any injury to people or property resulting from any ideas, methods, instructions or products referred to in the content.

