Abstract
The aim of this presented study was the sensory evaluation, the analysis of the nutritional composition, and the analysis of the content of health-promoting ingredients, i.e., the total phenolic compounds and the total flavonoids, in raw chocolate (made exclusively from unroasted cocoa beans, cane sugar, and cocoa butter) in comparison to classic commercial chocolates available in the consumer market. The research showed that raw chocolate, compared to commercial chocolates, contained less carbohydrates (39.6% in raw chocolate and 42.7% and 53.7% in commercial chocolate, respectively), was characterized by a higher content of total phenolic compounds (22.08 mg GAE/g in raw chocolate and 9.25 and 7.87 mg GAE/g in commercial chocolates, respectively), had a a higher content of total flavonoids (8.75 mg ECE/g in raw chocolate and 4.43 mg/g and 3.83 mg ECE/g in commercial chocolates, respectively), and also had a higher total antioxidant activity (172.16 μM TE/g in raw chocolate and 132.60 and 63.76 μM TE/g in commercial chocolates, respectively). In the sensory assessment, raw chocolate received lower ranks than commercial chocolates, especially in the case of the most important discriminant in the entire evaluation, i.e., taste, which was unquestionably related to the lower content of carbohydrates. However, currently, it is necessary to reduce the consumption of sugar, which, when excessively present in the diet, is the cause of many diseases. However, in the sensory evaluation for the criteria “external appearance—shape” and “external appearance—surface condition,” the raw chocolate received the highest marks.
1. Introduction
Confectionery is a category of snacks that is among the most popular, both among adults and children. In 2014, 91% of Poles declared that they purchased confectionery, and for the majority of them, confections were an indispensable element of the diet. Among all the respondents, 40% declared consuming something sweet at least five times a week [1]. Chocolate is a product that is commonly consumed by all generations and age groups [2]. Data from the year 2020 confirms consumer interest in confectionery, with 21% of the respondents indicating that they choose products of the highest quality [3]. 33% of the consumers of confectionery choose chocolate products, with the dominant preferences being focused on milk chocolate (52%), followed by dark chocolate (33%), and white chocolate (13%). The volume of the Polish confectionery market is estimated at close to 3000 million EUR [3].
The consumption of confectionery in large amounts can be harmful, due to the presence of simple sugars, purified wheat flour, fat, unsaturated fatty acids, and trans isomers of fatty acids in their composition, which, in consequence, may lead to disturbances in the functioning of the organism and the development of diet-related diseases, such as diabetes, obesity, or disorders of the circulatory system [4].
Chocolate is rich in fats, proteins, carbohydrates, polyphenols, and other bioactive compounds [2]. Chocolate products with a high calorific value are increasingly being replaced by chocolate with a lower calorific value that retains taste quality and visual appeal. The trend in modern chocolate products is to eliminate unnecessary components with a negative effect on one’s health, such as sugar, preservatives, synthetic flavours, and emulsifiers. This is inseparably related to the current demand for products of the types described as “fit” and “eco” and for products with the least possible degree of processing. This situation is due to the growing awareness of consumers as to the current fashion and trends driven by celebrities from the worlds of sports and social media [5].
Chocolate is a unique food product, as it is characterised by a solid consistency at room temperature, but it melts easily in the mouth [6]. These properties of chocolate are a result of the properties of cocoa butter, which is a solid at temperatures below 25 °C and holds the particles of sugar and cocoa mass together. At the temperature of the human body, cocoa butter, however, is almost completely liquid, thus allowing the movement of particles due to which chocolate becomes a smooth liquid. Chocolate also has a specific sweetness that is attractive to a majority of people, so it appears strange that the history of chocolate started from a liquid, greasy, and bitter liquor with no resemblance to the product as we know it as today [7]. Its flavour is undoubtedly the most important attribute of chocolate in terms of consumer perceptions. In this respect, the quality of the initial raw material used in chocolate production is of immense importance. The successive stages of chocolate production also have a significant effect on the quality of the end product [8]. The production process of classic chocolate comprises fermentation, drying, roasting, grinding of the cocoa seed, the mixing of all ingredients (cocoa mass, sugar, cocoa butter, emulsifiers, flavours and, if required, milk components), conching, and tempering. The main chemical reactions take place during the fermentation, drying, cocoa seed roasting, and conching of the chocolate mass. These reactions are of the greatest importance for the final taste and flavour [2]. However, those stages also cause certain chemical modifications, which result in changes in the composition and biological properties of the cocoa seeds [9].
Cocoa tree seeds (beans) and chocolate itself contain over 200 substances that can improve health and well-being. Not all of those substances, however, are contained in amounts sufficient to produce a health-promoting effect, e.g., acylethanolamines, phenylethylamine, and serotonin [10]. Other substances, in turn, may have low bioavailability in the human organism or may undergo rapid degradation [11].
Cocoa and chocolate operate like functional foods, as they contain a number of substances that have a beneficial effect on human health. Chocolate combines certain sensory features with aphrodisiac and antidepressant properties, which expands its effects beyond the cardiovascular system, metabolic diseases, neurological disorders, and psychological profiles [12]. Over the last 15 years, there has been an increase in interest in the potential health benefits of antioxidants and other compounds included in the phytochemical composition of dark chocolate and cocoa [13]. Over 200 studies concerning the bioactive components, chemical composition, and health benefits of cocoa trees and cocoa products have been reported [2].
Cocoa tree seeds (beans) have an extremely rich history of medicinal and ritual applications. It started with cocoa seeds being used initially by the Olmecs and then by the Mayas and the Aztecs [14]. Chocolate’s history began with the Mayas, who were most likely the first people in South America to cultivate the cocoa tree. For the Mayas, chocolate was a cocoa drink prepared with hot water and often aromatised with cinnamon and pepper. It was called the food of the Gods, and it was served on the table of Emperor Montezuma II by the Aztecs [6,12]. The term “chocolate” was coined by the early Olmecs, was adopted by the Mayas, and was later adopted by the Mexica (Aztecs) [15]. The word “chocolate” probably originates from the word “Xococalit” from the Aztec “xocolatl” denoting bitter water, and was a drink prepared by the Pre-Olmecs from cocoa seeds as far back as about 2000 BC [16].
According to EU Directive 2000/36/EC of the European Parliament, “chocolate designates the product obtained from cocoa products and sugars that, subject to (b), contains not less than 35% total dry cocoa solids, including not less than 18% cocoa butter and not less than 14% of dry non-fat cocoa solids” (excluding certain kinds of chocolate such as “vermicelli”, “gianduja”, or “couverture”) [17].
The concept of raw chocolate is still not defined, but it assumes that raw chocolate retains the traits, parameters, and standards of chocolate, but at every stage of the production of such chocolate, the temperature cannot exceed 42 °C [18], the cocoa beans cannot be subjected to roasting, and the chocolate should be composed solely of three components: cocoa mass, cocoa butter, and sugar (of all kinds of chocolate, raw chocolate is the best for human health; therefore, in its production, alternative sugars are most frequently used, such as, e.g., coconut palm sugar, sugar from coconut palm flowers, xylitol, or stevia). There are concerns that not blasting them with heat of up to about 150 °C could mean an increase in bacteria such as salmonella. However, producers insist that, as no animal products are involved, there is no greater risk than when dealing with vegetables, such as carrots or lettuce [19].
In view of the present interest of consumers in products with the lowest degree of processing and that are characterised by a chemical composition rich in health-promoting components, we undertook a study aimed at the estimation of the quality of raw chocolate obtained with a simple craftsman method. The following research hypothesis was put forward: raw chocolate may constitute a more favourable alternative (in terms of chemical composition) to the highly processed commercial products. In order to prove the hypothesis, an analysis was conducted of the nutritional composition of the chocolate and the estimation of its content of health-promoting components, e.g., total phenolic content and total flavonoid content, as compared to classic commercial chocolates available in the consumer market. In addition, a sensory analysis was performed to determine the preferences of the members of the sensory assessment panel in comparison to the commercial products.
2. Materials and Methods
2.1. Experimental Material
The following ingredients were used for the production of the raw chocolate (MAN), and they all originated from organic production:
- raw beans of the cocoa tree cv. Nacional Arriba from the Zoilita plantation in the Los Ríos region of Ecuador (“Eko gram”, Poland);
- unrefined cane sugar (“Sweet garden”, India);
- cocoa butter (“Eko gram”, Poland).
The reference material for the comparisons in the experiment consisted of two samples of commercial chocolate (64% and 50% cocoa mass) available on the market:
- classic bitter chocolate 64% (COM 64%) ingredients: cocoa mass, sugar, cocoa with reduced fat content, cocoa butter, emulsifiers (soy lecithin, polyglycerol polyricinoleate), flavour, coca mass minimum of 64%;
- light bitter chocolate 50% (COM 50%) ingredients: sugar, cocoa mass, cocoa with reduced fat content, cocoa butter, milk fat, emulsifiers (soy lecithin, polyglycerol polyricinoleate), salt, flavour, cocoa mass minimum of 50%.
The choice of reference chocolates with a cocoa mass content of 50% and 64% resulted from the popularity of these chocolates among consumers and corresponded, in terms of the cocoa mass content, to raw chocolate.
2.2. Recipe of the Raw Chocolate
Ingredients: raw cocoa tree beans, hulled—570 g; unrefined cane sugar—300 g; cocoa butter—50 g.
The percentage value of the chocolate is the total content of cocoa mass, including cocoa butter, in the chocolate; in the chocolate produced in this experiment, it was ≈ 65.26%.
A schematic diagram of the process of production is presented in Figure 1.
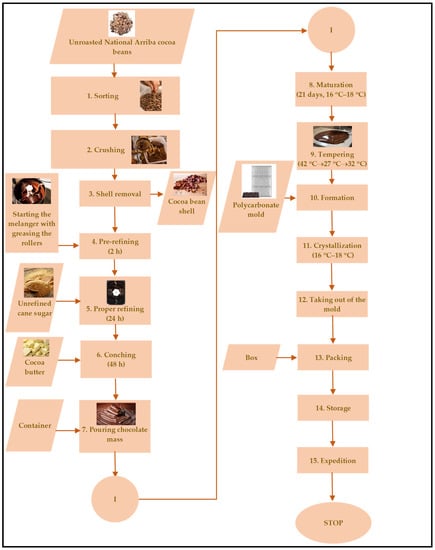
Figure 1.
Block diagram of the process of raw chocolate production.
Cocoa beans were sorted, and those that did not meet the quality requirements were rejected. The accepted beans were ground to the point where the hulls cracked; excessive fragmentation may have resulted in excessive losses at the next stage of processing. The lighter hulls were separated using compressed air. After the melanger was started, when the rollers reached their maximum speed, 15 g of cocoa butter were added to reduce friction and wear on the machine, and then 570 g of cleaned cocoa beans (nibs) were added in batches. The fragmented beans, under the effect of grinding by the rollers, were gradually reduced in size. After 2 h of grinding, unrefined cane sugar was added in portions (300 g). After 24 h from the time of starting the operation of the melanger, the remaining portion of 35 g of cocoa butter was added. The entire mass was left for 48 h for conching. After 72 h of continuous operation of the machine, the smooth and aromatic mass was poured into a container and closed tightly. The chocolate was then left for 21 days in a dry room with a temperature of 16–18 °C in order to mature. The process of chocolate maturation was the final stage of chocolate production, in which taste and flavour were formed and attain full depth. Next, the chocolate was tempered on a marble tabletop. After the process of tempering, the liquid mass was poured into special polycarbonate forms, in which air bubbles were removed from the chocolate mass through the shaking of the forms, and then the whole quantity was left at a temperature of 16–18 °C for full crystallisation.
2.3. Determination of Nutritional Composition
Moisture in tested samples was determined according to the method AOAC 931.04 [20]. Ash contents were determined after dry digestion at 550 °C [21]. The content of lipids was determined according to the AOAC 963.15 official method [22], as modified by Roda and Lambri [23]. The samples were then subjected to acid hydrolysis and extraction by means of a Soxhlet apparatus. Portions of 3–4 g of chocolate/cocoa beans were weighed out. Those amounts were mixed with 45 mL of distilled water at boiling temperature, and then 55 mL of HCl (25% w/v) were added. The solutions were boiled for about 30 min in a reflux condenser, and then filtered using a Whatman n° 595 ½ filter. The filter containing the hydrolysed samples was rinsed thoroughly with distilled water until all chlorides were washed out, and then dried at 100 °C for 6 h. Ultimately, the fat material with the filter was extracted by means of a Soxhlet apparatus with the use of 50 mL of n-hexane for 4 h.
Protein determination was carried out following the AOAC 939.02-1939 method [24]. Dietary fibres were analyzed using the AOAC 985.29 methodology [25]. Total non-fibre carbohydrate contents were determined by percent differences (100%—% moisture, % protein, % fat, % ash, and % fibre content) [26].
The energetic value was calculated by applying the mean recalculation coefficients for protein, fat, and carbohydrates according to Kunachowicz et al. [27]. These factors were as follows: 1 g of protein—17 kJ, 1 g of fat—37 kJ, and 1 g of carbohydrates—17 kJ.
2.4. Extraction of Bioactive Components
The extraction of bioactive components from samples of the chocolate was conducted according to the procedure described by Barišić et al. [28]. The obtained extracts were stored in a freezer, and prior to analysis, they were filtered through a nylon membrane filter.
2.5. Total Phenolic Content
Determinations of the phenolic compounds in the tested samples were made by spectrophotometric means (λ = 725 nm) according to a modified Singleton and Rossi method [28,29]. A portion (0.1 mL) of chocolate or cocoa bean extract was mixed with 6 mL of water and 0.5 mL of the Folin–Ciocalteu reagent in a calibrated flask. After 6 min, 1.5 mL of 20% Na2CO3 was added, and the flask was topped up with distilled water to the target volume (10 mL). The mixture prepared in this manner was left for 2 h at room temperature in a dark place, and the absorbance of the final solution was measured at 725 nm relative to a blank sample. The results of the phenol content were expressed in gallic acid equivalents (GAE) (Sigma-Aldrich, St. Louis, MO, USA, ACS reagent ≥ 98.00%). The results were calculated from the equation of the calibration curve prepared for gallic acid (GA) standards in the concentration range of 10–60 mg/L (10, 20, 30, 40, 50, and 60 mg/L). Each sample was diluted appropriately to fit the range of the standard curve. All analyses were performed in triplicate.
2.6. Total Flavonoid Content
The determination of flavonoid content in the tested samples was performed by means of spectrophotometry (λ = 510 nm) according to a modified procedure described by Karadeniz et al. [30]. An aliquot of methanolic chocolate extract (1 mL) was mixed with 5 mL of redistilled water and 0.3 mL of 5% NaNO2. After 5 min of incubation at room temperature, 0.6 mL of 10% AlCl3·6H2O was added. After 5 min of incubation, 2 mL of 1 M of NaOH was added, and the mixture was filled with redistilled water up to the final volume of 10 mL. The absorbance of the samples prepared in this manner was measured at 510 nm against the blank. The results of the flavonoid content were expressed in epicatechin equivalents (ECE) (Sigma-Aldrich, St. Louis, MO, USA, ACS reagent ≥ 98.00%). The results were calculated from the equation of the calibration curve prepared for epicatechin (EC) standards in the concentration range of 10–400 mg/L (10; 50; 100; 150; 200; 250; 300; 400 mg/L). Each sample was diluted appropriately to fit the range of the standard curve. All analyses were performed in triplicate.
2.7. Free Radical-Scavenging Ability by the Use of a Stable DPPH• Radical
The antioxidant activity was determined according to a modified Brand–Williams et al. method with the use of the synthetic radical DPPH (2,2-diphenyl-1-picrylhydrazyl, Sigma) dissolved in ethanol [31,32]. A total of 0.5mM of alcoholic DPPH solution was prepared by dissolving 19.72 mg of DPPH in ethanol. The obtained solution was diluted to final 0.08 mM working solution, so that its absorbance at 517 nm was approximately 0.9. The solution was stored in the dark.
The test sample contained 1.5 mL of the DPPH solution and 20 µL of the extracts; the absorbance (A) was measured 30 min after the initiation of the reaction. Each measurement was performed in triplicate, and the mean absorbance value (A1) for the solution was calculated.
The inhibition of the DPPH radical by the sample was calculated according to the following formula: inhibition % = 100 (A0 − A1)/A0, where A0 is the absorbance of the control, and A1 is the absorbance of the sample. Each sample, depending on the material of the chocolate, was diluted appropriately to the range of the standard curve prepared for Trolox (6-hydroxy-2,5,7,8-tetramethylchroman-2-carboxylic acid) standards. All analyses were performed in triplicate; the concentration values were based on a Trolox standard curve (40–600 μM) and expressed as micromoles of Trolox equivalents (TE) per gram of chocolate.
2.8. Sensory Analysis
The sensory evaluation was performed for the raw chocolate (MAN) and, as a reference, for two samples of commercial chocolates (COM 50% and COM 64%). Sensory analysis of the chocolates was conducted with regard to general preferences (the indication by the assessor that a single sample of chocolate was preferred in terms of sensory traits) and with the use of a hedonic scale, which determined the degree to which a given sample was “desirable” or “undesirable” to the consumer. A 5-point scale was used: like very much (+2 pts), like (+1 pt), neither like nor dislike (0 pts), dislike (−1 pt), dislike very much (−2 pts) [33,34,35,36]. In addition, sensory evaluation in terms of fragrance and flavour was conducted with the use of the ranking test, in which every sample was given a suitable rank, from the least intense fragrance/flavour (rank 1) to the most intense fragrance/flavour (rank 3) [33,35]. The results obtained for an individual trait were expressed as an average characteristic for a given testing group.
In addition, a five-point sensory assessment of the chocolates was conducted with regard to the visual appearance of the products: colour, form, and surface quality; and to the fracture, flavour, and taste. The assessors, using a five-point rating scale, were to assign a rank to the given quality trait from 5 to 1 (Table 1). The rank of 5 meant the highest result, and 1 meant the lowest. A definition of the quality of the tested product was assigned to every rank. In view of the fact that not all quality traits affect the overall quality to the same degree, weight coefficients were applied to determine the importance of the quality factors relative to the others (Table 1). The results obtained for a particular trait were summed up and expressed on a percentage scale, where the highest rating of a given trait corresponded to 100%.

Table 1.
Definitions of product quality for the five-point sensory assessment.
2.9. Statistical Analysis
Data were analysed using one-way analysis of variance (ANOVA) followed by Duncan’s test using the SAS statistical system (SAS Version 9.1, SAS Inst., Cary, NC, USA). The significance of all tests was set at p ≤ 0.05.
3. Results and Discussion
3.1. Chemical Composition and Visual Assessment
A bar of raw chocolate obtained in the experiment was characterised by a dark brown colour and a perfectly smooth surface (Figure 2).
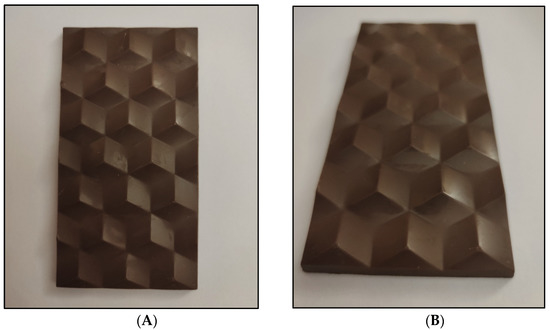
Figure 2.
Bar of raw chocolate: (A)—view from above, (B)—view from the front.
Table 2 presents the nutritional composition of the raw chocolate produced in the experiment (MAN) compared to the composition of the commercial products (COM 50% and COM 64%) and to the composition of the cocoa beans from which the experimental product was derived.
Table 2.
Nutritional composition of raw chocolate, commercial chocolates and cocoa beans.
The raw chocolate was characterised by the highest fat content (33.4%), compared to the commercial chocolates COM 50% and COM 64% (28.0 and 32.0%, respectively). In the case of the content of carbohydrates, the lowest level of those components was noted in the experimental product, at 39.6%, while in the case of the commercial products, the corresponding values were 53.7% and 42.7%, respectively. The nutritional composition determined the energy value of the products, and the raw chocolate was characterised by a calorific value (495 kcal) that was similar to those of the commercial chocolates (491 kcal and 494 kcal, respectively). Chocolate and chocolate products are characterised by a high nutritional and calorific value (above 3000 kcal/kg). A notable part of that high energy value results from the content of fat and carbohydrates. The literature data indicate that dark chocolate and milk chocolate are characterised by the following nutritional compositions: carbohydrate amounts of 49.7 and 50.5%, fat amounts of 33.6 and 36.3%, protein amounts of 6.6 and 7.3%, crude fibre amounts of 8 and 3.2%, and calorific values of 515 and 545 kcal, respectively [12]. Similar values of the nutritional composition of chocolate were described by Gürsoy and Heperkan [37], i.e., the compositions for dark and milk chocolate were, respectively: carbohydrate amounts of 55 and 57%, fat amounts of 32 and 33%, protein amounts of 5 and 7%, and calorific values 530 and 518 kcal. Caponio et al. [38] demonstrated that 70% dark chocolate % had the following composition: carbohydrate amounts of 45%, fat amounts of 41%, protein amounts of 8–9%, and soluble dietary fibre amounts of 5%. Cocoa butter is the component of chocolate that has the highest calorific value. It contains approximately 34% (33.3–40.2%) stearic acid (saturated acid), 34% (26.3–35.2%) oleic acid (monounsaturated acid), and 27% (25.2–33.7%) palmitic acid (saturated acid) [37,39]. Stearic acid has only a small effect on the level of cholesterol. Oleic acid may have a reducing effect on cholesterol levels, or it can be neutral in this respect. Palmitic acid, in turn, displays a moderate tendency towards elevating the level of cholesterol. The remaining part of cocoa butter is composed of unsaturated fatty acids [7]. Chocolate also contains minerals in its composition, especially potassium, magnesium, copper, and iron [13,40,41]. While the majority of carbohydrates in chocolate originate from saccharose, there are also small amounts of various carbohydrates in the dietary fibre contained in cocoa. Carbohydrate types and amounts are important because they affect the glycaemic index. Because the presence of lipids in food slows carbohydrate absorption, a high fat content in chocolate causes a slower rise in blood sugar levels, resulting in a lower glycaemic index [7].
Table 3 presents the total content of polyphenolics and the total content of flavonoids in the produced raw chocolate and in the commercial chocolates as compared to the content of those components in the non-roasted beans of the cocoa tree. The highest total phenolic content and total flavonoid content were noted in cocoa beans (27.82 mg GAE/g and 12.22 mg ECE/g, respectively). The raw chocolate produced in the experiment was characterised by significantly higher total phenolic and flavonoid contents (22.08 mg GAE/g and 8.75 mg ECE/g, respectively) in comparison to the commercial chocolates, which were characterised by a ca. 2.8-fold lower (COM 50%) and 2.4-fold lower (COM 64%) content of polyphenols and an ca. 2.3-fold lower (COM 50%) and ca. 2-fold lower (COM 64%) content of flavonoids.
Table 3.
Total phenolic content, total flavonoid content, and antioxidant activity of the analysed samples of raw chocolate, commercial chocolates, and cocoa beans.
The literature data indicate that non-roasted cocoa beans from Ecuador had a total phenolic content of 25.42 mg GAE/g, while the corresponding value for roasted cocoa beans was 22.92 mg GAE/g. The total phenolic content in various cocoa beans varied in the range from 9.96 mg GAE/g to 37.81 mg GAE/g and depended on the cultivar, place of origin, and method of treatment or processing (roasting). The cited authors indicated that a majority of the chocolates tested in the described experiment were characterised by a higher level of polyphenols in the chocolates (within the range of 9.10 mg GAE/g to 40.55 mg GAE/g) relative to the phenolic content in the respective cocoa beans from which the chocolates were produced [18]. Urbańska et al. [42], in a study on the mass of milk chocolates based on cocoa mass obtained from non-roasted cocoa beans from Peru, noted a total phenolic content ranging from about 15.25 mg GAE/g to approximately 16.85 mg GAE/g. In another study, chocolates from Peru had phenolic contents ranging from 1.69 mg GAE/g to 5.39 mg GAE/g [43]. Todorovic et al. [44] obtained polyphenol contents in chocolates in the range of 7.21 mg GAE/g to 12.65 mg GAE/g. Jaćimović et al. [13] showed that the content of total polyphenols in dark chocolate ranged from 10.55 to 39.82 mg GAE/g. In addition, it was found that the chocolate samples with the highest cocoa content were characterized by the highest content of polyphenols. It is known that the total polyphenol content varies depending on the variety of cocoa beans and the conditions during fermentation, drying, roasting, processing, and storage. In some cases, the results obtained cannot be directly compared due to different extraction solvents. In addition, some literature results are reported as mg of GAE per gram of cocoa product, while other results are reported as mg of GAE per gram of chocolate defatted sample, which contributes to some variation between the results [45].
The content of flavonoids in a study on cocoa beans from China, Indonesia, and Papua New Guinea ranged from 3.50 mg ECE/g to 12.62 mg ECE/g [46], and the highest of those values corresponded to the value obtained in the experiment presented herein. The content of flavonoids in chocolates from Peru varied from 0.28 mg CE/g (catechin equivalents) to 1.99 mg CE/g [43]. In another study, the level of flavonoids in lipid-free chocolate masses fell within the range of 0.02 mg ECE/g to 6.01 mg ECE/g [47]. Jaćimović et al. [13] showed that the total flavonoid content in dark chocolate samples ranged from 10.04 to 37.85 mg CE/g. The chocolate samples with the highest levels of total polyphenols also contained the highest contents of flavonoids [13], which was also confirmed in our study. Samples with the highest content of cocoa showed the highest content of flavonoids. According to Lee et al. [48], cocoa has a higher content of flavonoids per portion than tea or red wine. Powdered cocoa is one of the richest identified dietary sources of flavonoids so far, next to buckwheat hulls, sorghum, and cinnamon [49].
The highest value of antioxidant activity, a 36.95% DPPH radical inhibition, was noted for non-roasted cocoa beans, which corresponded to 216.61 μM TE/g (Table 3). Higher antioxidant activity results for cocoa beans were obtained by Elodie et al. [9], i.e., between 295 and 329 μM TE/g (unfermented cocoa beans) and from 221 to 351 μM TE/g (fermented cocoa beans). The second-ranking sample in terms of antioxidant activity was the raw chocolate MAN obtained from non-roasted cocoa beans, which had an inhibition at a level of 29.91% (172.16 μM TE/g). The sample of commercial chocolate (COM 64%) was characterised by antioxidant activity at a level of 23.63% inhibition (132.60 μM TE/g). The lowest value of antioxidant activity was noted in the case of the commercial chocolate COM 50%–at a 12.72% inhibition (63.76 μM TE/g). Caponio et al. [38] showed that two types of dark chocolate, i.e., artisanal and industrial, had antioxidant activities of 79.81 and 68.65 μM TE/g, respectively, which were lower than in our study. The results obtained in the range of the contents of polyphenols, flavonoids, and antioxidant activity supported the correlation between the content of cocoa mass and the oxidative capacity of the products. Roasting cocoa beans generally results in a lowering of antioxidant activity. Arlorio et al. [50] noted a decrease in the antioxidant activity of cocoa ranging between 37 and 48% after preliminary roasting at 100 °C and proper roasting of various cocoa cultivars at 130 °C. In addition, Hu et al. [51] observed a decrease in the antioxidant activity of cocoa, ranging between 44 and 50%, during roasting at a high temperature (190 °C) for a short time (15 min).
With regard to the commercial production of chocolate, one should take into account that the numerous parameters of the complex technological process affect the nutritional as well as the health-promoting values of the obtained product [18]. Cocoa beans are the primary raw material for the production of chocolate and the most important source of phenolic compounds [52]. In the technological process, which is characterised by the use of high temperatures, a majority of polyphenols undergo degradation, which can be observed in the form of lower levels of those health-promoting components relative to the unprocessed raw material. It should be emphasised that certain polyphenols, e.g., (-)-epicatechin, can form highly complex, insoluble complexes that are very hard to determine analytically. Such complex procyanidins, under the effect of high temperatures, may undergo degradation into easily extractable monomeric forms, which affect the total phenolic content in the product [18]. The roasting of cocoa beans results in the appearance of the characteristic colour, flavour, taste, and texture of roasted cocoa beans [53], which has an effect on the sensory parameters of the final product, i.e., chocolate. As a result of the application of high temperatures during roasting, in the range of 120–150 °Cover 5–120 min, a reduction is observed in the total phenolic content and the total flavonoid content [53,54]. Chocolate processing has an effect on the total phenolic content and also on the antioxidant activity of chocolate, and suitable technology can “optimise” the retention of polyphenols and the antioxidant activity of chocolate [55]. Żyżelewicz et al. [56] indicated that, in the case of the total content of polyphenols in chocolate, the conching process did not contribute to a significant degradation of these compounds, unlike the roasting process. The progressive decrease in the content of polyphenols during the production of chocolate was also described by Di Mattia et al. [57]. These authors indicated that roasting played the most important role in this case, although differences in the concentration of polyphenols can also be observed between conched and un-tempered chocolate, as well as finished dark chocolate.
3.2. Sensory Evaluation
In the sensory analysis performed with the method of preference assessment by a group of assessors, the commercial chocolate COM 50% obtained the highest rank of 9 in total, while the experimental raw chocolate and the commercial chocolate COM 64% obtained the ranks of 2 and 1, respectively (Figure 3).
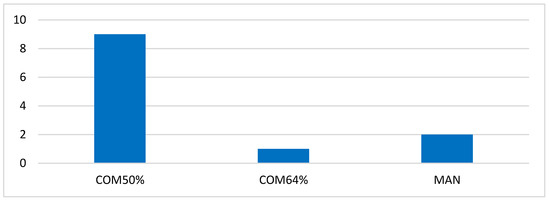
Figure 3.
Results of sensory analysis—method of preference evaluation. MAN—raw chocolate, COM 64%—classic bitter chocolate 64%, COM 50%—light bitter chocolate 50% (COM 50%).
In the sensory analysis of the tested samples of chocolate according to the hedonic scale, the commercial chocolates obtained the highest summary values of ratings, i.e., 18 (COM 50%) and 13 (COM 64%), while the experimental raw chocolate (MAN) obtained the lowest rating of 2 (Figure 4).
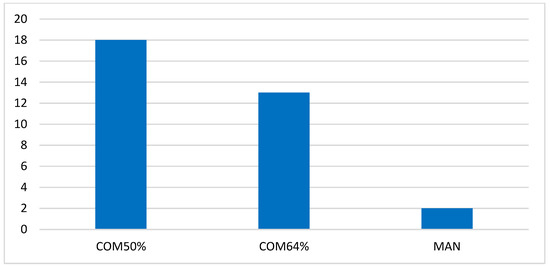
Figure 4.
Results of sensory analysis—hedonic method, assessor perception of the samples. MAN—raw chocolate, COM 64%—classic bitter chocolate 64%, COM 50%—light bitter chocolate 50% (COM 50%).
In the analysis conducted with the method of sequencing the discriminants of the two traits of flavour and taste, the commercial chocolates were indicated as the preferred ones in terms of flavour, with average ranks of 2.33 (COM 50%) and 2 (COM 64%), respectively, while the raw chocolate (MAN) obtained the lowest rank of 1.83. When the criterion in the evaluation was the taste, all of the tested chocolates were given similar ranks (2 and 1.95), with the commercial chocolates having a minimal advantage (Figure 5).
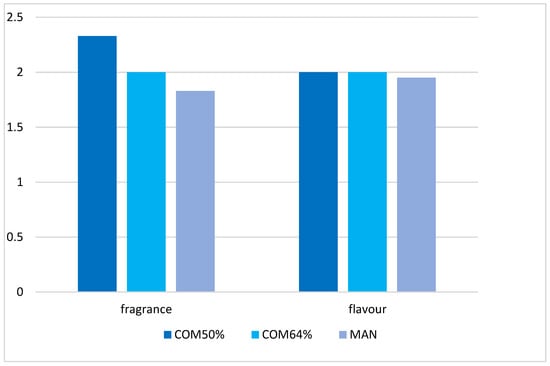
Figure 5.
Evaluation of the taste of the samples, results of sensory analysis through the sequencing method. MAN–raw chocolate, COM 64%–classic bitter chocolate 64%, COM 50%–light bitter chocolate 50% (COM 50%).
In the next stage of the conducted sensory analysis of the chocolates, five evaluated traits were distinguished, i.e., external appearance—colour, external appearance—shape, external appearance—surface condition, fragrance, and flavour (Figure 6).
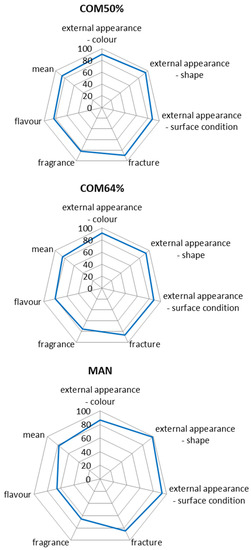
Figure 6.
Results of five-point evaluation of the chocolates. MAN—raw chocolate, COM 64%—classic bitter chocolate 64%, COM 50%—light bitter chocolate 50% (COM 50%).
In the evaluation of the trait “external appearance—colour”, the commercial chocolates obtained the highest ranks in the percentage scale, i.e., 91.67% (COM 64%) and 90% (COM 50%), while the raw chocolate (MAN) obtained the rank of 86.67%. With regard to the criteria of “external appearance—shape” and “external appearance—surface condition”, the panel members gave the highest ranks to the raw chocolate (MAN), at 98.33 and 93.33%, respectively, while the ranks given to the commercial chocolates were 95 and 88.33% (COM 50%) and 93.33 and 88.33% (COM 64%), respectively. The commercial chocolates were characterised by the highest-ranked parameters, i.e., flavour and taste, and obtained the values of 81.67 and 75%, and 83.33 and 80%, for the chocolates COM 50% and COM 64%, respectively, while the rank given to the raw chocolate MAN for its flavour and taste was low at 65%. Taking into account the weight of the individual evaluated parameters, in this analysis, as can be seen in Table 1, the highest summary rank for all five of the evaluated discriminants was granted to the chocolate COM 50%, at 86.58%, followed by the chocolate COM 64% at84%, and the lowest rank was given to the raw chocolate MAN at 77.83%.
In summary of the results of the sensory evaluation, the commercial chocolate scored 50%. The most important discriminant in the evaluation was taste (weight factor 0.3), which is affected by sweetness, which is determined by the content of carbohydrates. The commercial chocolate COM 50% had the highest content of carbohydrates at 53.7% (Table 2). This was reflected in the highest level of sweetness in that chocolate. The chocolate COM 64% was the next-ranked chocolate in terms of taste, with 42.7% carbohydrate content, which was 11% less than the chocolate COM 50%. The experimental raw chocolate MAN had the lowest content of carbohydrates, 39.6%, and its rank for taste was also the lowest. The taste preferences of consumers are shaped by their being accustomed to products offered by commercial producers in the consumer market. Popov-Raljić et al. [58] analysed the sensory parameters of nine milk chocolate products that differed in their content of saccharose (400, 475, or 550 g/kg) and cocoa butter (280, 320 or 360 g/kg). The cited authors demonstrated that samples with a low content of sugar had a more bitter taste, while samples with a higher sugar content were characterised by a more intense milky/vanilla/caramel taste and a harder consistency, and they obtained higher ranks in the sensory evaluation. According to Urbańska et al. [59], a high sugar addition results in higher consumer acceptance of chocolates. However, in recent years, efforts have been made to reduce the content of sugar in various food products, including chocolate. The excessive intake of free sugars increases the total consumption of energy and may reduce the consumption of foods richer in nutrients, which involves numerous unfavourable health effects [60]. The excessive intake of sugar is related to an increased risk of the development of non-contagious diseases, such as excessive body mass, cardiometabolic diseases, elevated blood pressure, certain kinds of cancer, and tooth decay [61]. On the basis of evidence linking sugar intake with unfavourable health effects, the WHO [62] recommended a limitation of free sugar intake to less than 10% (at best, below 5%) of the daily total consumption of energy, which corresponds to 50 g a day per average adult. Although a number of countries have implemented a set of strategies and means aimed at reducing sugar intake [63], the available data show that the objective has not yet been attained [61]. In view of the above, the raw chocolate presented in this report can be an alternative to commercial products that are characterised by a higher content of carbohydrates. In spite of the lower ranks in the sensory analysis, it is worth promoting such a product that complies with WHO recommendations concerning the reduction of sugar intake.
Fat is another component that should be mentioned among the basic nutritional components of chocolate. The raw chocolate MAN had the highest content of fat (33.4%), while the commercial chocolate COM 50% was characterised by the lowest level of that component (28%). Guinard et al. [64] demonstrated that various levels of fat and sugar in chocolate resulted in very big differences in the sensory properties of milk chocolate. The cited authors demonstrated that samples with a high fat content were ranked lower than samples with a low content of fat.
The raw chocolate MAN was obtained from non-roasted cocoa beans, as opposed to the commercial chocolates, which were produced from roasted cocoa beans. In addition, the composition of the raw chocolate was limited solely to three basic components: non-roasted cocoa beans, cane sugar, and cocoa butter. According to the producer’s statement, the commercial chocolates contained additional components, such as emulsifiers (soy lecithin, polyglycerol polyricinoleate), flavour additives, and milk fat (in the case of the chocolate COM 50%). The raw chocolate had a higher content of total phenolic compounds and a higher total flavonoid content. As those components produce a more intense bitter taste, this resulted in reduced ranks in the evaluation of the trait “taste”. Oberrauter et al. [65] demonstrated that phenolic compounds are the key inducers of bitterness and sourness, which potentially reduces the acceptance of such chocolates by consumers.
4. Conclusions
This presented study indicated that the craft raw chocolate produced solely with the use of three recipe ingredients (non-roasted cocoa beans, cane sugar, and cocoa butter) was characterised by a lower content of carbohydrates (39.6% in raw chocolate and 42.7% and 53.7% in commercial chocolates, respectively), higher total phenolic and total flavonoid contents (22.08 mg GAE/g and 8.75 mg ECE/g in raw chocolate; 9.25 and 7.87 mg GAE/g; and 4.43 and 3.83 mg ECE/g in commercial chocolates, respectively), and a higher antioxidant activity compared to commercial chocolates (172.16 μM TE/g in raw chocolate and 132.60 and 63.76 μM TE/g in commercial chocolates, respectively). In the sensory evaluation, the raw chocolate obtained lower rankings than the commercial chocolates, especially in the case of the most important discriminant in the entire evaluation, i.e., taste, which was unquestionably related to the lower content of carbohydrates. On the other hand, in the sensory evaluation for the criteria “external appearance—shape” and “external appearance—surface condition”, the panel members gave the highest ranks to the raw chocolate.
Author Contributions
Conceptualisation, R.K. and M.R.; methodology R.K. and M.R.; software, J.W.; validation, R.K.; formal analysis, R.K.; investigation, R.K. and M.T.I.; resources, R.K. and M.T.I.; data curation, R.K., M.R. and J.W.; writing—original draft preparation, R.K.; writing—review and editing, R.K. and M.T.I.; visualization, R.K. and J.W.; supervision, R.K. and M.T.I.; project administration, R.K.; funding acquisition, R.K. All authors have read and agreed to the published version of the manuscript.
Funding
This work was financed by a statutory activity subsidy from the Polish Ministry of Science and Higher Education for the Faculty of Food Science and Biotechnology of the University of Life Sciences in Lublin.
Institutional Review Board Statement
Not applicable.
Informed Consent Statement
Not applicable.
Data Availability Statement
Not applicable.
Conflicts of Interest
The authors declare no conflict of interest.
References
- KPMG. Rynek Słodyczy w Polsce. Available online: https://assets.kpmg/content/dam/kpmg/pl/pdf/2016/12/pl-Rynek-slodyczy-w-Polsce-2014-online-secured.pdf (accessed on 22 December 2022).
- Barišić, V.; Kopjar, M.; Jozinović, A.; Flanjak, I.; Ačkar, Đ.; Miličević, B.; Šubarić, D.; Jokić, S.; Babić, J. The Chemistry behind Chocolate Production. Molecules 2019, 24, 3163. [Google Scholar] [CrossRef]
- BioStat, C.B.-R. Badanie Rynku Słodyczy. Available online: https://www.statystyka.az.pl/zastosowania/badania-ankietowe-statystyka/badanie-rynku-slodyczy.php (accessed on 22 December 2022).
- Gronowska-Senger, A. Nutrition, life style and health of the Poles. Zyw. Człowieka Metab. 2007, 34, 12–21. [Google Scholar]
- Hartel, R.W.; von Elbe, J.H.; Hofberger, R. Confectionery Science and Technology; Springer International Publishing: Cham, Switzerland, 2018; ISBN 978-3-319-61740-4. [Google Scholar]
- Patel, N.; Jayswal, S.; Maitreya, B.B.; Nirali Patel, C. Dark chocolate: Consumption for human health. J. Pharmacogn. Phytochem. 2019, 8, 2887–2890. [Google Scholar]
- Beckett, S. The Science of Chocolate; Royal Society of Chemistry: Cambridge, UK, 2008; ISBN 978-0-85404-970-7. [Google Scholar]
- Pieracci, Y.; Ascrizzi, R.; Pistelli, L.; Flamini, G. Comparison of the Chemical and Sensorial Evaluation of Dark Chocolate Bars. Appl. Sci. 2021, 11, 9964. [Google Scholar] [CrossRef]
- Elodie, J.M.; Bereau, D.; Poucheret, P.; Guzman, C.; Boudard, F.; Robinson, J.C. Antioxidative and Immunomodulatory Potential of the Endemic French Guiana Wild Cocoa “Guiana”. Foods 2021, 10, 522. [Google Scholar]
- Nehlig, A. The neuroprotective effects of cocoa flavanol and its influence on cognitive performance. Br. J. Clin. Pharmacol. 2013, 75, 716–727. [Google Scholar] [CrossRef]
- Ramsey, D. Chocolate: Indulge Your Inner Chocoholic; Dorling Kindersley: London, UK, 2016. [Google Scholar]
- Montagna, M.T.; Diella, G.; Triggiano, F.; Caponio, G.R.; De Giglio, O.; Caggiano, G.; Di Ciaula, A.; Portincasa, P. Chocolate, “Food of the Gods”: History, Science, and Human Health. Int. J. Environ. Res. Public Health 2019, 16, 4960. [Google Scholar] [CrossRef]
- Jaćimović, S.; Popović-Djordjević, J.; Sarić, B.; Krstić, A.; Mickovski-Stefanović, V.; Pantelić, N.Đ. Antioxidant Activity and Multi-Elemental Analysis of Dark Chocolate. Foods 2022, 11, 1445. [Google Scholar] [CrossRef]
- Jalil, A.; Ismail, A. Polyphenols in Cocoa and Cocoa Products: Is There a Link between Antioxidant Properties and Health? Molecules 2008, 13, 2190–2219. [Google Scholar] [CrossRef]
- Macri, M.J.; Looper, M.G. New Catalog of Maya Hieroglyphs: The Classic Period Inscriptions; Iniversity of Oklahoma Press: Oklahoma City, OK, USA, 2013; ISBN 9780806143712. [Google Scholar]
- Nowak, P. Historia zapisana w tabliczce. Przegląd Piekarniczy Cukier. 2010, 9, 74–75. [Google Scholar]
- EU. EU Directive 2000/36/EC of the European Parliament and of the Council of 23 June 2000 relating to cocoa and chocolate products intended for human consumption. Off. J. Eur. Commun. 2000, L197, 19–25. [Google Scholar]
- Urbańska, B.; Kowalska, J. Comparison of the Total Polyphenol Content and Antioxidant Activity of Chocolate Obtained from Roasted and Unroasted Cocoa Beans from Different Regions of the World. Antioxidants 2019, 8, 283. [Google Scholar] [CrossRef] [PubMed]
- Nieburg, O. Is the Rise of Raw Chocolate a Safety Concern? Available online: https://www.confectionerynews.com/Article/2014/07/16/Raw-chocolate-a-Salmonella-health-risk-says-NCA?utm_source=copyright&utm_medium=OnSite&utm_campaign=copyright (accessed on 22 December 2022).
- AOAC 931.04; Moisture in Cocoa Products. AOAC International: Gaithersburg, MD, USA, 2013.
- Kowalski, R.; Wierciński, J. Evaluation of chemical composition of some Silphium L. species seeds as alternative foodstuff raw materials. Polish J. Food Nutr. Sci. 2004, 13, 349–354. [Google Scholar]
- AOAC 963.15; Official Methods of Analysis. Fat in Cacao Products, Soxhlet Extraction Method. AOAC International: Gaithersburg, MD, USA, 2010.
- Roda, A.; Lambri, M. Changes in Antioxidants and Sensory Properties of Italian Chocolates and Related Ingredients Under Controlled Conditions During an Eighteen-Month Storage Period. Nutrients 2019, 11, 2719. [Google Scholar] [CrossRef] [PubMed]
- AOAC 939.02-1939; Protein (Milk) in Milk Chocolate. Kjeldahl Method. AOAC International: Gaithersburg, MD, USA, 2000.
- AOAC 985.29; Total Dietary Fiber in Foods, Enzymatic-Gravimetric Method. AOAC International: Gaithersburg, MD, USA, 2003.
- Lončarević, I.; Pajin, B.; Petrović, J.; Nikolić, I.; Maravić, N.; Ačkar, Đ.; Šubarić, D.; Zarić, D.; Miličević, B. White Chocolate with Resistant Starch: Impact on Physical Properties, Dietary Fiber Content and Sensory Characteristics. Molecules 2021, 26, 5908. [Google Scholar] [CrossRef] [PubMed]
- Kunachowicz, H.; Nadolna, I.; Przygoda, B.; Iwanow, K. Food Composition Tables; Instytut Żywności i Żywienia: Warszawa, Poland, 1998. [Google Scholar]
- Barišić, V.; Stokanović, M.C.; Flanjak, I.; Doko, K.; Jozinović, A.; Babić, J.; Šubarić, D.; Miličević, B.; Cindrić, I.; Ačkar, Đ. Cocoa Shell as a Step Forward to Functional Chocolates—Bioactive Components in Chocolates with Different Composition. Molecules 2020, 25, 5470. [Google Scholar] [CrossRef] [PubMed]
- Singleton, V.L.; Rossi, J.A. Colorimetry of total phenolics with phosphomolybdic-phosphotungstic acid reagents. Am. J. Enol. Vitic. 1965, 16, 144–158. [Google Scholar]
- Karadeniz, F.; Burdurlu, H.; Koca, N.; Soyer, Y. Antioxidant activity of selected fruits and vegetables grown in Turkey. Turkish J. Agric. For. 2005, 29, 297–303. [Google Scholar]
- Brand-Williams, W.; Cuvelier, M.E.; Berset, C. Use of a free radical method to evaluate antioxidant activity. LWT Food Sci. Technol. 1995, 28, 25–30. [Google Scholar] [CrossRef]
- Wyrostek, J.; Kowalski, R. The Effect of Water Mineralization on the Extraction of Active Compounds from Selected Herbs and on the Antioxidant Properties of the Obtained Brews. Foods 2021, 10, 1227. [Google Scholar] [CrossRef]
- Baryłko-Pikielna, N.; Matuszewska, I. Sensoryczne Badania Żywności; Wydawnictwo Naukowe PTTŻ: Kraków, Poland, 2014; ISBN 978-83-935421-3-0. [Google Scholar]
- Szczęsna, T.; Wojtala, M.; Waszkowiak, K. The effect of nutritional knowledge, education and financial situation on food preferences and nutritional habits of agricultural university students living in students house. Probl. Hig. Epidemiol. 2005, 86, 30–35. [Google Scholar]
- Kowalski, R.; Wyrostek, J.; Kałwa, K.; Kowalska, G.; Pankiewicz, U.; Sujka, M.; Włodarczyk-Stasiak, M.; Mazurek, A. Sensory and chemical evaluation of tea brews prepared with the assistance of ultrasound. Cienc. Rural. 2019, 49, e20190056. [Google Scholar] [CrossRef]
- Obiedziński, M. Wybrane Zagadnienia Analizy Żywności; SGGW: Warszawa, Poland, 2009; ISBN 9788375831644. [Google Scholar]
- Gürsoy, B.; Heperkan, Z.D. Chocolate production, nutrients and health benefits. Int. J. Food Eng. Res. 2020, 6, 121–134. [Google Scholar]
- Caponio, G.R.; Lorusso, M.P.; Sorrenti, G.T.; Marcotrigiano, V.; Difonzo, G.; De Angelis, E.; Guagnano, R.; Monaci, L.; De Angelis, M.; Portincasa, P. Sensory Evaluation of Dark Chocolate: A Nutraceutical Boosting Consumers’ Health. Nutrients 2020, 12, 939. [Google Scholar] [CrossRef] [PubMed]
- Gunstone, F.D. Vegetable Oils in Food Technology; Gunstone, F.D., Ed.; Wiley: Hoboken, NJ, USA, 2011; ISBN 9781444332681. [Google Scholar]
- Torres-Moreno, M.; Torrescasana, E.; Salas-Salvadó, J.; Blanch, C. Nutritional composition and fatty acids profile in cocoa beans and chocolates with different geographical origin and processing conditions. Food Chem. 2015, 166, 125–132. [Google Scholar] [CrossRef] [PubMed]
- Oliveira, L.B.; de Melo, J.C.; da Boa Morte, E.S.; de Jesus, R.M.; Teixeira, L.S.G.; Korn, M.G.A. Multi-element determination in chocolate bars by microwave-induced plasma optical emission spectrometry. Food Chem. 2021, 351, 129285. [Google Scholar]
- Urbańska, B.; Szafrański, T.; Kowalska, H.; Kowalska, J. Study of Polyphenol Content and Antioxidant Properties of Various Mix of Chocolate Milk Masses with Different Protein Content. Antioxidants 2020, 9, 299. [Google Scholar]
- Calixto-Cotos, M.R.; Chire-Fajardo, G.C.; Orihuela-Rivera, C.A. Antioxidants properties of chocolates sold in Peru Propiedades antioxidantes de chocolates comercializados en Perú. Acta Agronómica 2019, 67, 479–485. [Google Scholar]
- Todorovic, V.; Redovnikovic, I.R.; Todorovic, Z.; Jankovic, G.; Dodevska, M.; Sobajic, S. Polyphenols, methylxanthines, and antioxidant capacity of chocolates produced in Serbia. J. Food Compos. Anal. 2015, 41, 137–143. [Google Scholar]
- Belščak, A.; Komes, D.; Horžić, D.; Ganić, K.K.; Karlović, D. Comparative study of commercially available cocoa products in terms of their bioactive composition. Food Res. Int. 2009, 42, 707–716. [Google Scholar] [CrossRef]
- Gu, F.; Tan, L.; Wu, H.; Fang, Y.; Xu, F.; Chu, Z.; Wang, Q. Comparison of Cocoa Beans from China, Indonesia and Papua New Guinea. Foods 2013, 2, 183–197. [Google Scholar] [CrossRef]
- Hu, Y.; Pan, Z.J.; Liao, W.; Li, J.; Gruget, P.; Kitts, D.D.; Lu, X. Determination of antioxidant capacity and phenolic content of chocolate by attenuated total reflectance-Fourier transformed-infrared spectroscopy. Food Chem. 2016, 202, 254–261. [Google Scholar] [CrossRef] [PubMed]
- Lee, K.W.; Kim, Y.J.; Lee, H.J.; Lee, C.Y. Cocoa Has More Phenolic Phytochemicals and a Higher Antioxidant Capacity than Teas and Red Wine. J. Agric. Food Chem. 2003, 51, 7292–7295. [Google Scholar] [CrossRef] [PubMed]
- Miller, K.B.; Hurst, W.J.; Payne, M.J.; Stuart, D.A.; Apgar, J.; Sweigart, D.S.; Ou, B. Impact of Alkalization on the Antioxidant and Flavanol Content of Commercial Cocoa Powders. J. Agric. Food Chem. 2008, 56, 8527–8533. [Google Scholar] [CrossRef] [PubMed]
- Arlorio, M.; Locatelli, M.; Travaglia, F.; Coïsson, J.-D.; Del Grosso, E.; Minassi, A.; Appendino, G.; Martelli, A. Roasting impact on the contents of clovamide (N-caffeoyl-L-DOPA) and the antioxidant activity of cocoa beans (Theobroma cacao L.). Food Chem. 2008, 106, 967–975. [Google Scholar]
- Hu, S.; Kim, B.-Y.; Baik, M.-Y. Physicochemical properties and antioxidant capacity of raw, roasted and puffed cacao beans. Food Chem. 2016, 194, 1089–1094. [Google Scholar] [CrossRef]
- Penido, F.C.L.; Lourenço, I.C.R.; da Silva, L.M.; Garcia, C.F.; Rezende, F.A.G.G. Chemical composition, antioxidant activity, and fatty acid profile of cocoa nibs. Int. J. Res. Granthaalayah 2021, 9, 168–176. [Google Scholar] [CrossRef]
- Krysiak, W. Influence of roasting conditions on coloration of roasted cocoa beans. J. Food Eng. 2006, 77, 449–453. [Google Scholar]
- Krysiak, W. Effects of convective and microwave roasting on the physicochemical properties of cocoa beans and cocoa butter extracted from this material. Grasas Aceites 2011, 62, 467–478. [Google Scholar] [CrossRef]
- Di Mattia, C.D.; Sacchetti, G.; Mastrocola, D.; Serafini, M. From Cocoa to Chocolate: The Impact of Processing on In Vitro Antioxidant Activity and the Effects of Chocolate on Antioxidant Markers In Vivo. Front. Immunol. 2017, 8, 1207. [Google Scholar] [CrossRef]
- Żyżelewicz, D.; Budryn, G.; Oracz, J.; Antolak, H.; Kręgiel, D.; Kaczmarska, M. The effect on bioactive components and characteristics of chocolate by functionalization with raw cocoa beans. Food Res. Int. 2018, 113, 234–244. [Google Scholar] [CrossRef] [PubMed]
- Di Mattia, C.; Martuscelli, M.; Sacchetti, G.; Scheirlinck, I.; Beheydt, B.; Mastrocola, D.; Pittia, P. Effect of Fermentation and Drying on Procyanidins, Antiradical Activity and Reducing Properties of Cocoa Beans. Food Bioprocess. Technol. 2013, 6, 3420–3432. [Google Scholar] [CrossRef]
- Popov-Raljić, J.; Laličić-Petronijević, J. Sensory Properties and Color Measurements of Dietary Chocolates with Different Compositions During Storage for Up to 360 Days. Sensors 2009, 9, 1996–2016. [Google Scholar] [CrossRef] [PubMed]
- Urbańska, B.; Kowalska, H.; Szulc, K.; Ziarno, M.; Pochitskaya, I.; Kowalska, J. Comparison of the Effects of Conching Parameters on the Contents of Three Dominant Flavan3-ols, Rheological Properties and Sensory Quality in Chocolate Milk Mass Based on Liquor from Unroasted Cocoa Beans. Molecules 2021, 26, 2502. [Google Scholar] [CrossRef] [PubMed]
- Mela, D.J.; Woolner, E.M. Perspective: Total, Added, or Free? What Kind of Sugars Should We Be Talking About? Adv. Nutr. 2018, 9, 63–69. [Google Scholar] [CrossRef]
- Prada, M.; Saraiva, M.; Garrido, M.V.; Sério, A.; Teixeira, A.; Lopes, D.; Silva, D.A.; Rodrigues, D.L. Perceived Associations between Excessive Sugar Intake and Health Conditions. Nutrients 2022, 14, 640. [Google Scholar] [CrossRef] [PubMed]
- WHO. Guideline: Sugars Intake for Adults and Children; World Health Organization: Geneva, Switzerland, 2015; ISBN 978-92-4-069422-4. [Google Scholar]
- Prada, M.; Rodrigues, D.L.; Godinho, C.A.; Lopes, D.; Garrido, M. V Knowledge and acceptance of interventions aimed at reducing sugar intake in Portugal. Public Health Nutr. 2020, 23, 3423–3434. [Google Scholar] [CrossRef]
- Guinard, J.-X.; Mazzucchelli, R. Effects of sugar and fat on the sensory properties of milk chocolate: Descriptive analysis and instrumental measurements. J. Sci. Food Agric. 1999, 79, 1331–1339. [Google Scholar] [CrossRef]
- Oberrauter, L.-M.; Januszewska, R.; Schlich, P.; Majchrzak, D. Sensory evaluation of dark origin and non-origin chocolates applying Temporal Dominance of Sensations (TDS). Food Res. Int. 2018, 111, 39–49. [Google Scholar] [CrossRef]
Disclaimer/Publisher’s Note: The statements, opinions and data contained in all publications are solely those of the individual author(s) and contributor(s) and not of MDPI and/or the editor(s). MDPI and/or the editor(s) disclaim responsibility for any injury to people or property resulting from any ideas, methods, instructions or products referred to in the content. |
© 2023 by the authors. Licensee MDPI, Basel, Switzerland. This article is an open access article distributed under the terms and conditions of the Creative Commons Attribution (CC BY) license (https://creativecommons.org/licenses/by/4.0/).