Article

Enhancing Neonatal Incubator Energy Management and Monitoring through IoT-Enabled CNN-LSTM Combination Predictive Model

by
I Komang Agus Ady Aryanto
,
Dechrit Maneetham
* and
Padma Nyoman Crisnapati
*
Department of Mechatronics Engineering, Rajamangala University of Technology Thanyaburi, Bangkok 12110, Thailand
*
Authors to whom correspondence should be addressed.
Appl. Sci. 2023, 13(23), 12953; https://doi.org/10.3390/app132312953
Submission received: 26 October 2023 / Revised: 28 November 2023 / Accepted: 30 November 2023 / Published: 4 December 2023
(This article belongs to the Special Issue Future Internet of Things: Applications, Protocols and Challenges)

Abstract

:
This research focuses on enhancing neonatal care by developing a comprehensive monitoring and control system and an efficient model for predicting electrical energy consumption in incubators, aiming to mitigate potential adverse effects caused by excessive energy usage. Employing a combination of 1-dimensional convolutional neural network (1D-CNN) and long short-term memory (LSTM) methods within the framework of the Internet of Things (IoT), the study encompasses multiple components, including hardware, network, database, data analysis, and software. The research outcomes encompass a real-time web application for monitoring and control, temperature distribution visualizations within the incubator, a prototype incubator, and a predictive energy consumption model. Testing the LSTM method resulted in an RMSE of 42.650 and an MAE of 33.575, while the CNN method exhibited an RMSE of 37.675 and an MAE of 30.082. Combining CNN and LSTM yielded an RMSE of 32.436 and an MAE of 25.382, demonstrating the potential for significantly improving neonatal care.

1. Introduction

Newborn babies are referred to as neonates, and babies born before reaching 37 weeks of gestation are considered premature. Premature babies face higher health risks than those born at full term, requiring intensive care. Intensive care for these infants necessitates using a medical device known as a neonatal incubator. The incubator maintains a stable environmental temperature and humidity using an internal heater, assisted by a fan for air circulation. Operating the incubator requires significant knowledge, and medical personnel must be able to monitor the conditions inside the incubator at all times.
Additionally, efficient energy management within the incubator is crucial, as excessive energy usage could lead to the heater inside increasing the temperature conditions, potentially negatively impacting infant care and raising energy consumption. Therefore, research was conducted to develop an efficient energy-management system and enable real-time monitoring and control of the incubator’s conditions to enhance neonatal care. In this study, a combination of LSTM-CNN methods and the Internet of Things (IoT) concept was utilized to create an energy prediction model and a real-time operational system for monitoring and control.
The Internet of Things (IoT) is a technological concept that enables hardware or objects, regardless of location, to communicate over the Internet without human intervention [1]. The IoT has been widely adopted in various aspects of life to enhance daily living, even within the industrial sector [2]. The IoT comprises hardware, networking, and software components [3,4]. In this research, IoT technology was applied in healthcare, specifically in neonatal incubators. Multiple sensors, actuators, and network modules are installed in the incubator. All hardware sensors and actuator modules are connected to a microcontroller, which processes the data and sends them to an IoT broker using the message queuing telemetry transport (MQTT) communication protocol [5].
Several previous studies have explored using the Internet of Things (IoT) in baby incubators, incorporating various sensors. Furthermore, previous research has employed a hybrid fuzzy and PID approach in incubator control systems. Researchers have also researched incubator monitoring and apnea detection systems for premature babies using IoT and wearable devices [6,7,8,9]. However, no research has effectively combined artificial intelligence (AI) with IoT within the context of baby incubators. Our study addresses this gap by developing a system capable of understanding energy consumption, monitoring temperature conditions through a web application, and comprehending temperature distribution within the incubator.
Generally, healthcare professionals use neonatal incubators to maintain temperature and humidity conditions. Therefore, this research uses DHT11 sensors to monitor temperature and humidity and ACS712 devices to measure energy consumption [10,11]. Additionally, this research conducted experiments to understand the temperature distribution inside the incubator. Multiple DHT11 sensors were installed at various corners within the incubator to collect temperature data from each point in more detail and visualize. Through visualization, temperature distribution patterns were observed, which can provide further insights into improving temperature management efficiency and energy usage. This, in turn, contributes to the optimization of neonatal care.
The main hardware components utilized included a microcontroller, a single-board computer, a 1200-watt AC heater, and a 12 V DC motor with a propeller for the fan. The microcontroller was the ATMega256, integrated into the Arduino Mega 2560 board [12]. Arduino Mega 2560 has digital input/output (I/O) and analog I/O to connect with the DHT11 and ACS721 sensors. It also features three serial ports (Tx/Rx), with one of these serial ports used in the research to connect the ESP8266 WiFi module [13,14]. Furthermore, this study used the Raspberry Pi, a single-board computer capable of running Linux or Windows-based operating systems. The Raspberry Pi has a CPU, RAM, and I/O ports suitable for IoT-based projects [15]. Hence, in this research, Raspberry Pi was the server running the Mosquitto IoT Broker application, an Apache Server, and the MySQL database [16,17,18].
Subsequently, sensor measurements from the hardware components are sent to the IoT broker using a WiFi module with an MQTT communication protocol. MQTT is a protocol that offers three different quality of service (QoS) levels and employs publish/subscribe (pub/sub) terminology for communication [19,20]. The transmitted data enter the IoT broker and are further processed by the system, being stored in the database. The data stored in the database are then displayed in real-time on the web application. Furthermore, this web application is responsive and can be accessed on various screen sizes, including mobile devices. This feature allows for flexible control and monitoring of the incubator from anywhere and anytime over the Internet using the MQTT protocol.
The data stored in the database are then used as a dataset for creating a predictive model for electricity consumption. The process of creating this model utilizes a combination of methods from deep learning, namely long short-term memory (LSTM) and a 1-dimensional convolutional neural network (1D-CNN) [21]. Combining these two methods aims to increase the accuracy of predicting electrical energy consumption [22]. The choice of these two methods is based on the temporal or sequential data type. Therefore, the decision was made to employ the LSTM method to understand the data sequence that will occur next. The output from the 1D-CNN will be used as input for LSTM. Generally, the analysis process begins by inputting data into the 1D-CNN. The output results from the 1D-CNN are then used as input for LSTM. Following this, the final result of this model will be evaluated to measure the level of prediction it produces.
In the context of the incubator, numerous studies have been conducted previously, but most of them utilized control methods such as PID and Fuzzy [6,7,8,9], as shown in Table 1. Our research aims to extend the development of the incubator with artificial intelligence to monitor energy usage based on temperature conditions inside the incubator. In this work, our main contributions are:
  • web application for real-time monitoring and control;
  • visualization of the temperature data distribution inside the incubator;
  • prototype of an electronic hardware incubator; and
  • hybrid model utilizing 1D-CNN and LSTM methods for predicting energy consumption models.

2. Related Works

Numerous prior investigations have been conducted about neonatal incubators. Kapen et al. in 2019 [6] aimed to create an automatic neonatal incubator with various modules such as phototherapy, fingerprint reader, and remote monitoring. The remote monitoring module supervises the baby’s temperature, heart rate, and video surveillance. Alimuddin et al., in 2021 [7], applied a hybrid Fuzzy-PID system to control temperature and humidity in the incubator. Next, Cay et al., 2022 [8] developed a respiratory monitoring and Apnea detection system for premature babies using the Internet of Things concept. This system utilizes the ESP32 microcontroller, sensors, edge computing devices (ECD), and the MQTT protocol. This system implements an Internet of Things architecture with the MQTT protocol to connect the wireless embedded system (WES) or sensors to the edge computing device (ECD). Aya-Parra et al., 2023 [9] worked on developing an incubator system for temperature and humidity monitoring through a web application. This system uses a WiFi network and the MQTT communication protocol to send data to a broker service integrated with Node-RED. In Table 1, there is a summary of research related to neonatal incubator systems. This table summarizes research findings based on various aspects, including hardware, network, data management, software, analysis methods, and control systems. The last row of this table highlights the contributions of these research findings.
In Table 1, the hardware section features the adoption of the ATMega2560 microcontroller, chosen for its larger processing capacity. On the network side, the implementation of MQTT and HTTP protocols stands out compared to previous research that exclusively used MQTT. MQTT connects sensor devices within the neonatal incubator to the IoT broker, while HTTP establishes connections between web and mobile applications and the database. Notably, in the IoT broker section, Mosquitto is utilized, being directly installed on the Raspberry Pi, a departure from previous research that relied on third-party broker providers. Moving to the software section designed for monitoring the incubator’s condition through web and mobile devices, it follows a web-based approach, contrasting with prior research that predominantly focused on desktop applications and a 16 × 2 LCD module. Finally, the data analysis and monitoring of the neonatal incubator’s condition involve utilizing LSTM and CNN methods, a unique combination not previously explored in research.

3. Materials and Methods

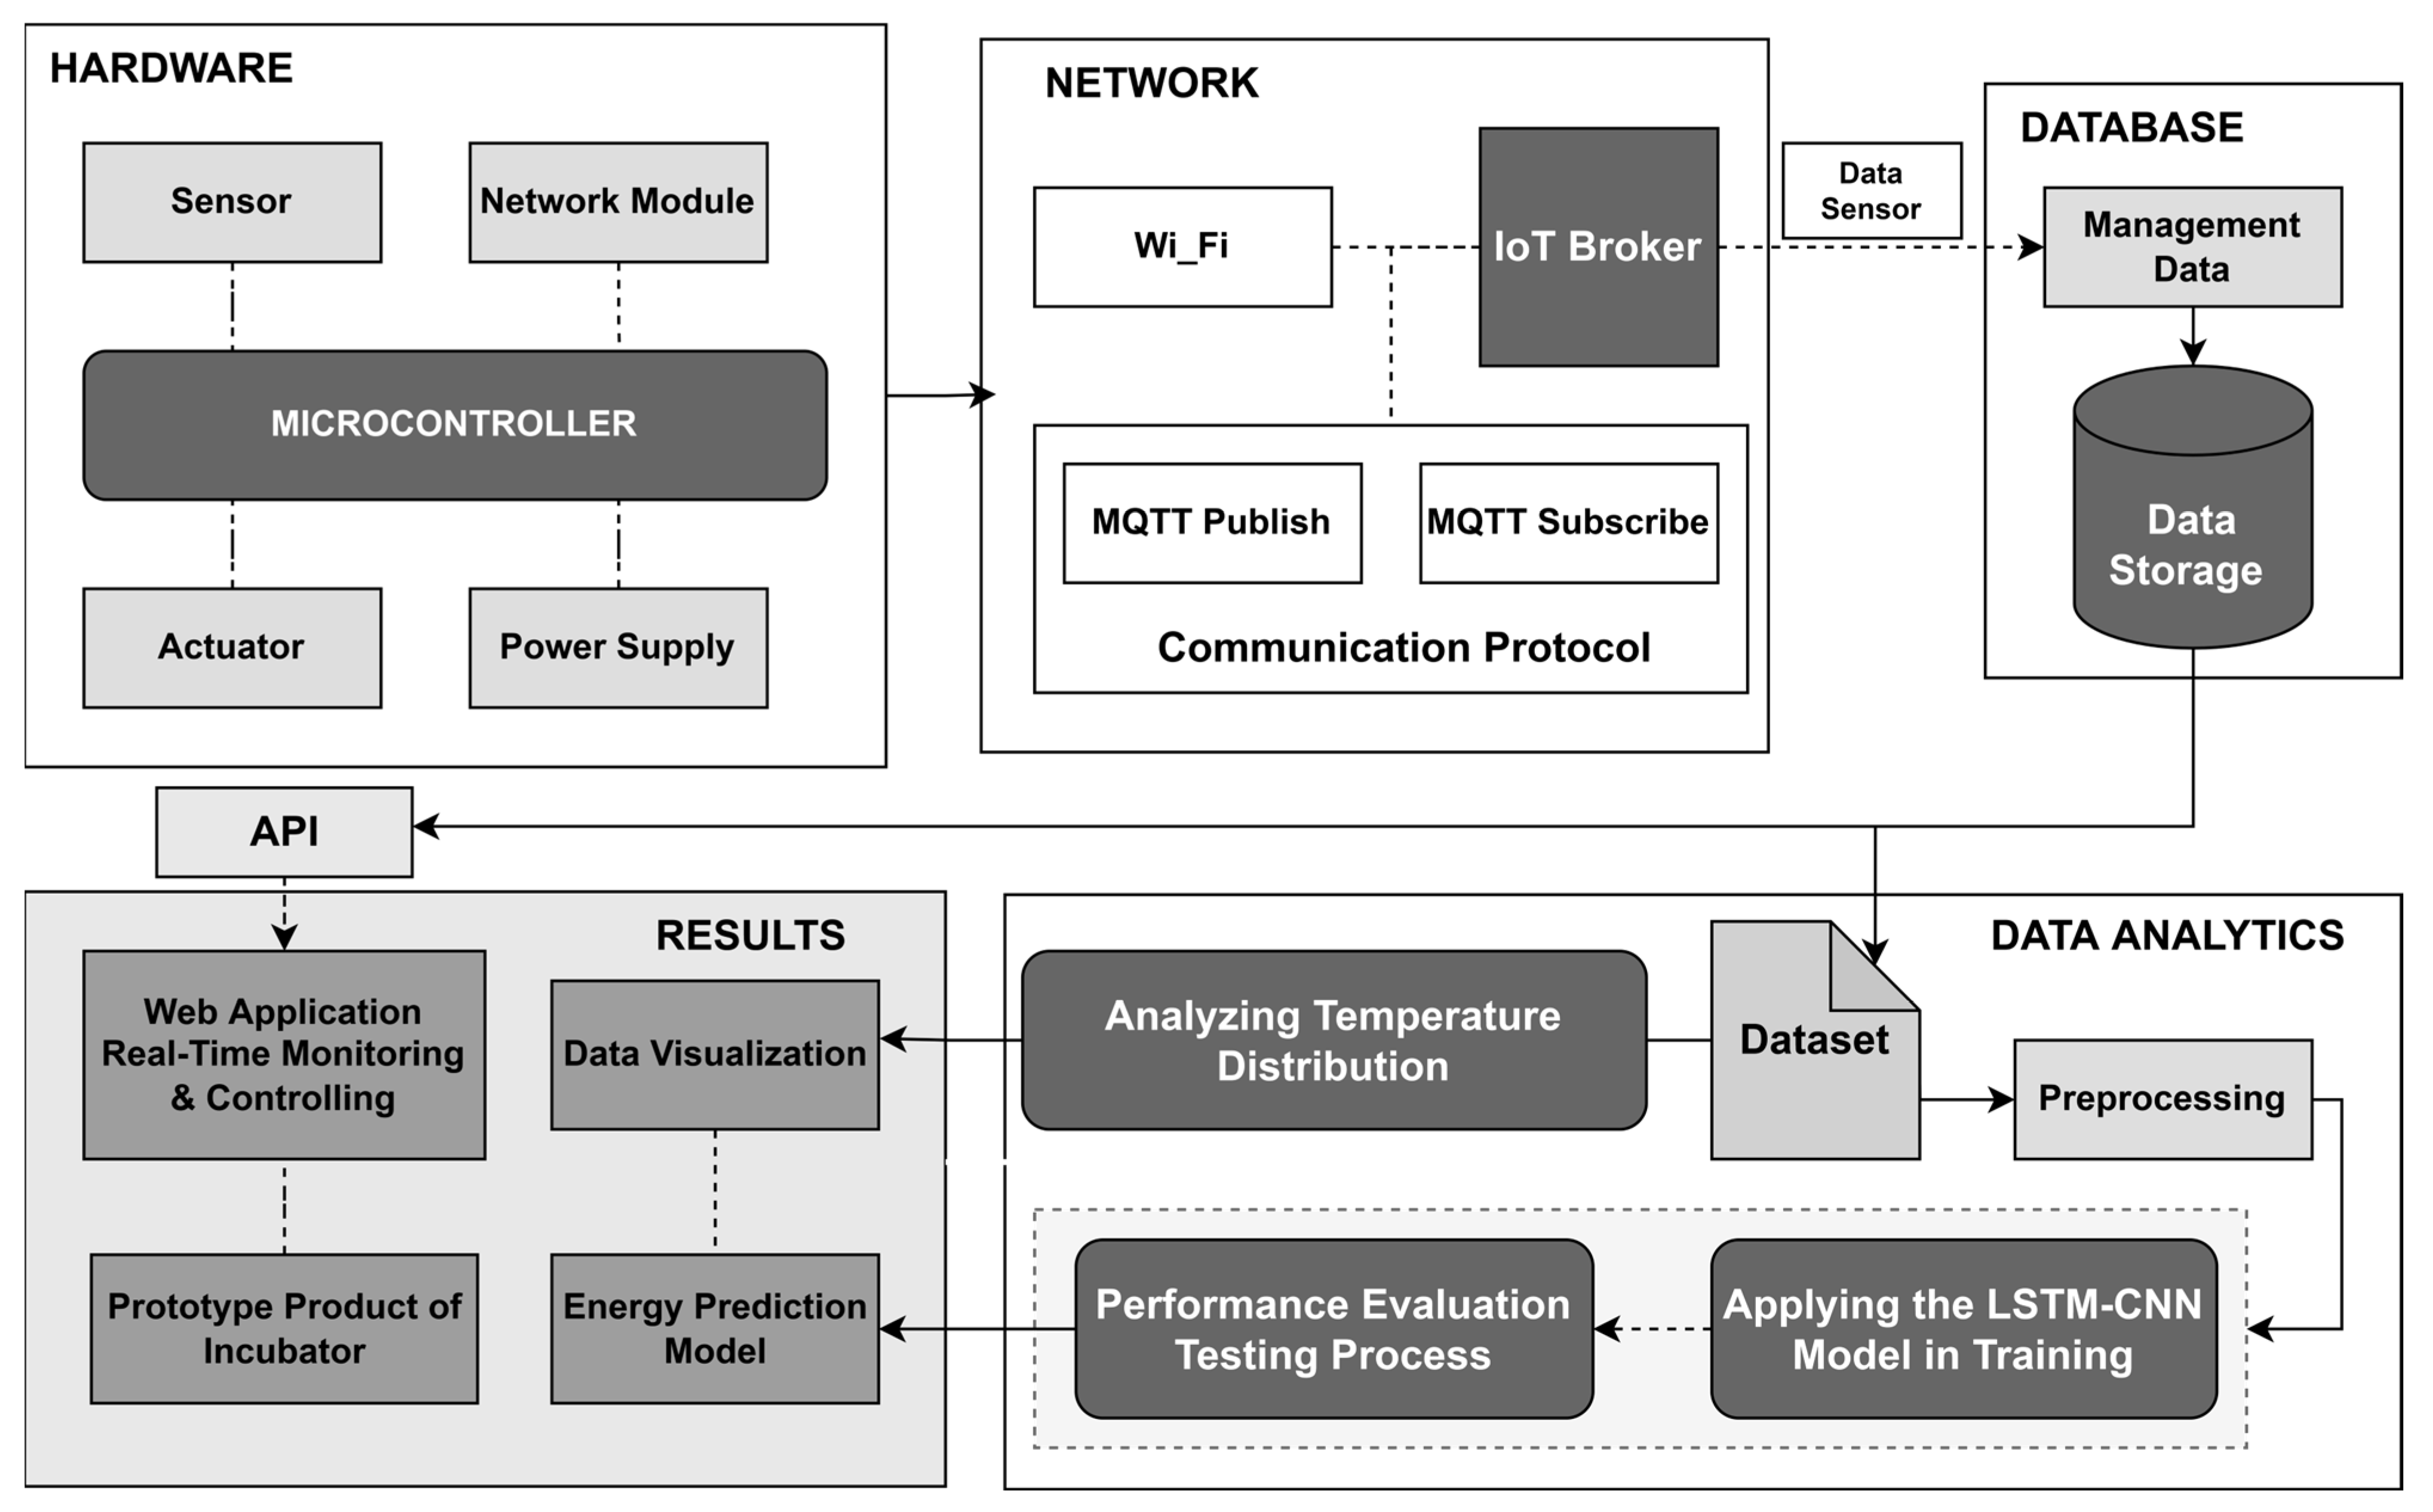
3.1. System Overview

An overview of the system in this research is depicted in Figure 1. The entire developed system is divided into five components called modules. Each module encompasses several processes. These components include hardware, network, database, data analysis, and outputs. The initial stages of the research start from the hardware component and continue through the process to obtain the final results.
In the hardware component, various electronic components are used to collect data. These electronic components include sensors, actuators, power supply, communication or network devices, and microcontrollers. These electronic components are connected to the microcontroller according to their respective I/O signals. The sensors carry out the process of reading environmental data values inside the incubator, and the microcontroller processes the acquired values. The microcontroller can use these data to send commands to the actuators or transmit the data to the database via the network.
An IoT Broker is used and installed on a server in the network component. The data sent by the hardware will enter this IoT broker. Data communication in this system uses the publish/subscribe method, where each piece of data sent has a corresponding topic [23]. Additionally, each device has a unique ID or identity for identification purposes. WiFi is the communication medium during the data transmission from hardware to the IoT Broker.
The data collected in the IoT broker are then processed for storage in the database. The data storage process is conducted in real-time from the broker to the database using a socket service created with Python. However, before the data are stored in the database, they are filtered to ensure no data loss or inappropriate data occurs during storage. Subsequently, the data stored in the database are used as a dataset in the analysis stage to create a model to predict energy consumption and temperature distribution patterns within the incubator.
The dataset contains features or attributes such as temperature, humidity, and electric current values in the analysis stage. Data patterns in this dataset are recorded every second. Therefore, energy consumption is calculated for each second in the analysis process. Suppose you want to calculate the total energy consumption for a specific period. In that case, you can multiply the electric current data by the electrical voltage (220 V) with the desired duration in seconds. For example, if you want to find energy consumption per minute, the result can be multiplied by 60 s.
The next step in the process is modeling, using deep learning methods to analyze the sequential data from the incubator. This analysis process combines two techniques, 1D-CNN and LSTM, to develop a predictive model for electric energy consumption [24]. Before that, a data preprocessing process is performed, which includes steps such as calculating the average values based on time and scaling. The purpose is to optimize and prepare the data to create an accurate and reliable predictive model.
Furthermore, in the next phase, an analysis of the temperature distribution patterns within the incubator is conducted, aiding in the optimization of infant care. The outcome of this analysis will manifest as visualizations of the temperature distribution conditions within the incubator. Additionally, a web application has been developed to be accessed from anywhere via the Internet. This web application allows users to monitor and control the incubator’s conditions in real-time.

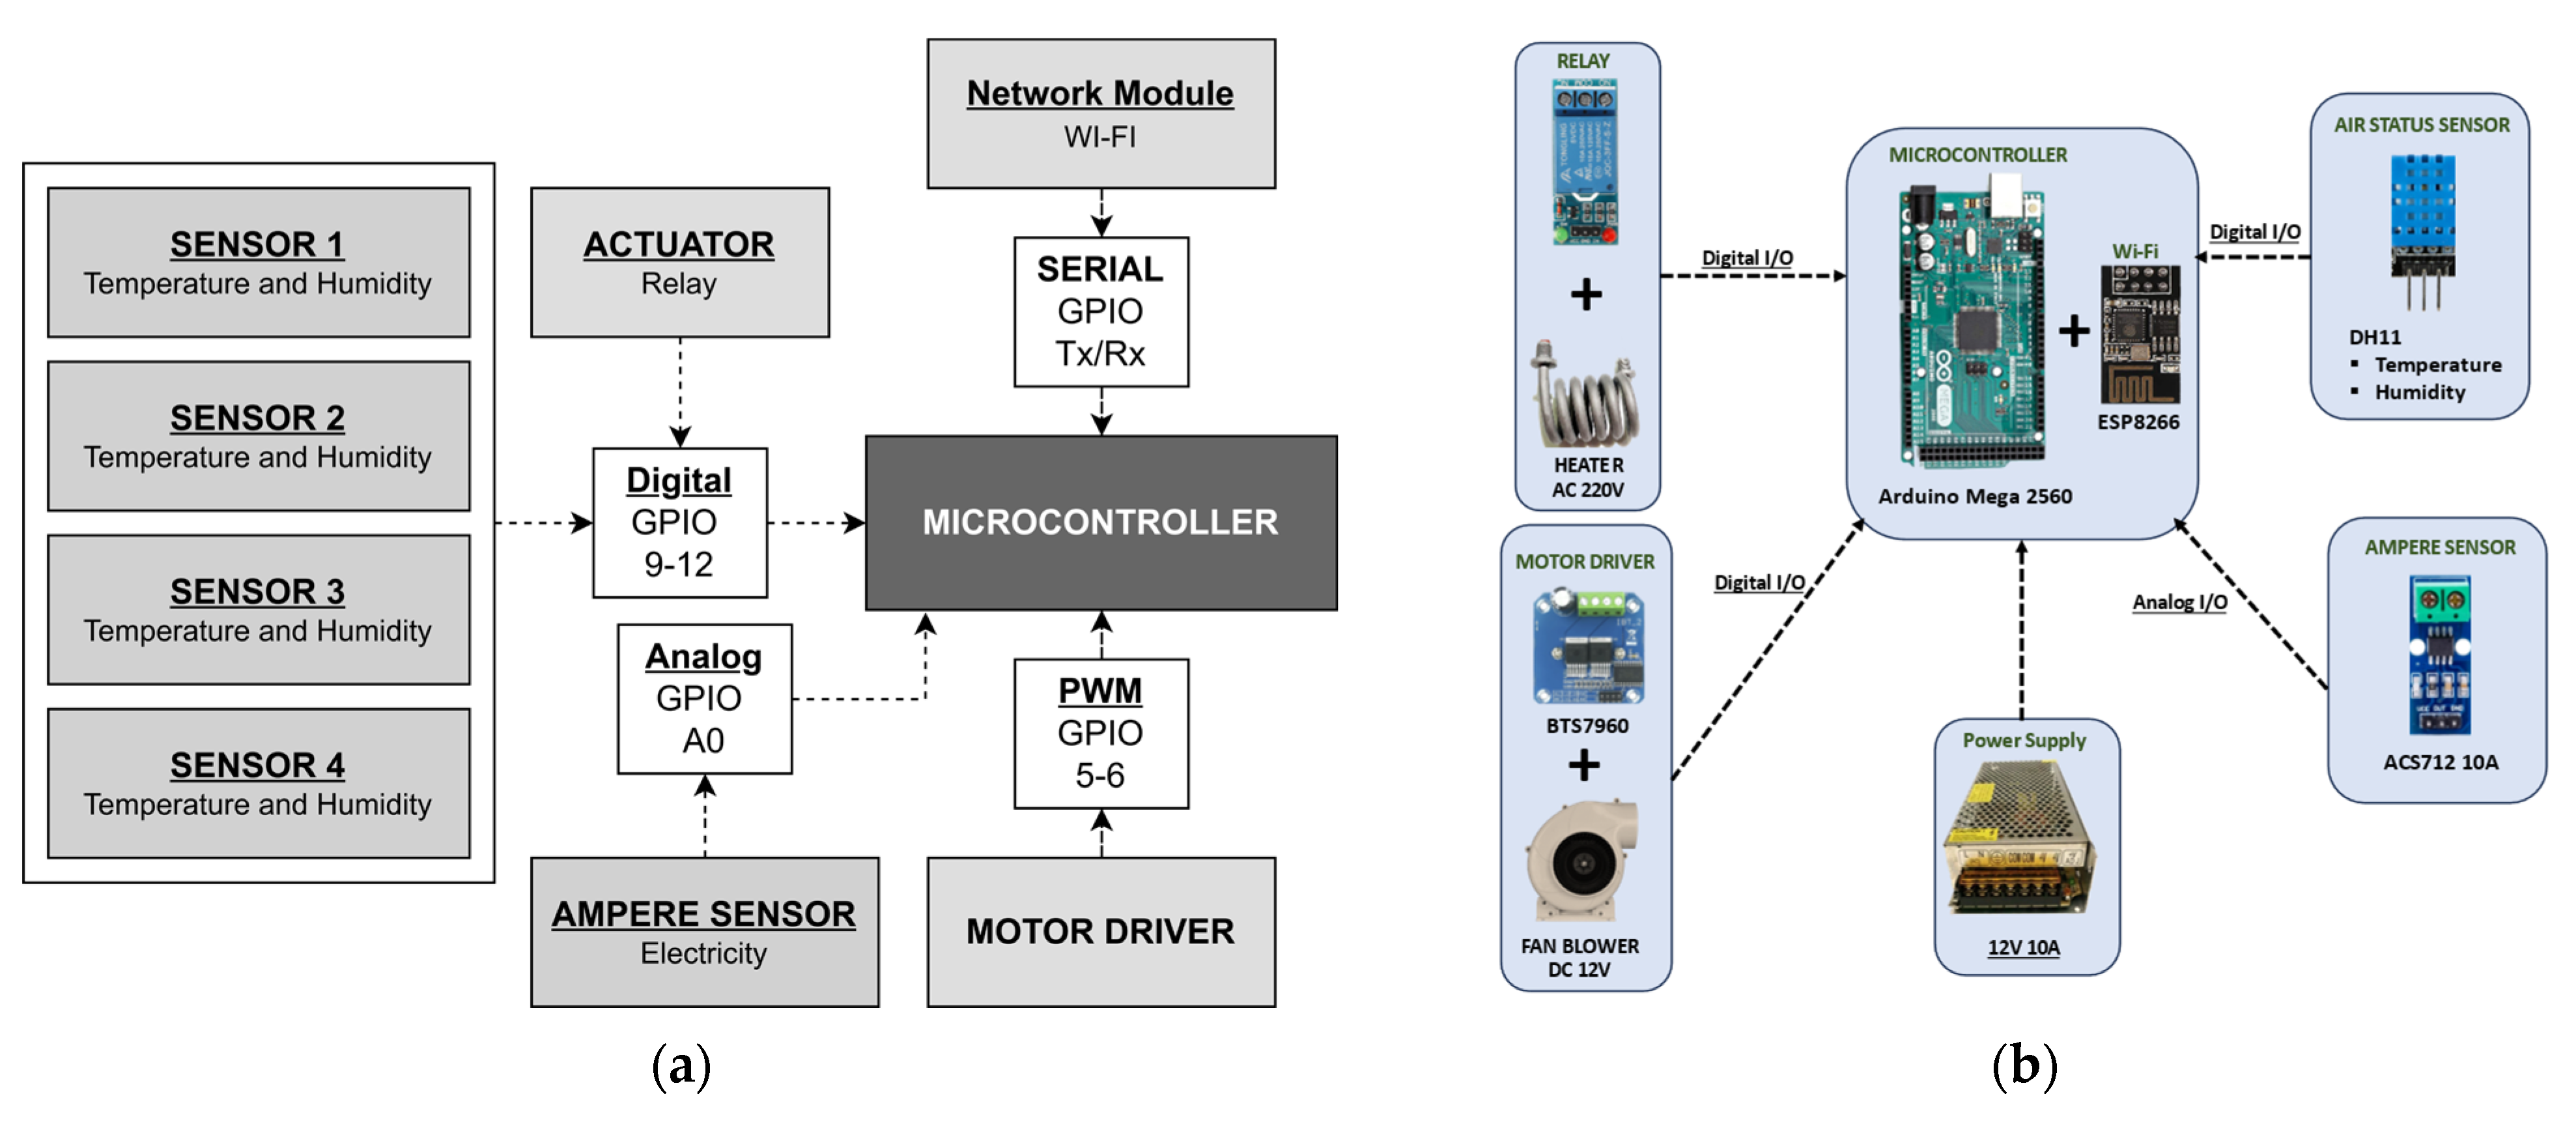
3.2. Electronic Design

The hardware design in this research is illustrated in Figure 2. Figure 2a represents the design process, while Figure 2b displays the wiring schematic. The hardware design utilizes several DHT11 sensors [25] and a one-channel relay device as actuators. All of these components are connected to the microcontroller through digital I/O pins. An ACS712 sensor is also employed to measure the electrical current linked to the microcontroller via an analog I/O pin (A0) [26]. To control the speed of the DC motor, a BTS7960 device is used, capable of controlling motors up to 48 V. The DC motor circulates the heated air produced by the heater into the incubator. This heater device is connected to a relay module, facilitating easy on/off control. A comprehensive list of the electronic components used can be found in Table 2.
Furthermore, the placement procedure of these sensors is designed to optimize monitoring and measurements inside the incubator, as depicted in Figure 3. Four temperature and humidity sensors are positioned on each side of the incubator. The distribution of these sensors across the incubator’s sides aims to assist in monitoring even temperature and humidity changes throughout the entire space. Meanwhile, the current sensor placed on the AC power cable of the primary power source enables precise monitoring of the electrical current entering the incubator.
The next step after connecting the sensor and actuator devices to the microcontroller involves developing the program code. The program development process employs the Arduino IDE as the code editor [28]. The program is divided into several functions, which include (a) connecting to the internet network, (b) communicating with the IoT broker, (c) reading sensor values, and (d) the control system. The program begins with the device connecting to the Internet using the SSID and password. Subsequently, the device establishes a connection with the IoT broker by configuring several parameters such as the host, port, username, and password. Once connected, the device starts reading sensor data and repeatedly sends them to the IoT broker. The following complete details regarding the program on the hardware can be seen in Algorithm 1.
Algorithm 1: Hardware system
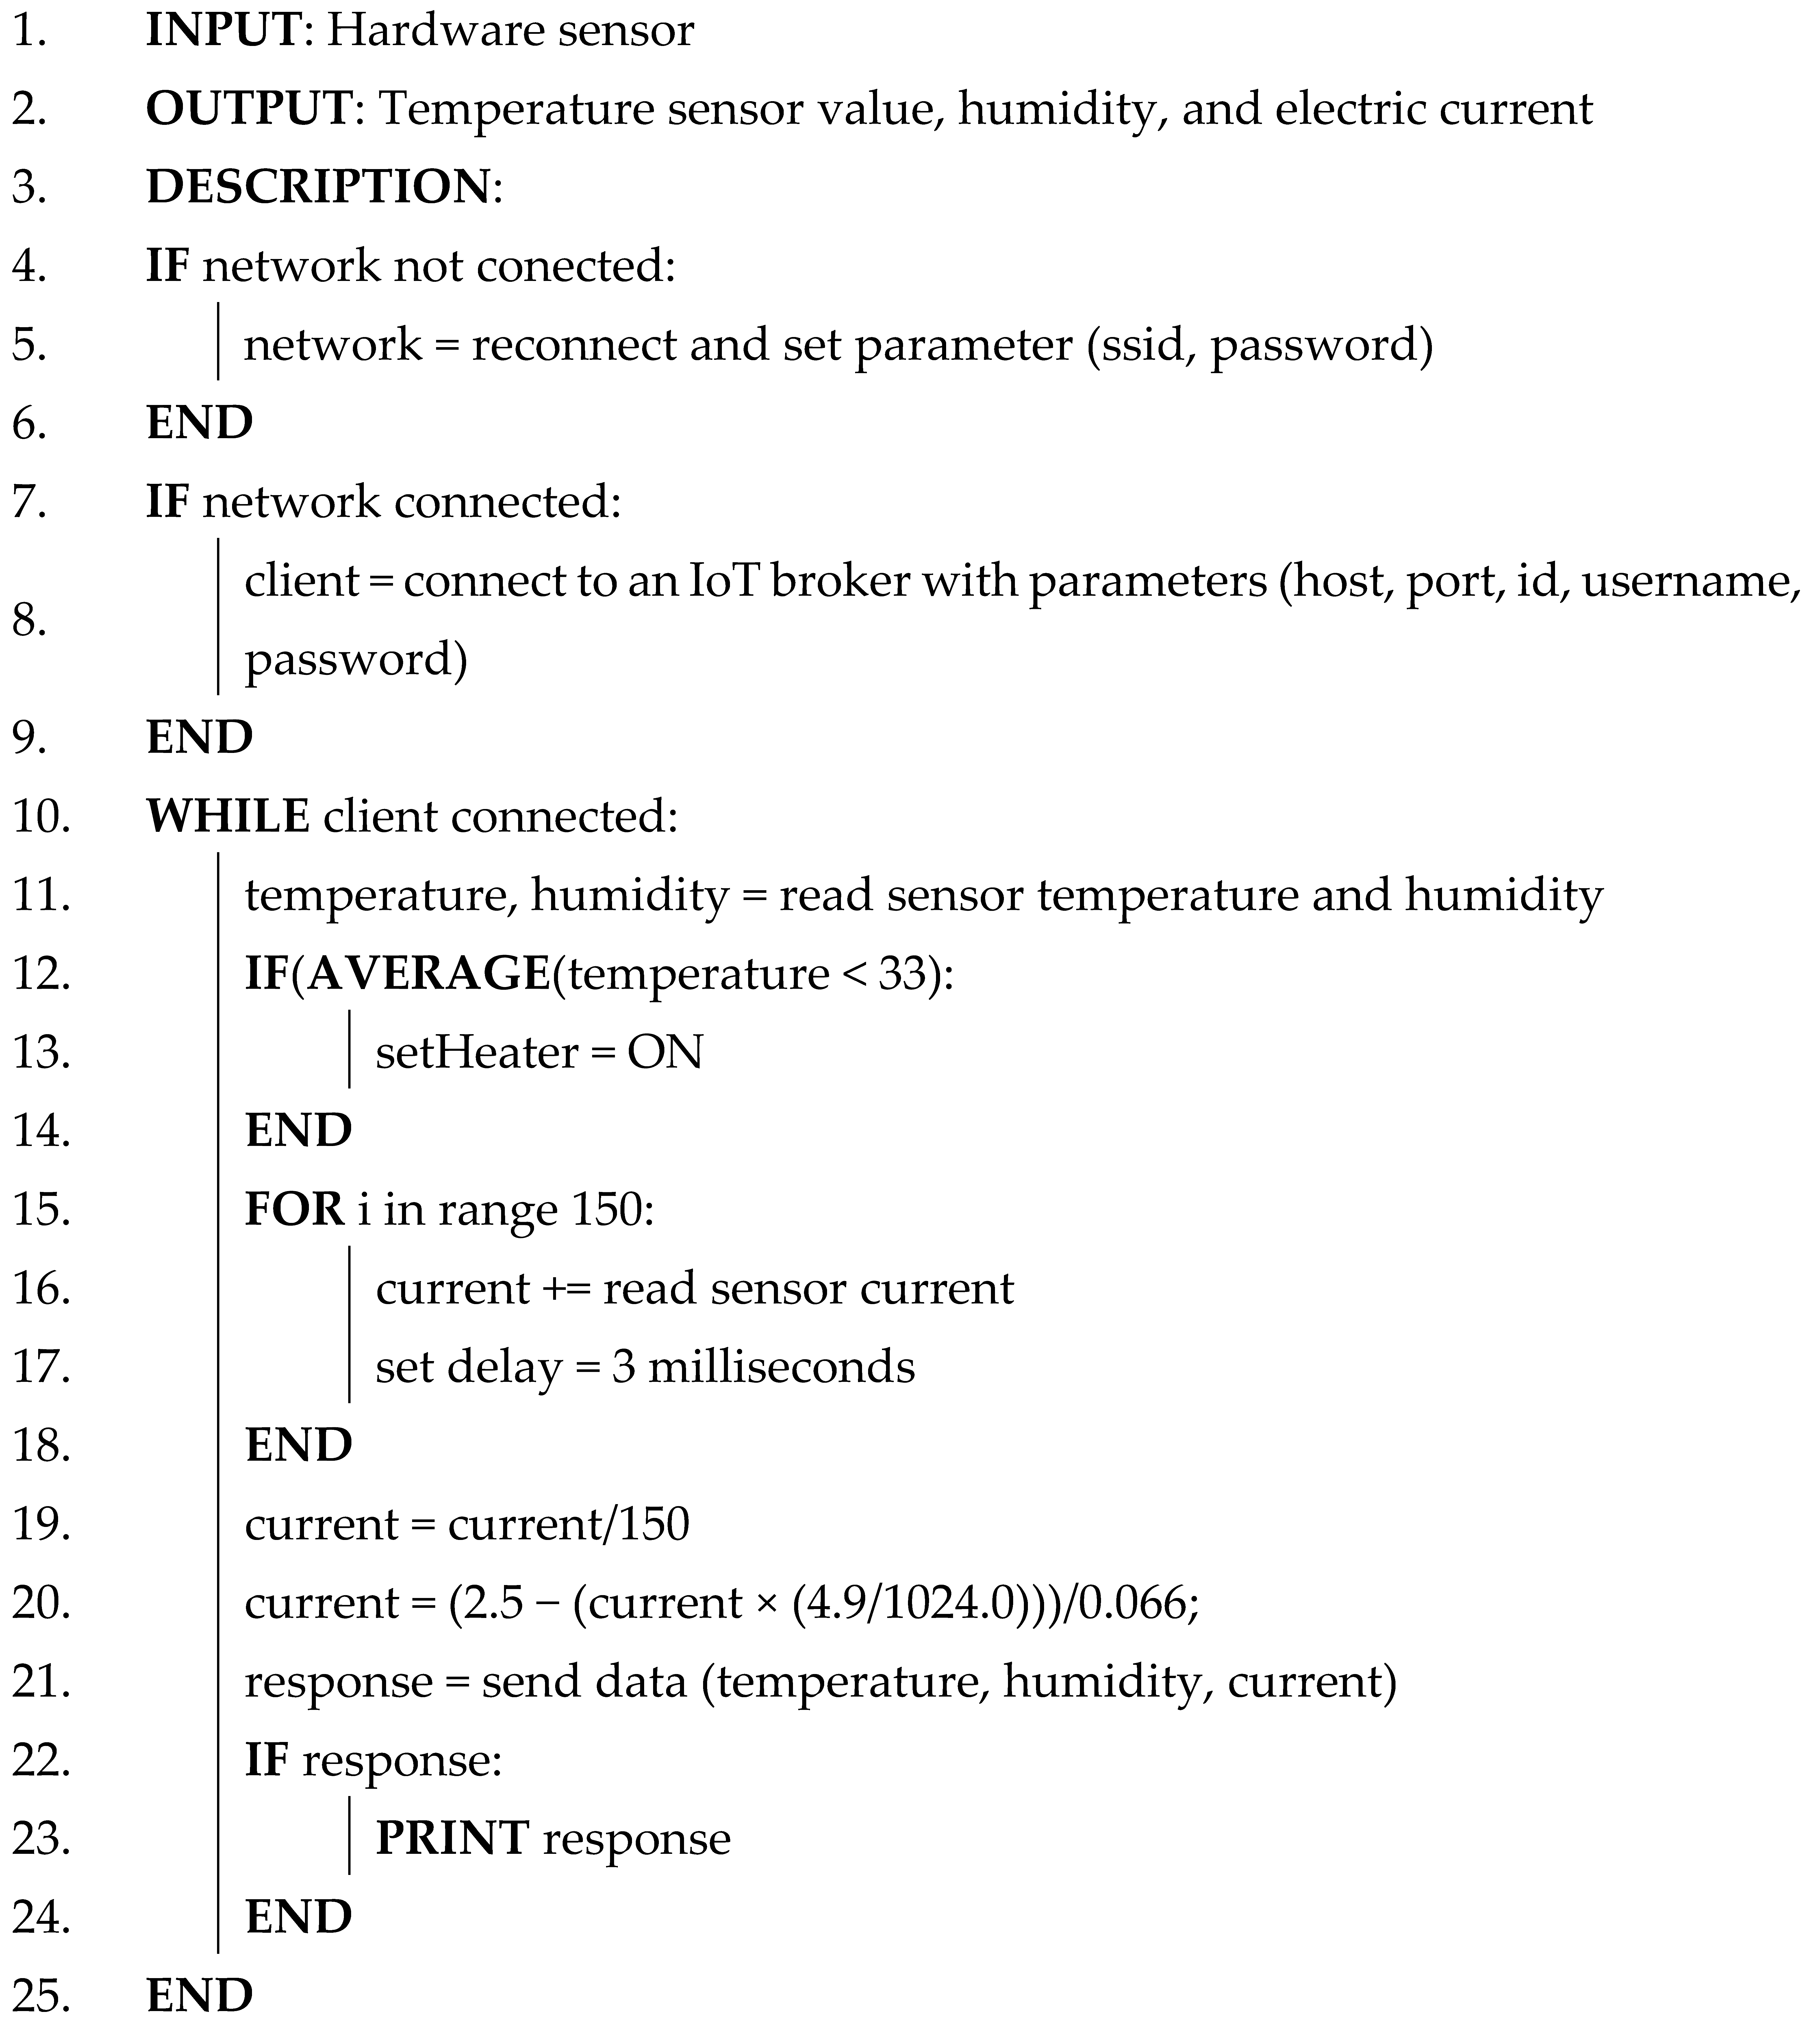
Applsci 13 12953 i001

3.3. Network Design

The network design is explained in Figure 4. The communication process between objects or incubators uses the MQTT protocol and a WiFi network to transmit sensor data. Communication using the MQTT protocol involves the terms subscribe and publish. An IoT broker functions to receive messages from publishers and then distribute them to subscribers who have subscribed to relevant topics [29].
Subsequently, the data on the broker are subscribed to by clients and then displayed in the web application or stored in the database. In this research, the IoT broker is installed on a Raspberry Pi mini-computer, which also functions as an Apache server for the web application [17]. Mosquitto is used as the MQTT broker service for the IoT broker [30]. Several configurations on the IoT broker, such as port settings, authentication, and host settings, must be configured in advance.

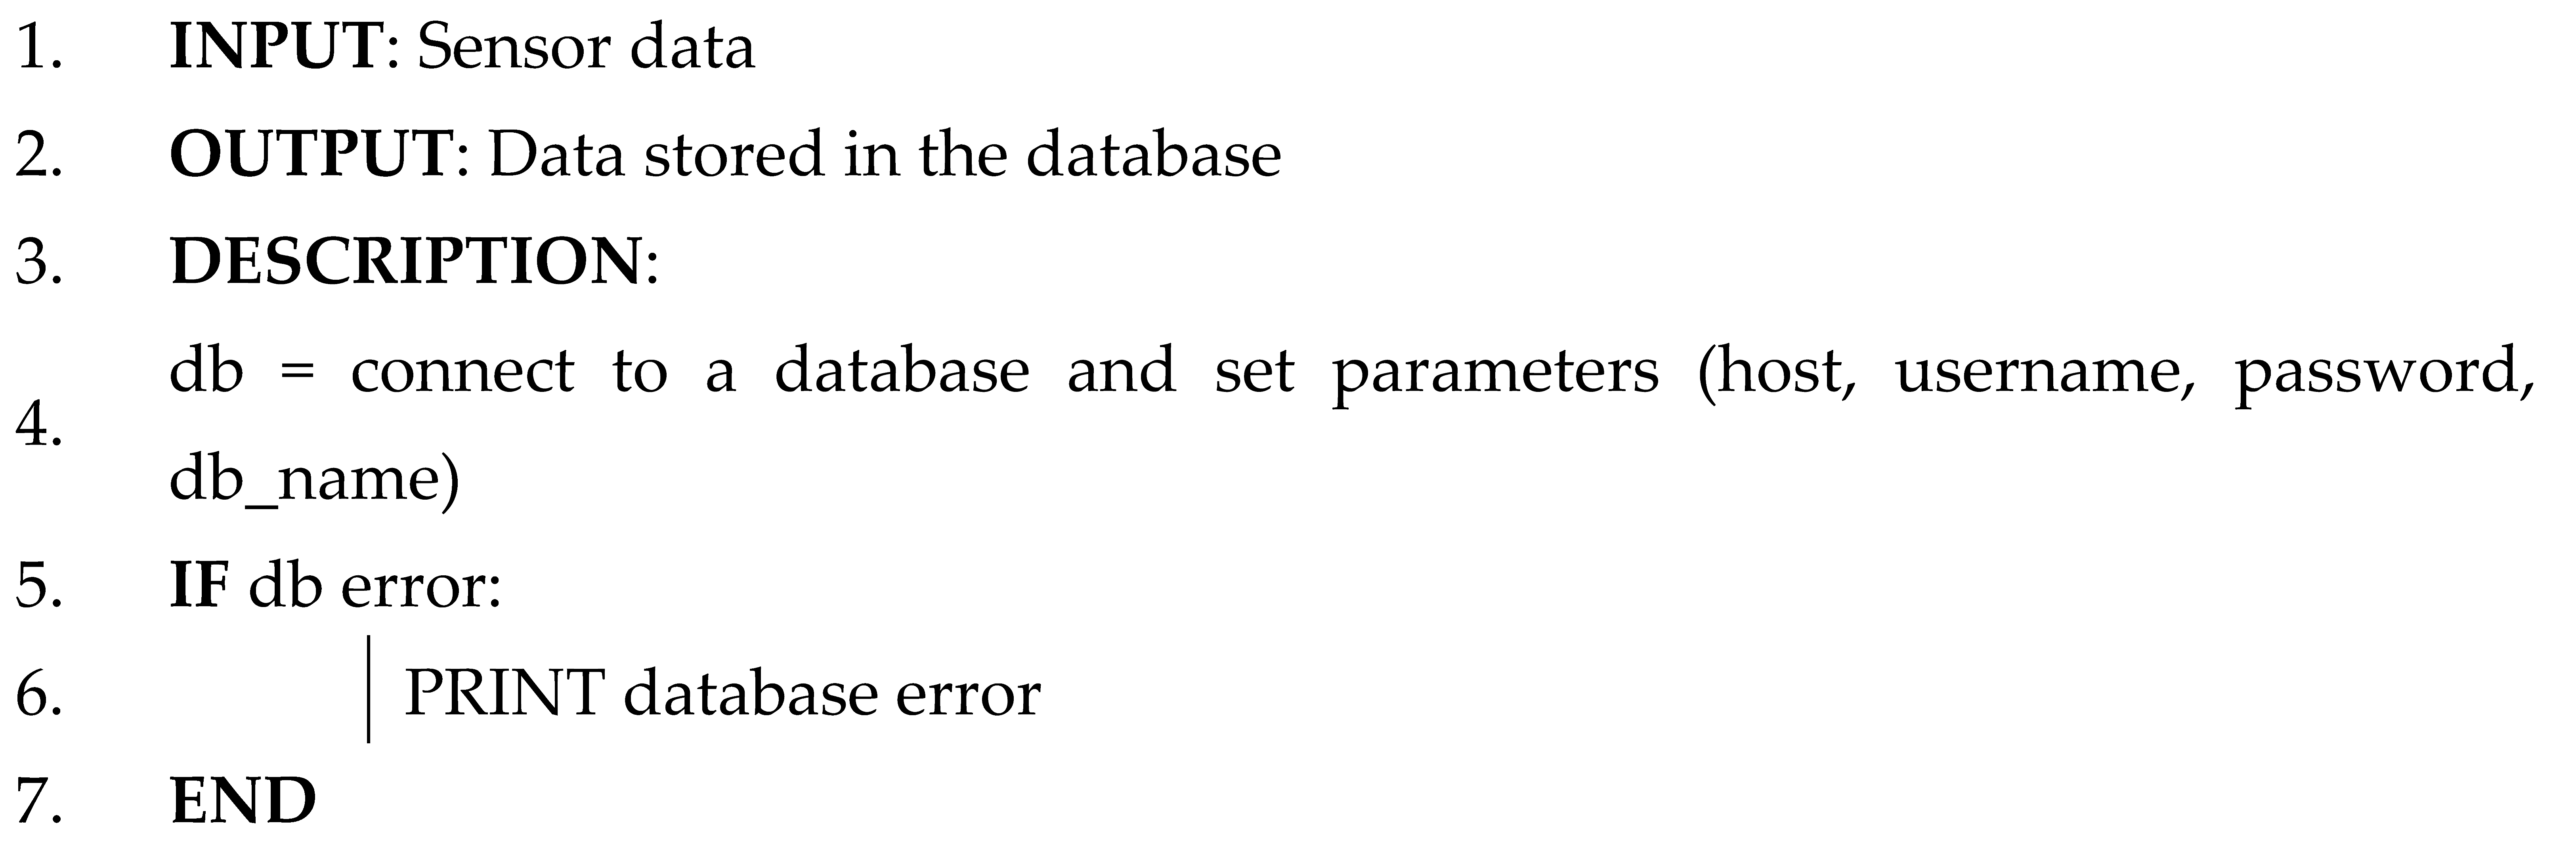
3.4. Data Management

3.4.1. Database

In this study, the sensor measurement data from the incubator are sent to the broker and then processed by the system for storage in the database. The database application used in this research is MySQL, which is one of the relational database management systems (DBMS) that makes it easy to manage structured data as tables which can have relationships with each other [18,31]. In storing sensor data, the data must go through a filtering process, which is carried out by setting upper and lower threshold values to improve the quality of the data stored in the database.
This process is carried out with the aim of filtering out non-outlier data. The process is controlled by the filter low and filter high parameters in Algorithm 2, at Lines 10 and 11. The values of these parameters have been determined based on the characteristics of the DHT11 sensor device, which has a temperature measurement range of 0 °C to 50 °C and humidity range of 20% to 90%, as presented in Table 2. The methodology used to determine these threshold values is based on the range of sensor characteristic values [27] and standard temperature values for the incubator range from 32 °C to 35 °C [32]. If the measurement point of sensor data is below the filter low or filter high threshold, it will be identified as an outlier, as in Lines 14–19 of Algorithm 2.
Algorithm 2: Data management
Applsci 13 12953 i002a
Applsci 13 12953 i002b
After going through the filtering process, the data are separated based on the data topic and then stored in variables for storage. A description of the variable structure and sensor data types can be seen in Table 3, and the data-management program is shown in Algorithm 2. After that, the data stored in the database can be accessed for analysis and monitoring purposes. The data in the database are used as a dataset in the analysis process.

3.4.2. Dataset Description

This research uses the sensor data stored in the database as the dataset. Based on the variable data in the database, this dataset consists of 10 attributes corresponding to the sensor data. The attributes of this dataset are T_1, T_2, T_3, T_4, Electricity, RH_1, RH_2, RH_3, RH_4, and date. The attributes T_1, T_2, T_3, T_4 are obtained from the temperature variables (temperature_1, temperature_2, temperature_3, temperature_4), and RH_1, RH_2, RH_3, RH_4 are obtained from the humidity variables (humidity_1, humidity_2, humidity_3, humidity_4). Additionally, the electricity attribute is obtained from the electricity variable. Detailed information about the dataset attributes is shown in Table 4.
r = n i = 1 n   x i   y i i = 1 n x i   i = 1 n y i   n   i = 1 n x i 2 i = 1 n x i 2 n   i = 1 n y i 2 i = 1 n y i 2
Next, after obtaining the dataset, an analysis is conducted to determine the correlation coefficient (r) between attributes using Equation (1) [33]. Data correlation analysis is essential to understand the relationship between the target attribute, in this case, the electricity attribute, and other attributes [34]. Knowing the correlation coefficient values between the target and other attributes makes model development or training easier. Attributes positively correlate if the correlation value approaches 1 or 0 < r < 1. Conversely, attributes have a negative correlation if the correlation value falls within the range −1 < r < 0, and if the correlation value approaches 0, it indicates no correlation between the attributes.

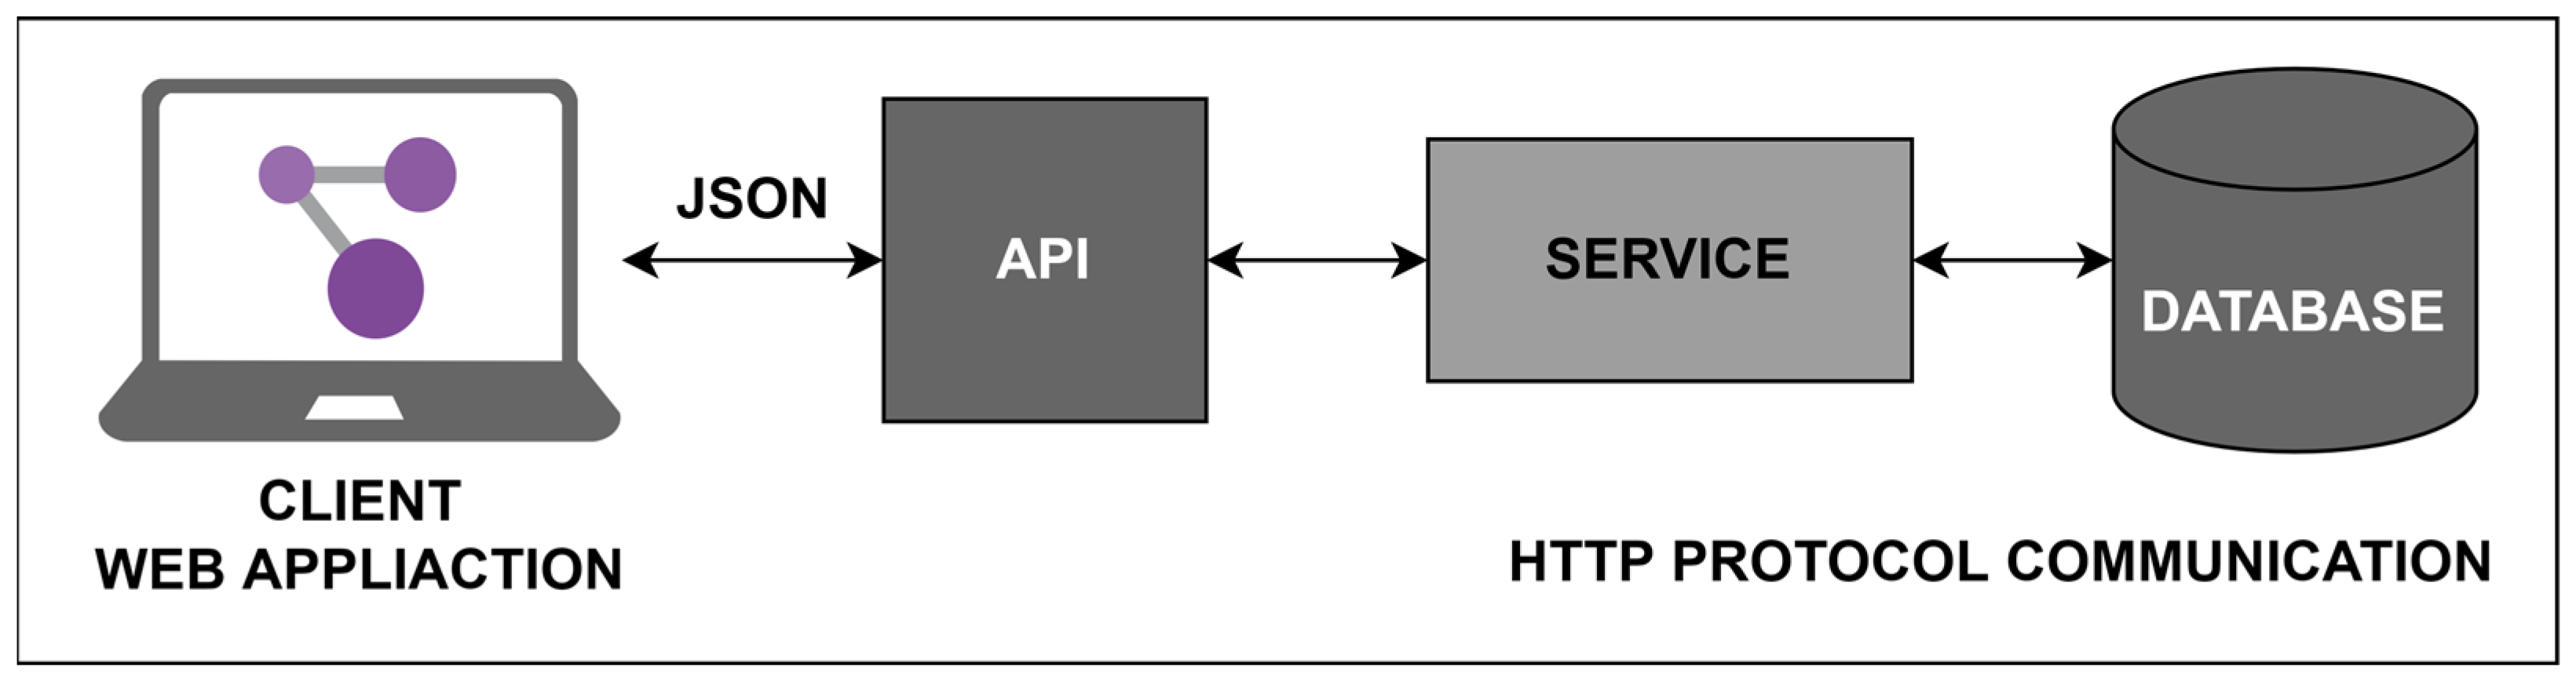
3.5. Software Design

The software design is illustrated in Figure 5. The software architecture design process involves several components: the database, gateway service, an application programming interface (API), and web application. MySQL version 8.0.30 is utilized as the database to store sensor data, falling under the category of relational databases [35]. Clients requesting data from the database must go through the gateway service system. Therefore, the gateway service is responsible for interacting with clients and managing all client data requests via the API [2]. The generated data will be in JavaScript Object Notation (JSON) format to facilitate communication with the web. The JSON format is favored for its lightweight and structured nature [36].
Furthermore, the web application design is implemented with a responsive interface, meaning it can be accessed on various screen types. The web interface also includes charts and tables to visually represent data from the database. The development of this web application involves several programming languages, including CSS version 3, JavaScript version ES13, PHP version 7.2.27, and Python version 3.10.6 [37]. The software programming process is illustrated in Algorithm 3.
Algorithm 3: Web application
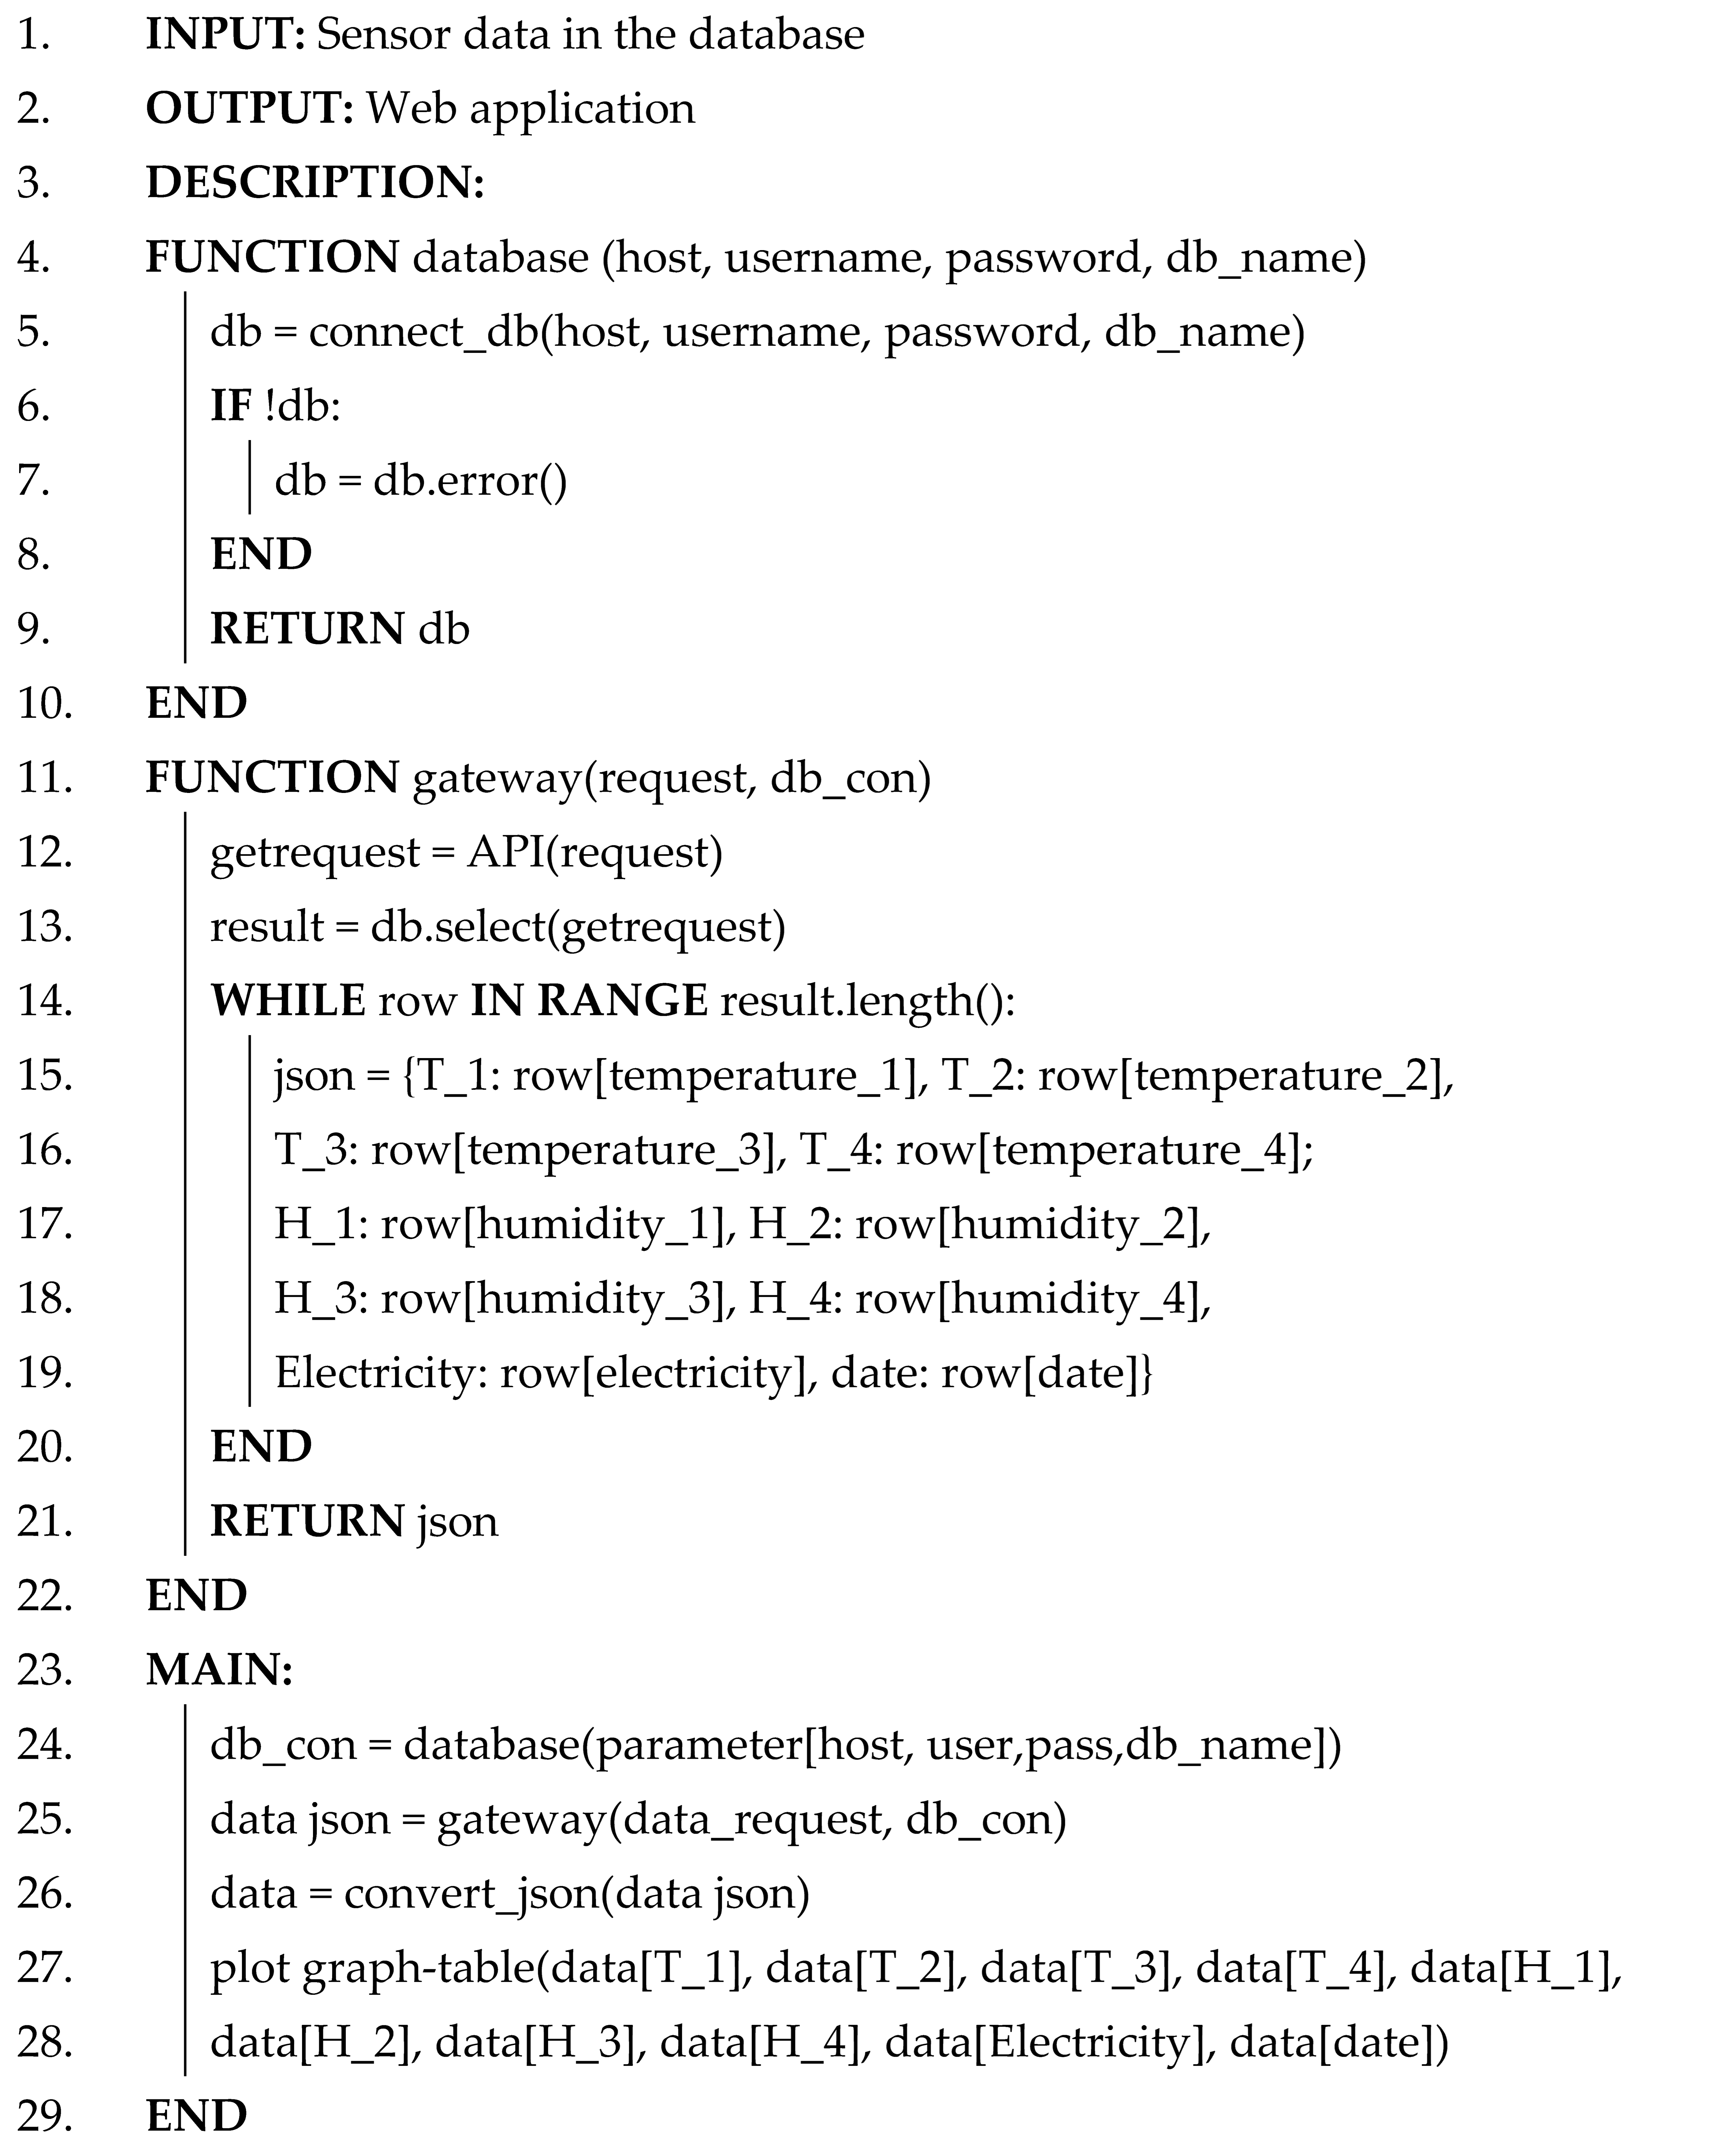
Applsci 13 12953 i003

3.6. Model Design

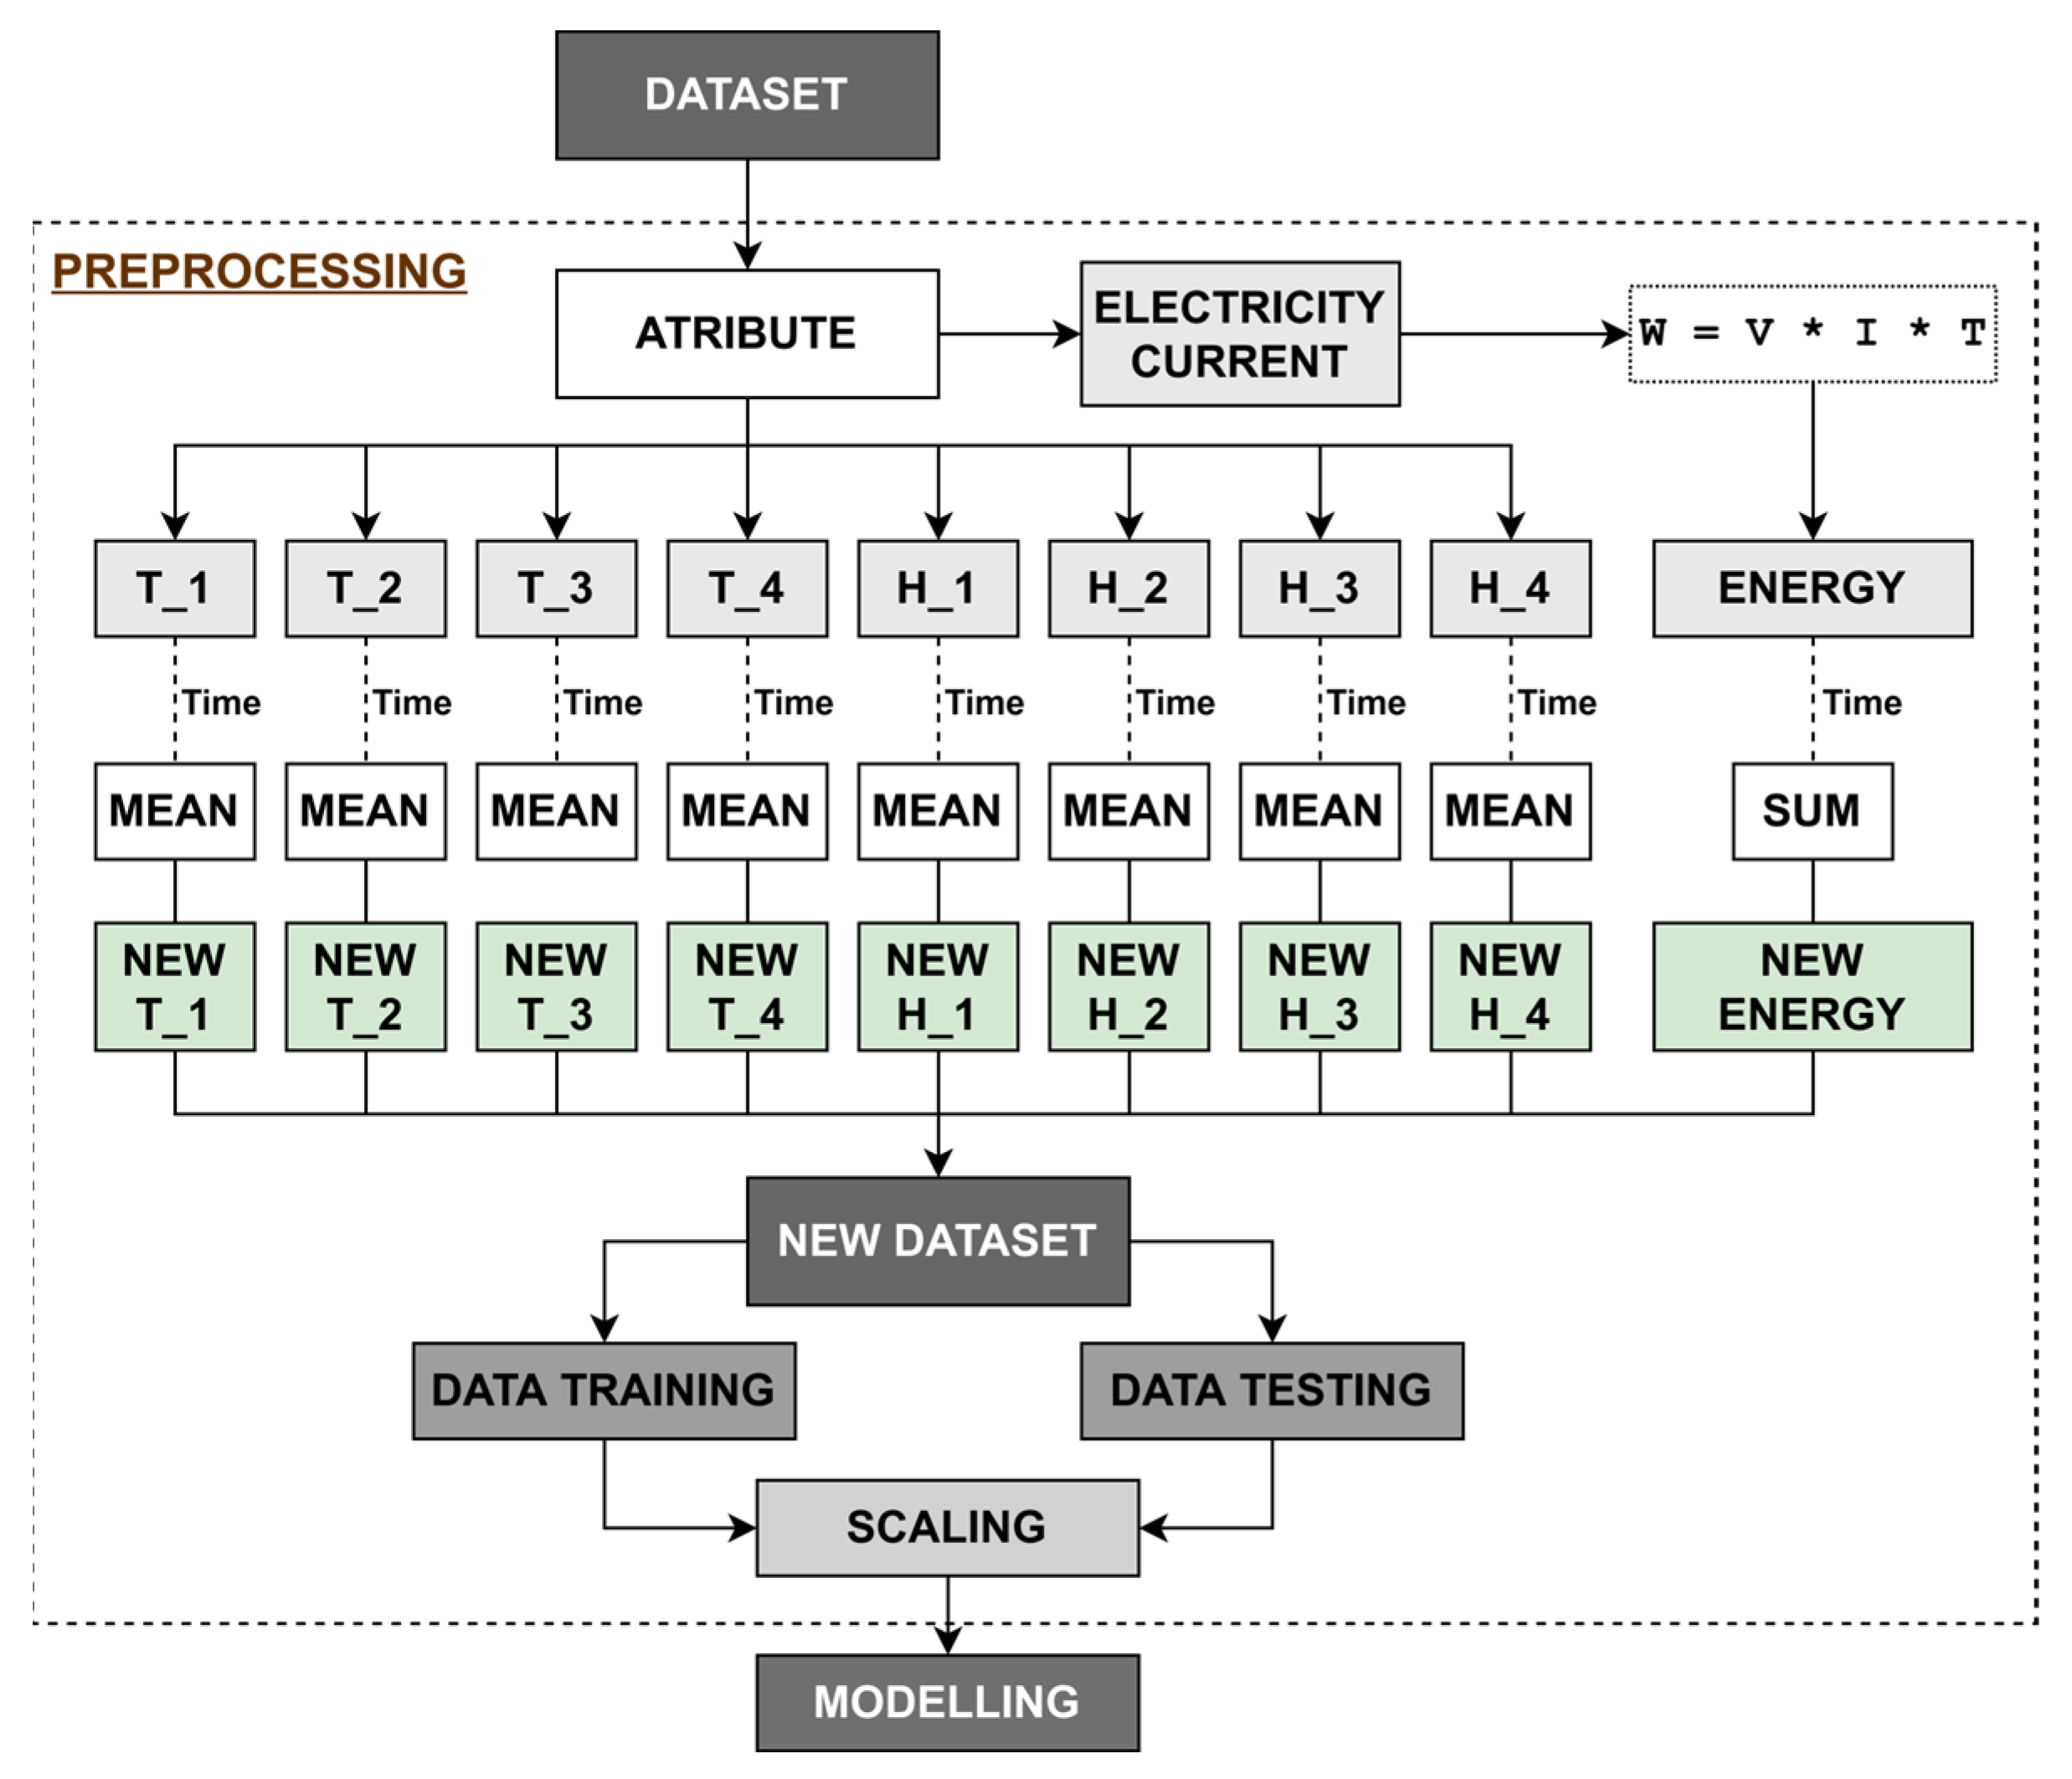
3.6.1. Preprocessing

Figure 6 depicts the dataset preprocessing process performed in this study. Dataset preprocessing comprises a series of steps on raw data to ensure their quality and suitability before they can be used for analysis or modeling. In this research, the dataset includes temperature, humidity, and electric current data, with attributes as shown in Table 4. Subsequently, this dataset is processed by calculating the average values of temperature and humidity attributes over time (T). Meanwhile, the electric current attribute (I) is calculated to obtain its energy value (W) by multiplying voltage (V) with electric current and time, as indicated in Equation (2) [38]. As a result, a new attribute called energy is added to the dataset, rendering the electric current attribute obsolete. Unlike temperature and humidity attributes with averaged values, the energy attribute is summed according to periods (T).
W = V × I × T
After obtaining the new dataset, the next step is to scale the training and testing data. The fitting process is carried out in the training data by applying the MinMaxScaler method [39]. This method helps to transform the data range to distribute it on a scale between 0 and 1 [40]. The use of MinMaxScaler on the training data is intended to balance the influence of each variable on the model. Additionally, the testing data are scaled to adapt the testing data to the same transformation as the training data, and this is performed to maintain a balance between the training and testing data.

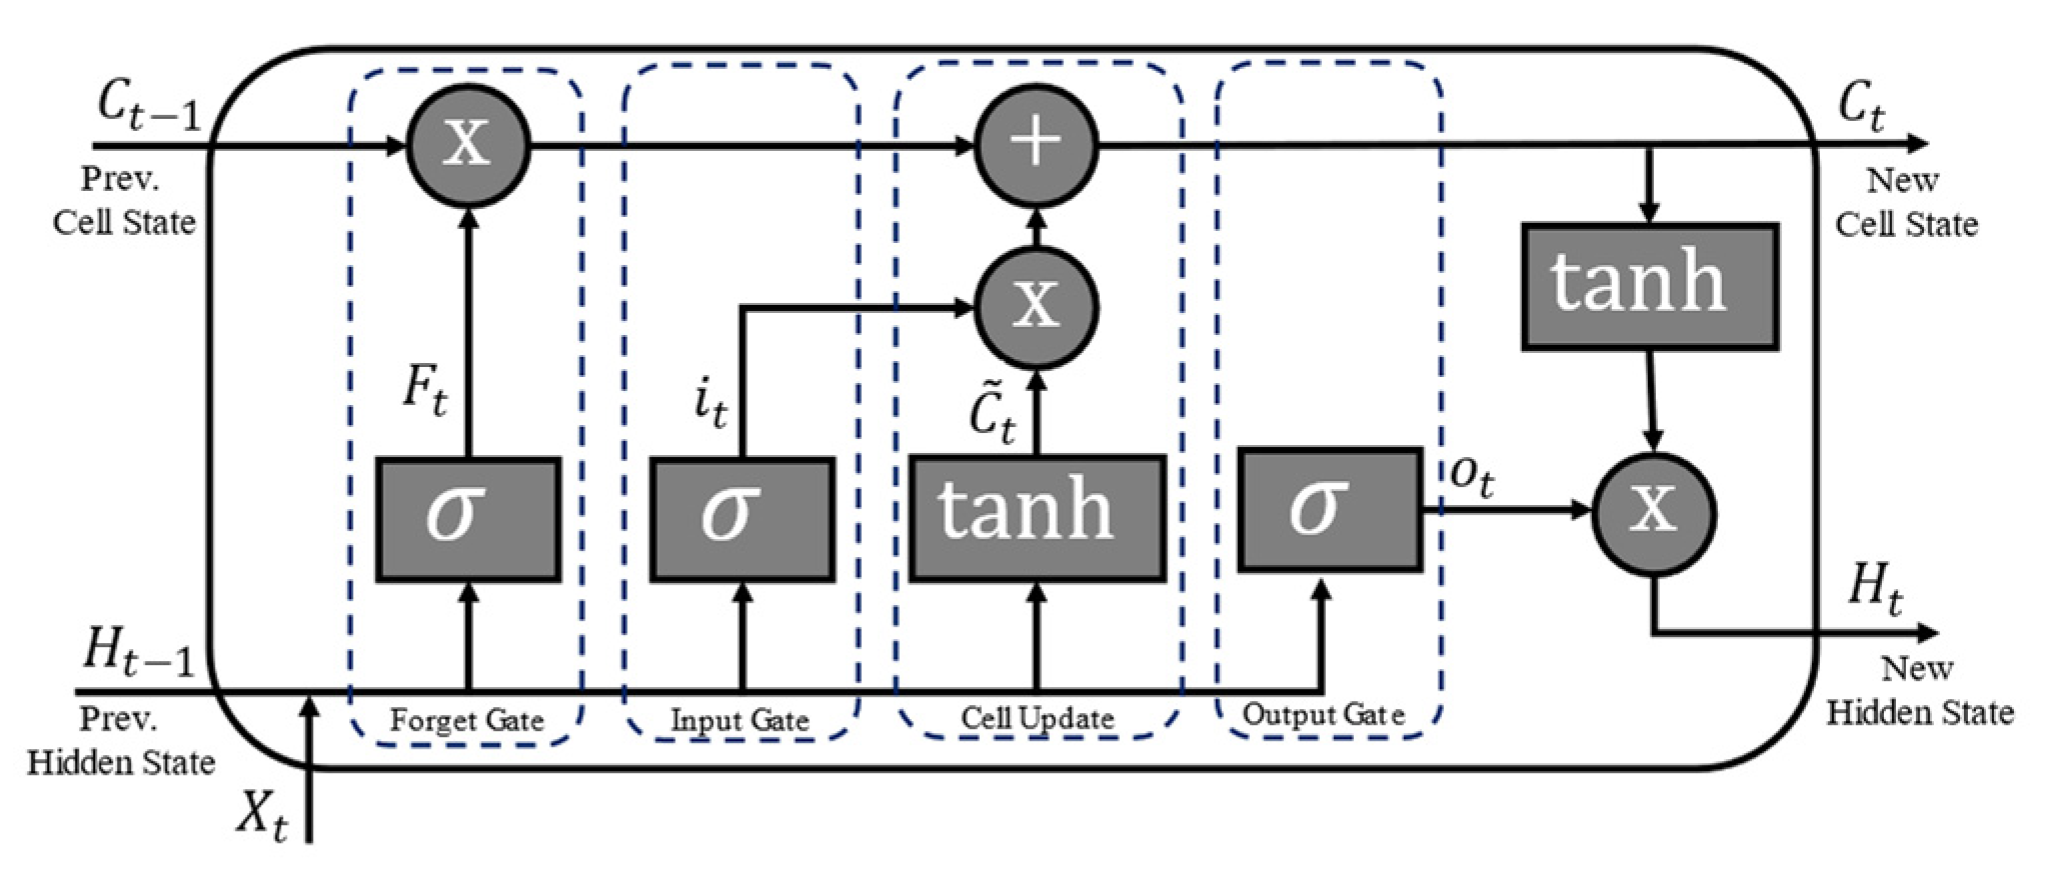
3.6.2. Long Short-Term Memory (LSTM)

LSTM [41] is used in this research to address short-term and long-term dependency issues in sequential data. As a recurrent neural network (RNN) type, the LSTM workflow uses gates and memory cells to retain information over extended periods. There are three types of gates in LSTM: the input gate, the forget gate, and the output gate. In the context of this research, the LSTM method is employed to create a model based on the dataset obtained from sensor data.
The modeling process to recognize data patterns begins by determining the appropriate number of layers, neurons, and activation functions. The model’s performance is evaluated using test data to measure its effectiveness. The mathematical calculations depict the operations within LSTM that enable it to recognize patterns in sequential data and maintain and manipulate information over extended periods through Equations (3)–(10). The architectural design of the LSTM is illustrated in Figure 7 [33].
F t = σ H t 1 , X t   .   W f + b f
I t = σ H t 1 , X t   .   W i + b i
C t ˜ = tanh H t 1 , X t   .   W c + b c
C t = ( F t   .   C t 1 ) + ( I t   .   C t ˜ )
O t = σ ( W o   .   H t 1 , X t ) + b o
H t = O t   .   tanh ( C t )
σ x = 1 1 + e x
tanh x = e x e x e x + e x
Based on the structure and equations, LSTM explains that the input values of weights are represented by W f , W i , W c , and W o . The variable t indicates the current time, while t 1 represents the previous time. Furthermore, b f , b i , b c , and b o are biases. The symbol X refers to the input, H to the output, and C to the cell state. The notation σ describes the sigmoid function, producing inputs between 0 and 1. A value of 0 indicates that no values are allowed to pass to the next stage, while a value of 1 signifies that the output can fully enter the next stage. Additionally, the hyperbolic tangent function ( tan h ) is used to address gradient loss during the training process.

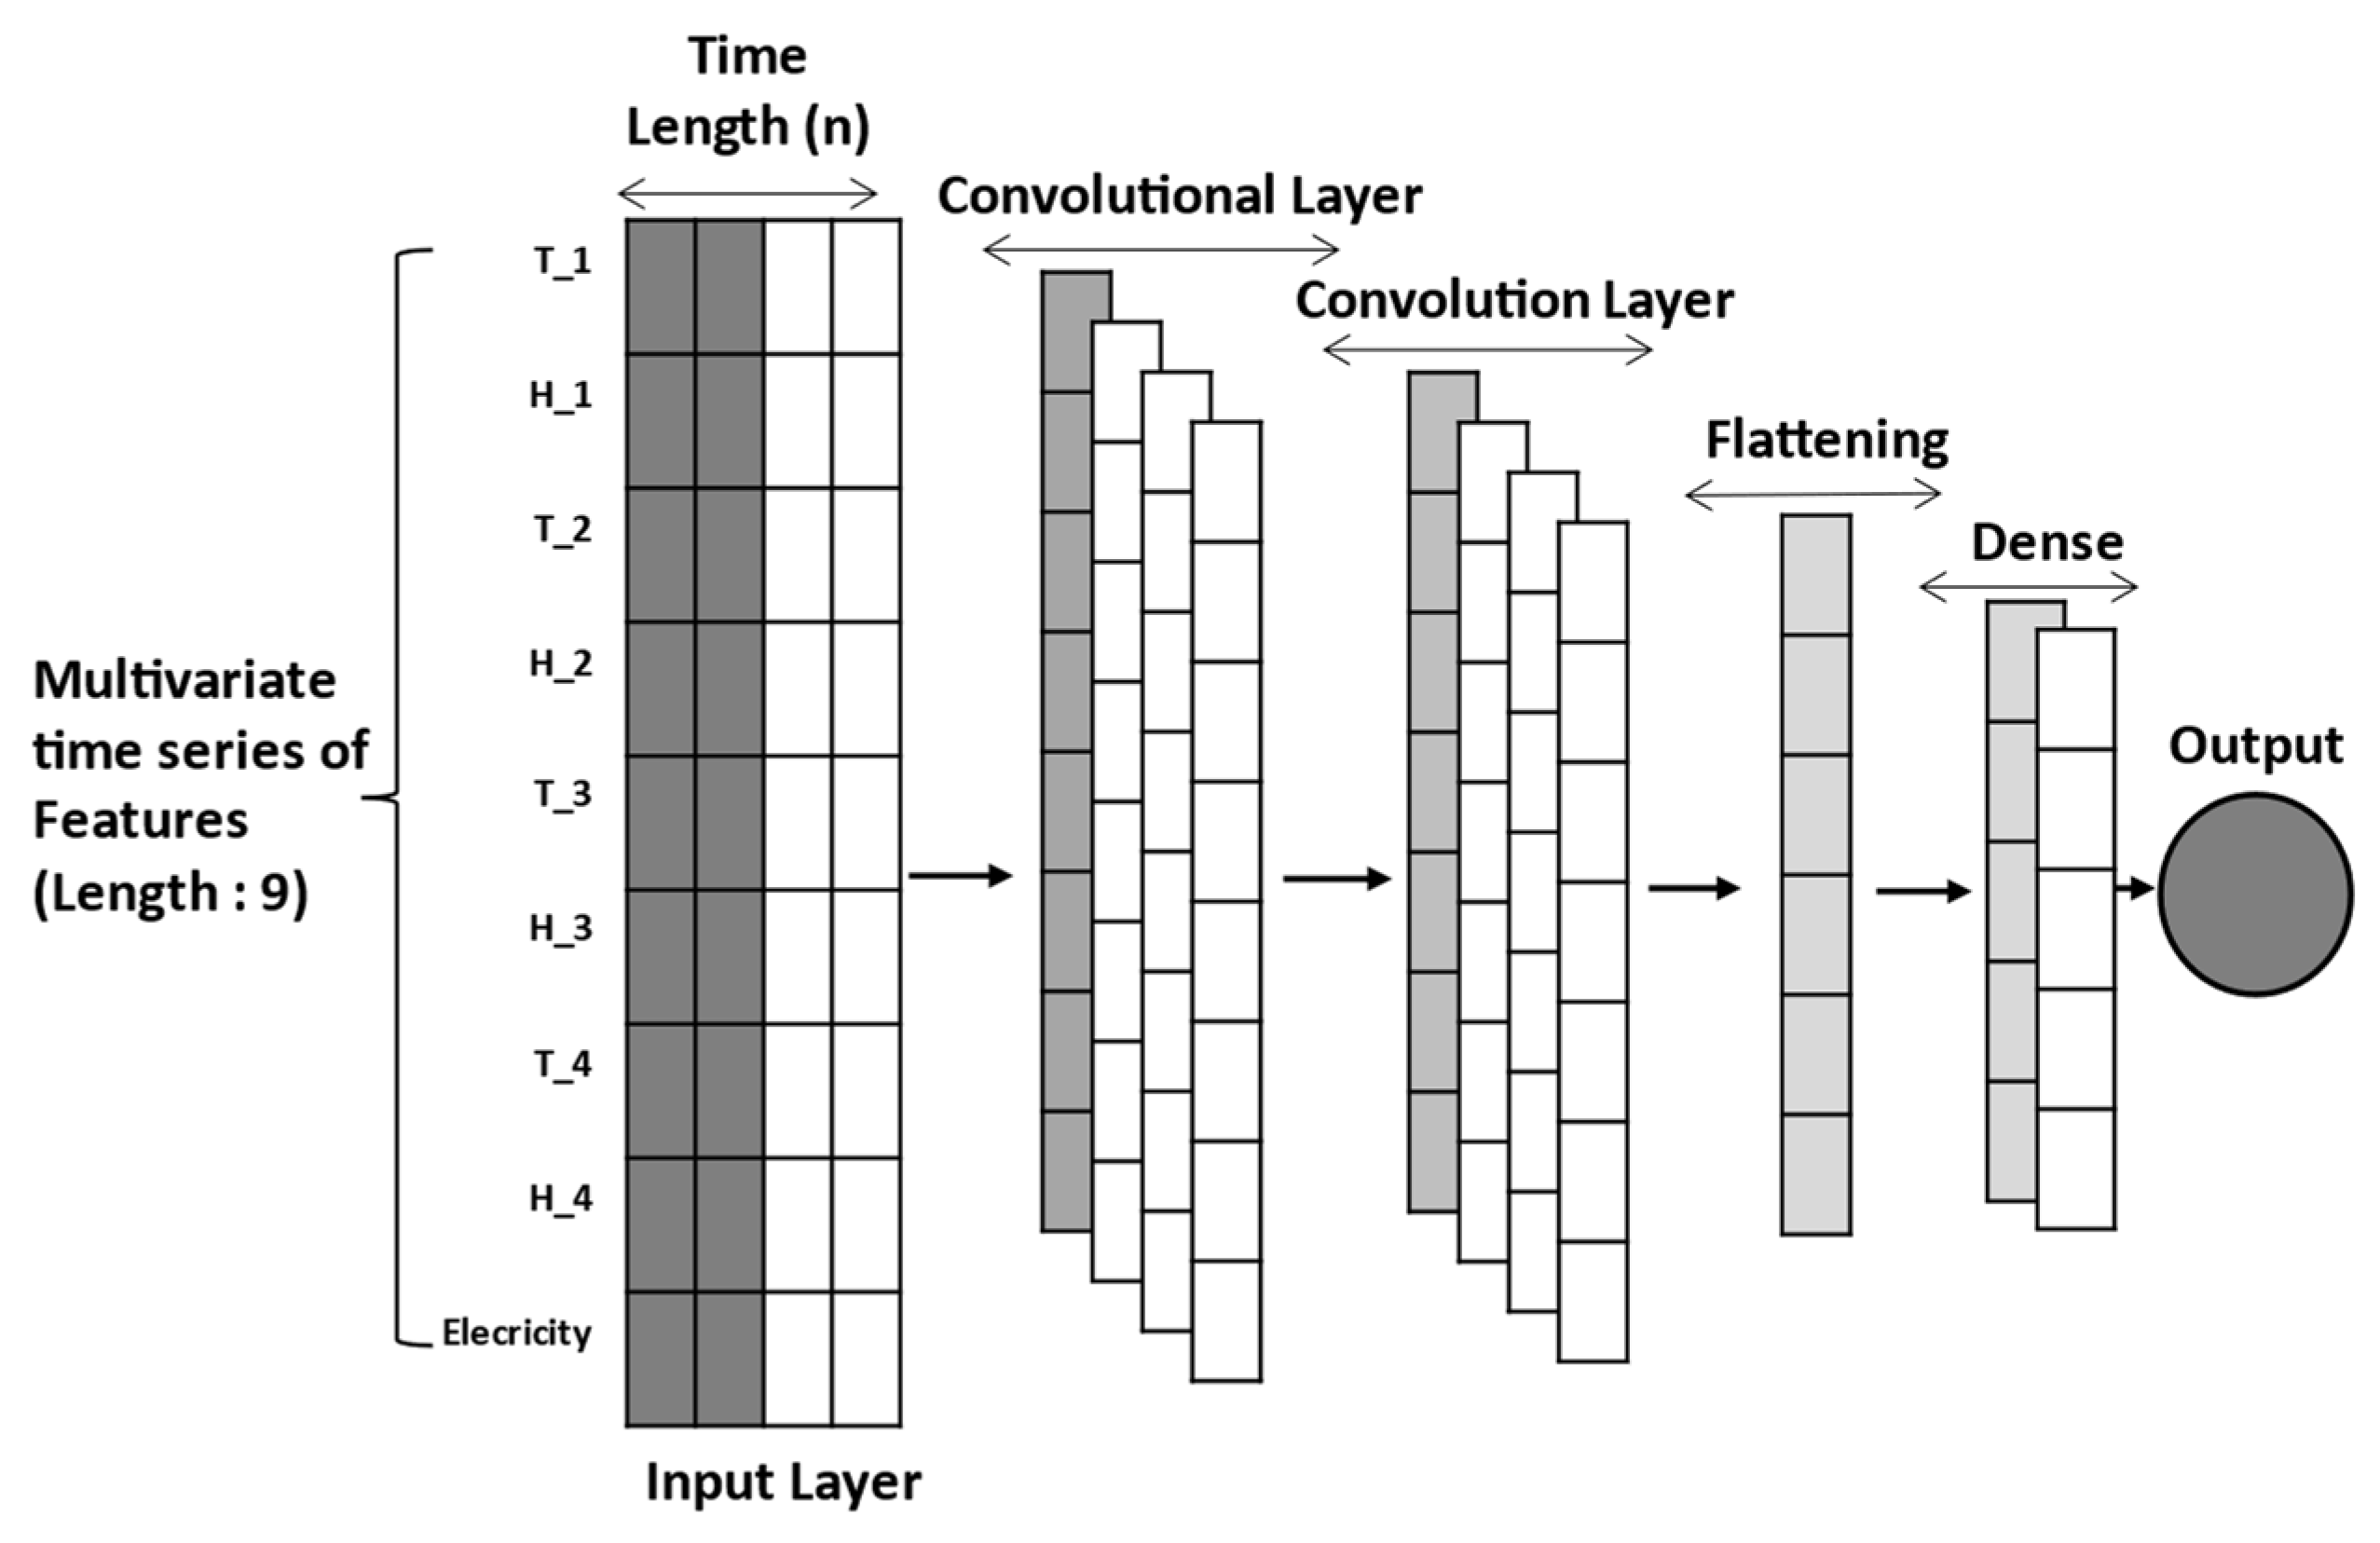
3.6.3. Convolutional Neural Network (CNN)
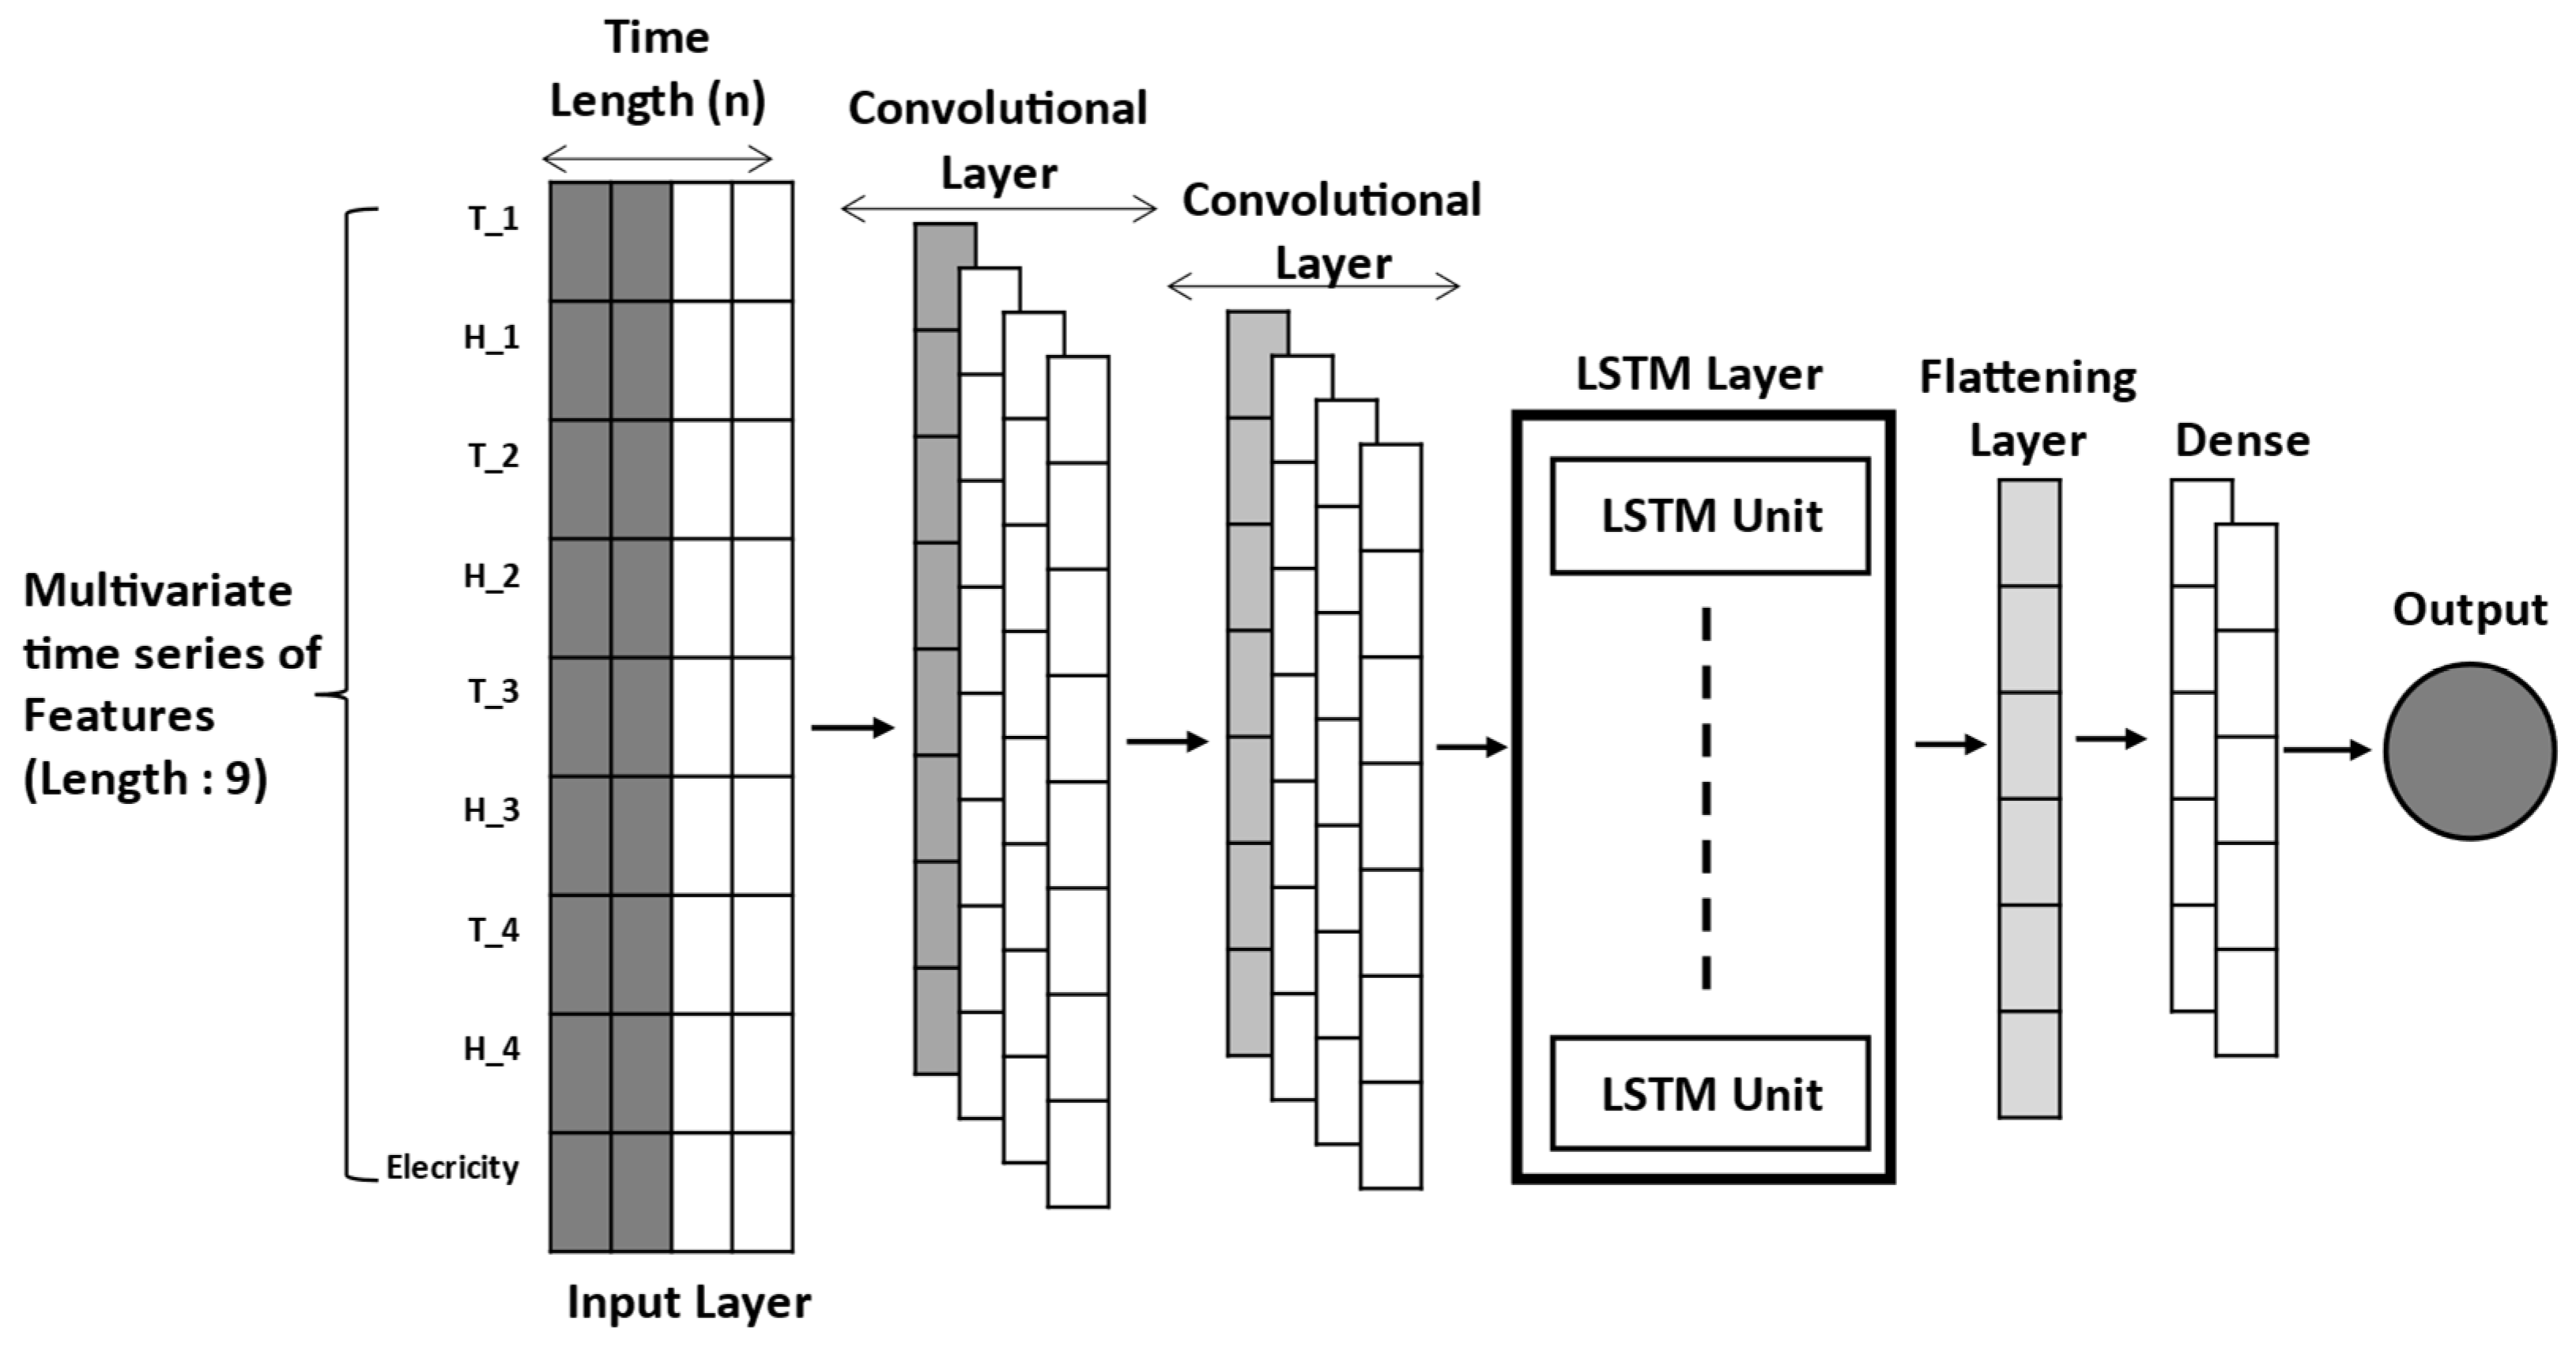
The one-dimensional convolutional neural network (1D-CNN) [42,43] is an artificial neural network architecture used for processing one-dimensional data, such as time-series data. This research applied a 1D-CNN architecture consisting of several key layers, as shown in Figure 8. These layers consist of an input layer, which functions to receive input data consisting of nine fields, namely T_1, H_1, T-2, T_3, H_3, T_4, H_4, and electricity. Five timesteps (lookback) are used in the input to predict future energy usage. Next, the convolutional layer is the main layer used to extract features from the data. In this study, we set several values for neurons in each of Convolutional Layer 1 and 2 and use ReLU activation. This is followed by the flattening layer process, which is used to transform the data into a one-dimensional vector. Finally, the dense layer process with 10 neurons is responsible for processing data representations and producing the output of the modeling process. In Table 5, information about the parameters or properties of each layer is displayed. Mathematically, the 1D-CNN method can be expressed in Equation (11). In Equation (11), the input vector x with length n is convolved with the filter vector ω with length l , resulting in the one-dimensional output layer c [44,45].
c n = f i = l l ω i x n i + b

3.6.4. CNN-LSTM

Figure 9 shows the architecture of the method used in creating a predictive model for energy consumption by combining two techniques: 1D-CNN and LSTM [46,47,48]. The modeling process consists of three main stages: input, processing, and output. In the input stage, the process begins by using the CNN method, which consists of several conventional layers with 50 neurons each. The input data consist of the fields: T_1, H_1, T-2, T_3, H_3, T_4, H_4, and electricity. The CNN is used to extract features from the input data. Next, the results from the CNN are used as input for the LSTM method, which consists of two layers with 50 neurons each. LSTM is used to understand the sequential patterns of the data in the future period. Each layer uses the ReLU activation function. Furthermore, before generating the output, the flattening process is performed, followed by the dense layer stage with 10 neurons. This dense layer is responsible for processing the previously extracted data representations and generating energy usage predictions. Furthermore, during the model training process, optimization is performed using the Adam algorithm. A summary of the properties of each layer can be seen in Table 6.

3.6.5. Activation Function

Activation functions transform inputs into outputs that are then passed to the next layer of neurons. One of the activation functions in deep learning is the rectified linear unit (ReLU) [49]. The working process of the ReLU activation is as follows: if the input value is positive (α > 0), then the output value is equal to the input value, which is expressed as f(α) = α. Conversely, if the input value is negative (α ≤ 0), the output value is always 0, expressed as f(α) = 0. ReLU activation is highly computationally efficient and does not suffer from the vanishing gradient problem. In general, the equation for ReLU activation is as shown in Equation (12) [50]:
f α = max 0 ,   α

3.6.6. Evaluation Performance Model

The evaluation process is carried out to determine the extent to which the model matches the data used and how well the model produces predictions. This research used four evaluation techniques for the model evaluation process, each with its function. The methods used are the root mean squared error (RMSE), mean absolute error (MAE), mean absolute percentage error (MAPE), and mean squared error (MSE) [42].
The RMSE technique, as shown in Equation (13), measures the error between predicted and actual values. Meanwhile, MAPE, as shown in Equation (14), is used to calculate prediction errors as a percentage. As Equation (15) indicates, MAE measures the error between predicted and actual values, considering tolerance for outliers. Additionally, MSE is used to measure the difference between predicted values and actual values. The MSE equation is presented in Equation (16) [51,52].
In this research, the symbols in the evaluation equation can be explained as follows:
R M S E = i = 1 n y i y i ˜ 2 n
M A P E = 1 n i = 1 n y i y i ˜ y i × 100 %
M A E = i = 1 n | y i y i ˜ | n
M S E = i = 1 n y i y ˜ i   2 n
n = Number of data points;
y i = Actual values;
y i ˜ = Predicted values;
Σ = Summation of all data.

3.6.7. Data Visualization
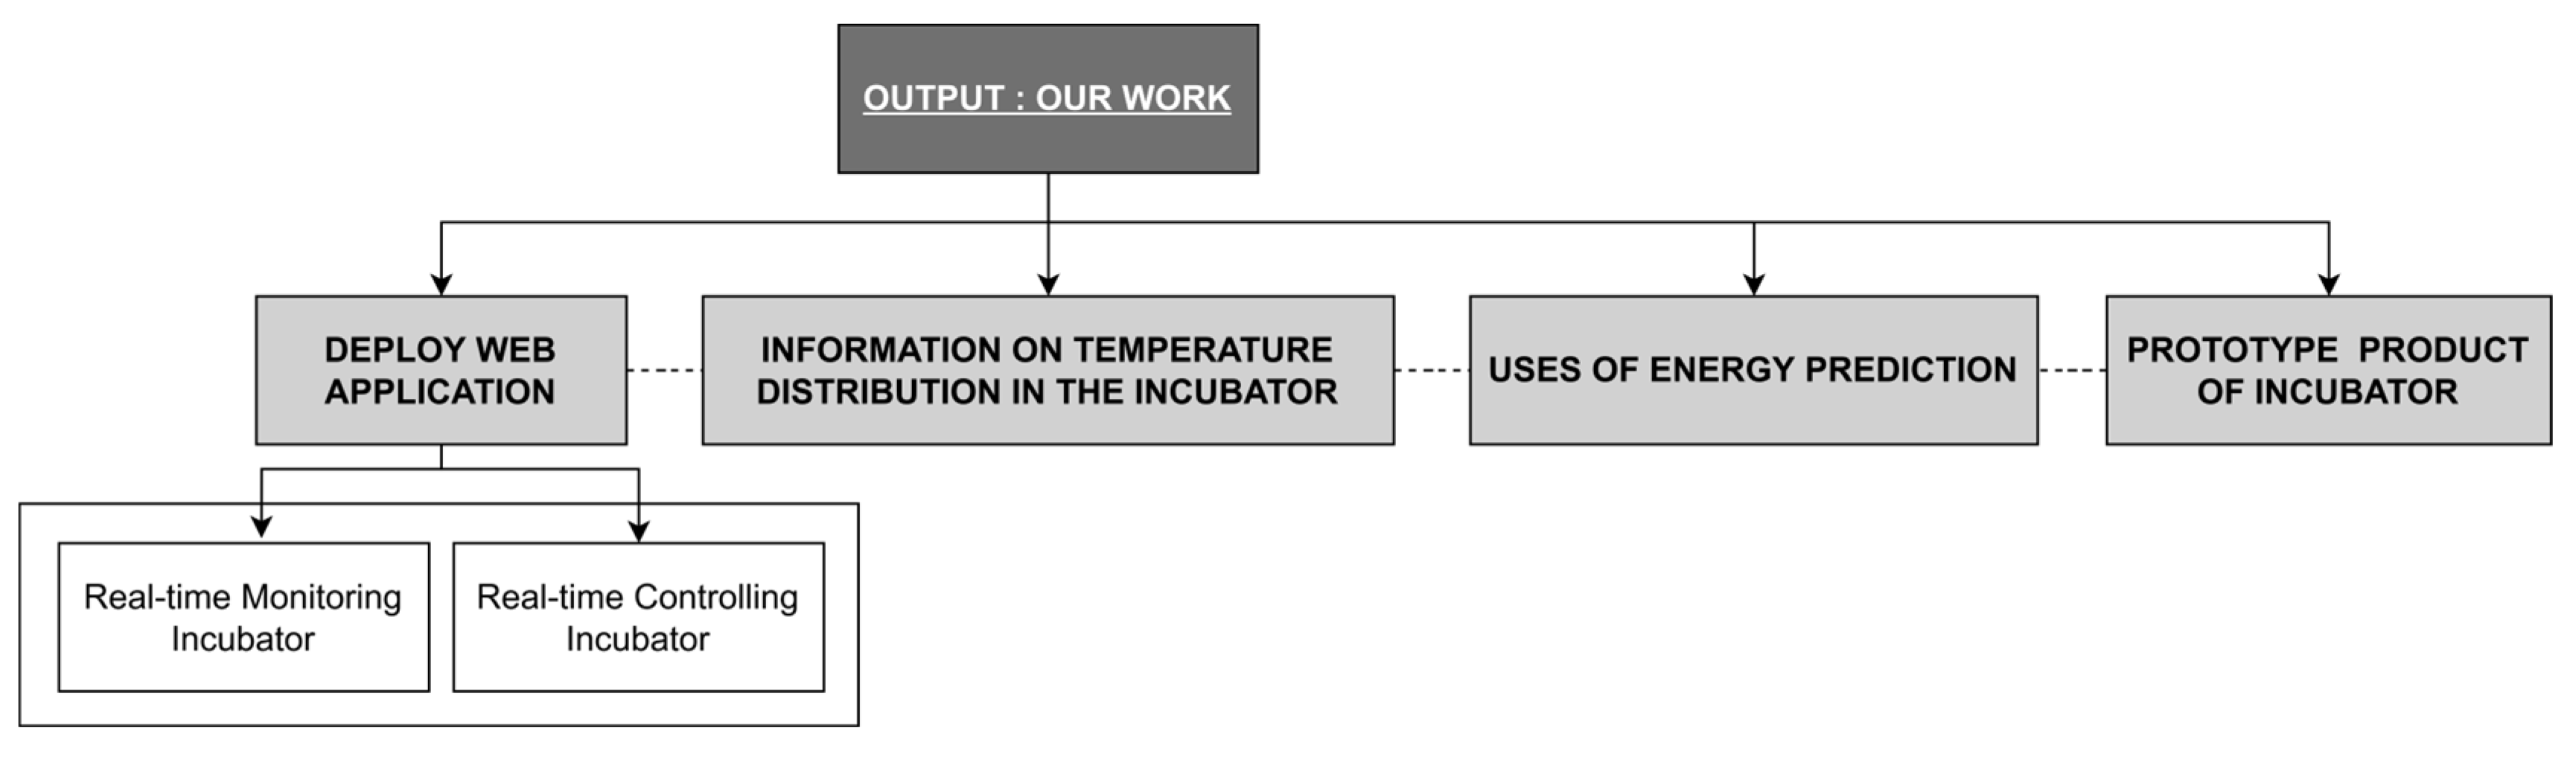
Data visualization is transforming data into visual information or other graphical forms. This research transforms the temperature data inside the incubator into visualizations to understand temperature patterns and distributions, making the information more easily understandable [53]. During this process, data from four temperature sensors on each side of the incubator are visualized in three dimensions (3D) with coordinates (x, y, z). The creation of 3D graphs is aided by the Matplotlib library, one of the libraries in the Python programming language. The type of visualization used in this research is surface visualization, which helps to create a three-dimensional representation corresponding to the temperature data. Furthermore, adjustments are made to set the color scale, axis labels, and titles in the visualization graph.

3.7. Output Design

In the research output design shown in Figure 10, there are several types of outputs, including:
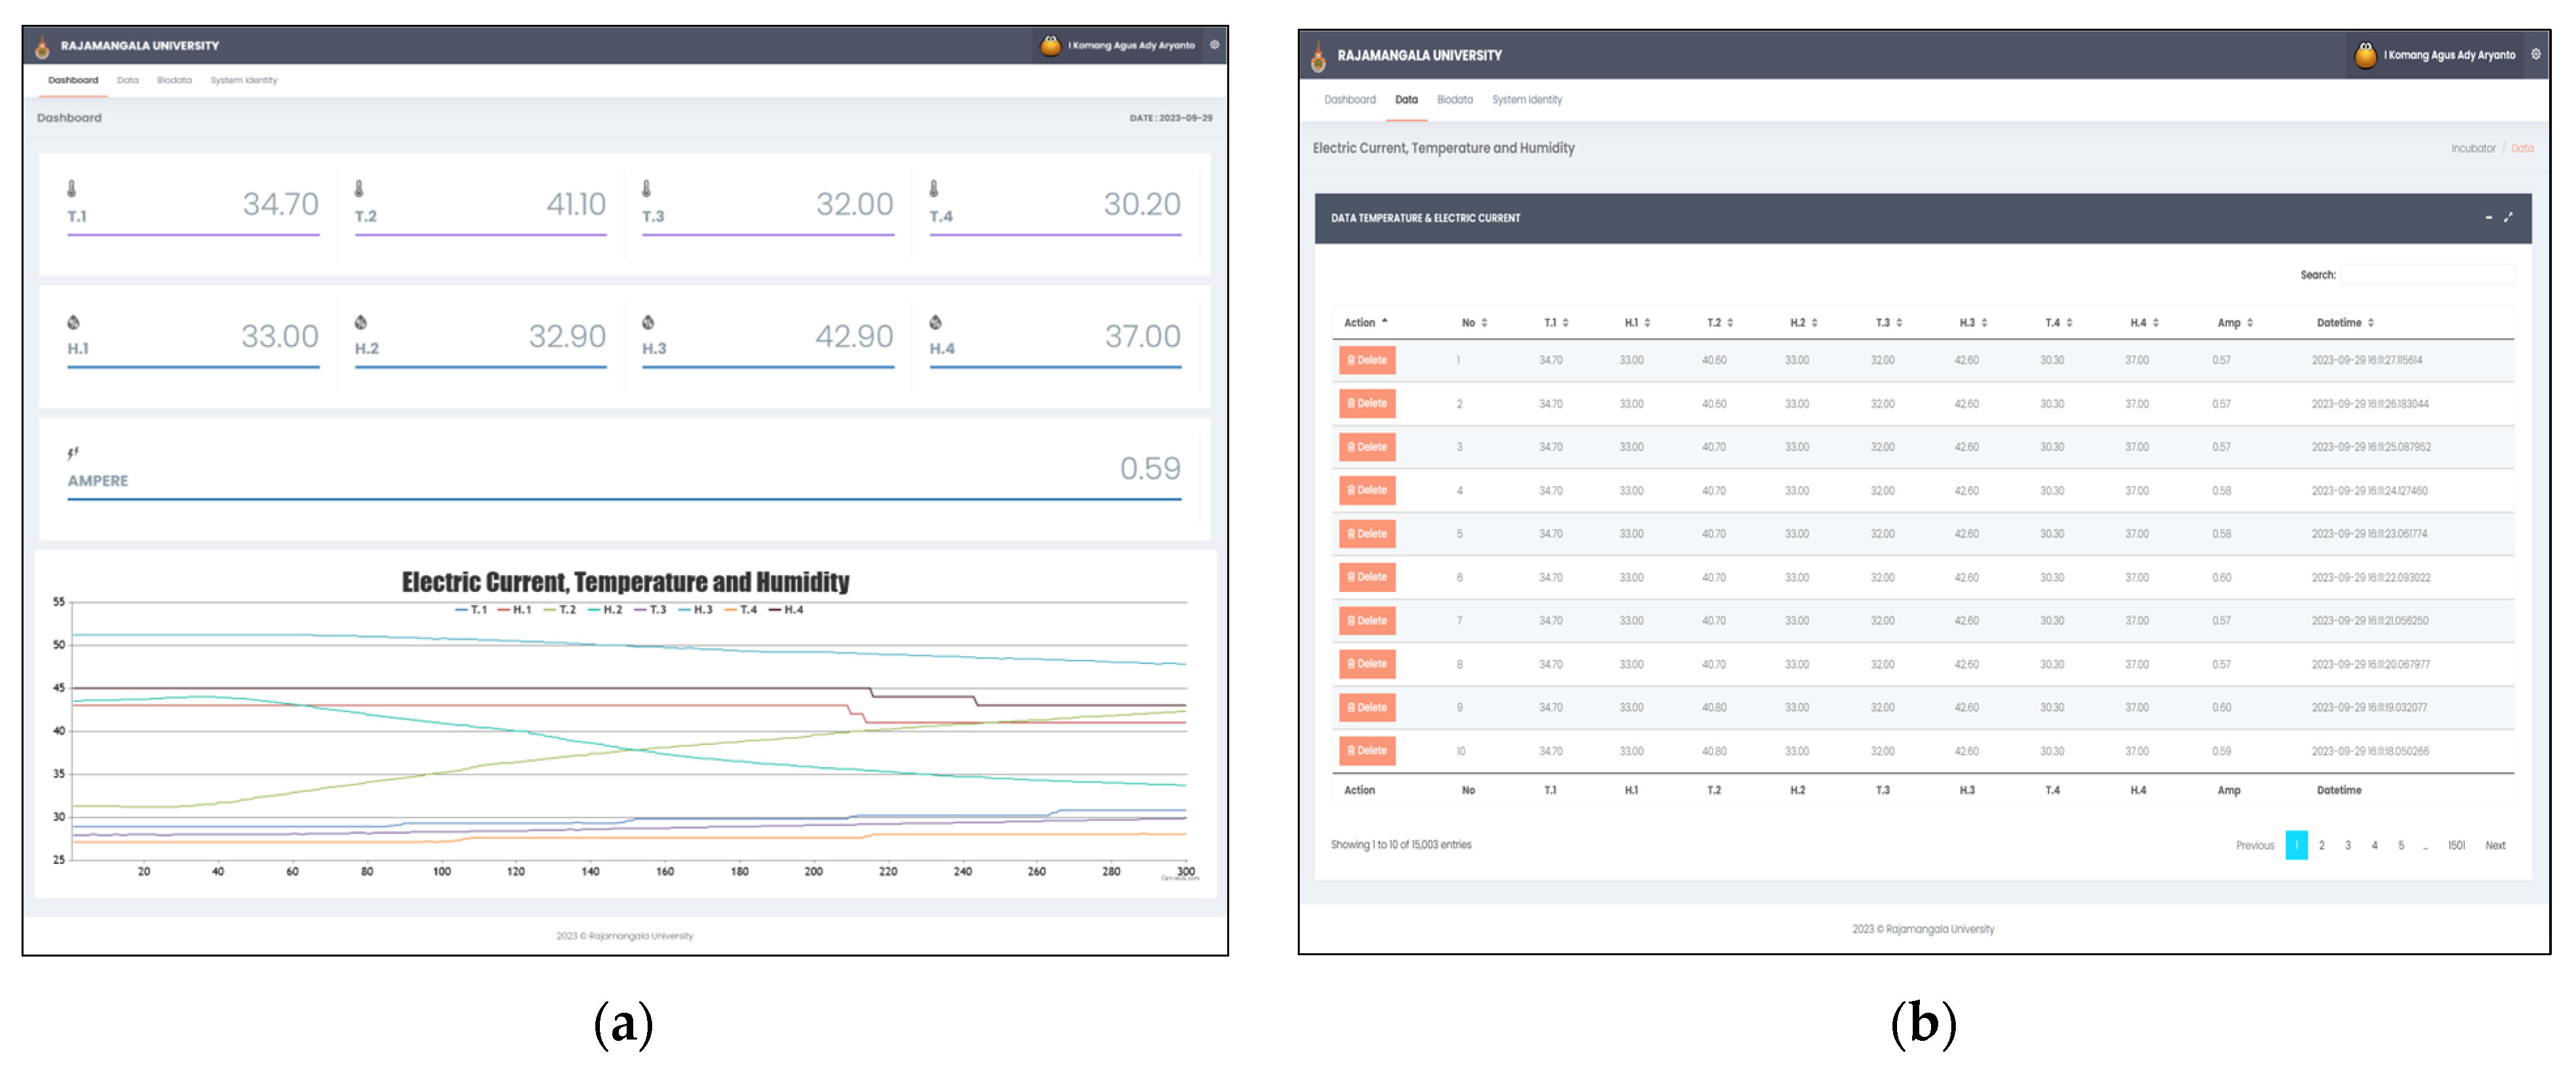
  • A web application for real-time monitoring and control: the first output is a web application designed for monitoring real-time data from sensors inside the incubator, such as temperature, humidity, electrical current, and heater status. This application provides real-time information to medical staff or the patient’s family.
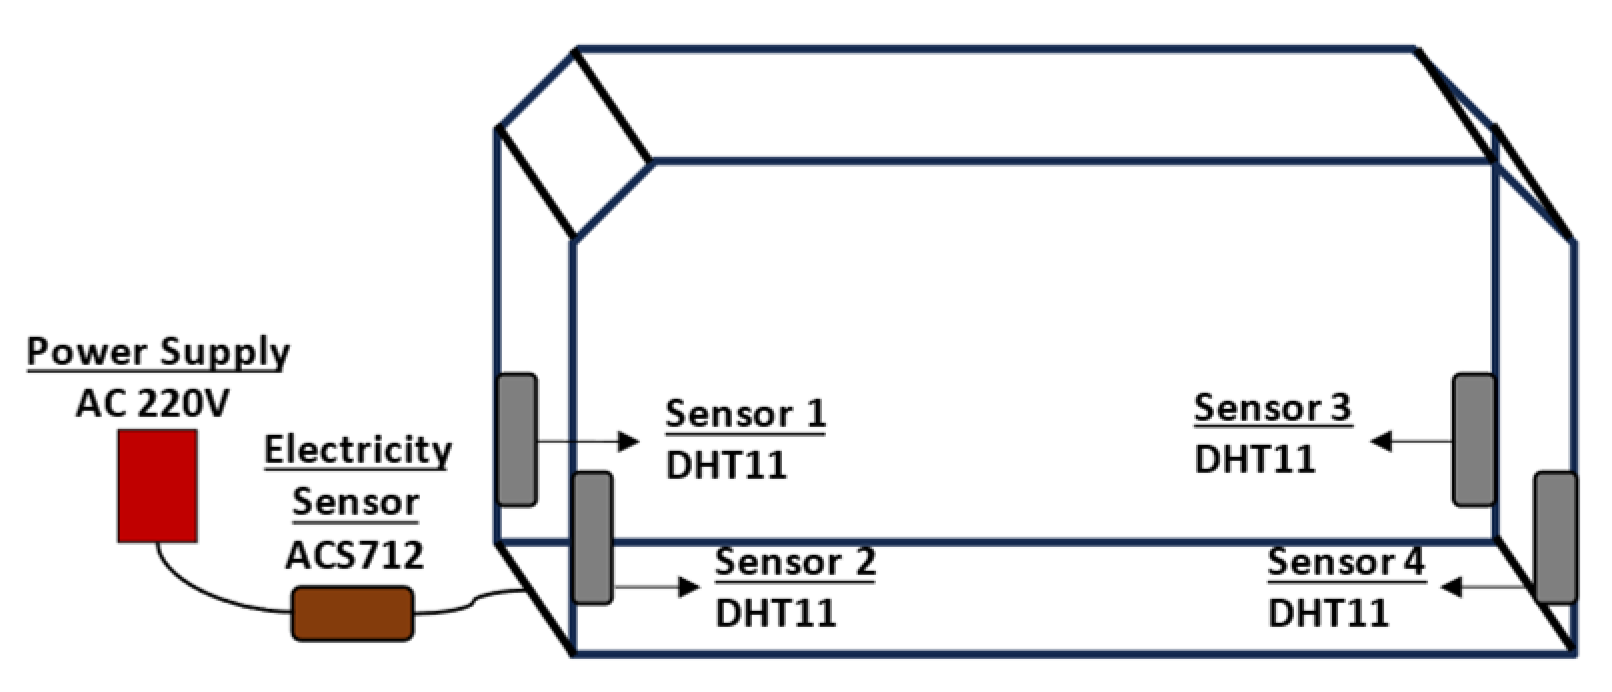
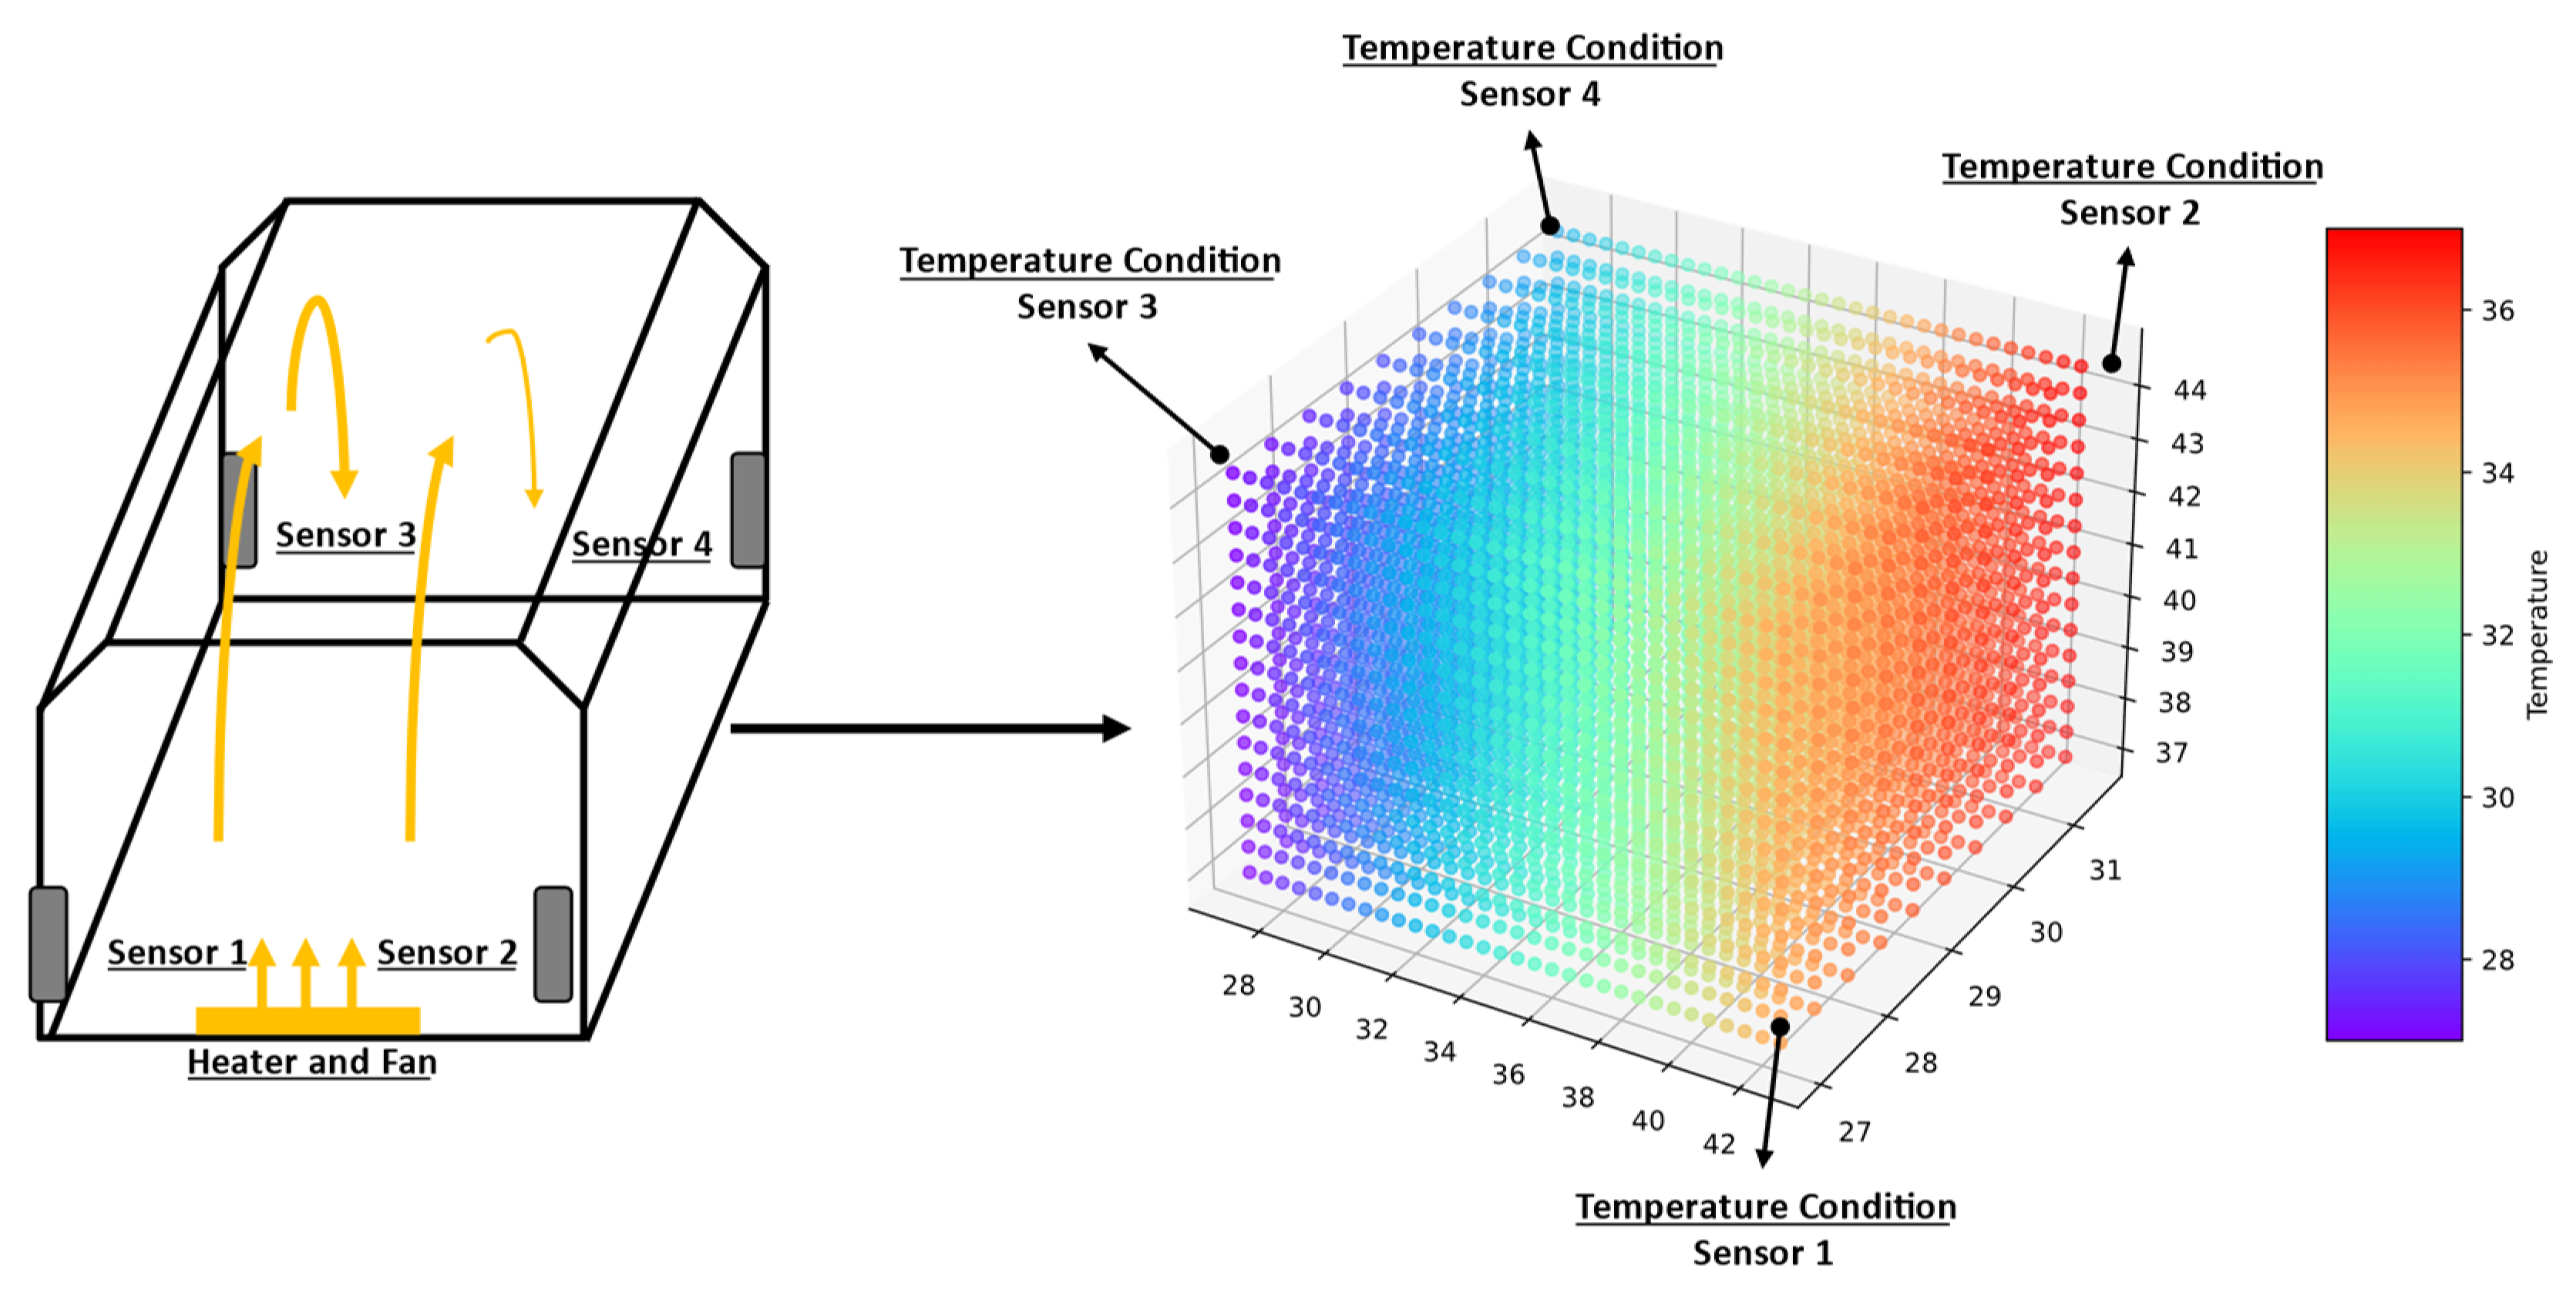
  • Visualization of the temperature data distribution inside the incubator: the second output is the visualization of the temperature data distribution within the incubator. This visualization provides insights into temperature fluctuations in different areas within the incubator, enabling the identification of areas that may require further attention.
  • A prototype of an electronic hardware incubator: the third output is a prototype product of an incubator equipped with several hardware modules such as sensors, actuators, and microcontrollers. This prototype is a tangible representation of the designed incubator by integrating various hardware components and technologies.
  • Energy consumption prediction models: the final output is an energy consumption prediction model. This model can assist in optimizing resource usage by making predictions for more efficient energy consumption. The research’s outcomes are expected to improve neonatal management and care.

4. Results and Discussion

Figure 11 presents an overview of the hardware implementation used in the incubator system. Figure 11a displays the main incubator box, which includes temperature and humidity sensors on each side. Subsequently, in Figure 11b, the implementation of the heater device is shown. This device generates heat and distributes it throughout the incubator using a blower fan. Finally, Figure 11c illustrates the hardware implementation for the electronic components that control the incubator. These electronic components include a microcontroller, current sensor, WiFi module, and power supply.
Figure 12 shows the results of the responsive web application implementation, making it accessible on various screen sizes, including mobile phones. In the application, the main page is a dashboard, as seen in Figure 12a. This dashboard page displays data from the incubator in real-time as graphs. Figure 12b also indicates the stored data from the database in a tabular format. This page provides various features for users, including the ability to sort data, perform searches, and download data in Excel, CSV, PDF, and JSON formats.
Based on the data stored in the database, which have been converted into a dataset and displayed in Figure 13, there are several primary attributes. These attributes include T_1 (as shown in Figure 13a), T_2 (Figure 13b), T_3 (Figure 13c), T_4 (Figure 13d), H_1 (Figure 13e), H_2 (Figure 13f), H_3 (Figure 13g), H_4 (Figure 13h), and Ampere (Figure 13i). New data based on the Ampere data were also generated to measure energy consumption. The energy (W) calculation process follows Equation (2). The results of these energy data are displayed in Figure 13j. There is a significant drop in temperature in the data T_1, T_2, T_3, and T_4 (Figure 13a–d). This was caused by the incubator’s box being opened, allowing hot air to escape. The box was intentionally opened to observe the data pattern, and once the incubator box was closed again, the temperature returned to normal. Meanwhile, there is an increase in humidity in the data H_1, H_2, H_3, and H_4 (Figure 13e–h).
Table 7 presents statistical information from the dataset. The statistical results are categorized into variables: count, mean, std, min, and max. The total number of data entries for each attribute is 65.535. The average temperature value in the dataset ranges from 31 °C to 39 °C. The average energy consumption is 161.47 Joule, with a minimum value of 99 Joule and a maximum of 202.40 Joule.
Furthermore, Table 8 displays the correlation coefficient values from the dataset. Noticeably, the correlation coefficient values for the Joule and Ampere attributes are identical. This is because the Joule value is calculated based on the Ampere attribute. Some attributes show negative values in the correlation coefficient to the Joule attribute. The correlation between the T_1 and T_3 data attributes is 0.69, indicating a strong relationship. Similarly, the correlation between T_2 and T_3 is 0.35, suggesting that the temperature flows from T_1 and T_2 to T_3, as observed in Figure 14. Furthermore, the humidity data attributes H_1 and H_2 and H_3 and H_4 have correlations exceeding 0.79. Additionally, the H_4 attribute exhibits a significant correlation with the target attribute Joule, with a value of 0.91.
Figure 14 depicts the temperature distribution pattern in the incubator. From the image, it is evident that the section of the incubator occupied by Sensor 1 and Sensor 2 has a higher temperature than the section occupied by Sensor 3 and Sensor 4. This temperature difference can be attributed to two primary factors. First, the proximity of Sensor 1 and Sensor 2 to the heat source results in higher temperatures in their vicinity due to the direct influence of the heat source. The second factor is the blower fan’s lack of even hot air distribution, so there are hot areas in the incubator.
Next, the dataset undergoes preprocessing in training and testing the model for predicting electricity usage. This involves calculating the total energy consumption (Joules) and computing the average values for the temperature attributes (T_1, T_2, T_3, T_4) and humidity (H_1, H_2, H_3, H_4) for each minute (60 s). As a result, a new dataset is obtained with energy values ranging from 7.000 to 11.000 Joules, as depicted in Figure 15. Subsequently, the data are preprocessed to scale for the training dataset.
In this research, the testing of the model is divided into three parts. First, the initial model is created using the LSTM method. Second, the model is created using the CNN method. Third, a model is developed by combining the CNN and LSTM methods. The best RMSE and MAE results for the LSTM method are 42.650 and 33.575, respectively. The LSTM layer consists of 35 neurons, the dense layer contains 10 neurons, and the lookback value is set to 5. The complete testing results are presented in Table 9. The comparison between the predicted and actual values is shown in Figure 16a (with five neurons-1 and five neurons-2) and Figure 16b (with thirty-five neurons-1 and thirty-five neurons-2).
In the second test using the CNN method, the best results for RMSE and MAE were 37.675 and 30.082, respectively. The optimal model for this test was achieved using 55 neurons-1 and 55 neurons-2. The comprehensive results can be found in Table 10, and the comparison between the predicted and actual values is illustrated in Figure 17a (with 30 neurons-1 and 30 neurons-2) and Figure 17b (with 55 neurons-1 and 55 neurons-2).
In the third test using the combination of CNN and LSTM, the best results were achieved with RMSE values of 32.436 and MAE values of 25.382. Furthermore, compared to the previous methods’ results, the combination of CNN and LSTM outperformed them, indicating an improvement in the model’s performance using this combination. Detailed results can be found in Table 11, and the comparison between the predicted and actual values using the CNN-LSTM method is illustrated in Figure 18a,b.
In Figure 19, a graph or visualization of the loss values computed during the model training process is presented. These results measure how much the predicted values differ from the actual values. In Figure 19a, the loss results for Model 1 are shown, utilizing the CNN-LSTM method, where each CNN and LSTM layer has 10 neurons, resulting in an RMSE of 38.052. Meanwhile, in Figure 19b, the loss results for Model 2 using the CNN-LSTM method are displayed, with each CNN and LSTM layer having 50 neurons and an RMSE of 32.436, as indicated in Table 11. Each model in the training process utilized 240 epochs and the observed spikes in the early stages of the training loss. This phenomenon can be attributed to the occurrence of vanishing gradients, particularly when the ReLU activation function is employed during the training process.
In this section, we also compare the results of the energy consumption prediction model with similar methods. We have compared the results of several methods, namely elastic net (ELNET) regression, support vector regression (SVR), gradient boosting regression (GBR), linear regression (LR), ridge regression (RR), and kernel ridge regression (KRR). Based on the test results, the model evaluations for each method are as follows: ELNET has an RMSE of 274.217 Joule, SVR has an RMSE of 82.572 Joule, GBR has an RMSE of 51.213 Joule, LR has an RMSE of 43.438 Joule, RR has an RMSE of 41.258 Joule, and KRR has an RMSE of 38.758 Joule. These comparison results are also presented in Table 12, with the last row mentioning the results of the model with the combination of CNN-LSTM. Additionally, for the comparison between the actual and predicted values for each method, refer to Figure 20a for ELNET, Figure 20b for SVR, Figure 20c for GBR, Figure 20d for LR, Figure 20e for RR, and Figure 20f for KRR.

5. Conclusions

In summary, this study has effectively devised a comprehensive framework for the real-time control of energy and monitoring of incubator conditions in neonatal care facilities. The system effectively integrates various hardware components and a highly efficient database management system by utilizing the Internet of Things (IoT) architecture in combination with the MQTT communication protocol. A rigorous and validated predictive energy consumption model was developed, integrating convolutional neural networks (CNN) and long short-term memory (LSTM) techniques. The temperature distribution within the incubator exhibits variation throughout its sides, as indicated by the results of the tests. The measurements obtained from the incubator’s sensors can be recorded within a database system. These stored data may be accessible in real-time using a web application, facilitating the monitoring and control functions. During the experimental phase, the long short-term memory (LSTM) approach produced root mean square error (RMSE) and mean absolute error (MAE) values of 42.650 and 33.575, respectively.
On the other hand, the convolutional neural network (CNN) technique gave RMSE and MAE values of 37.675 and 30.082, respectively. The integration of both convolutional neural network (CNN) and long short-term memory (LSTM) techniques resulted in notable enhancements in the root mean square error (RMSE) and mean absolute error (MAE) values, which reached 32.436 and 25.382, respectively. This exemplifies the integrated methodology’s efficacy in augmenting the model’s prediction precision. The results indicate that the model successfully enhanced predicted accuracy to a significant degree. Moreover, the technology facilitates the visualization of temperature distribution within the incubator, augmenting the standard of care provided to infants. This study significantly contributes to the progression of neonatal incubator technology, facilitating the development of more efficient and data-informed newborn care solutions in healthcare settings.

Author Contributions

Conceptualization, I.K.A.A.A. and D.M.; methodology, I.K.A.A.A., D.M. and P.N.C.; software, I.K.A.A.A.; data collection, I.K.A.A.A.; data analysis I.K.A.A.A.; writing—original draft preparation, I.K.A.A.A., D.M. and P.N.C.; writing—review and editing, I.K.A.A.A., D.M. and P.N.C.; and supervision, I.K.A.A.A., D.M. and P.N.C. All authors have read and agreed to the published version of the manuscript.

Funding

This research received no external funding.

Institutional Review Board Statement

Not applicable.

Informed Consent Statement

Not applicable.

Data Availability Statement

Data are contained within the article.

Acknowledgments

Sincere gratitude is extended to Rajamangala University of Technology Thanyaburi and Institute Technology and Business STIKOM Bali for their unwavering support and the invaluable resources that greatly facilitated the successful completion of this research.

Conflicts of Interest

The authors declare no conflict of interest.

References

  1. Fortino, G.; Savaglio, C.; Spezzano, G.; Zhou, M. Internet of Things as System of Systems: A Review of Methodologies, Frameworks, Platforms, and Tools. IEEE Trans. Syst. Man Cybern. Syst. 2021, 51, 223–236. [Google Scholar] [CrossRef]
  2. Wozniak, M.; Zielonka, A.; Sikora, A.; Piran, M.J.; Alamri, A. 6G-Enabled Iot Home Environment Control Using Fuzzy Rules. IEEE Internet Things J. 2021, 8, 5442–5452. [Google Scholar] [CrossRef]
  3. Fortino, G.; Russo, W.; Savaglio, C.; Viroli, M.; Zhou, M. Modeling Opportunistic IoT Services in Open IoT Ecosystems. CEUR Workshop Proc. 2017, 1867, 90–95. [Google Scholar]
  4. Krohkaew, J.; Nilaphruek, P.; Witthayawiroj, N.; Uapipatanakul, S.; Thwe, Y.; Crisnapati, P.N. Thailand Raw Water Quality Dataset Analysis and Evaluation. Data 2023, 8, 141. [Google Scholar] [CrossRef]
  5. De Rango, F.; Potrino, G.; Tropea, M.; Fazio, P. Energy-Aware Dynamic Internet of Things Security System Based on Elliptic Curve Cryptography and Message Queue Telemetry Transport Protocol for Mitigating Replay Attacks. Pervasive Mob. Comput. 2020, 61, 101105. [Google Scholar] [CrossRef]
  6. Kapen, P.T.; Mohamadou, Y.; Momo, F.; Jauspin, D.K.; Kanmagne, N.; Jordan, D.D. Development of a Neonatal Incubator with Phototherapy, Biometric Fingerprint Reader, Remote Monitoring, and Heart Rate Control Adapted for Developing Countries Hospitals. J. Neonatal Nurs. 2019, 25, 298–303. [Google Scholar] [CrossRef]
  7. Alimuddin, A.; Arafiyah, R.; Saraswati, I.; Alfanz, R.; Hasudungan, P.; Taufik, T. Development and Performance Study of Temperature and Humidity Regulator in Baby Incubator Using Fuzzy-Pid Hybrid Controller. Energies 2021, 14, 14206505. [Google Scholar] [CrossRef]
  8. Cay, G.; Solanki, D.; Rumon, M.A.A.; Ravichandran, V.; Hoffman, L.; Laptook, A.; Padbury, J.; Salisbury, A.L.; Mankodiya, K. NeoWear: An IoT-Connected e-Textile Wearable for Neonatal Medical Monitoring. Pervasive Mob. Comput. 2022, 86, 101679. [Google Scholar] [CrossRef]
  9. Aya-Parra, P.A.; Rodriguez-Orjuela, A.J.; Rodriguez Torres, V.; Cordoba Hernandez, N.P.; Martinez Castellanos, N.; Sarmiento-Rojas, J. Monitoring System for Operating Variables in Incubators in the Neonatology Service of a Highly Complex Hospital through the Internet of Things (IoT). Sensors 2023, 23, 5719. [Google Scholar] [CrossRef]
  10. Essa, M.E.-S.M.; El-shafeey, A.M.; Omar, A.H.; Fathi, A.E.; Maref, A.S.A.E.; Lotfy, J.V.W.; El-Sayed, M.S. Reliable Integration of Neural Network and Internet of Things for Forecasting, Controlling, and Monitoring of Experimental Building Management System. Sustainability 2023, 15, 2168. [Google Scholar] [CrossRef]
  11. Hadi, W.N.H.W.A.; Rashid, R.A.; Sarijari, M.A.; Hamid, S.Z.A.; Muhammad, N.A. Machine Learning Bill Prediction for IoT-Based Utility Management System. In Proceedings of the 2022 IEEE 6th International Symposium on Telecommunication Technologies (ISTT), Johor Bahru, Malaysia, 14–16 November 2022; pp. 74–78. [Google Scholar]
  12. Dinçer, K.; Semczuk, M. Open-Source Magnetometer for Characterizing Magnetic Fields in Ultracold Experiments. Appl. Sci. 2023, 13, 10620. [Google Scholar] [CrossRef]
  13. Rouillard, J.; Vannobel, J.-M. Multimodal Interaction for Cobot Using MQTT. Multimodal Technol. Interact. 2023, 7, 78. [Google Scholar] [CrossRef]
  14. Woźniak, M.; Szczotka, J.; Sikora, A.; Zielonka, A. Fuzzy Logic Type-2 Intelligent Moisture Control System. Expert Syst. Appl. 2024, 238, 121581. [Google Scholar] [CrossRef]
  15. Guo, S.; Mao, X.; Dai, D.; Wang, Z.; Chen, D.; Wang, S. Embedded Yolo-Fastest V2-Based 3D Reconstruction and Size Prediction of Grain Silo-Bag. Remote Sens. 2023, 15, 4846. [Google Scholar] [CrossRef]
  16. Siddharthan, H.; Deepa, T.; Chandhar, P. SENMQTT-SET: An Intelligent Intrusion Detection in IoT-MQTT Networks Using Ensemble Multi Cascade Features. IEEE Access 2022, 10, 33095–33110. [Google Scholar] [CrossRef]
  17. Barreto, M.V.S.; Barra, W.; Rocha, E.M.; Nogueira, F.G.; Marcillo, K.L.; De Medeiros, R.L.P.; Abreu, T.W.M.; Alves, M.S. Apache Dynamic Update for Feedback Control of Computing Resources. IEEE Access 2019, 7, 55861–55872. [Google Scholar] [CrossRef]
  18. Hernández-Gutiérrez, C.A.; Delgado-del-Carpio, M.; Zebadúa-Chavarría, L.A.; Hernández-de-León, H.R.; Escobar-Gómez, E.N.; Quevedo-López, M. IoT-Enabled System for Detection, Monitoring, and Tracking of Nuclear Materials. Electronics 2023, 12, 3042. [Google Scholar] [CrossRef]
  19. Jara Ochoa, H.J.; Peña, R.; Ledo Mezquita, Y.; Gonzalez, E.; Camacho-Leon, S. Comparative Analysis of Power Consumption between MQTT and HTTP Protocols in an IoT Platform Designed and Implemented for Remote Real-Time Monitoring of Long-Term Cold Chain Transport Operations. Sensors 2023, 23, 4896. [Google Scholar] [CrossRef]
  20. Dinculeană, D.; Cheng, X. Vulnerabilities and Limitations of MQTT Protocol Used between IoT Devices. Appl. Sci. 2019, 9, 848. [Google Scholar] [CrossRef]
  21. Alhussein, M.; Aurangzeb, K.; Haider, S.I. Hybrid CNN-LSTM Model for Short-Term Individual Household Load Forecasting. IEEE Access 2020, 8, 180544–180557. [Google Scholar] [CrossRef]
  22. Peng, Y.; Shen, H.; Tang, X.; Zhang, S.; Zhao, J.; Liu, Y.; Nie, Y. Energy Consumption Optimization for Heating, Ventilation and Air Conditioning Systems Based on Deep Reinforcement Learning. IEEE Access 2023, 11, 88265–88277. [Google Scholar] [CrossRef]
  23. El-Hassan, F.T.; Ionescu, D. Design and Implementation of a Hardware Versatile Publish-Subscribe Architecture for the Internet of Things. IEEE Access 2018, 6, 31872–31890. [Google Scholar] [CrossRef]
  24. Singh, T.; Solanki, A.; Sharma, S.K.; Jhanjhi, N.Z.; Ghoniem, R.M. Grey Wolf Optimization Based CNN-LSTM Network for the Prediction of Energy Consumption in Smart Home Environment. IEEE Access 2023, 11, 114917–114935. [Google Scholar] [CrossRef]
  25. Govarthan, R.; Hariharan, S.; Mary, T.B.; Paul, J.J.; Manimekalai, M.A.P.; Thilagavathi, K. IoT Based Health Monitoring and Tracking in Combat. In Proceedings of the 2023 4th International Conference on Signal Processing and Communication (ICSPC), Coimbatore, India, 6–8 September 2023; pp. 297–301. [Google Scholar]
  26. Widura, A.; Hadiatna, F.; Anugerah, D. Fuzzy-Based Smart Farming and Consumed Energy Comparison Using the Internet of Things. IEEE Access 2023, 11, 69241–69251. [Google Scholar] [CrossRef]
  27. Lalitha, K.; Ramya, G.; Shunmugathammal, M. AI-Based Safety Helmet for Mining Workers Using IoT Technology and ARM Cortex-M. IEEE Sens. J. 2023, 23, 21355–21362. [Google Scholar] [CrossRef]
  28. El-Leathey, L.-A.; Anghelita, P.; Constantin, A.-I.; Circiumaru, G.; Chihaia, R.-A. System for Indoor Comfort and Health Monitoring Tested in Office Building Environment. Appl. Sci. 2023, 13, 11360. [Google Scholar] [CrossRef]
  29. Tran, M.Q.; Elsisi, M.; Liu, M.K.; Vu, V.Q.; Mahmoud, K.; Darwish, M.M.F.; Abdelaziz, A.Y.; Lehtonen, M. Reliable Deep Learning and IoT-Based Monitoring System for Secure Computer Numerical Control Machines Against Cyber-Attacks With Experimental Verification. IEEE Access 2022, 10, 23186–23197. [Google Scholar] [CrossRef]
  30. Ling, Z.; Gao, C.; Sano, C.; Toe, C.; Li, Z.; Fu, X. STIR: A Smart and Trustworthy IoT System Interconnecting Legacy IR Devices. IEEE Internet Things J. 2020, 7, 3958–3967. [Google Scholar] [CrossRef]
  31. Győrödi, C.A.; Turtureanu, T.; Győrödi, R.Ş.; Zmaranda, D.R. Implementing a Synchronization Method between a Relational and a Non-Relational Database. Big Data Cogn. Comput. 2023, 7, 153. [Google Scholar] [CrossRef]
  32. World Health Organization Research; Reproductive Health. Managing Newborn Problems: A Guide for Doctors, Nurses, and Midwives; Integrated Management of Pregnancy and Childbirth; World Health Organization: Geneva, Switzerland, 2003; ISBN 9789241546225. [Google Scholar]
  33. Wardana, I.N.K.; Gardner, J.W.; Fahmy, S.A. Optimising Deep Learning at the Edge for Accurate Hourly Air Quality Prediction. Sensors 2021, 21, 1064. [Google Scholar] [CrossRef]
  34. Wardana, I.N.K.; Gardner, J.W.; Fahmy, S.A. Estimation of Missing Air Pollutant Data Using a Spatiotemporal Convolutional Autoencoder. Neural Comput. Appl. 2022, 34, 16129–16154. [Google Scholar] [CrossRef]
  35. Wen, S.; Jia, P.; Yang, P.; Hu, C. Squill: Testing DBMS with Correctness Feedback and Accurate Instantiation. Appl. Sci. 2023, 13, 2519. [Google Scholar] [CrossRef]
  36. Babovic, Z.B.; Protic, J.; Milutinovic, V. Web Performance Evaluation for Internet of Things Applications. IEEE Access 2016, 4, 6974–6992. [Google Scholar] [CrossRef]
  37. Brito, T.; Ferreira, M.; Monteiro, M.; Lopes, P.; Barros, M.; Santos, J.F.; Santos, N. Study of JavaScript Static Analysis Tools for Vulnerability Detection in Node.Js Packages. IEEE Trans. Reliab. 2023, 72, 1324–1339. [Google Scholar] [CrossRef]
  38. Elmannai, W.; Elleithy, K.; Benz, A.A.; DeAngelis, A.C.; Weaver, N. An Enhanced Piezoelectric-Generated Power Technique for Qi Wireless Charging. Clean Technol. 2023, 5, 94–115. [Google Scholar] [CrossRef]
  39. Ahsan, M.M.; Mahmud, M.A.P.; Saha, P.K.; Gupta, K.D.; Siddique, Z. Effect of Data Scaling Methods on Machine Learning Algorithms and Model Performance. Technologies 2021, 9, 52. [Google Scholar] [CrossRef]
  40. Aaryan, A.; Kanisha, B. Forecasting Stock Market Price Using LSTM-RNN. In Proceedings of the 2022 2nd International Conference on Advance Computing and Innovative Technologies in Engineering (ICACITE), Greater Noida, India, 28–29 April 2022; pp. 1557–1560. [Google Scholar]
  41. Hochreiter, S.; Schmidhuber, J. Long Short-Term Memory. Neural Comput. 1997, 9, 1735–1780. [Google Scholar] [CrossRef] [PubMed]
  42. Lawal, A.; Rehman, S.; Alhems, L.M.; Alam, M.M. Wind Speed Prediction Using Hybrid 1D CNN and BLSTM Network. IEEE Access 2021, 9, 156672–156679. [Google Scholar] [CrossRef]
  43. Wang, X.; Xia, M.; Deng, W. MSRN-Informer: Time Series Prediction Model Based on Multi-Scale Residual Network. IEEE Access 2023, 11, 65059–65065. [Google Scholar] [CrossRef]
  44. Zhao, J.; Mao, X.; Chen, L. Speech Emotion Recognition Using Deep 1D & 2D CNN LSTM Networks. Biomed. Signal Process Control 2019, 47, 312–323. [Google Scholar] [CrossRef]
  45. Mitiche, I.; Nesbitt, A.; Conner, S.; Boreham, P.; Morison, G. 1D-CNN Based Real-Time Fault Detection System for Power Asset Diagnostics. IET Gener. Transm. Distrib. 2020, 14, 5766–5773. [Google Scholar] [CrossRef]
  46. Han, Z.; Cui, B.; Xu, L.; Wang, J.; Guo, Z. Coupling LSTM and CNN Neural Networks for Accurate Carbon Emission Prediction in 30 Chinese Provinces. Sustainability 2023, 15, 13934. [Google Scholar] [CrossRef]
  47. Zhang, C.; Chen, P.; Jiang, F.; Xie, J.; Yu, T. Fault Diagnosis of Nuclear Power Plant Based on Sparrow Search Algorithm Optimized CNN-LSTM Neural Network. Energies 2023, 16, 2934. [Google Scholar] [CrossRef]
  48. Rubasinghe, O.; Zhang, X.; Chau, T.K.; Chow, Y.; Fernando, T.; Iu, H.H.C. A Novel Sequence to Sequence Data Modelling Based CNN-LSTM Algorithm for Three Years Ahead Monthly Peak Load Forecasting. IEEE Trans. Power Syst. 2023, 1–15. [Google Scholar] [CrossRef]
  49. Jain, R.; Semwal, V.B. A Novel Feature Extraction Method for Preimpact Fall Detection System Using Deep Learning and Wearable Sensors. IEEE Sens. J. 2022, 22, 22943–22951. [Google Scholar] [CrossRef]
  50. Lee, S.Y.; Byeon, S.; Kim, H.S.; Jin, H.; Lee, S. Deep Learning-Based Phase Prediction of High-Entropy Alloys: Optimization, Generation, and Explanation. Mater. Des. 2021, 197, 109260. [Google Scholar] [CrossRef]
  51. Chicco, D.; Warrens, M.J.; Jurman, G. The Coefficient of Determination R-Squared Is More Informative than SMAPE, MAE, MAPE, MSE and RMSE in Regression Analysis Evaluation. PeerJ Comput. Sci. 2021, 7, e263. [Google Scholar] [CrossRef]
  52. Hodson, T.O. Root-Mean-Square Error (RMSE) or Mean Absolute Error (MAE): When to Use Them or Not. Geosci. Model Dev. 2022, 15, 5481–5487. [Google Scholar] [CrossRef]
  53. Embarak, O. Data Analysis and Visualization Using Python: Analyze Data to Create Visualizations for BI Systems; Apress: New York, NY, USA, 2018; ISBN 9781484241097. [Google Scholar]
Figure 1. System overview.
Applsci 13 12953 g001
Figure 2. Architecture of hardware: (a) Electronic design; (b) Electronic schematic.
Applsci 13 12953 g002
Figure 3. Sensor placement in the incubator.
Applsci 13 12953 g003
Figure 4. Architecture of network.
Applsci 13 12953 g004
Figure 5. Architecture of software.
Applsci 13 12953 g005
Figure 6. Preprocessing flow diagram.
Applsci 13 12953 g006
Figure 7. The architecture of LSTM.
Applsci 13 12953 g007
Figure 8. Architecture of CNN.
Applsci 13 12953 g008
Figure 9. The architecture of CNN-LSTM.
Applsci 13 12953 g009
Figure 10. Output design.
Applsci 13 12953 g010
Figure 11. Hardware prototype: (a) neonatal incubator box; (b) actuator heater and blower; (c) electronic components.
Applsci 13 12953 g011
Figure 12. Web application: (a) dashboard page; (b) data record page.
Applsci 13 12953 g012
Figure 13. Data sensor: (a) Temperature 1 (T_1); (b) Temperature 2 (T_2); (c) Temperature 3 (T_3; (d) Temperature 4 (T_4); (e) Humidity 1 (H_1); (f) Humidity 2 (H_2); (g) Humidity 3 (H_3); (h) Humidity 4 (H_4); (i) electric current (Ampere); and (j) energy (Joule).
Applsci 13 12953 g013aApplsci 13 12953 g013b
Figure 14. Temperature distribution.
Applsci 13 12953 g014
Figure 15. Target energy attribute data (Joule).
Applsci 13 12953 g015
Figure 16. Results of an energy prediction model with LSTM: (a) 5 neurons-1 and 5 neurons-2; (b) 35 neurons-1 and 35 neurons-2.
Applsci 13 12953 g016
Figure 17. Results of an energy prediction model with CNN: (a) 30 neurons-1 and 30 neurons-2; (b) 55 neurons-1 and 55 neurons-2.
Applsci 13 12953 g017
Figure 18. Results of an energy prediction model with the CNN–LSTM combination: (a) Neuron 10; (b) Neuron 50.
Applsci 13 12953 g018
Figure 19. Losses during model training: (a) Model 1; (b) Model 2.
Applsci 13 12953 g019
Figure 20. Comparison with other methods: (a) elastic net regression; (b) support vector regression; (c) gradient boosting regression; (d) linear regression; (e) ridge regression; (f) kernel ridge regression.
Applsci 13 12953 g020aApplsci 13 12953 g020b
Table 1. Summary of the works related to neonatal incubator systems.
ReferenceHardwareNetworkDataSoftwareMethod
[6]Microcontroller ATMega 328ProtocolHTTPMySQLMobile-
Microcomputer -NetworkGSM
Sensor Phototherapy,
Temperature, humidity,
Fingerprint, Heart Rate, Camera
Broker IoT-
[7]Microcontroller ATMega16Protocol--LCD, DesktopFuzzy-PID
Microcomputer -Network-
Sensor Temperature, HumidityBroker IoT-
[8]Microcontroller ESP32ProtocolMQTTFilter,
Peak
Detection, Feature
Extraction
LCD, Desktop-
Microcomputer Raspberry PiNetworkWiFi
Sensor RespirationBroker IoTMosquitto
[9]Microcontroller ESP32ProtocolMQTTMySQLWeb-
Microcomputer-NetworkWiFi
Sensor Temperature, humidity, SoundBroker IoTNode-Red
Proposed workMicrocontroller ATMega 2560ProtocolMQTT, HTTPFilter, MySQLWeb,
Mobile
CNN,
LSTM,
RMSE,
MAE,
MAPE,
MSE
Microcomputer Raspberry PiNetworkWiFi
Sensor Temperature, humidity,
Energy
Broker IoTMosquitto
Table 2. Electronic component.
ComponentDescriptionQty.Unit Price ($)Total ($)
Board Arduino Mega2560Microcontroller18.658.65
ESP8266WiFi10.860.86
DHT11Temperature measurement range: 0 °C to 50 °C, and Humidity measurement range: 20% to 90% [27]40.602.4
ACS712 10 AAmpere sensor10.730.73
Relay 1 channelRelay10.300.3
Motor DC 12 VMotor115.3815.38
BTS7960Driver motor13.893.89
Heater Incubator 1200 WattHeater 1115.34115.34
Power supply 12 VPower supply18.788.78
Total156.33
Table 3. Database structure for electronic sensors.
VariableElectronicData TypeUnitVariableElectronicData TypeUnit
temperature_1DHT11Float°Chumidity_1DHT11Float%
temperature_2DHT11Float°Chumidity_2DHT11Float%
temperature_3DHT11Float°Chumidity_3DHT11Float%
temperature_4DHT11Float°Chumidity_4DHT11Float%
electricityACS712FloatAdateDS1307DateTimeyy:mm:dd
hh:mm:ss
Table 4. Dataset attribute.
VariableAttributeUnitDescriptionsVariableAttributeUnitDescriptions
temperature_1T_1°CTemperature on the right rear sidehumidity_1RH_1%Humidity on the right rear side
temperature_2T_2°CTemperature on the right front sidehumidity_2RH_2%Humidity on the right front side
temperature_3T_3°CTemperature on the left front sidehumidity_3RH_3%Humidity on the left front side
temperature_4T_4°CTemperature on the left rear sidehumidity_4RH_4%Humidity on the left rear side
electricityElectricityAElectrical energy usagedateDateyy:mm:dd
hh:mm:ss
Date and time
Table 5. CNN properties of the proposed model.
LayerProperties
1st Convolutionalfilter = 55, kernel size = 3, activation = ReLU
2nd Convolutionalfilter = 55, kernel size = 2, activation = ReLU
Flattening-
Denseunit = 10
Table 6. CNN-LSTM properties of the proposed model.
LayerProperties
1st Convolutionalfilter = 50, kernel size = 3, activation = ReLU
2nd Convolutionalfilter = 50, kernel size = 2, activation = ReLU
1st LSTMunit = 50, activation = ReLU
2nd LSTMunit = 50, activation = ReLU
Flattening-
Denseunit = 10
Table 7. Statistical information of the dataset.
VariableT_1T_2T_3T_4H_1H_2H_3H_4AmpereJoule
count65,53565,53565,53565,53565,53565,53565,53565,53565,53565,535
mean34.2239.0231.7631.7734.0334.2243.7636.450.73161.47
std0.481.140.271.022.621.512.472.600.0921.63
min28.9031.1027.9027.1029.0032.4038.8031.000.4599.00
max35.2045.3032.6033.8046.0046.4051.4045.000.92202.40
Table 8. Correlation coefficient values of attributes in the dataset.
T_1H_1T_2H_2T_3H_3T_4H_4AmpereJoule
T_11−0.430.1−0.310.69−0.27−0.034−0.22−0.2−0.2
H_1−0.4310.110.79−0.220.94−0.0080.87−0.003−0.003
T_20.10.111−0.370.350.015−0.580.36−0.63−0.63
H_2−0.310.79−0.731−0.220.80.30.570.290.29
T_30.69−0.220.35−0.221−0.210.13−0.16−0.11−0.11
H_3−0.270.940.0150.8−0.2110.0180.860.0220.022
T_4−0.034−0.008−0.580.30.130.0181−0.430.910.91
H_4−0.220.870.360.57−0.160.86−0.431−0.42−0.42
Ampere−0.2−0.003−0.630.29−0.110.0220.91−0.4211
Joule−0.2−0.003−0.630.29−0.110.0220.91−0.4211
Table 9. The result of LSTM testing.
Neurons LSTM-1Neurons LSTM-2DenseLookbacksRMSE (Joule)MAE (Joule)MSE (Joule)MAPE (%)
5510547.82437.9450.0040.4
101010553.58742.8160.0040.4
151510560.23851.2310.0050.5
202010595.77887.1490.0080.8
252510583.12775.2840.0070.7
303010564.15452.4200.0050.5
353510542.65033.5740.0030.3
404010572.56657.8420.0060.6
454510564.61654.2050.0050.5
505010560.42049.2340.0050.5
555510567.37655.3510.0050.5
606010553.05442.4520.0040.4
656510547.79338.9470.0040.4
707010568.44554.6030.0050.5
Table 10. The result of CNN testing.
Neurons CNN-1Neurons CNN-2DenseLookbacksRMSE (Joule)MAE (Joule)MSE (Joule)MAPE (%)
5510585.40467.0580.0070.7
101010541.45933.3770.0030.3
151510538.38030.5880.0030.3
202010545.49236.2440.0040.4
252510541.66033.0740.0030.3
303010537.87330.2090.0030.3
353510547.03937.8670.0040.4
404010559.83748.5920.0050.5
454510561.52551.4130.0050.5
505010545.26135.9640.0030.3
555510537.67530.0820.0030.3
606010570.76862.2460.0060.6
656510546.59337.4930.0040.4
707010550.01040.6760.0040.4
Table 11. The result of CNN–LSTM testing.
Neurons CNN-1Neurons CNN-2Neurons LSTM-1Neurons LSTM-2LookbacksRMSE (Joule)MAE (Joule)MSE (Joule)MAPE (%)
5555553.67843.0370.0040.4
10101010538.05230.2660.0030.3
15151515553.81943.7750.0040.4
20202020556.92246.4860.0050.5
25252525555.12343.1330.0040.4
30303030551.15640.5310.0040.4
35353535552.60044.5320.0040.4
40404040543.77335.5230.0030.3
45454545564.27451.4160.0050.5
50505050532.43625.3820.0020.2
55555555544.56236.1650.0040.4
60606060540.75832.5830.0030.3
65656565546.43937.8020.0040.4
707070705115.99296.3230.0090.9
Table 12. The result of comparison with other methods.
MethodRMSE (Joule)MAE (Joule)MSE (Joule)MAPE (%)
Elastic Net Regression274.217272.2050.0262.6
Support Vector Regression82.57269.8230.0070.7
Gradient Boosting Regression51.21341.8820.0040.4
Linear Regression43.43834.7000.0030.3
Ridge Regression41.25832.4040.0030.3
Kernel Ridge Regression38.75829.8410.0030.3
CNN-LSTM32.43625.3820.0020.2
Disclaimer/Publisher’s Note: The statements, opinions and data contained in all publications are solely those of the individual author(s) and contributor(s) and not of MDPI and/or the editor(s). MDPI and/or the editor(s) disclaim responsibility for any injury to people or property resulting from any ideas, methods, instructions or products referred to in the content.

