1. Introduction
Due to the dramatic performance improvement in deep learning, a variety of powerful deep models have evolved and extended to occur in crucial scenarios like disease diagnosis and autonomous driving, which require high reliability and robustness. In the context of deep learning, out-of-distribution (OOD) refers to data points or samples that are different from or not well-represented by the data distribution the model was trained on. When a model encounters OOD data, its predictions or classifications may be unreliable or incorrect, as it lacks the knowledge or ability to make accurate assessments of these unfamiliar samples. For example, autonomous vehicles must operate in diverse and dynamic environments, including urban, suburban, and rural areas, each with unique challenges. If the vehicle encounters an entirely new object or an unusual environmental condition, the system should be able to recognize it as OOD and take the appropriate action, such as slowing down or requesting human intervention. However, the deployment of the trained models can suffer from disastrous failure because of distribution failure without filtering the OOD data [
1]. Therefore, the perception of unknown/unseen/novel/OOD samples from test-time data has been a basic yet challenging open problem in the development of deep models. Various methods and techniques have been developed to improve OOD detection and make deep-learning models more robust in the face of unexpected data.
In general, the tasks in this domain can be divided into anomaly detection, open-set detection, and OOD detection based on the source of the classes and the aims of the models [
2]. An anomaly detection model aims to detect a novel class different from the class with which the model is trained, and there is only one known class. The open-set detection model needs to distinguish the known data from the unknown and further classify the known data into specific classes it has witnessed during training, and there are multiple classes in the training period. OOD detection tries to discriminate OOD instances from in-distribution ones, and the OOD instances come from the real world, which means the OOD instances do not belong to any specific datasets. Note, however, that the unknown samples are derived from some specific datasets, while the OOD detection deals with the samples without any limitation. Considering the differences above, OOD detection is the most helpful in the real-world application of deep models due to its robustness and reliability. However, compared with other tasks, OOD detection is also the most challenging problem because of limited access to labels and infinite unknown distributions.
The purpose of OOD detection is to classify the samples that are semantically different from the training data into an unknown class [
3]. Based on the frameworks, the methodologies fall into two main frameworks: discrimination and generative categories. The models have made rapid progress, along with advances in deep-learning architectures, algorithms, and training techniques. However, their performance improves at the cost of large amounts of labeled data, which are costly and impossible for most real-world applications. Because of that, unsupervised learning methods, which are trained on unlabeled data, have attracted growing attention on this topic in the past decade. Unsupervised OOD detection has a rich history, with roots tracing back to the work of [
4], well before the advent of deep learning. One of the fundamental advantages of unsupervised learning lies in its ability to efficiently utilize unlabeled data, which is often more readily available compared to labeled data. In addition, unsupervised learning methods are particularly advantageous due to their scalability, making them well-suited for analyzing large datasets and handling big data applications. Given these characteristics, unsupervised learning presents a viable approach for addressing OOD detection challenges in real-world scenarios. Moreover, the intrinsic capacity of unsupervised models to uncover hidden patterns or structures in data, which might elude supervised methods, positions them as promising OOD detectors. The models achieve this by learning what constitutes normal from the underlying data distribution.
Considering this, much research has attempted to extract the compact discriminative features of in-distribution data using self-supervised methods—one type of unsupervised learning—where the models learn the representation through various agent tasks. Unluckily, the performance failed to meet the requirement because the features in latent space, learned by a deep neural network (DNN), are not separable enough to distinguish between the known and unknown. Specifically, when the number of classes is large, the performance of self-supervised learning degrades sharply. Among them, auto-encoders are widely expected to learn a good set of representations to reduce the reconstruction error. However, the input raw data contains large amounts of unnecessary information, which prevents the model from learning compact features for discrimination between the known and unknown. Recently, contrastive learning has seen significant advancements in enhancing the capability of deep neural networks to learn the crucial representations for downstream classification tasks.
Based on the aforementioned analysis, the objective of this study is to address the challenge of training deep models solely on unlabeled data to endow them with robust OOD detection capabilities. This necessitates devising effective strategies to harness the potential of unlabeled datasets, enabling the deep models to discern and accurately identify OOD instances without reliance on labeled data. The core question revolves around the exploration of methodologies that empower deep-learning models for OOD detection in the absence of labeled samples, paving the way for more scalable and resource-efficient deployment in real-world applications. In this study, we introduce a novel approach that combines contrastive learning with an auto-encoder to enhance OOD detection performance. Contrastive learning works by optimizing feature extraction, pulling in-distribution samples closer together while pushing OOD samples farther apart during training. Consequently, it provides the auto-encoder with preprocessed features rather than raw data mixed with noise. Auto-encoders have the capability to model a distinct feature distribution space for each dataset, imparting specificity to the input features within the feature distribution space. Our results demonstrate that this integrated framework surpasses the performance of many existing self-supervised OOD detection methods and even competes favorably with certain supervised techniques. In summary, there are three contributions to this work: (1) We propose a simple approach to combine contrastive learning with an auto-encoder for OOD detection. The backbone network is trained with a contrastive learning method to provide an auto-encoder with processed features—the auto-encoder constructs better feature space for the discrimination of known and unknown instances. (2) Through end-to-end training, contrastive learning and the auto-encoder boost each other to improve the performance of the deep-learning model. (3) We performed experiments under various contexts. The proposed approach achieves SOTA performance on multiple public datasets.
2. Related Work
2.1. OOD Detection
Supervised learning takes advantage of labeled samples to learn feature representation in the feature space to separate outliers from inliers implicitly, while unsupervised learning detects OOD samples by capitalizing on the nuances of the distribution of unlabeled training data and identifying outliers or deviations from it.
2.1.1. Supervised Learning Methodology
In the context of supervised learning, the methodology falls into three categories: the closed-set classifier-based detector, outlier exposure detector, and distance-based detector. Closed-set classifiers are still deployed as mainstream OOD detectors, leveraging the maximum softmax probability (MSP) to threshold the OOD samples, and it is proven there is a close relationship between the classification accuracy of a model and its open-set recognition performance [
5]. Hendrycks and Gimpel [
6] first put forward a baseline for detecting misclassified and OOD examples in neural networks, which leverage MSP as the threshold to detect OOD samples. In this framework, great efforts are devoted to improving the feature representation ability such that the trained model can confidently detect outliers from the real world [
7]. Huang et al. [
8] illustrated that the performance of OOD detection can degrade significantly when the number of in-distribution classes increases, so they proposed to decompose the large semantic space into smaller groups with similar concepts, which allows for simplifying the decision boundaries between known and unknown data. In addition, the confidence given by softmax limits the representation ability, as significantly different logits may output the same softmax probability. Some research has attempted to use the logits before the softmax layer to detect OOD [
9,
10], while others have tried to calibrate the softmax probabilities to improve the performance [
3,
11,
12,
13]. Liu et al. [
14] proposed using the energy score derived from the logit outputs for OOD detection and demonstrated superiority over the softmax score. Energy-based models map each input X to a single deterministic point that is called energy. Wang et al. [
15] proposed the Joint Energy criterion as a simple and effective method that estimates the OOD indicator scores by aggregating label-wise energy scores from multiple labels.
Another research line is to train a classifier that treats the OOD samples as an additional new class. The classifier is trained with samples from a variety of sources in different research. For example, some OOD samples are derived from accessible auxiliary outlier datasets, some are generated with a GAN-based approach, and others are even crawled from the internet [
16,
17,
18,
19,
20]. After a comparison between the effectiveness of different sources of OOD data, much attention has been paid to improving the generalization capability and robustness of the detector by utilizing fake or counterfactual OOD samples [
21,
22,
23]. Compared to softmax or OpenMax, a distance-based detector decreases the risk factor [
24]. Utilizing the labels, a set of prototypes or reciprocal points are learned to detect the OOD samples based on the distance concerning each prototype [
25]. However, Li et al. [
26] and Zhang et al. [
27] claimed that a global average pooling can destroy image structures and result in compromised discriminative local representations of the target objects. Choi et al. [
28] proposed a balanced energy regulation loss that utilizes class-wise different prior probabilities for auxiliary data to address the class balance in OOD data.
2.1.2. Unsupervised Methodology
Unsupervised OOD detection methods include generative-based methods, contrastive learning models, and other self-supervised learning strategies. A notable observation highlighted by [
29] is the challenge faced by generative models like the variational auto-encoder (VAE), auto-regressive models, and flow-based methods, which tend to assign unexpectedly high likelihood scores to OOD samples. To alleviate the problem in generative models, [
30] employs a likelihood ratio to model the background and foreground information when semantically irrelevant information is added to the input distribution. The authors of [
31] found a strong tie between the OOD samples’ complexity and likelihood values. In the cases where a simple OOD sample is fed into the model, the universal compressor assigns a high probability to it and effectively corrects the high likelihood, wrongly given by the learned model. Cai and Li [
32] proposed a novel frequency-regularized learning framework for OOD detection, which incorporates high-frequency information into training and guides the model to focus on semantically relevant features. Chali et al. [
33] modified the training objective for generative models by incorporating the approximate mass, which smooths the learned distribution in the vicinity of training in-distribution data. In recent research, self-supervised learning (SSL) approaches have emerged. Gidaris et al. [
34] trained the model to learn representation by predicting image rotations, which function as an auxiliary task in SSL. Hendrycks et al. [
35] introduced the integration of SSL techniques to enhance model robustness and uncertainty estimation. This was achieved by combining SSL methods with various auxiliary tasks [
36]. Furthermore, Yu and Aizawa [
37] leveraged unsupervised learning to maximize the discrepancy between two parallel classifiers when exposed to OOD samples. Ruff et al. [
17] took advantage of an extra small pool of labeled OOD samples to train its deep semi-supervised OOD detector (deep-SVDD) based on the idea that the entropy of the latent distribution for normal data should be lower than that of the anomalous distribution. Garg et al. [
38] proposed a principled yet simple approach to estimating KL-divergence to detect OOD samples according to the KL-divergence measure. Unsupervised OOD detection methods continue to evolve and hold significant promise in addressing the challenges of identifying and handling OOD samples in diverse applications.
2.2. Contrastive Learning
One of the fundamental concepts in contrastive learning is the idea of learning representations by contrasting positive pairs (similar samples) and negative pairs (dissimilar samples) [
39,
40,
41]. Early work in this area often utilized siamese networks and triplet loss functions to optimize these embeddings. However, the approach had scalability issues with large datasets and required the careful selection of triplets. The introduction of InfoNCE loss by the momentum contrast (MoCo) framework by He et al. [
39] marked a significant advancement. It simplified the training process by using a large memory bank to store representations, making it efficient for large-scale datasets like ImageNet. This method also contributed to the success of SSL. Up to now, contrastive learning has gained significant attention in the field of OOD detection. SimCLR, by Chen et al. [
42,
43], further refined the contrastive learning paradigm. It emphasized data augmentation and introduced an augmented view of the same image, leading to SOTA results in various benchmarks. The framework also highlighted the importance of batch normalization in improving performance. In the context of OOD detection, contrastive learning has demonstrated its versatility. Researchers have explored using contrastive representations as the basis for more accurate and efficient OOD detection techniques [
44]. Moreover, multi-scale representations have recently gained traction in contrastive learning. Models like MoCo and SwAV [
45] explicitly consider multiple scales or views of data, enhancing the robustness of learned representations. Contrastive learning has not only significantly improved self-supervised learning but has also become a powerful tool for OOD detection and feature representation. However, contrastive learning may overfit the features in in-distribution data, as the majority of the training samples usually belong to the normal class. This can result in higher similarity scores for OOD samples that deviate significantly from the learned in-distribution patterns. Zhang et al. [
46] found that existing models trained by off-the-shelf cross-entropy or contrastive losses are incompetent to capture valuable local representations for multi-scale OOD detection. Therefore, they proposed to leverage both the global visual information and local region details of images to benefit OOD detection. In addition, the performance of contrastive learning models for OOD detection may vary across different datasets and domains. Models trained on one dataset may not generalize well to unseen datasets with different characteristics. Often, addressing these challenges involves a combination of strategies, such as incorporating labeled OOD data when available, utilizing more advanced contrastive learning architectures, introducing regularization techniques, and carefully selecting and fine-tuning model hyperparameters. Additionally, considering ensemble methods or combining contrastive learning with other OOD detection approaches may enhance the overall performance.
2.3. Auto-Encoders
Auto-encoders have made significant strides in machine learning in recent years and have played a crucial role in OOD detection. An auto-encoder is a neural network designed to map input data to a low-dimensional representation and then map it back to the original data [
47,
48,
49]. It consists of an encoder and a decoder and learns how to compress and reconstruct data to extract essential features. Auto-encoders are highly regarded in OOD detection due to their ability to capture critical data features [
50,
51,
52]. Hawkins et al. [
53] is the first to employ an auto-encoder to measure the outlyingness of data records. Researchers used to train auto-encoders to reconstruct only normal samples and then use the reconstruction error to measure the degree of abnormality in samples. This approach effectively identifies samples that do not conform to the normal data distribution. However, auto-encoder-based models tend to overestimate the reconstruction error for normal points, whereas they underestimate the error for outliers. Abhaya and Patra [
54] proposed to compute the reconstruction error only with normal points, where they exploited the novel clustering approach to filter the probable outliers based on density and distance to the higher-density points. Adversarial auto-encoders [
55] introduce adversarial networks to improve the quality of generated data. These models excel in generating OOD data and hold potential in modeling model uncertainty [
56,
57,
58]. Kingma and Welling [
59] designed a VAE to identify data that does not conform to the patterns learned during the VAE’s training on in-distribution data. Auto-encoders are also widely used in transfer learning by transferring auto-encoders trained in a known domain to an unknown domain to improve OOD detection performance [
60,
61,
62,
63,
64]. However, auto-encoders might struggle to capture the diverse and novel patterns present in OOD samples, especially if these samples exhibit characteristics not well-represented in the training data. Further, auto-encoders are primarily designed for data reconstruction and may not inherently capture the discriminative features useful for distinguishing between in-distribution and OOD samples. Cheng et al. [
65] argued that the performance of OOD detection suffers from overfitting and instability during training.
Addressing the above challenges may involve exploring more sophisticated auto-encoder architectures, incorporating additional supervision or labeled OOD data, experimenting with different loss functions, and carefully optimizing hyperparameters. Ensemble methods or combining auto-encoders with other OOD detection techniques may also be explored to enhance the overall performance.
Our approach strategically combines contrastive learning with auto-encoders for effective OOD detection. The synergy between these two components is instrumental in enhancing the overall model performance. Contrastive learning plays a pivotal role in reinforcing the backbone’s representation learning capabilities. By encouraging in-distribution samples to be pulled closer together and pushing OOD samples farther apart during training, contrastive learning contributes to a more discriminative feature space. This learned feature space becomes adept at capturing the nuances of the data distribution, thus improving the model’s ability to distinguish between in-distribution and OOD samples. On the other hand, the auto-encoder component contributes to the refinement of the feature space. It achieves this by minimizing the reconstruction error, effectively encouraging the preservation of crucial information during the encoding and decoding process. The auto-encoder serves as a regularization mechanism, ensuring that the learned features are not only discriminative but also conducive to accurate reconstruction. Aside from that, the combination of the two methods improves the model’s capability to capture both global and local features for OOD detection.
3. Methodology
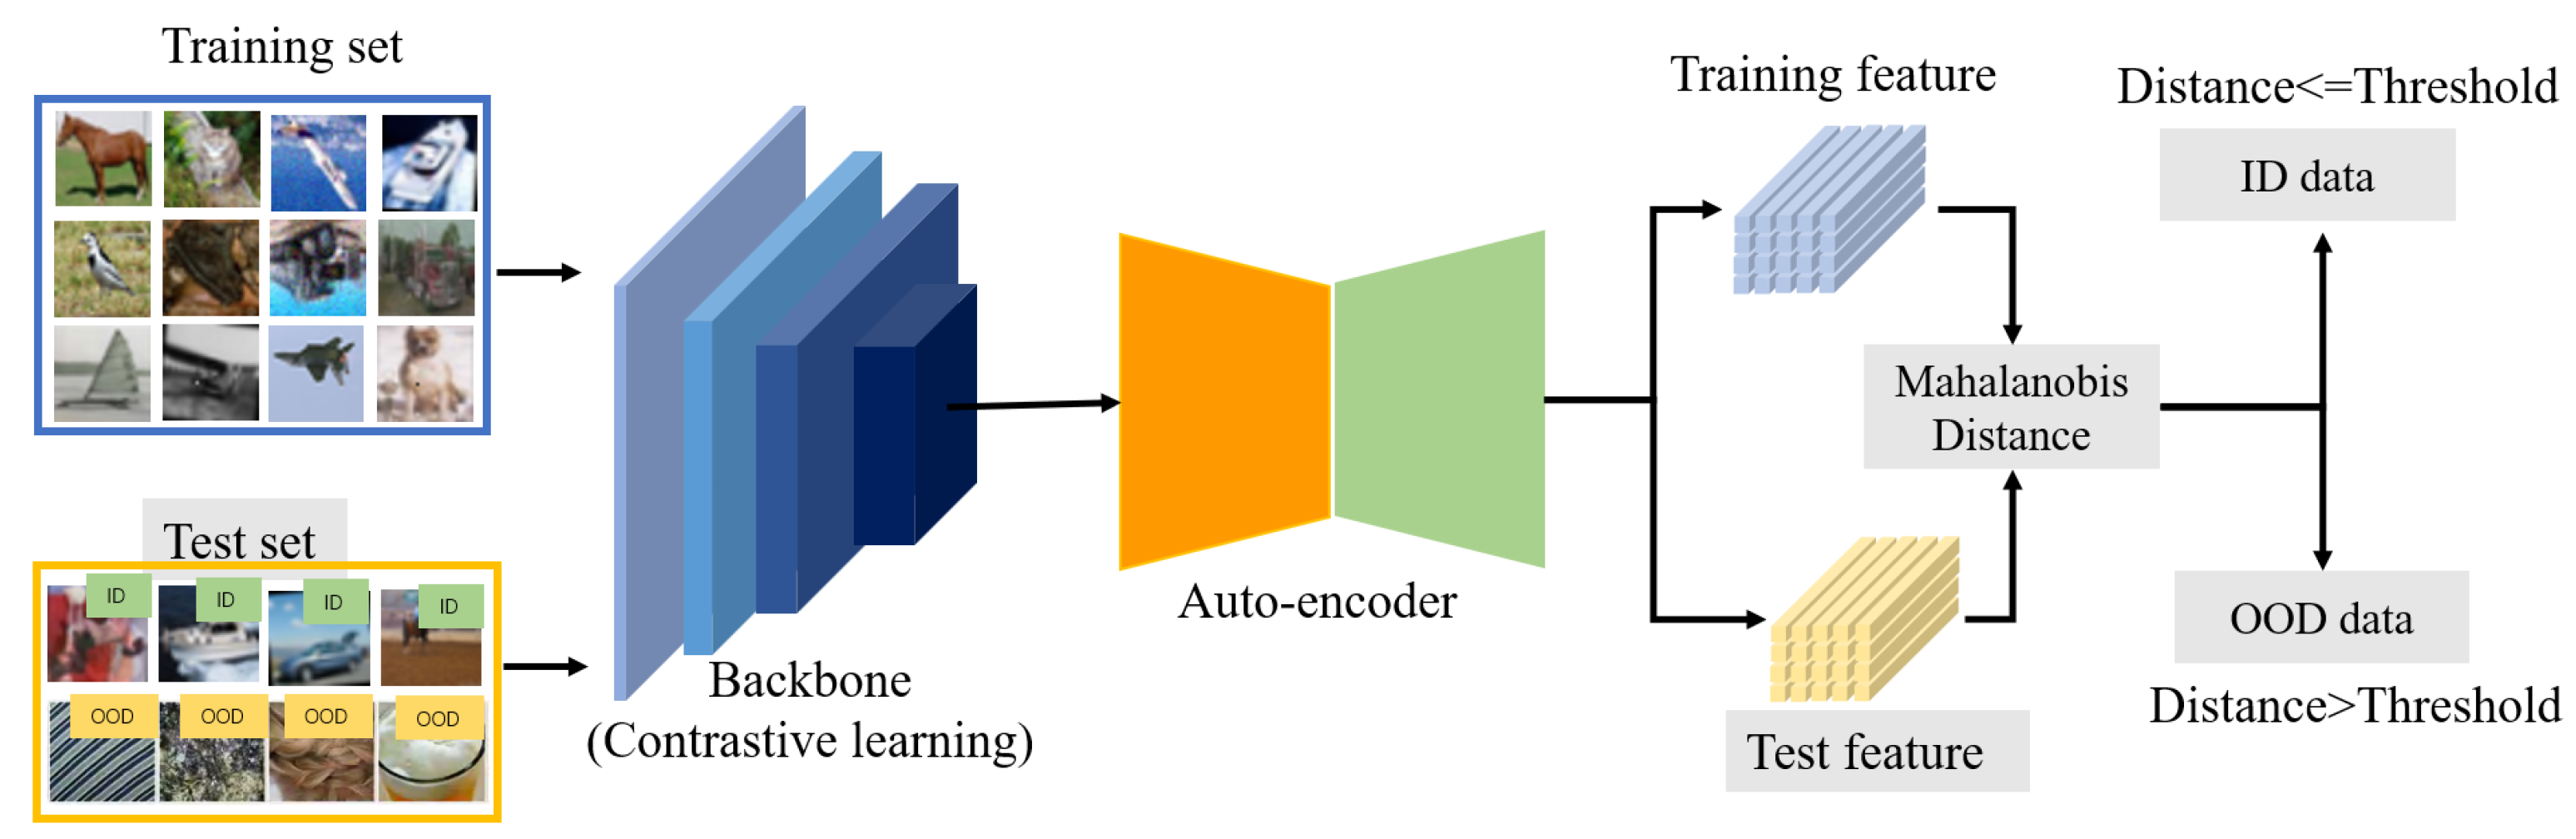
In this section, we present a detailed description of the proposed method for OOD detection. Our model primarily comprises a backbone network and an auto-encoder. The proposed approach integrates a self-supervised learning architecture with an auto-encoder to acquire discriminative feature representations. This integration aims to effectively differentiate between the in-distribution samples and outliers. The model structure and parameters are designed to synergistically leverage self-supervised learning and auto-encoding techniques for enhanced feature extraction and anomaly detection capabilities. The architecture is shown in
Figure 1. The training dataset is sent to the backbone, which is trained with a contrastive learning framework. Recent research has proven that feature representations extracted by a self-supervised learning paradigm are much more powerful than those from a supervised learning paradigm [
66]. The reason is that the self-supervised paradigm focuses on obtaining the distinguished features between positive samples and negative samples and using contrastive learning loss (called InfoNCE) [
67] to reduce the feature distance between positive samples and increase the feature distance between negative samples, while the supervised learning training may be affected by the label bias problem, i.e., a long-tailed sample or class imbalance. After obtaining the feature representations produced by the contrastive learning framework, those features are fed into an auto-encoder network to construct a manifold of the training dataset by minimizing the reconstruction error.
Finally, in the test process, the features of the given samples are compared with the counterparts of the training dataset, and the network provides a decision according to the Mahalanobis distance. The subsequent sub-sections provide details of each part.
3.1. Preliminaries
For a given dataset in which n is the number of samples in the dataset, and y is the corresponding label that is not compulsory, the goal of the OOD detection task is to train a network using dataset and then test a given sample to see whether it is an in-distribution sample, e.g., , or an outlier, e.g., . The prevalent way to achieve the goal in OOD detection is to first extract the feature representations of the training dataset and the counterpart of the given sample and then compare the distance between these two feature representations. If the distance is smaller than a preset threshold, then the given sample is an in-distribution sample. Conversely, it is an outlier.
3.2. Contrastive Learning-Based Backbone
The goal of the backbone is to obtain the discriminative feature representations for each sample. The contrastive learning framework achieves this goal by constructing positive–negative pairs. Specifically, a sample in the batch data containing
N images is augmented in two different ways, generating two samples. These two samples make up a positive pair while one of them forms negative pairs with other samples in this batch. During the training, the backbone pulls each instance close to its positive instances while pushing away from other images. The network is optimized by minimizing the normalized temperature-scaled cross-entropy [
68], one of the variants of InfoNCE, expressed as follows:
where
are positive pairs for the
ith image from a batch of
N images,
is a projection header,
u is the normalized feature representation,
is the temperature parameter, and
N is the batch size.
is the indicator function, which equals zero when
, and equals 1 when
. This formulation delineates the contrastive learning process, emphasizing the creation of positive pairs and the role of the backbone in guiding the network during training. The normalized temperature-scaled cross-entropy loss is a crucial component that shapes the learning dynamics, promoting the closeness of positive pairs while encouraging differentiation from negative instances.
3.3. Feature Reconstruction Based on Auto-Encoder
The auto-encoder is aimed at learning a manifold of the distribution of training datasets by a manner of unsupervised learning. It condenses input features with high dimensionality into a compact embedding space to effectively reconstruct the original input. The auto-encoder is structured by an encoder
f and a decoder
g. Suppose the input feature is
, and then the loss of the auto-encoder is the square of the Euclidean distance, square
norm, i.e.,
By minimizing the loss, the decoder fits a manifold that represents the unique distributions of training datasets. It is worth noticing that the input features of the auto-encoder are the output features of the backbone. The feature representations from the backbone based on the contrastive learning supervised learning style contain discriminative semantic information, and the auto-encoder structure can build a unique distribution space for each in-distribution sample. In this way, the network consisting of the backbone and the auto-encoder can effectively identify the out-of-distribution samples.
3.4. Synergistic Integration of Contrastive Learning and Auto-Encoder for Enhanced OOD Detection
Contrastive learning is employed for feature extraction, but it fails to capture the distribution characteristics unique to each dataset. On the other hand, auto-encoders have the capability to model a distinct feature distribution space for each dataset, imparting specificity to the input features within the feature distribution space. Consequently, this facilitates differentiation between various datasets. For an individual test sample, examining its feature distribution allows us to determine whether it belongs to the OOD category.
3.5. Out-of-Distribution Detection
As shown in
Figure 1, out-of-distribution detection is achieved by comparing the feature distance between the training dataset (in-distribution dataset) and the test samples. During the training stage, the whole network is optimized by minimizing the following loss function,
where the hyperparameter
is a weight value to adjust the balance between two loss functions. During the test stage, the training datasets and the test samples are sent to the network to obtain feature representations, named
and
, respectively. Then, a score is calculated based on the following equation,
This score is the Mahalanobis distance between two feature representations; and are the mean and covariance matrix of . The out-of-distribution decision is according to a rule that if the score s is larger than a pre-defined threshold, then the test sample is an outlier from the out-of-distribution dataset. Conversely, the test sample is from an in-distribution dataset.
4. Experiments
In this section, we first introduce the implementation details of the proposed method and the datasets used in the experiments, and then we present the experimental results to show the superiority of our method to other approaches.
4.1. Implementation Details
The backbone of the proposed method is based on the ResNet50 model, and the training schema is followed by the contrastive learning method called SimCLR [
42]. The auto-encoder contains four MLP layers. Both the encoder and decoder have two MLP layers, where the first MLP layer is followed by a ReLU activation function. The dimensionality of the backbone is 2048. The hidden and latent dimensionalities of the encoder are 1024 and 512, respectively. The experiments are conducted on three NVIDIA GTX 3090 GPUs, and the batch size of each GPU is 512. The weight value of the loss is set as 0.3, and the optimizer is SGD. The initial learning rate is set as 1.8 and decreases with the cosine decay schedule. There is a linear warmup for 20 epochs, which continues training until 300 epochs. The threshold of the decision score is set at a true positive rate of 0.95.
The datasets used in this paper are summarized as follows:
CIFAR-10 dataset. This dataset consists of 50,000 training images and 10,000 test images from 10 different classes. Each image size is pixels.
CIFAR-100 dataset. It also has 50,000 training images and 10,000 test images. However, it has 100 classes, which are further organized into 20 sub-classes.
SVHN dataset. SVHN is a real-world street-view housing number dataset. It has 73,257 digits available for training and 26,032 digits for testing. Similar to the CIFAR-10/100 dataset, the size of its image is also pixels.
DTD dataset. DTD is a collection of texture images in the wild. It includes a total of 5640 images, split equally between 47 categories, where the size of images ranges between and pixels.
LSUN dataset. The LSUN classification dataset contains 10 scene categories, such as dining room, bedroom, chicken, outdoor church, and so on. For training data, each category contains many images, ranging from around 120,000 to 3,000,000. The validation data includes 300 images, and the test data has 1000 images for each category.
Place365 dataset. It is a scene recognition dataset, which is composed of 10 million images comprising 434 scene classes.
iNaturalist dataset. It contains 675,170 training and validation images from 5089 natural fine-grained categories. These categories belong to 13 super-categories, including Plantae (Plant), Insecta (Insect), Aves (Bird), Mammalia (Mammal), and so on. The iNat dataset is highly imbalanced with dramatically different numbers of images per category.
We leveraged three common metrics, including FPR at TPR = 95%, AUROC, and AUPR, to evaluate our method.
The false positive rate (FPR), a commonly used metric in OOD detection, measures the proportion of negative instances that are incorrectly classified as positive. FPR is calculated as follows:
where false positives are the number of negative instances incorrectly classified as positive, and true negatives are the number of negative instances correctly classified as negative. FPR is often used in combination with other metrics like the true positive rate (TPR) to evaluate the overall performance of a classification model. In the context of OOD detection, a good OOD detection model should have a low FPR, as it indicates a low rate of falsely identifying normal in-distribution samples as an OOD distribution. Reducing the FPR while maintaining high sensitivity (TPR) is a key objective for such models.
AUROC stands for the area under the receiver operating characteristic curve, which is a graphical representation of model performance, as its discrimination threshold varies. In OOD detection, it can summarize the model’s ability to distinguish between positive and negative samples across different threshold values. A higher AUROC indicates that the model can effectively differentiate between in-distribution and OOD samples. It is a valuable metric for evaluating how well a model controls its false positive rate while maintaining high true positive rates, which is crucial in applications where false alarms can be costly.
AUPR is the area under the precision-recall curve, which is a pivotal performance metric bearing substantial importance in the evaluation of machine learning models. As OOD detection deals with scenarios where we are chiefly interested in the accurate identification of rare OOD samples while minimizing false alarms, AUPR provides an indispensable perspective on model efficacy.
4.2. OOD Detection Performance
Table 1 displays the performance of the proposed method on five commonly used OOD detection datasets. Following the common setting, we take the CIFAR-10 dataset and CIFAR-100 dataset as in-distribution datasets, respectively, and the other datasets as OOD datasets for validation. When the CIFAR-10 dataset is an in-distribution dataset, the proposed method has good performance on all five datasets. Specifically, in terms of the AUROC and AUPR, the proposed method has nearly 100% values on all OOD datasets. When the CIFAR-100 dataset is an in-distribution dataset, our method can still obtain impressive performance even if the performance is a little bit worse than that of the CIFAR-10 dataset, where most values of the AUROC and AUPR are larger than 95%.
4.3. Comparisons with Other Methods
Table 2 presents the comparisons of the proposed method with other different OOD detection methods. From the table, we can find that our method significantly improves the average AUROC when compared to other OOD detection methods, including those based on input reconstruction (such as the auto-encoder and variational auto-encoder) and one-class classification (specifically, deep-SVDD). One common limitation of these three detectors is their tendency to misclassify images from the SVHN dataset as being more in-distribution when they are trained on the CIFAR-10 or CIFAR-100 datasets. In contrast, our method demonstrates its capability to effectively identify a significant portion of outliers within the SVHN dataset. Additionally, we conducted experiments with rotation-loss, which is a non-contrastive self-supervised training objective. Our findings indicate that our method achieves a higher AUROC in general.
Our method is inspired by the SSD [
44] that only uses a contrastive learning framework for OOD detection. Our method takes the framework of the SSD as a backbone and adds an auto-encoder module at the end of it to fit a distribution space of datasets. The results in
Table 3 show that our method has the best performance with the LSUN and Places365 datasets, where it improves the AUROC by 3% when the CIFAR-10 dataset is an in-distribution dataset, and improves theAUROC by about 25% when the CIFAR-100 dataset is an in-distribution dataset, compared with the SSD. In terms of the DTD dataset, our method performs best when the CIFAR-10 dataset is an in-distribution dataset and is placed second when the CIFAR-100 dataset is an in-distribution dataset. As for the SVHN dataset, our method has an extremely similar AUROC with SSD, where the difference is only 0.5%, and it improves the AUROC by 2.9% when the CIFAR-100 dataset is an in-distribution dataset. We argue that because the auto-encoder fits the unique distribution for each dataset, our method can have such good performance on these datasets, while, when it comes to identifying CIFAR-10 and CIFAR-100 datasets, the performance of our method is not satisfactory—it has a large gap with the SSD. We think the reason is that these two datasets are very similar, and the number of classes is relatively large, resulting in the auto-encoder failing to build a distinguished distribution for the datasets. A good attempt is to increase the number of auto-encoders to obtain a more powerful fitting ability. In our future work, we will focus on this direction.
5. Results and Discussion
In this section, we begin by examining the strengths inherent in the proposed approach. Subsequently, we present the key insights derived from the experimental results, elucidating the underlying reasons behind these observed phenomena.
5.1. Strengths of Combined Contrastive Learning and Auto-Encoder
The performance issues associated with unsupervised learning in OOD detection are multifaceted. Unsupervised learning methods often assume that training and testing data originate from similar distributions. In OOD detection, due to the lack of labels, ensuring this assumption holds is challenging. If the distribution of test data significantly deviates from that of the training data, unsupervised learning methods may struggle to generalize effectively to unseen data. In addition, unsupervised learning models may not effectively capture the key features related to OOD samples during the learning of feature representations. This results in diminished performance for OOD data, as the model fails to distinguish effectively between known and unknown data. Thirdly, in the absence of labels, unsupervised learning methods face difficulty in learning decision boundaries conducive to OOD detection during training. Some unsupervised learning methods may overly fit the known data distribution during training, struggling to adapt to unknown data distributions that deviate significantly from the training data. This may lead to the misclassification of OOD samples. Often, addressing these challenges involves incorporating additional information during training or adopting more sophisticated model architectures to enhance the generalization of unknown data.
Certainly, the combination of contrastive learning with an auto-encoder in our method addresses the aforementioned challenges in the following ways. Contrastive learning is employed to train the backbone of our model, facilitating the extraction of more robust and discriminative features. By pulling in-distribution samples closer and pushing OOD samples farther away in the learned representation space, the model becomes more adept at capturing the underlying patterns that distinguish known and unknown data. The auto-encoder component of our method contributes to the refinement of the latent space. By minimizing the reconstruction error between the input and the reconstructed output, the auto-encoder encourages the preservation of essential information in the feature space. This results in a more refined and expressive latent representation that aids in distinguishing between in-distribution and OOD samples. Contrastive learning and an auto-encoder work synergistically during end-to-end training; while contrastive learning focuses on strengthening the discriminative capabilities of the model, the auto-encoder pushes for reconstruction accuracy. This complementary learning ensures that the model is well-balanced and capable of effectively discerning OOD samples. The combination of contrastive learning and an auto-encoder equips the model to handle deviations in data distribution. The enhanced feature representation and refined latent space contribute to improved generalization capabilities, allowing the model to adapt to unseen distributions during testing. By leveraging the strengths of both contrastive learning and auto-encoder, our method overcomes the limitations of traditional unsupervised learning in OOD detection, offering a more effective and robust solution.
5.2. Impact of In-Distribution Complexity on OOD Detection Performance
In this section, we delve into an intriguing observation regarding the performance of our OOD detection method concerning the complexity of the in-distribution data. Specifically, our experiments reveal a notable distinction in performance when the in-distribution data comprises 10 classes as opposed to 100 classes. One key aspect influencing OOD detection is the complexity of the feature space that the model needs to learn. In scenarios where the in-distribution data are derived from 10 classes, the feature space is inherently simpler and less diverse. This simplicity facilitates the model’s capacity to discern outliers or anomalous patterns associated with OOD samples. With a higher number of classes (100 classes), there is an increased risk of the model overfitting to class-specific features during training. This overfitting might hinder the model’s generalization to OOD samples that deviate from these specific class features. The presence of a larger number of classes introduces the potential for class imbalance, where some classes may have fewer instances than others. Class imbalance can impact the model’s ability to generalize, particularly when confronted with OOD samples that do not align with the more prevalent classes. The augmented number of classes introduces more intra-class variability, posing a challenge for the model to capture generalizable features. This variability may adversely affect OOD detection, given that the model grapples with distinguishing between unusual patterns and normal intra-class variations. A higher number of classes typically leads to more intricate decision boundaries. The model may encounter difficulties in delineating between classes, potentially hindering its ability to generalize effectively to OOD samples.
5.3. Growing Advantages over Other OOD Detection Methods with More In-Distribution Classes
Our method exhibits a less effective OOD detection performance when trained on the CIFAR-100 dataset compared to its performance when trained on CIFAR-10. However, in direct comparison with other methods, our approach demonstrates a more pronounced advantage when CIFAR-100 is utilized as the in-distribution dataset. This suggests that our method is particularly well-suited for scenarios involving a larger number of in-distribution data categories. Such adaptability is of significant importance in practical applications, underscoring the relevance and robustness of our approach in handling diverse and complex in-distribution data settings. There are many reasons for that. First, the combination of contrastive learning and an auto-encoder is designed to yield robust feature representations. This robustness ensures that the model can effectively encode and distinguish complex and varied features, making it well-suited for in-distribution scenarios with a larger diversity of categories. Second, contrastive learning, coupled with the reconstruction aspect of auto-encoding, encourages the model to generalize well across different categories. In comparison to the SSD and supervised methods, the superiority arises from the construction of a unique feature distribution space by the auto-encoder. Third, the combined approach provides an adaptive learning mechanism. It allows the model to adjust its feature representations based on the complexity and diversity of the in-distribution categories encountered during training. This adaptability contributes to the model’s effectiveness in handling a wide array of categories.
5.4. Discrepancies and Strategies for Improvement
The combination of contrastive learning and an auto-encoder in our OOD detection method holds promise, but the observed performance discrepancy between training on CIFAR-10 and testing on CIFAR-100, or vice versa, may be attributed to several factors, including similarity in object classes, shared dataset characteristics, and difficulty in obtaining feature distribution for an auto-encoder. To address these concerns, potential solutions involve diverse training data, fine-tuning the target dataset, class-agnostic features, cross-dataset validation, data augmentation techniques, and model complexity and regularization. By incorporating these strategies, it is possible to enhance the model’s adaptability and improve its performance when confronted with similar yet distinct datasets like CIFAR-10 and CIFAR-100. The key is to promote feature generalization, reduce dataset-specific biases, and enable the model to effectively navigate the subtle differences between the training and testing datasets.
6. Conclusions
Our approach combines the strengths of contrastive learning and auto-encoders for robust OOD detection, showcasing superior performance compared to existing methods. The synergistic relationship between contrastive learning and an auto-encoder contributes to improved end-to-end training. The experimental results highlight the efficacy of our model in detecting outliers during testing. Specifically, when trained on CIFAR-10, our model achieves a remarkable average detection rate for OOD data, and when trained on CIFAR-100, it achieves an average detection rate for OOD instances. Our method proves competitive with or surpasses other OOD detectors, demonstrating significant performance gains, especially in scenarios with only unlabeled data. By combining contrastive learning with an auto-encoder, our model achieves a more discriminative and robust feature representation. This improvement is reflected in its ability to accurately distinguish between in-distribution and OOD samples, outperforming existing methods in terms of detection accuracy. The refined latent space, learned through the synergy of contrastive learning and an auto-encoder, enables the model to generalize effectively to diverse and unfamiliar datasets. This adaptability is a crucial advancement in OOD detection, especially in real-world scenarios where data distributions may evolve. We validated the efficacy of our approach through extensive experiments.
In summary, our work stands as a noteworthy contribution to OOD detection, introducing a novel approach that elevates detection performance, enhances robustness to unseen distributions, and undergoes thorough empirical validation, establishing its practical significance in real-world applications. The potential industrial and commercial applications of our method are diverse, including applications in OOD detection in industrial processes, fraud detection in financial transactions, quality control in manufacturing, and healthcare diagnostics. Our method exhibits several advantages, including enhanced efficiency in handling diverse datasets, scalability for adapting to different domains, and ease of implementation into existing systems and workflows. These features make our proposed OOD detection method a promising solution for real-world applications, offering practical advantages in terms of accuracy, adaptability, and seamless integration into various industries.


