Article

Evaluation of the Rock Mechanical Properties of Shale Oil Reservoirs: A Case Study of Permian Lucaogou Formation in the Jimusar Sag, Junggar Basin

1
State Key Laboratory of Oil and Gas Reservoir Geology and Exploitation, Southwest Petroleum University, Chengdu 610500, China
2
National Center for International Research on Deep Earth Drilling and Resource Development, Faculty of Engineering, China University of Geosciences (Wuhan), Wuhan 430074, China
3
Exploration Division, PetroChina Xinjiang Oilfield Company, Karamay 834000, China
4
CNPC Greatwall Drilling Company Drilling Engineering and Technology Research Institue, Panjin 124010, China
*
Authors to whom correspondence should be addressed.
Appl. Sci. 2023, 13(23), 12851; https://doi.org/10.3390/app132312851
Submission received: 29 September 2023 / Revised: 26 November 2023 / Accepted: 27 November 2023 / Published: 30 November 2023
(This article belongs to the Special Issue Advances and Challenges in Rock Mechanics and Rock Engineering)

Abstract

:
Rock mechanical properties play an important role in the exploration and development of shale oil reservoirs. To study the rock mechanical properties continuously distributed along the longitudinal direction of the formation, physical and mechanical property data of shales from the Permian Lucaogou Formation of the Junggar Basin were gathered through experimental tests. The regression analysis method was applied to obtain relationships between physical properties and rock mechanical properties. Based on this, new empirical relationships between rock mechanical properties were established. The results show that the uniaxial compressive strength (UCS) ranged from 48.40 to 147.86 MPa, the Young’s modulus (Es) was between 3.02 and 20.63 GPa, the Poisson’s ratio (νs) ranged from 0.13 to 0.36, the cohesive force (C) ranged from 14.65 to 34.60 MPa, and the internal friction angle (φ) was between 27.61 and 46.94°. The rock mechanical properties were more sensitive to the P-wave interval transit time (Δtc) and bulk density (DEN). Among them, the UCS was more sensitive to Δtc, while the C, Es, and νs were more sensitive to Δtc/DEN. For UCS and Es, an exponential function correlation is more reliable than linear expression and power function, whereas for C and νs, power function and linear expression were adopted for higher accuracy, respectively. Compared with the empirical equations presented in the literature, the empirical equations established in the paper are more accurate and reliable, making them applicable to the Permian Lucaogou Formation shale oil reservoirs in the Jimusar Sag of the Junggar Basin.

1. Introduction

With the increasing need for energy and the decrease in conventional oil and gas resources, the exploration and development of unconventional oil and gas reservoirs, especially shale oil reservoirs, has received extensive attention. According to the assessment report conducted by the EIA, the technically recoverable reserves of shale oil reservoirs are estimated to be approximately 32.2 × 10⁹ bbl in China, indicating that there is great potential for the value development of shale oil resources in China [1,2]. In recent years, China’s Qaidam, Ordos, Bohai Bay, and Junggar Basins made certain breakthroughs in the exploration of shale oil reservoirs, uncovering shale oil resources with development potential [3]. However, these shale oil resources are still in the early stages of exploration and development. As one of the most important petroliferous basins in Northwest China, the Junggar Basin includes abundant conventional and unconventional oil and natural gas resources. The Permian Lucaogou Formation is the most important source rock in the Jimusar Sag, Junggar Basin, which is the primary exploration target for shale oil [4,5]. Many studies have been carried out on the Permian Lucaogou Formation shale oil reservoirs, producing meaningful results about its geological and geochemical characteristics [5,6,7,8]. These results suggest that shale oil reservoirs from the Lucaogou Formation in the Jimusar Sag have lower permeability characteristics, indicating that the shale oil reservoir from the Lucaogou Formation needs to adopt hydraulic fracturing technology to achieve reservoir stimulation. Rock mechanical properties play very important roles in the fracturing design. Furthermore, rock mechanical properties are of great interest relating to wellbore stability issues and the optimization of drilling operations [9,10]. Therefore, the evaluation of rock mechanical properties is of great importance for the exploitation and development of oil and gas reservoirs. However, studies on the mechanical properties of the shale oil reservoirs in the Permian Lucaogou Formation of the Junggar Basin are still limited.
There has been abundant research on the rock mechanical properties of different formations [11,12,13,14]. These studies showed that laboratory tests are an important means to obtain the rock mechanical properties, including the deviatoric stress vs. axial strain curve, elastic modulus, Poisson’s ratio, rock strength parameters, etc. However, there are few research results on the mechanical properties of the Permian Lucaogou Formation shale oil reservoirs in the Jimsar sag, Junggar Basin. Based on mechanical experiments, the data points of strength parameters and elasticity parameters can be obtained, which have the characteristics of dispersion and only cover a small section of the formation. For the heterogeneous reservoirs, however, data points obtained from the experiments are scattered and cannot represent the rock mechanical properties of the entire reservoir interval. The shale oil reservoirs from the Permian Lucaogou Formation in the Jimusar Sag of the Junggar Basin are of a heterogeneous type [15]. Thus, it is difficult to obtain the mechanical property profile of the rocks continuous along the entire reservoir interval. Logging is an effective means to obtain information on the rock mechanical properties in continuous formations [16,17,18]. However, logging data cannot directly provide the rock mechanical properties of rocks. In order to solve the problem, there are numerous correlations between strength or static elastic parameters and physical parameters (such as wave velocity, density, and porosity, etc.) that have been proposed in the literature [19,20,21,22,23]. The studies indicated that the empirical expressions in the literature have certain application limitations, and different empirical expressions have different application ranges; that is, there is a set of suitable empirical relations for predicting the rock mechanical properties in a specific formation or a specific rock type, so that there are limitations in the direct application of the empirical relations in a certain region to other regions. That may be because many of the same factors including pore size, degree of cementation, mineralogy, shape and spatial arrangement of grains, etc., influence rock mechanical and physical properties [24]. Therefore, local empirical relationships between rock mechanical properties and physical parameters in a specific formation need to be developed. This is the reason why numerous empirical equations were proposed by previous workers. In general, the correlation between rock mechanical and physical properties of a specific formation is based on laboratory tests. In addition, there are no reports of empirical equations for predicting the rock mechanical properties of shale oil reservoirs from the Permian Lucaogou Formation in the Jimusar Sag of the Junggar Basin.
The main objective of this paper was to investigate the rock mechanical properties, including strength and static elasticity parameters. The regression analysis method was applied to obtain the relationships between physical and rock mechanical properties. On this basis, new empirical relationships between rock mechanical properties were developed, which can be used to directly obtain a continuous profile of these properties of the shale oil reservoirs from well logging data.

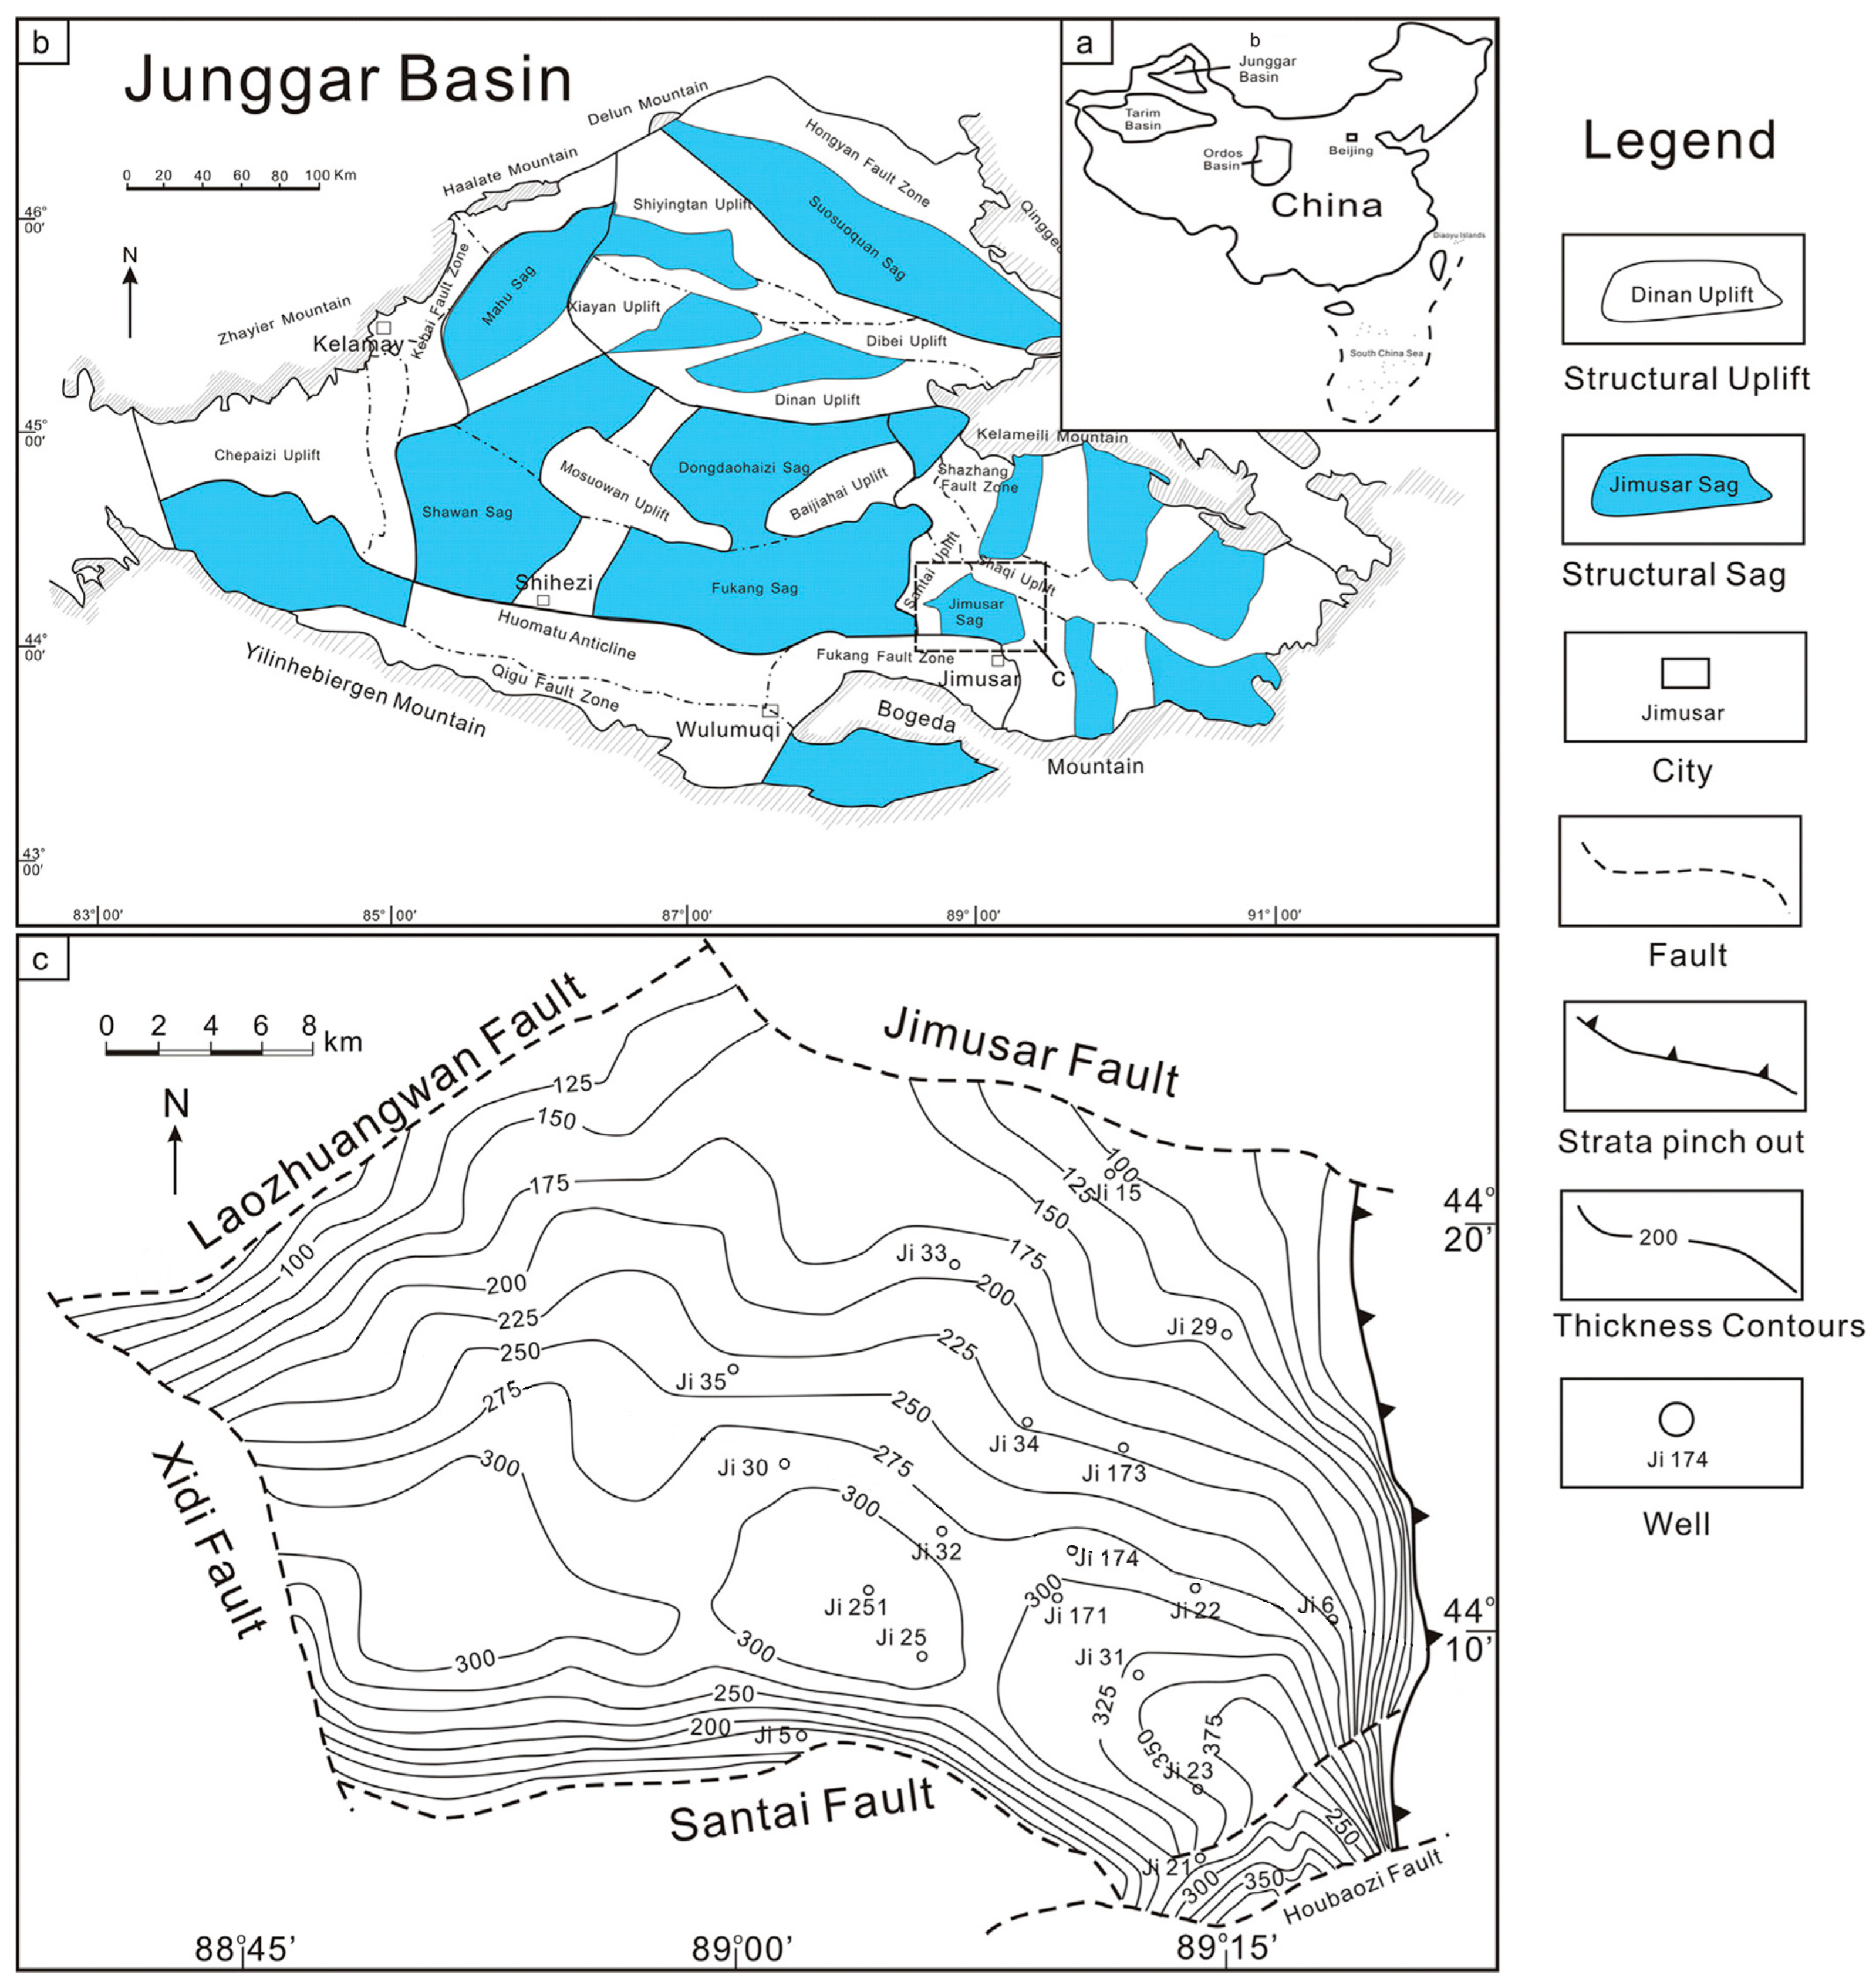
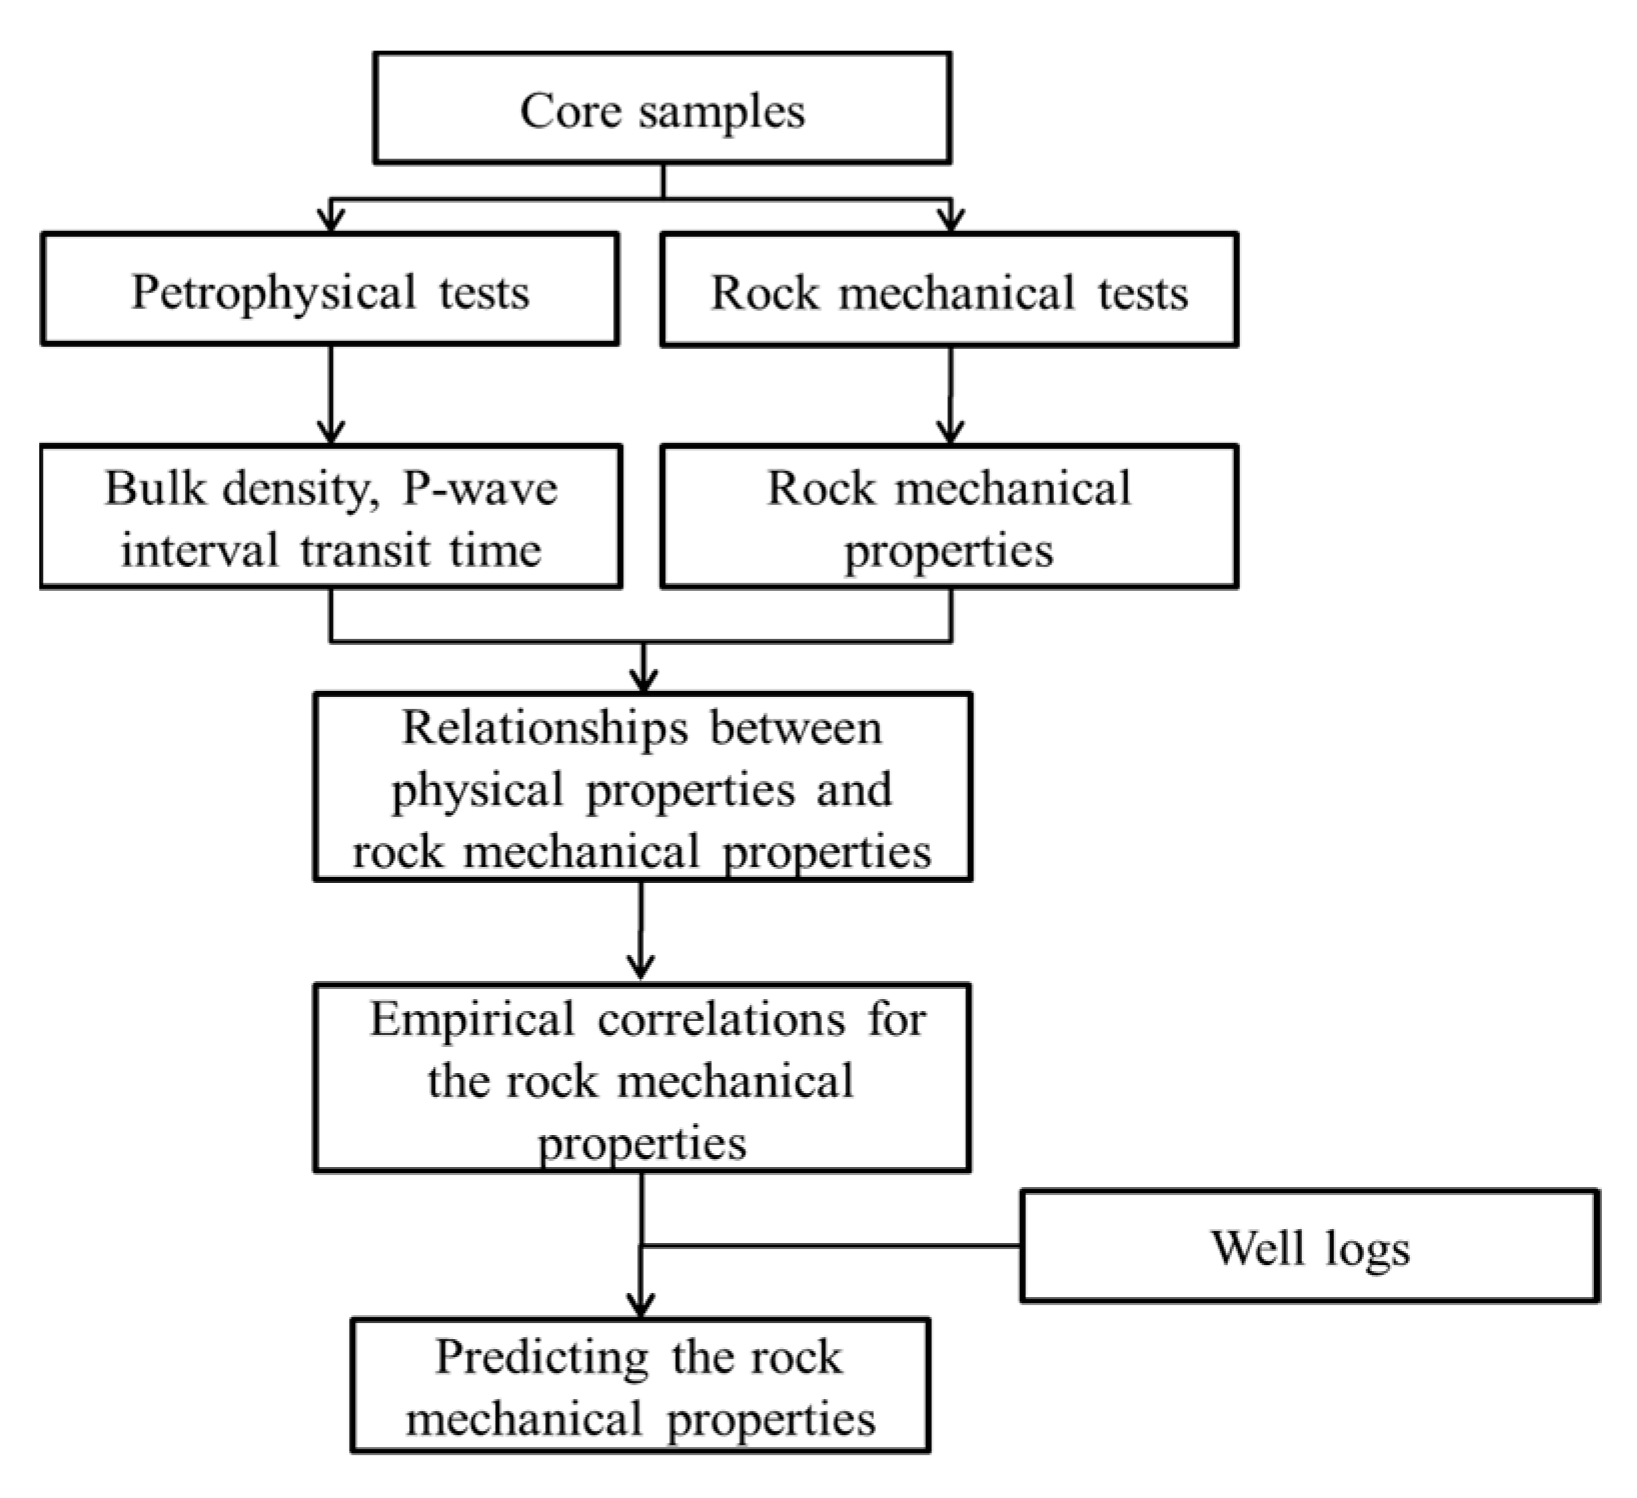
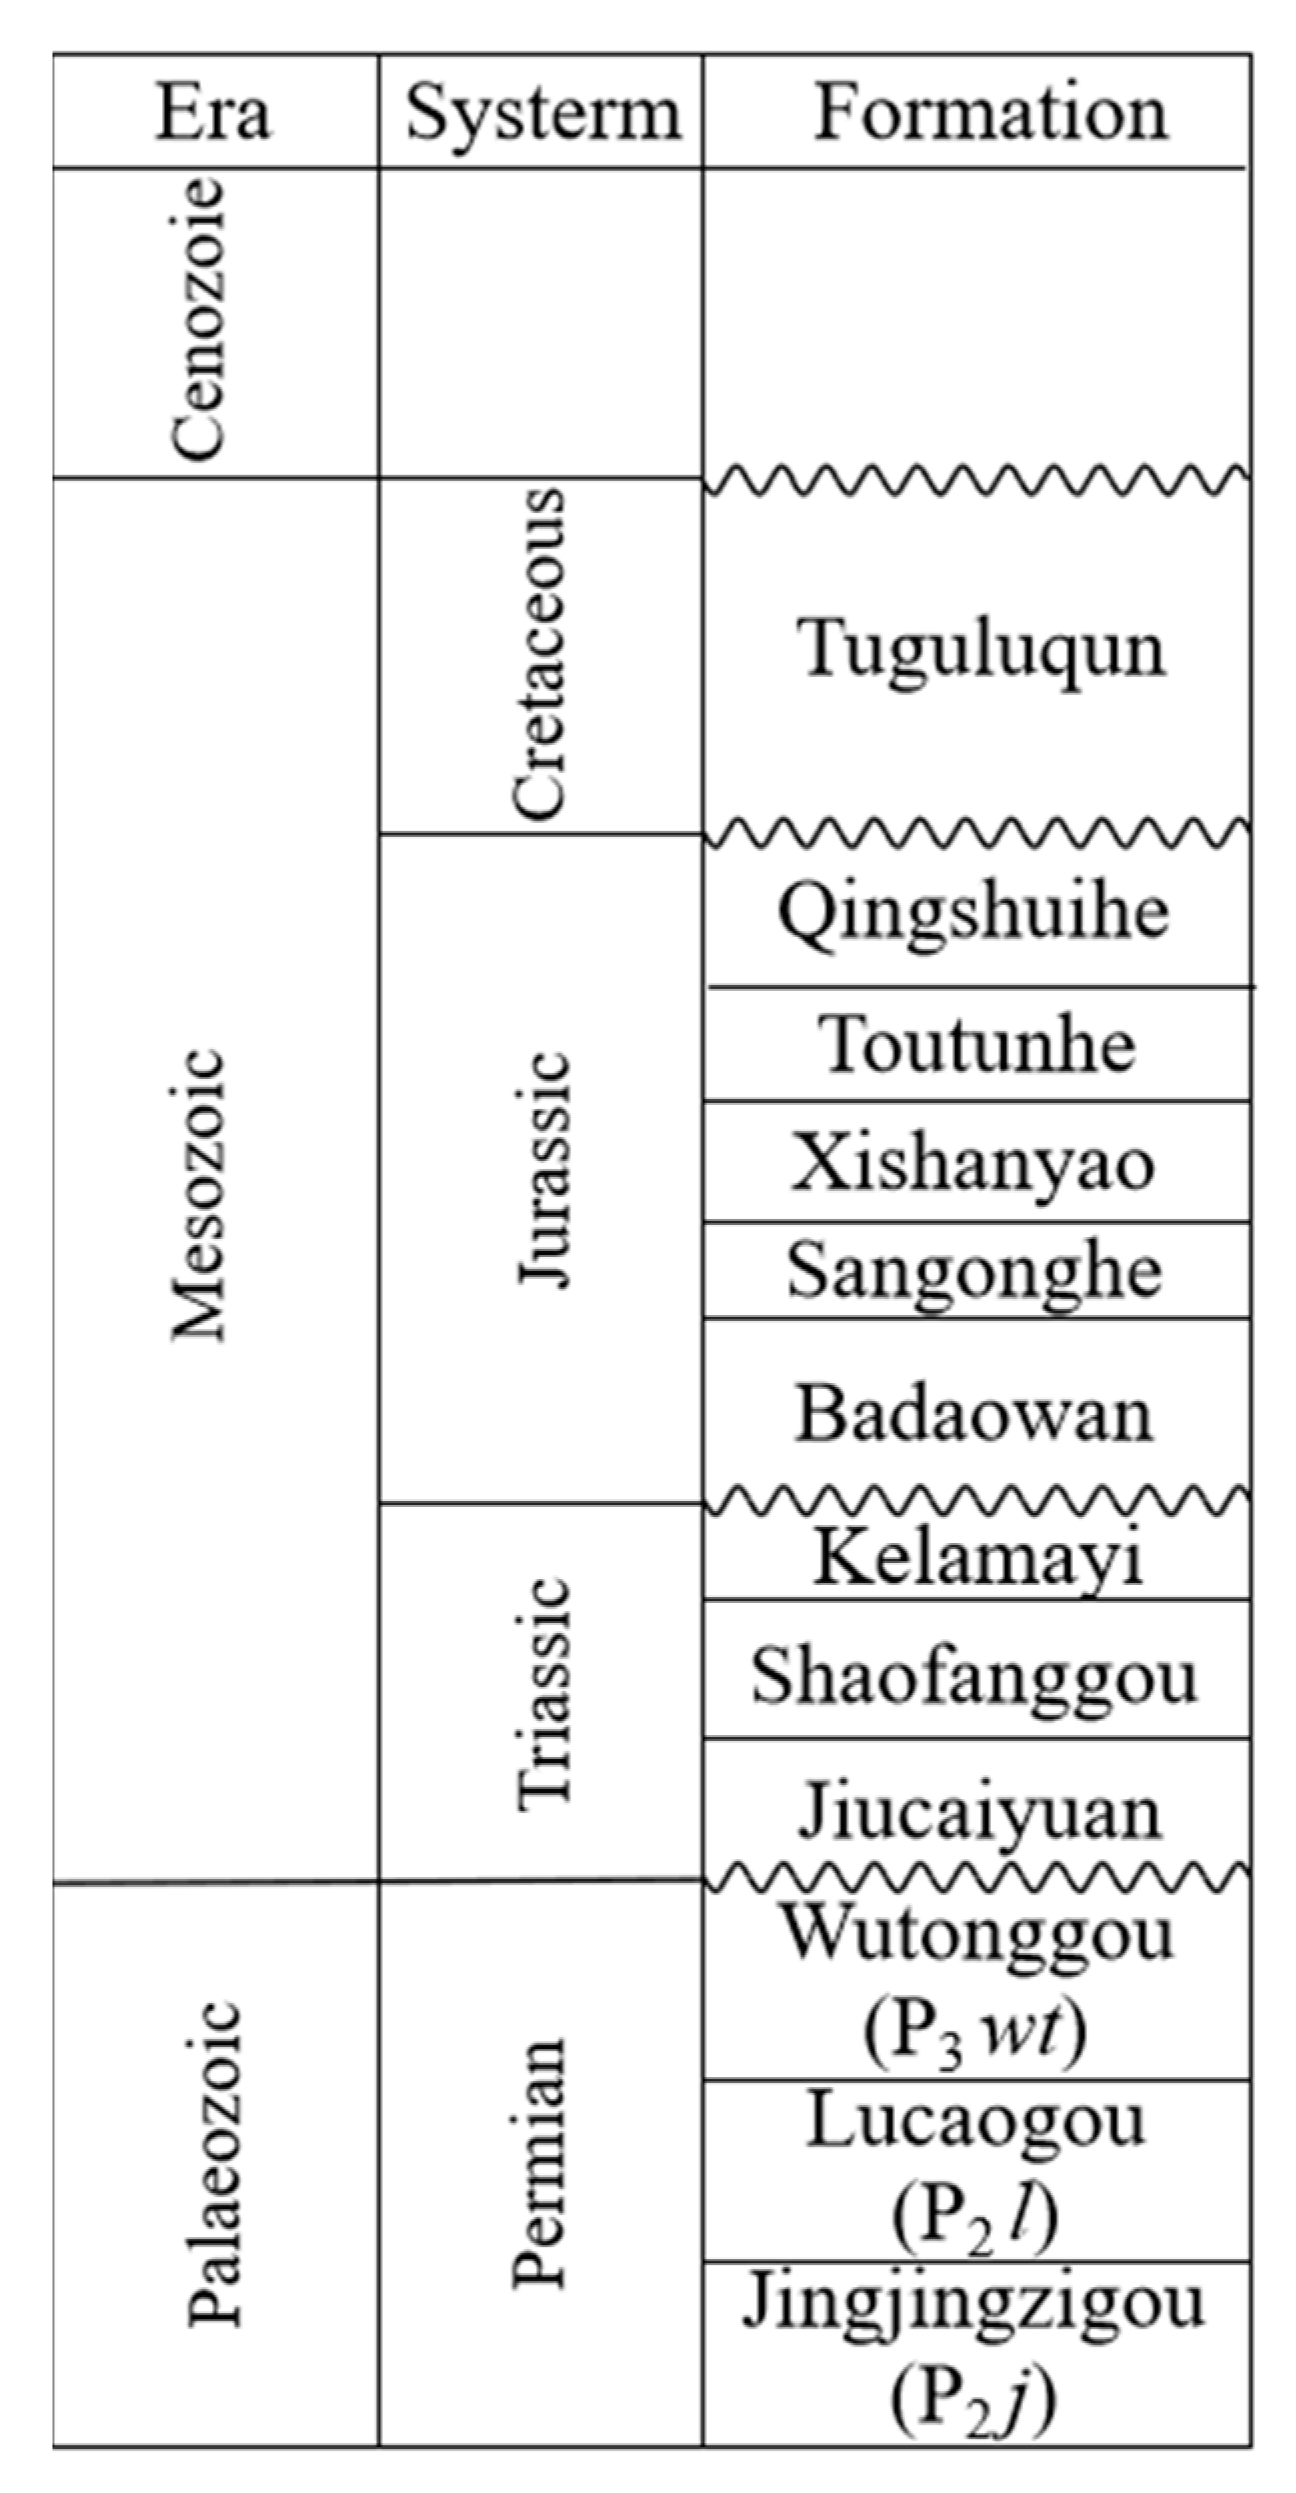
2. Samples and Methods

The Jimusar Sag can be found in the east of the Junggar Basin in northwest China [4] (Figure 1a,b). The stratigraphic formations from top to bottom of the study area at the Junggar Basin include the Cretaceous, Jurassic, Triassic, and Permian (Jingzigou Formation, Lucaogou Formation, Wutonggou Formation) Strata [25] (Figure 2). There were over 40 wells in the study area with the purpose of investigating the Lucaogou Formation in the Jimusar Sag, and oil and gas were found from some wells [26] (Figure 1c).
In the study, the experimental rock samples were mainly obtained from the core samples of two wells in the Jumusar sag of the Junggar Basin, which can be used for physical and rock mechanical tests. The original workflow of the research in the paper is shown in Figure 3. The sample no., well name, depth, lithology, and test types are shown in Table 1. In Table 1, 28 core samples were selected for uniaxial compression and triaxial compression tests. Table 1 indicates that the lithology of the core samples at different depths is different, indicating that the lithology of the core samples is relatively complex, including micritic dolomite, detrital feldspar sandstone, argillaceous siltstone, sandy micritic dolomite, siltstone, dolomite, siltstone, dolomitic mudstone, dolomitic siltstone, etc. This is consistent with previous research results [4]. The collected rock samples were prepared into cylindrical plug samples with a diameter of 25 mm. The two end faces of the plug samples were ground smooth to achieve a flatness of ±0.05 mm [27]. Before testing, the plug samples were dried at 105 °C for 24 h to remove any moisture.
According to the relevant requirements of the Chinese Standard GB/T 50266-2013 [27], the mass, average diameter, and length of the sample were measured, and the volume of the sample was calculated. On this basis, the bulk density of the samples can be obtained by dividing the measured mass by the volume.
According to the Chinese Standard GB/T 50266-2013 [27], the P-wave velocity of rock sample can be gained using the ultrasonic pulse transmission method and the frequency value in this study was 50 kHz. The principle diagram of the ultrasonic pulse test is shown in Figure S1 (within the Supplementary Data). The P-wave velocity of rock sample can be calculated as follows:
V p = L t p t p 0 Δ t p = V p 1
where L is the length of rock sample, m; tp is arrival time of the first wave of the P-wave, s; tp0 is system delay time, s; Vp is the P-wave velocity, m/s; and △tp is the P-wave interval transit time, s/m.
According to the Chinese Standard GB/T 50266-2013 [27], the uniaxial compressive strength (UCS), Young’s modulus (Es), Poisson’s ratio (νs), cohesive strength (C), internal friction angle (φ), and tensile strength (σt) of rock samples can be acquired from the mechanical experiments. During the experiments, the RTR-1000 testing system was adopted, which is shown in Figure S2 (within the Supplementary Data). Based on the experimental results, the stress–strain curve of rock sample can be drawn, which can be seen in Figure S3 (within the Supplementary Data). On this basis, the UCS, Es, and νs can be calculated as follows [9]:
U C S = P / A
E s = Δ σ / Δ ε
v s = ε r / ε a
where P is the load corresponding to the rock sample fracture, kN; A is the bottom area of the cylindrical rock sample, m2. The calculation diagram of the Es and νs can be seen in Figure S4 (within the Supplementary Data). During the elastic stage of the stress–strain curve, Δσ is the axial stress, MPa; Δε is the axial strain, %; εr is the radial strain, %; and εa is the axial strain, %.
In addition, the damage envelope can also be obtained through the relationship between the confining pressure and the peak strength. The slope k and intercept b were obtained using the linear regression method. Therefore, the φ and C can be calculated from the slope k and intercept b as follows [28]:
φ = arcsin k 1 k + 1
C = b 1 sin ( φ ) 2 cos ( φ )
For each sample, both DEN, Vp and UCS, C, φ, Es, and νs were obtained from laboratory tests. The relationships between physical parameters and rock mechanical properties should be discussed. The regression analyses (linear and non-linear) were applied to obtain the fit formula. Based on this, the empirical relationships for evaluating the rock mechanical properties of the shale oil reservoirs were established. In order to evaluate the prediction effect, statistical analysis was essential. The goodness of the fit for each empirical correlation was evaluated using the coefficient of determination (R2). The R2 can be calculated as follows:
R 2 = 1 n i = 1 y i y ^ i 2 n i = 1 y i y ¯ 2
where y i and y ^ i are the measured and estimated value of y for the ith data point, respectively, y ¯ is the average value of the measured value, and n is the number of data points.
Furthermore, the root mean square error (RMSE) and average absolute relative deviation (AARD) are also applied to estimate the goodness of the fit for each empirical correlation. The AARD and RMSE were calculated as follows:
R M S E = y i y ^ ı 2 / n
A A R D = y i y ^ i / y i n × 100
In addition, a number of empirical equations were introduced to evaluate the rock mechanical properties. Some empirical equations suggested in the literature between physical parameters and rock mechanical properties for different rock types are seen in Table 2. From Table 2, the empirical equations in the different literature for estimating the rock mechanical properties are different.

3. Results and Discussion

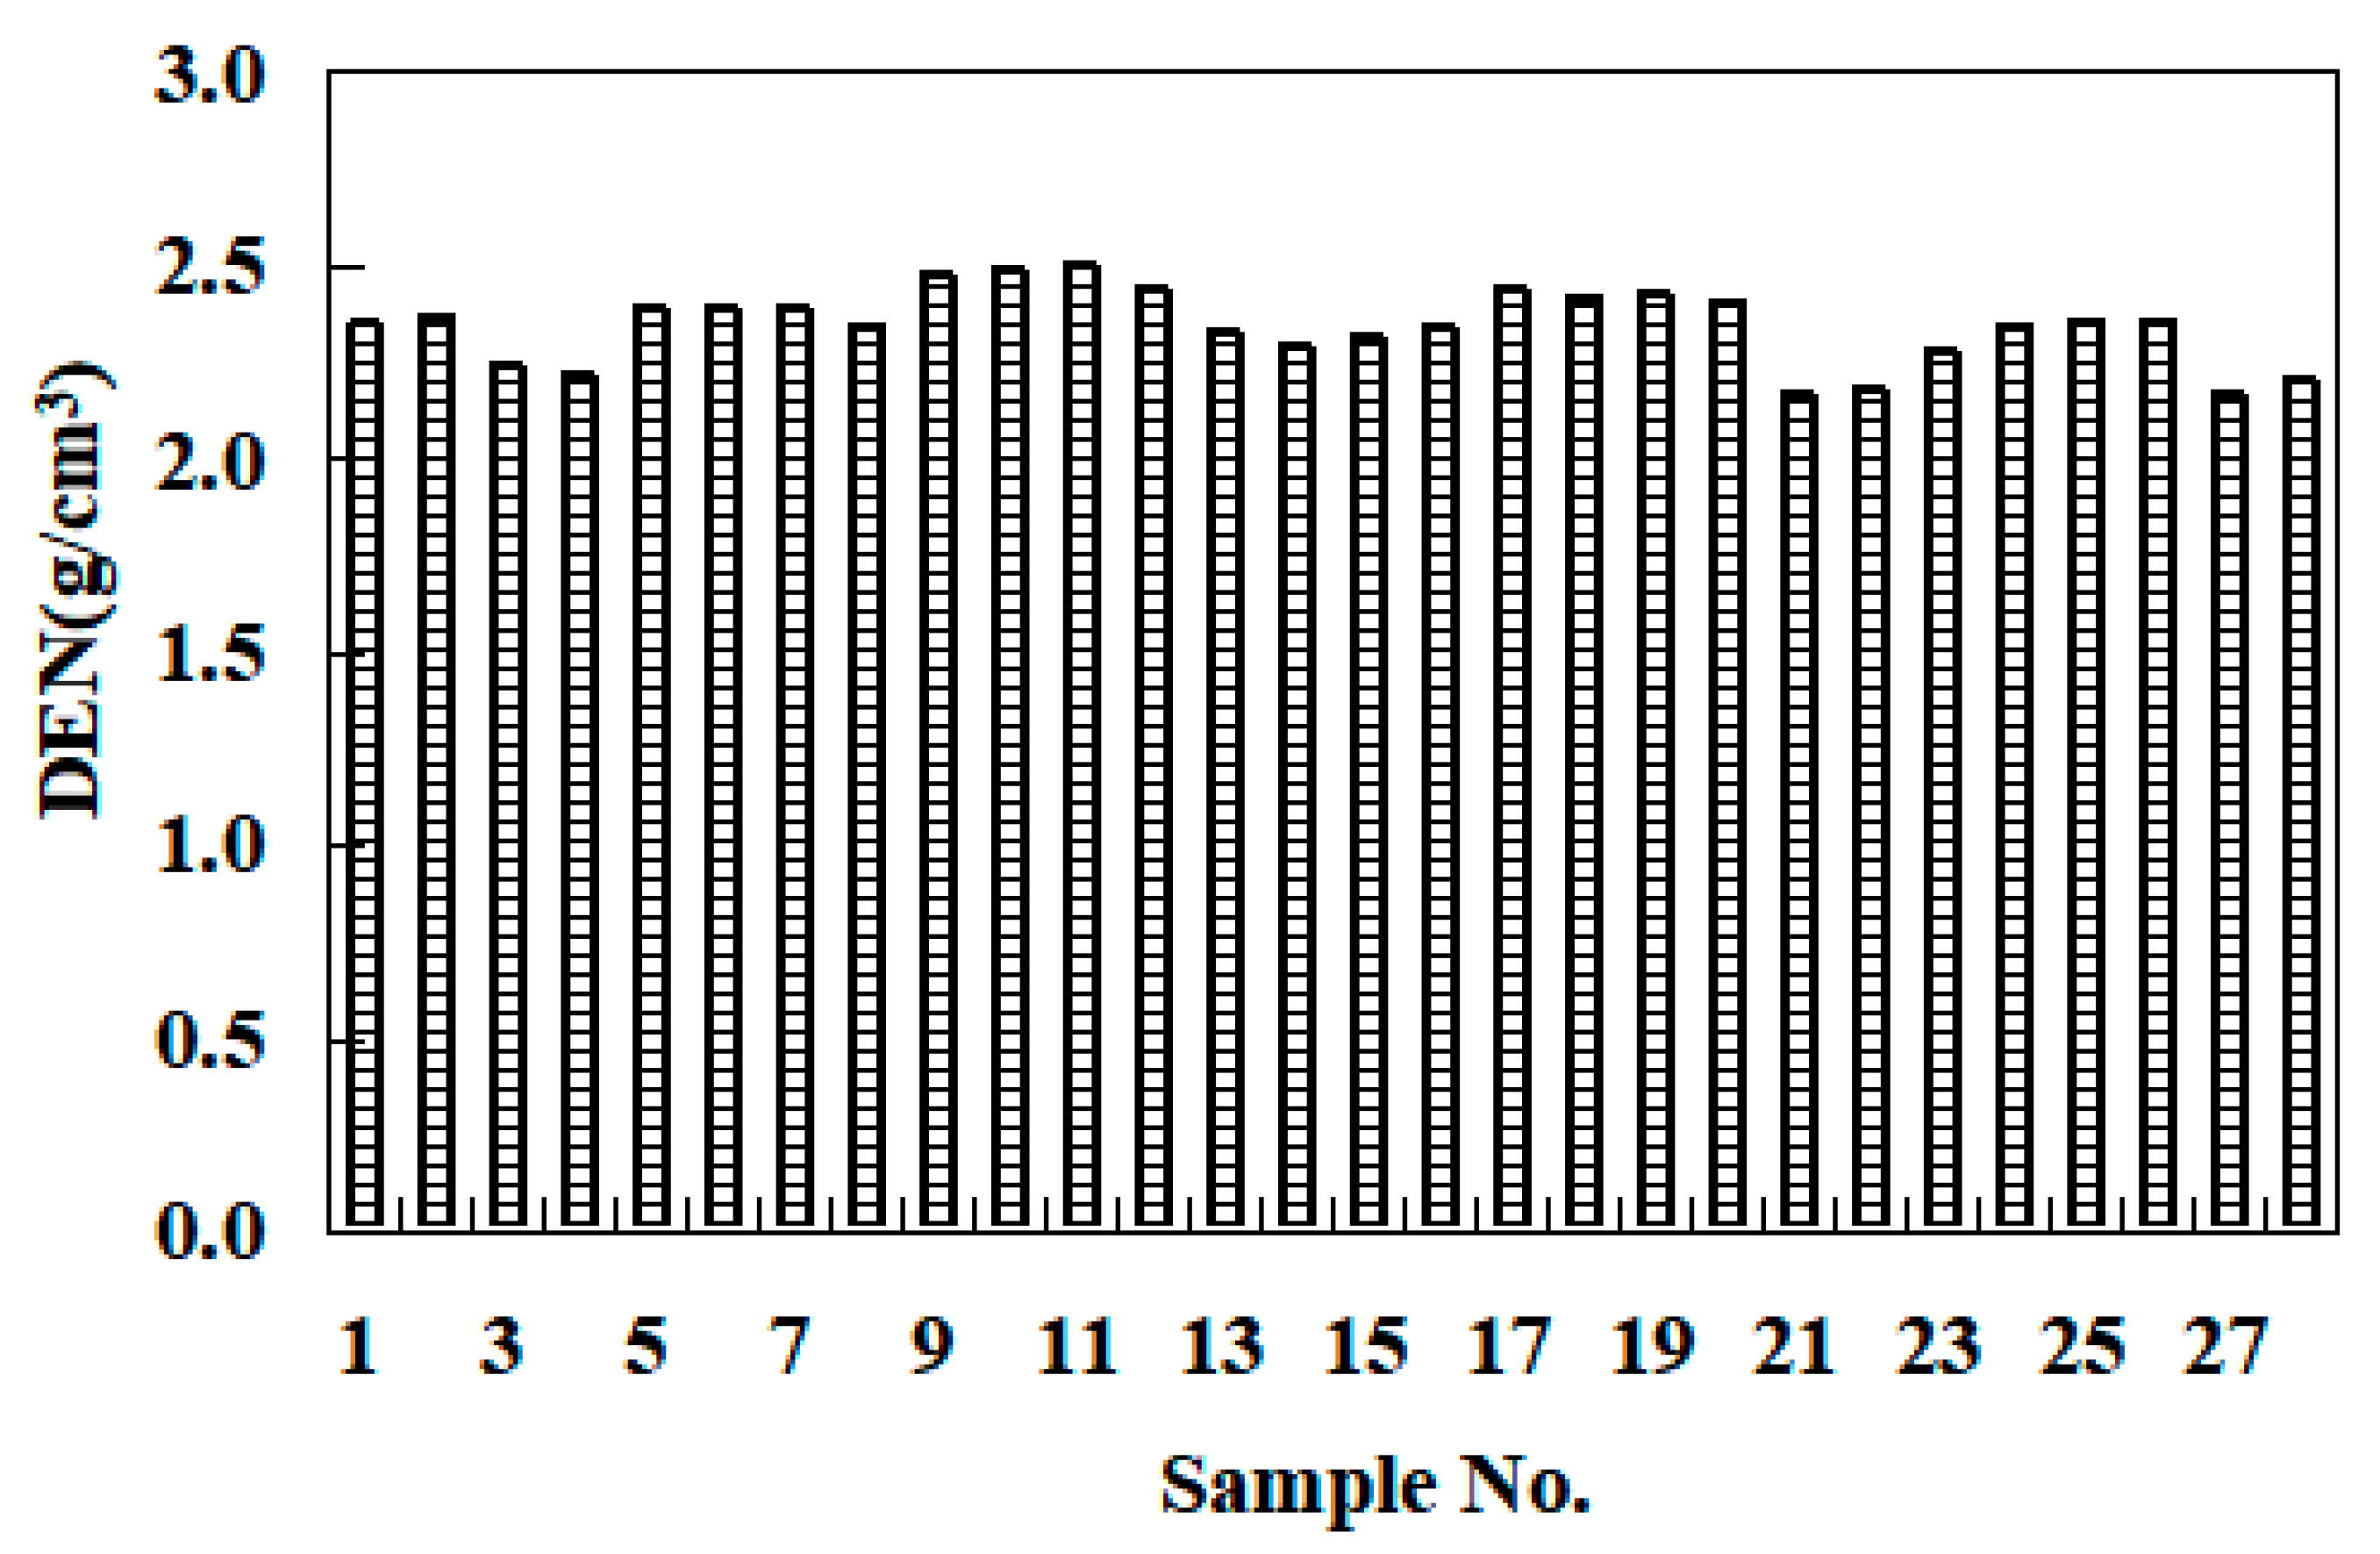
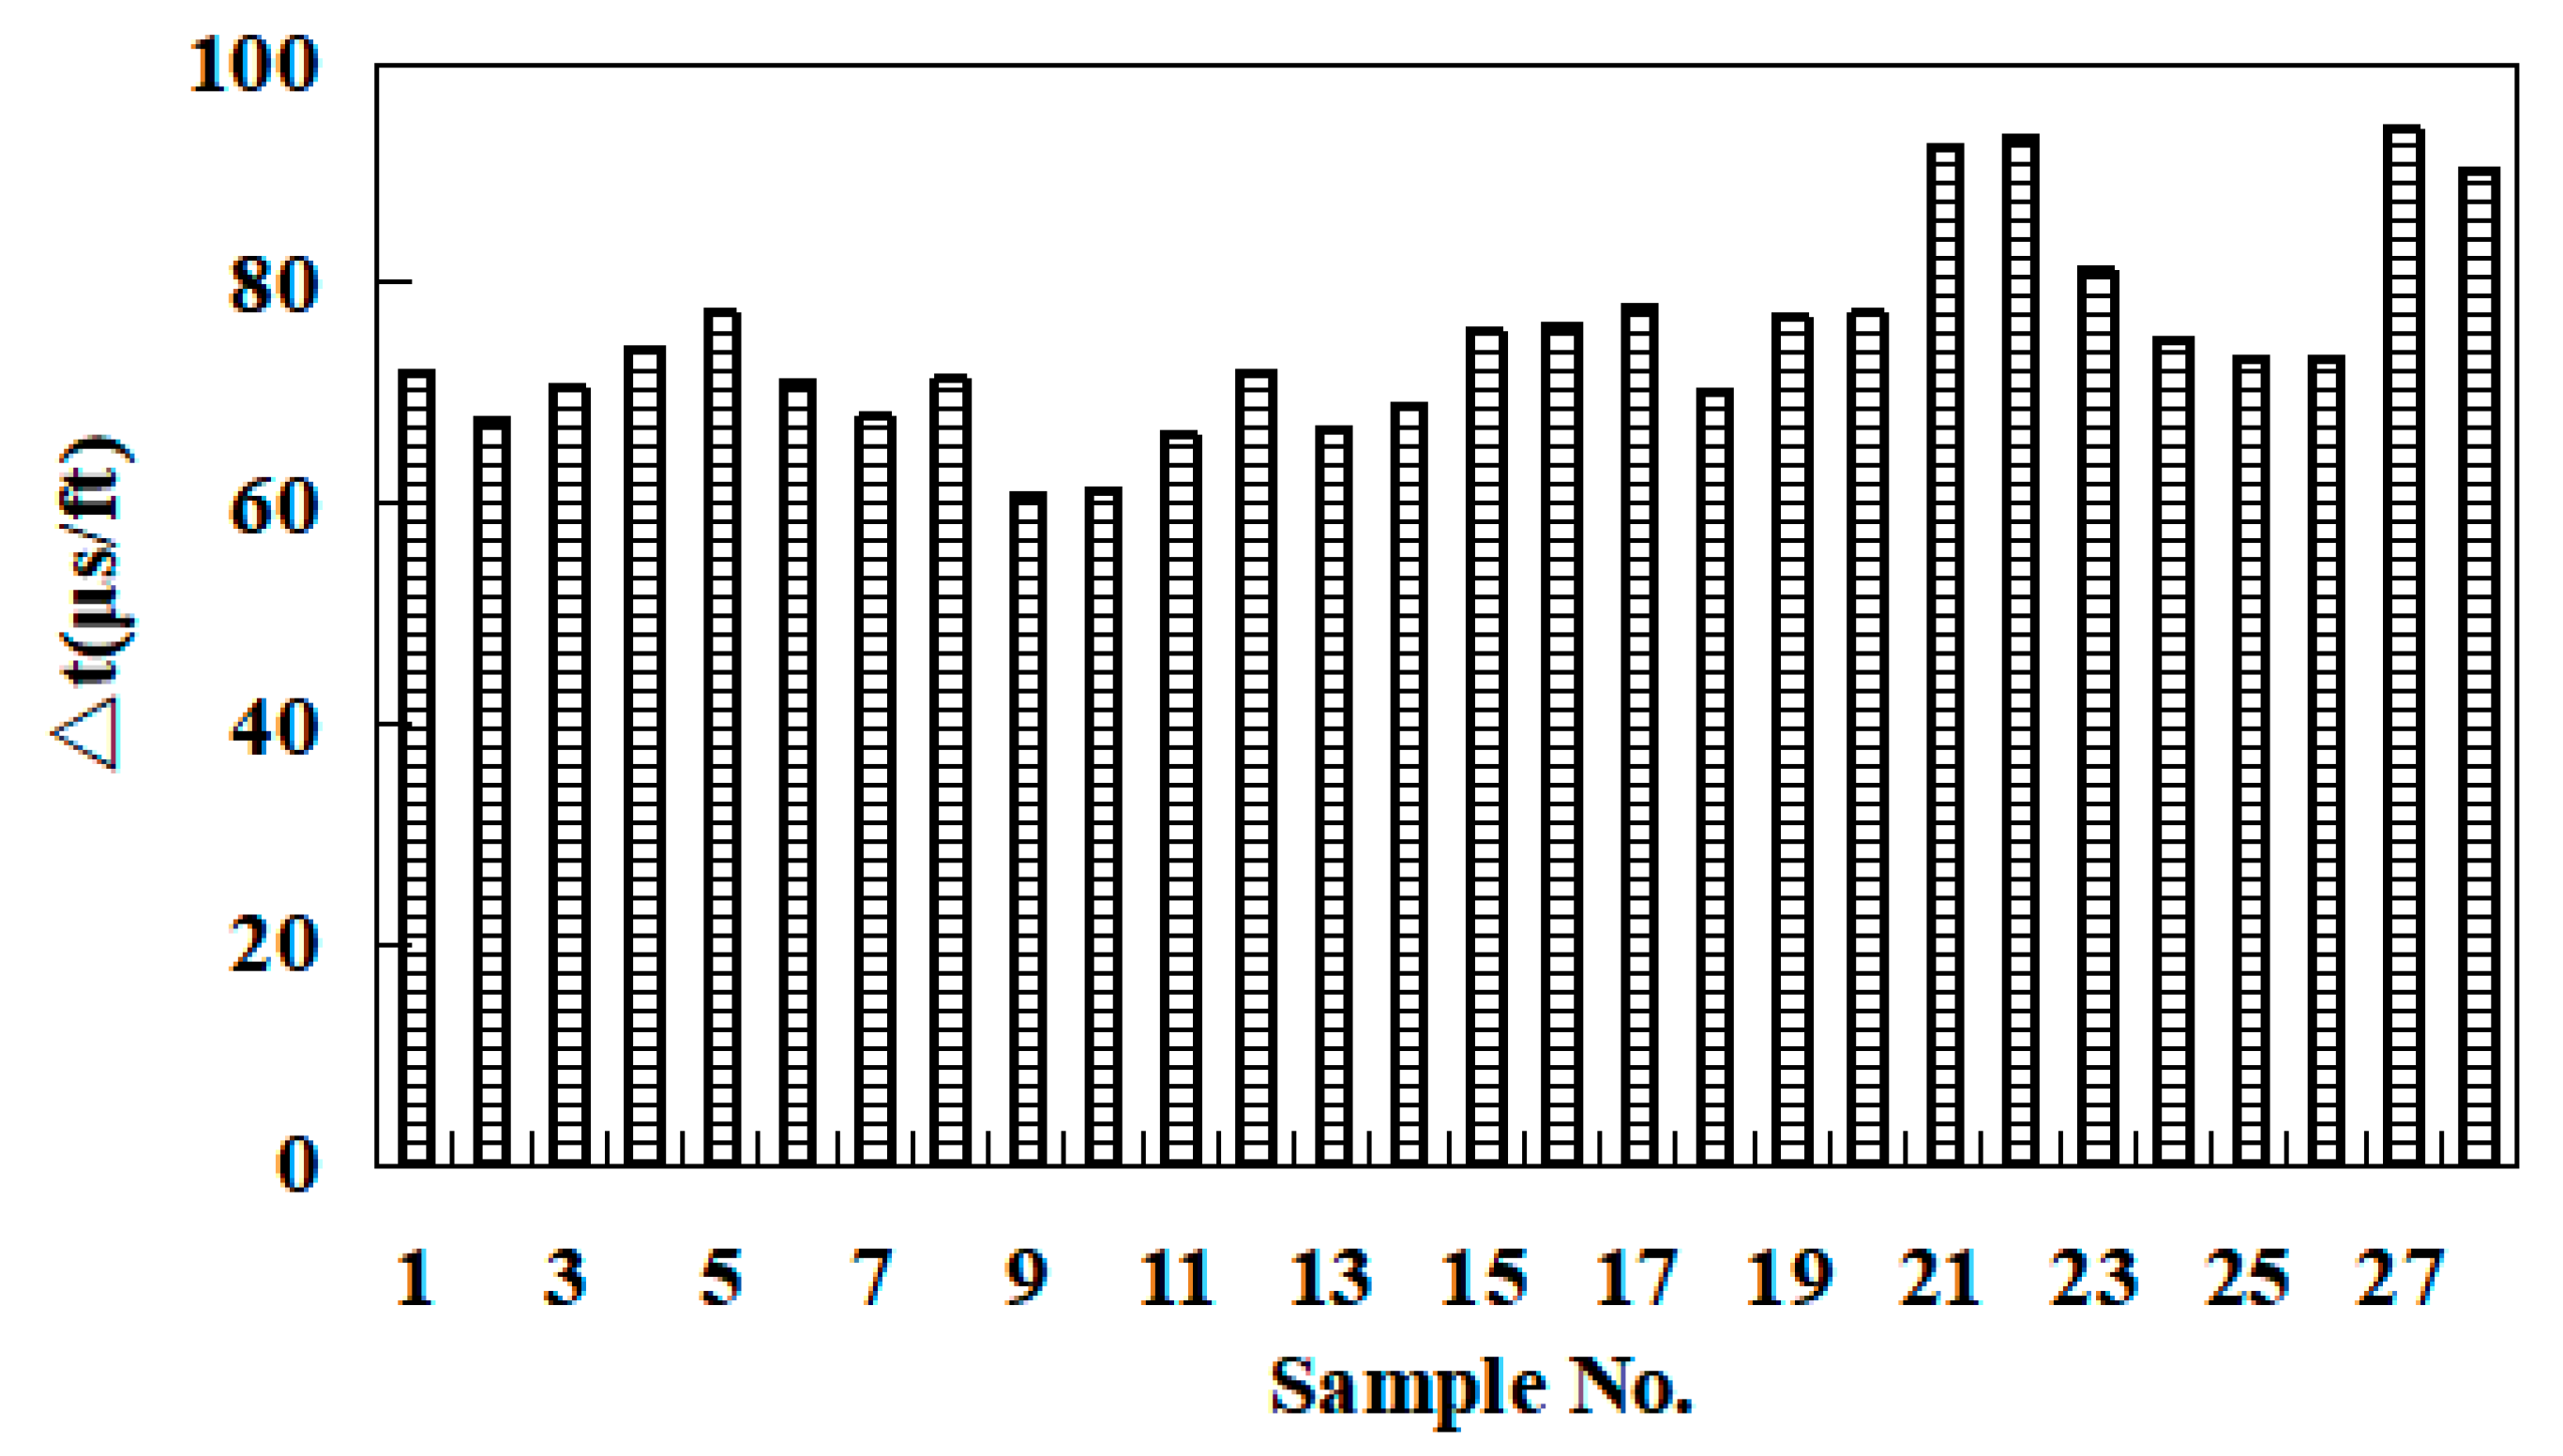
3.1. Density and P-Wave Interval Transit Time

The bulk density of the rock samples is listed in Figure 4, where it can be noted that the bulk density of the samples ranged from 2.17 to 2.50 g·cm−3 with an average of 2.35 g·cm−3. Additionally, there was a certain range of variation in the bulk density of different samples, and the change was less than 0.36 g·cm−3. The difference in bulk density may be caused by the difference in the mineral composition, mineral content, and porosity of samples from the Permian Lucaogou Formation in the Junggar Basin. The P-wave interval transit time of the rock samples is shown in Figure 5 and was between 60.96 and 94.22 μs/ft for the samples, with a mean value of 74.84 μs/ft. There is a certain range of variation in the P-wave interval transit times of different samples, and the change is less than 33.62 μs/ft. The difference in the P-wave interval transit time may be due to the difference in the pore structure of samples from the Lucaogou Formation of Permian in the Junggar Basin. The correlation between the density and the P-wave interval transit time is depicted in Figure S5 (within the Supplementary Data). The P-wave interval transit time decreases with increasing density, with a correlation coefficient of 0.5895. The results of the study are in consistent with the conclusions of previous research [16].

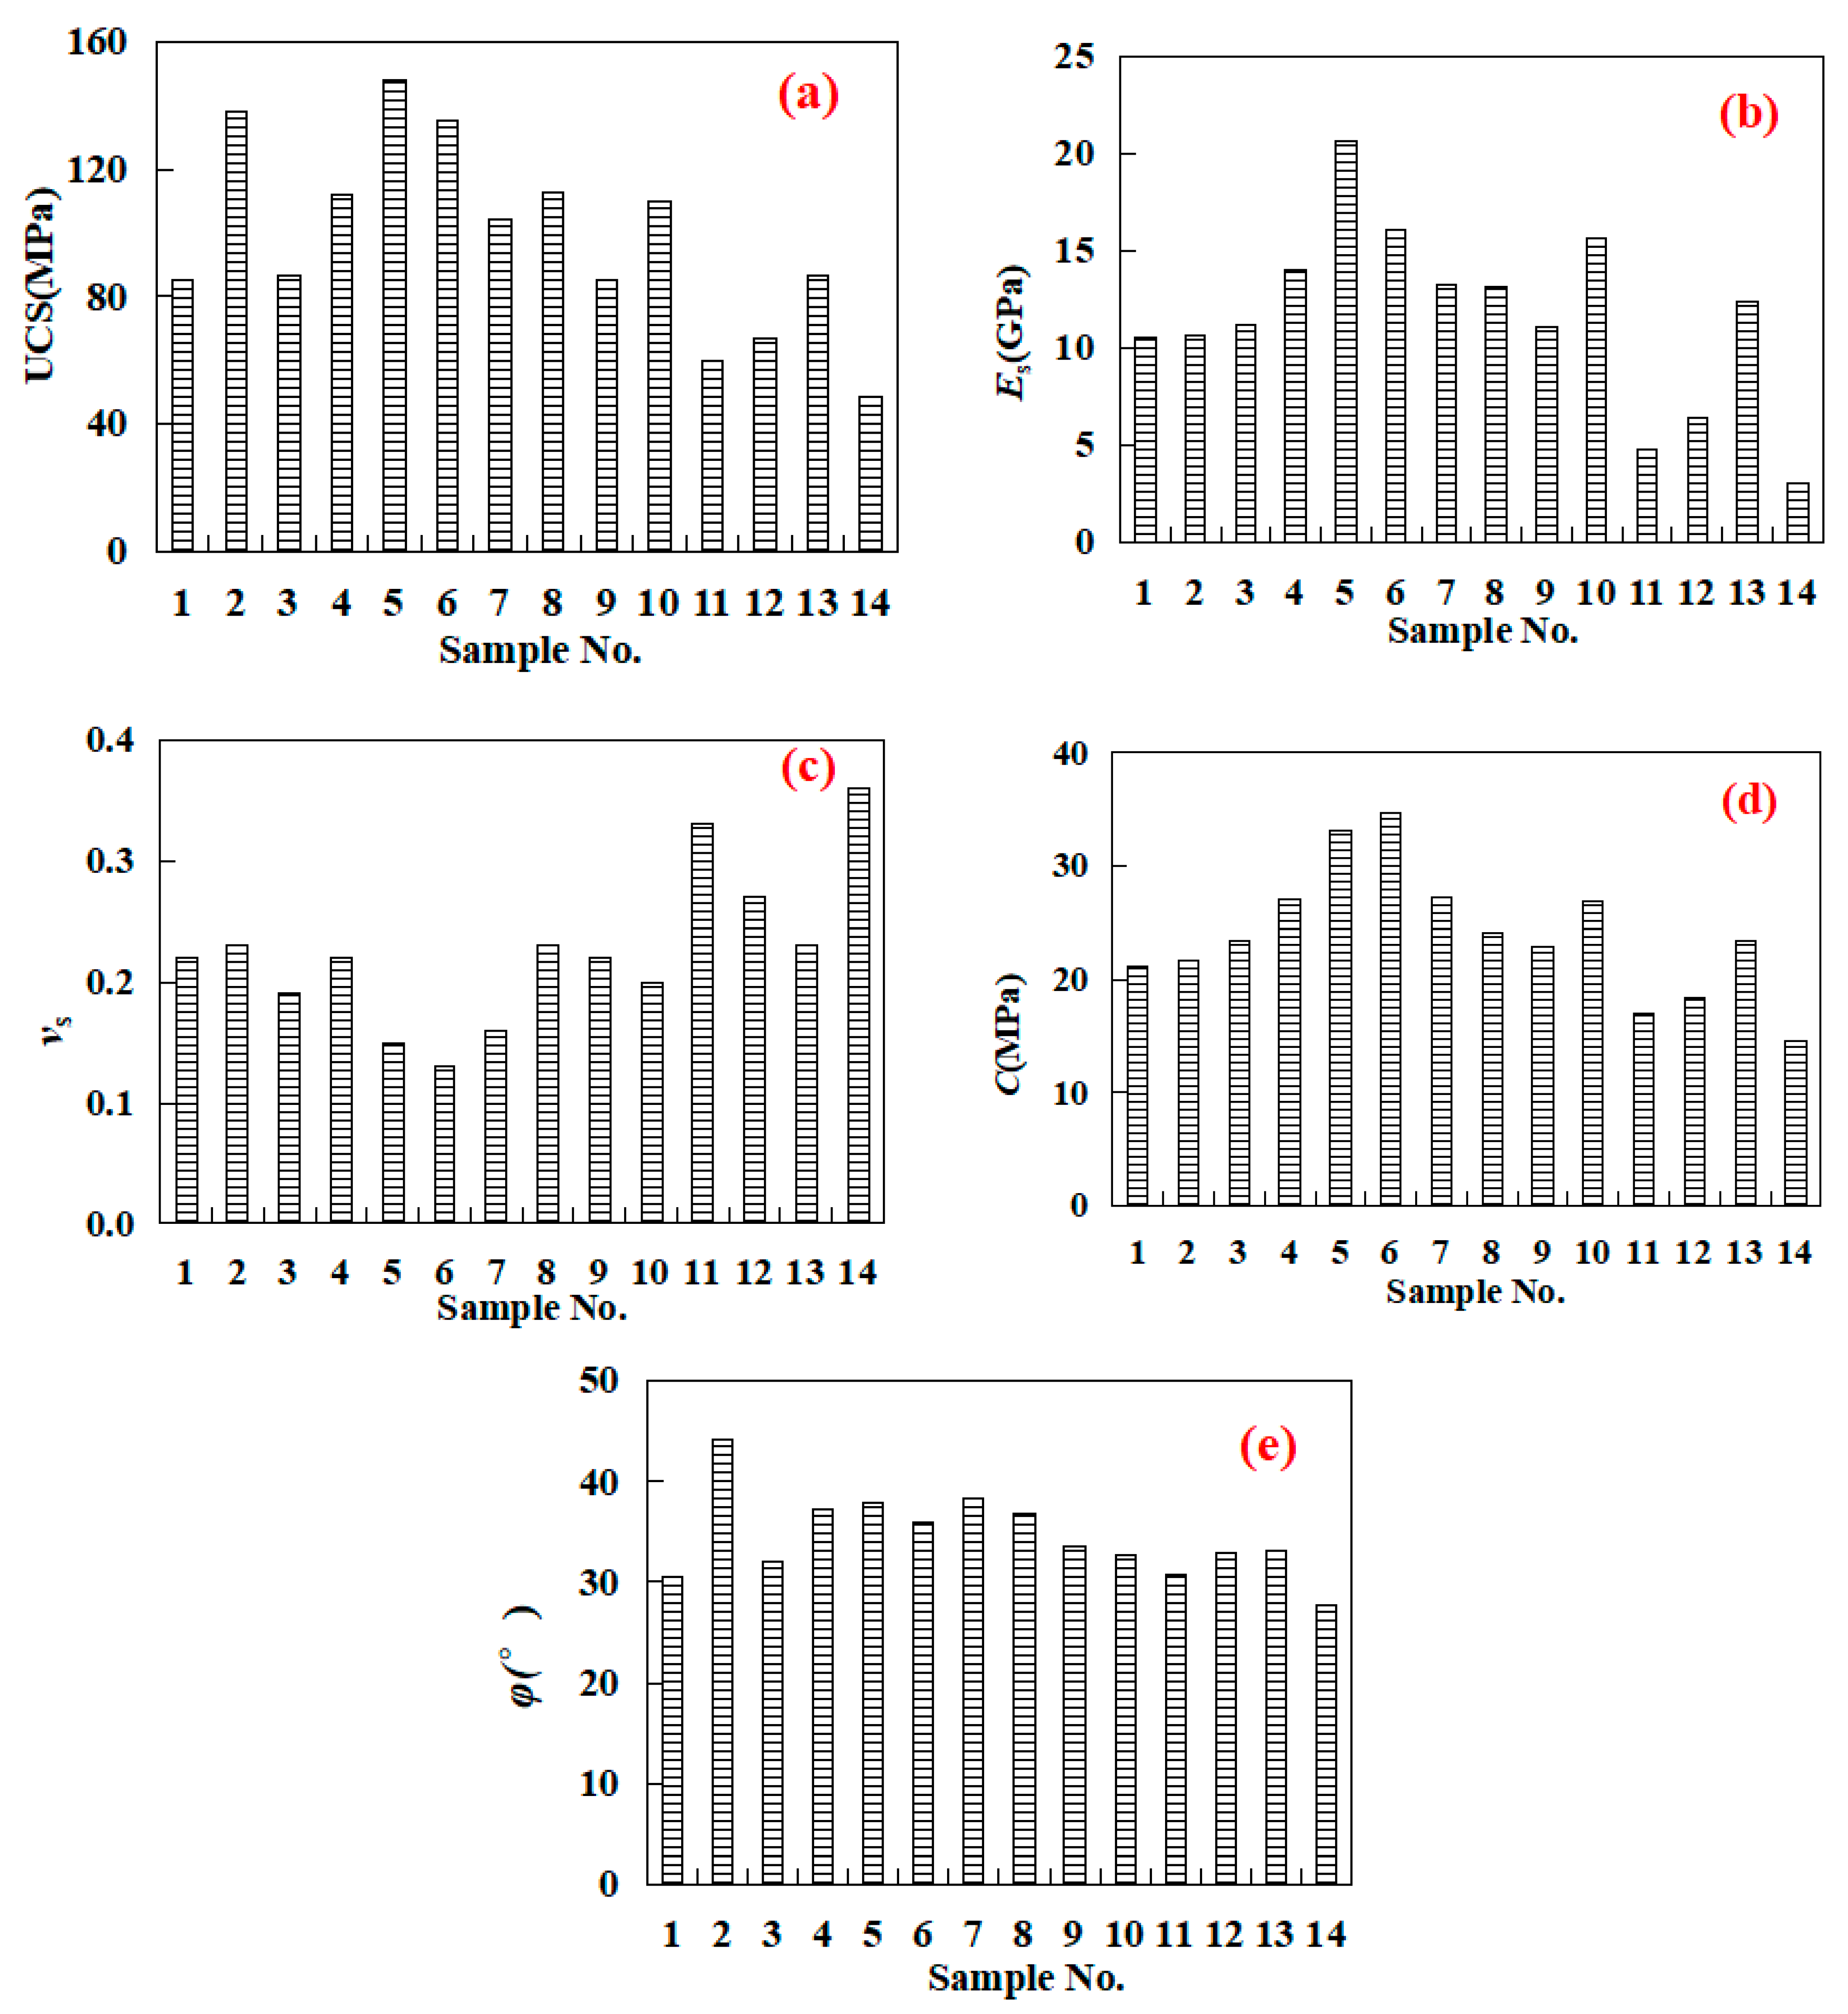
3.2. Rock Mechanical Properties

Based on the uniaxial/triaxial compression tests, the UCS, C, φ, Es, and νs can be determined, as shown in Figure 6. We can observe that the UCS of the samples was between 48.40 and 147.86 MPa, with an average of 98.48 MPa (Figure 6a); the Es of the samples ranged from 3.02 to 20.63 GPa with a mean value of 11.64 GPa (Figure 6b); the νs of the samples ranged from 0.13 to 0.36 with a mean value of 0.22 (Figure 6c); the C of the samples was between 14.65 and 34.60 MPa, with a mean value of 23.97 MPa (Figure 6d); and the φ of the samples was between 27.61 and 46.94°, with an average of 34.89 ° (Figure 6e). According to previous works [17,18,19,20,21,22,23,24,29,30,31,32,33,34,35], our results fall within acceptable ranges. Additionally, there is a wide range of variation in the strength parameters and static elastic parameters of different samples, indicating that the rock samples from the Permian Lucaogou Formation in the Junggar Basin have strong heterogeneity.

3.3. Empirical Correlations for the Rock Mechanical Properties

The bulk density and P-wave velocity are parameters that can be obtained from geophysical well logging. In previous studies [17,18,19,20,21,22,23,24,29,30,31,32,33,34,35], there was evidence of strong relationships between both parameters and rock mechanical properties. Referring to previous research ideas, the relationships between single parameters (Vp or DEN) or a combination of parameters considering the two parameters of Vp and DEN and rock mechanical properties were investigated. Then, the appropriate relationship can be selected based on the relative error. Finally, local empirical equations for evaluating the rock mechanical properties of the Permian Lucaogou Formation shale oil reservoirs in the Junggar Basin can be established, resulting in better prediction accuracy.

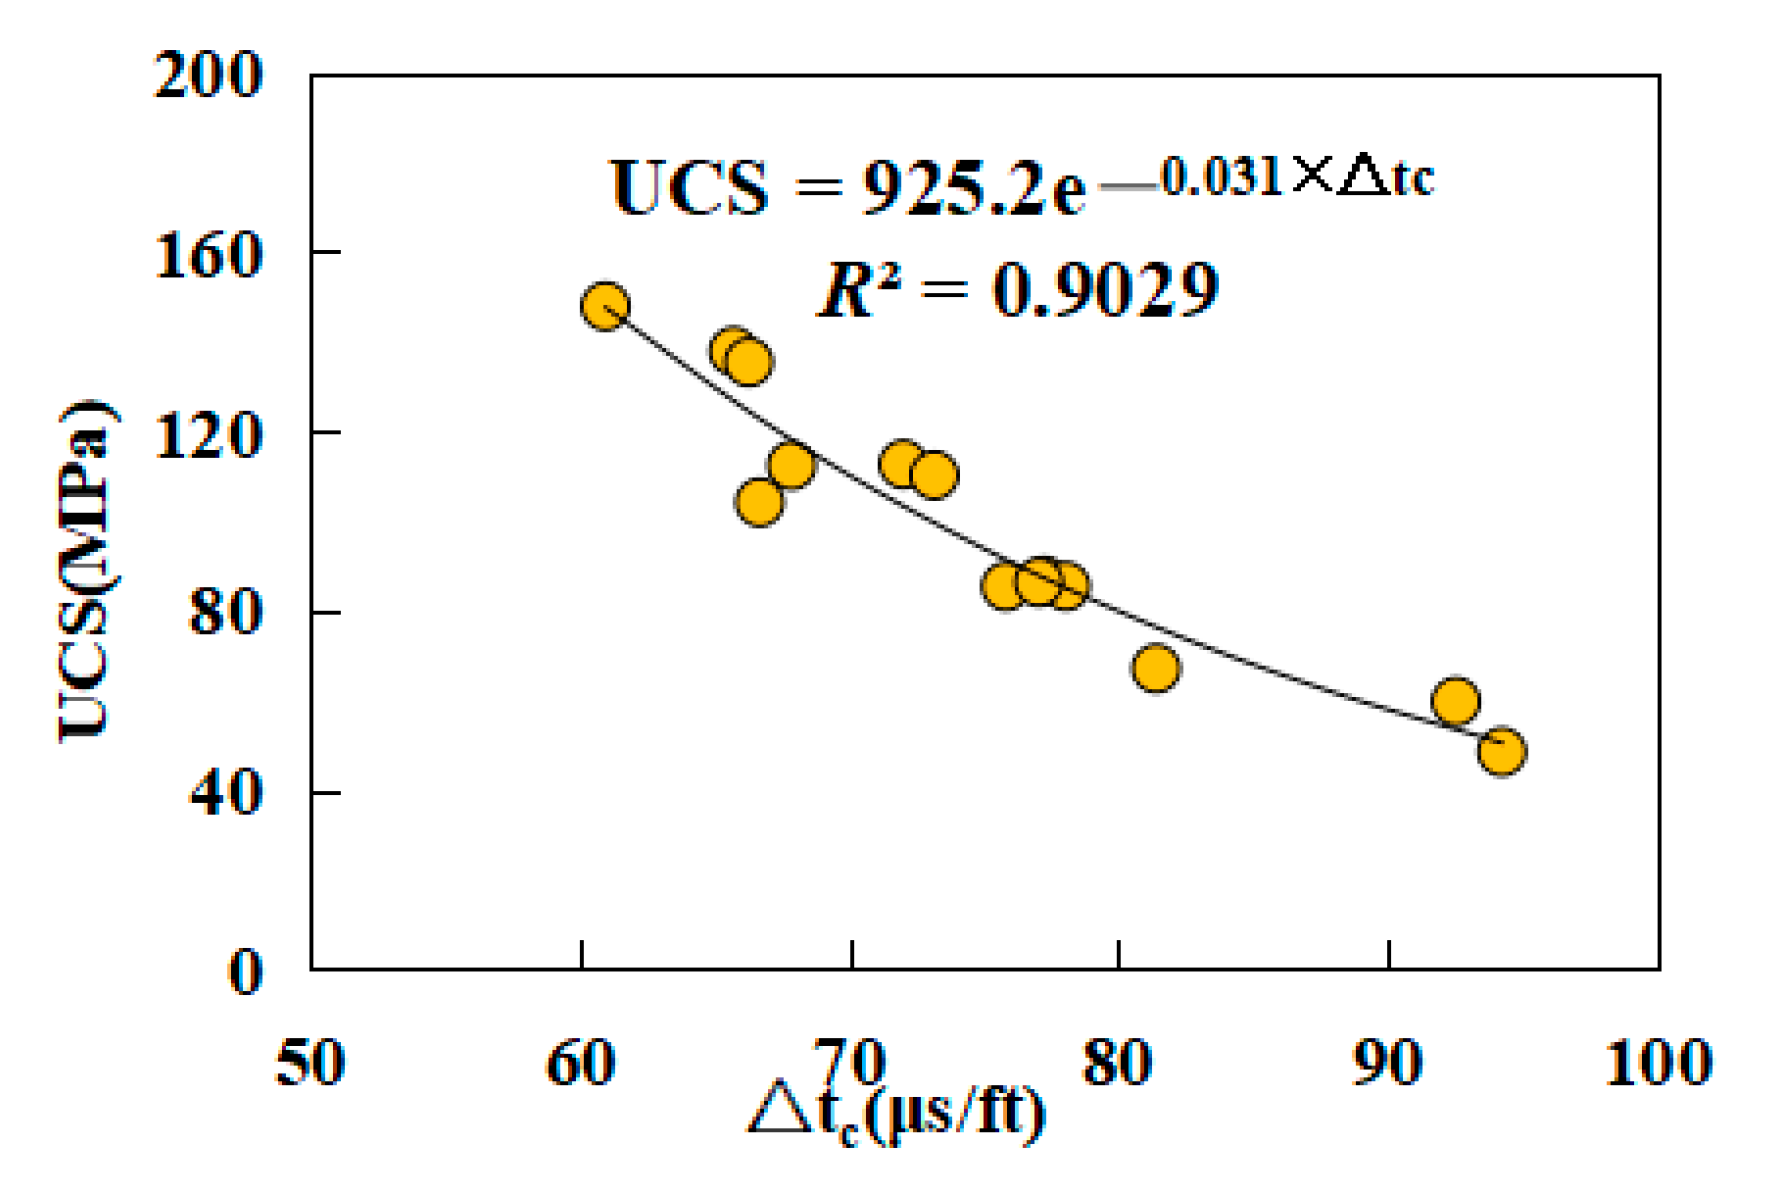
3.3.1. Strength Parameters

The correlation between the uniaxial compressive strength and the P-wave interval transit time is shown in Figure 7. From Figure 7, the UCS of rocks decreased with an increasing P-wave interval transit time. The finding was consistent with previous studies [17,18,19,20,21,22,23,24,29,30,31,32,33,34,35], suggesting that the UCS of rocks increased as the P-wave velocity increased (the wave velocity and wave interval transit time are reciprocal). From Table 2, empirical equations for estimating the UCS of rocks include linear, exponential, and power forms. Therefore, linear, logarithmic, exponential, and power curves were used to fit experimental data points, and then equations with the highest correlation coefficient (R2) were obtained. As shown in Figure 7, the curve based on the exponential function had the best fit, with an R2 of 0.9028. The equation of the curve is:
U C S = 925.2 e 0.031 × Δ t c     R 2 = 0.9029
The correlation between the cohesive strength and the P-wave interval transit time is shown in Figure S6 (within the Supplementary Data). From Figure S6 (within the Supplementary Data), the C of the rocks is negatively correlated with the P-wave interval transit time. The fitting effect between the C and the P-wave interval transit time was not good. Therefore, a combination of parameters considering the two parameters of the P-wave interval transit time and density were adopted to develop the equation for estimating the C of the rocks. The relationship between C and Δtc/DEN is described in Figure 8, indicating that the curve based on the power function had the best fit, with an R2 of 0.8898. The empirical equation for estimating the C of the rocks is as follows:
C = 2976.9 × Δ t c / D E N 1.402     R 2 = 0.8898
The correlation between the internal friction angle and the P-wave interval transit time is shown in Figure S7 (within the Supplementary Data), where the φ of the rocks was negatively correlated with the P-wave interval transit time, consistent with previous studies [16], indicating that the φ of rocks increased with the increasing P-wave velocity. The φ can also be estimated from the P-wave interval transit time or a combination of parameters considering the two parameters of the P-wave interval transit time and density. Simultaneously, the Mohr–Coulomb criterion indicates that there is a correlation among uniaxial compressive strength, cohesion, and the angle of internal friction [36]. Two of the three parameters have been established and the third parameter can be obtained via calculation. In other words, if the UCS and C are known, the φ can be calculated form the equation, as follows:
φ = 2 arctan U C S 2 C π 2 × 180 π

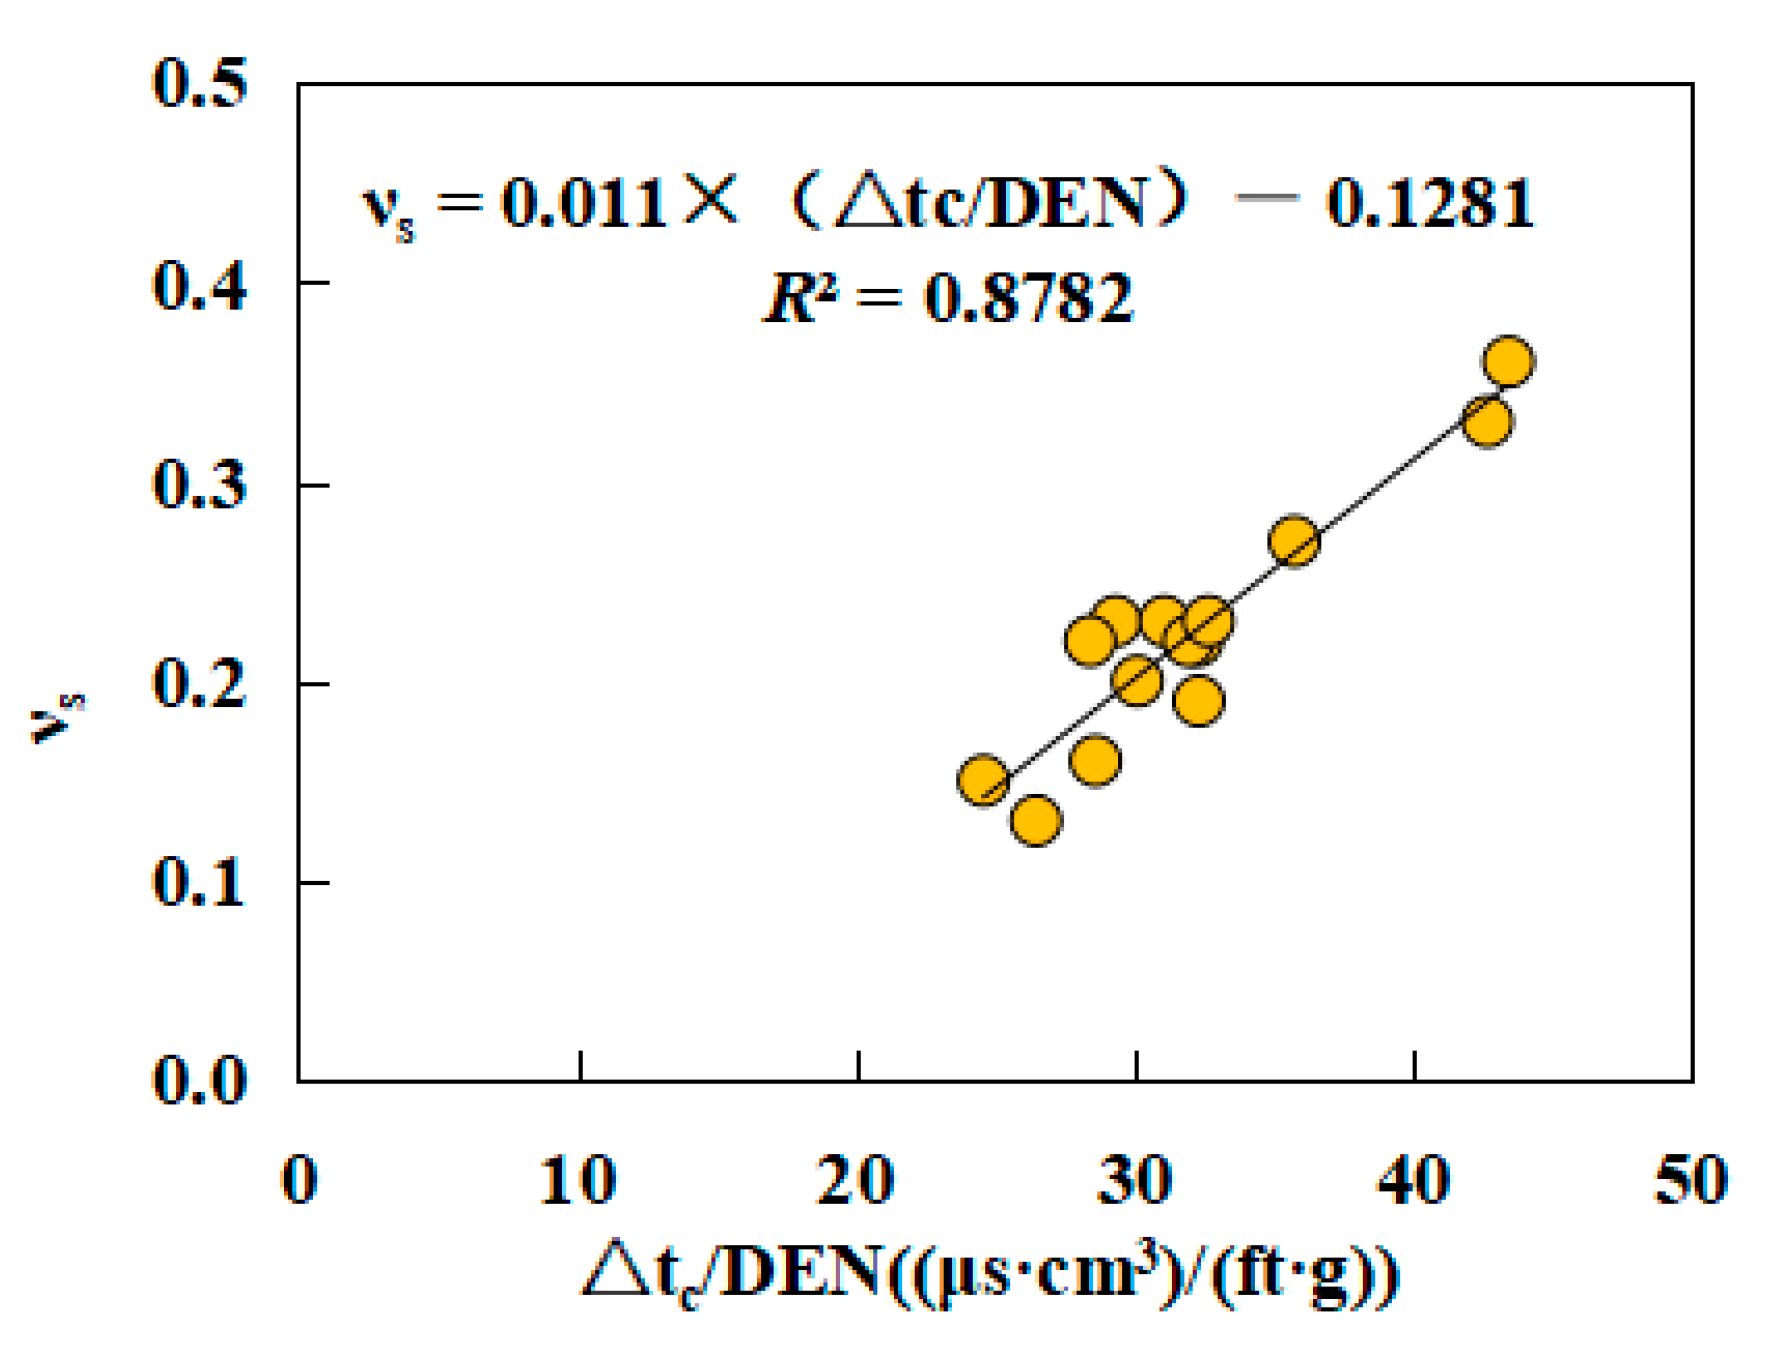
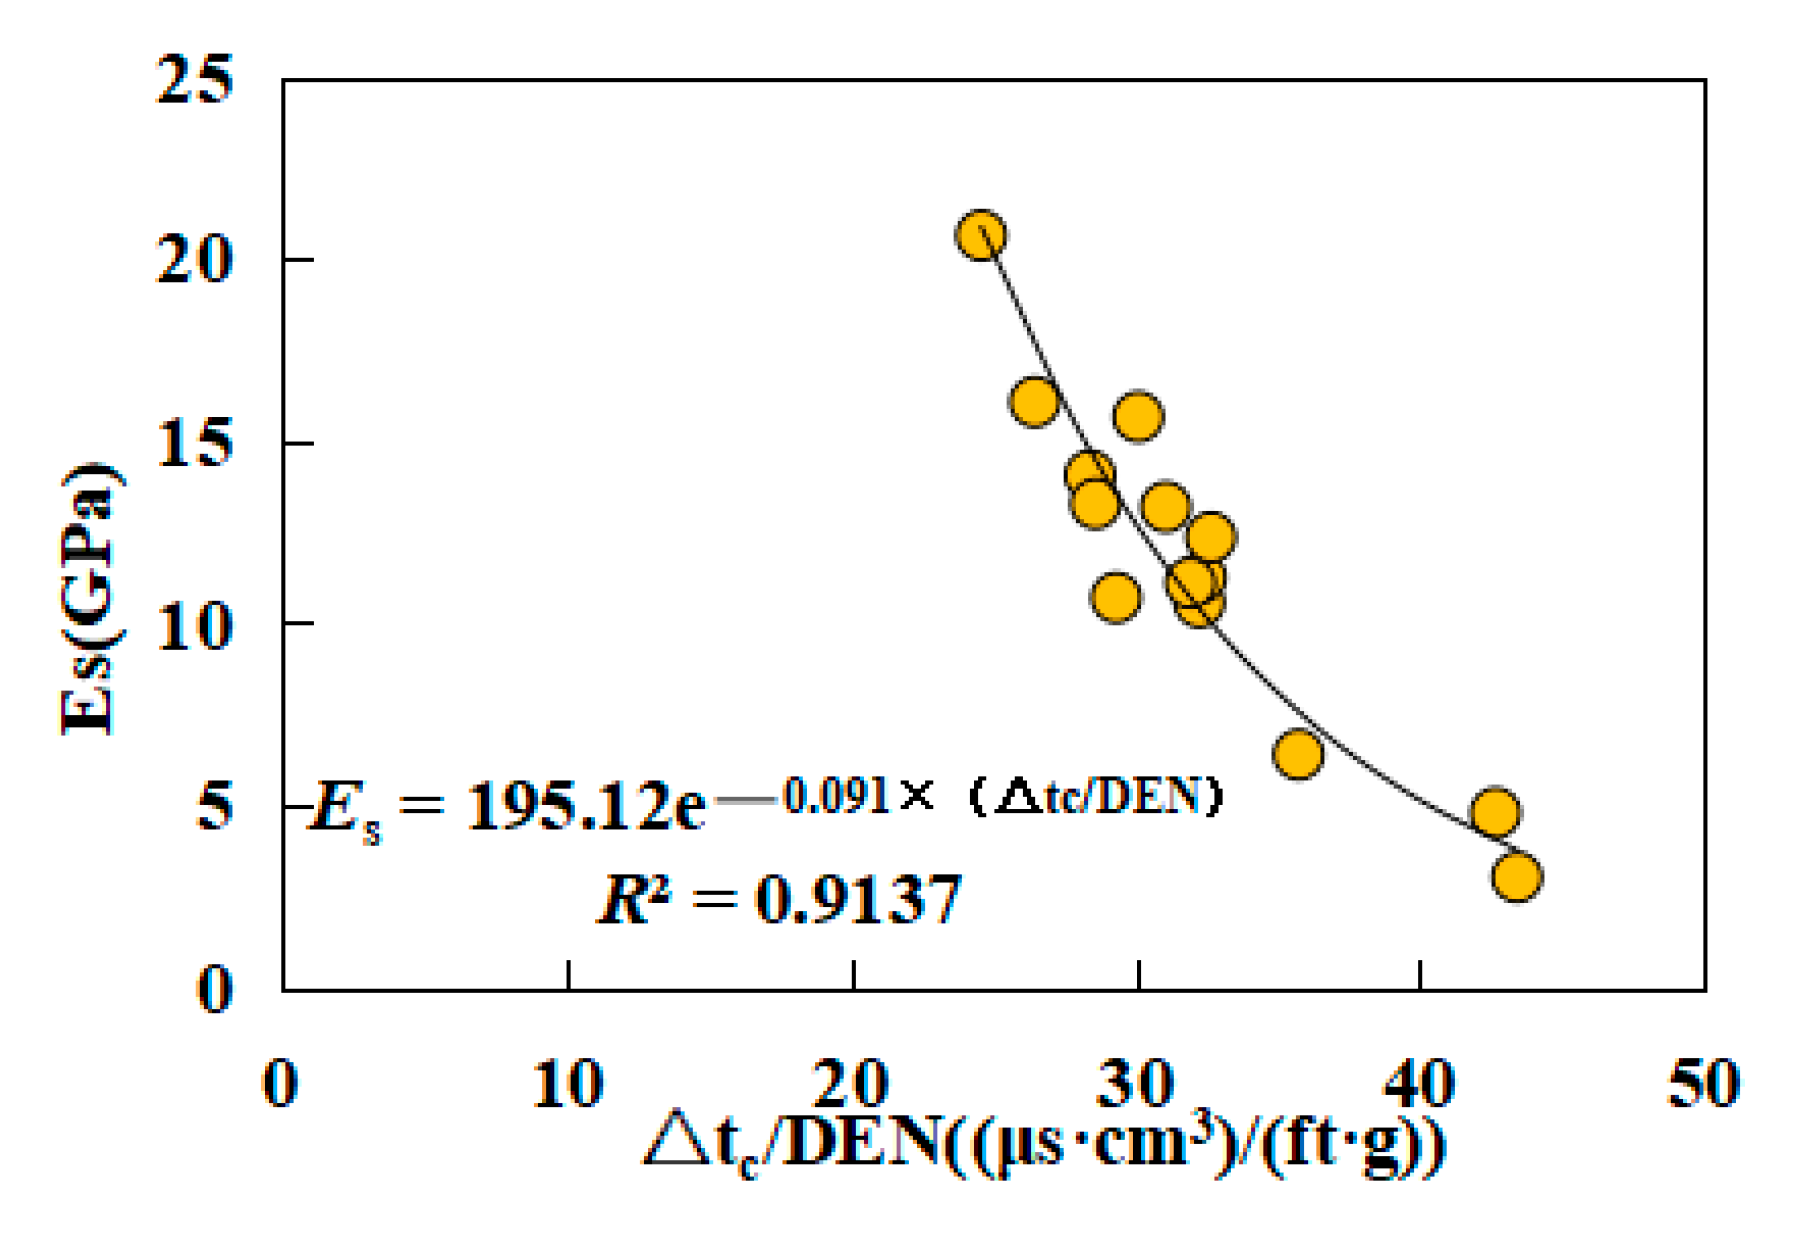
3.3.2. Static Elasticity Parameters

The correlation between the static Young’s modulus and the P-wave interval transit time is shown in Figure S8 (within the Supplementary Data), where the Es of the rocks was negatively correlated with the P-wave interval transit time, consistent with previous studies [19,20,29,33,34], suggesting that the Es of the rocks increased with the increasing P-wave velocity. The combination of parameters considering the P-wave interval transit time and density was adopted to develop the equation for estimating the Es of the rocks because of the higher R2. The relationship between Es and Δtc/DEN is described in Figure 9. Here, it can be seen that the curve based on the exponential function had the best fit, with an R2 of 0.9137. The empirical equation for estimating the Es of the rocks is as follows:
E s = 195.12 e 0.091 × Δ t c / D E N     R 2 = 0.9137
The correlation between the static Poisson’s ratio and the P-wave interval transit time is shown in Figure S9. From Figure S9, the νs of the rocks was positively correlated with the P-wave interval transit time, which is consistent with previous studies [16,17], indicating that the νs of the rocks increased with increasing P-wave velocity. The combination of parameters considering the P-wave interval transit time and density was adopted to develop the equation for estimating the νs of rocks because of the higher R2. The relationship between νs and Δtc/DEN is described in Figure 10, where we can observe that the curve based on the linear function had the best-fitting effect, with an R2 of 0.8782. The empirical equation for estimating the νs of rocks is as follows:
v s = 0.011 × Δ t c / D E N 0.1281     R 2 = 0.8782

3.3.3. Statistical Analysis

The accuracy of the predicted rock mechanical properties for shale oil reservoirs based on the empirical equations was evaluated via statistical analysis. The values of the predicted rock mechanical properties (based on equations in Table 2 and Equations (23)–(27)) were compared with the corresponding measured values, and the corresponding error comparative analysis was carried out. The root mean square error (RMSE) and average absolute relative deviation (AARD/%) are shown in Table 3. Compared with the empirical equations suggested in previous works (Table 2), the empirical equations established in this study show the lowest RMSE and AARD, indicating that the equations worked well for predicting rock mechanical properties for shale oil reservoirs with a comparatively small deviation.
Furthermore, the histograms of the differences between the predicted rock mechanical properties and the corresponding measured values are presented in Figure 11. From Figure 11a, the equation in this study (Equation (23)) predicted the UCS very well, fitting 85.71% of the given data within ±15 MPa, whereas Equations (11), (13) and (14) only fitted 42.86%, 28.57%, and 21.43% of the given data within ±15 MPa, respectively. Figure 11a also shows that Equation (11) tended to greatly overestimate the UCS of the samples, whereas Equations (10) and (12)–(14) tended to underestimate the UCS of the samples, especially Equations (10) and (12). From Figure 11b, we can observe that the developed equation in this study (Equation (26)) predicted the Es very well, fitting 92.86% of the given data within ±3 GPa. In previous works, however, Equations (15)–(18) fit 42.86%, 64.29%, 28.57%, and 50% of the given data, respectively, within ±3 GPa. Figure 11b also shows that Equations (15) and (17) tended to considerably underestimate the Es of the samples. Figure 11c indicates that the developed equation in this study (Equation (27)) calculated the νs, fitting 78.6% of the given data within ±0.03. In previous works, however, Equations (19) and (20) fit 42.86% and 14.26% of the given data, respectively, within ±0.03. Figure 11c also represents that Equation (19) appeared to greatly underestimate the νs of the samples, whereas Equation (20) seemed to overestimate the νs of the samples. Figure 11c indicates that the developed equation in this study (Equation (27)) calculated the νs, fitting 78.6% of the given data within ±0.03. In previous works, however, Equations (19) and (20) fit 42.86% and 14.26% of the given data, respectively, within ±0.03. Figure 11c also represents that Equation (19) tended to greatly underestimate the νs of the samples, whereas Equation (20) seemed to overestimate the νs of the samples. Figure 11d depicts that the developed equation in this study (Equation (24)) determined the φ, fitting 78.6% of the given data within ±3°. In previous works, however, Equations (21) and (22) fit 42.86% and 7.14% of the given data, respectively, within ±3°. Figure 11d also displays that Equations (21) and (22) appeared to overestimate the φ of samples, especially Equation (22). Based on the comparison results, the prediction performances of the newly developed equations are significantly higher than those of the equations suggested in previous works (Table 2), indicating that a set of empirical equations was unable to cover a wide range of geographical areas. This result is consistent with previous research conclusions [16]. This may be attributed to the sample lithology and heterogeneities. In other words, the existing empirical equations for specific blocks or formation are not universal or applicable to other blocks. When using these empirical equations, the applicability of existing empirical equations should be checked first or the empirical relationships for a specific block established, to ensure that the results obtained can be used reasonably and reliably. Hence, local empirical correlations between rock mechanical and physical properties need to be determined, in order to provide correct information for future exploration in the same or close-by areas.
On the basis of the above research, the new empirical equations (Equations (23)–(27)) can be used to calculate the rock mechanical properties for the Permian Lucaogou Formation shale oil reservoirs, which can be compared to the experimental data. The values measured vs. predicted for the rock mechanical properties are presented in Figure 12. The solid line in Figure 12 is a 1:1 slope line, and a point located on the 1:1 slope line suggests an extremely good correlation. It can be noted from Figure 12 that the values of predicted rock mechanical properties based on the new equations are consistent with the corresponding measured values and the coefficients of determination for new equations are more than 0.80. Furthermore, the plots of the relative error for the calculation results of new equations are described in Figure 13. From Figure 13, it can be seen that the average relative errors are 7.48%, 12.40%, 8.57%, 5.52%, and 4.42%, respectively. In conclusion, the equations can provide satisfactory representations of rock mechanical properties for shale oil reservoirs, which can avoid other time-consuming test procedures.

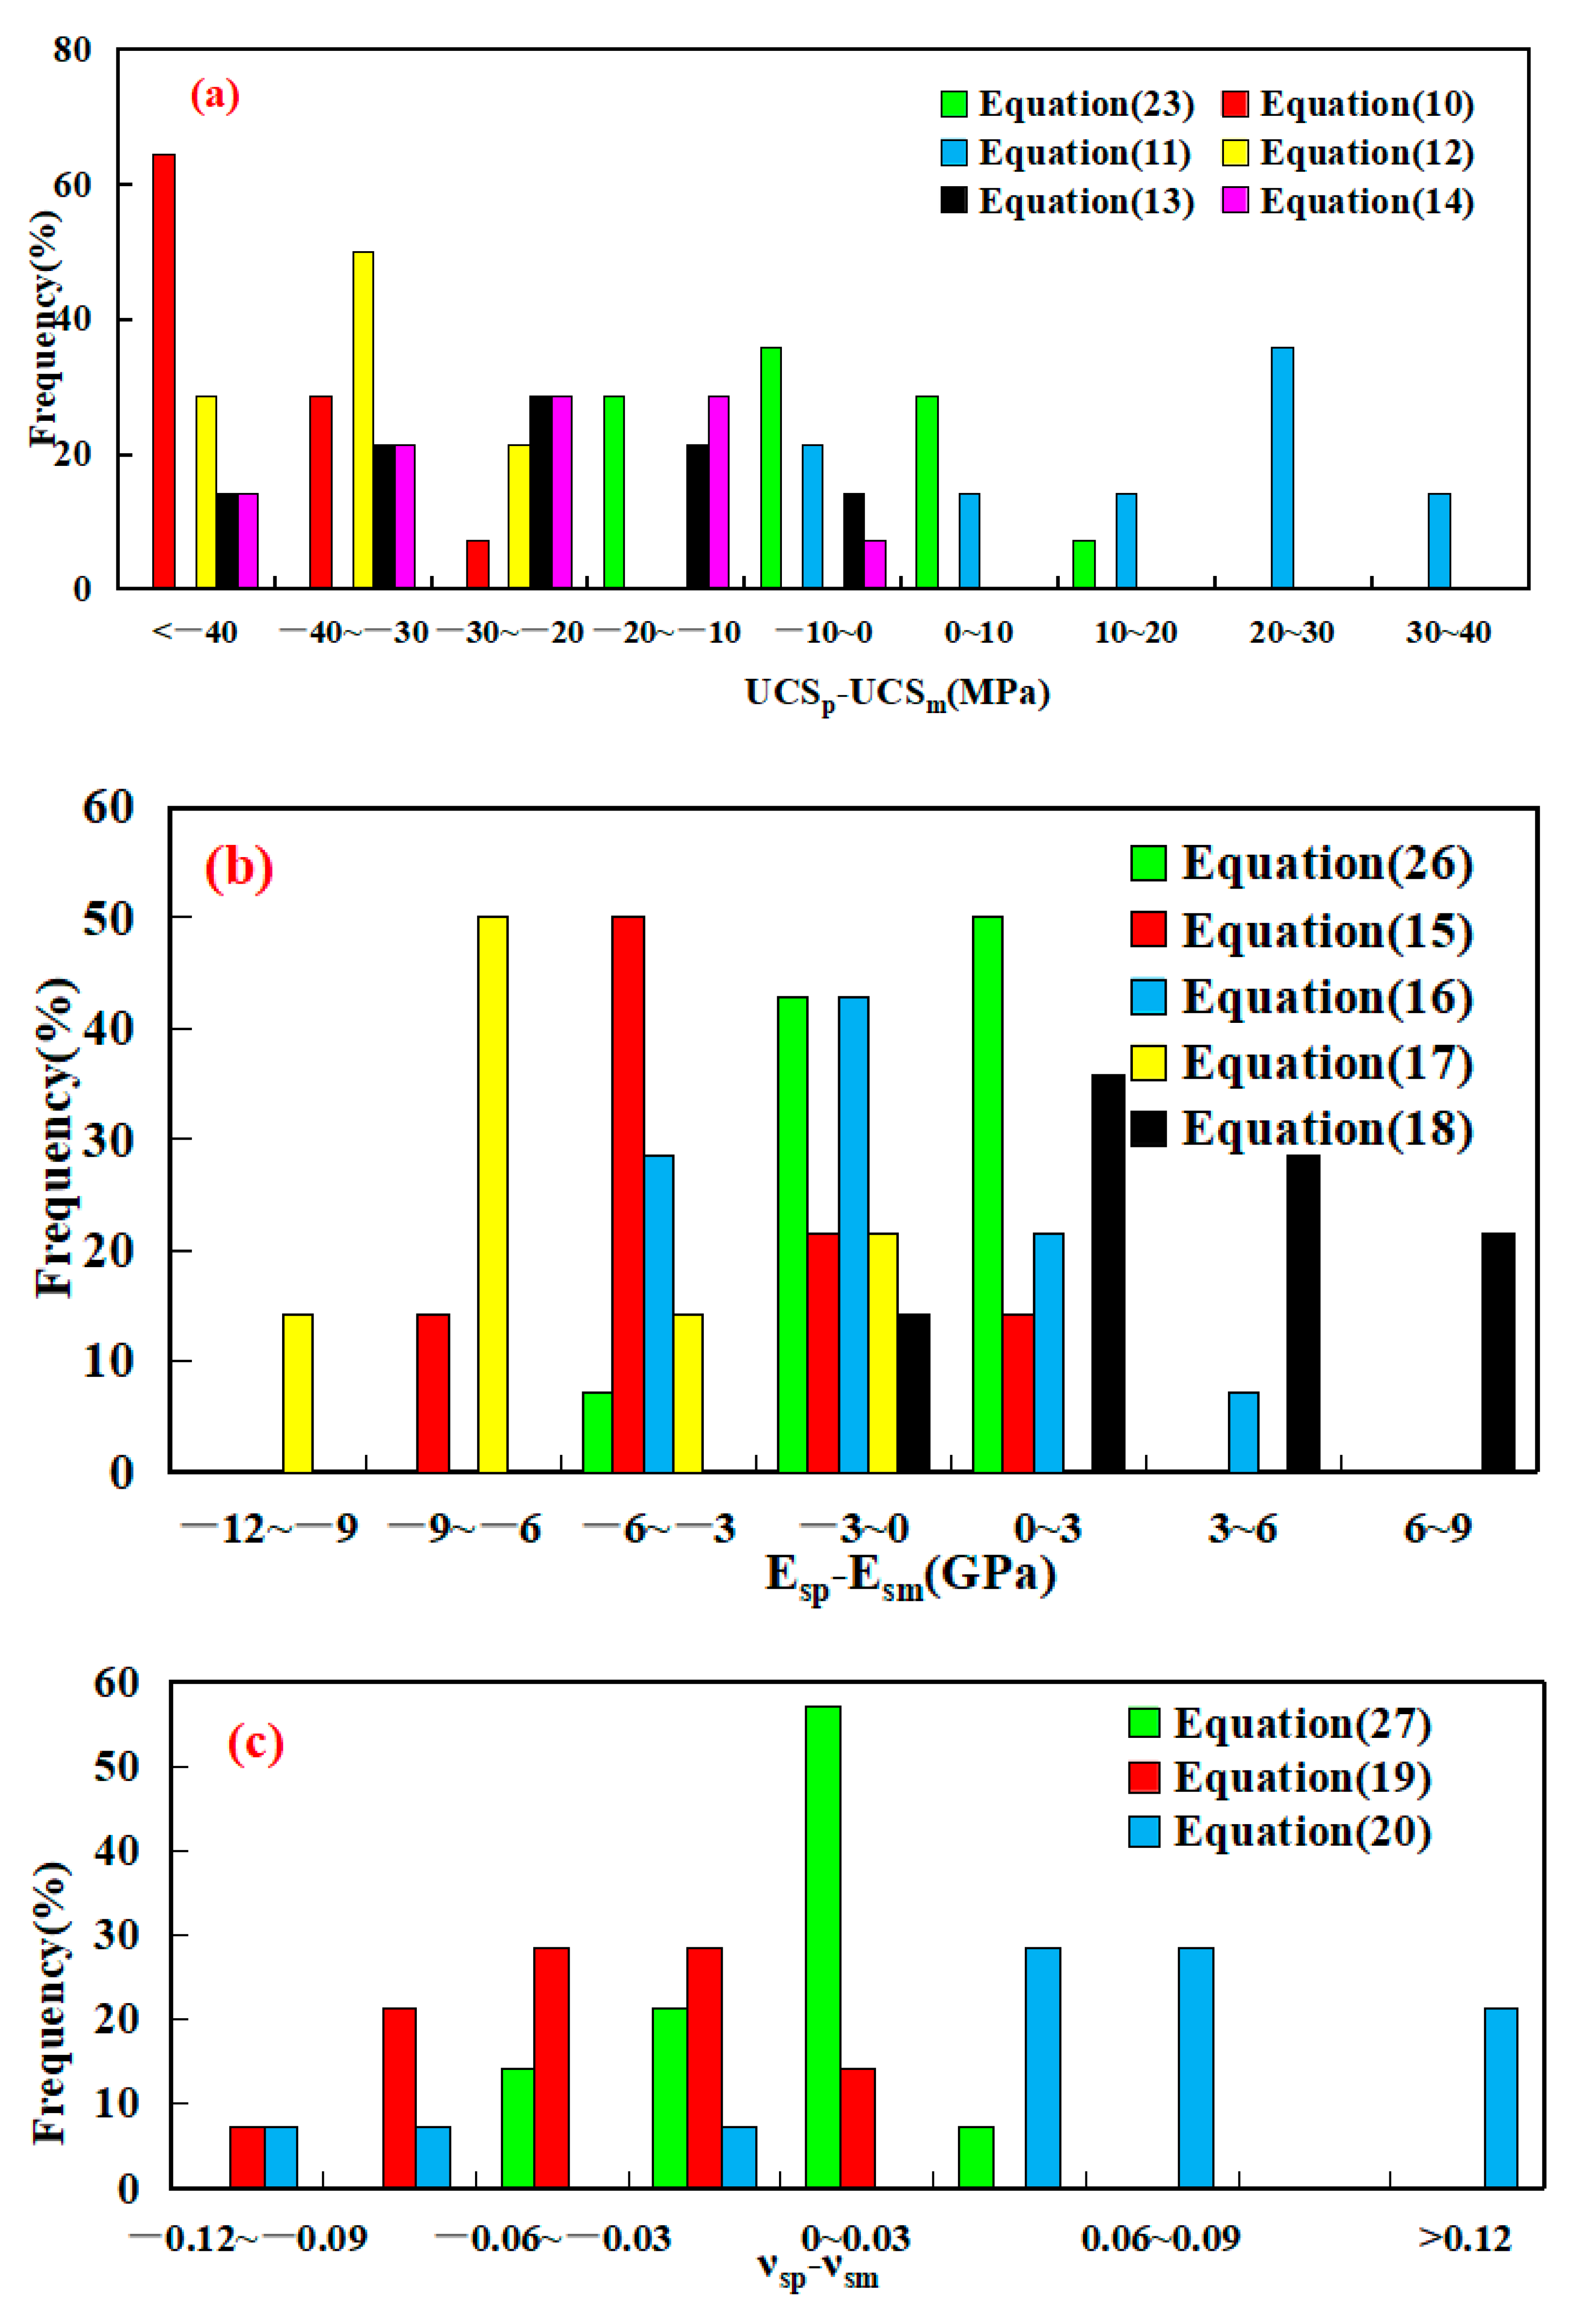
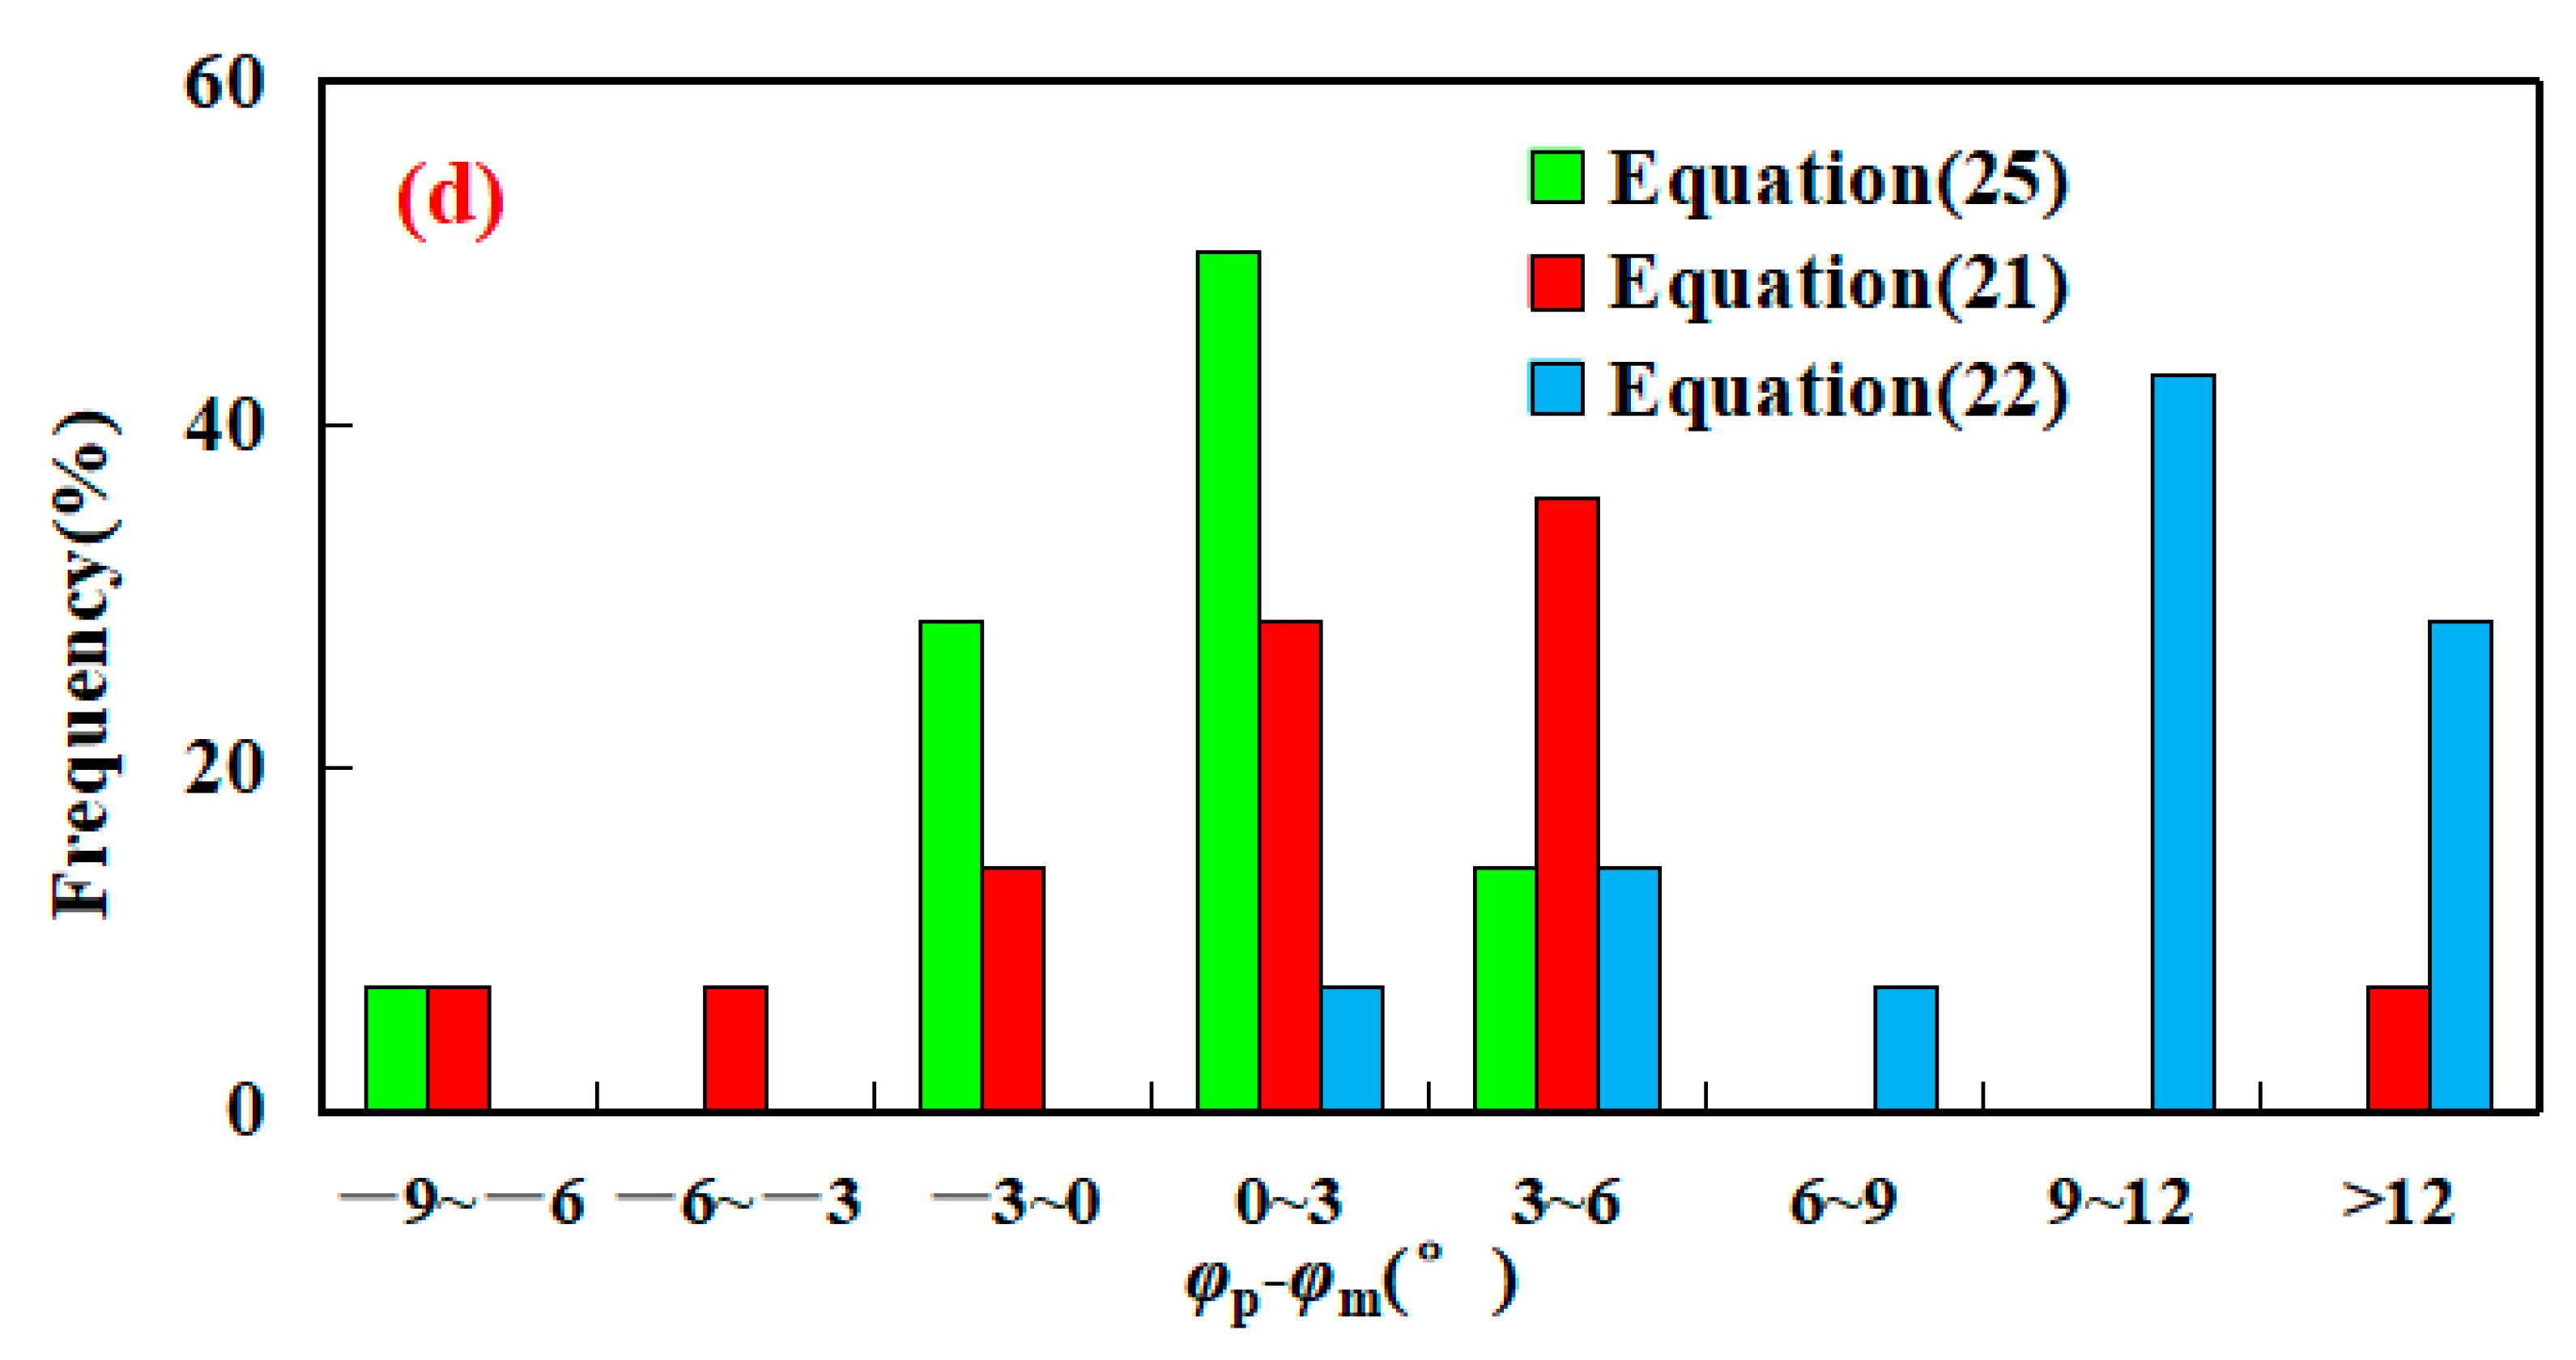
3.4. Applicability of Empirical Relations to Predict the Rock Mechanical Properties

Based on the empirical relationship (Equations (23)–(27)) and well logging data, the continuous profile of rock mechanical properties can be obtained.

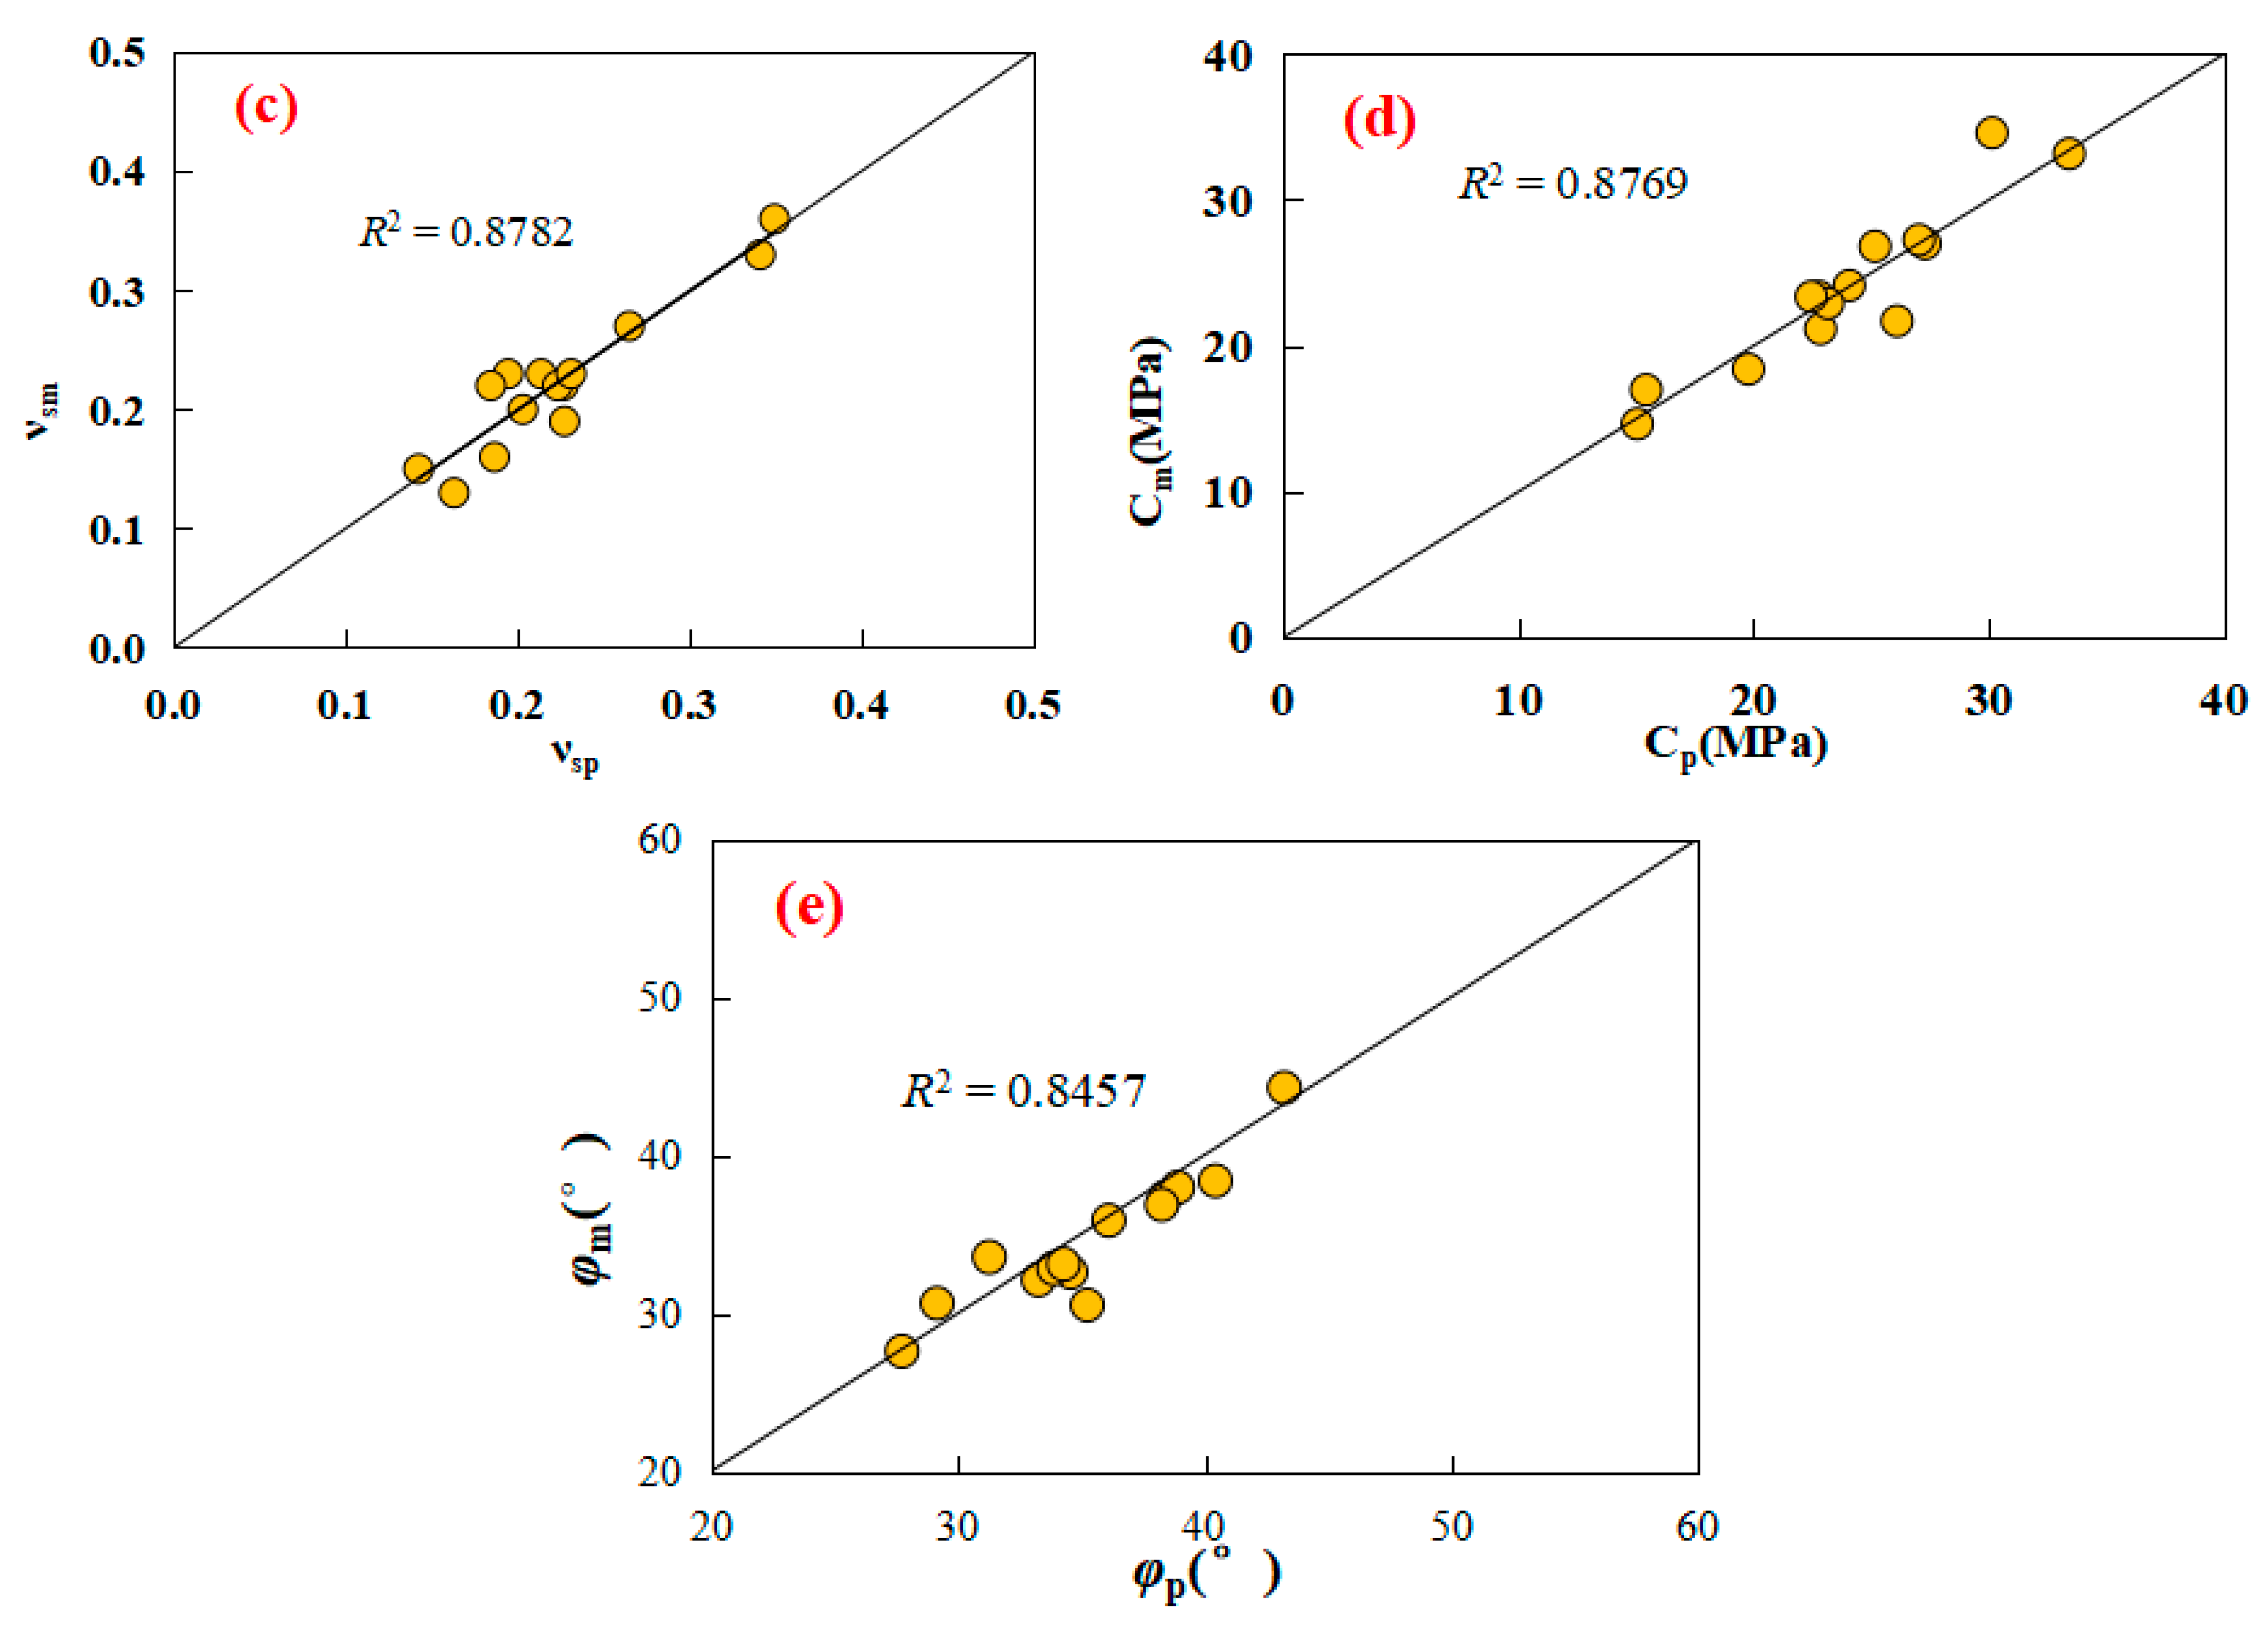
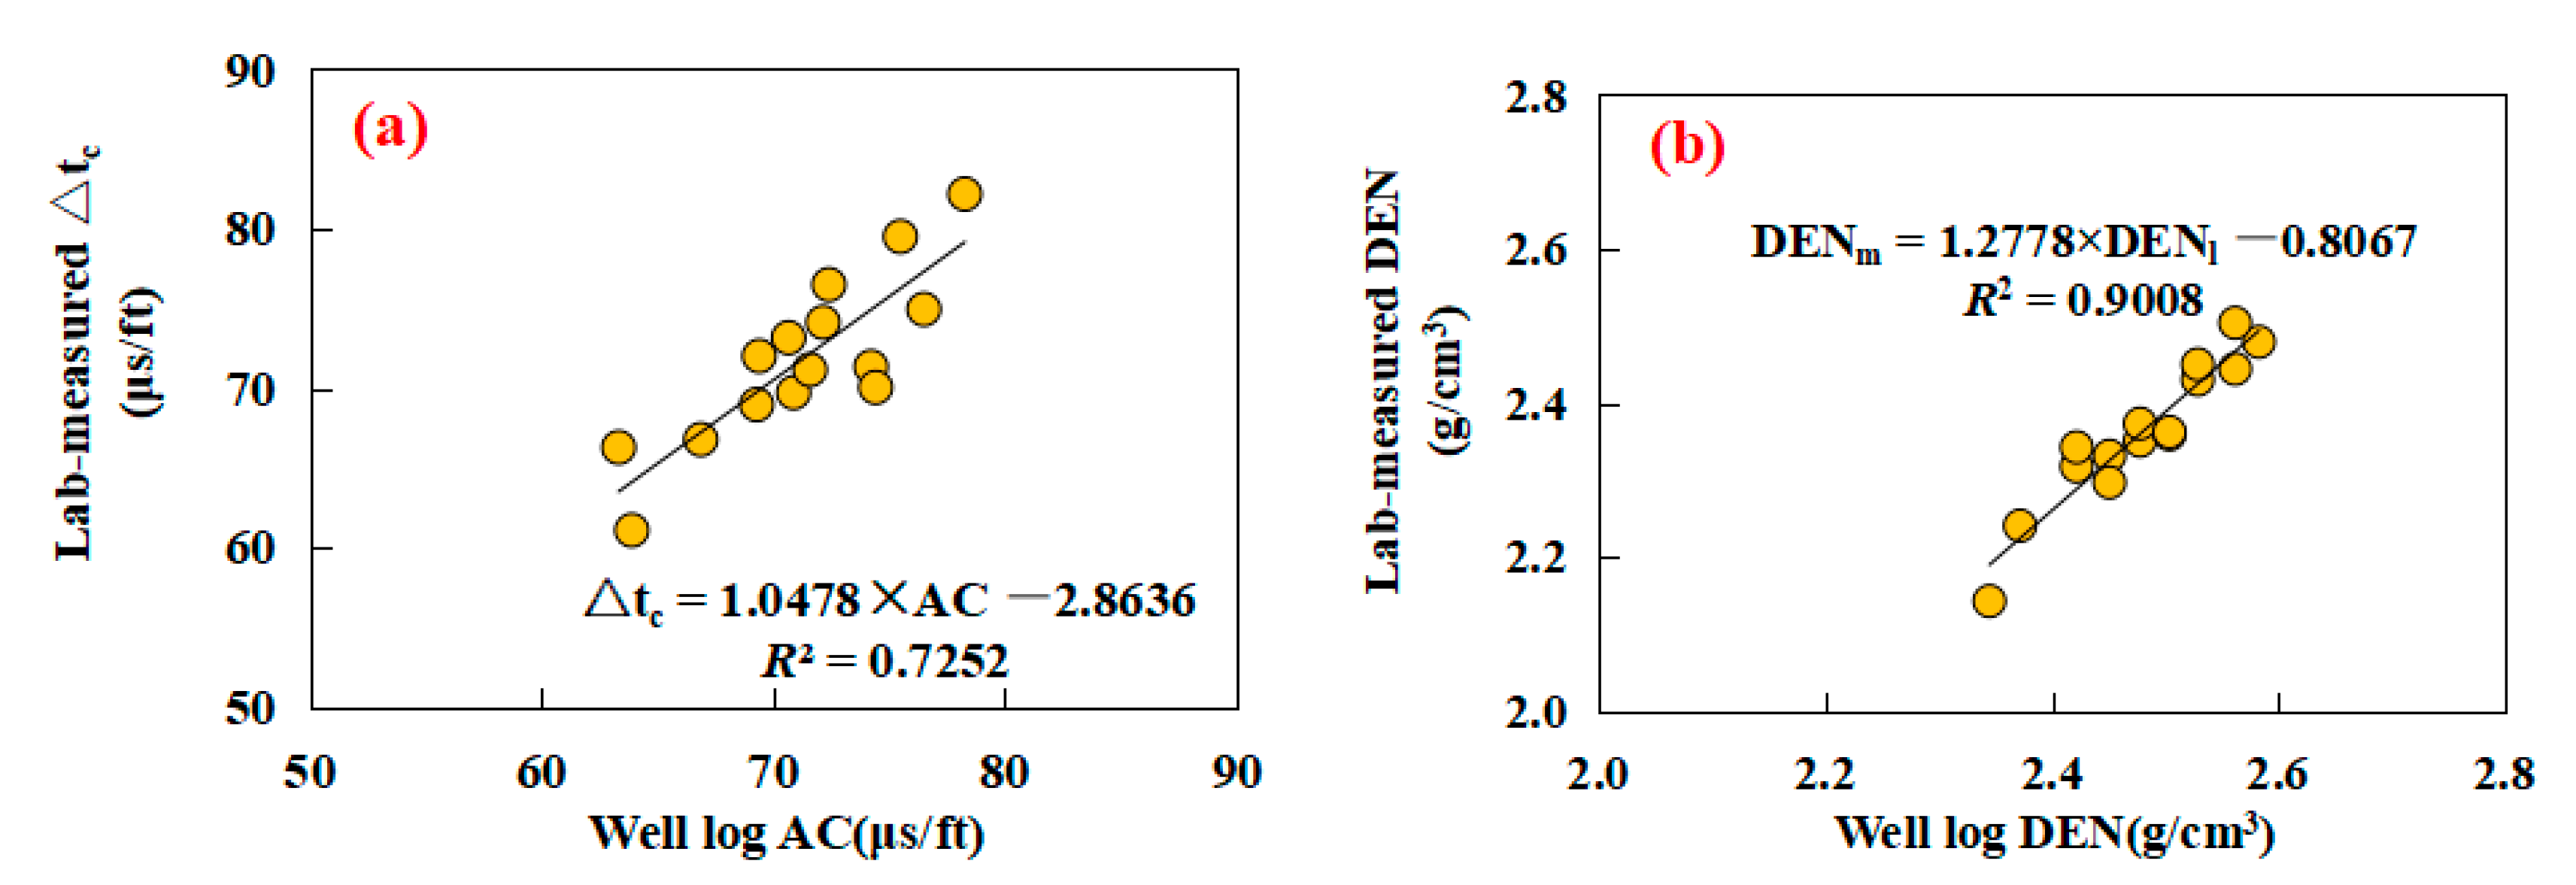
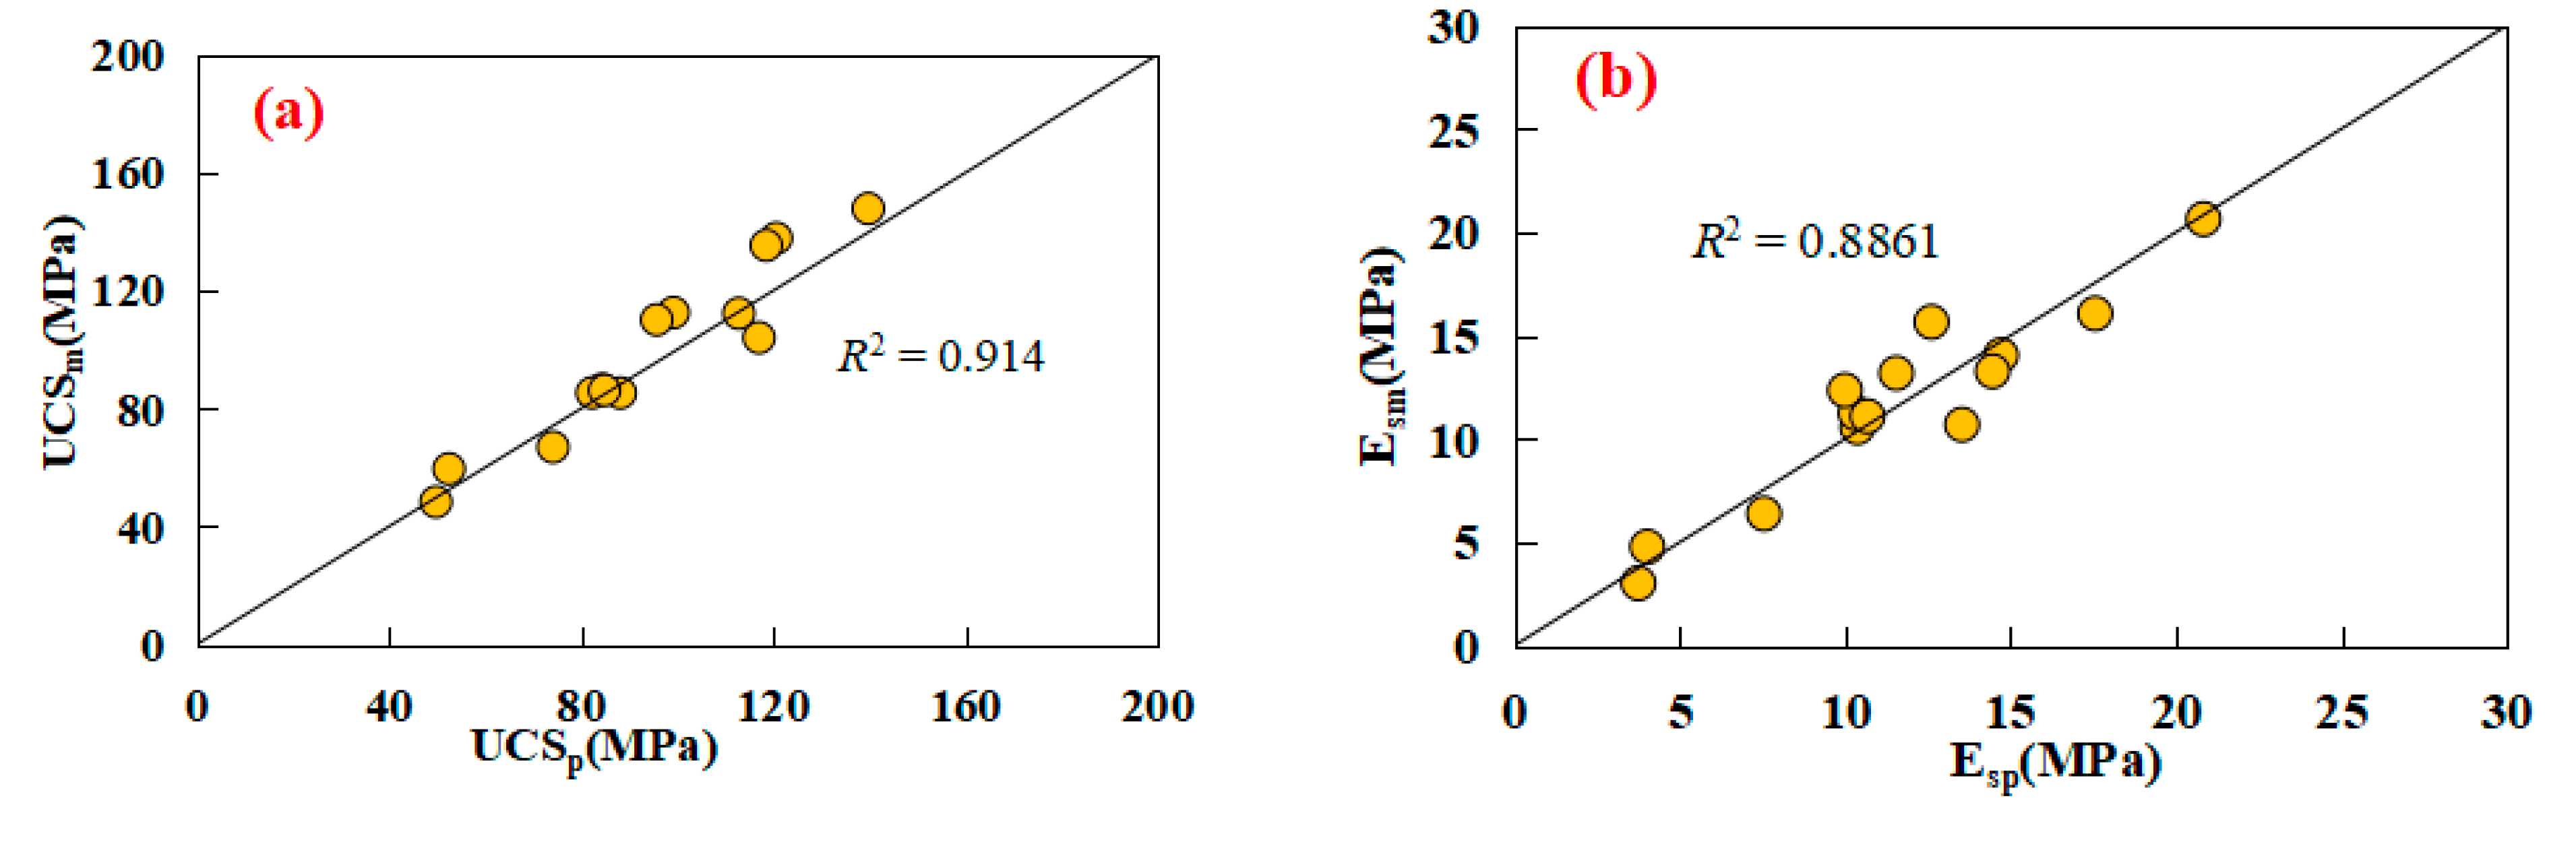
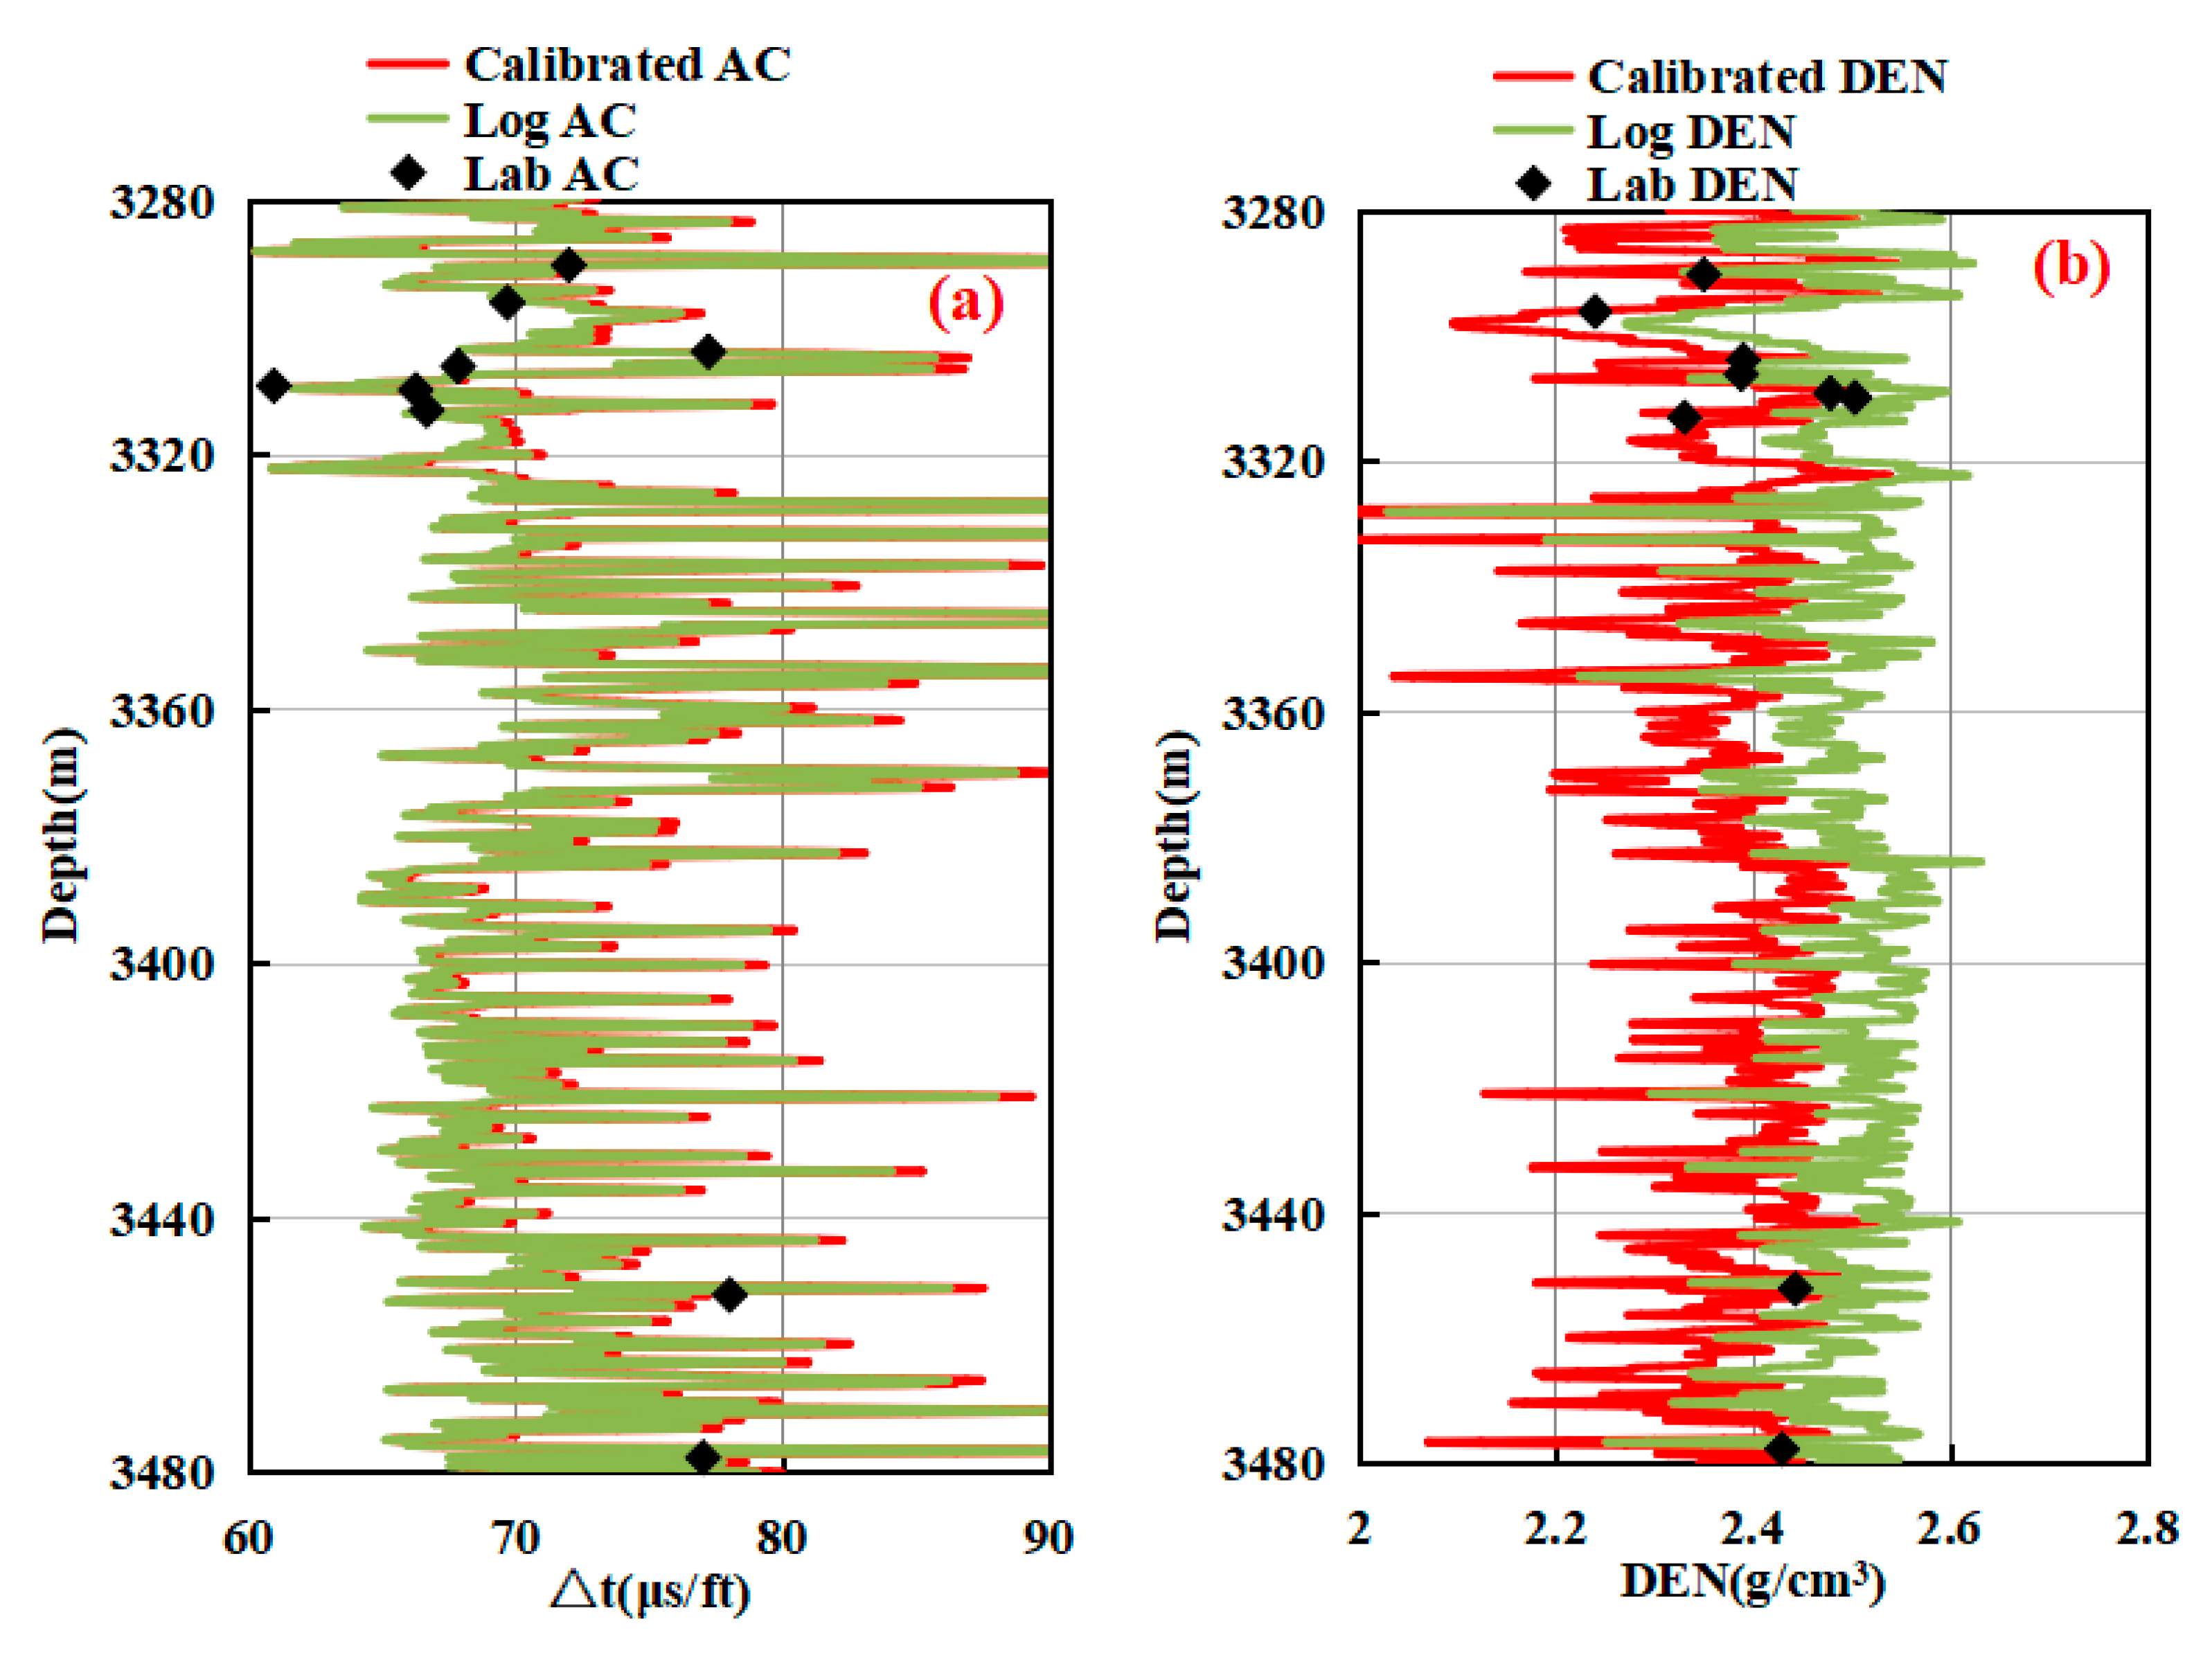
3.4.1. Calibration of the Well Logging Values with the Laboratory-Measured P-Wave Interval Transit Time and Density

Bulk density and P-wave velocity are parameters that can be obtained from the density and sonic logs, respectively. These parameters are conventional well logging data and usually used to gain formation information. A wellbore environment such as formation temperature, pore pressure, drilling fluid, etc., can have a considerable impact on the readings of well logging, resulting in the differences in the P-wave interval transit time and density values between well logging and laboratory-measured data [37]. Therefore, before using the P-wave interval transit time and density logging data combined with empirical equations to evaluate the rock mechanical properties, it is necessary to calibrate the P-wave interval transit time and density values obtained via well logging with respect to the laboratory-measured values. Using the linear fitting regression of laboratory-measured and logging values, the fitting model was established, shown in Figure 14. Thus, based on the model, the P-wave interval transit time and density values from well logging were calibrated. The formulas are as follows:
Δ t c = 1.0478 × A C 2.8636     R 2 = 0.7252
D E N m = 1.2778 × D E N l 0.8067     R 2 = 0.9008
where Δtc is the laboratory-measured P-wave interval transit time, μs/ft; AC is the P-wave interval transit time from sonic logging, μs/ft; DENm is the laboratory-measured density; and DENl is the density from density logging.
As shown in Figure 15, the calibrated P-wave interval transit time and density are in line with the laboratory-measured P-wave interval transit time and density, except for a small amount of experimental data points, and the AARD values are 3.34% and 1.06%, respectively.

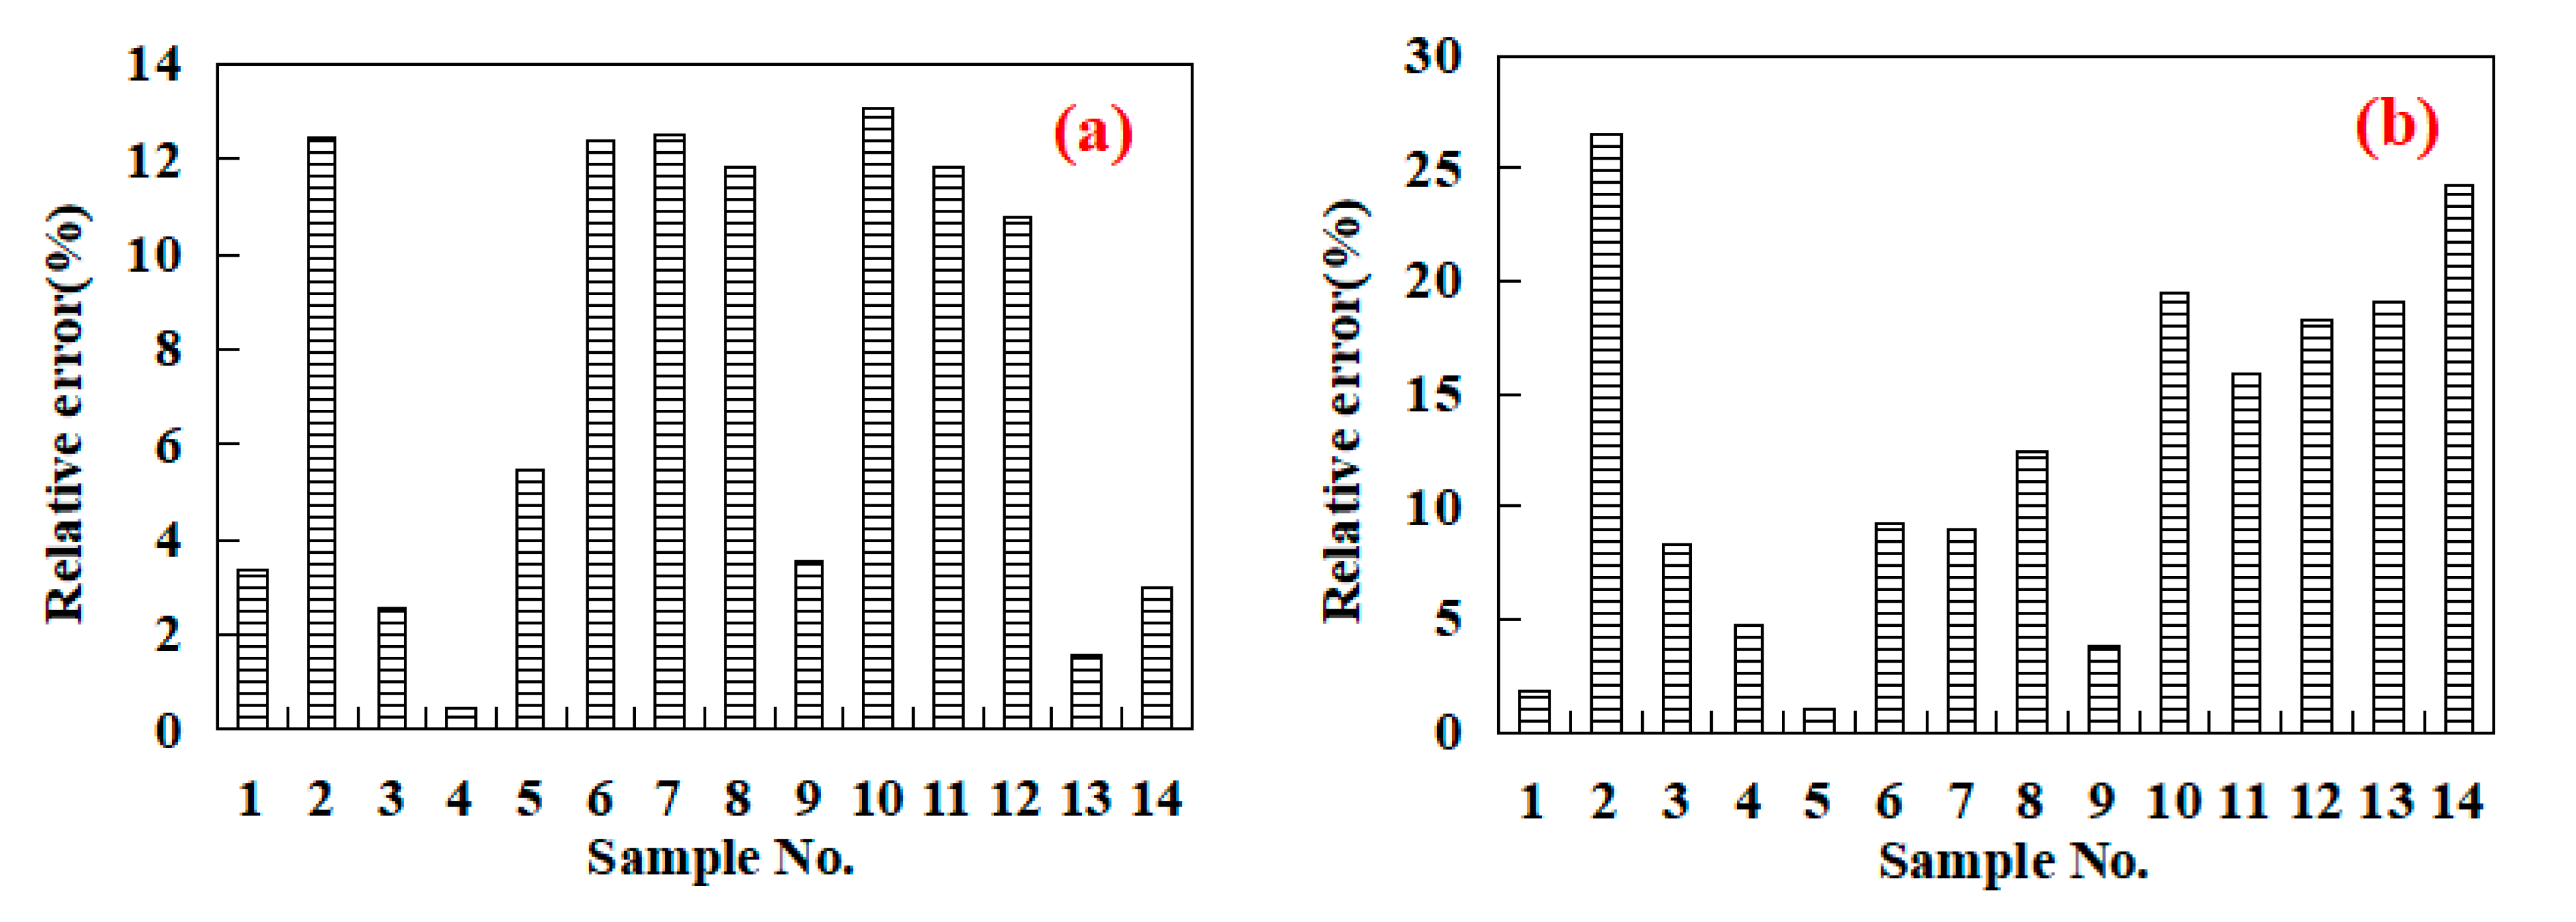
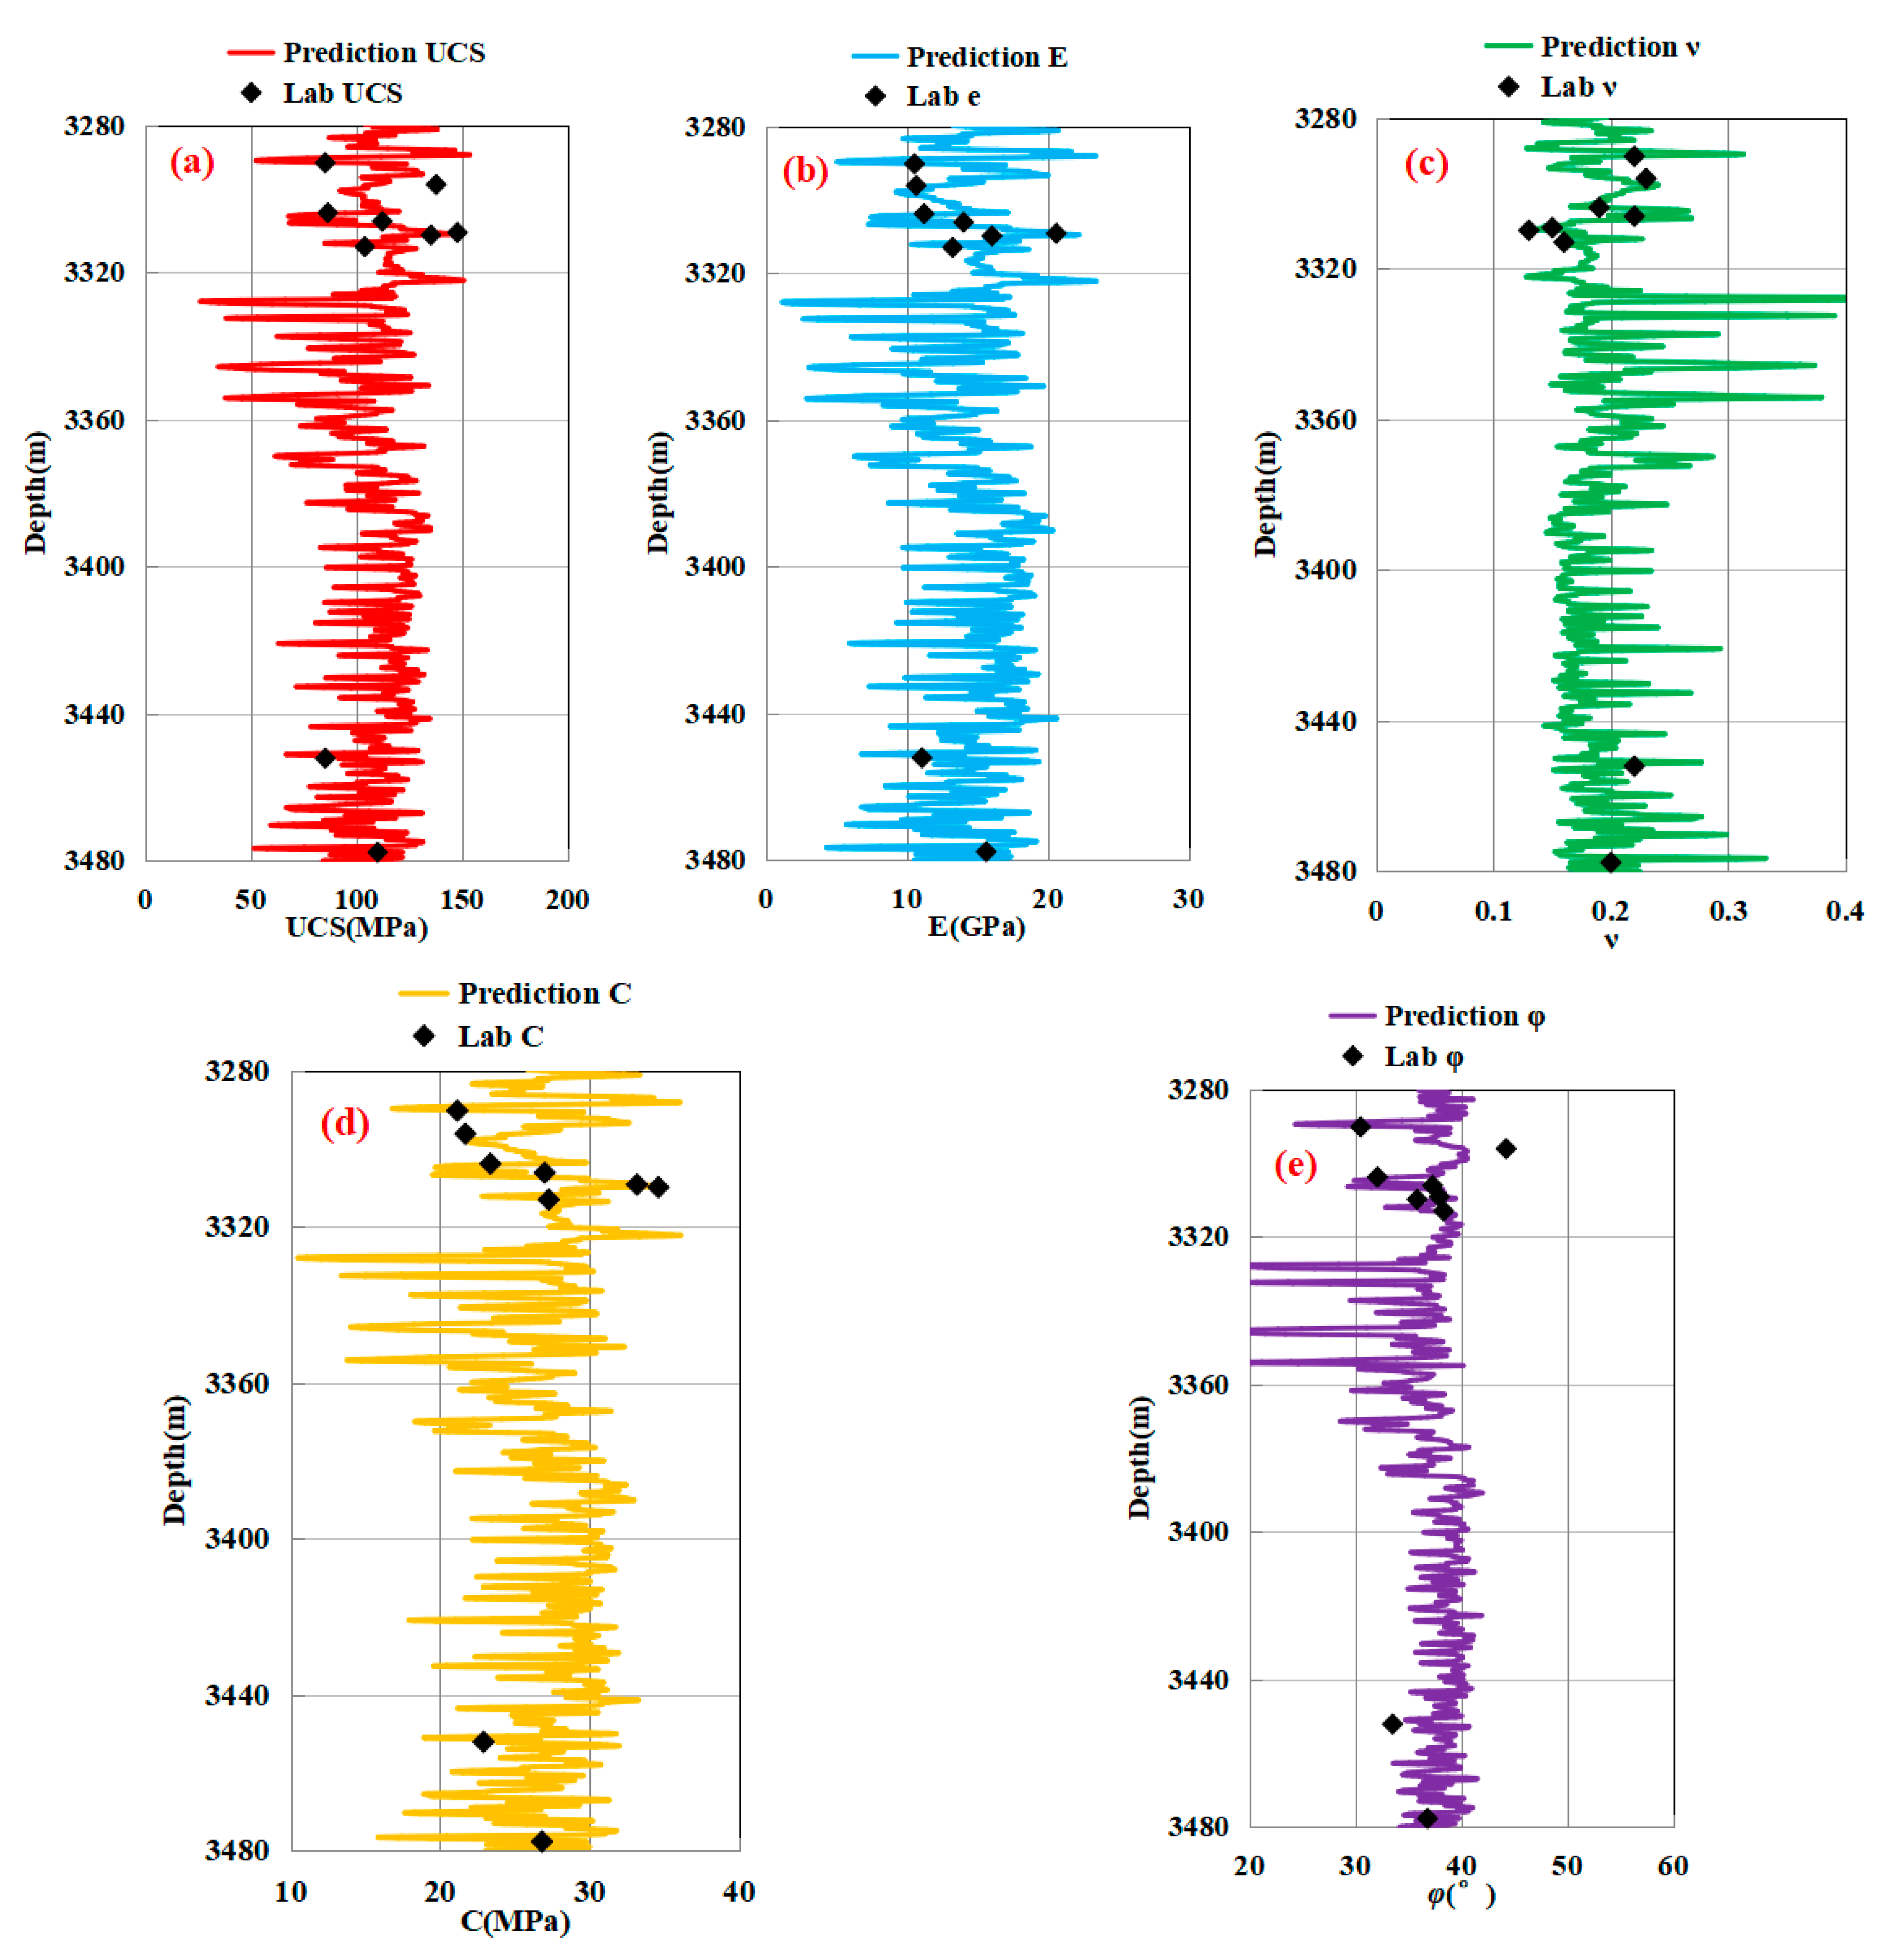
3.4.2. Evaluation of the Rock Mechanical Properties

According to the established empirical relationship and the calibrated P-wave interval transit time and density curve, the mechanical parameter profile of the rock along the longitudinal distribution of the formation was obtained. At the same time, in order to evaluate the consistency between the laboratory-measured and calculated rock mechanical parameters, the laboratory-measured rock mechanical parameter points were placed on the graph. Figure 16 shows an example of the prediction profile of the rock mechanical parameters for shale oil reservoirs from the Permian Lucaogou Formation in the Junggar Basin (a, uniaxial compressive strength; b, Young’s modulus; c, Poisson’s ratio; d, cohesive strength; e, internal friction angle). From Figure 16, it can be seen that the calculated rock mechanical property log curves had a good correlation with the laboratory-measured values.
Therefore, it was concluded that there is a real correlation between physical (such as DEN and Vp) and rock mechanical properties (such as UCS, C, φ, Es and νs), supporting the engineering use of correlations, such as optimized drilling operations, wellbore stability analysis, wellbore trajectory optimization, hydraulic fracturing design, etc.

4. Conclusions

In this study, the rock physical and mechanical properties of the Permian Lucaogou Formation, along with their relationships, were investigated. On this basis, newly empirical relationships of the rock mechanical properties were developed. The following conclusions were made:
(1)
The mechanical properties of the Lucaogou Formation were determined to have a uniaxial compressive strength ranging from 48.40 to 147.86 MPa, Young’s modulus ranging from 3.02 to 20.63 GPa, Poisson’s ratio ranging from 0.13 to 0.36, cohesive force ranging from 14.65 to 34.60 MPa, and internal friction angle ranging from 27.61 to 46.94°.
(2)
The UCS is more sensitive to the P-wave interval transit time, whereas the cohesion, Young’s modulus, and Poisson’s ratio are more sensitive to Δtc/DEN. For the UCS and static Young’s modulus, an exponential function correlation was more reliable than a linear expression and power function, whereas the cohesion and static Poisson’s ratio adopted the power function and linear expression for higher accuracy, respectively.
(3)
The newly empirical correlations for predicting rock mechanical properties were established, and the statistical analysis results provided corresponding evidence, indicating that the newly proposed equations were applicable to the Lucaogou Formation. Thus, the mechanical characteristic profile of the Lucaogou Formation was obtained via sonic and density logs.

Supplementary Materials

The following supporting information can be downloaded at: https://www.mdpi.com/article/10.3390/app132312851/s1, Figure S1. Schematic diagram of ultrasonic pulse test. Figure S2. The experimental setup. (a) Schematic diagram of the sample in the triaxial cell; (b) RTR-1000 rock triaxial testing system (revised from Ma et al., 2016). Figure S3. Deviatoric stress vs. strain curves under triaxial compression test(confining pressure of 52MPa) (Ea represents the axial strain, Er represents the radial strain). Figure S4. The calculation of the Young’s modulus (a) and Poisson’s ratio (b) based on the elastic deformation stage of the stress–strain curve. Figure S5. Relationship between DEN and Δtc. Figure S6. Relationship between C and Δtc. Figure S7. Relationship between φ and Δtc. Figure S8. Relationship between Es and Δtc. Figure S9. Relationship between νs and Δtc. Reference [38] are cited in the supplementary materials.

Author Contributions

Methodology, L.L.; Formal analysis, X.G.; Investigation, J.X. and R.G.; Writing—review & editing, J.X. and X.L. All authors have read and agreed to the published version of the manuscript.

Funding

This research was supported by the CNPC Innovation Found (No. 2023DQ02-0101) and the open project of National Center for International Research on Deep Earth Drilling and Resource Development (No. DEDRD-2023-03).

Institutional Review Board Statement

Not applicable.

Informed Consent Statement

Not applicable.

Data Availability Statement

The data presented in this study are available on request from the corresponding author. The data are not publicly available due to privacy.

Conflicts of Interest

Xiucheng Guo was employed by CNPC Greatwall Drilling Company and Renzhong Gan was employed by PetroChina Xinjiang Oilfield Company, who provided funding and technical support for the work. The remaining authors declare that the research was conducted in the absence of any commercial or financial relationships that could be construed as a potential conflict of interest.

References

  1. U.S. Energy Information Administration (EIA). Technically Recoverable Shale Oil and Shale Gas Resources: An Assessment of 137 Shale Formations in 46 Countries Outside the United States; U.S. Energy Information Administration (EIA): Washington, DC, USA, 2015.
  2. Fathy, D.; Wagreich, M.; Fathi, E.; Ahmed, M.S.; Leila, M.; Sami, M. Maastrichtian Anoxia and Its Influence on Organic Matter and Trace Metal Patterns in the Southern Tethys Realm of Egypt during Greenhouse Variability. ACS Omega 2023, 8, 19603–19612. [Google Scholar] [CrossRef] [PubMed]
  3. Zou, C.; Yang, Z.; Cui, J.; Zhu, R.; Hou, L.; Tao, S.; Yuan, X.; Wu, S.; Lin, S.; Wang, L.; et al. Formation mechanism, geological characteristics and development strategy of nonmarine shale oil in China. Pet. Explor. Dev. 2013, 40, 15–27. [Google Scholar] [CrossRef]
  4. Qiu, Z.; Tao, H.; Zou, C.; Wang, H.; Ji, H.; Zhou, S. Lithofacies and organic geochemistry of the middle Permian Lucaogou Formation in the Jimusar sag of the Junggar Basin, NW China. J. Pet. Sci. Eng. 2016, 140, 97–107. [Google Scholar] [CrossRef]
  5. Zhang, M.; Li, Z. The lithofacies and reservoir characteristics of the fine-grained sedimentary rocks of the Permian Lucaogou Formation at the northern foot of Bogda Mountains, Junggar Basin (NW China). J. Pet. Sci. Eng. 2018, 170, 21–39. [Google Scholar] [CrossRef]
  6. Hu, T.; Pang, X.; Wang, Q.; Jiang, S.; Wang, X.; Huang, C.; Xu, Y.; Li, L.; Li, H. Geochemical and geological characteristics of Permian Lucaogou Formation shale of the well Ji174, Jimusar Sag, Junggar Basin, China: Implications for shale oil exploration. Geol. J. 2018, 53, 2371–2385. [Google Scholar] [CrossRef]
  7. Su, Y.; Zha, M.; Ding, X.; Qu, J.; Gao, C.; Jin, J.; Iglauer, S. Petrographic, palynologic and geochemical characteristics of source rocks of the Permian Lucaogou formation in Jimsar Sag, Junggar Basin, NW China: Origin of organic matter input and depositional environments. J. Pet. Sci. Eng. 2019, 2019, 106364. [Google Scholar] [CrossRef]
  8. Wu, S.; Zhai, X.; Yang, Z.; Bale, H.; Hong, Y.; Cui, J.; Pan, S.; Lin, S. Characterization of fracture formation in organic-rich shales-An experimental and real time study of the Permian Lucaogou Formation, Junggar Basin, northwestern China. Mar. Pet. Geol. 2019, 107, 397–406. [Google Scholar] [CrossRef]
  9. Cui, S.; Liu, H.; Meng, Y.; Fan, Y.; Wang, J.; Han, Z. Study on mechanical properties and wellbore stability of deep brittle shale. J. Pet. Sci. Eng. 2020, 194, 107500. [Google Scholar] [CrossRef]
  10. Allawi, R.H. Chemical and mechanical model to analysis wellbore stability. Pet. Sci. Technol. 2023, 1–23. [Google Scholar] [CrossRef]
  11. Josh, M.; Esteban, L.; Delle Piane, C.; Sarout, J.; Dewhurst, D.N.; Clennell, M.B. Laboratory characterization of shale properties. J. Pet. Sci. Eng. 2012, 88, 107–124. [Google Scholar] [CrossRef]
  12. Sone, H.; Zoback, M.D. Mechanical properties of shale-gas reservoir rocks—Part 2: Ductile creep, brittle strength, and their relation to the elastic modulus. Geophysics 2013, 78, D393–D402. [Google Scholar] [CrossRef]
  13. Hou, Z.; Gutierrez, M.; Ma, S.; Almrabat, A.; Yang, C. Mechanical behavior of shale at different strain rates. Rock Mech. Rock Eng. 2019, 52, 3531–3544. [Google Scholar] [CrossRef]
  14. Kolawole, O.; Ispas, I. Evaluation of geomechanical properties via scratch tests: Where are we and where do we go from here? SN Appl. Sci. 2020, 2, 1633. [Google Scholar] [CrossRef]
  15. Liu, B.; Lu, Y.; Meng, Y.; Li, X.; Guo, X.; Ma, Q.; Zhao, W. Petrologic characteristics and genetic model of lacustrine lamellar fine-grained rock and its significance for shale oil exploration: A case study of Permian Lucaogou Formation in Malang sag, Santanghu Basin, NW China. Pet. Explor. Dev. 2015, 42, 656–666. [Google Scholar] [CrossRef]
  16. Ahmed, A.K.; Flori, R.E.; Alsaba, M. Estimating rock mechanical properties of the Zubair shale formation using a sonic wireline log and core analysis. J. Nat. Gas Sci. Eng. 2018, 53, 359–369. [Google Scholar]
  17. Khandelwal, M. Correlating P-wave velocity with the physico-mechanical properties of different rocks. Pure Appl. Geophys. 2013, 170, 507–514. [Google Scholar] [CrossRef]
  18. Jasim, N.; Hamd-Allah, S.M.; Abass, H. Evaluation of Geomechanical Properties for Tight Reservoir Using Uniaxial Compressive Test, Ultrasonic Test, and Well Logs Data. Pet. Coal 2020, 62, 329–340. [Google Scholar]
  19. Chang, C.; Zoback, M.D.; Khaksar, A. Empirical relations between rock strength and physical properties in sedimentary rocks. J. Pet. Sci. Eng. 2006, 51, 223–237. [Google Scholar] [CrossRef]
  20. Armaghani, D.J.; Amin, M.F.M.; Yagiz, S.; Faardonbeh, R.S.; Abdullah, R.A. Prediction of the uniaxial compressive strength of sandstone using various modeling techniques. Int. J. Rock Mech. Min. Sci. 2016, 85, 174–186. [Google Scholar] [CrossRef]
  21. Kurtuluş, C.; Sertçelik, F.; Sertçelik, I. Correlating physico-mechanical properties of intact rocks with P-wave velocity. Acta Geod. Geophys. 2016, 51, 571–582. [Google Scholar] [CrossRef]
  22. Khosravi, M.; Tabasi, S.; Eldien, H.H.; Motahari, M.R.; Alizadeh, S.M. Evaluation and prediction of the rock static and dynamic parameters. J. Appl. Geophys. 2022, 199, 104581. [Google Scholar] [CrossRef]
  23. Tian, Y.; Zhou, F.; Hu, L.; Tang, X.; Liu, H. Optimization of Rock Mechanical Properties Prediction Model Based on Block Database. Rock Mech. Rock Eng. 2023, 56, 5955–5978. [Google Scholar] [CrossRef]
  24. Zhang, K.; Liu, R.; Bai, E.; Zhao, Z.; Peyrotty, G.; Fathy, D.; Liu, Z. Biome responses to a hydroclimatic crisis in an Early Cretaceous (Barremian-Aptian) subtropical inland lake ecosystem, Northwest China. Palaeogeogr. Palaeoclimatol. Palaeoecol. 2023, 622, 111596. [Google Scholar] [CrossRef]
  25. Ding, X.; Gao, C.; Zha, M.; Chen, H.; Su, Y. Depositional environment and factors controlling β-carotane accumulation: A case study from the Jimsar Sag, Junggar Basin, northwestern China. Palaeogeogr. Palaeoclimatol. Palaeoecol. 2017, 485, 833–842. [Google Scholar] [CrossRef]
  26. Wang, J.; Cao, Y.; Liu, K.; Gao, Y.; Qin, Z. Fractal characteristics of the pore structures of fine-grained, mixed sedimentary rocks from the Jimsar Sag, Junggar Basin: Implications for lacustrine tight oil accumulations. J. Pet. Sci. Eng. 2019, 182, 106363. [Google Scholar] [CrossRef]
  27. GB/T 50266-2013; Standard for Tests Method of Engineering Rock Mass. National Standards Compilation Group of People’s Republic of China: Beijing, China, 2013.
  28. Kovari, K.; Tisa, A.; Einstein, H.H.; Franklin, J.A. Suggested methods for determining the strength of rock materials in triaxial compression: Revised version. Int. J. Rock Mech. Min. Sci. Geomech. Abstr. 1983, 20, 283–290. [Google Scholar]
  29. Horsrud, P. Estimating mechanical properties of shale from empirical correlations. SPE Drill Complet. 2001, 16, 68–73. [Google Scholar] [CrossRef]
  30. Freyburg, E. Der Untere und mittlere Buntsandstein SW-Thuringen in seinen gesteinstechnicschen Eigenschaften. Ber. Dtsch. Ges. Geol. Wiss. A Berl. 1972, 176, 911–919. [Google Scholar]
  31. Golubev, A.A.; Rabinovich, G.Y. Resultaty primeneia appartury akusticeskogo karotasa dlja predeleina proconstych svoistv gornych porod na mestorosdeniaach tverdych isjopaemych. Prikl. Geofiz. Mosk. 1976, 73, 109–116. [Google Scholar]
  32. Kılıç, A.; Teymen, A. Determination of mechanical properties of rocks using simple methods. Bul. Eng. Geol. Environ. 2008, 67, 237–244. [Google Scholar] [CrossRef]
  33. Dewhurst, D.N.; Sarout, J.; Delle Piane, C. Prediction of shale mechanical properties from global and local empirical correlations. In SEG Technical Program Expanded Abstracts 2010; Society of Exploration Geophysicists: Houston, TX, USA, 2010. [Google Scholar]
  34. Vasconcelos, G.; Lourenço, P.; Alves, C.; Pamplona, J. Predication of the mechanical properties of granites by ultrasonicpulse velocity and Schmidt hummer hardness. In Proceedings of the Tenth North American Masonry Conference, St. Louis, MI, USA, 3–6 June 2007. [Google Scholar]
  35. Lal, M. Shale stability: Drilling fluid interaction and shale strength. In Proceedings of the SPE Asia Pacific Oil and Gas Conference and Exhibition, Jakarta, Indonesia, 20–22 April 1999. [Google Scholar]
  36. Al-Ajmi, A.M.; Zimmerman, R.W. Relation between the Mogi and the Coulomb failure criteria. Int. J. Rock Mech. Min. Sci. 2005, 42, 431–439. [Google Scholar] [CrossRef]
  37. Alberty, M. The influence of the borehole environment upon compressional sonic logs. Log Anal. 1996, 37, 30–44. [Google Scholar]
  38. Ma, T.; Yang, C.; Chen, P.; Wang, X.; Guo, Y. On the damage constitutive model for hydrated shale using CT scanning technology. J. Nat. Gas Sci. Eng. 2016, 28, 204–214. [Google Scholar] [CrossRef]
Figure 1. (a) Geographical Location of the Junggar Basin, China. (b) Geographical Location of the Jimsar Sag in the Junggar Basin. (c) The distribution position of some drilled wells in the Jimsar Sag (modified after Qiu et al. (2016) [4]).
Applsci 13 12851 g001
Figure 2. The stratigraphic columns of the study area at the Junggar Basin.
Applsci 13 12851 g002
Figure 3. The original workflow of the research in the paper.
Applsci 13 12851 g003
Figure 4. The bulk density of the samples.
Applsci 13 12851 g004
Figure 5. The P-wave interval transit time of the samples.
Applsci 13 12851 g005
Figure 6. The rock mechanical properties of the samples ((a) uniaxial compressive strength; (b) Young’s modulus; (c) Poisson’s ratio; (d) cohesive strength; (e) internal friction angle).
Applsci 13 12851 g006
Figure 7. Relationship between UCS and Δtc.
Applsci 13 12851 g007
Figure 8. Relationship between C and Δtc/DEN.
Applsci 13 12851 g008
Figure 9. Relationship between Es and Δtc/DEN.
Applsci 13 12851 g009
Figure 10. Relationship between νs and Δtc/DEN.
Applsci 13 12851 g010
Figure 11. Histograms representing the frequency differences in the predicted (p) and measured (m) values of rock mechanical properties based on the empirical equations shown in Table 2, and the developed empirical correlations (Equations (23)–(26)) ((a) uniaxial compressive strength; (b) Young’s modulus; (c) Poisson’s ratio; (d) internal friction angle).
Applsci 13 12851 g011aApplsci 13 12851 g011b
Figure 12. The values measured vs. predicted for the rock mechanical properties: ((a) uniaxial compressive strength; (b) Young’s modulus; (c) Poisson’s ratio; (d) cohesive strength; and (e) internal friction angle.
Applsci 13 12851 g012aApplsci 13 12851 g012b
Figure 13. The plots of the relative error for the calculation results of new equations ((a) Equation (23); (b) Equation (26); (c) Equation (27); (d) Equation (24); (e) Equation (25)).
Applsci 13 12851 g013aApplsci 13 12851 g013b
Figure 14. Relationships between the well log P-wave interval transit time (a), density (b), and lab-measured P-wave interval transit time (a) and density (b).
Applsci 13 12851 g014
Figure 15. Well log vs. lab-measured P-wave interval transit time (a) and density (b).
Applsci 13 12851 g015
Figure 16. Predicted rock mechanical properties using Equations (23)–(27) based on the well logging data ((a) uniaxial compressive strength; (b) Young’s modulus; (c) Poisson’s ratio; (d) cohesive strength; (e) internal friction angle).
Applsci 13 12851 g016
Table 1. Sample location for the Permian Lucaogou Formation.
Sample No.Well NameDepth
m
LithologyConfining Pressure
MPa
1J163290.3micritic dolomite0
23290.5micritic dolomite43
33296.1detrital feldspar sandstone0
43296.3detrital feldspar sandstone43
53301.4argillaceous siltstone0
63301.6argillaceous siltstone47
73306.2sandy micritic dolomite0
83306.6sandy micritic dolomite48
93308.8argillaceous siltstone0
103309.1argillaceous siltstone47
113309.9argillaceous dolomite0
123310.2argillaceous dolomite47
133313.1siltstone0
143313.3siltstone47
153317.1dolomite0
163317.4dolomite46
173452.2siltstone0
183452.5siltstone49
193477.8dolomitic siltstone0
203478.1dolomitic siltstone52
21J223462.9dolomitic mudstone0
223463.2dolomitic mudstone50
233464.6dolomitic mudstone0
243464.9dolomitic mudstone50
253469.7dolomitic siltstone0
263469.9dolomitic siltstone51
273471.8dolomitic mudstone0
283472.1dolomitic mudstone51
Note: In the triaxial compression tests, the confining pressure is approximately equal to the overlying rock pressure minus the pore pressure.
Table 2. Empirical relationships between UCS, φ, Es, νs, and Vp.
Equation No.LithologyEquationR2 aReference
(10)Shale U C S = 0.77 V P 2.93 0.99[29]
(11)Sandstone U C S = 0.035 V p 31.5 -[30]
(12)Limestone and dolomite U C S = 10 ( 2.44 + 109.14 / Δ t ) / 145 -[31]
(13)Different rocks U C S = 2.304 V P 2.43 0.94[32]
(14)Different rocks U C S = 8.10 6 V P 2 0.024 V P + 31.92 0.89[24]
(15)Shale E s = 0.076 V P 3.23 0.99[29]
(16)Shale E s = 5 V p 10.26 0.87[33]
(17)Shale E S = 0.2966 e 0.6984 V P 0.91[16]
(18)Sandstone E S = 4.9718 V P 7151 0.97[34]
(19)Shale v S = 0.7621 e 0.353 V P 0.87[16]
(20)Different rocks v s = 8 × 10 9 × V P 2 2 × 10 5 × V P + 0.222 0.85[17]
(21)Shale φ = sin 1 V P 1 / V P + 1 -[35]
(22)Shale φ = 17.134 e 0.239 V P 0.92[16]
Note: a, the data are obtained from the literature.
Table 3. The RMSE and AARD of the equations in Table 2, estimating the rock mechanical parameters.
ParameterEmpirical EquationRMSEAARD/%
UCSEquation (10)49.36 MPa48.60
Equation (11)19.77 MPa22.28
Equation (12)38.10 MPa38.63
Equation (13)26.76 MPa24.16
Equation (14)27.82 MPa25.47
Equation (23) (in this study)9.72 MPa7.48
EsEquation (15)4.59 GPa31.04
Equation (16)3.19 GPa29.00
Equation (17)6.75 GPa47.71
Equation (18)3.92 GPa48.20
Equation (26) (in this study)1.54 GPa12.41
νsEquation (19)0.0619.22
Equation (20)0.1044.38
Equation (27) (in this study)0.028.58
CEquation (24) (in this study)1.90 MPa5.52
φEquation (21)4.22°11.41
Equation (22)11.58°32.88
Equation (25) (in this study)3.14°6.36
Disclaimer/Publisher’s Note: The statements, opinions and data contained in all publications are solely those of the individual author(s) and contributor(s) and not of MDPI and/or the editor(s). MDPI and/or the editor(s) disclaim responsibility for any injury to people or property resulting from any ideas, methods, instructions or products referred to in the content.

