


A Thorough Investigation of the Dynamic Properties of Granite under Cyclic Loading


Abstract
:1. Introduction
2. Literature Review and Discussion
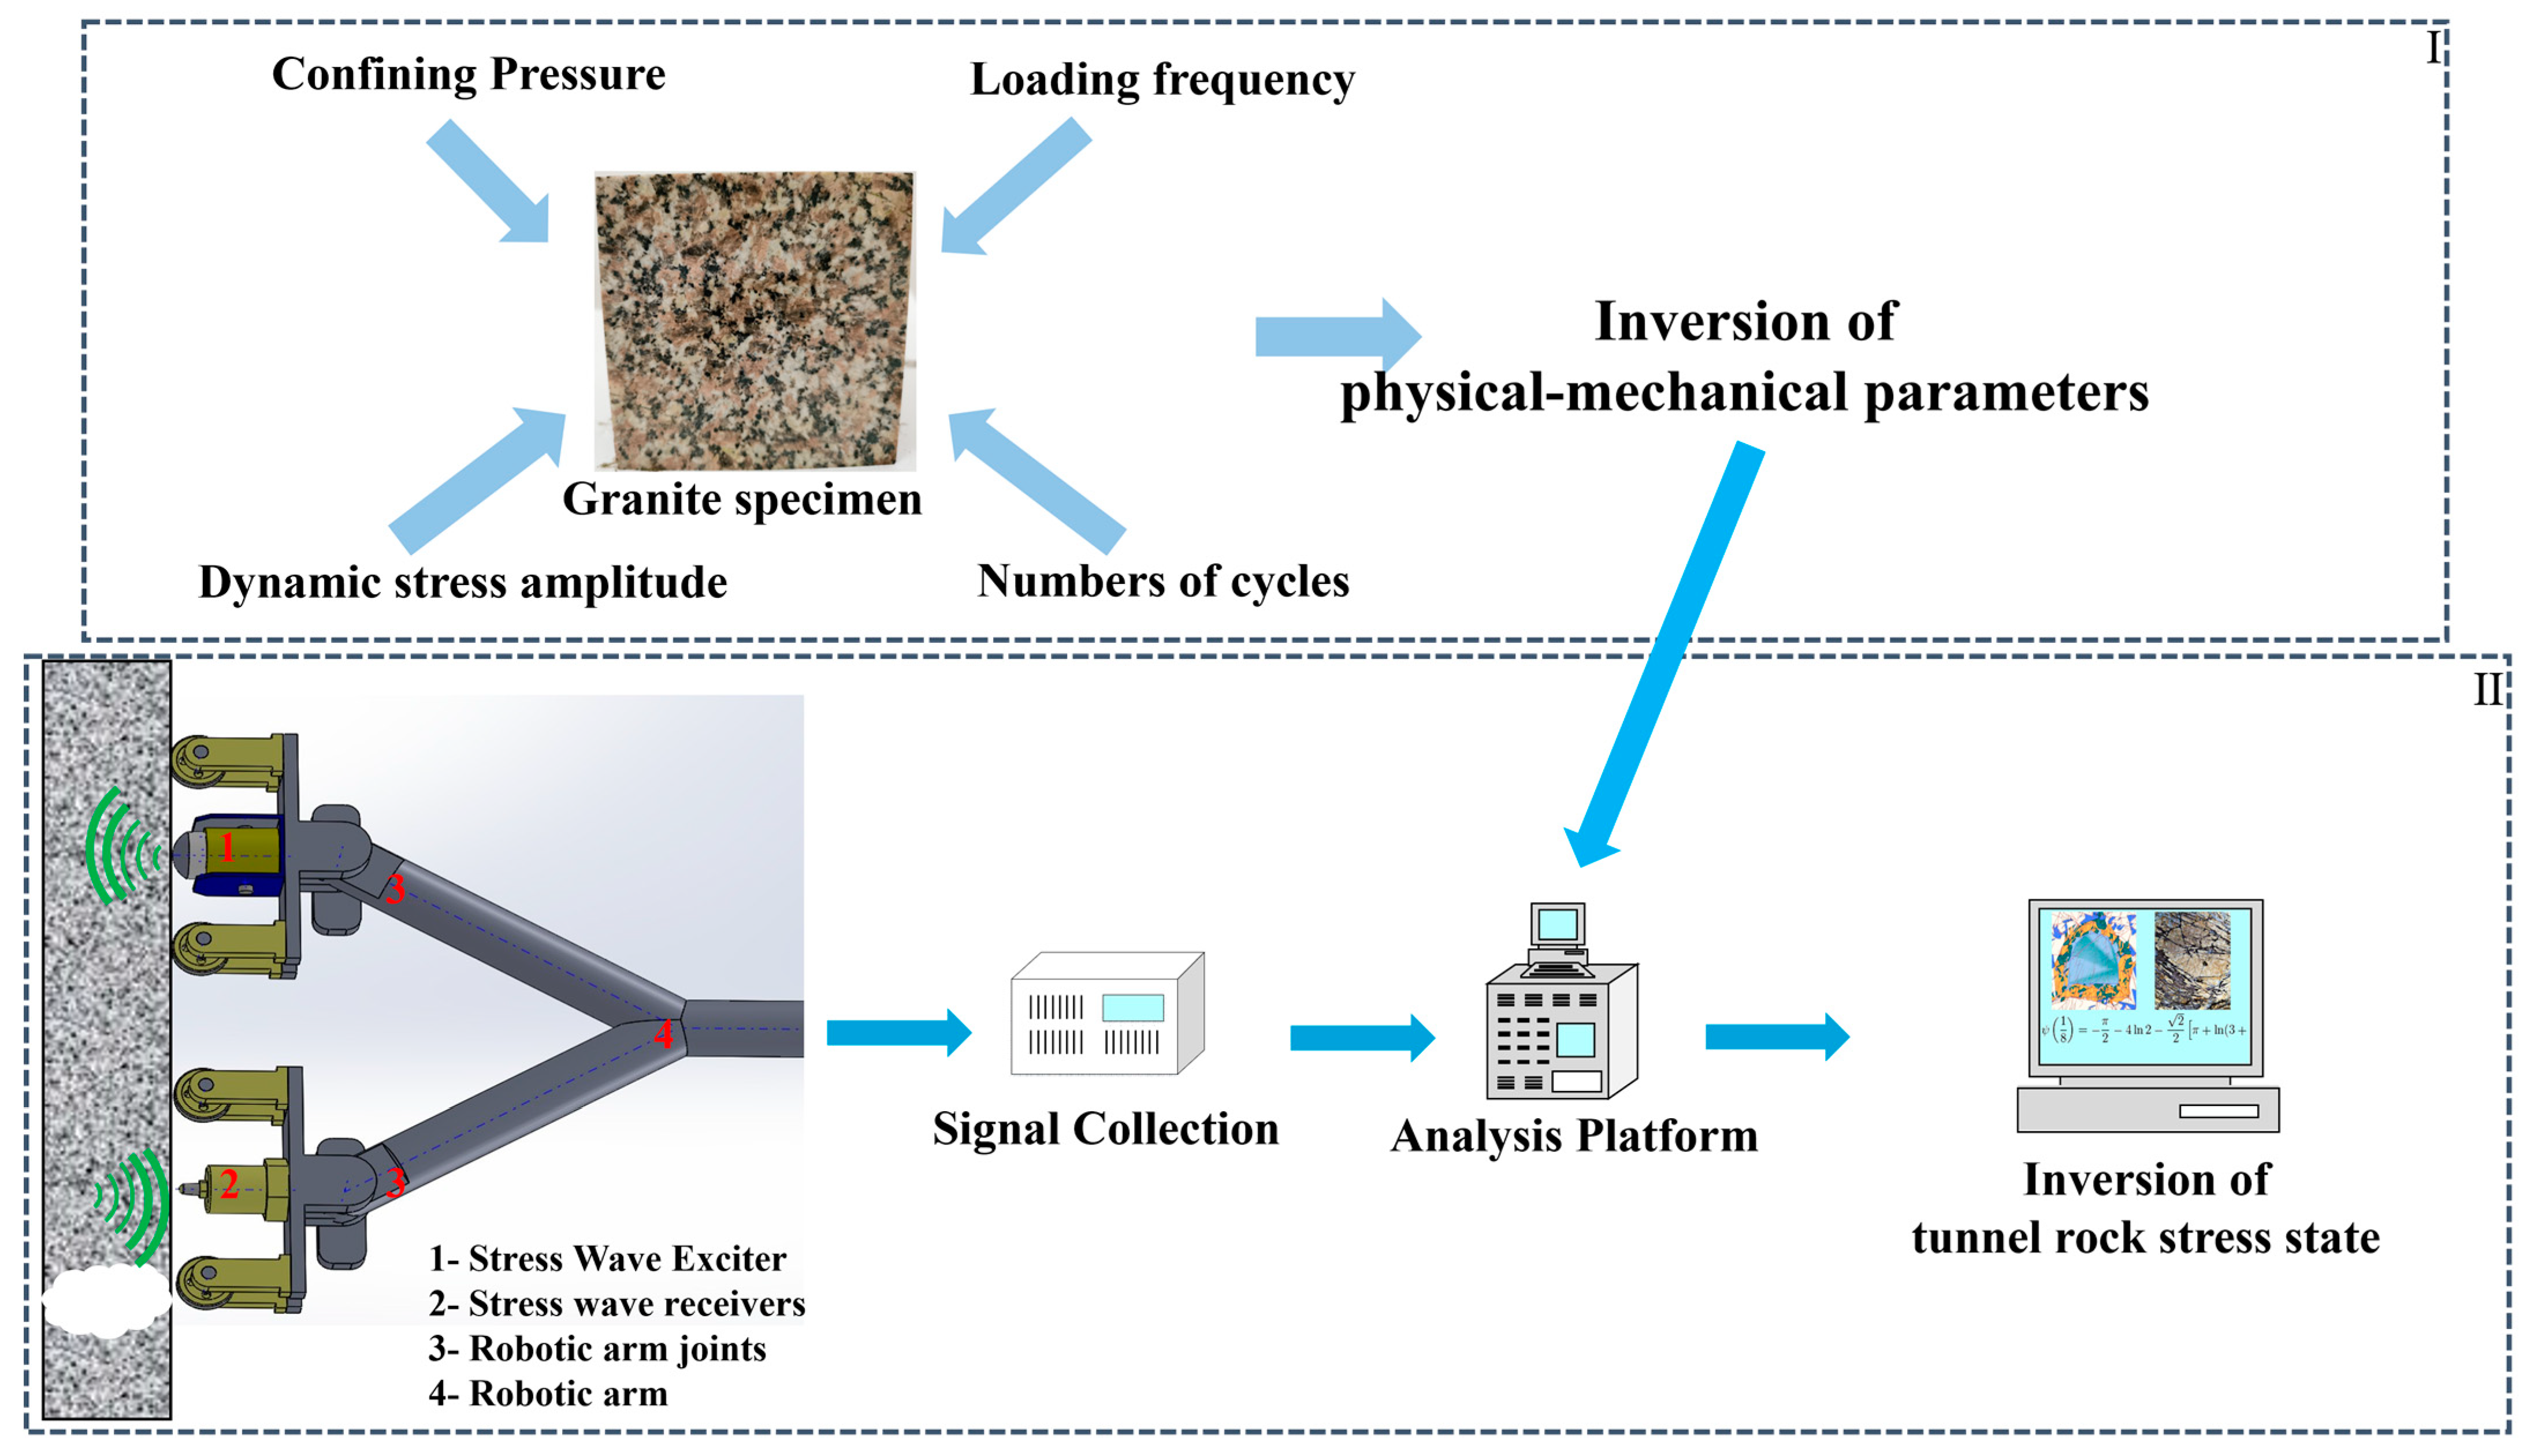
3. Experimental Setup
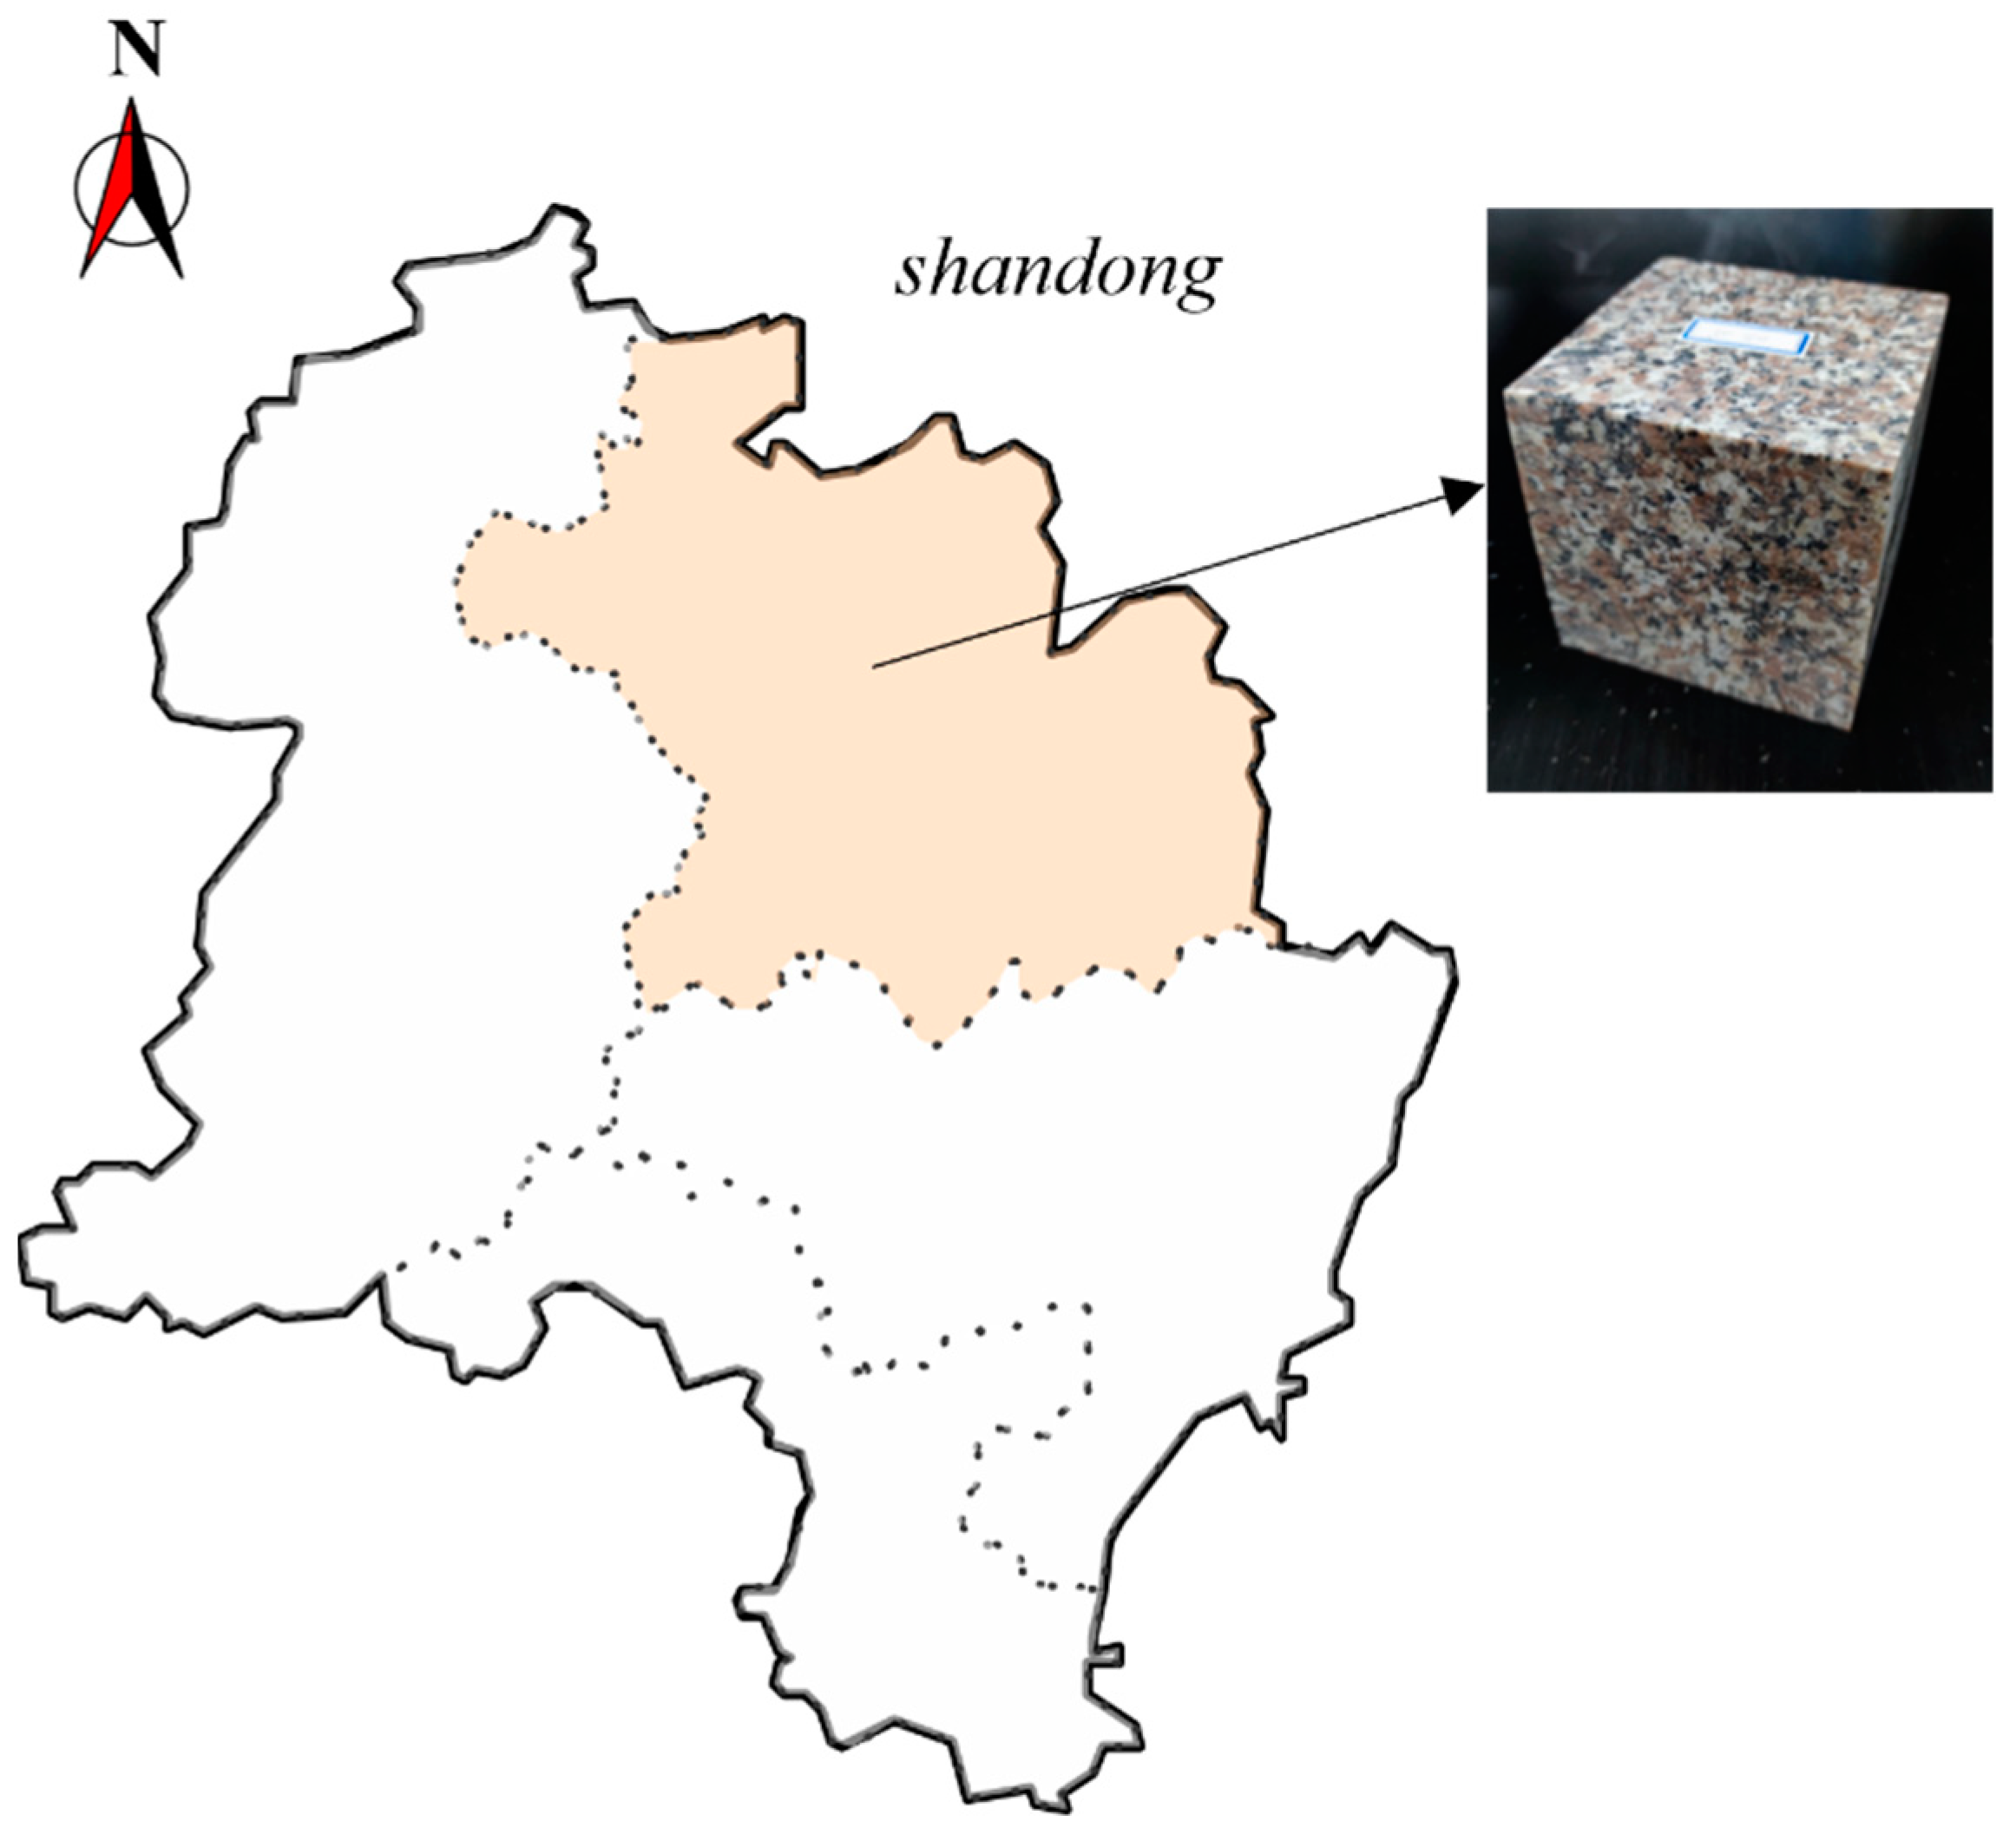
3.1. Specimen Preparation
3.2. Test Scheme
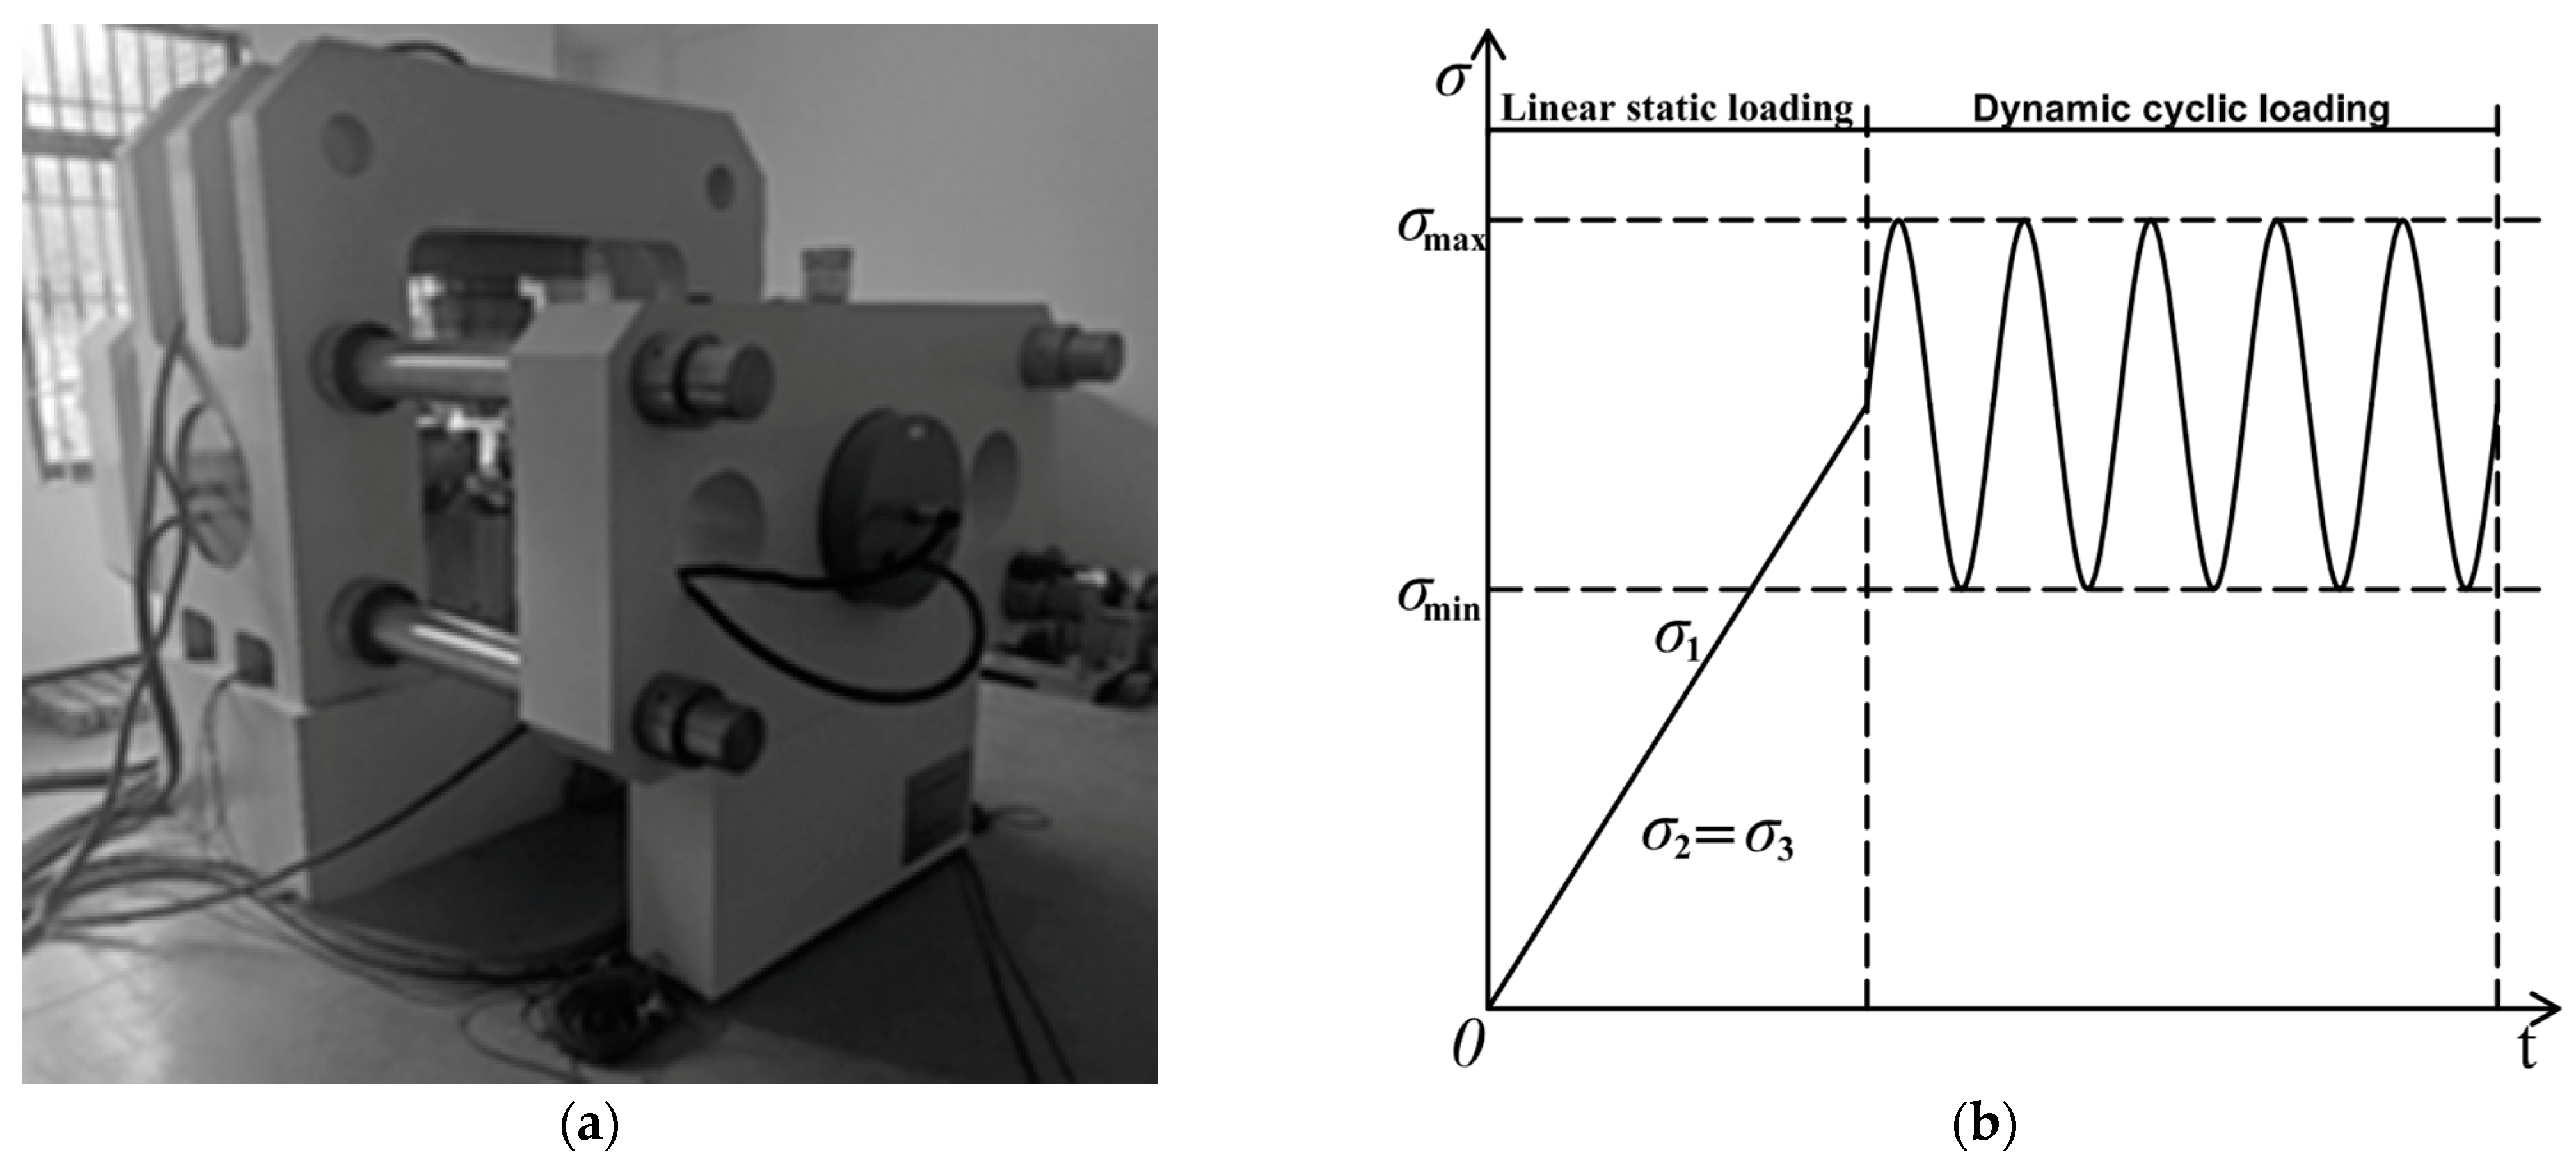
3.3. Test Principle
4. Results and Discussion
4.1. Hysteresis Loops of Specimens
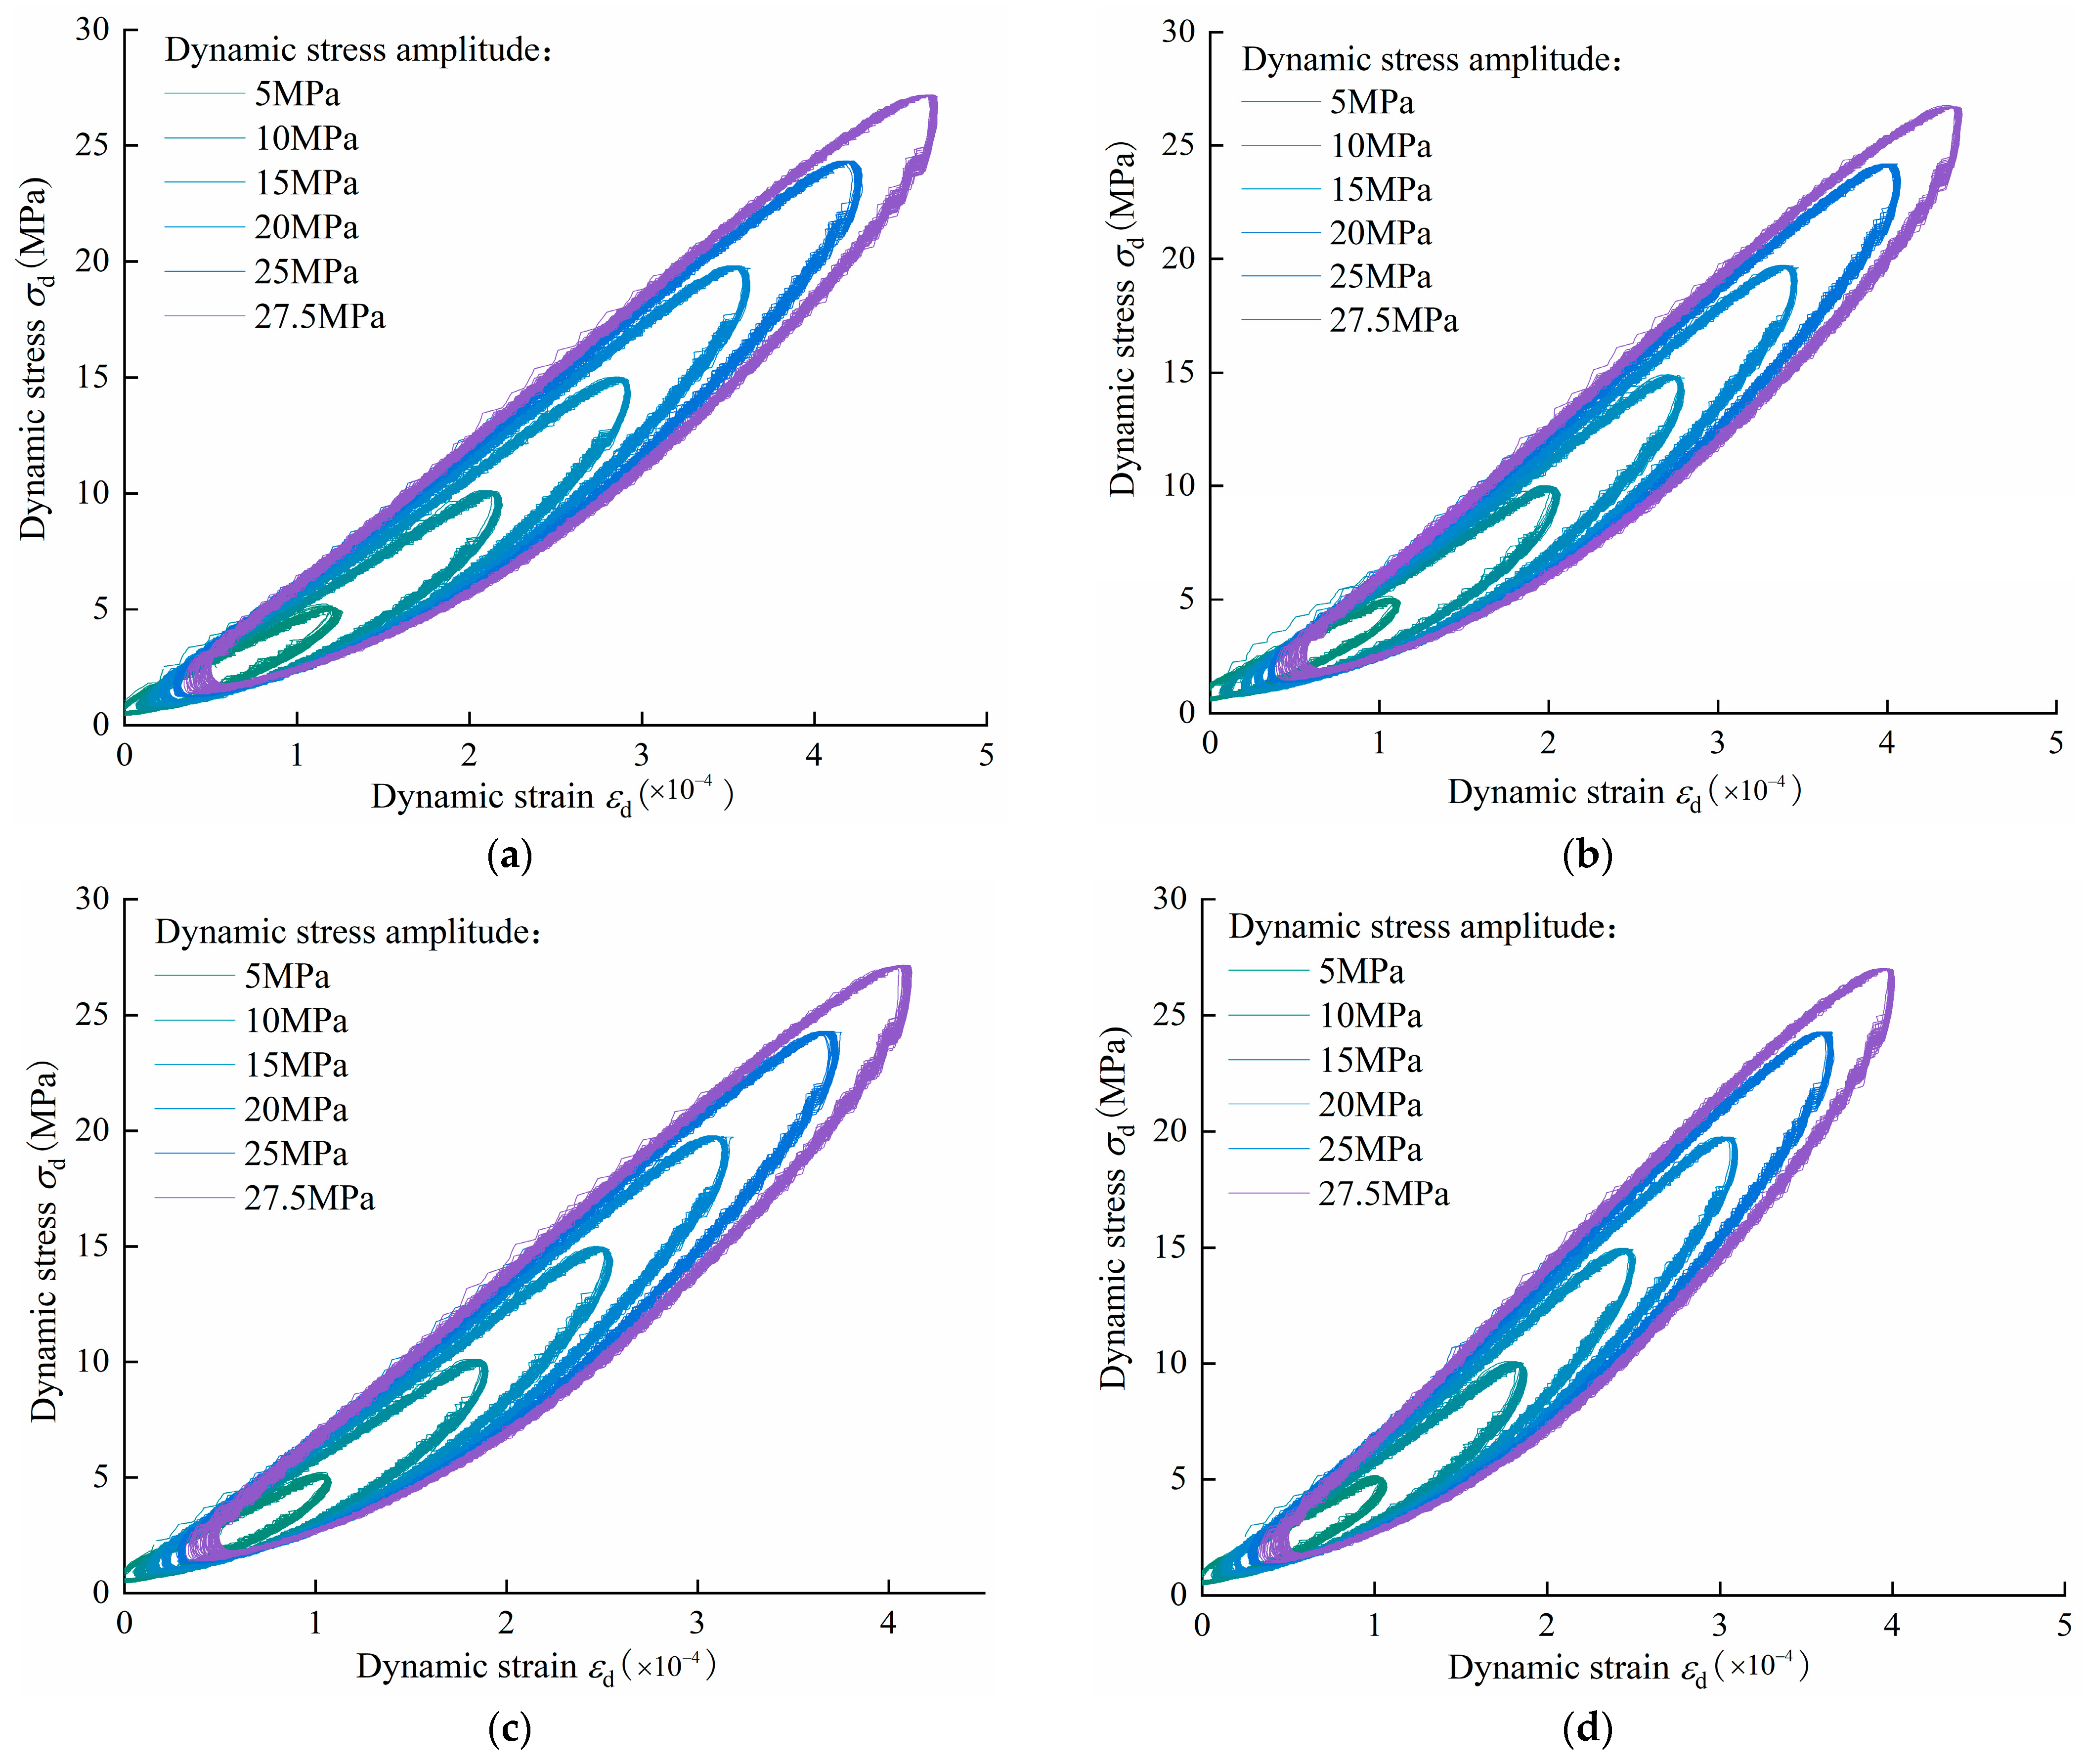
4.1.1. Effect of Confining Pressure
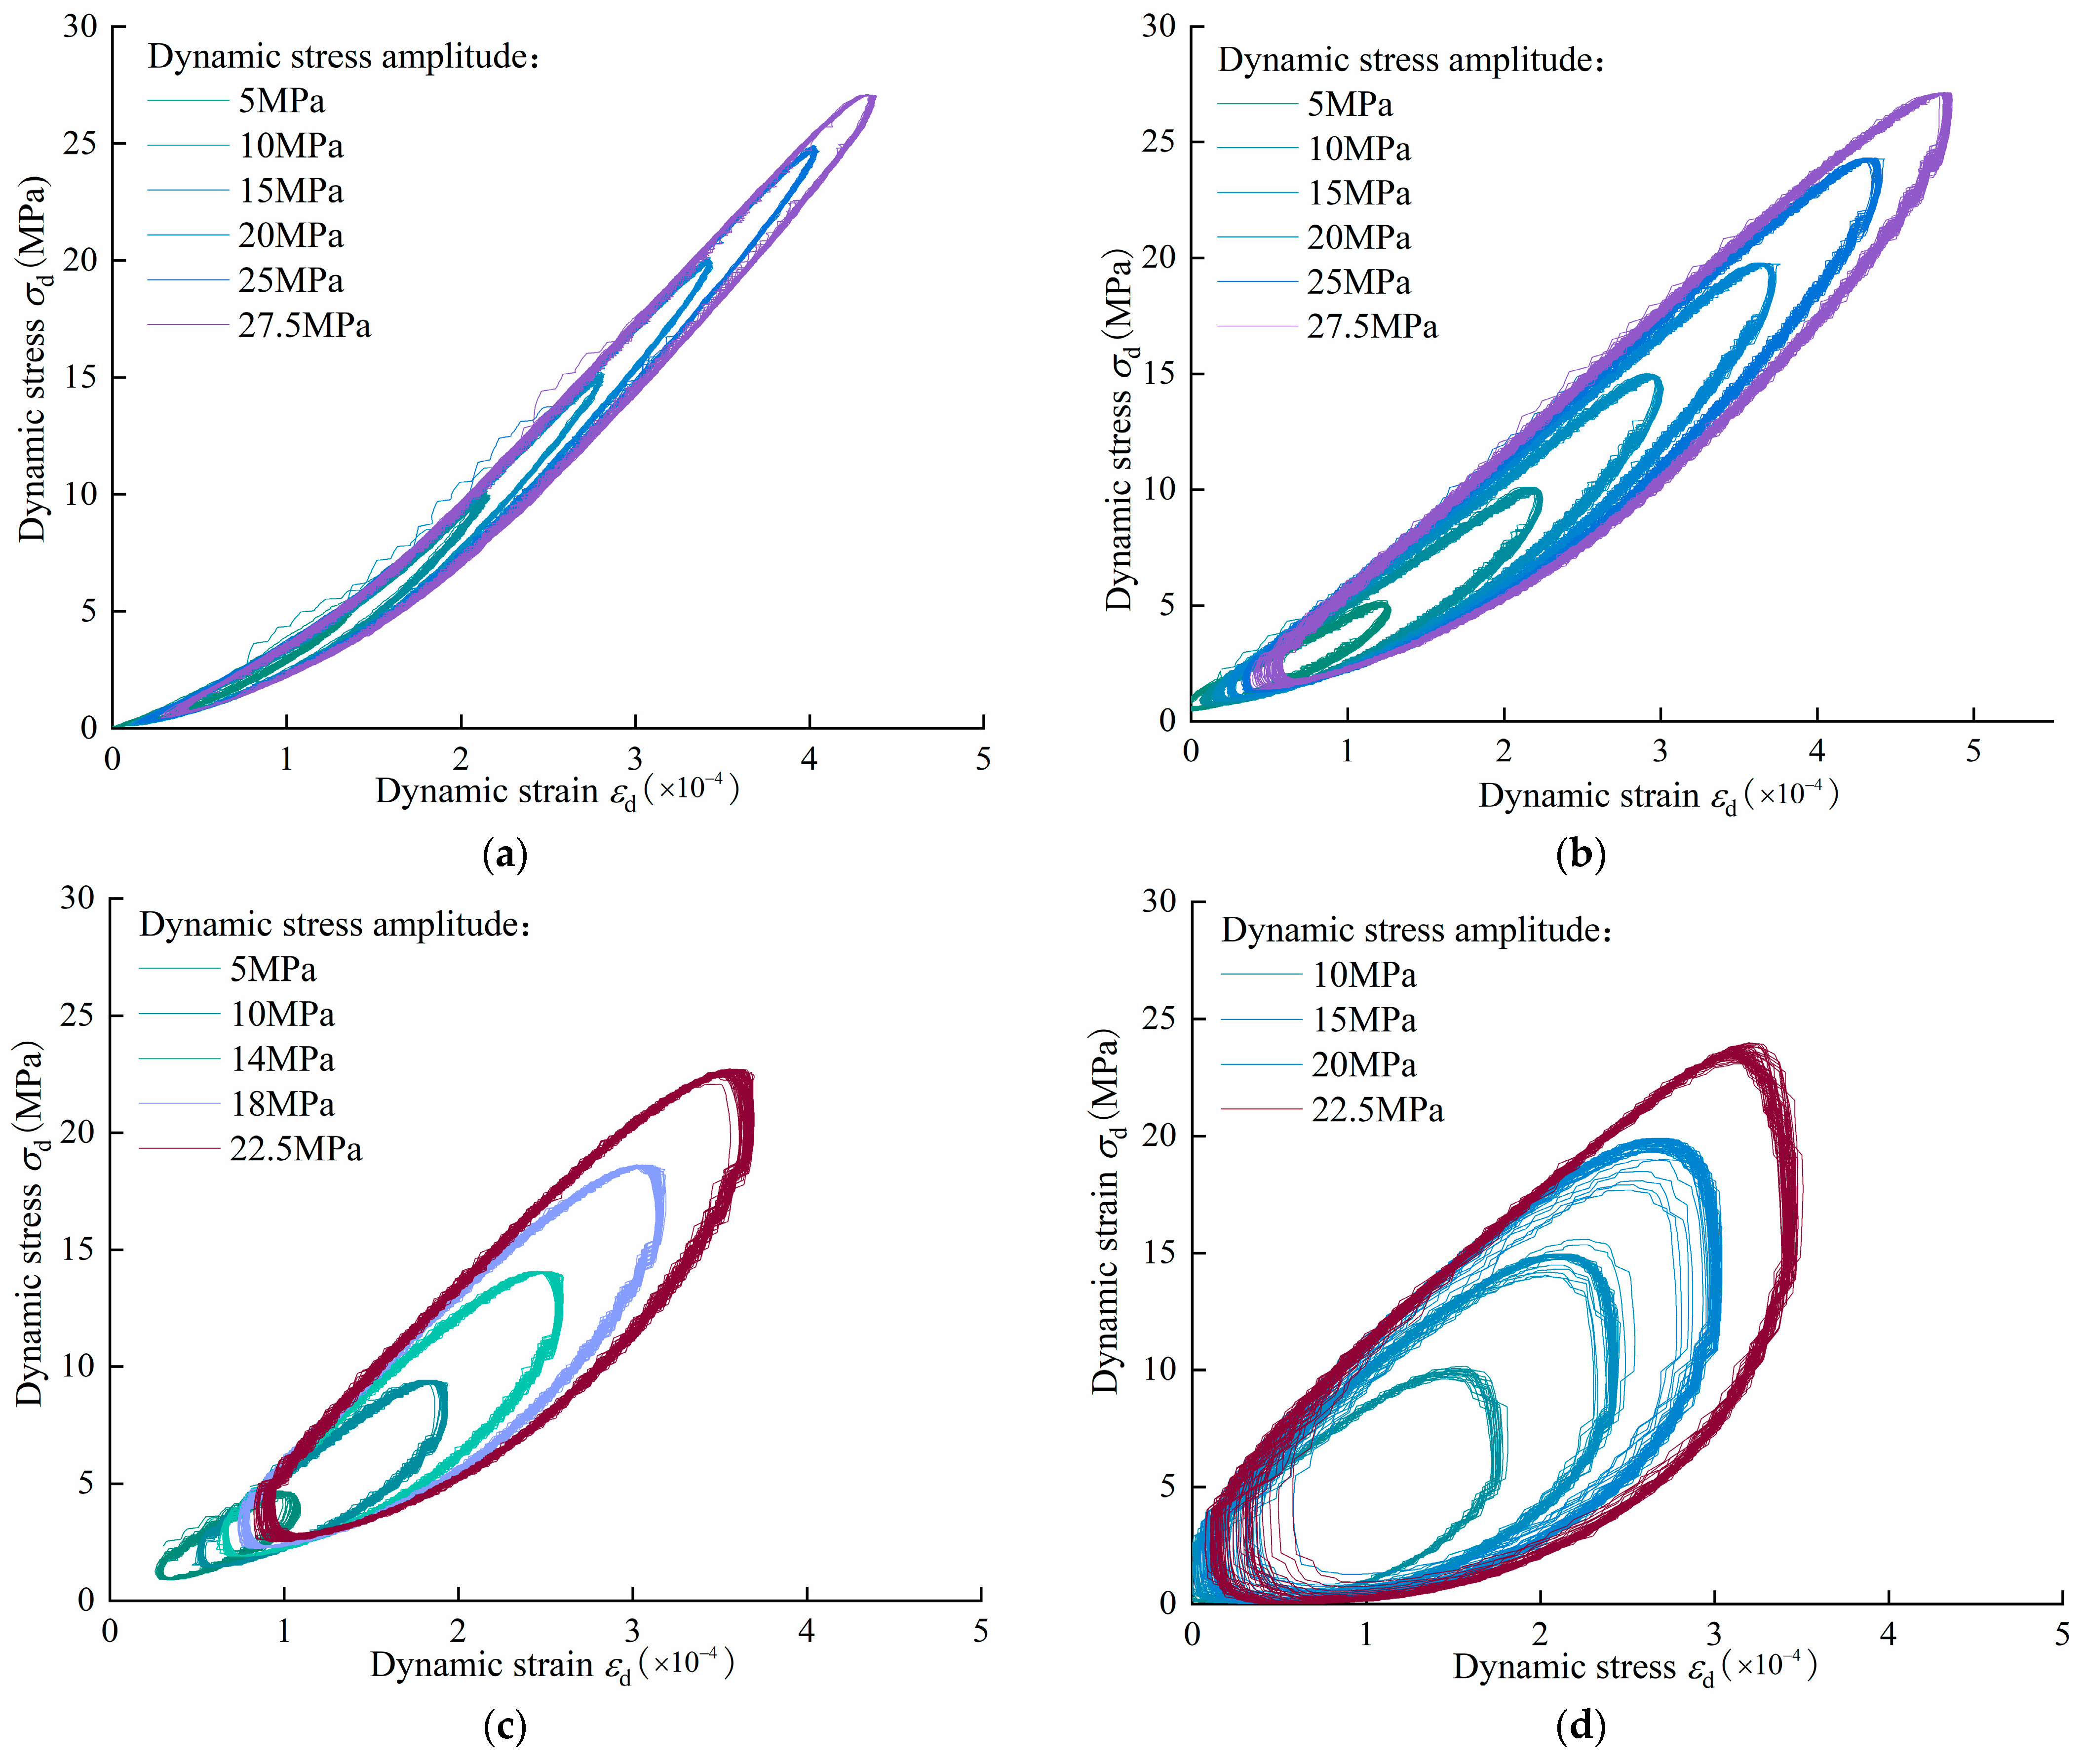
4.1.2. Effect of Loading Frequency
4.2. Dynamic Elastic Modulus and Dynamic Damping Ratio of Specimens
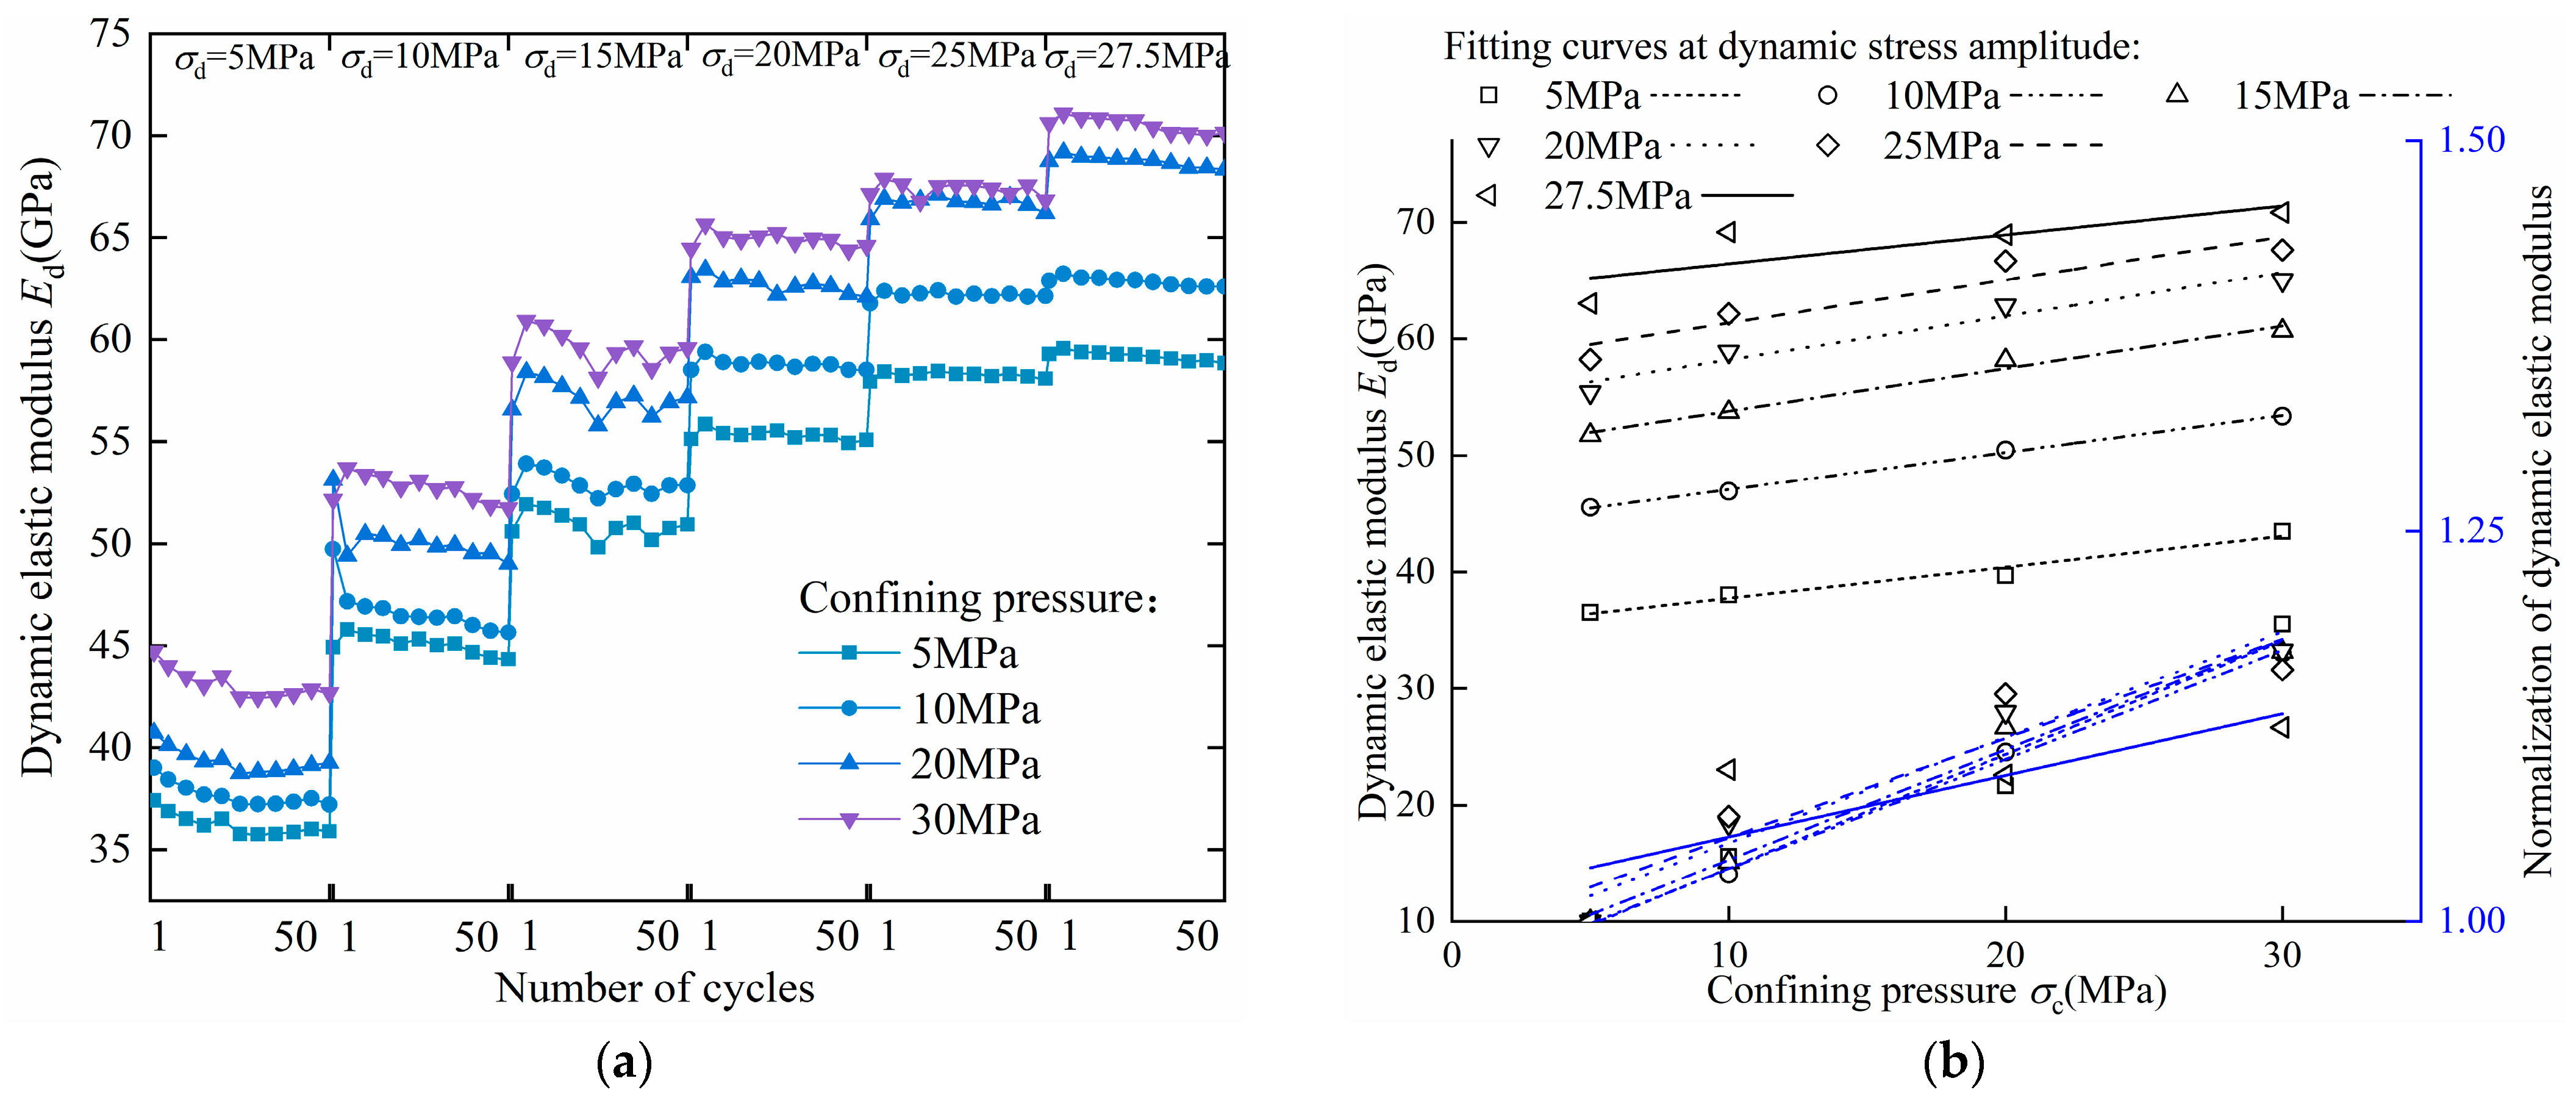
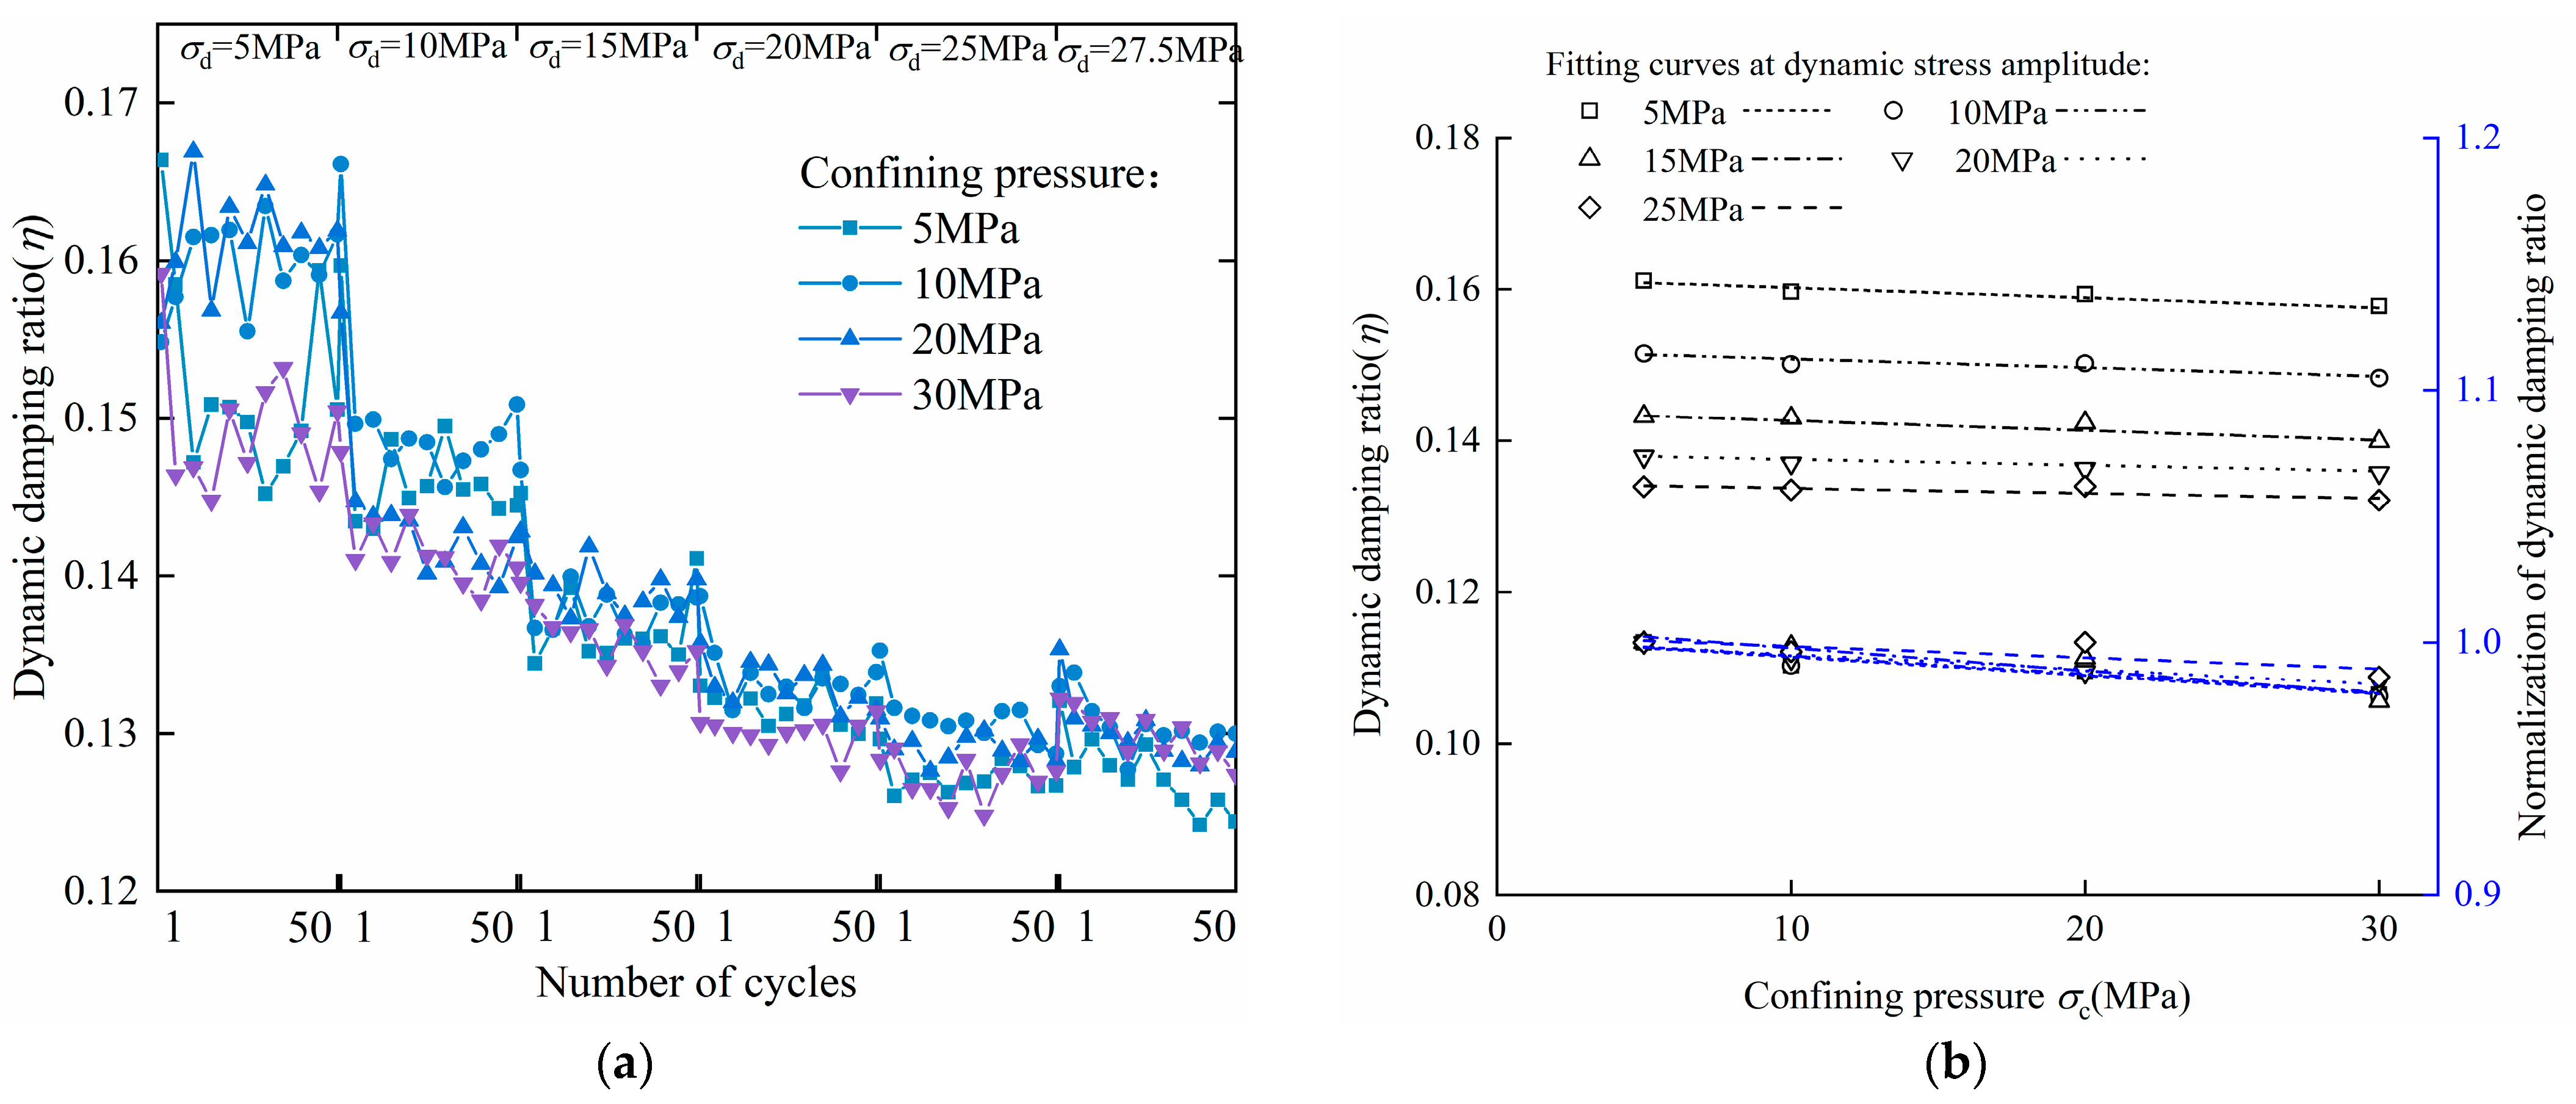
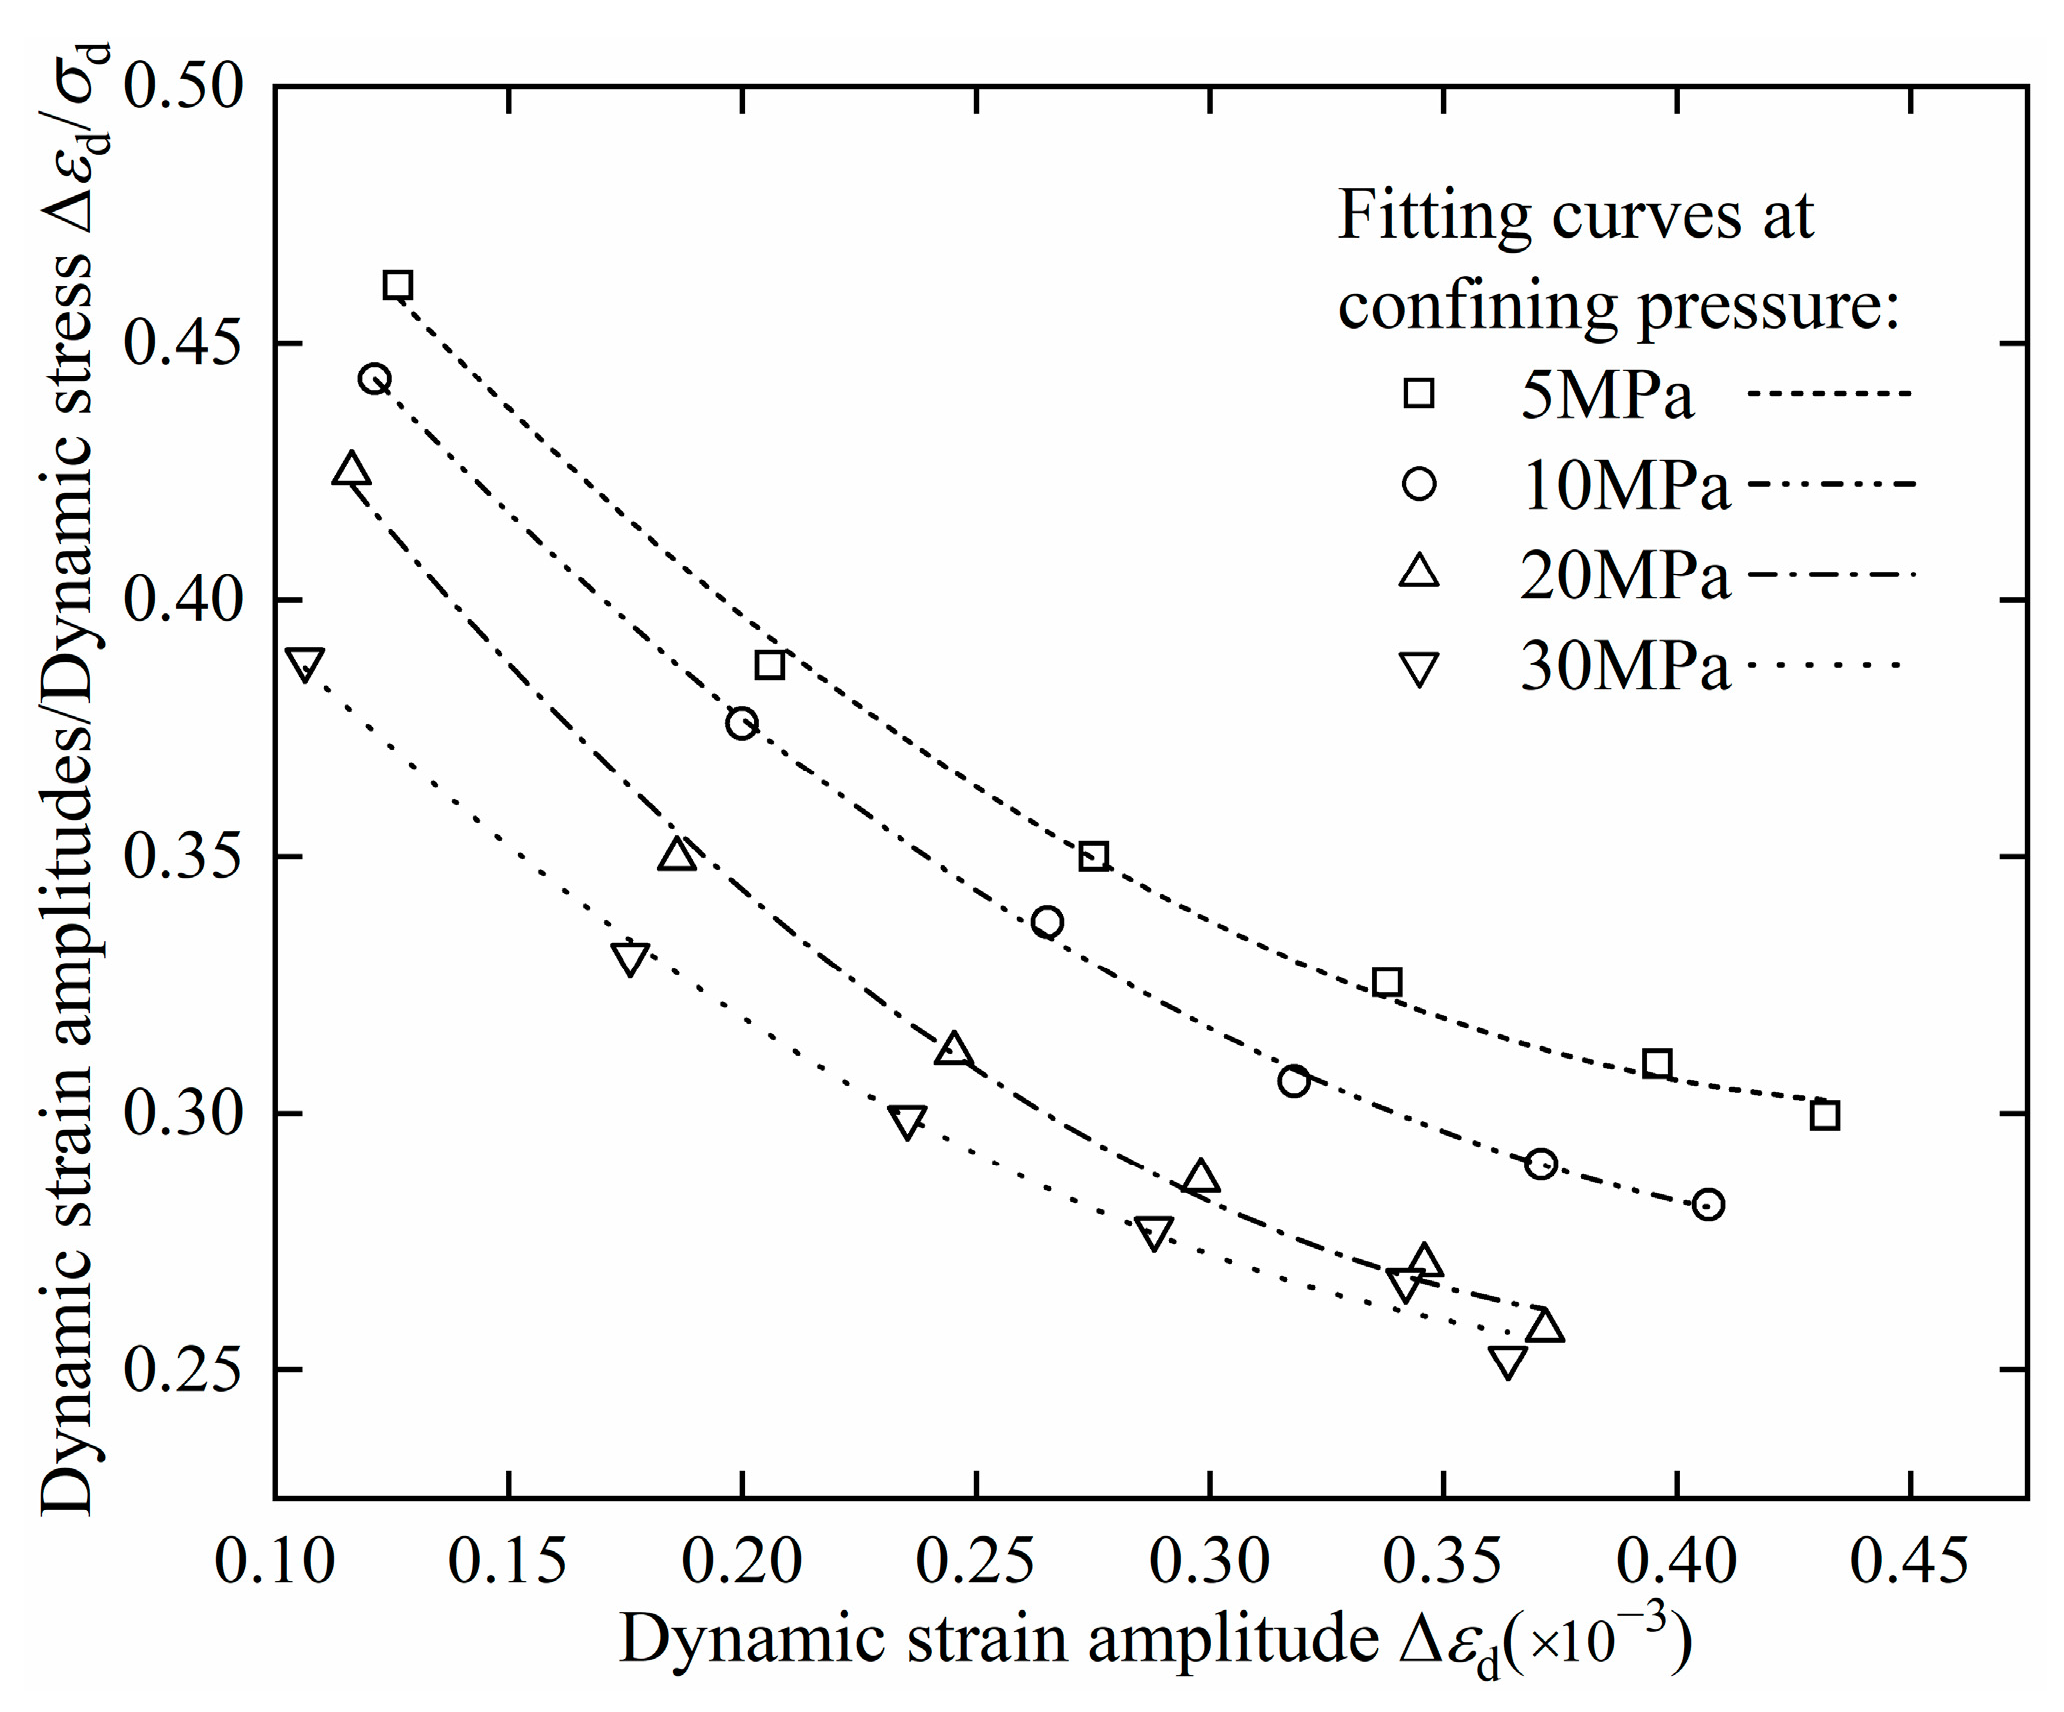
4.2.1. Effect of Confining Pressure
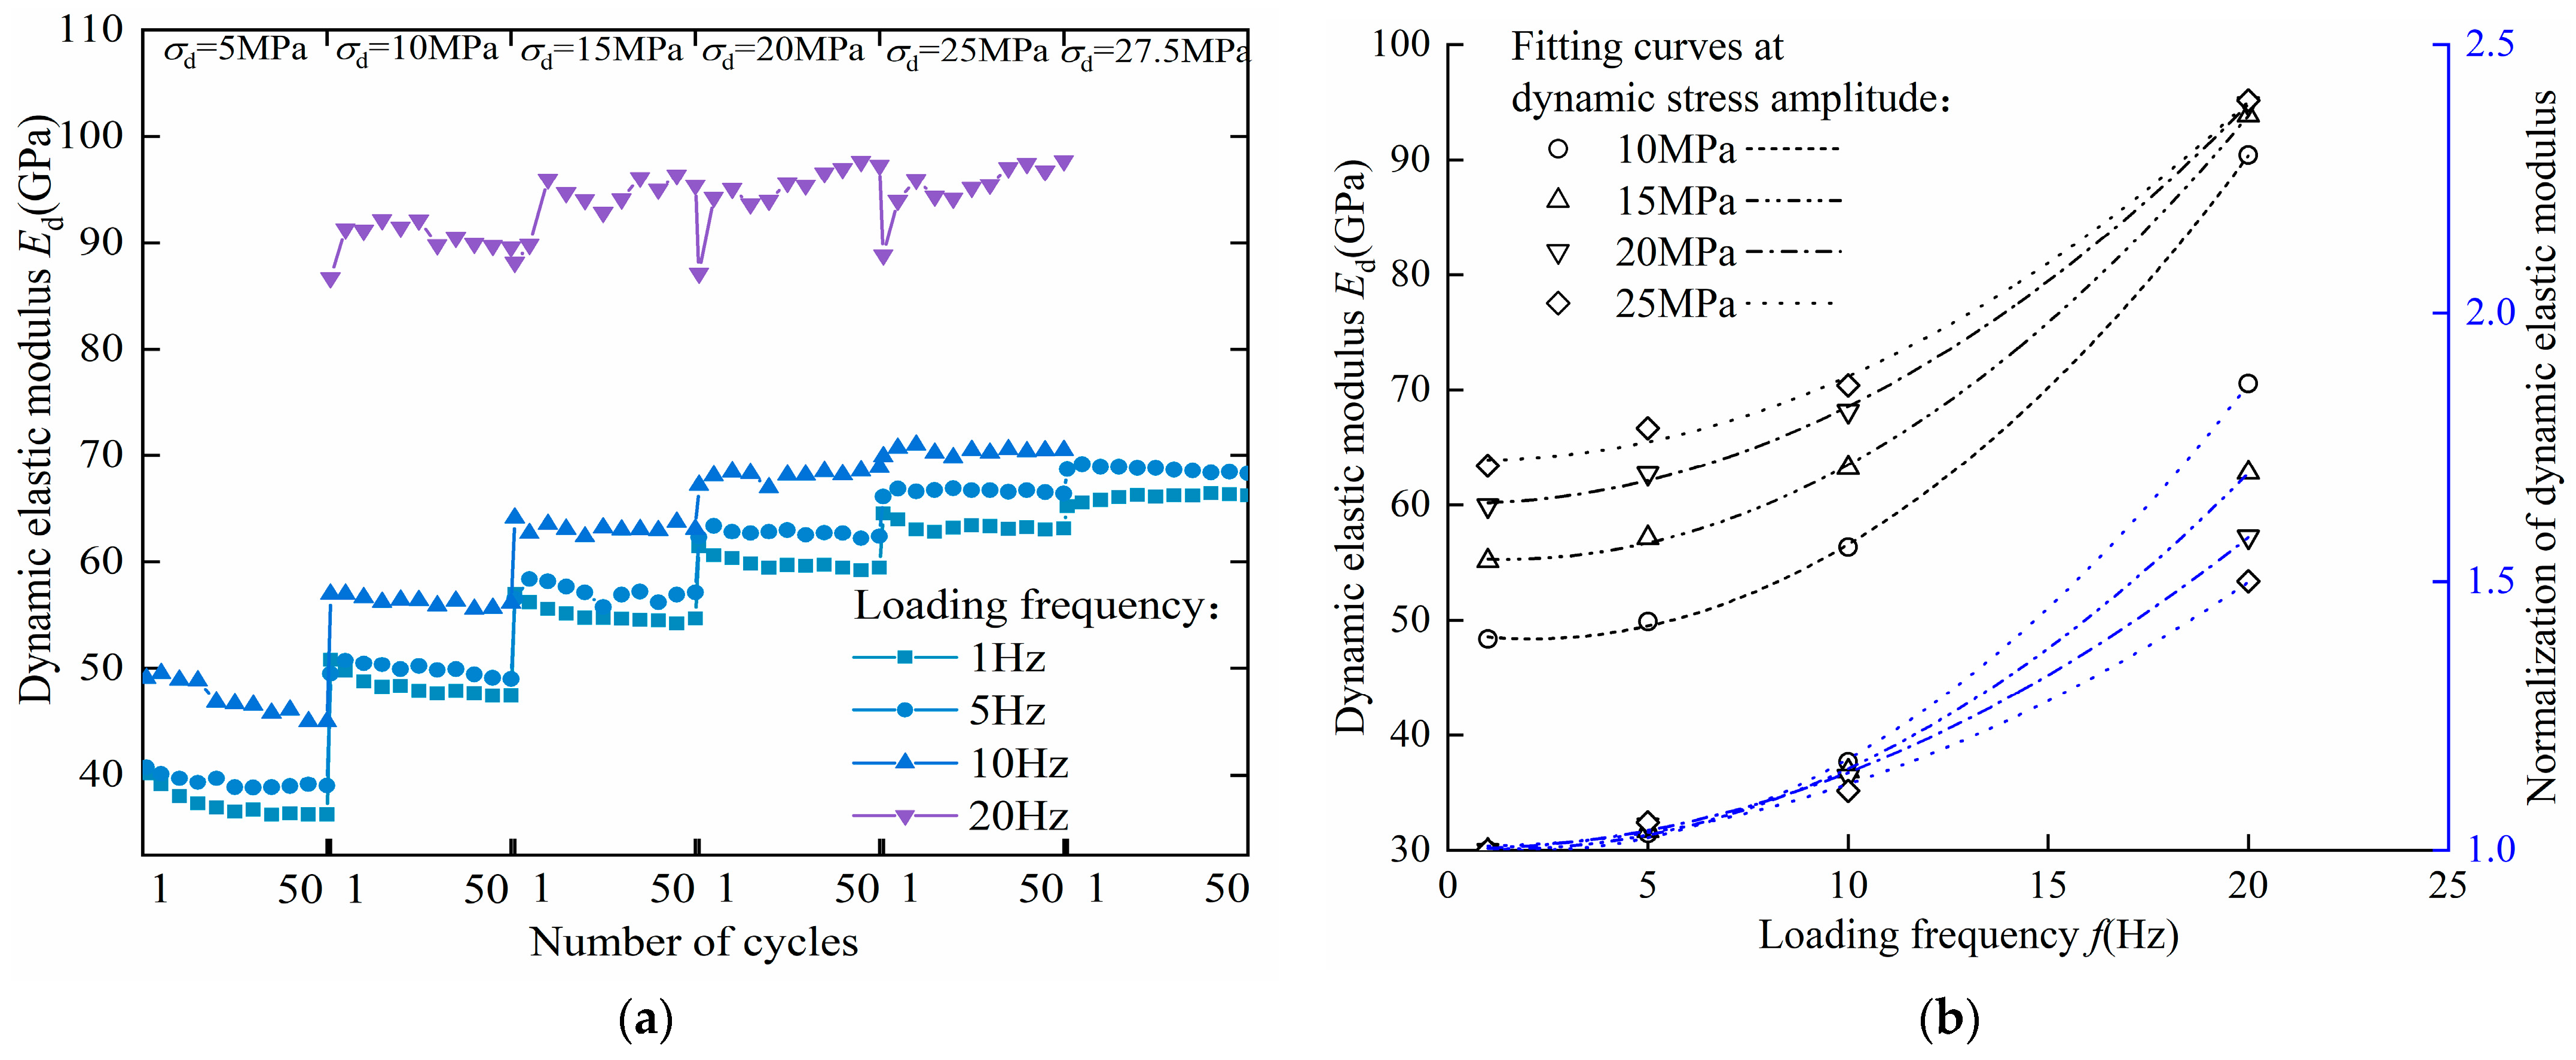
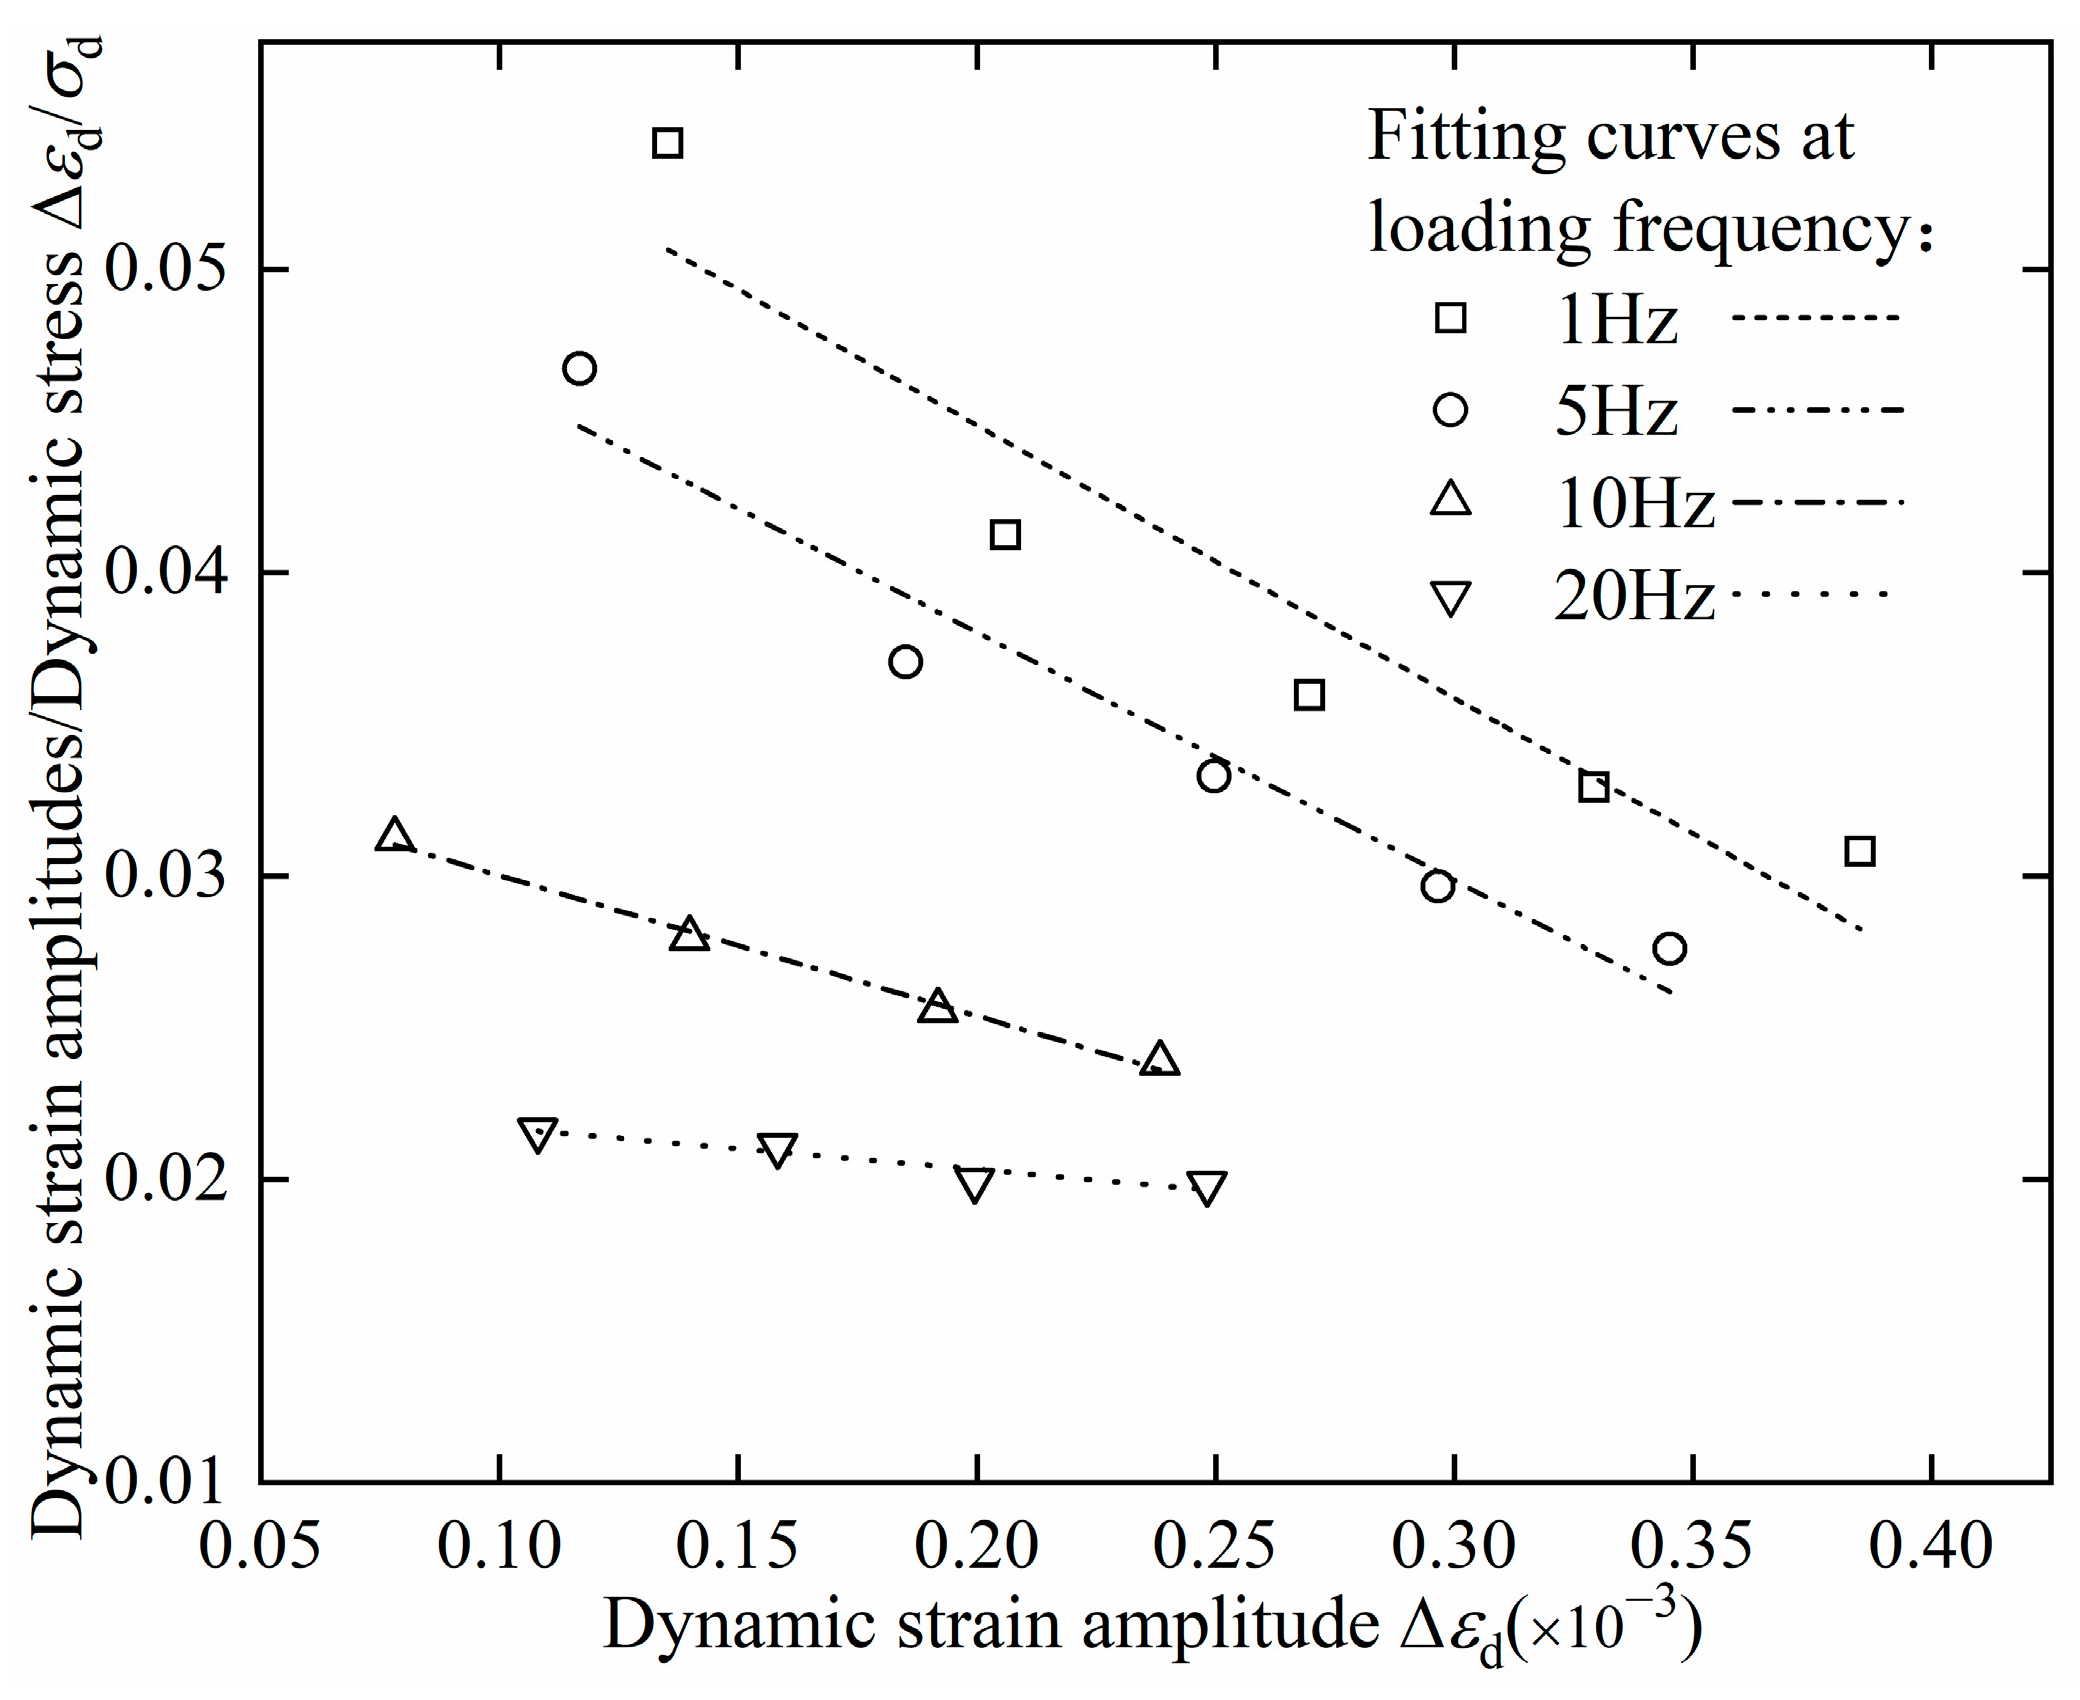
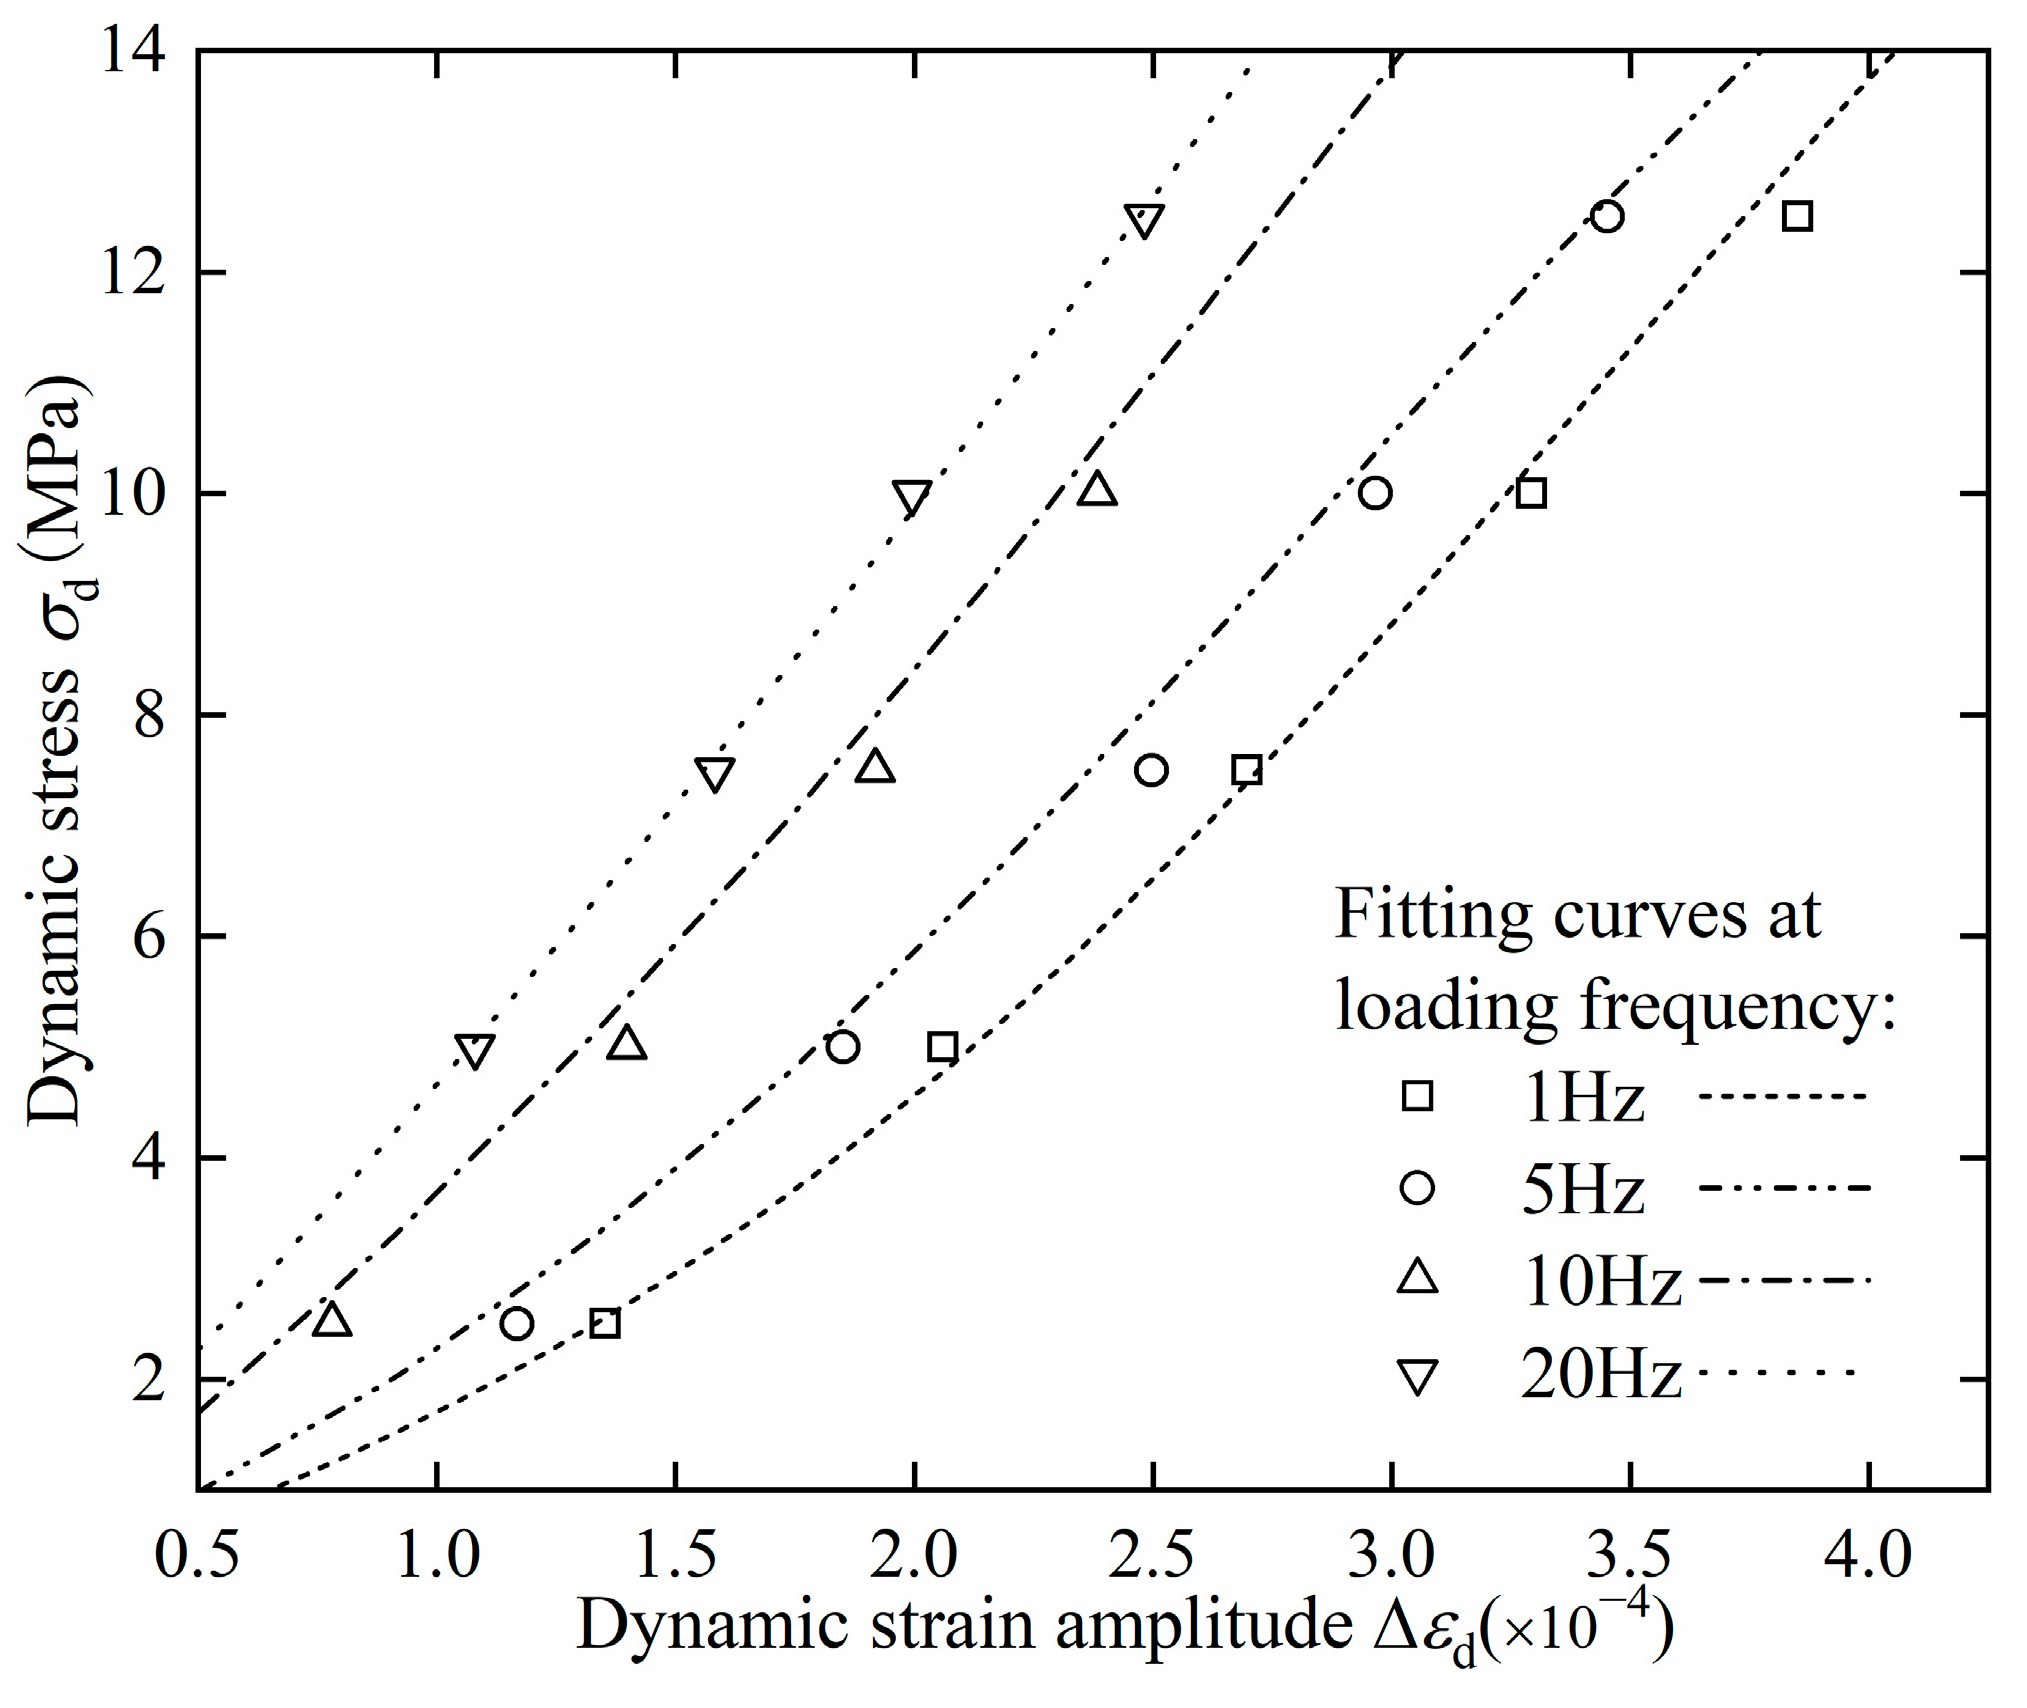
4.2.2. Effect of Loading Frequency
4.2.3. Effect of Dynamic Stress Amplitude
4.2.4. Effect of Number of Cycles
5. Dynamic Response Model
5.1. Model Establishment
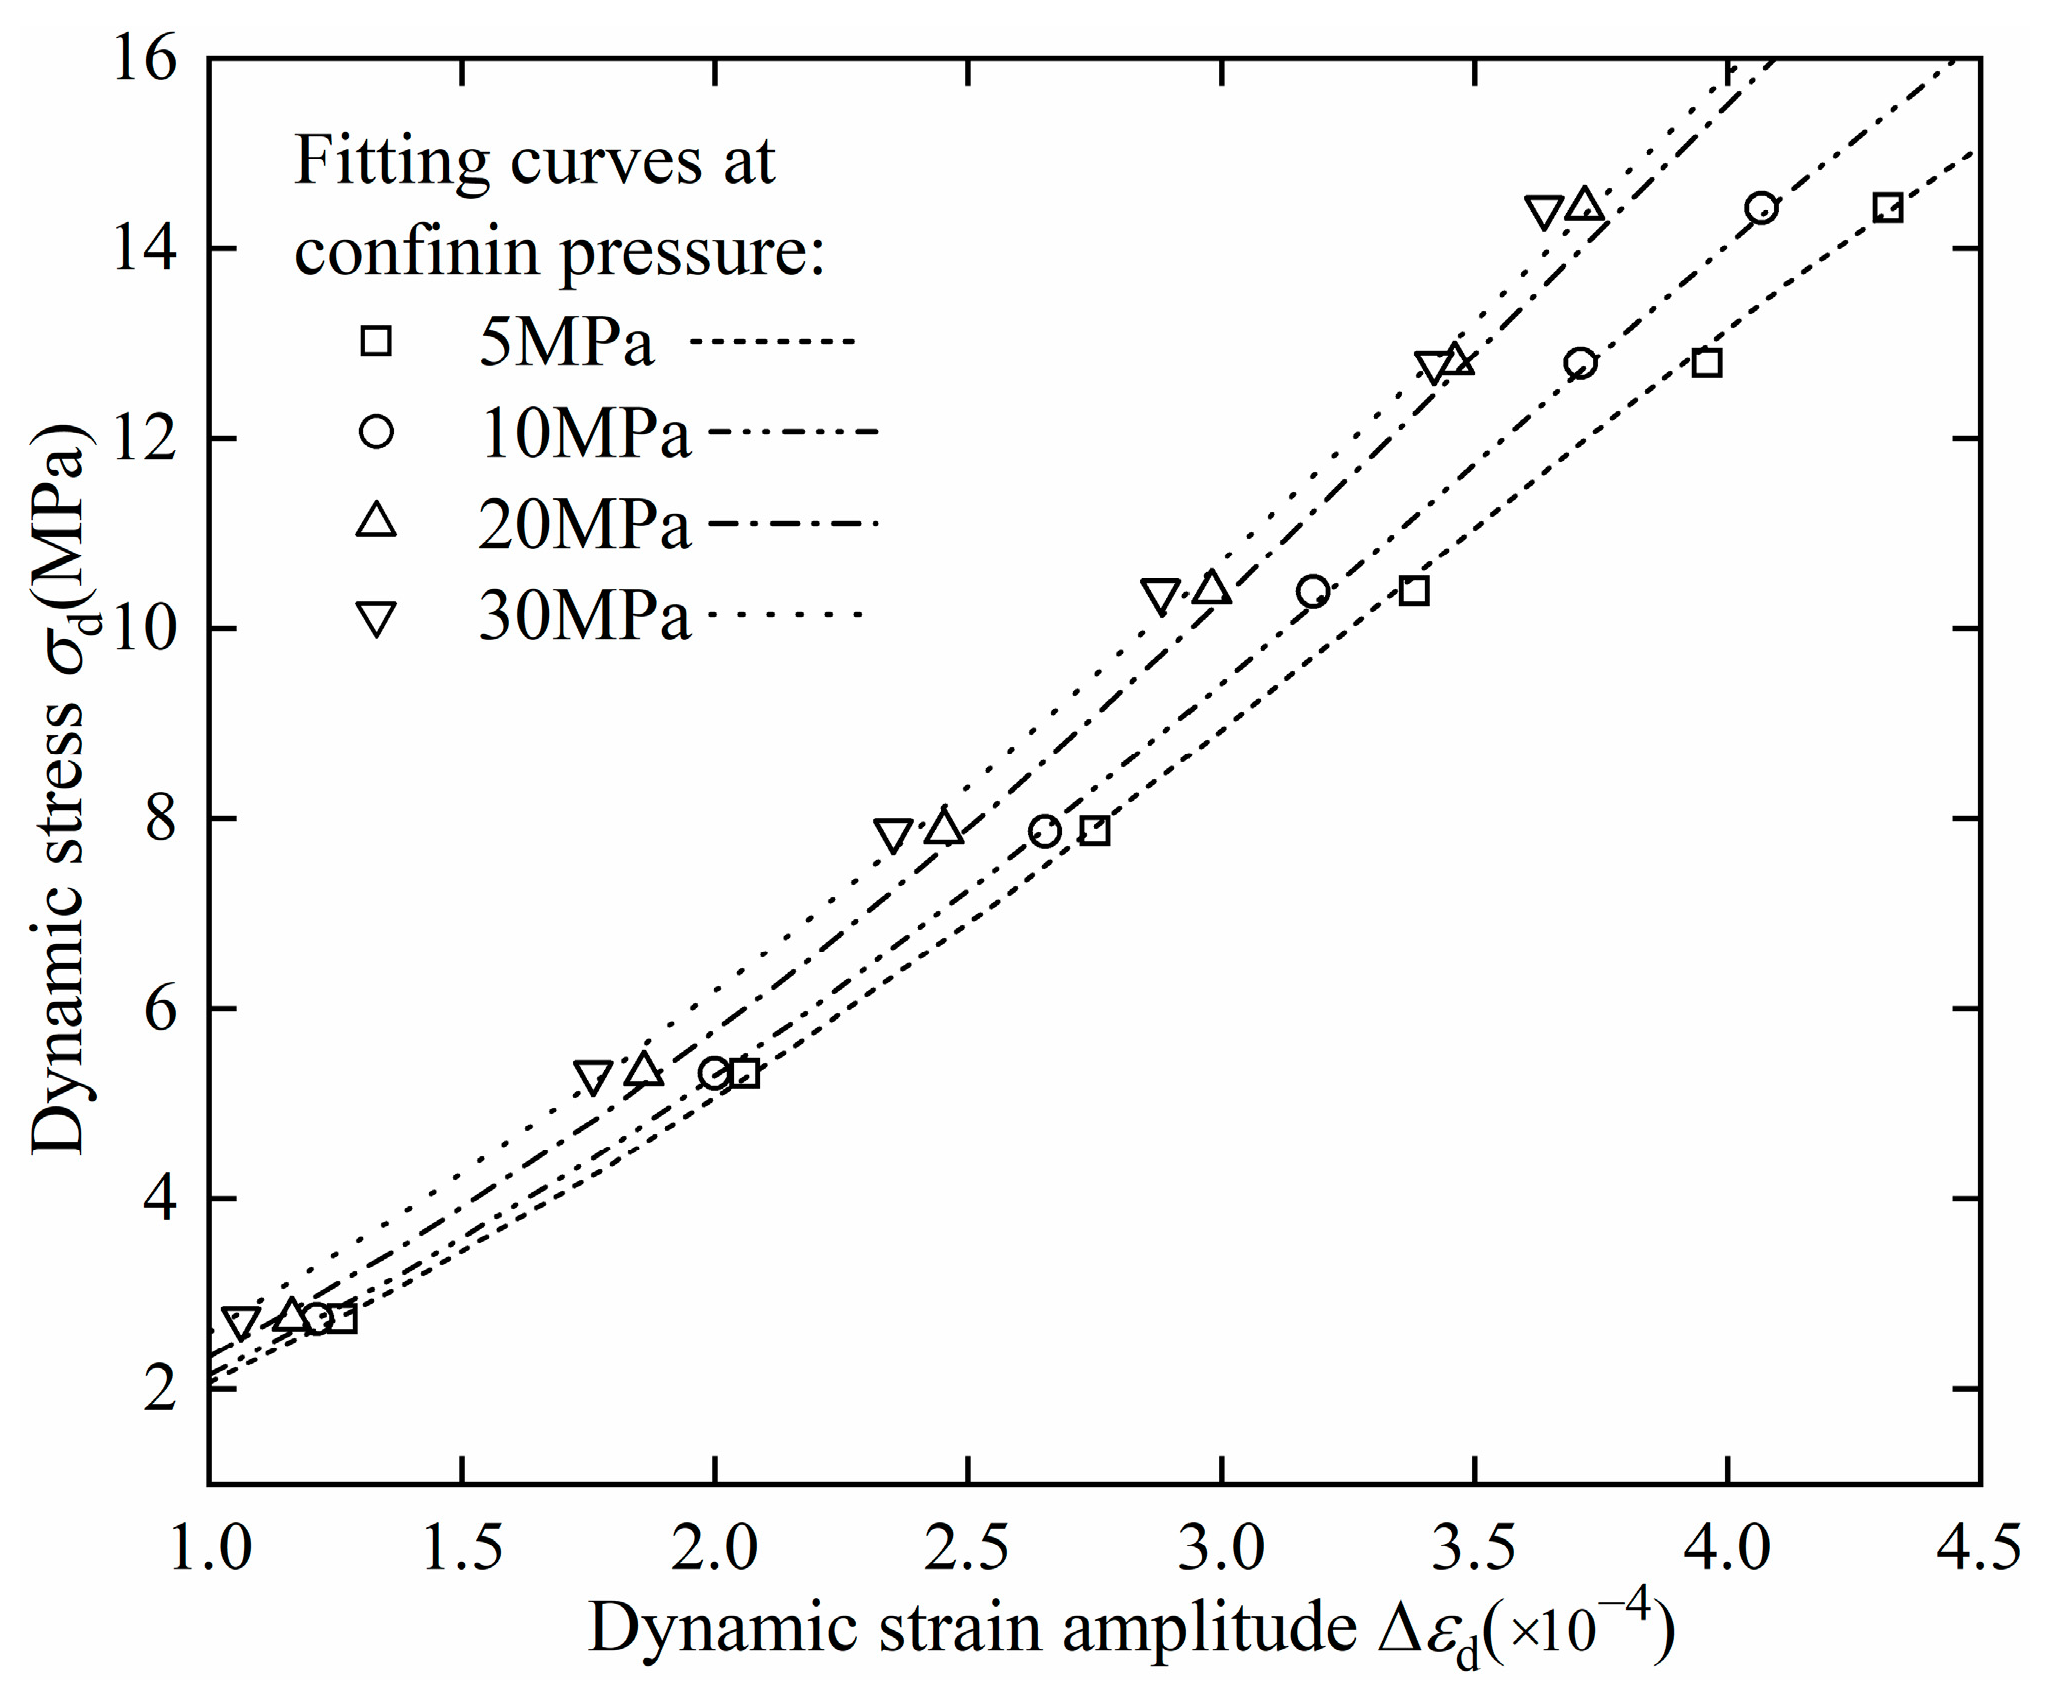
5.2. Influence of Confining Pressure
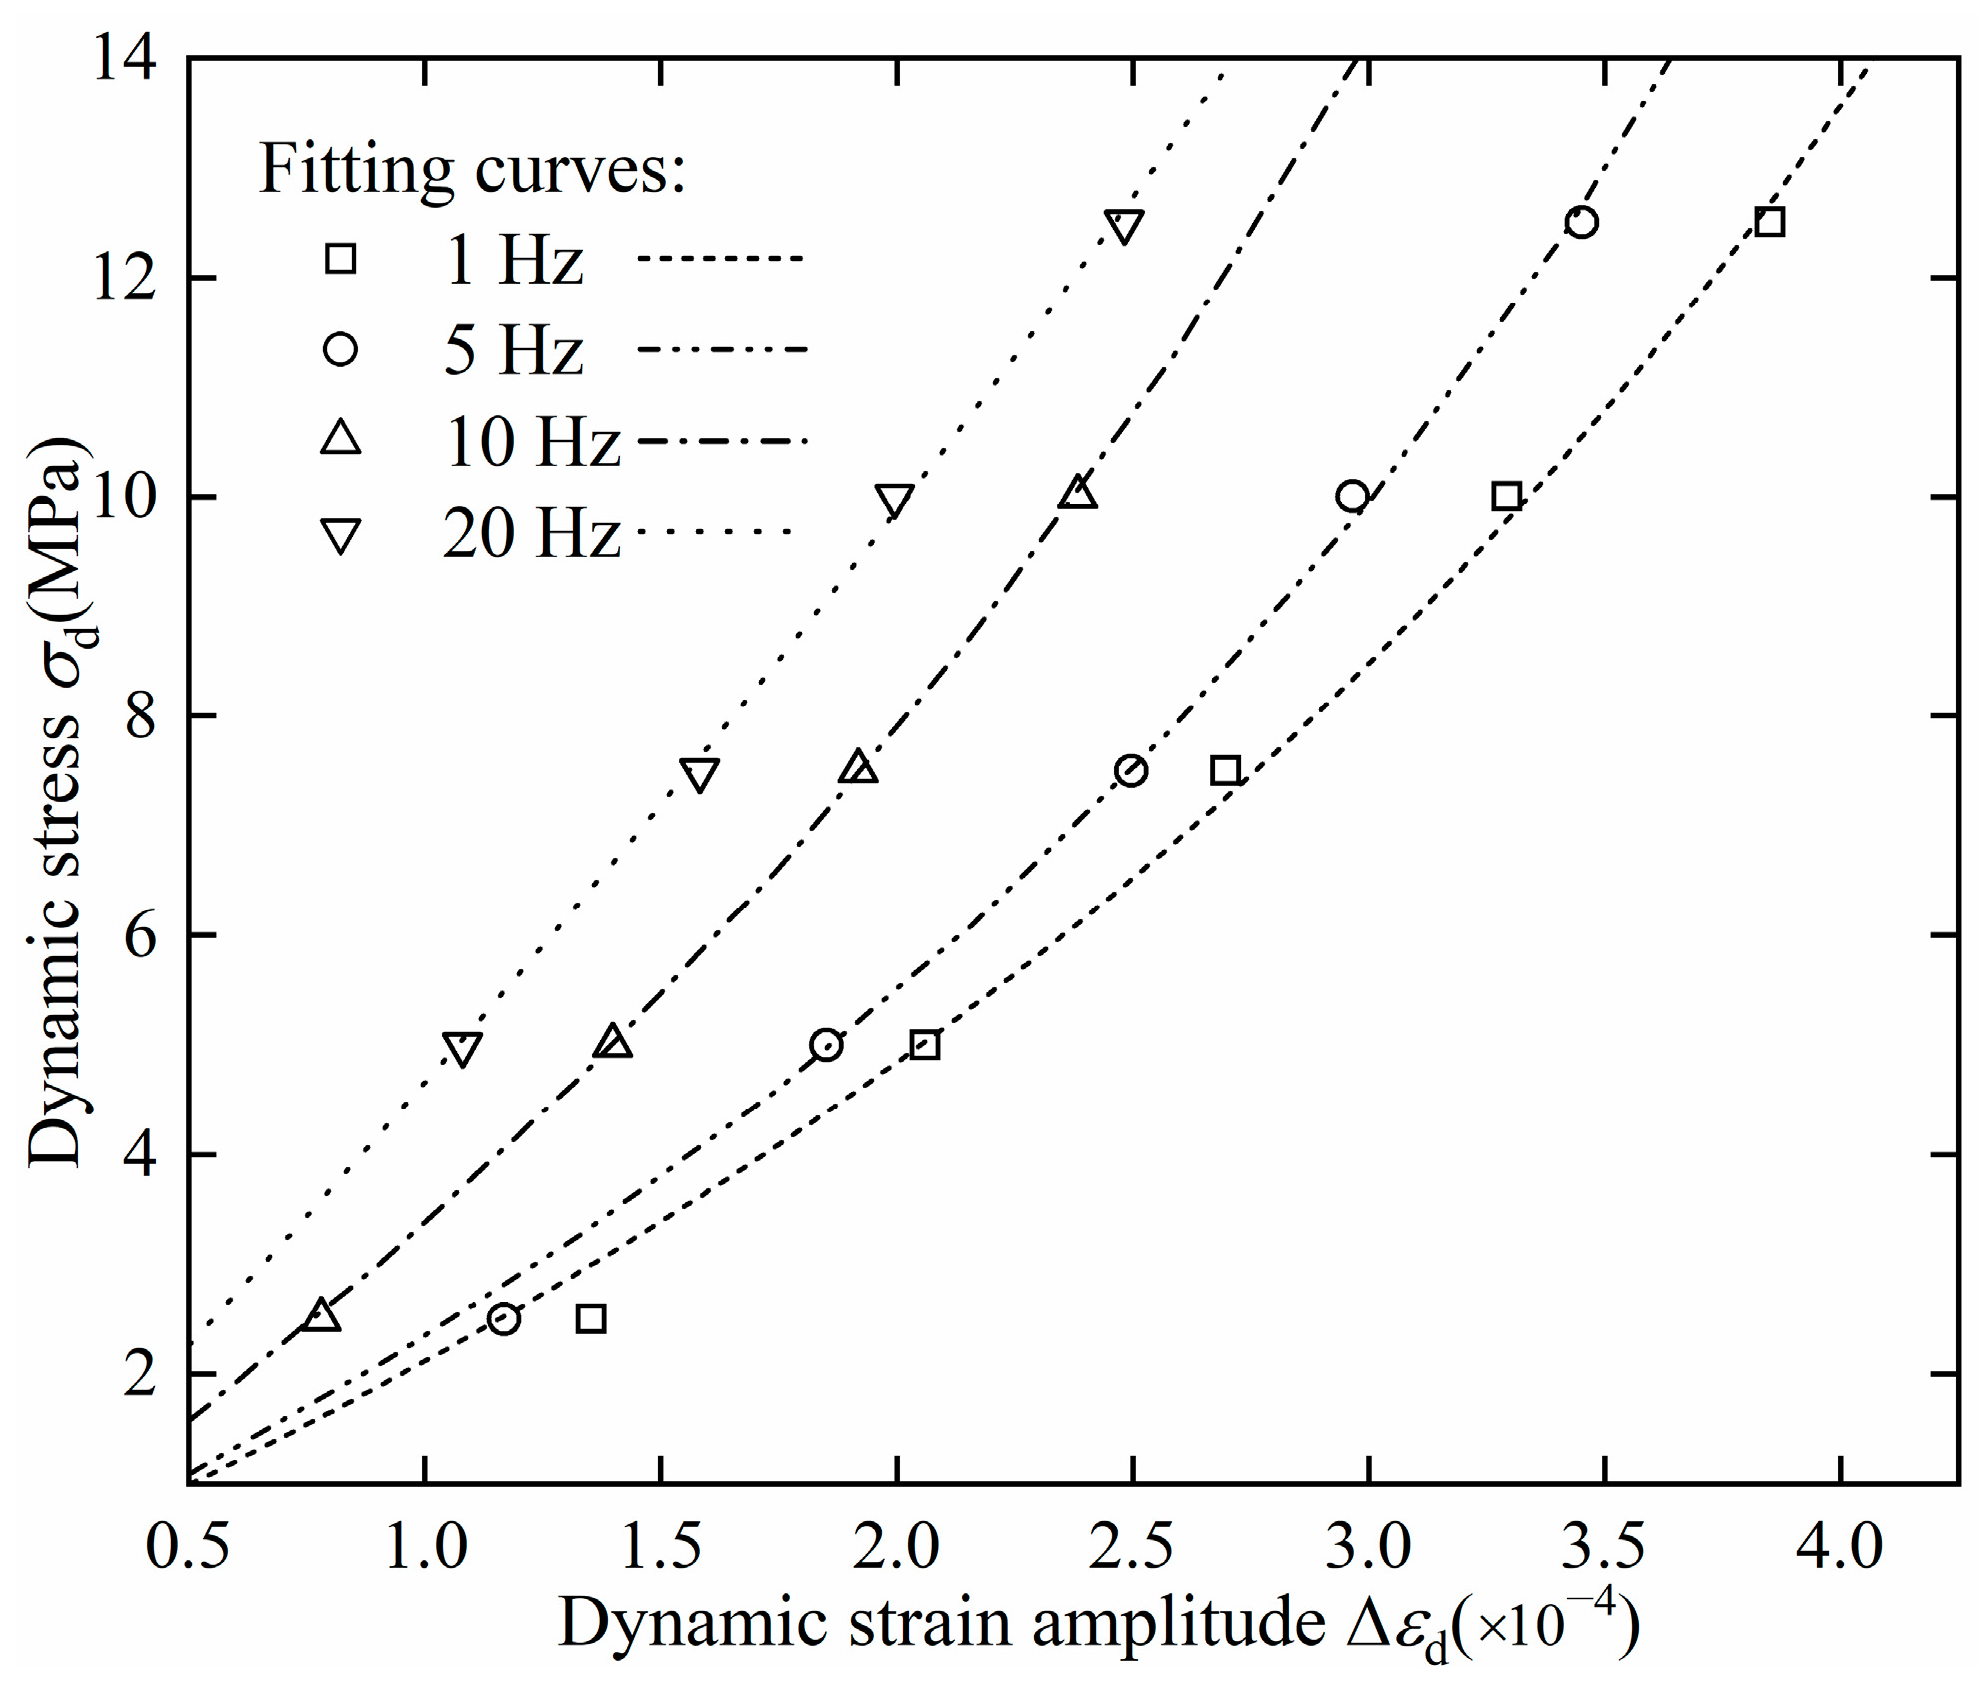
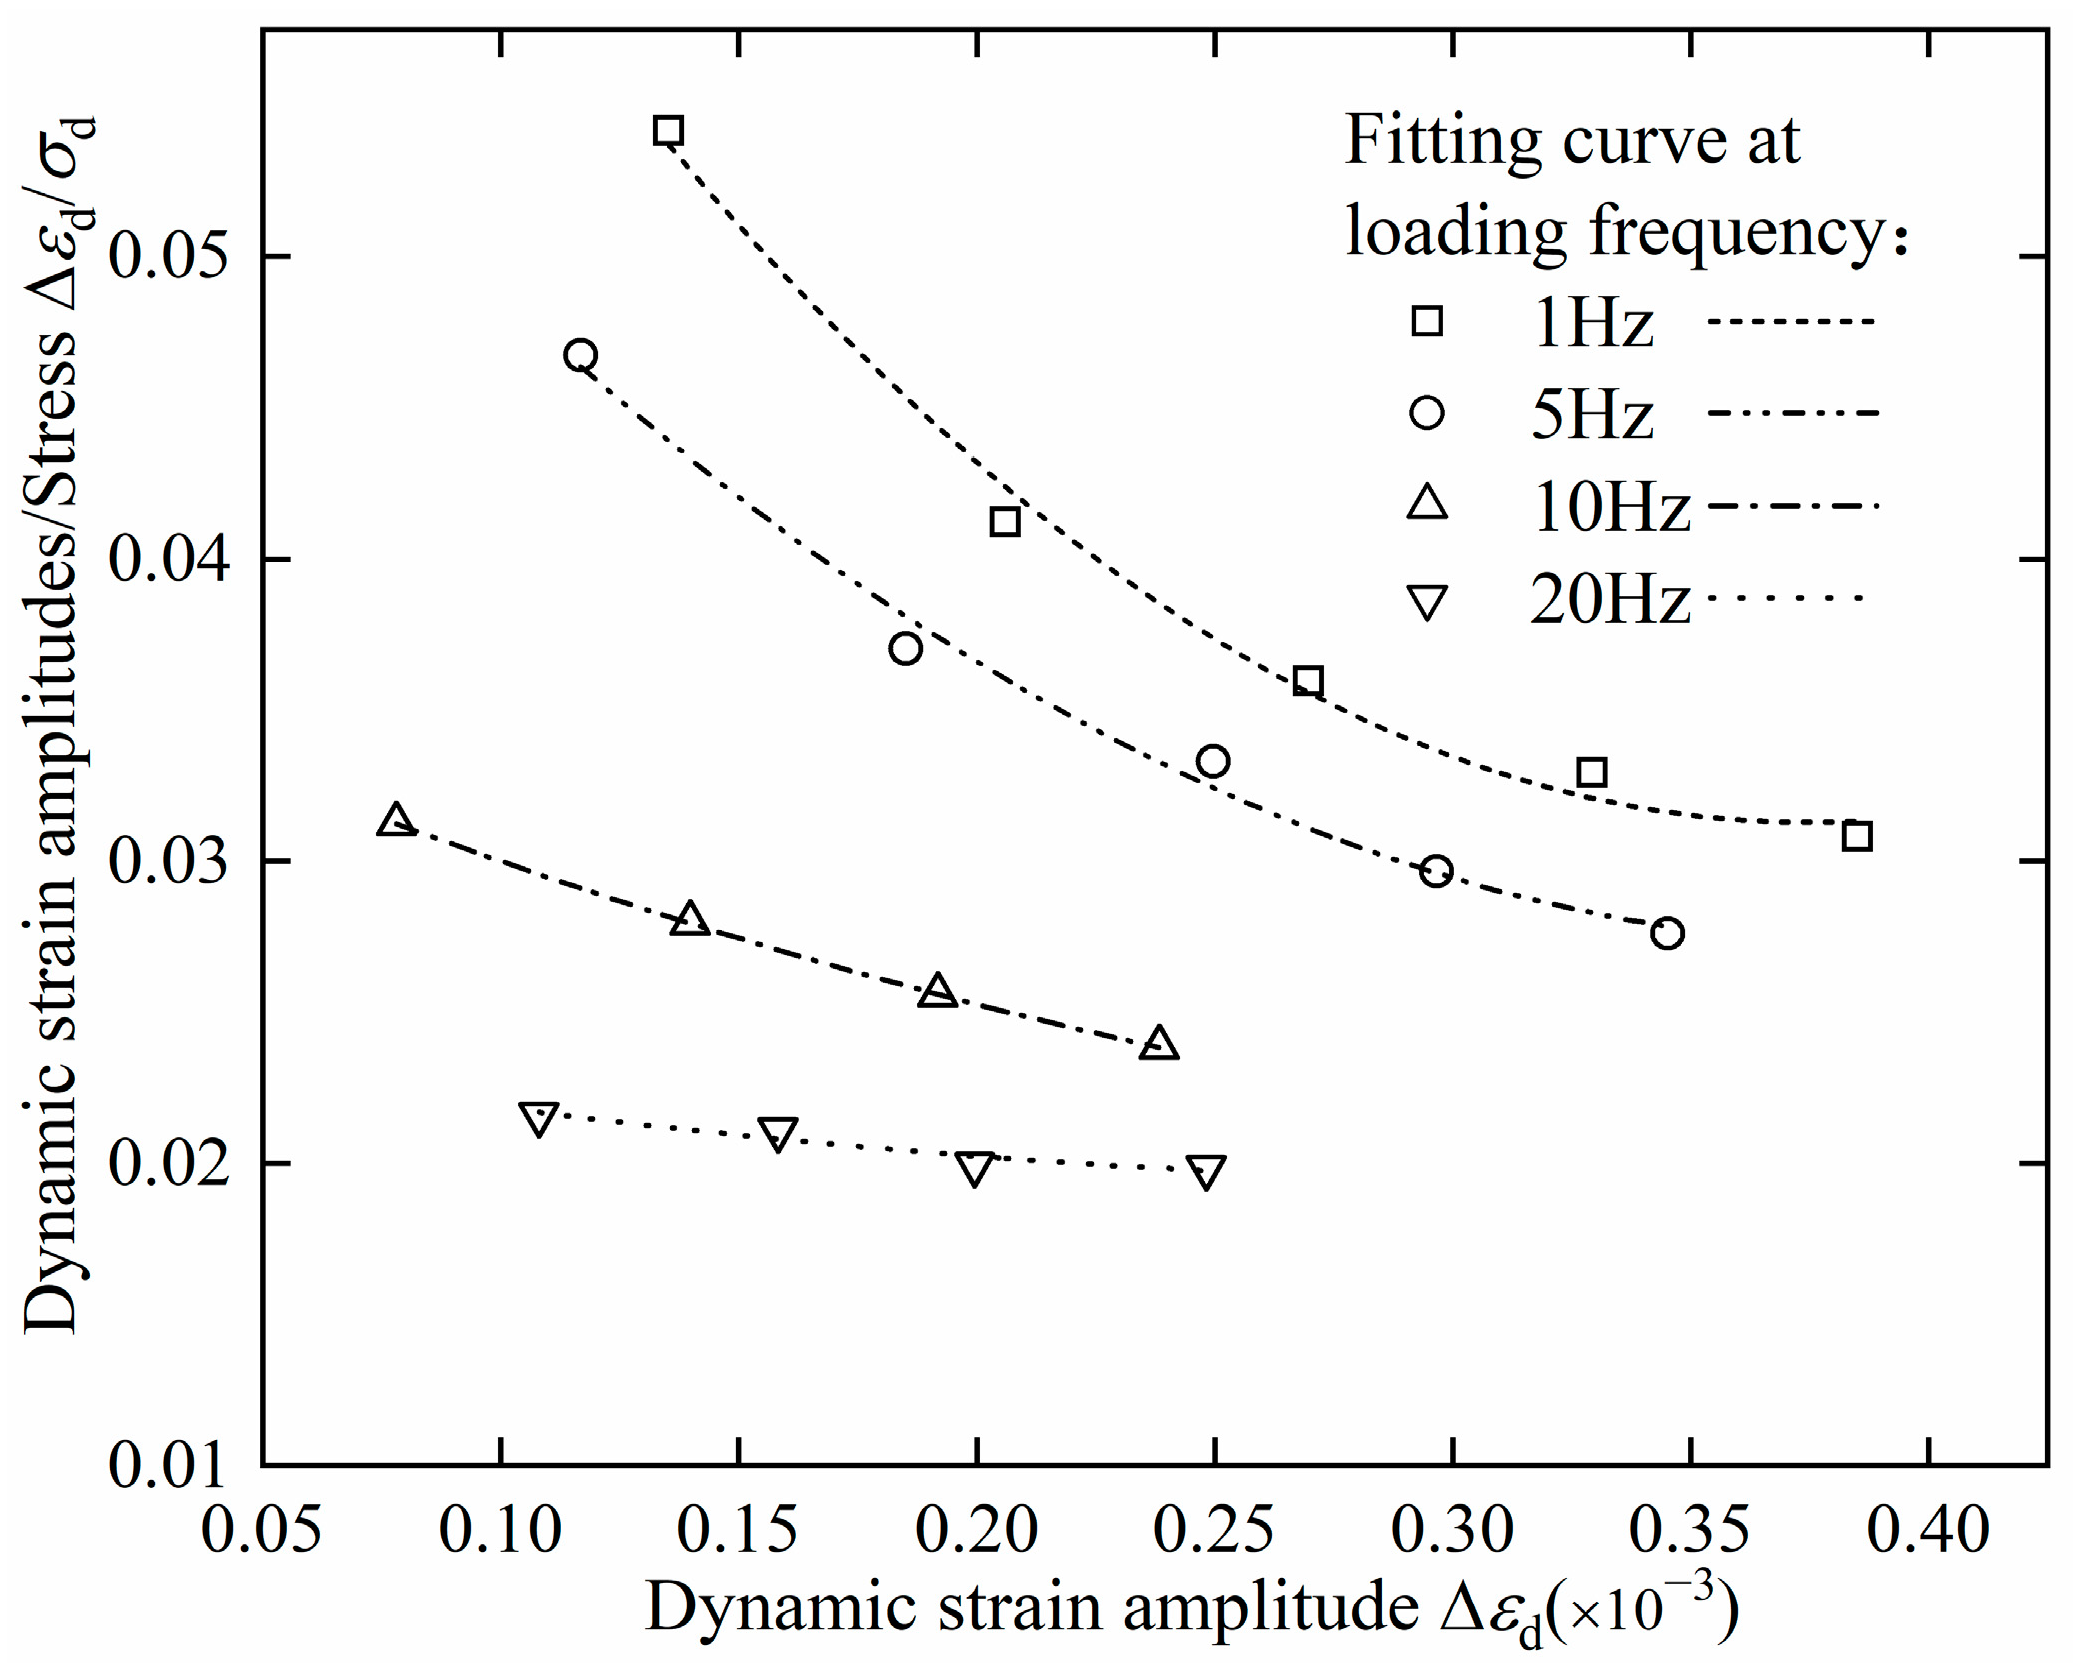
5.3. Influence of Loading Frequency
6. Conclusions
- The dynamic response of granite was examined under various factors, including loading frequency (1–20 Hz), confining pressure (5–30 MPa), dynamic stress amplitude (5–27.5 MPa), and the number of cycles (0–50 times).
- The dynamic elastic modulus of granite increased by approximately 6%, 13%, and 20% as the dynamic stress amplitude went from 5 MPa to 10 MPa, 20 MPa, and 30 MPa, respectively. This behavior can be attributed to the closure of microdefects and reduced energy consumption. On the contrary, the dynamic damping ratio exhibited a decline due to diminished energy consumption resulting from friction and viscous resistance.
- Granite’s dynamic elastic modulus and dynamic damping ratio displayed an upward trend with loading frequency. The dynamic elastic modulus increased by approximately 7% (from 1 Hz to 5 Hz), 28% (from 1 Hz to 10 Hz), and 80% (from 1 Hz to 20 Hz). Enhanced dynamic stress amplitude led to an increased dynamic elastic modulus and a decreased dynamic damping ratio. These outcomes are associated with microcrack closure, increased intergranular viscosity, and heightened energy consumption.
- Increasing dynamic stress amplitude resulted in a higher dynamic elastic modulus and a lower dynamic damping ratio. This is attributed to particle compression, leading to tighter contacts and decreased energy consumption from friction and viscous resistance.
- The dynamic elastic modulus and dynamic damping ratio of granite decreased before stabilizing with an increase in the number of cycles. The initial loading stage induced significant deformation and energy consumption, followed by gradual stabilization as equilibrium was reached.
- The modified Duncan–Chang model established a dynamic stress–strain relationship for granite and demonstrated good alignment with experimental data. It is noteworthy that high frequency had a more significant impact on material behavior compared with confining pressure. These experimental data and the constructed model will be further integrated into Part II of our research, enabling a comprehensive investigation and a deeper understanding of the proposed study.
Author Contributions
Funding
Institutional Review Board Statement
Informed Consent Statement
Data Availability Statement
Conflicts of Interest
References
- Mizuno, A. Report on the collapse accident of the ceiling boards for transverse ventilation at the Sasago Tunnel. In Proceedings of the 17th International Symposium on Aerodynamics, Ventilation and Fire in Tunnels 2017, ISAVFT 2017, Lyon, France, 13–15 September 2017; pp. 621–630. [Google Scholar]
- Crampin, S.; Peacock, S. A review of the current understanding of seismic shear-wave splitting in the Earth’s crust and common fallacies in interpretation. Wave Motion 2008, 45, 675–722. [Google Scholar] [CrossRef]
- Bai, Q.; Konietzky, H. An innovative method to simulate stress-induced velocity changes in anisotropic rocks. Geotech. Lett. 2021, 11, 299–305. [Google Scholar] [CrossRef]
- Tian, J.; Wang, E. Ultrasonic method for measuring in-situ stress based on acoustoelasticity theory. Yanshilixue Yu Gongcheng Xuebao/Chin. J. Rock Mech. Eng. 2006, 25, 3719–3724. [Google Scholar]
- Kang, F.; Jia, T.; Li, Y.; Deng, J.; Tang, C.a.; Huang, X. Experimental study on the physical and mechanical variations of hot granite under different cooling treatments. Renew. Energy 2021, 179, 1316–1328. [Google Scholar] [CrossRef]
- Yang, S.Q.; Li, Y.; Ma, G.W.; Sun, B.W.; Yang, J.; Xu, J.; Dai, Y.H. Experiment and numerical simulation study of dynamic mechanical behavior of granite specimen after high temperature treatment. Comput. Geotech. 2023, 154, 105111. [Google Scholar] [CrossRef]
- Liu, X.; Zheng, Y.; Hao, Q.; Zhao, R.; Xue, Y.; Zhang, Z. Dynamic failure features and brittleness evaluation of coal under different confining pressure. Geomech. Eng. 2022, 30, 401–411. [Google Scholar] [CrossRef]
- Chongyang, W.; Sijiang, W.; Yisha, P.; Sheng, Z. Experimental Study on Fatigue Life of Gypsum-Like Rock Under Uniaxial Compression with Different Loading Frequencies. Pure Appl. Geophys. 2022, 179, 1225–1239. [Google Scholar] [CrossRef]
- Zheng, Q.; Liu, E.; Sun, P.; Liu, M.; Yu, D. Dynamic and damage properties of artificial jointed rock samples subjected to cyclic triaxial loading at various frequencies. Int. J. Rock Mech. Min. Sci. 2020, 128, 104243. [Google Scholar] [CrossRef]
- Chen, Z.; Ma, C.; Li, T.; He, C. Experimental investigation of the failure mechanism of deep granite under high seepage water pressure and strong unloading effect. Acta Geotech. 2022, 17, 5009–5030. [Google Scholar] [CrossRef]
- Deng, L.; Wu, Y.; Ji, Y.; Huang, Z.; Zou, C. Physical and mechanical properties of granite after high-temperature and acidic treatment for the enhanced geothermal system. Bull. Eng. Geol. Environ. 2022, 81, 407. [Google Scholar] [CrossRef]
- Chen, Y.-L.; Wang, S.-R.; Ni, J.; Azzam, R.; Fernández-steeger, T.M. An experimental study of the mechanical properties of granite after high temperature exposure based on mineral characteristics. Eng. Geol. 2017, 220, 234–242. [Google Scholar] [CrossRef]
- Liu, L.; Wang, Y.; An, H. Fractal Characteristics and Energy Dissipation of Granite After High-Temperature Treatment Based on SHPB Experiment. Front. Earth Sci. 2022, 10, 861847. [Google Scholar] [CrossRef]
- Gao, C.; Zhou, Z.; Li, L.; Li, Z.; Zhang, D.; Cheng, S. Strength reduction model for jointed rock masses and peridynamics simulation of uniaxial compression testing. Geomech. Geophys. Geo-Energy Geo-Resour. 2021, 7, 34. [Google Scholar] [CrossRef]
- As’habi, F.; Lakirouhani, A. Numerical modeling of jointed rock samples under unconfined and confined conditions to study peak strength and failure mode. Arab. J. Geosci. 2021, 14, 174. [Google Scholar] [CrossRef]
- Ma, Z.; Yan, P.; Cheng, S.; Gong, P.; Qi, F.; Wang, J. Experimental study of the dynamic mechanical responses and failure characteristics of coal under true triaxial confinements. Int. J. Min. Sci. Technol. 2023, 33, 761–772. [Google Scholar] [CrossRef]
- Yang, B.; He, M.; Zhang, Z.; Zhu, J.; Chen, Y. Experimental investigation and empirical model on damping properties of rock under multistage cyclic loading. Soil Dyn. Earthq. Eng. 2022, 163, 107557. [Google Scholar] [CrossRef]
- Ma, C.; Zhu, C.; Zhou, J.; Ren, J.; Yu, Q. Dynamic response and failure characteristics of combined rocks under confining pressure. Sci. Rep. 2022, 12, 12187. [Google Scholar] [CrossRef]
- Yan, Z.Q.; Li, Z.; Tan, Y.Z.; Ma, L.J.; Yu, L.Y.; Li, H.Y. Coupling Effects of Strain Rate and Low Temperature on the Dynamic Mechanical Properties of Frozen Water-Saturated Sandstone. Water 2022, 14, 3513. [Google Scholar] [CrossRef]
- Suo, Y.; Su, X.; Wang, Z.; He, W.; Fu, X.; Feng, F.; Pan, Z.; Xie, K.; Wang, G. A study of inter-stratum propagation of hydraulic fracture of sandstone-shale interbedded shale oil. Eng. Fract. Mech. 2022, 275, 108858. [Google Scholar] [CrossRef]
- Su, H.; Jiang, Y.; Yu, L.; Wang, W.; Guo, Q. Dynamic fracture and deformation responses of rock mass specimens containing 3D printing rough joint subjected to impact loading. Geomech. Geophys. Geo-Energy Geo-Resour. 2022, 8, 186. [Google Scholar] [CrossRef]
- Ni, X.H. Failure characteristic of granite under cyclic loading with different frequencies. Appl. Mech. Mater. 2014, 638–640, 1967–1970. [Google Scholar] [CrossRef]
- Fu, B.; Zhang, D.; Ye, C. Experimental Study on Mechanical Properties of Sandstone Under Sinusoidal Dynamic Load. Geotech. Geol. Eng. 2022, 40, 2397–2408. [Google Scholar] [CrossRef]
- Luo, Y.; Gong, H.; Wei, X.; Zheng, S.; Pei, C.; Li, X. Dynamic compressive characteristics and damage constitutive model of coral reef limestone with different cementation degrees. Constr. Build. Mater. 2023, 362, 129783. [Google Scholar] [CrossRef]
- Mishra, S.; Khetwal, A.; Chakraborty, T.; Basu, D. Effect of loading characteristics and specimen size in split Hopkinson pressure bar test on high-rate behavior of phyllite. Arch. Civ. Mech. Eng. 2022, 22, 212. [Google Scholar] [CrossRef]
- Han, Z.; Xie, S.; Li, D.; Zhu, Q.; Yan, Z. Dynamic mechanical behavior of rocks containing double elliptical inclusions at various inclination angles. Theor. Appl. Fract. Mech. 2022, 121, 103544. [Google Scholar] [CrossRef]
- Liu, Y.; Dai, F.; Dong, L.; Xu, N.; Feng, P. Experimental Investigation on the Fatigue Mechanical Properties of Intermittently Jointed Rock Models Under Cyclic Uniaxial Compression with Different Loading Parameters. Rock Mech. Rock Eng. 2017, 51, 47–68. [Google Scholar] [CrossRef]
- Manogharan, P.; Wood, C.; Marone, C.; Elsworth, D.; Rivière, J.; Shokouhi, P. Experimental Investigation of Elastodynamic Nonlinear Response of Dry Intact, Fractured and Saturated Rock. Rock Mech. Rock Eng. 2021, 55, 2665–2678. [Google Scholar] [CrossRef]
- He, M.M.; Zhang, Z.Q.; Li, N. Experimental investigation and empirical model to determine the damping and shear stiffness properties of soft rock under multistage cyclic loading. Soil Dyn. Earthq. Eng. 2021, 147, 106818. [Google Scholar] [CrossRef]
- Mishra, S.; Chakraborty, T.; Matsagar, V.; Loukus, J.; Bekkala, B. High Strain-Rate Characterization of Deccan Trap Rocks Using SHPB Device. J. Mater. Civ. Eng. 2018, 30, 04018059. [Google Scholar] [CrossRef]
- Guo, H.; Guo, W.; Zhai, Y.; Su, Y. Experimental and modeling investigation on the dynamic response of granite after high-temperature treatment under different pressures. Constr. Build. Mater. 2017, 155, 427–440. [Google Scholar] [CrossRef]
- Wang, X.; Liu, Z.; Gao, X.; Li, P.; Dong, B. Dynamic characteristics and energy evolution of granite subjected to coupled static–cyclic impact loading. Geomech. Geophys. Geo-Energy Geo-Resour. 2023, 9, 62. [Google Scholar] [CrossRef]
- Wang, H.; He, M.; Zhu, J.; Guo, S.; Chen, Y.; Li, N. Experimental investigation of linear damping characteristics on granite and red sandstone under dynamic cyclic loading. Eur. J. Environ. Civ. Eng. 2022, 26, 5259–5278. [Google Scholar] [CrossRef]
- Li, P.; Cai, M.; Gao, Y.; Guo, Q.; Miao, S.; Ren, F.; Wang, Y. Mechanical responses and fracturing behavior of jointed rock masses with a cavity under different dynamic loads. Int. J. Impact Eng. 2023, 178, 104608. [Google Scholar] [CrossRef]
- Chen, D.; Tang, J.; Yang, X. Effects of Drying–Wetting Cycle and Fines Content on Hysteresis and Dynamic Properties of Granite Residual Soil under Cyclic Loading. Appl. Sci. 2023, 13, 6660. [Google Scholar]
- Xia, W.; Xue, J.; Zhang, Y.; Jin, J.; Zhao, Z.; Cai, R. Dynamic Characteristics of Thermal Damage Granite Under Cyclic Impact Loading. Geotech. Geol. Eng. 2023, 41, 2313–2323. [Google Scholar] [CrossRef]
- Sun, B.; Yang, P.; Liu, S.; Zeng, S. Impact dynamic characteristics and constitutive model of granite damaged by cyclic loading. J. Mater. Res. Technol. 2023, 24, 333–345. [Google Scholar] [CrossRef]
- Zhang, H.; Huang, L.; Li, X.; Hu, X.; Wu, Y. Study on the Evolution of Physical Parameters and Dynamic Compression Mechanical Properties of Granite after Different Heating and Cooling Cycles. Materials 2023, 16, 2300. [Google Scholar] [CrossRef]
- Xi, Y.; Wang, H.; Zha, C.; Li, J.; Guo, B. Experimental study of the influence of temperature and cooling method on dynamic mechanical properties and damage of granite. Energy Sci. Eng. 2022, 10, 3779–3797. [Google Scholar] [CrossRef]
- Li, G.; Liu, S.; Lu, R.; Ma, F.; Guo, J. Experimental Study on Mechanical Properties and Failure Laws of Granite with Artificial Flaws under Coupled Static and Dynamic Loads. Materials 2022, 15, 6105. [Google Scholar] [CrossRef]
- Tian, N.; Wang, Z.; Xiong, F.; Liu, Z. Influence of axial pressure on dynamic mechanical properties of granite under cyclic impact loading. Harbin Gongye Daxue Xuebao/J. Harbin Inst. Technol. 2021, 53, 156–164. [Google Scholar] [CrossRef]
- Xiao, P.; Li, D.-y.; Zhao, G.-y.; Zhu, Q.-q.; Liu, H.-x.; Zhang, C.-s. Mechanical properties and failure behavior of rock with different flaw inclinations under coupled static and dynamic loads. J. Cent. South Univ. 2020, 27, 2945–2958. [Google Scholar] [CrossRef]
- Li, D.; Hu, C.; Zhu, Q. Experimental study on mechanical properties and failure laws of granite with an artificial flaw under coupled static and dynamic loads. Yanshilixue Yu Gongcheng Xuebao/Chin. J. Rock Mech. Eng. 2020, 39, 6105. [Google Scholar] [CrossRef]
- Chen, Y.; Zuo, J.; Guo, B.; Guo, W. Effect of cyclic loading on mechanical and ultrasonic properties of granite from Maluanshan Tunnel. Bull. Eng. Geol. Environ. 2020, 79, 299–311. [Google Scholar] [CrossRef]
- Liang, S.; Ling, T.; Liu, D.; Li, S. On Dynamic Constitutive Model of Granite Under Impact Loading: Effect of Damage on Dynamic Strength. IOP Conf. Ser. Earth Environ. Sci. 2019, 283, 012019. [Google Scholar] [CrossRef]
- Zhao, Z.; Wu, B.; Zhang, Z.; Yu, W. Impact strength characteristics of granite under combined dynamic and static loading conditions. Arab. J. Geosci. 2021, 14, 105. [Google Scholar] [CrossRef]
- Bie, P.F.; Liu, H.X. Influence of stress amplitude on the dynamic characteristics of phyllite samples under triaxial multi-stage cyclic loading. IOP Conf. Ser. Earth Environ. Sci. 2020, 570, 032043. [Google Scholar] [CrossRef]
- BJ, B.; FD, S. Frequency dependence of elasticity of rock—Test of seismic velocity. Nature 1977, 268, 220–222. [Google Scholar]
- Yang, S.-Q.; Tang, J.-Z.; Wang, S.-S.; Yang, D.-S.; Zheng, W.-T. An Experimental and Modeling Investigation on Creep Mechanical Behavior of Granite Under Triaxial Cyclic Loading and Unloading. Rock Mech. Rock Eng. 2022, 55, 5577–5597. [Google Scholar] [CrossRef]
- Qian, L.; Yao, T.; Mo, Z.; Gao, Y.; Zhang, J.; Li, Y.; Zhang, R.; Li, Z. Experimental study on crack evolution behavior and constitutive model of granite based on the deviatoric stress to peak strength ratio. Bull. Eng. Geol. Environ. 2022, 81, 278. [Google Scholar] [CrossRef]
- Meng, Q.B.; Liu, J.F.; Huang, B.X.; Pu, H.; Wu, J.Y.; Zhang, Z.Z. Effects of Confining Pressure and Temperature on the Energy Evolution of Rocks Under Triaxial Cyclic Loading and Unloading Conditions. Rock Mech. Rock Eng. 2022, 55, 773–798. [Google Scholar] [CrossRef]
- Tutuncu, A.N.; Podio, A.L.; Sharma, M.M. Nonlinear viscoelastic behavior of sedimentary rocks, Part II: Hysteresis effects and influence of type of fluid on elastic moduli. Geophysics 1998, 63, 195–203. [Google Scholar] [CrossRef]
- David, E.C.; Brantut, N.; Schubnel, A.; Zimmerman, R.W. Sliding crack model for nonlinearity and hysteresis in the uniaxial stress–strain curve of rock. Int. J. Rock Mech. Min. Sci. 2012, 52, 9–17. [Google Scholar] [CrossRef]
- Zhu, Z.D.; Ni, X.; Hu, Z.; Huang, Q.; Li, X. Mesoscopic damage quantification research of the deformation and failure of granite under circulatory load with different frequencies. Eur. J. Environ. Civ. Eng. 2013, 17, s321–s333. [Google Scholar] [CrossRef]
- Zhu, Z.D.; Sun, L.Z.; Wang, M.Y. Damping ratio experiment and mesomechanical analysis of deformation failure mechanism on rock under different frequency cyclic loadings. Yantu Lixue/Rock Soil Mech. 2010, 31, 8–12. [Google Scholar]
- Ma, L.J.; Liu, X.Y.; Wang, M.Y.; Xu, H.F.; Hua, R.P.; Fan, P.X.; Jiang, S.R.; Wang, G.A.; Yi, Q.K. Experimental investigation of the mechanical properties of rock salt under triaxial cyclic loading. Int. J. Rock Mech. Min. Sci. 2013, 62, 34–41. [Google Scholar] [CrossRef]
- Liu, J.; Qiao, L.; Li, P. Experimental studies and constitutive model of elastoplastic mechanical behaviors of sandstone with hydro-physicochemical influencing effects. Yanshilixue Yu Gongcheng Xuebao/Chin. J. Rock Mech. Eng. 2009, 28, 20–29. [Google Scholar] [CrossRef]
- Fan, J.; Jiang, D.; Liu, W.; Wu, F.; Chen, J.; Daemen, J. Discontinuous fatigue of salt rock with low-stress intervals. Int. J. Rock Mech. Min. Sci. 2019, 115, 77–86. [Google Scholar] [CrossRef]
- Duncan, J.M.; Chang, C.Y.; Division, F. Nonlinear Analysis of Stress and Strain in Soils. J. Soil Mech. Found. Div. 1970, 96, 1629–1653. [Google Scholar] [CrossRef]
- Jia, P.; Khoshghalb, A.; Chen, C.; Zhao, W.; Dong, M.; Alipour Esgandani, G. Modified Duncan-Chang Constitutive Model for Modeling Supported Excavations in Granular Soils. Int. J. Geomech. 2020, 20, 04020211. [Google Scholar] [CrossRef]
- Yang, S.Q.; Yang, J.; Xu, P. Analysis on pre-peak deformation and energy dissipation characteristics of sandstone under triaxial cyclic loading. Geomech. Geophys. Geo-Energy Geo-Resour. 2020, 6, 24. [Google Scholar] [CrossRef]


| References | Rock Type | Loading Method | Variables | Parameters |
|---|---|---|---|---|
| Ma et al. [16] | Coal | Split Hopkinson pressure bar (SHPB) loading | Confining pressures (0–20 MPa) | Failure mode |
| Yang et al. [17] | Granite and red sandstone | Cyclic triaxial compression test | Confining pressures (5–25 MPa) | Dynamic shear modulus and damping ratio |
| Ma et al. [18] | Coal–rock | Dynamic impact test | Striking velocity (~6 m/s), confining pressures (0–15 MPa) | Dynamic compressive strength, elastic modulus |
| Yan et al. [19] | Sandstone | Split Hopkinson pressure bar (SHPB) loading | Temperature (−20–−1 °C) | Strength change laws and failure patterns |
| Su et al. [21] | Rock-like materials | Split Hopkinson pressure bar (SHPB) loading | Impact pressure (0.3–0.7 MPa), joint roughness coefficient (0–8.38) | Dynamic elastic modulus, mean dynamic compressive strength, average peak strain |
| Ni et al. [22] | Granite | Cyclic loading test | Stress amplitude (10 MPa), frequency (0.01–1 Hz) | Dynamic elastic modulus, damping ratio |
| Fu et al. [23] | Sandstone | Cyclic loading test | Frequency (0.2–0.8 Hz), cyclic amplitudes, number of cycles | Elastic modulus |
| Mishra et al. [25] | Phyllite rock | Split Hopkinson pressure bar (SHPB) loading | Slenderness ratios, diameters, gas gun pressures, different striker bar lengths | Peak stress, dynamic modulus |
| Liu et al. [27] | Synthetic rock-like materials | Cyclic loading test | Frequency (1–20 Hz), maximum stress levels (0.8–0.95), amplitude levels (0.4–0.7) | Fatigue deformation characteristics, fatigue energy, and damage evolution |
| He et al. [29] | Sandstone | Cyclic loading test | Confining pressures (0.5–1 MPa), stress amplitude (0.1–0.9 MPa), moisture content (15.15–19.85%) | Damping parameters, dynamic shear modulus |
| Mishra et al. [30] | Granite | Split Hopkinson pressure bar (SHPB) loading | Strain rates (41.31–475.59/s) | Dynamic elastic modulus |
| Guo et al. [31] | Granite | Split Hopkinson pressure bar (SHPB) loading | Pre-heating temperature (25–800 °C) | Peak stress, peak strain and elastic modulus |
| Wang et al. [32] | Granite | Cyclic loading test | Confining pressures (2–6 MPa) | Dynamic elastic modulus |
| Wang et al. [33] | Granite and sandstone | Cyclic loading test | Stress level (5–25 MPa), strain amplitude (0–0.07%), frequency (0.2–0.8 Hz) | Damping ratio, damping coefficient |
| Li et al. [34] | Granite | Split Hopkinson pressure bar (SHPB) loading | Impact pressures (0.7–0.9 MPa), joint angle (0–90°) | Dynamic compressive strength, elastic modulus, transmitted energy ratio, absorbed energy ratio, reflected energy ratio |
| Chen et al. [35] | Granite residual soil | Dynamic triaxial tests | Fines content (0–83.19%), drying and wetting cycles number (1–10,000) | Dynamic shear modulus, damping ratio |
| Xia et al. [36] | Granite | Split Hopkinson pressure bar (SHPB) loading | Temperature (100–800 °C), axial static pressure (10–40 MPa) | Mechanical strength, elastic modulus, peak stress |
| Sun et al. [37] | Granite | Split Hopkinson pressure bar (SHPB) loading | Stress amplitude (48–108 MPa), cyclic upper limit stress (0.5–0.9) | Dynamic compressive strength, peak strain, transmitted energy, reflection energy |
| Zhang et al. [38] | Granite | Split Hopkinson pressure bar (SHPB) loading | Temperature (200–600 °C), the number of cycles (1–20 times) | Dynamic compressive strength, elastic modulus |
| Yan et al. [39] | Granite | Split Hopkinson pressure bar (SHPB) loading | Temperature (25–800 °C) | Dynamic peak stress, elastic modulus, peak strain |
| Li et al. [40] | Granite | Split Hopkinson pressure bar (SHPB) loading | Uniaxial compressive strength (0–60%), inclination angles (0–90°) | Dynamic strength |
| Tian et al. [41] | Granite | Split Hopkinson pressure bar (SHPB) loading | Axial pressures (0–120 MPa) | Peak stress, elastic modulus, strain rate, peak strain |
| Xiao et al. [42] | Granite | Split Hopkinson pressure bar (SHPB) loading | Flaw angles (0–90°), static loads (18.4–128.7 MPa) | Peak strain, dynamic strength |
| Li et al. [43] | Granite | Split Hopkinson pressure bar (SHPB) loading | Axial stress (0-70 MPa) | Dynamic strength, dynamic elastic modulus, dynamic strain |
| Chen et al. [44] | Granite | Compression tests | Confining pressure (0–5 MPa) | Elastic strains, Young’s modulus |
| Liang et al. [45] | Granite | Split Hopkinson pressure bar (SHPB) loading | Strain rates (19.1–190.5/s) | Ultimate strength, elastic modulus |
| Zhao et al. [46] | Granite | Split Hopkinson pressure bar (SHPB) loading | Confining pressure (0.25–0.4 MPa) | Anti-impact strength |
| Current research | Granite | Dynamic triaxial tests | Confining pressure (5–30 MPa), loading frequency (1–20 Hz), dynamic stress amplitude (5–27.5 MPa), number of cycles (50 times and more) | Dynamic elastic modulus, dynamic damping ratio |
| Name | Confining Pressure σc (MPa) | Frequency f (Hz) | Stress Amplitude Δσd (MPa) | Number of Cycles |
|---|---|---|---|---|
| Y5-5 | 5 | 5 | 5/10/15/20/25/27.5 | 50 |
| Y5-10 | 10 | |||
| Y5-20 | 20 | |||
| Y5-30 | 30 | |||
| Y1-20 | 20 | 1 | ||
| Y10-20 | 10 | |||
| Y20-20 | 20 |
| Name | Confining Pressure σc (MPa) | Fitting Formula | Fitting (R2) |
|---|---|---|---|
| Granite specimens | 5 | 0.99 | |
| 10 | 0.99 | ||
| 20 | 0.99 | ||
| 30 | 0.99 |
| Name | Parameter and Confining Pressure Relationship Formula |
|---|---|
| Granite specimens | |
| Name | Loading Frequency f (Hz) | Fitting Formula | Fitting (R2) |
|---|---|---|---|
| Granite specimens | 1 | 0.98 | |
| 5 | 0.98 | ||
| 10 | 0.99 | ||
| 20 | 0.75 |
| Name | Parameter and Loading Frequency Relationship Formula |
|---|---|
| Granite specimens | |
Disclaimer/Publisher’s Note: The statements, opinions and data contained in all publications are solely those of the individual author(s) and contributor(s) and not of MDPI and/or the editor(s). MDPI and/or the editor(s) disclaim responsibility for any injury to people or property resulting from any ideas, methods, instructions or products referred to in the content. |
© 2023 by the authors. Licensee MDPI, Basel, Switzerland. This article is an open access article distributed under the terms and conditions of the Creative Commons Attribution (CC BY) license (https://creativecommons.org/licenses/by/4.0/).
Share and Cite
Ding, X.; Zhao, J.; Dong, Y.; Zhou, M. A Thorough Investigation of the Dynamic Properties of Granite under Cyclic Loading. Appl. Sci. 2023, 13, 12514. https://doi.org/10.3390/app132212514
Ding X, Zhao J, Dong Y, Zhou M. A Thorough Investigation of the Dynamic Properties of Granite under Cyclic Loading. Applied Sciences. 2023; 13(22):12514. https://doi.org/10.3390/app132212514
Chicago/Turabian StyleDing, Xiaobin, Junxing Zhao, Yaojun Dong, and Mi Zhou. 2023. "A Thorough Investigation of the Dynamic Properties of Granite under Cyclic Loading" Applied Sciences 13, no. 22: 12514. https://doi.org/10.3390/app132212514
APA StyleDing, X., Zhao, J., Dong, Y., & Zhou, M. (2023). A Thorough Investigation of the Dynamic Properties of Granite under Cyclic Loading. Applied Sciences, 13(22), 12514. https://doi.org/10.3390/app132212514