Article

A Study of the Characteristics of Micro-Seismic (ME) and Electromagnetic Radiation (EMR) Signals under the Static Load Conditions of Rocks

School of Resources, Environment and Safety Engineering, Hunan University of Science and Technology, Xiangtan 411201, China
*
Author to whom correspondence should be addressed.
Appl. Sci. 2023, 13(23), 12910; https://doi.org/10.3390/app132312910
Submission received: 31 October 2023 / Revised: 26 November 2023 / Accepted: 30 November 2023 / Published: 2 December 2023
(This article belongs to the Special Issue Advances and Challenges in Rock Mechanics and Rock Engineering)

Abstract

:
Geological hazards, such as the frequent occurrence of rock bursts in deep mining, emphasize the critical necessity for the early warning and prediction of dynamic fractures in coal and rock masses, as well as the destabilization of the surrounding rock. This study delves into the mechanisms of electromagnetic radiation (EMR) signals and their synchronous coupling with micro-seismic (ME) signals. EMR and ME signals from rock specimens were systematically collected during the uniaxial compression fracture process using a dedicated monitoring and acquisition system. Employing the wavelet analysis method, the original data underwent reconstruction and denoising, while the EMR and ME spectra, derived through fast Fourier transform, were subjected to detailed scrutiny. The comprehensive analysis unveiled that EMR signals arising from rock fractures exhibited precise timing synchronization with ME signals. Moreover, the dominant frequencies of both signals are closely aligned within the low-frequency band, indicating a remarkable degree of similarity and homology. These findings establish an experimental basis for the development of monitoring and early warning systems geared toward assessing damage to coal and rock masses using EMR and ME signals.

1. Introduction

Micro-seisms (MEs) and electromagnetic radiation (EMR) represent forms of energy released during the deformation and rupture of coal and rock masses under stress [1,2]. To delve into the destruction process and mechanism of coal and rock mass under static loads, researchers employ various technical means to monitor and analyze a series of physical parameters during the destruction process. Their objective is to pinpoint the most effective early warning methods, including acoustic emission/micro-seismic [3], EMR [4], and others. The EMR method, particularly suited for complex underground environments, offers more information about rock fractures and remains unaffected by fractures, making it a non-contact monitoring method. However, the mechanism of EMR remains incompletely understood, limiting the further development and widespread application of EMR technology in deformation monitoring [5].
The EMR mechanism in rock materials can be understood from multiple perspectives. Rock experiments suggest two perspectives on EMR mechanisms: rupture and non-rupture. These perspectives provide microscopic and specific explanations for seismic EMR [6]. Scholars have dedicated significant efforts to understanding the generation mechanism of EMR [7,8]. Mastrogianis et al. [9] experimentally verified the piezoelectric effect mechanism proposed by early scholars for rock materials. They posit that when rocks containing quartz and other piezoelectric materials fracture, polarization occurs within the material, creating positive and negative charges on its opposing surfaces. The generation mechanism of EMR is typically related to the movement of charged objects [10]. Therefore, irregular work or vibration of electric charges can be considered the basic condition for the EMR generated by rock fractures. Song et al. and Wang et al. [11] developed a new electromagnetic vector three-axis sensor, laying the foundation for EMR positioning and enabling the preliminary development of EMR monitoring technology from prediction to positioning. By analyzing the EMR signals of sandstone samples with different water contents under uniaxial compression, Li et al. [12] proposed that the inhomogeneity of EMR signals and the frequency mutations of the minimum and maximum signals should be regarded as precursors of rock failures. Scholars found that EMR and AE signals are synchronized in time series, and although they share low-frequency components, their average dominant frequencies differ significantly [13]. Feng et al. discussed crack propagation, AE, and EMR laws, as well as the response characteristics of coal with different diameters and strengths during the failure process. Ref. [14] concluded that the hole diameter significantly affects the axial load limit.
ME refers to the stress wave released when coal and rock mass lose stability under external loads. It is a form of energy release usually accompanied by crack vibrations [15]. Ai et al. [16] found good synchronicity in the time domain between the ME, EMR signals, and the generated crack area by conducting static load tests on coal briquettes with different particle sizes. Cao et al. [17] proposed a comprehensive prediction index based on the principle of dynamic and static load superposition to predict large energy events and affected areas. Crack vibration refers to the mechanical movement of cracks or fissures, similar to the EMR physical quantity generated during and after the local mechanical movement of an object [18]. However, due to the unknown and complex nature of the coal mining process, actual time series observations are often irregular and noisy, making it increasingly important to analyze and process complex data to obtain more accurate information [19].
Considering that predicting rock failure events aims to estimate the probability distribution and frequency distribution of future rock failure events based on real-time time series monitoring values, a common challenge in various coal mine safety tasks, such as mine safety production, risk management, and decision-making, Du et al. [20] proposed the Deep Nonlinear State Space Model (DNLSSM). This model effectively simulates the nonlinear correlation between the observed time series data and the underlying dynamic process, significantly improving prediction accuracy.
Additionally, during the rock fracture process, the rapid movement of charged particles in the rock generates electric current, which in turn produces electromagnetic fields and EMR signals. Similarly, the propagation of cracks and fissures induces stress waves that generate acoustic and electromagnetic waves. The propagation speed of EMR signals is much faster than ME signals, indicating the possibility of coupling between ME signals and EMR signals.
The novelty of this work lies in the early signaling technique that can be implemented before the collapse and plastic failure of rock masses in the field. This is achieved through rigorous experimentation using sophisticated laboratory instrumentation. This study enables the assessment of failure susceptibility at an early stage through ME and EMR signals, substantiating the practical significance of the research.

2. Objective and Research Motivation

Considerable research has been conducted on the stress–strain graphical correlation and ME and EMR signals during rock fracture. However, limited attention has been directed toward the generation mechanism and coupling process of EMR and ME monitoring. Therefore, leveraging the ME monitoring device and EMR monitoring equipment independently developed by the authors, this study delves into the correlation between ME and EMR signals in the generation mechanism of sandy dolomite under uniaxial compression. The findings offer an experimental foundation for the early warning of dynamic collapse in coal and rock masses.

3. Materials and Methodology

3.1. Preparation of Specimen
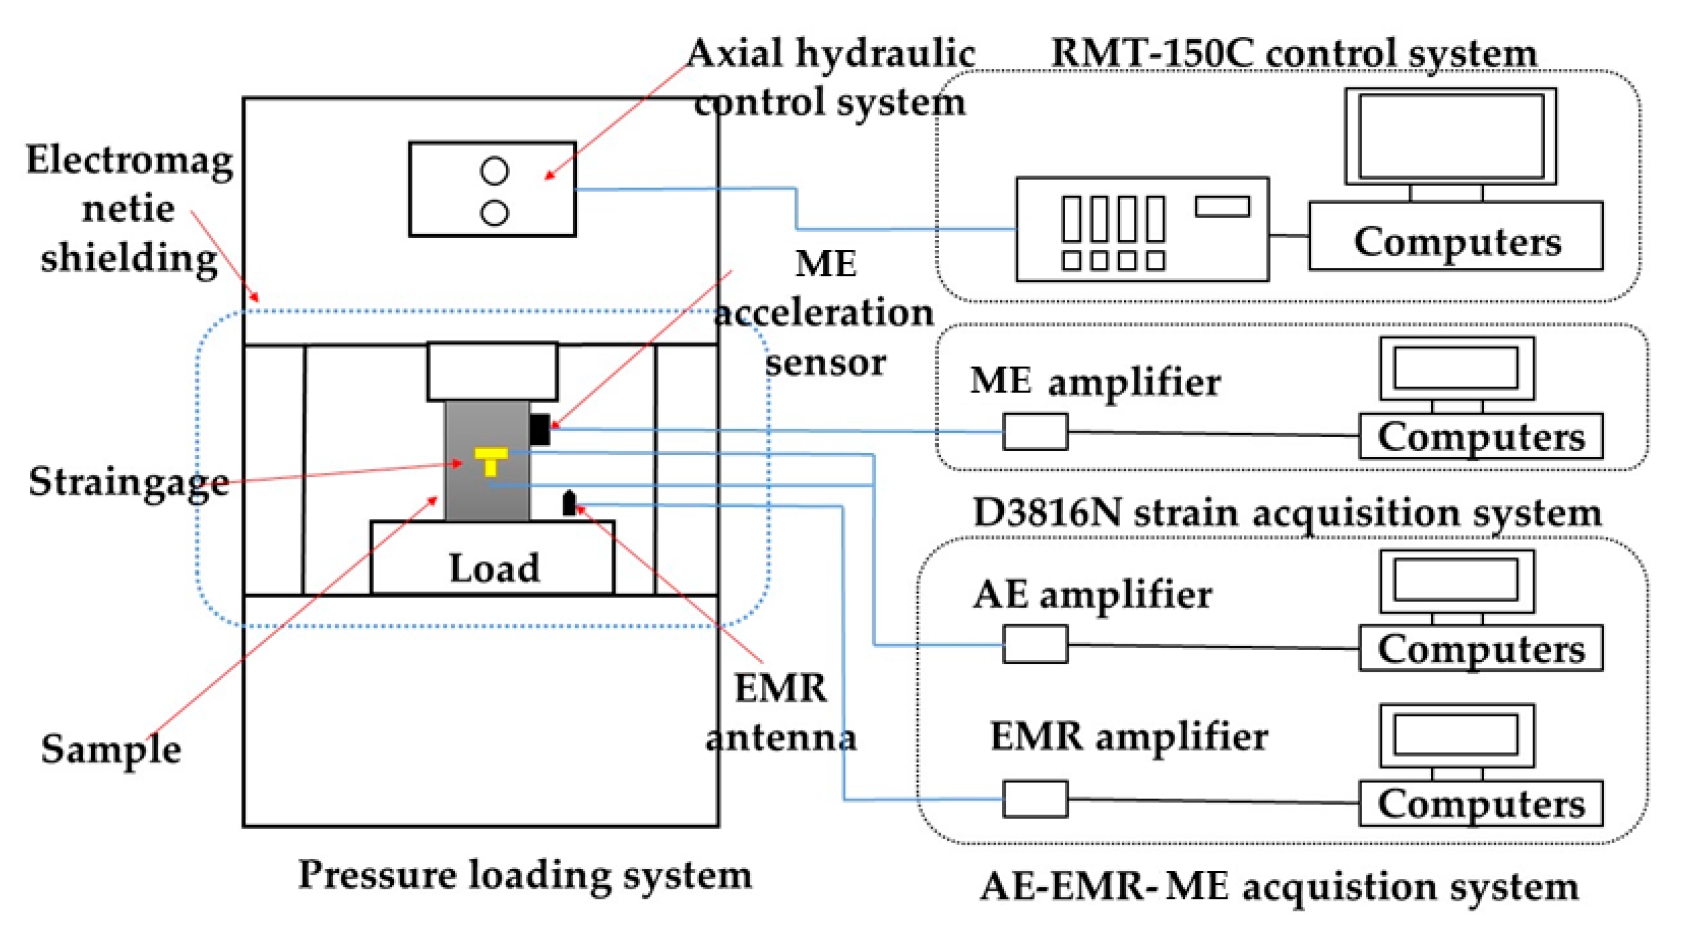
To ensure the consistency of specimen characteristics, dolomite specimens were procured and processed from the same rock. The height-to-diameter ratio was fixed at 2, with a rock specimen diameter of 50 mm and a height of 100 mm. The specimens were assigned the following numbers: J-1, J-2, J-3, and J-4.

3.2. Testing System

The experimental system in this paper comprises the following components: (1) the RMT-150 C rock soil mechanics experimental system; (2) the AE, ME, and EMR signal synchronous acquisition system based on an oscilloscope; and (3) the D3816N strain acquisition system. Figure 1 illustrates a schematic diagram of the experimental equipment.

3.3. Procedure of Test

Before initiating the experiment, thorough observations and cleaning of rock specimens were conducted. The strain calibration bridge box and the ME acceleration sensor were subsequently affixed to the axial intermediate position on both sides of the rock specimen, ensuring optimal transmission of ME signals between the specimen and the acceleration sensor. The receiving antenna for EMR signals was aligned with the middle of the sample, positioned 30 mm away, and shielded with electromagnetic cloth to minimize interference from external vibrations.
Subsequently, the RMT-150 C system was started, preheated, and systematically checked to ensure the proper functioning of all instruments within the experimental setup. The entire experiment was governed by displacement, with loading controlled by stroke. The loading rate was set at 0.01 mm/s until the specimen underwent destruction.
Upon commencement of the experiment, data collection and computer control were initiated. The deformation of the specimen was vigilantly monitored and recorded in real time throughout the loading process, serving as a crucial reference for analyzing the damage evolution process of the specimen. To mitigate interference signals, the laboratory restricted movement and maintained a controlled environment.
Upon the destruction of the specimen, all data acquisition systems were halted, marking the conclusion of the experiment. The collected data were saved, and the condition of the crushed specimen was documented. The aftermath of the rock fracture was cleared, the test bench was organized, and subsequent experiments were conducted following the aforementioned procedures.

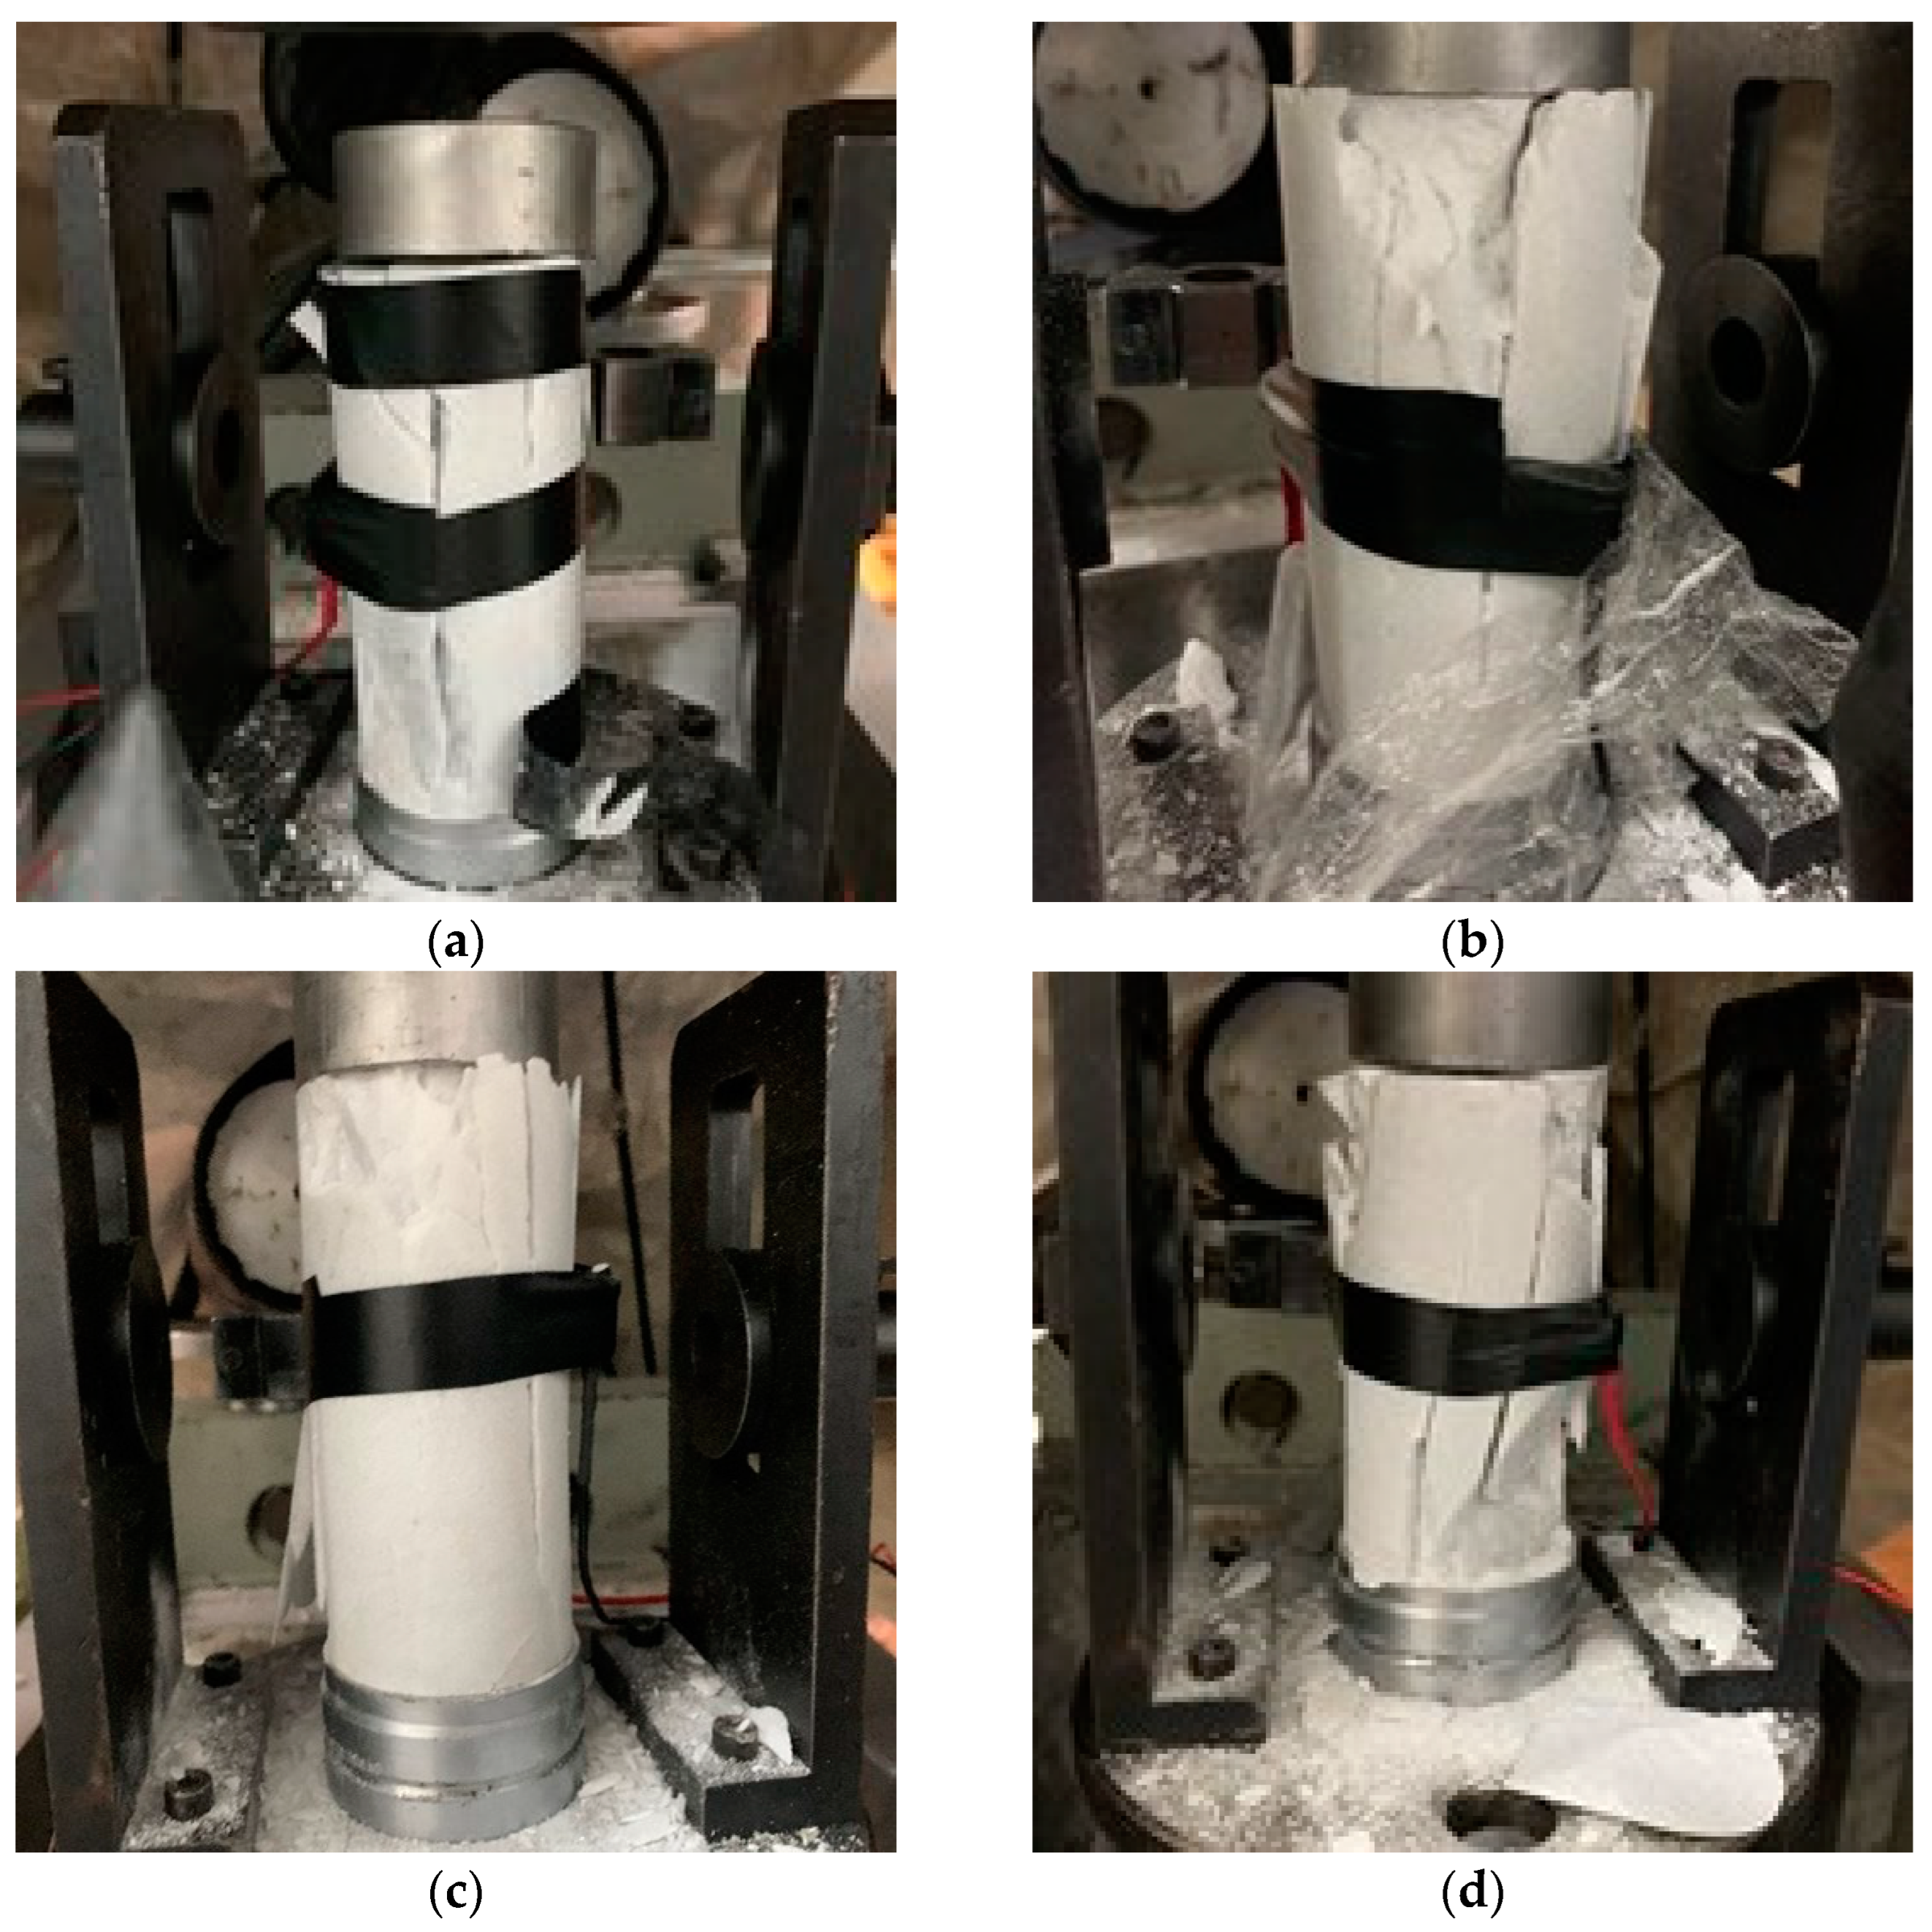
3.4. Fracture of Specimen

Figure 2 is the shape of the four groups of specimens after failure. The fixation of electrical tape during loading will keep the shape of the specimen after failure, which is more convenient to observe. The fracture pattern observed in the J-1 specimen indicates composite failure, which is clearly distinct from the other three rock specimens. Figure 2 illustrates the post-failure shapes of the four specimen groups. The strategic application of electrical tape during loading serves to preserve the specimen’s shape after failure, facilitating convenient observation. Notably, the fracture pattern observed in the J-1 specimen signifies composite failure, markedly distinct from the other three rock specimens. The fracture surface of the J-1 specimen reveals concurrent tensile and shear cracks, with an irregular distribution of cracks and observable small fragments detaching. In cases of composite failure, the primary crack shape is nearly perpendicular to the entire specimen, extending through the rock specimen along the loading direction. In contrast, specimens J-2, J-3, and J-4 exhibit failure concentrated at the ends, identified as end constraint failure. This occurs when the stress distribution within the rock specimen is significantly influenced by boundary conditions or constraints at the specimen’s ends during the loading process. The resultant end effect manifests as concentrated failure at both ends.

4. Test Results: Analysis and Interpretation

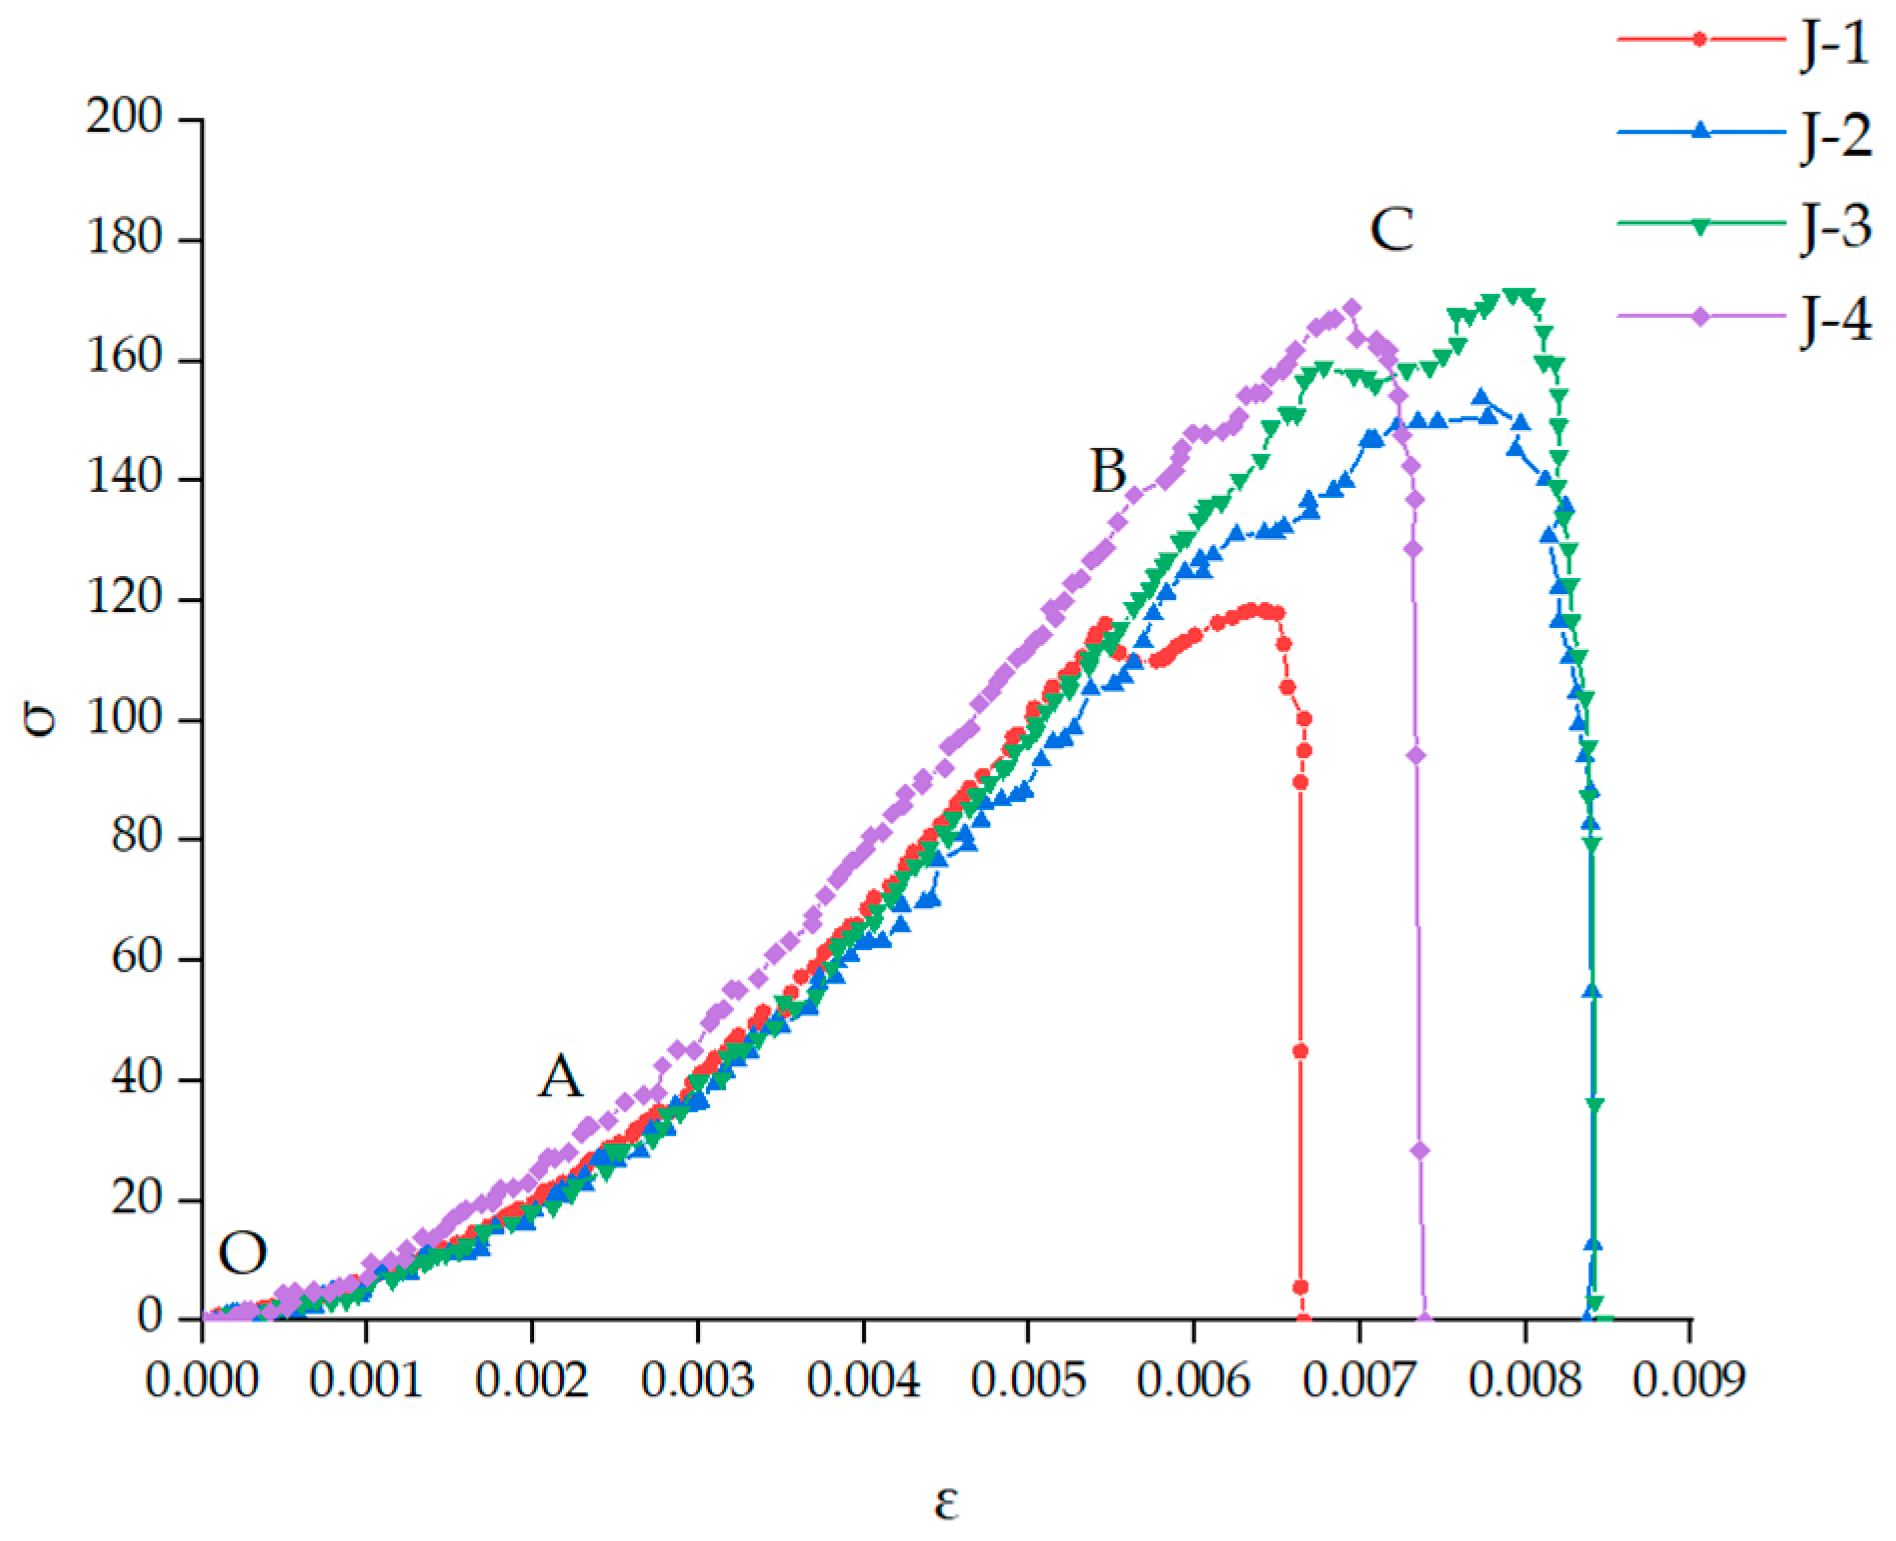
4.1. Stress–Strain Curve of Specimen Failure

The mechanical parameters characterizing rock mass comprise diverse eigenvalues derived from the stress–strain curve acquired through rock mechanics tests. These parameters serve as a foundational framework for predicting the deformation and destruction behavior of rock mass, thereby facilitating the assessment of its engineering stability [21,22]. The stress–strain curves of four dolomite specimen groups subjected to uniaxial compression are depicted in Figure 3. A detailed examination of Figure 3 reveals that the fracture development in the four specimen groups is fundamentally uniform during the OA (pore fracture compaction stage) and AB (elastic deformation stage). However, the peak point of specimen J-1 is notably lower than the other three specimens, attributable to the inherent inhomogeneity and discontinuity of the sandstone. The fractured form of specimen J-1 demonstrates composite failure, a clear distinction from the other three specimens. Upon the destruction of the rock specimen, the primary crack shape is nearly perpendicular to the overall axial axis of the specimen. This distinctive pattern arises from the axial compression of the cylindrical specimen, inducing transverse expansion through the Poisson effect. Consequently, transverse tensile stress is generated in the vertical plane inside the specimen, leading to tensile failure when this stress exceeds the tensile limit of the dolomite specimen. Subsequent to reaching the peak failure strength, specimens J-2, J-3, and J-4 do not immediately exhibit strain, indicating the presence of residual strength, with strain lagging behind stress.
The yield point B of the BC yield stage marks the transition from the elastic to the plastic stage, indicating the rock’s entry into the plastic deformation stage from the elastic stage. At this stage, internal cracks in the rock develop, and the specimen’s volume undergoes a transition from compression to expansion due to the fragmentation of the rock. After point C, the post-failure stage ensues, characterized by complete penetration of the main crack in the specimen and a rapid loss of bearing capacity.

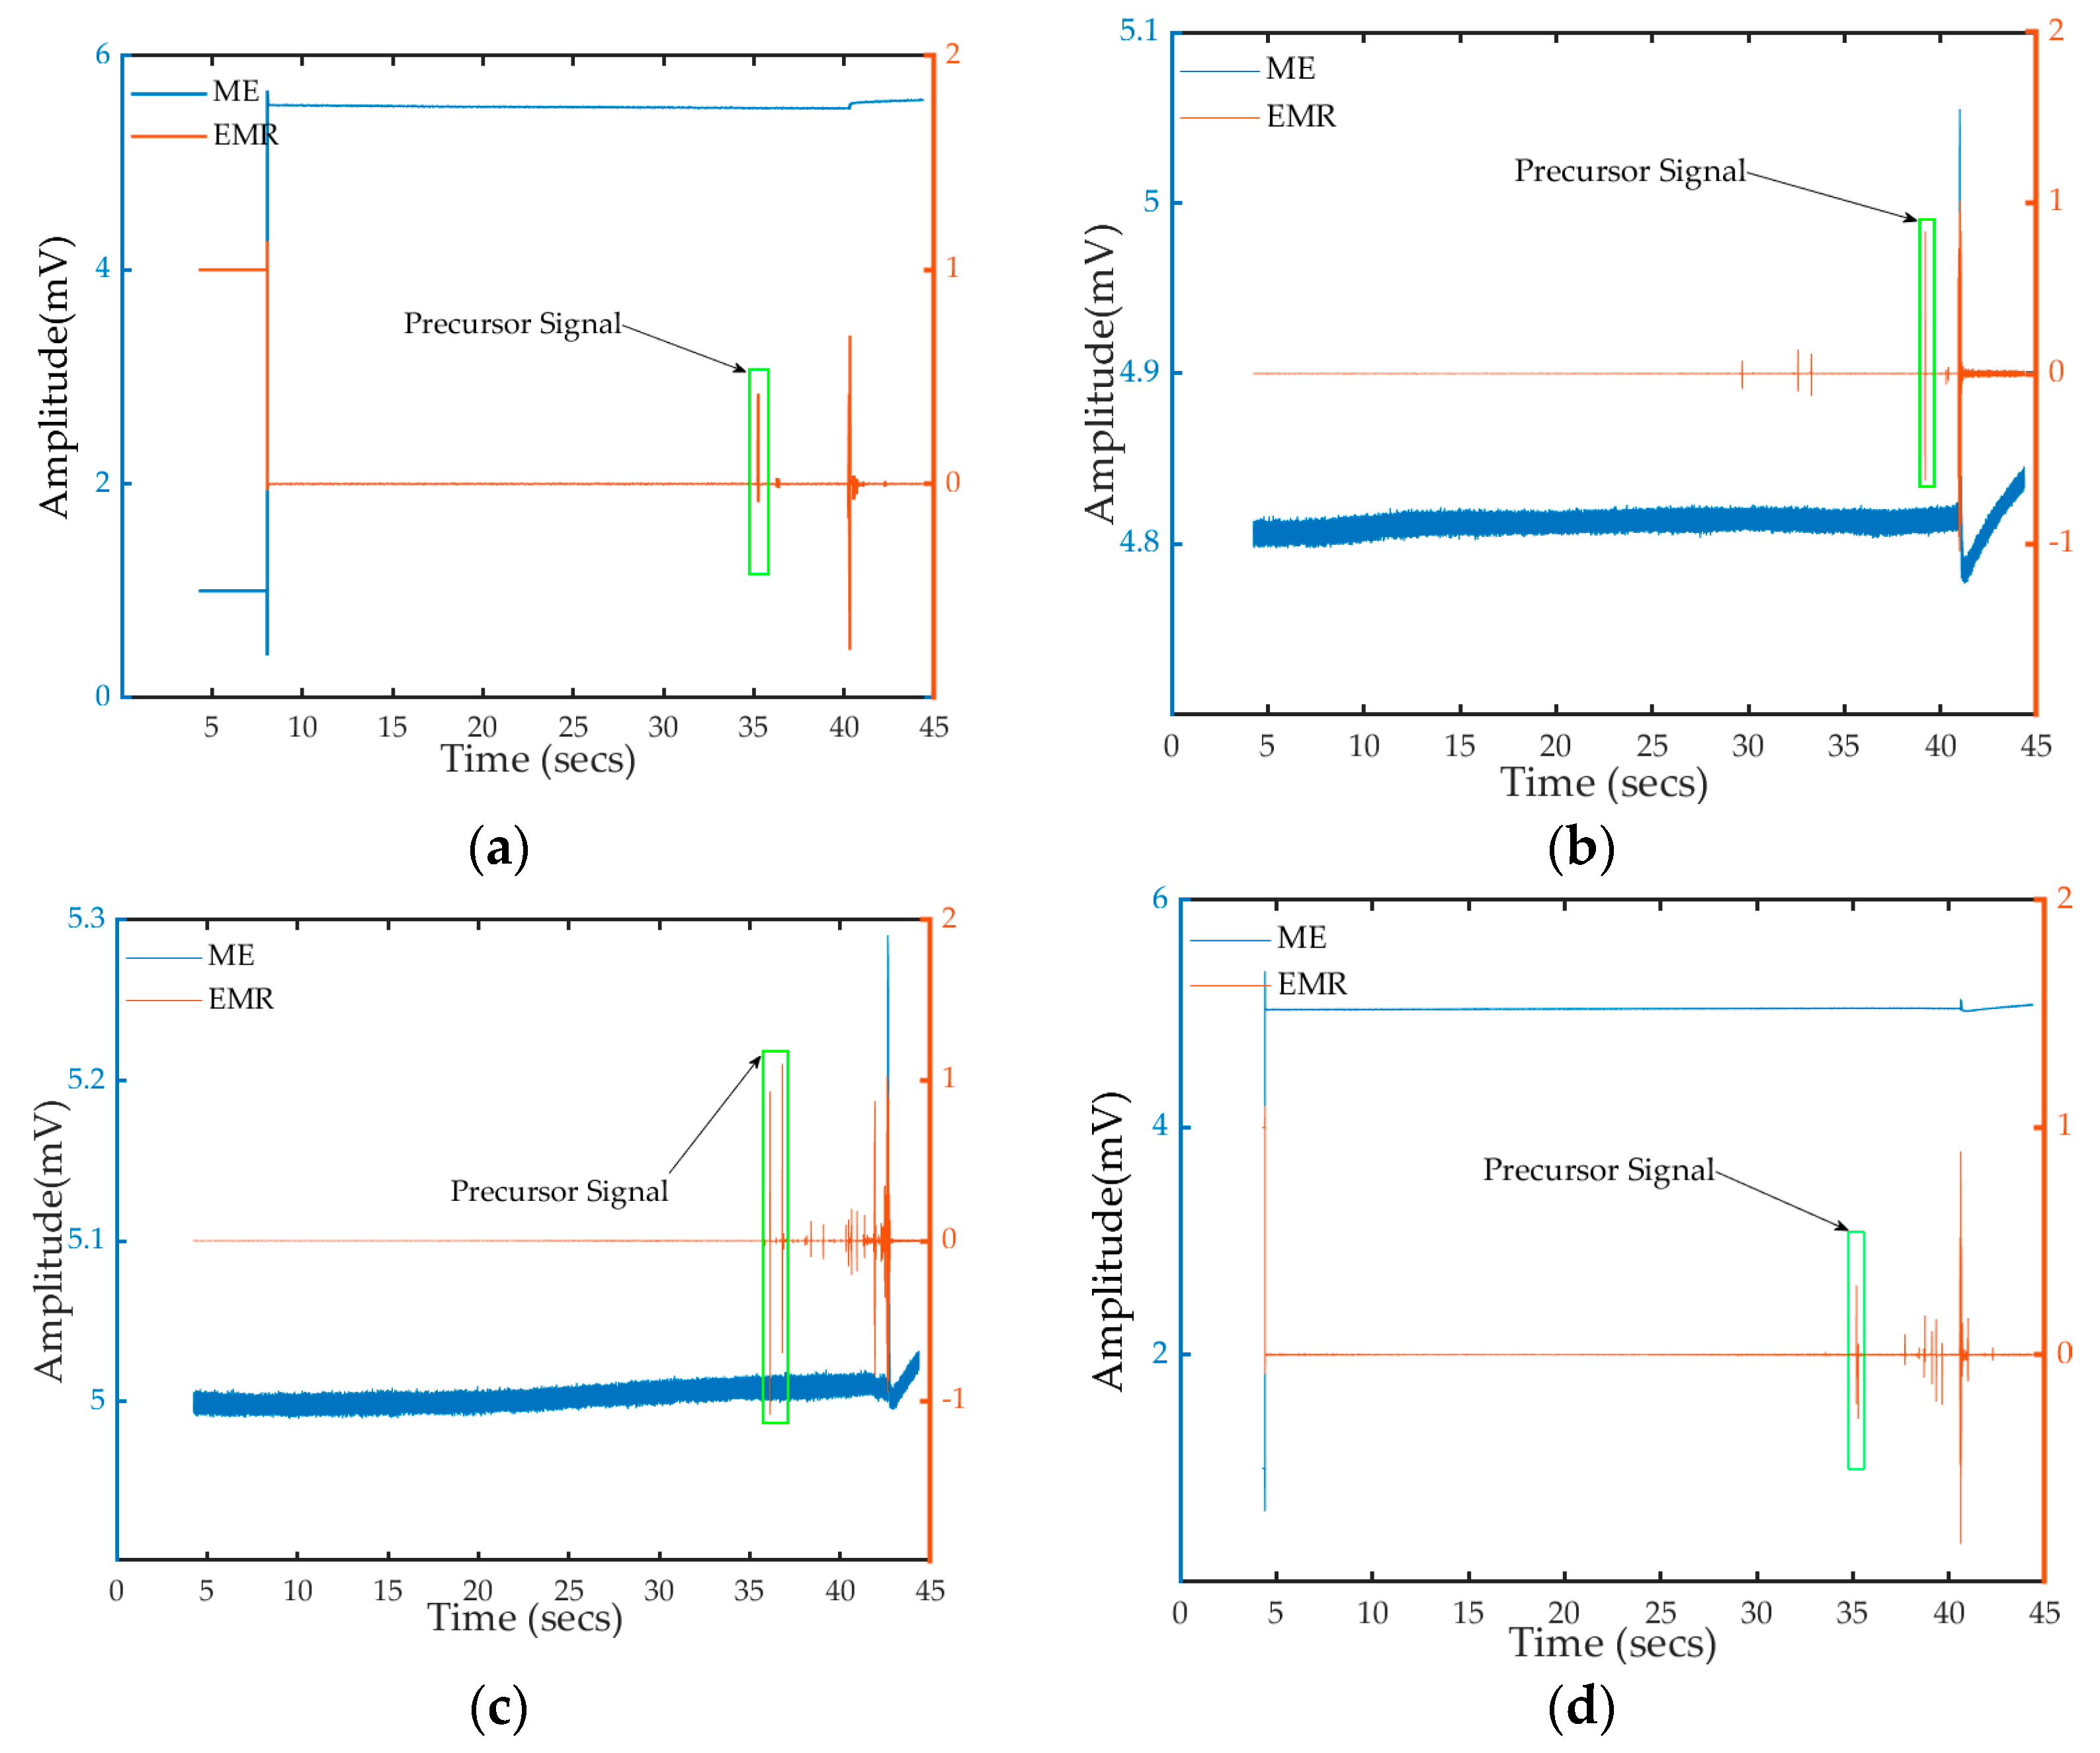
4.2. Signal Extraction

During the uniaxial compression experiment, the collected signal is susceptible to interference, primarily stemming from instrument vibrations. Following noise reduction in the anticipated signal data, energy, frequency, and amplitude are systematically compared and analyzed. Distinct AE, ME, and EMR signals are evident in the data collected from the four rock specimen groups.
To accurately isolate genuine signals generated during the experiment and the on-site sandstone fracture process, the experiment employs the STA/LTA algorithm for data identification and extraction [23,24].

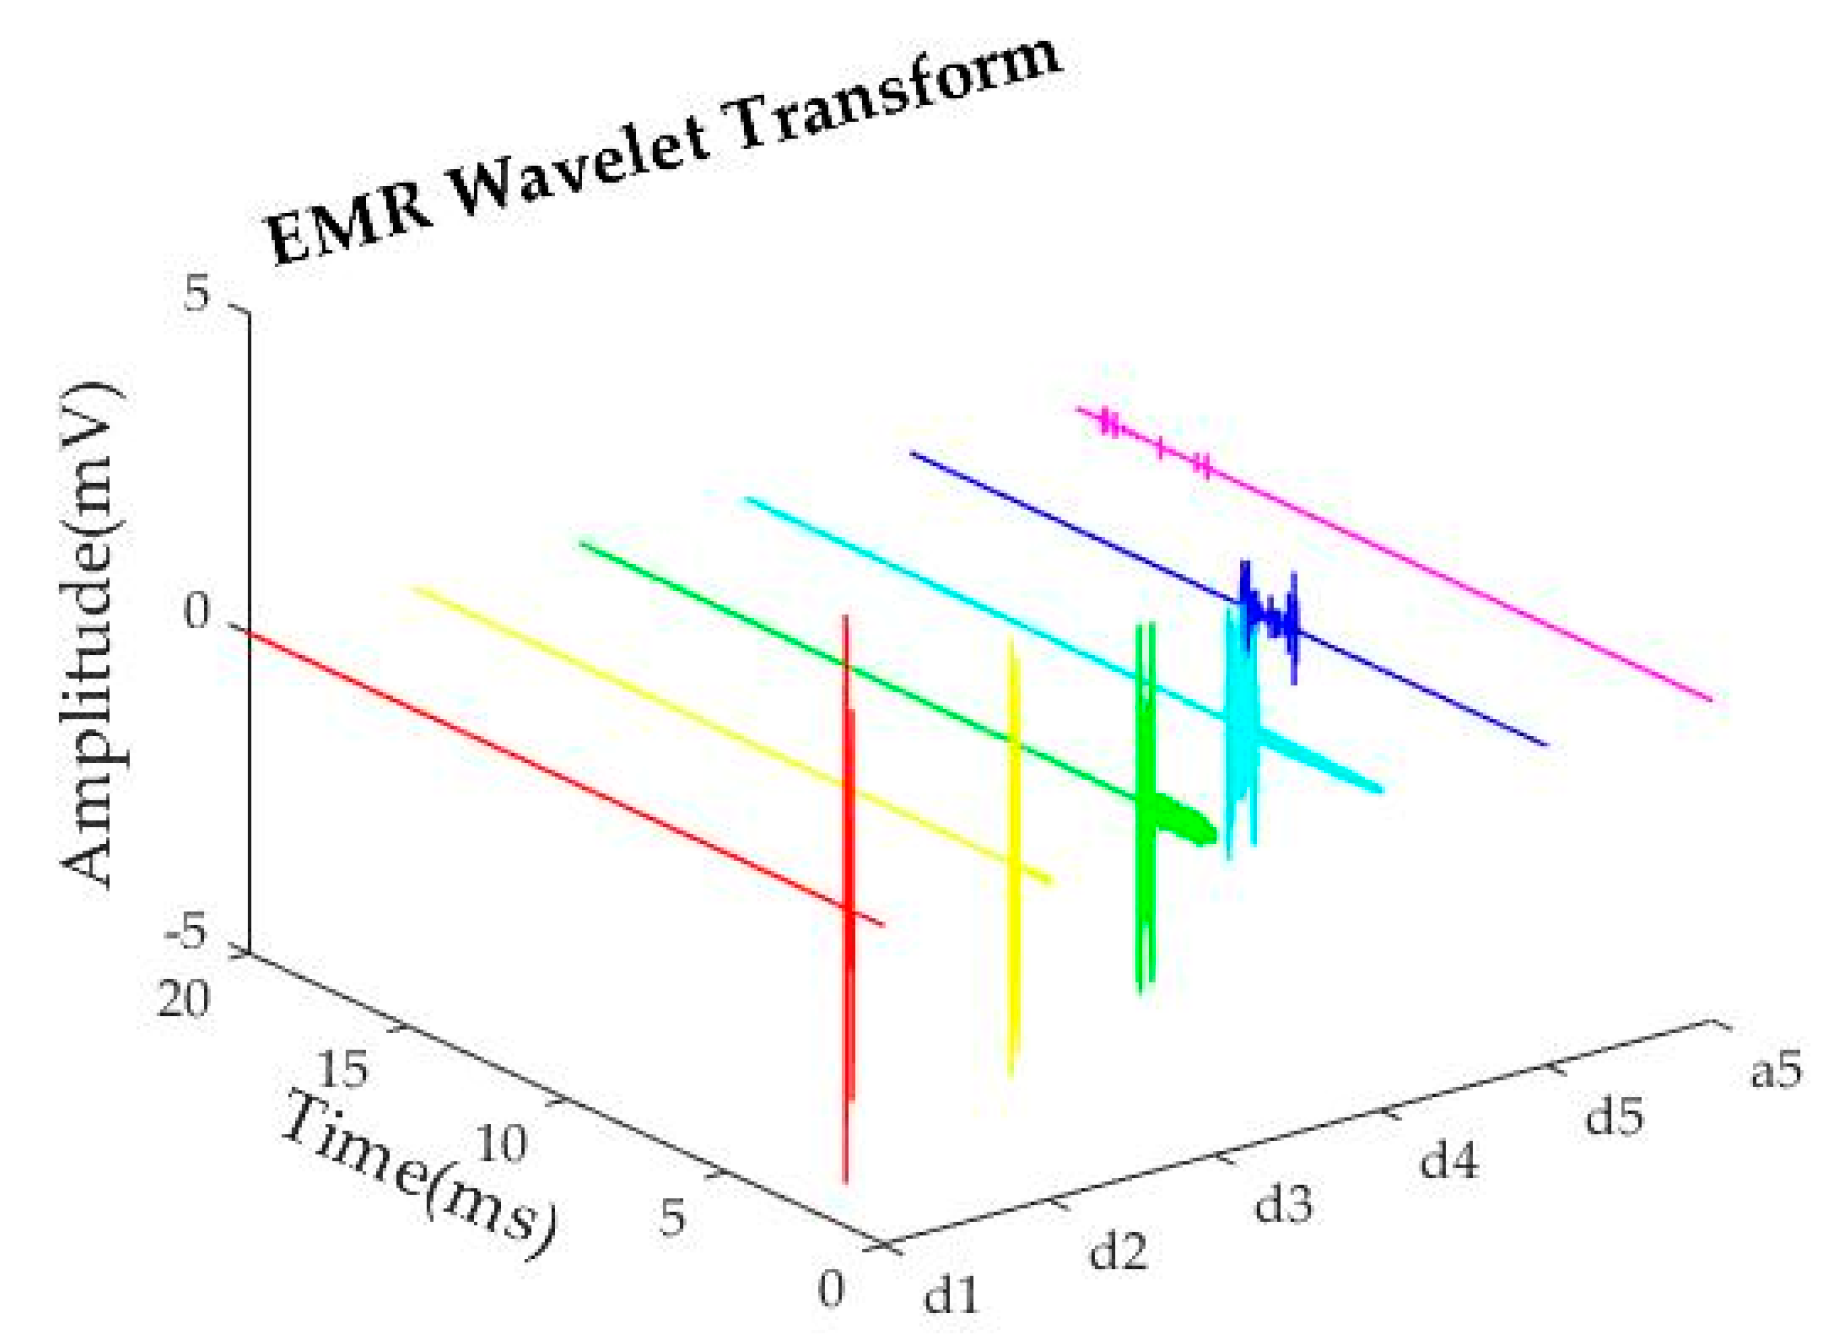
4.3. Wavelet Iterative Threshold Denoising

The ‘Sym8’ wavelet basis function is employed for the decomposition and reconstruction of the signal in five layers. To enhance signal clarity, the wavelet iterative threshold denoising method is applied [25,26]. Using the J-3 specimen as an illustration, Figure 4 demonstrates the denoised signal.

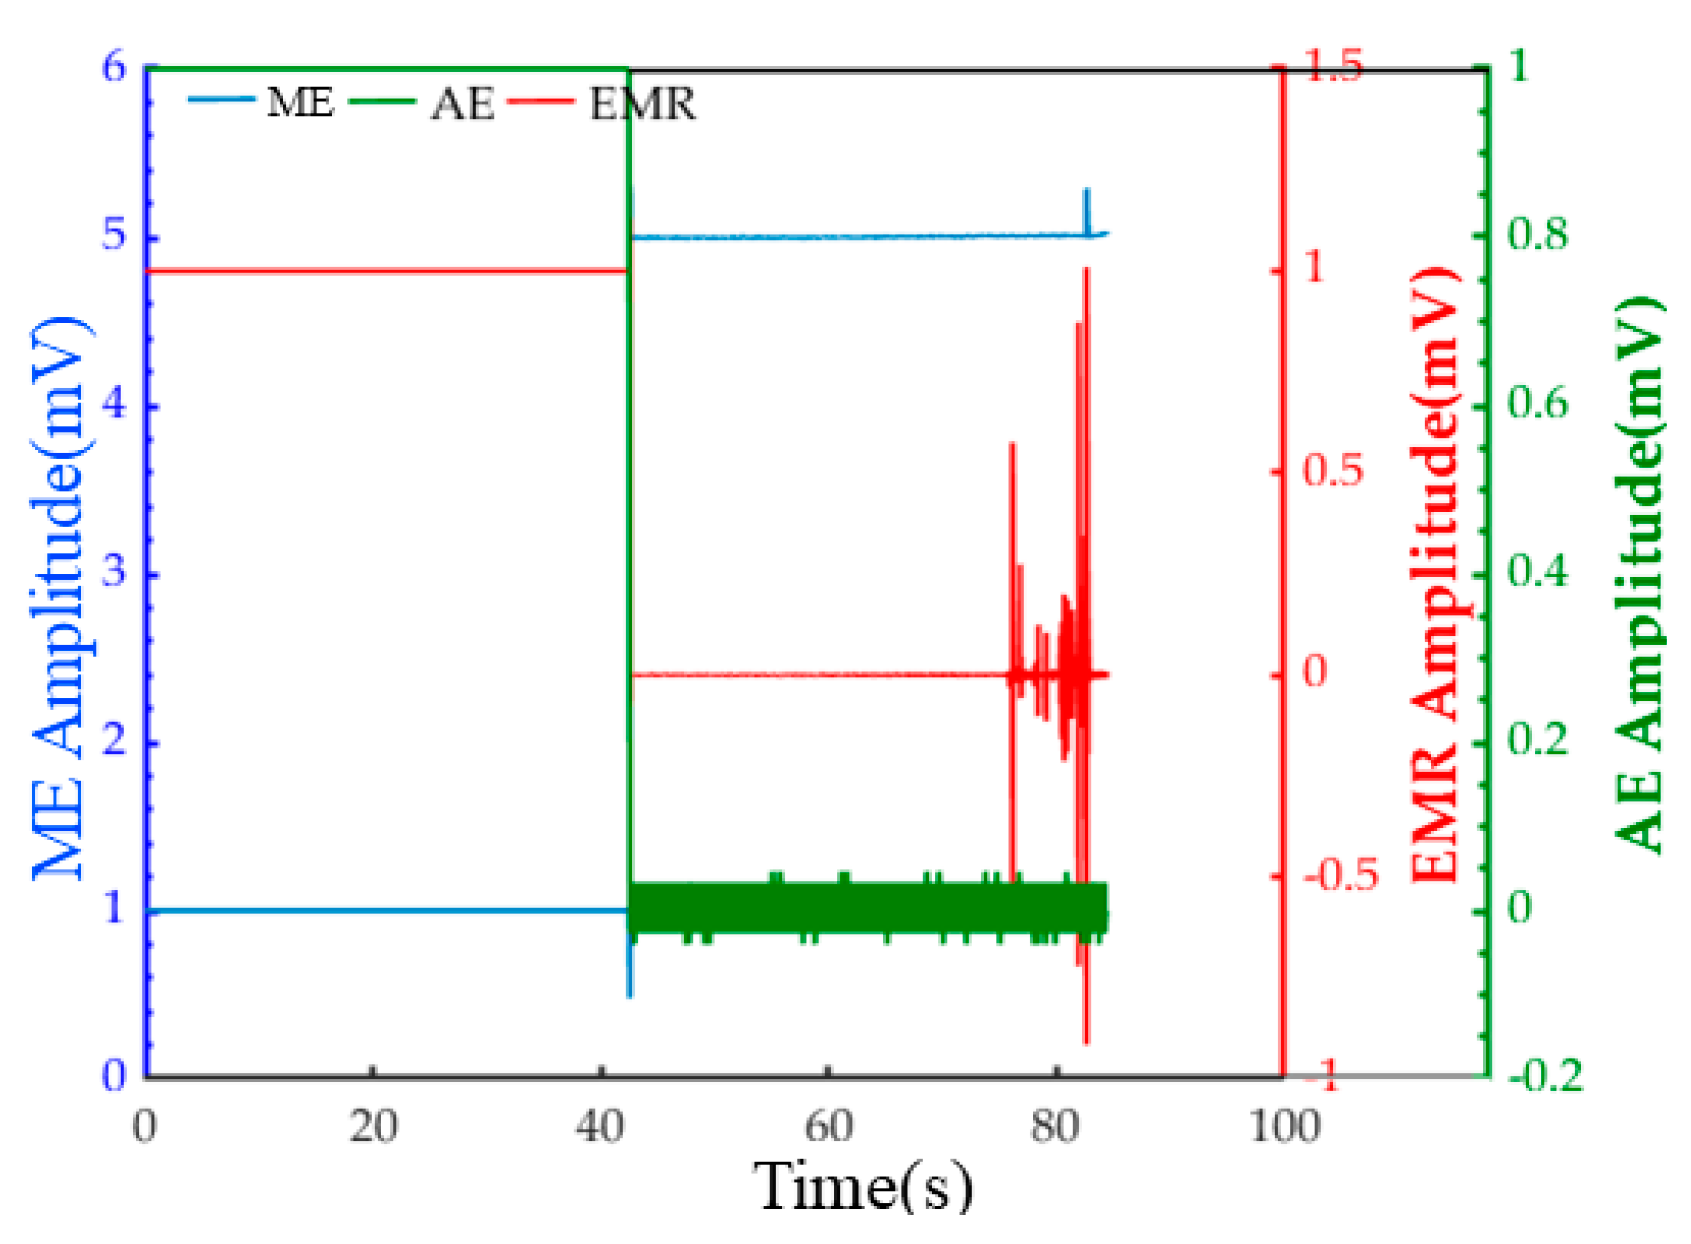
4.4. Signal Waveform Analysis after Noise Reduction

Following the outlined procedures, time domain diagrams of ME and EMR signals are obtained through signal processing for the four experimental groups, as depicted in Figure 5. Analyzing the ME and EMR waveforms resulting from rock damage in the specimens under static load conditions reveals that the first arrival time difference between the monitored ME signal and the EMR signal is less than 0.01 MS. This aligns with the established understanding that the propagation speed of EMR is faster than ME in the same medium. In terms of the signal-to-noise ratio, ME signals exhibit higher ratios and smoother waveforms, and both undergo rapid fluctuation rise followed by a gradual decline.
Moreover, the waveform rise time difference between the ME and EMR signals is minimal, and later stages exhibit sustained vibrations with a notable decrease in amplitude. To anticipate rock fractures, the ME and EMR signals of each specimen group undergo analysis. This involves determining the mutation position in the EMR signals to further explore the correlation between the EMR and ME signals in both the time domain and frequency domain [27].

5. Coupling Analysis of the ME Signal and EMR Signal

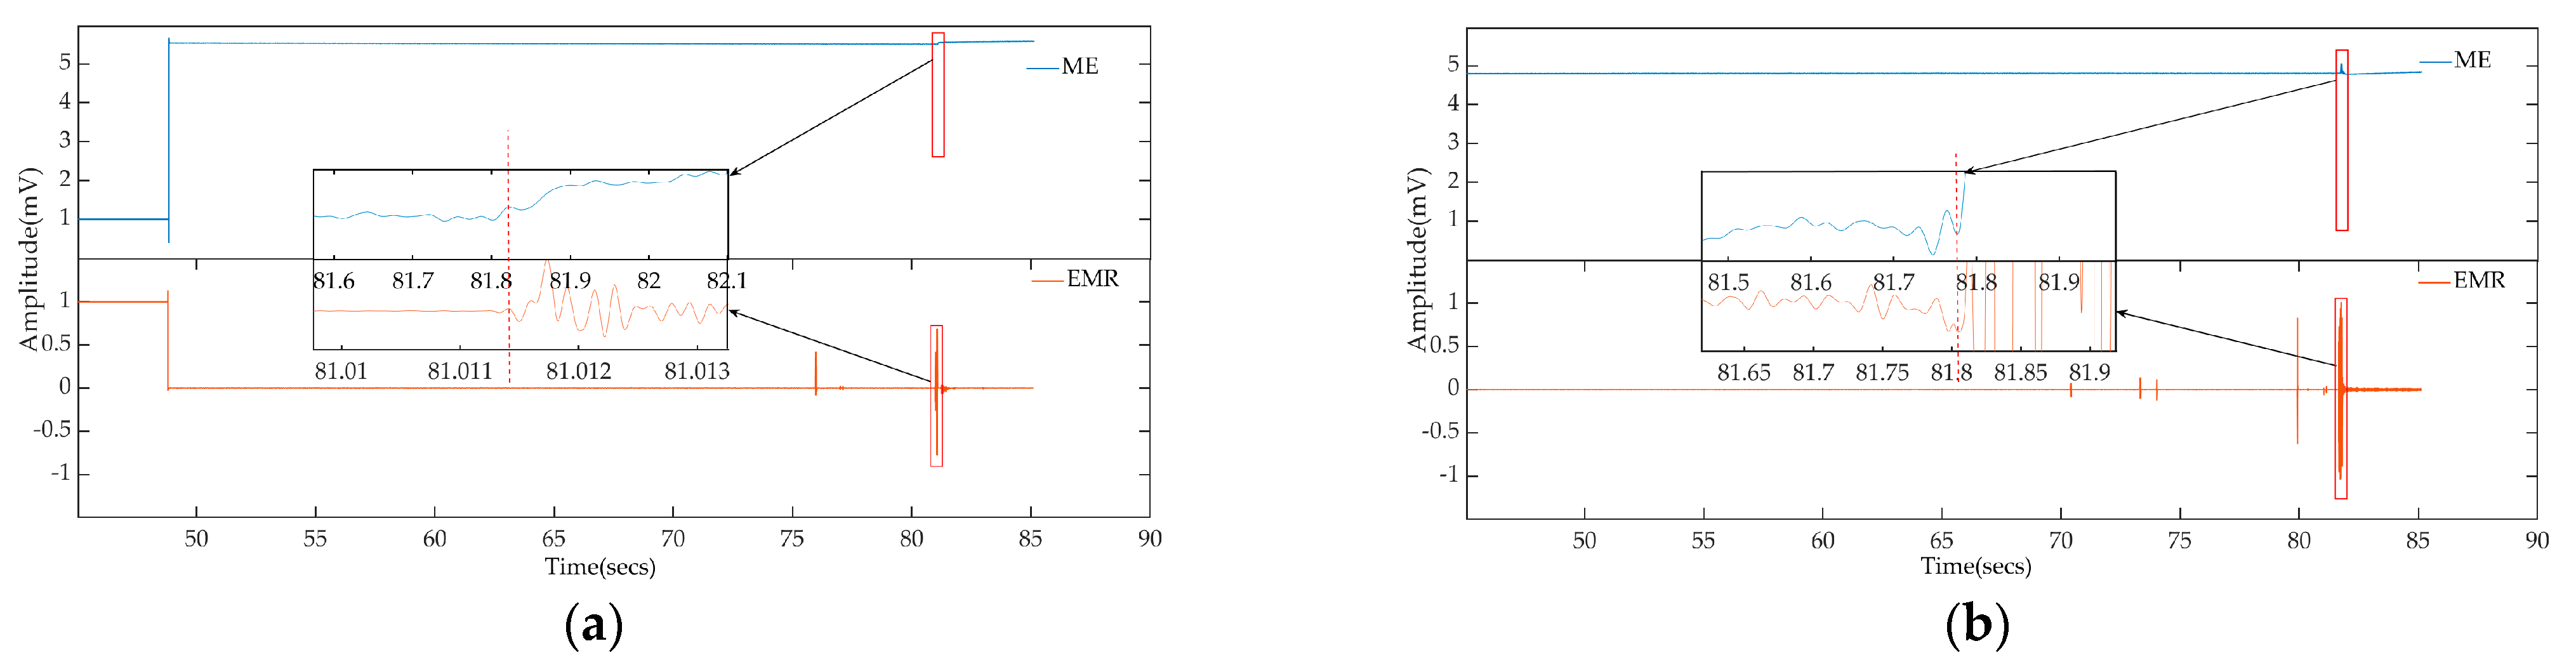
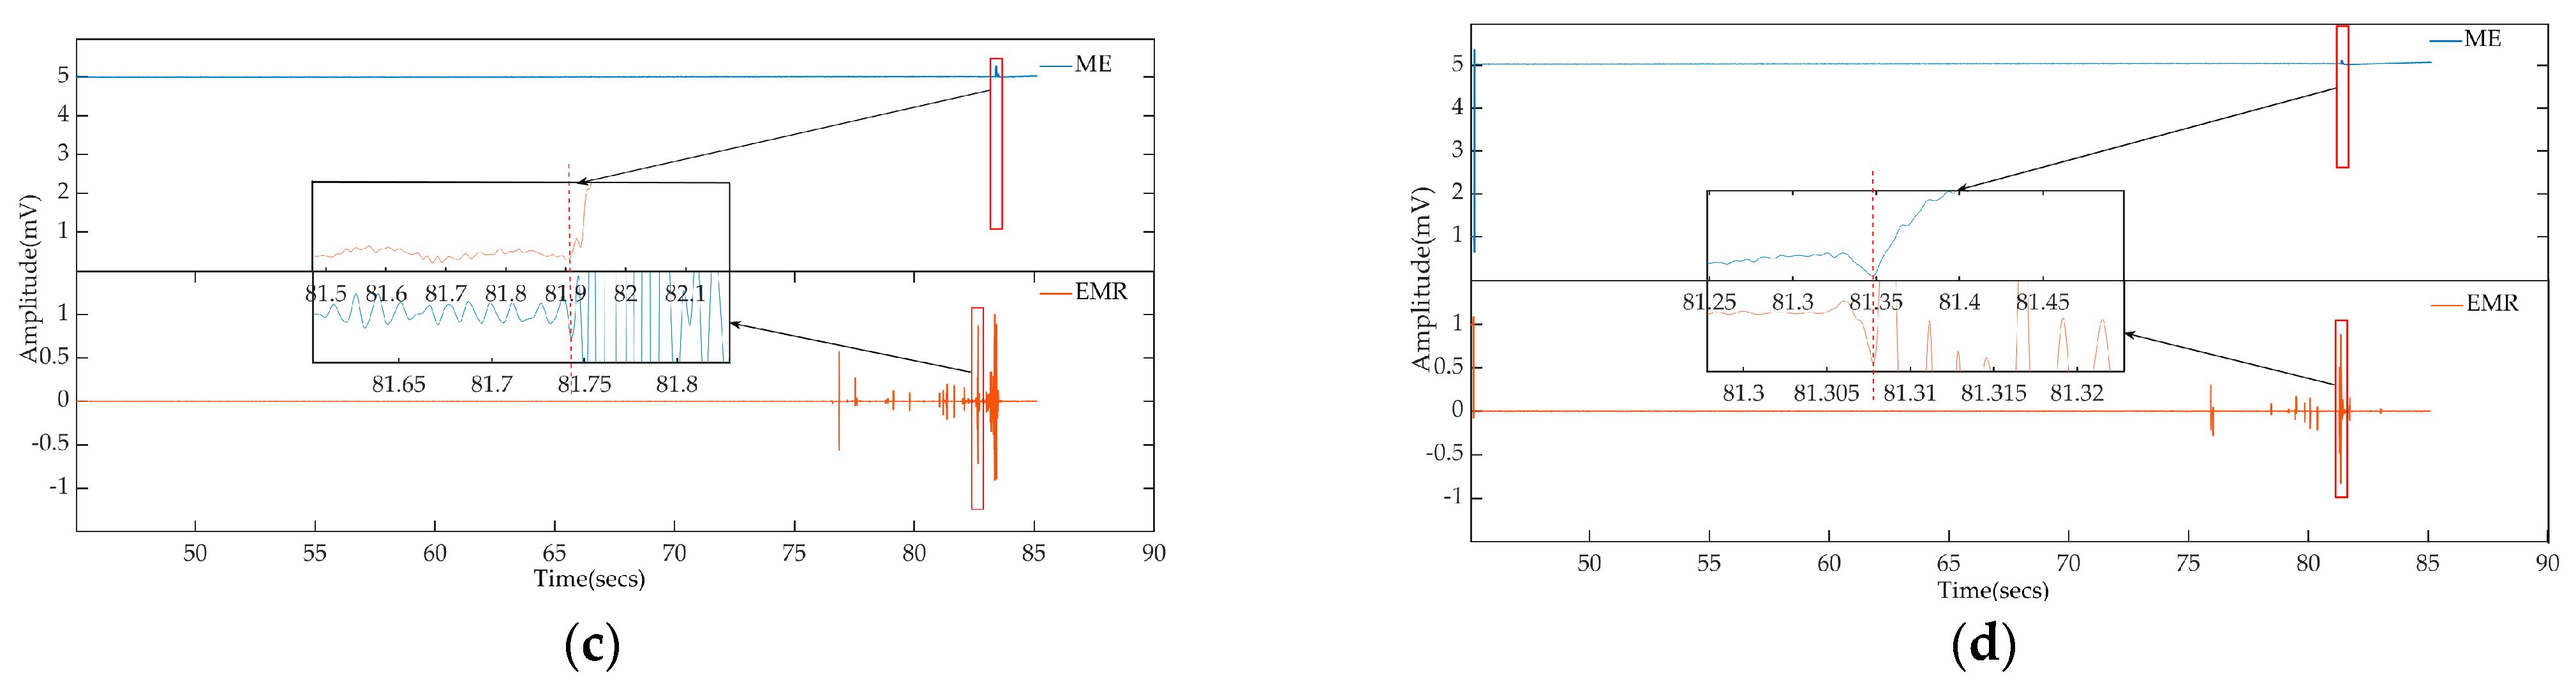
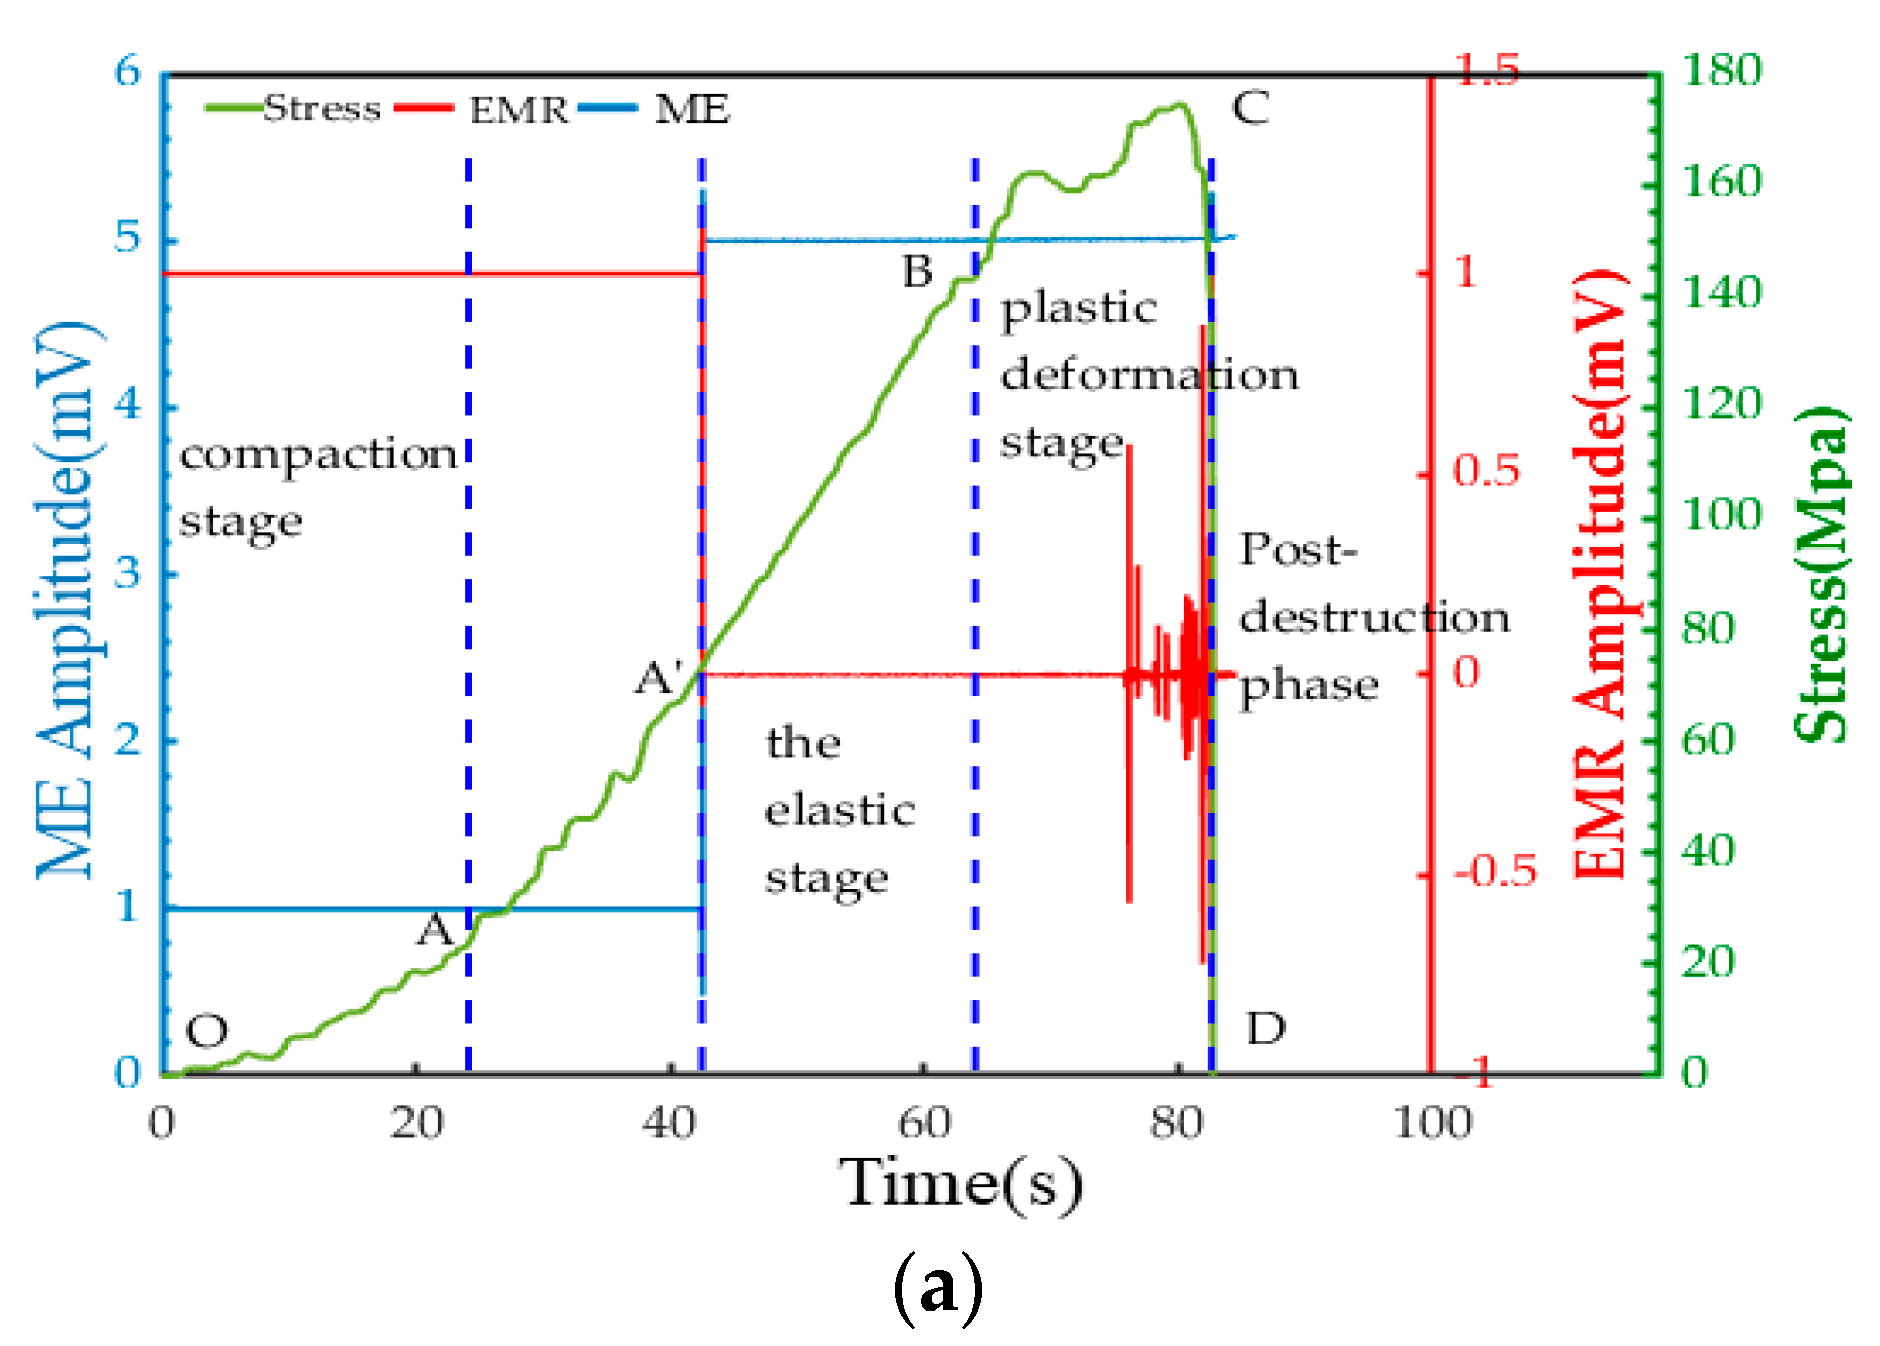
5.1. Time Domain Characteristics Analysis

Analysis of the experimental results in Figure 6 reveals a high degree of synchronization between the EMR and ME signals generated during the rock failure process in the time domain. Notably, the time difference between the ME and EMR signals is minimal, indicating the faster propagation speed of EMR compared to ME. Consequently, the EMR signal can serve as a reliable predictor for the arrival of the ME signal.
It is observed that the attenuation rate of the ME signal is significantly higher than the EMR signal, which is attributed to the charge accumulation effect during the later stages of crack propagation. As the rock mass fractures and the crack tip accelerates, charge accumulation occurs on both sides of the crack, leading to the generation of EMR. This phenomenon is particularly pronounced in rock masses with impact effects. The much higher propagation speed of EMR compared to ME means that when ME signals (cracks) and charged particles are generated simultaneously, EMR is also generated. Before the main rupture occurs, small ME signals are generated, serving as the power source for EMR. The charge generated by the rupture of these small ME signals forms the physical basis of EMR. Consequently, the precursor EMR signal, preceding the main EMR rupture, often occurs before the arrival of the main rupture signal. This EMR precursor signal serves as an early warning signal for synchronous monitoring of ME and EMR.
Through post-observation data processing, time domain images confirm the presence of EMR precursor signals in all four sets of experimental data, affirming the feasibility and reliability of such precursor signals for monitoring and early warning purposes.

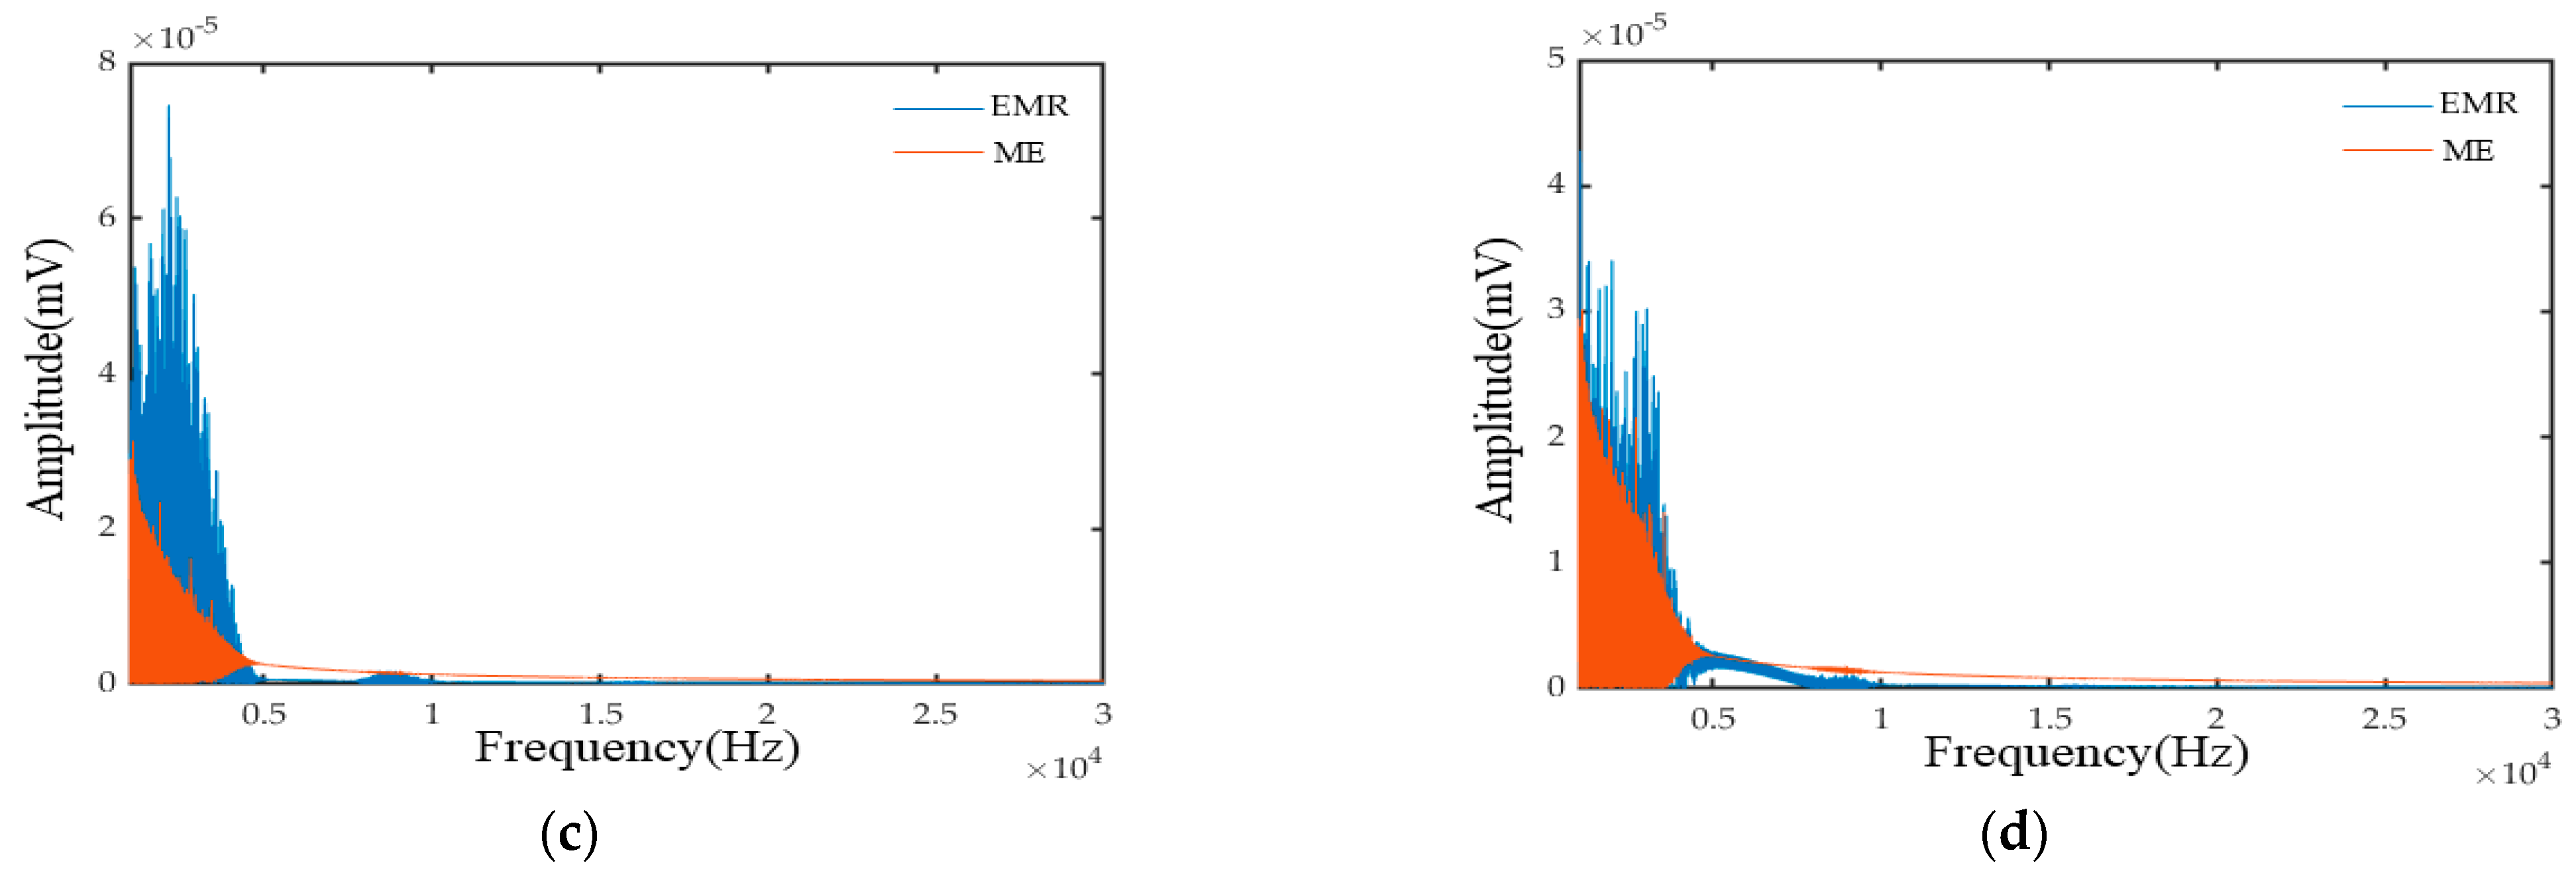
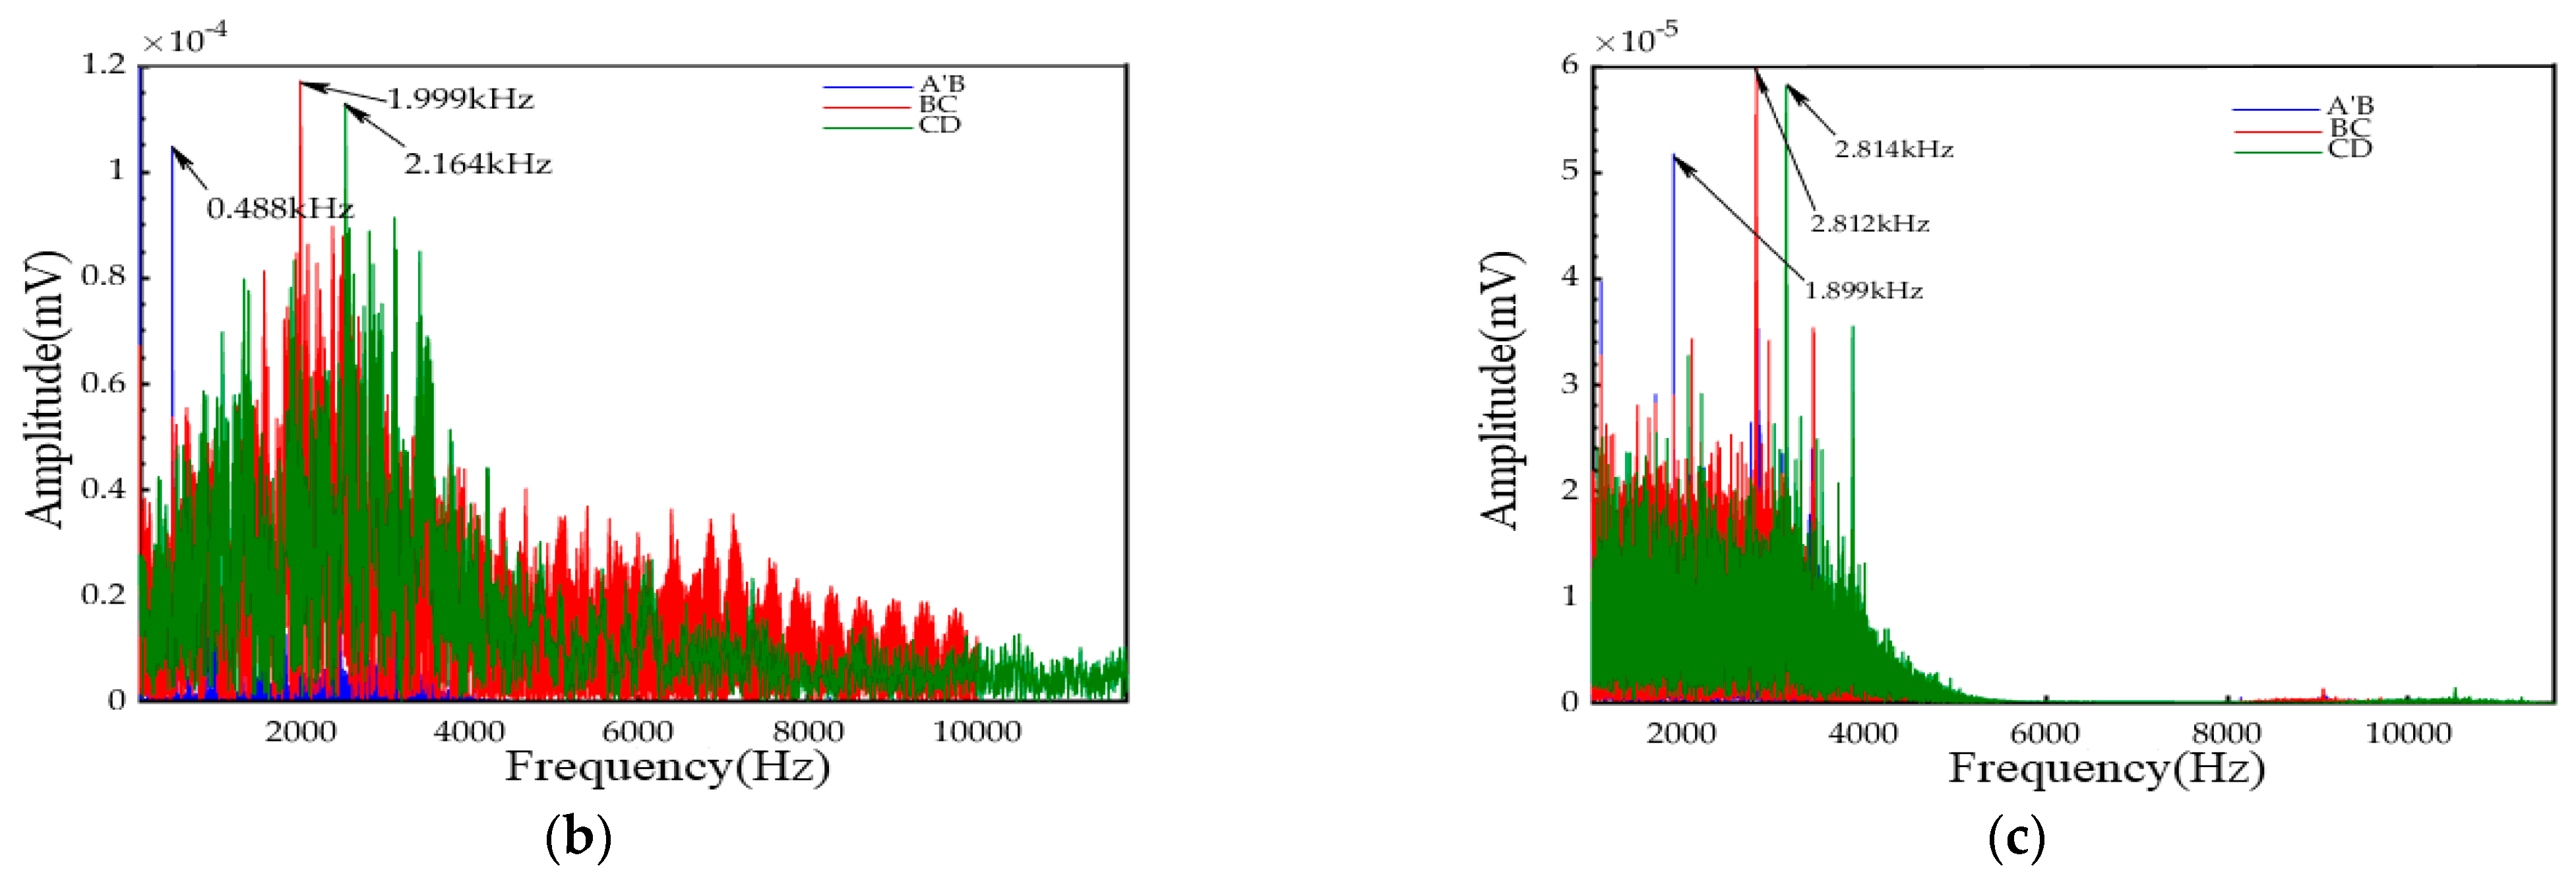
5.2. Frequency Characteristics Analysis

Figure 7 illustrates the spectra of the EMR and ME signals obtained through fast Fourier transform for the rupture processes of the four specimen groups. It is evident that both the ME and EMR signals exhibit distinctive low-frequency components. This phenomenon arises from the relatively rapid deformation during smaller fractures, resulting in higher-frequency vibrations. Conversely, larger fractures induce slower deformation rates and lower vibration frequencies, giving rise to lower-frequency signals [28]. Throughout the rock fracture process, the low-frequency signals of both the EMR and ME signals are concentrated between 1000 Hz and 30,000 Hz. No data are observed within the 0–1000 Hz range, and amplitude values between 30,000 Hz and 1,000,000 Hz are negligible, approximately 1/40 of the amplitude value of the peak frequency within the main frequency range. Thus, the primary analysis interval is 1000 Hz to 30,000 Hz. The primary frequency band of the ME signal is centered within 5 kHz, with significantly reduced amplitudes beyond this band, identifying the main frequency as 2.81 kHz. The primary frequency band of the EMR signal is slightly narrower than the ME bandwidth but still falls within the low-frequency range, primarily concentrated within 20 kHz. The main frequency of the EMR signal is 2.16 kHz, which is very similar to the main frequency of the ME signal. The close alignment of the main frequencies in the low-frequency band indicates that both ME and EMR signals are manifestations of energy release during rock breakage and deformation.
When rock breaks and deforms, energy release manifests in various ways. Some energy is converted into mechanical waves, propagating as ME signals, while another part is transformed into electromagnetic waves, propagating as EMR signals. These data confirm, to a certain extent, that static load-induced fracture damage in rocks generates micro-seismic activity, leading to EMR signals from charged cracks [29]. Additionally, the high time frequency correlation between EMR and ME signals suggests that the EMR signal resulting from rock fractures appears to stem from vibrationally charged crack clusters [30]. This provides evidence that the EMR signal generated during rock fracture is highly analogous to the ME signal, establishing an experimental basis for the simultaneous monitoring of EMR and ME signals.

5.3. Analysis of the Signal Coupling Effect

The generation of EMR signals during rock fractures relies on the clear synchronization of fracture events, vibrations, and ME signals in a time sequence. Consequently, the ME acceleration sensor is affixed to the surface of the rock specimen, while the EMR antenna receiver is strategically positioned near the specimen, enabling comprehensive and synchronized monitoring of the EMR and ME signals under full load conditions. As the dolomite progresses through different stages, distinctive fracture development characteristics become apparent. Therefore, the specimen’s loading process is inherently accompanied by the emission characteristics of ME, AE, and EMR signals (Figure 8).
It can be seen in Figure 8 that the low-frequency EMR and ME signals of the final main fracture of the dolomite specimen are synchronized in the time domain. The AE signal monitored by the AE sensor lags behind the synchronous EMR and ME signal, indicating that the synchronous EMR and ME signal wave velocity is higher than the AE wave velocity; this is because AE signals propagate through molecular vibrations in the air, which usually travel at a slower speed. EMR signals propagate at speeds equal to the speed of light, and ME signals propagate through elastic waves in a solid medium. In addition, ME and AE still occur in the pre-stage and post-stage of the final AE signal and ME signal, indicating that the ME signal and AE signal are generated and expanded by cracks before the main fracture of the rock. At the same time, the EMR signal intensity of dolomite will increase to a certain extent in the compaction stage, which is caused by the piezoelectric effect, and then the EMR signal intensity of the material is maintained at the same level in the elastic deformation stage and the plastic deformation stage. Due to the strong brittleness of dolomite specimens, there is no obvious signal fluctuation before the micro-cracks penetrate and produce macroscopic cracks visible to the naked eye. There is almost no charge induction signal in the compaction and elastic stage of natural dolomite specimens, and there is less charge and ME signal in the fracture development stage. The reason is that the development degree of micro-fractures in dolomite is weak, and the storage energy in the compaction and elastic stage is not enough to lead to large-scale micro-fracture expansion. There is almost no charge sensing and low-frequency geophysical signal generation because when the micro-fracture is weakly developed, the frequency of the ME signal is a high-frequency signal, and the weak fracture network cannot provide sufficient stress release and energy transfer paths, nor does it have a richer high-frequency signal composition [31]. However, entering the plastic deformation stage, the energy accumulation inside the rock specimen increases, and the stress is concentrated in local areas. Due to the deformation and stress release inside the specimen, micro-cracks are generated and expanded, resulting in charge redistribution and generating charge induction signals, at the same time, they are accompanied by the generation of ME signals. The different cracks begin to penetrate during the complete failure of the specimen, and the number of EMR and ME signal events increases. Therefore, during the instability failure, the crack expands rapidly, the energy is released instantaneously, the damage changes sharply, the bearing structure surface is rapidly destabilized, and the amplitude of the charge induction signal reaches the maximum.
In Figure 9, the frequency comparison of the EMR and ME signals of the J-4 dolomite specimen at each stage is presented. Figure 9a corresponds to the four stages of the uniaxial compression failure of dolomite: the compaction stage and the early stage of elastic deformation (OA′). No noticeable EMR and ME signals were collected during this phase. In the middle and late stages of the elastic deformation stage (A′B), the generated EMR remains at a consistent level with the ME signal. The main frequency of ME is 1.899 kHz, while the main frequency of EMR is 0.488 kHz. As the specimen transitions into the plastic deformation stage (BC), numerous EMR signal events emerge. The main frequency of ME becomes 2.812 kHz, and the main frequency of EMR is 1.999 kHz. When the specimen reaches its peak load, the amplitude of both the EMR and ME signals reaches a maximum before declining. Corresponding to the CD stage, the main frequency of ME is 2.814 kHz, and the main frequency of EMR is 2.164 kHz.
Using MATLAB 2021a software for calculations, a fast Fourier transform of the fifth channel data from the dolomite ME sensor is employed to generate the corresponding EMR signal spectrum diagram at different stages. Additionally, by comparing Figure 9b, c, it is observed that the frequency of the dolomite compression EMR signal is mainly concentrated within 20 kHz, while the frequency of the ME signal is primarily concentrated within 10 kHz. The amplitude intensity of the EMR signal gradually increases with the loading process. From elastic deformation to plastic deformation and, finally, into the post-failure stage, the frequency distribution of the dolomite EMR signal becomes increasingly concentrated around 2 kHz.

6. Discussion and Conclusions

6.1. Discussion

In the pursuit of understanding the ME and EMR signal characteristics stemming from the compression rupture of sandstone specimens, uniaxial compression tests were conducted utilizing the RMT-150C rock mechanics testing machine, coupled with ME sensors, strain gauges, and EMR antennas. The ensuing analysis delved into the distinct features of EMR and ME signals generated during the static failure of dolomite under compressive stress, unraveling the intricate coupling processes between them. Additionally, the test data laid the foundation for a comprehensive coupling analysis of ME and EMR generated by sources in different directions within the surrounding rock.
While the current work holds notable practical significance in the realm of damage and collapse prediction for rock masses, it is not without inherent limitations. The orientation of bedding planes within the rock mass emerges as a significant factor influencing plastic deformation characteristics and failure patterns [32,33]. Furthermore, the establishment of specific yield criteria, tailored to the in situ state of stresses in rock beds, is imperative for a more nuanced analysis of complex failures [34,35]. These aspects, acknowledging their importance, are slated for incorporation by the authors in future studies.

6.2. Conclusions

Through a comprehensive uniaxial compression test, this study meticulously analyzes the characteristics of electromagnetic radiation (EMR) and micro-seismic (ME) signals generated during the compression failure of sandstone under static loads, as well as the intricate coupling processes between them. The following conclusions have been drawn.
Upon the application of pressure, as it propagates to the free surface of the rock sample, fractures emerge, gradually expanding into larger cracks. Notably, during the stage of fracture expansion, abnormal EMR signals manifest, confirming the production of EMR signals during rock breakage. It is observed that these EMR signals generally exhibit low amplitudes. As the impact stress diminishes, the EMR signals recede, affirming that low-frequency EMR results from charge movements on the surface of fractured rock fragments [36]. The time synchronization between the EMR signal and the ME signal, coupled with their high similarity in the frequency domain, underscores the homology between EMR generated during rock failure and ME. In conditions marked by small ME and subsequent small ME ruptures, an early warning precursor signal emerges before the main rupture signal. In the context of coal mining, where major disasters like water, fire, gas, dust, and roof instability are encountered, the link between water, gas, and roof disasters with the fracture and slip instability of rock strata is crucial during the mining process. Proposing the main fracture precursor signal of EMR for coal and rock mass as an early warning signal holds significant engineering relevance for the monitoring and early warning of dynamic disasters in coal and rock masses [37].

Author Contributions

Conceptualization, Q.L.; methodology, B.A.; investigation, L.H.; writing—original draft preparation, L.H.; writing—review and editing, Q.L.; supervision, B.A.; validation, Q.L.; formal analysis, L.H. All authors have read and agreed to the published version of the manuscript.

Funding

This research was funded by the National Natural Science Foundation of China (grant No. 52274117).

Institutional Review Board Statement

Not applicable.

Informed Consent Statement

Not applicable.

Data Availability Statement

The data presented in this study are available on request from the corresponding author.

Acknowledgments

The authors wish to acknowledge the support they received. The reviewers are gratefully acknowledged for their valuable comments on the manuscript.

Conflicts of Interest

The authors declare no conflict of interest.

References

  1. He, H.; Dou, L.M.; Gong, S.Y.; He, J.; Zheng, Y.L.; Zhang, X. ME and electromagnetic coupling method for coal bump risk assessment based on dynamic static energy principles. Saf. Sci. 2019, 114, 30–39. [Google Scholar] [CrossRef]
  2. Qi, F.Z.; Yang, D.W.; Li, B.; Ma, Z.G.; Qi, F.Z.; Wang, Z.L.; Ma, W.X. Stability control mechanism of high-stress roadway surrounding rock by roof fracturing and rock mass filling. Adv. Civ. Eng. 2021, 2021, 6658317. [Google Scholar] [CrossRef]
  3. Ge, M.C. Efficient mine ME monitoring. Int. J. Coal Geol. 2005, 64, 44–56. [Google Scholar] [CrossRef]
  4. Qiu, L.M.; Zhu, Y.; Song, D.Z.; He, X.Q.; Wang, W.X.; Liu, Y.; Xiao, Y.Z.; Wei, M.H.; Yin, S.; Liu, Q. Study on the Nonlinear Characteristics of EMR and AE during Coal Splitting Tests. Minerals 2022, 12, 108. [Google Scholar] [CrossRef]
  5. Sharma, S.K.; Chauhan, V.S.; Sinapius, M. A review on deformation-induced electromagnetic radiation detection: History and current status of the technique. J. Mater. Sci. 2021, 56, 4500–4551. [Google Scholar] [CrossRef]
  6. Lin, P.; Wei, P.C.; Wang, C.; Kang, S.Z.; Wang, X. Effect of rock mechanical properties on electromagnetic radiation mechanism of rock fracturing. J. Rock. Mech. Geotech. 2021, 13, 798–810. [Google Scholar] [CrossRef]
  7. Ogawa, T.; Oike, K. Electromagnetic radiation from rocks. J. Geophys. Res.-Atmos. 1985, 90, 6245–6249. [Google Scholar] [CrossRef]
  8. Cress, G.O.; Brady, B.T.; Rowell, G.A. Sources of electromagnetic radiation from fracture of rock samples in the laboratory. Geophys. Res. Lett. 2013, 14, 331–334. [Google Scholar] [CrossRef]
  9. Mastrogiannis, D.; Antsygina, T.N.; Chishko, K.A.; Mavromatou, C.; Hadjicontis, V. Relationship between electromagnetic and acoustic emissions in deformed piezoelectric media: Microcracking signals. Int. J. Solids Struct. 2015, 56–57, 118–125. [Google Scholar] [CrossRef]
  10. Li, X.; Li, H.; Yang, Z.; Li, H.; Zuo, H.; Wang, X.; Li, H. Stress-Electromagnetic Radiation (EMR) Numerical Model and EMR Evolution Law of Composite Coal-Rock under Load. ACS Omega 2022, 7, 40399–40418. [Google Scholar] [CrossRef]
  11. He, X.Q.; Zhao, Y.J.; Liu, Y.; Song, D.Z.; Qiu, L.M.; Wei, M.H.; Yin, S.; Guo, L. Research on vector characteristics and applications of electromagnetic radiation induced by rock failure. Meas Sci Technol. 2022, 47, 3654–3667. [Google Scholar]
  12. Li, H.R.; Qiao, Y.F.; Shen, R.X.; He, M.C. Electromagnetic radiation signal monitoring and multi-fractal analysis during uniaxial compression of water-bearing sandstone. Measurement 2023, 34(4), 111245. [Google Scholar] [CrossRef]
  13. Di, Y.Y.; Wang, E.Y.; Li, Z.H.; Liu, X.F.; Huang, T.; Yao, J.J. Comprehensive early warning method of microseismic, acoustic emission, and electromagnetic radiation signals of rock burst based on deep learning. Int. J. Rock Mech. Min. 2023, 170, 105519. [Google Scholar] [CrossRef]
  14. Feng, X.; Hu, Q.; Ding, Z.; Wang, D.; Zhao, X.; Wei, Q. Crack Propagation and AE/EMR Response Characteristics of Pre-Holed Coal Specimens under Uniaxial Compression. Sustainability 2022, 14, 15196. [Google Scholar] [CrossRef]
  15. Nan, L.; Ge, M.C.; Wang, E.Y. Two types of multiple solutions for microseismic source location based on arrival-time-difference approach. Nat. Hazards. 2014, 73, 829–847. [Google Scholar]
  16. Ai, D.; Li, C.; Zhao, Y.; Li, G. Investigation on micro-seismic, electromagnetic radiation and crack propagation characteristics of coal under static loading. Rock. Soil. Mech. 2020, 41, 2043–2051. [Google Scholar]
  17. Ge, M.C. Source location error analysis and optimization methods. J. Rock Mech. Geotech. 2012, 4, 1–10. [Google Scholar] [CrossRef]
  18. Li, X.L.; Chen, S.J.; Wang, E.Y.; Li, Z.H. Rock burst mechanism in coal rock with structural surface and the ME (MS) and electromagnetic radiation (EMR) response. Eng. Fail. Anal. 2021, 124, 105396. [Google Scholar] [CrossRef]
  19. Chen, J.; Yu, S.; Wei, W.; Ma, Y. Matrix-based method for solving decision domains of neighbourhood multigranulation decision-theoretic rough sets. Caai T Intell. Technol. 2022, 7, 313–327. [Google Scholar] [CrossRef]
  20. Du, H.; Du, S.; Li, W. Probabilistic time series forecasting with deep non-linear state space models. Caai T Intell. Techno. 2023, 8, 3–13. [Google Scholar] [CrossRef]
  21. Zhao, Y.L.; Zhang, C.S.; Wang, Y.X.; Lin, H. Shear-related roughness classification and strength model of natural rock joint based on fuzzy comprehensive evaluation. Int. J. Rock. Mech. Min. Sci. 2021, 137, 104550. [Google Scholar] [CrossRef]
  22. Ren, S.; Zhao, Y.; Liao, J.; Liu, Q.; Li, Y. Lugeon Test and Grouting Application Research Based on RQD of Grouting Sections. Sustainability 2022, 14, 12748. [Google Scholar] [CrossRef]
  23. Hu, X.H.; Kuang, Q.H.; Cai, Q.H.; Xue, Y.; Zhou, W.X.; Li, Y. A Coherent Pattern Mining Algorithm Based on All Contiguous Column Bicluster. J. Artif. Intell. Technol. 2022, 2, 80–92. [Google Scholar] [CrossRef]
  24. Zhao, H.M.; Ma, L.W. Several rough set models in quotient space. Caai T Intell. Technol. 2022, 7, 69–80. [Google Scholar] [CrossRef]
  25. Hsiao, I.H.; Chung, C.Y. AI-infused semantic model to enrich and expand programming question generation. J. Artif. Intell. Technol. 2022, 2, 47–54. [Google Scholar] [CrossRef]
  26. Zhang, Z.; De Luca, G.; Archambault, B.; Chavez, J.; Rice, B. Traffic Dataset and Dynamic Routing Algorithm in Traffic Simulation. J. Artif. Intell. Technol. 2022, 2, 111–122. [Google Scholar] [CrossRef]
  27. Lou, Q.; Song, D.Z.; He, X.Q.; Li, Z.L.; Qiu, L.M.; Wei, M.H.; He, S.Q. Correlations between acoustic and electromagnetic emissions and stress drop induced by burst-prone coal and rock fracture. Safety Sci. 2019, 115, 310–319. [Google Scholar] [CrossRef]
  28. Fan, X.; Chen, R.; Lin, H.; Lai, H.P.; Zhang, C.Y.; Zhao, Q.H. Cracking and failure in rock specimen containing combined flaw and hole under uniaxial compression. Adv. Civ. Eng. 2018, 2018, 9818250. [Google Scholar] [CrossRef]
  29. Song, X.; Li, X.; Li, Z.; Zhang, Z.; Cheng, F.; Chen, P.; Liu, Y. Study on the charac-teristics of coal rock electromagnetic radiation (EMR) and the main influencing factors. J. Appl. Geophys. 2018, 148, 216–225. [Google Scholar] [CrossRef]
  30. Tian, X.H.; Song, D.Z.; He, X.Q.; Khan, M.; Li, Z.L.; Qiu, L.M.; Liu, X.F. On the characterization and correlation of the rock failure-induced electromagnetic radiation and micro-vibration. Eng. Geol. 2022, 311, 106879. [Google Scholar] [CrossRef]
  31. Liu, Y.; He, K.; Chen, G.; Leow, W.R.; Chen, X. Nature-inspired structural materials for flexible electronic devices. Chem. Rev. 2017, 117, 12893–12941. [Google Scholar] [CrossRef]
  32. Wu, C.Z.; Chen, Q.; Basack, S.; Xu, R.Q.; Shi, R.M. Biaxial creep test study on the influence of structural anisotropy on rheological behaviour of hard rock. J. Mater. Civil. Eng. 2016, 28, 04016104. [Google Scholar] [CrossRef]
  33. Wu, Z.; Chen, Q.; Basack, S.; Karekal, S. Laboratory investigation on rheological properties of greenschist considering anisotropy under multi-stage compressive creep condition. J. Struct. Geol. 2018, 114, 111–120. [Google Scholar] [CrossRef]
  34. Duan, G.; Li, J.; Zhang, J.; Assefa, E.; Sun, X. Mechanical properties and failure modes of rock specimens with specific joint geometries in triaxial unloading compressive test. Adv. Mater. Sci. Eng. 2019, 2019, 1–14. [Google Scholar] [CrossRef]
  35. Tang, L.; Wang, Y.; Sun, Y.; Chen, Y.; Zhao, Z. A Review on the failure modes of rock and soil mass under compression and the exploration about constitutive equations of rock and soil mass. Adv. Civ. Eng. 2022, 2022, 1–13. [Google Scholar] [CrossRef]
  36. Nardi, A.; Caputo, M. Monitoring the mechanical stress of rocks through the electromagnetic emission produced by fracturing. Int. J. Rock Mech. Min. 2009, 46, 940–945. [Google Scholar] [CrossRef]
  37. Di, Y.Y.; Wang, E.Y. Rock burst precursor electromagnetic radiation signal recognition method and early warning application based on recurrent neural networks. Rock Mech. Rock Eng. 2021, 54, 1449–1461. [Google Scholar] [CrossRef]
Figure 1. Schematic diagram of the test equipment.
Applsci 13 12910 g001
Figure 2. Specimen fracture diagram. (a) J-1; (b) J-2; (c) J-3; (d) J-4.
Applsci 13 12910 g002
Figure 3. Full stress–strain curve of dolomite.
Applsci 13 12910 g003
Figure 4. Wavelet decomposition and reconstruction of the EMR signal of the J-3 specimen before noise reduction. ((a5) is the fifth layer decomposition low-frequency coefficient; (d5) is the fifth layer decomposition high-frequency coefficient; (d4) is the fourth layer decomposition high-frequency coefficient; (d3) is the third layer decomposition high-frequency coefficient; (d2) is the second layer decomposition high-frequency coefficient; (d1) is the first layer decomposition high-frequency coefficient).
Applsci 13 12910 g004
Figure 5. EMR waveform and ME waveform of the four groups of specimens. (a) J-1; (b) J-2; (c) J-3; (d) J-4.
Applsci 13 12910 g005aApplsci 13 12910 g005b
Figure 6. EMR and ME signal time domain diagram of the four groups of specimens after noise reduction. (a) J-1; (b) J-2; (c) J-3; (d) J-4.
Applsci 13 12910 g006
Figure 7. EMR and ME spectra of the four groups of specimens (1000 Hz~30,000 Hz). (a) J-1; (b) J-2; (c) J-3; (d) J-4.
Applsci 13 12910 g007aApplsci 13 12910 g007b
Figure 8. Comparison of the monitoring results of the EMR, ME, and AE of the J-4 specimen.
Applsci 13 12910 g008
Figure 9. Comparison of each stage and signal spectrum corresponding to the failure process of the J-4 specimen. (a) The corresponding stages of the whole process of failure of the J-4 specimen under load; (b) EMR signal spectrum corresponding to each stage of the J-4 specimen; (c) ME signal spectrum corresponding to each stage of the J-4 specimen.
Applsci 13 12910 g009aApplsci 13 12910 g009b
Disclaimer/Publisher’s Note: The statements, opinions and data contained in all publications are solely those of the individual author(s) and contributor(s) and not of MDPI and/or the editor(s). MDPI and/or the editor(s) disclaim responsibility for any injury to people or property resulting from any ideas, methods, instructions or products referred to in the content.

