
User Experience of Older People While Using Digital Health Technologies: A Systematic Review

 and
and 
Abstract
:1. Introduction
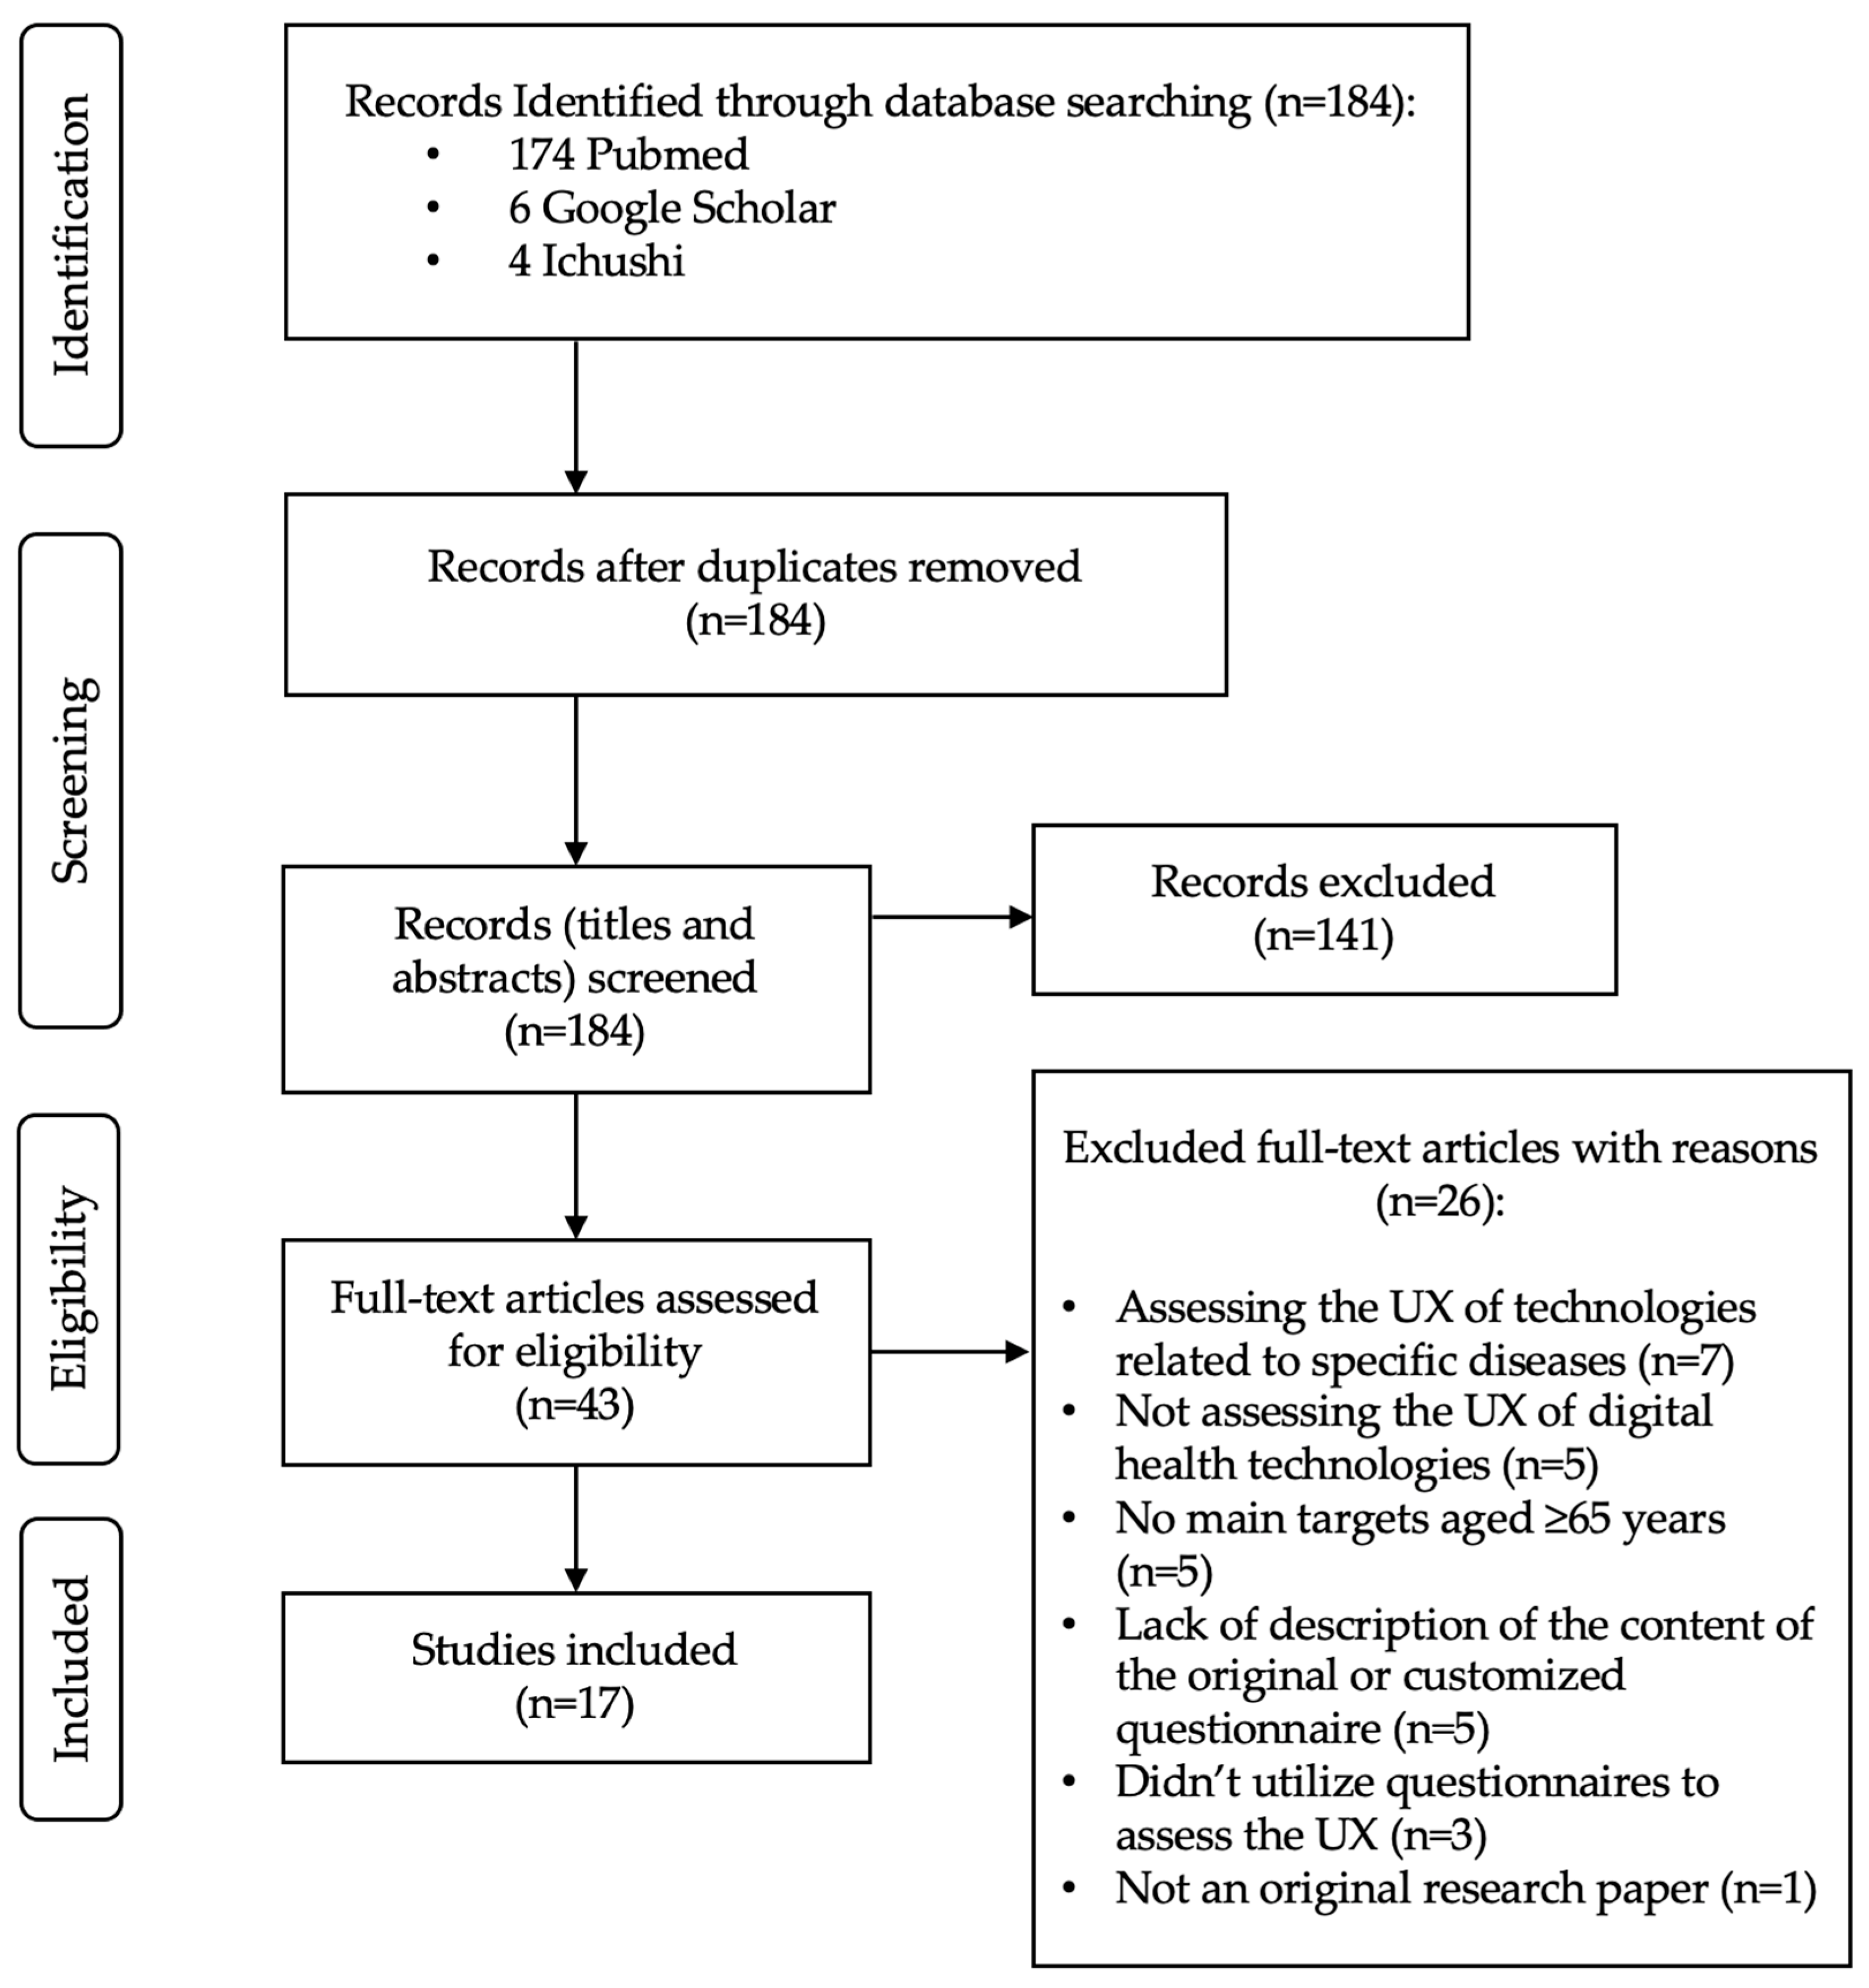
2. Materials and Methods
3. Results
4. Discussion
Author Contributions
Funding
Data Availability Statement
Conflicts of Interest
References
- Kim, J.; Campbell, A.S.; de Ávila, B.E.; Wang, J. Wearable biosensors for healthcare monitoring. Nat. Biotechnol. 2019, 37, 389–406. [Google Scholar] [CrossRef] [PubMed]
- Sharma, A.; Badea, M.; Tiwari, S.; Marty, J.L. Wearable Biosensors: An Alternative and Practical Approach in Healthcare and Disease Monitoring. Molecules 2021, 26, 748. [Google Scholar] [CrossRef] [PubMed]
- Almalki, M.; Giannicchi, A. Health Apps for Combating COVID-19: Descriptive Review and Taxonomy. JMIR Mhealth Uhealth 2021, 9, e24322. [Google Scholar] [CrossRef] [PubMed]
- Connolly, S.L.; Kuhn, E.; Possemato, K.; Torous, J. Digital Clinics and Mobile Technology Implementation for Mental Health Care. Curr. Psychiatry Rep. 2021, 23, 38. [Google Scholar] [CrossRef] [PubMed]
- Haleem, A.; Javaid, M.; Singh, R.P.; Suman, R. Telemedicine for healthcare: Capabilities, features, barriers, and applications. Sens. Int. 2021, 2, 100117. [Google Scholar] [CrossRef] [PubMed]
- McKay, F.H.; Cheng, C.; Wright, A.; Shill, J.; Stephens, H.; Uccellini, M. Evaluating mobile phone applications for health behaviour change: A systematic review. J. Telemed. Telecare 2018, 24, 22–30. [Google Scholar] [CrossRef] [PubMed]
- Booth, F.; Potts, C.; Bond, R.; Mulvenna, M.; Kostenius, C.; Dhanapala, I.; Vakaloudis, A.; Cahill, B.; Kuosmanen, L.; Ennis, E. A Mental Health and Well-Being Chatbot: User Event Log Analysis. JMIR Mhealth Uhealth 2023, 11, e43052. [Google Scholar] [CrossRef]
- Tudor Car, L.; Dhinagaran, D.A.; Kyaw, B.M.; Kowatsch, T.; Joty, S.; Theng, Y.L.; Atun, R. Conversational Agents in Health Care: Scoping Review and Conceptual Analysis. J. Med. Internet Res. 2020, 22, e17158. [Google Scholar] [CrossRef]
- Chhabra, H.S.; Sharma, S.; Verma, S. Smartphone app in self-management of chronic low back pain: A randomized controlled trial. Eur. Spine J. 2018, 27, 2862–2874. [Google Scholar] [CrossRef]
- Hoffmann, M.; Stengel, S.; Szecsenyi, J.; Peters-Klimm, F. Health care professionals’ perspectives on the utilisation of a remote surveillance and care tool for patients with COVID-19 in general practice: A qualitative study. BMC Prim. Care 2022, 23, 254. [Google Scholar] [CrossRef]
- Omboni, S.; Caserini, M.; Coronetti, C. Telemedicine and M-Health in Hypertension Management: Technologies, Applications and Clinical Evidence. High Blood Press. Cardiovasc. Prev. 2016, 23, 187–196. [Google Scholar] [CrossRef] [PubMed]
- Owens, A.P.; Krebs, C.; Kuruppu, S.; Brem, A.K.; Kowatsch, T.; Aarsland, D.; Klöppel, S. Broadened assessments, health education and cognitive aids in the remote memory clinic. Front. Public Health 2022, 10, 1033515. [Google Scholar] [CrossRef] [PubMed]
- Trenfield, S.J.; Awad, A.; McCoubrey, L.E.; Elbadawi, M.; Goyanes, A.; Gaisford, S.; Basit, A.W. Advancing pharmacy and healthcare with virtual digital technologies. Adv. Drug Deliv. Rev. 2022, 182, 114098. [Google Scholar] [CrossRef] [PubMed]
- Sanchez-Martinez, S.; Camara, O.; Piella, G.; Cikes, M.; González-Ballester, M.; Miron, M.; Vellido, A.; Gómez, E.; Fraser, A.G.; Bijnens, B. Machine Learning for Clinical Decision-Making: Challenges and Opportunities in Cardiovascular Imaging. Front. Cardiovasc. Med. 2021, 8, 765693. [Google Scholar] [CrossRef] [PubMed]
- Tack, C. Artificial intelligence and machine learning | applications in musculoskeletal physiotherapy. Musculoskelet. Sci. Pract. 2019, 39, 164–169. [Google Scholar] [CrossRef]
- Zhao, R.; Zhao, X.; Guan, J.; Zhang, C.; Zhu, K. The effect of virtual reality technology on anti-fall ability and bone mineral density of the elderly with osteoporosis in an elderly care institution. Eur. J. Med. Res. 2023, 28, 204. [Google Scholar] [CrossRef]
- Quay, C.; Ramakrishnan, A. Innovative Use of Virtual Reality to Facilitate Empathy Toward Older Adults in Nursing Education. Nurs. Educ. Perspect. 2023, 44, 300–302. [Google Scholar] [CrossRef]
- Lewis, J.B. In older adults with frailty, virtual reality exercise training improves walking speed and balance. Ann. Intern. Med. 2023, 176, Jc106. [Google Scholar] [CrossRef]
- Lee, Y.H.; Lin, C.H.; Wu, W.R.; Chiu, H.Y.; Huang, H.C. Virtual reality exercise programs ameliorate frailty and fall risks in older adults: A meta-analysis. J. Am. Geriatr. Soc. 2023, 71, 2946–2955. [Google Scholar] [CrossRef]
- Palumbo, A. Microsoft HoloLens 2 in Medical and Healthcare Context: State of the Art and Future Prospects. Sensors 2022, 22, 7709. [Google Scholar] [CrossRef]
- Piatkowski, M.; Taylor, E.; Wong, B.; Taylor, D.; Foreman, K.B.; Merryweather, A. Designing a Patient Room as a Fall Protection Strategy: The Perspectives of Healthcare Design Experts. Int. J. Environ. Res. Public Health 2021, 18, 8769. [Google Scholar] [CrossRef] [PubMed]
- Bond, R.; Peace, A. Towards a digital health future. Eur. Heart J. Digit. Health 2021, 2, 60–61. [Google Scholar] [CrossRef] [PubMed]
- Janett, R.S.; Yeracaris, P.P. Electronic Medical Records in the American Health System: Challenges and lessons learned. Cien. Saude Colet. 2020, 25, 1293–1304. [Google Scholar] [CrossRef] [PubMed]
- Kataria, S.; Ravindran, V. Electronic health records: A critical appraisal of strengths and limitations. J. R. Coll. Physicians Edinb. 2020, 50, 262–268. [Google Scholar] [CrossRef] [PubMed]
- Caban, J.J.; Gotz, D. Visual analytics in healthcare—Opportunities and research challenges. J. Am. Med. Inform. Assoc. 2015, 22, 260–262. [Google Scholar] [CrossRef] [PubMed]
- Ha, L.; Sikora, A. Clinician-Designed Dashboards. Hosp. Pharm. 2023, 58, 225–226. [Google Scholar] [CrossRef] [PubMed]
- Siette, J.; Dodds, L.; Sharifi, F.; Nguyen, A.; Baysari, M.; Seaman, K.; Raban, M.; Wabe, N.; Westbrook, J. Usability and Acceptability of Clinical Dashboards in Aged Care: Systematic Review. JMIR Aging 2023, 6, e42274. [Google Scholar] [CrossRef]
- Simpao, A.F.; Ahumada, L.M.; Gálvez, J.A.; Rehman, M.A. A review of analytics and clinical informatics in health care. J. Med. Syst. 2014, 38, 45. [Google Scholar] [CrossRef]
- Maharani, A.; Pendleton, N.; Leroi, I. Hearing impairment, loneliness, social isolation, and cognitive function: Longitudinal analysis using English Longitudinal Study on Ageing. Am. J. Geriatr. Psychiatry 2019, 27, 1348–1356. [Google Scholar] [CrossRef]
- ISO 9241-210:2010(en); Ergonomics of Human-System Interaction—Part 210: Human-Centred Design for Interactive Systems. Online Browsing Platform (OBP): London, UK, 2010. Available online: https://www.iso.org/obp/ui/#iso:std:iso:9241:-210:ed-1:v1:en (accessed on 10 July 2023).
- Maqbool, B.; Herold, S. Potential effectiveness and efficiency issues in usability evaluation within digital health: A systematic literature review. J. Syst. Softw. 2024, 208, 111881. [Google Scholar] [CrossRef]
- Brink, H. Validity and reliability in qualitative research. Curationis 1993, 16, 35–38. [Google Scholar] [CrossRef] [PubMed]
- Moher, D.; Liberati, A.; Tetzlaff, J.; Altman, D.G. Preferred reporting items for systematic reviews and meta-analyses: The PRISMA statement. Int. J. Surg. 2010, 8, 336–341. [Google Scholar] [CrossRef] [PubMed]
- Bakogiannis, C.; Tsarouchas, A.; Mouselimis, D.; Lazaridis, C.; Theofillogianakos, E.K.; Billis, A.; Tzikas, S.; Fragakis, N.; Bamidis, P.D.; Papadopoulos, C.E.; et al. A patient-oriented app (ThessHF) to improve self-care quality in heart failure: From evidence-based design to pilot study. JMIR Mhealth Uhealth 2021, 9, e24271. [Google Scholar] [CrossRef] [PubMed]
- Bergquist, R.; Vereijken, B.; Mellone, S.; Corzani, M.; Helbostad, J.L.; Taraldsen, K. App-based self-administrable clinical tests of physical function: Development and usability study. JMIR Mhealth Uhealth 2020, 8, e16507. [Google Scholar] [CrossRef] [PubMed]
- Borda, A.; Gilbert, C.; Gray, K.; Prabhu, D. Consumer wearable information and health self management by older adults. Stud. Health Technol. Inform. 2018, 246, 42–61. [Google Scholar] [PubMed]
- Chen, M.; Tang, Q.; Xu, S.; Leng, P.; Pan, Z. Design and evaluation of an augmented reality-based exergame system to reduce fall risk in the elderly. Int. J. Environ. Res. Public Health 2020, 17, 7208. [Google Scholar] [CrossRef]
- Domingos, C.; Costa, P.; Santos, N.C.; Pêgo, J.M. Usability, acceptability, and satisfaction of a wearable activity tracker in older adults: Observational study in a real-life context in northern Portugal. J. Med. Internet Res. 2022, 24, e26652. [Google Scholar] [CrossRef]
- Doyle, J.; Murphy, E.; Gavin, S.; Pascale, A.; Deparis, S.; Tommasi, P.; Smith, S.; Hannigan, C.; Sillevis Smitt, M.; van Leeuwen, C.; et al. A digital platform to support self-management of multiple chronic conditions (ProACT): Findings in relation to engagement during a one-year proof-of-concept trial. J. Med. Internet Res. 2021, 23, e22672. [Google Scholar] [CrossRef]
- Huang, T.; Huang, C. Attitudes of the elderly living independently towards the use of robots to assist with activities of daily living. Work 2021, 69, 55–65. [Google Scholar] [CrossRef]
- Lee, E.; Han, S.; Jo, S.H. Consumer choice of on-demand mHealth app services: Context and contents values using structural equation modeling. Int. J. Med. Inform. 2017, 97, 229–238. [Google Scholar] [CrossRef]
- Macis, S.; Loi, D.; Ulgheri, A.; Pani, D.; Solinas, G.; Manna, S.; Cestone, V.; Guerri, D.; Raffo, L. Design and usability assessment of a multi-device SOA-based telecare framework for the elderly. IEEE J. Biomed. Health Inform. 2020, 24, 268–279. [Google Scholar] [CrossRef] [PubMed]
- Moyle, W.; Pu, L.; Murfield, J.; Sung, B.; Sriram, D.; Liddle, J.; Estai, M.; Lion, K. Consumer and provider perspectives on technologies used within aged care: An Australian qualitative needs assessment survey. J. Appl. Gerontol. 2022, 41, 2557–2565. [Google Scholar] [CrossRef] [PubMed]
- Pérez-Rodríguez, R.; Moreno-Sánchez, P.A.; Valdés-Aragonés, M.; Oviedo-Briones, M.; Divan, S.; García-Grossocordón, N.; Rodríguez-Mañas, L. FriWalk robotic walker: Usability, acceptance and UX evaluation after a pilot study in a real environment. Disabil. Rehabil. Assist. Technol. 2020, 15, 718–727. [Google Scholar] [CrossRef] [PubMed]
- Pérez-Rodríguez, R.; Villalba-Mora, E.; Valdés-Aragonés, M.; Ferre, X.; Moral, C.; Mas-Romero, M.; Abizanda-Soler, P.; Rodríguez-Mañas, L. Usability, user experience, and acceptance evaluation of CAPACITY: A technological ecosystem for remote follow-up of frailty. Sensors 2021, 21, 6458. [Google Scholar] [CrossRef] [PubMed]
- Salatino, C.; Andrich, R.; Converti, R.M.; Saruggia, M. An observational study of powered wheelchair provision in Italy. Assist. Technol. 2016, 28, 41–52. [Google Scholar] [CrossRef]
- Schmidt, L.I.; Jansen, C.P.; Depenbusch, J.; Gabrian, M.; Sieverding, M.; Wahl, H.W. Using wearables to promote physical activity in old age: Feasibility, benefits, and user friendliness. Z. Gerontol. Geriatr. 2022, 55, 388–393. [Google Scholar] [CrossRef]
- Stara, V.; Harte, R.; Di Rosa, M.; Glynn, L.; Casey, M.; Hayes, P.; Rossi, L.; Mirelman, A.; Baker, P.M.A.; Quinlan, L.R.; et al. Does culture affect usability? A trans-European usability and user experience assessment of a falls-risk connected health system following a user-centred design methodology carried out in a single European country. Maturitas 2018, 114, 22–26. [Google Scholar] [CrossRef]
- Sun, R.; Aldunate, R.G.; Paramathayalan, V.R.; Ratnam, R.; Jain, S.; Morrow, D.G.; Sosnoff, J.J. Preliminary evaluation of a self-guided fall risk assessment tool for older adults. Arch. Gerontol. Geriatr. 2019, 82, 94–99. [Google Scholar] [CrossRef]
- Van Velsen, L.; Frazer, S.; N’Dja, A.; Ammour, N.; Del Signore, S.; Zia, G.; Hermens, H. The reliability of using tablet technology for screening the health of older adults. Stud. Health Technol. Inform. 2018, 247, 651–655. [Google Scholar]
- Brooke, J. SUS: A quick and dirty usability scale. In Usability Evaluation in Industry; Jordan, P.W., Ed.; Taylor & Francis: London, UK, 1996; pp. 189–194. [Google Scholar]
- Bangor, A.; Kortum, P.; Miller, J. Determining what individual SUS scores mean: Adding an adjective rating scale. J. Usability Stud. 2009, 4, 114–123. [Google Scholar]
- Bangor, A.; Kortum, P.T.; Miller, J.T. An empirical evaluation of the system usability scale. Int. J. Hum.–Comput. Int. 2008, 24, 574–594. [Google Scholar] [CrossRef]
- Laugwitz, B.; Held, T.; Schrepp, M. Construction and evaluation of a user experience questionnaire. In Proceedings of the Symposium of the Workgroup Human-Computer Interaction and Usability Engineering of the Austrian Computer Society, Graz, Austria, 20–21 November 2008. [Google Scholar]
- Schrepp, M. User Experience Questionnaire Handbook; User Experience Questionnaire: Weyhe, Germany, 2015. [Google Scholar] [CrossRef]
- Cuadros, J.; Serrano, V.; García-Zubía, J.; Hernandez-Jayo, U. Design and evaluation of a user experience questionnaire for remote labs. IEEE Access 2021, 9, 50222–50230. [Google Scholar] [CrossRef]
- Gao, M.; Kortum, P.; Oswald, F. Psychometric evaluation of the USE (usefulness, satisfaction, and ease of use) questionnaire for reliability and validity. Hum. Fac. Erg. Soc. Ann. 2018, 62, 1414–1418. [Google Scholar] [CrossRef]
- Lewis, J.R. Psychometric evaluation of the Post-Study System Usability Questionnaire: The PSSUQ. Hum. Fac. Erg. Soc. Ann. 1992, 2, 1259–1263. [Google Scholar] [CrossRef]
- Lewis, J.R. Psychometric evaluation of the PSSUQ using data from five years of usability studies. Int. J. Hum.–Comput. Int. 2002, 14, 463–488. [Google Scholar] [CrossRef]
- Demers, L.; Weiss-Lambrou, R.; Ska, B. The Quebec User Evaluation of Satisfaction with Assistive Technology (QUEST 2.0): An overview and recent progress. Technol. Disabil. 2002, 14, 101–105. [Google Scholar] [CrossRef]
- Gray, D.B.; Hollingsworth, H.H.; Stark, S.; Morgan, K.A. A subjective measure of environmental facilitators and barriers to participation for people with mobility limitations. Disabil. Rehabil. 2008, 30, 434–457. [Google Scholar] [CrossRef]
- Gray, D.B.; Hollingsworth, H.H.; Stark, S.L.; Morgan, K.A. Participation survey/mobility: Psychometric properties of a measure of participation for people with mobility impairments and limitations. Arch. Phys. Med. Rehabil. 2006, 87, 189–197. [Google Scholar] [CrossRef]
- Jutai, J.; Day, H. Psychosocial Impact of Assistive Devices Scale (PIADS). Technol. Disabil. 2002, 14, 107–111. [Google Scholar] [CrossRef]
- Day, H.; Jutai, J. Measuring the psychosocial impact of assistive devices: The PIADS. Can. J. Rehabil. 1996, 9, 159–168. [Google Scholar]
- Day, H.; Jutai, J.; Campbell, K.A. Development of a scale to measure the psychosocial impact of assistive devices: Lessons learned and the road ahead. Disabil. Rehabil. 2002, 24, 31–37. [Google Scholar] [CrossRef] [PubMed]
- Chiari, L.; Van Lummel, R.; Becker, C.; Pfeiffer, K.; Lindemann, U.; Zijlstra, W. Classification of the user’s needs, characteristics and scenarios—Update. In Report from the EU Project (6th Framework Program, IST Contract No. 045622) Sensing and Action to Support Mobility in Ambient Assisted Living; Crown Copyright: London, UK, 2009. [Google Scholar]
- Gil-Gómez, J.A.; Manzano-Hernández, P.; Albiol-Pérez, S.; Aula-Valero, C.; Gil-Gómez, H.; Lozano-Quilis, J.A. USEQ: A short questionnaire for satisfaction evaluation of virtual rehabilitation systems. Sensors 2017, 17, 1589. [Google Scholar] [CrossRef] [PubMed]
- Brooke, J. SUS: A retrospective. J. Usability Stud. 2013, 8, 29–40. [Google Scholar]
- Zviran, M.; Glezer, C.; Avni, I. User satisfaction from commercial web sites: The effect of design and use. Inform. Manag. 2006, 43, 157–178. [Google Scholar] [CrossRef]
- Blažica, B.; Lewis, J.R. A Slovene translation of the system usability scale: The SUS-SI. Int. J. Hum.–Comput. Int. 2015, 31, 112–117. [Google Scholar] [CrossRef]
- Davis, F.D. Perceived usefulness, perceived ease of use, and user acceptance of information technology. MIS Quart. 1989, 13, 319–340. [Google Scholar] [CrossRef]
- Heerink, M.; Kröse, B.; Evers, V.; Wielinga, B. Assessing acceptance of assistive social agent technology by older adults: The Almere model. Int. J. Soc. Robot. 2010, 2, 361–375. [Google Scholar] [CrossRef]
- Gobbens, R.; Assen, M.; Luijkx, K.; Wijnen-Sponselee, M.; Schols, J.M.G.A. The Tilburg Frailty Indicator: Psychometric properties. J. Am. Med. Dir. Assoc. 2010, 11, 344–355. [Google Scholar] [CrossRef]
- Sheth, J.N.; Newman, B.I.; Gross, B.L. Why we buy what we buy: A theory of consumption values. J. Bus. Res. 1991, 22, 159–170. [Google Scholar] [CrossRef]
- O’Keefe, G.J.; Sulanowski, B.K. More than just talk: Uses, gratifications, and the telephone. J. Mass Commun. Q. 1995, 72, 922–933. [Google Scholar] [CrossRef]
- Berry, L.L.; Seiders, K.; Grewal, D. Understanding service convenience. J. Mark. 2002, 66, 1–17. [Google Scholar] [CrossRef]
- Lee, E.; Han, S.; Chung, Y. Internet use of consumers aged 40 and over: Factors that influence full adoption. Soc. Behav. Pers. 2014, 42, 1563–1574. [Google Scholar] [CrossRef]
- Lee, E.; Han, S. Determinants of adoption of mobile health services. Online Inform. Rev. 2015, 39, 556–573. [Google Scholar] [CrossRef]
- Sekhon, M.; Cartwright, M.; Francis, J.J. Development of a theory-informed questionnaire to assess the acceptability of healthcare interventions. BMC Health Serv. Res. 2022, 22, 279. [Google Scholar] [CrossRef]


| Components | Description |
|---|---|
| User Interface | This is the front-end component accessible through web or mobile applications that allows users to interact with the digital health system. |
| Data Collection | This component includes various sensors and devices that collect health-related data, such as wearable fitness trackers, medical devices, and IoT sensors. |
| User Profile Management | It manages user accounts, preferences, and personal information securely. |
| Authentication and Authorization | Ensures secure access to the system by verifying user identities and granting appropriate permissions. |
| Health Data Storage | Stores the collected health data securely, often in compliance with healthcare data privacy regulations. |
| Data Analysis and Processing | This component processes and analyzes health data to derive insights, identify patterns, and provide personalized recommendations. |
| Telemedicine and Communication | Facilitates real-time communication between healthcare providers and users through video calls, chat, or other telehealth services. |
| Machine Learning Algorithms | Utilizes machine learning and AI algorithms for tasks like disease diagnosis, rick prediction, and treatment recommendation. |
| Electronic Health record (EHR) System | Stores and manages users’ electronic health records, including medical history, diagnoses, medications, and treatments. |
| Alerts and Notifications | Sends alerts, reminders, and notifications to users for medication, appointments, or other health-related activities. |
| Keywords | |||
|---|---|---|---|
| Digital health technology Digital health device | User needs User experience Quality of experience | Evaluation Assessment | Questionnaire Scale |
| Author | Year | Location | Subjects | Questionnaires | Digital Health Technology |
|---|---|---|---|---|---|
| Bakogiannis et al. [34] | 2021 | Greece | 14 patients with heart failure (mean age, 64.9 ± 9.7 years) | PSSUQ | mHealth app (the Hellenic Educational Self-case and Support Heart Failure app [ThessHF app]) |
| Bergquist et al. [35] | 2020 | Norway | 20 community-dwelling adults (mean age, 68.7 ± 5.2 years) | SUS UEQ | 3 smartphone app-based self-tests of physical function |
| Borda et al. [36] | 2018 | Australia | 96 older adults living independently (aged ≥55 years) | Customized questionnaire based on the TFI | Wearable device that collect health data such as heart rate, respiration rate, blood pressure, activity (steps, calories), sleep, mood, and diet |
| Chen et al. [37] | 2020 | China | 25 elders (mean age, 71.5 ± 4.1 years) | UEQ-S | AR-based exergame system to reduce fall risk |
| Domingos et al. [38] | 2022 | Portugal | 110 community-dwelling older adults (mean age, 68.4 ± 3.1 years) | Customized questionnaire based on the TAM SUS USEQ | Wearable activity tracker (Xiaomi Mi Band 2) |
| Doyle et al. [39] | 2021 | Ireland and Belgium | 120 older persons with multimorbidity (mean age, 74.2 ± 6.4 years) | SUS | Digital platform to Support Self-management of Multiple Chronic Conditions (ProACT) |
| Huang et al. [40] | 2021 | Taiwan | 29 older people living independently | Customized questionnaire based on the TAM and the Almere models | Buddy robot (emotional companion-type robot) |
| Lee et al. [41] | 2017 | South Korea | 313 adults aged >40 years | Original questionnaire based on the relevant literature | mHealth application |
| Macis et al. [42] | 2020 | Italy |
|
| Tele-social-care platform |
| Moyle et al. [43] | 2022 | Australia | 133 older adults aged ≥65 years | Customized questionnaire based on the TAM | Aged care technology |
| Pérez-Rodríguez et al. [44] | 2020 | Spain | 42 inpatients aged ≥45 years | SUS UEQ Customized questionnaire based on the TAM | FriWalk robotic walker |
| Pérez-Rodríguez et al. [45] | 2021 | Spain | 37 older adults (mean age, 82.1 ± 5.4 years) | SUS UEQ Customized questionnaire based on the TAM | Technological ecosystem for remote follow-up |
| Salatino et al. [46] | 2016 | Italy | 79 participants (including 25 aged 60–80 and 4 aged >80 years) | QUEST 2.0 PIADS FABS/M | Powered wheelchair |
| Schmidt et al. [47] | 2022 | Germany | 80 older adults (mean age, 67 ± 4 years) | TSQ-WT | Commercially available activity trackers (Fitbit) |
| Stara et al. [48] | 2018 | Ireland Italy Israel | 15 older adults (mean age, 70.0 ± 6.4 years) | QUEST SUS | WIISEL (Wirelenn Insole for Independent and Safe Elderly Living) system that monitor fall risk and to detect falls |
| Sun et al. [49] | 2019 | USA | 29 female participants (mean age, 77.5 ± 7.9 years) | SUS | Kinect camera-based self-initiated fall risk assessment tool |
| van Velsen et al. [50] | 2018 | Netherlands | 24 older people (mean age, 71.6 years; range, 62–87 years) | SUS | Tablet technology for screening for health |
| Questionnaire | Frequency n, (%) | Description of Questionnaire | Construct Validity | Criterion-Related Validity | Other Validities | Reliability | Manual | Benchmark |
|---|---|---|---|---|---|---|---|---|
| SUS [51] | 9 (52.9) | Developed by John Brooke in 1986. It assesses the usability of various products and services such as hardware, software, mobile devices, websites, and applications. It consists of a 10-item questionnaire on a 5-point Likert scale from “Strongly agree” to “Strongly disagree”. The scores range from 0 to 100, with scores >68 indicating good usability [51,52]. | Strong correlations among the selected items were reported, with absolute values of r ranging from 0.7 to 0.9 [51]. | Not verified | Bangor et al. [53] found significant concurrent validity with a single 7-point rating of user-friendliness (r = 0.806). | The reliability of SUS was at or just over 0.90 [53]. | (Calculator and guide) https://measuringu.com/product/suspack/, accessed on 10 July 2023. | A score > 68 would be considered above average and anything < 68 is below average. Grading scale: F, SUS score < 60; D, 60 ≤ score < 70; C: 70 ≤ score < 80; B: 80 ≤ score < 90; A: score ≥ 90 [52]. |
| UEQ [54] | 5 (29.4) | The UEQ uses 26 pairs of contrasting adjectives to evaluate six aspects—attractiveness, perspicuity, efficiency, dependability, stimulation, and novelty—with scales from –3 (most negative answer) to +3 (most positive answer) [54]. It includes a comprehensive analysis tool and benchmark data set, enabling insightful product quality assessment based on a wide range of user experience studies [55]. | According to a factor analysis, the responses to the questionnaire did not align with the initially designed structure [56]. | The high correlation between the UEQ dimensions and the SUS (r between 0.60 and 0.82, p < 0.0001) confirmed the validity of this questionnaire [57]. | Not verified | The reliability of the UEQ was confirmed with a high Cronbach’s alpha score of 0.98 [57]. | (Handbook) https://www.ueq-online.org/Material/Handbook.pdf, accessed on 10 July 2023. | General Benchmark Business Software Websites and Web services https://www.ueq-online.org, accessed on 10 July 2023. |
| PSSUQ Version 3 [58] | 2 (11.8) | PSSUQ Version 3, a 16-item tool on a 7-point Likert scale between “Strongly agree” and “Strongly disagree”, assesses user satisfaction with a website, software, or product post-study. Lower scores indicate better performance and satisfaction. It has three subscales: System Quality (SysQual), Information Quality (InfoQual), and Interface Quality (IntQual), each derived from the average scores of respective question sets [59]. | The factor analysis revealed that three factors accounted for 87% of the total variance [58]. | It showed a moderate correlation (r = 0.80) with other measures of user satisfaction [58]. | It has shown evidence of concurrent validity [58]. | The earliest versions of the PSSUQ demonstrated significant reliability across both the overall scale and its subscale. For Version 3, the reliability coefficients are as follows: Overall: 0.94, SysQual: 0.90, InfoQual: 0.91, IntQual: 0.83 [59]. | Not applicable | SYSUSE: 3.80 INFOQUAL: 3.02 INTERQUAL: 2.49 Overall: 2.28 https://uiuxtrend.com/pssuq-post-study-system-usability-questionnaire/, accessed on 10 July 2023. |
| QUEST 2.0 [60] | 2 (11.8) | It consists of 12 items evaluating user satisfaction with the product (8 items) and service delivery (4 items). Each item is posed as a satisfaction query (e.g., “How satisfied are you with the <questionnaire item> of your assistive device?” (e.g., “How satisfied are you with the ease of adjusting the parts of your assistive device?”) and uses a 5-point Likert scale from “not satisfied at all” to “very satisfied” [60]. | Not verified | Positive correlations were found between QUEST 2.0 and the three Psychosocial Impact of Assistive Devices Scale (PIADS) dimensions. They were fair to moderate for the Device and total QUEST (Pearson correlation coefficient (r between 0.34 to 0.45) and fair with Services (r between 0.27 to 0.30) [60]. | Not verified | The test-retest reliability, as assessed using the intraclass correlation coefficient, yielded values of 0.82, 0.82, and 0.91) [60]. | Not applicable | Not applicable |
| FABS/M [61] | 1 (5.9) | It examines how environmental factors affect the daily use of assistive devices, acting as facilitators or barriers. It is composed of 133 questions grouped into six domains: primary mobility device, home-built features, community-built environment and natural features, community destination access, community facilities access, and community support network [61]. | Assessment of construct validity was conducted [62]. | Not verified | Assessment of internal consistency, content validity, and face validity was conducted [62]. | The items encompassed within the community support network domains exhibit moderate infernal consistency, as reflected by a Cronbach’s alpha value ranging from 0.35 to 0.90. Test-retest reliability was demonstrated with Person’s r values ranging from 0.52 to 0.82 [61]. | Not applicable | Normative data for SCI and Stroke [61]. https://www.sralab.org/rehabilitation-measures/facilitators-and-barriers-survey-environmental-influences-participation-among-people-lower-limb, accessed on 10 July 2023. |
| PIADS [63] | 1 (5.9) | It comprises 26 items, exploring perceived ability (12 items), adaptability (6 items), and self-esteem (8 items). Each item is presented in the format “How has the device influenced your <item>” (e.g., “How has the device influenced your openness to new experiences?”) and is rated on a 7-point scale (−3 to +3), ranging from “decreased a lot/a lot worse” to “increased a lot/a lot better” [63]. | A positive correlation was found between the total score on PIADS and Pleasure and Dominance on Mehrabian and Russell’s PIADS, although the specific coefficient was not reported [64]. | Not verified | Not verified | The test–retest reliability over a 2-week interval was deemed adequate, with an intraclass correlation coefficient of 0.45 [65]. | https://www.sralab.org/rehabilitation-measures/psychosocial-impact-assistive-devices#osteoarthritis, accessed on 10 July 2023. | Not exist |
| TSQ-WT [66] | 1 (5.9) | It assesses user satisfaction with wearable technologies. It encompasses six dimensions that evaluate the benefits, usability, self-concept, privacy, loss of control, quality of life, and wearing comfort of a system. Each dimension contains five items rated on a 5-point Likert scale from 0 (“not at all”) to 4 (“fully agree”), with higher scores indicating more positive ratings [66]. | Unpublished | Unpublished | Unpublished | Unpublished | Unpublished | Unpublished |
| USEQ [67] | 1 (5.9) | It assesses user satisfaction, a component of usability, in virtual rehabilitation systems. Comprising six items rated on a 5-point Likert scale, scores range from 6 (“poor satisfaction”) to 30 (“excellent satisfaction”). The score is evaluated using the following classifications: poor (0–5), fair (5–10), good (10–15), very good (15–20), or excellent (20–25) [67]. | Not verified | Not verified | Not verified | The six items of the USEQ were significantly correlated, demonstrating good internal consistency with a Cronbach’s alpha coefficient of 0.716 [67]. | Not applicable | Not applicable |
Disclaimer/Publisher’s Note: The statements, opinions and data contained in all publications are solely those of the individual author(s) and contributor(s) and not of MDPI and/or the editor(s). MDPI and/or the editor(s) disclaim responsibility for any injury to people or property resulting from any ideas, methods, instructions or products referred to in the content. |
© 2023 by the authors. Licensee MDPI, Basel, Switzerland. This article is an open access article distributed under the terms and conditions of the Creative Commons Attribution (CC BY) license (https://creativecommons.org/licenses/by/4.0/).
Share and Cite
Takano, E.; Maruyama, H.; Takahashi, T.; Mori, K.; Nishiyori, K.; Morita, Y.; Fukuda, T.; Kondo, I.; Ishibashi, Y. User Experience of Older People While Using Digital Health Technologies: A Systematic Review. Appl. Sci. 2023, 13, 12815. https://doi.org/10.3390/app132312815
Takano E, Maruyama H, Takahashi T, Mori K, Nishiyori K, Morita Y, Fukuda T, Kondo I, Ishibashi Y. User Experience of Older People While Using Digital Health Technologies: A Systematic Review. Applied Sciences. 2023; 13(23):12815. https://doi.org/10.3390/app132312815
Chicago/Turabian StyleTakano, Eiko, Hisataka Maruyama, Tetsuta Takahashi, Kouki Mori, Kota Nishiyori, Yoshifumi Morita, Toshio Fukuda, Izumi Kondo, and Yutaka Ishibashi. 2023. "User Experience of Older People While Using Digital Health Technologies: A Systematic Review" Applied Sciences 13, no. 23: 12815. https://doi.org/10.3390/app132312815
APA StyleTakano, E., Maruyama, H., Takahashi, T., Mori, K., Nishiyori, K., Morita, Y., Fukuda, T., Kondo, I., & Ishibashi, Y. (2023). User Experience of Older People While Using Digital Health Technologies: A Systematic Review. Applied Sciences, 13(23), 12815. https://doi.org/10.3390/app132312815