Communication

A Dynamic Urban Mobility Index from Clustering of Vehicle Speeds in a Tourist-Heavy City

by
Marissa Liponhay
1,†,
Jesus Felix Valenzuela
1,*,†,
Michael Dorosan
2,†,
Damian Dailisan
3,† and
Christopher Monterola
1
1
Analytics, Computing and Complex Systems Laboratory, Asian Institute of Management, 123 Paseo de Roxas, Makati City 1229, Philippines
2
Health Services Research Centre, Singapore Health Services, 20 College Rd., Singapore 169856, Singapore
3
Computational Social Science, ETH Zürich, F Floor STD Building, Stampfenbachstrasse 48, 8092 Zürich, Switzerland
*
Author to whom correspondence should be addressed.
These authors contributed equally to this work.
Appl. Sci. 2023, 13(23), 12763; https://doi.org/10.3390/app132312763
Submission received: 3 November 2023 / Revised: 14 November 2023 / Accepted: 16 November 2023 / Published: 28 November 2023
(This article belongs to the Special Issue Smart City and Informatization)

Abstract

:
The rapid urbanization of cities often brings about complex mobility issues, such as traffic congestion that, when unplanned, results in decreased productivity and quality of life. While many cities have adopted smart city initiatives to capture and monitor mobility, applying these in a developing country context remains a challenge when infrastructure and high-resolution spatial and temporal data are lacking. In this work, we use GPS data obtained from probe vehicles (a mix of public and private transport vehicles) within the city of Baguio, The Philippines, to develop and propose the Zone-based Speed Index (ZSI), a mobility index based on the speed clusters observed in this city. The ZSI dynamically infers monthly speed thresholds to classify zones as fast or slow and successfully captures the decrease in vehicle mobility associated with the impact of typhoons and holidays. Thus, it can be used to characterize urban vehicle mobility with high (hourly) resolution. Insights from the use of our dynamic mobility index are useful in the development and optimization of transportation systems, in monitoring the ease of vehicle mobility, and in the performance assessment of smart city initiatives, which are much needed in tourism hotspots.

1. Introduction

Globalization and population growth have rapidly accelerated urban development, often without adequate planning, leading to unintended negative impacts on the environment, economy, and society [1,2,3]. Among the various consequences, issues related to mobility, such as traffic congestion and costs of driving, stand as a significant obstacle to the economic growth of developing nations, resulting in far-reaching social and economic ramifications [4,5,6,7,8]. For instance, one study in the United States revealed that the average driving costs per driver encompass both direct (such as purchase, maintenance, and fuel) and indirect costs (including wasted time, fuel, and carbon emissions from congestion). Surprisingly, the indirect costs were found to constitute a substantial portion, amounting to approximately one-third of the total cost of car ownership in the country [9]. Similarly, a survey study conducted in a developing city in Bangladesh [10] emphasized the socioeconomic impacts of traffic congestion in ports and industrial zones, highlighting its direct effects on stress levels. The study estimated a staggering daily economic loss of USD 2.01M, considering delayed costs, fuel loss, pollution, and the loss of vehicle operators. Furthermore, the study’s stress assessment, with an overall score of 3.23 ± 0.71 , indicated a significant impact on respondents across various sociodemographic groups.
Recognizing the challenges in transport stemming from rapid urbanization, many cities have embraced smart city initiatives, which have gained significant momentum since 2012 and peaked in 2018 [11]. The primary function of strategic smart city planning is to assist urban areas in achieving sustainable development objectives, addressing a variety of present and future difficulties and challenges in domains such as transportation, water management, waste disposal, energy, living conditions, and governance [11]. For this purpose, assessing the impact of smart city initiatives on quality of life across various levels and dimensions is crucial. Despite the lack of a universal definition for a smart city [12,13,14], six domains or subindices are generally considered to be a smart city index’s basic components. These are economy, environment, governance, living, mobility, and people [11,15,16]. Each domain or subindex entails a number of indicators to enable us to assess the performance of smart city initiatives [17,18], whose results are then used as a basis for the introduction of policy interventions, urban planning, and the better management of smart cities.
To address issues on mobility, including traffic congestion, several approaches have been taken, such as synergy of the transport system [19], traffic signal control [20], and predictive analytics [21], among many others. Additionally, extensive measures of a transport or mobility index have been proposed for different purposes under different perspectives, such as urban planning, environmental impact, traffic system performance monitoring, urban development, human mobility patterns in relation to work, and transport sustainability [22,23,24]. We note, however, that calculations of the mobility index require the availability of high-resolution and up-to-date spatial and temporal data from various indicators, such as travel cost, travel time, and road network, among others, which are not readily available in developing countries. Moreover, the growing digital divide, as noted by the United Nations, between highly urbanized and developing countries [25] is deemed to have contributed to the widening gap of applications of smart city initiatives—now primarily focusing on more developed regions. Consequently, the emphasis on smart city development has shifted from infrastructure build-up to the provision of smart city services, assuming the pre-existence of supporting infrastructure [26]. Thus, there is a gap in smart city studies and in the formulations and calculations of subindices in the developing regions where data collection is still in its beginning phases.
In regions with inadequate infrastructure and limited data availability but that are highly attractive destinations, such as tourist hotspots, traffic congestion challenges become even more pronounced. The interplay between transportation and tourism has been extensively studied [27,28]; however, little attention has been given to the costs (time cost and environmental pollution) of road transportation [29]. The highly fluctuating state of mobility, influenced by unpredictable fluctuations in tourist numbers, negatively impacts residents, tourists, and the surrounding environment. Additionally, increased traffic congestion contributes to a deteriorating public perception of the destination [30].
The advent of GPS trackers, which are sensors capable of location awareness, has significantly transformed the potential for gathering detailed information about human movements when compared with conventional methods like travel surveys, space–time diaries, or laborious interviews. The utilization of spatial and temporal data combined and collected from GPS trackers has been extensive and has proven valuable in examining various aspects of mobility, such as addressing contemporary mobile navigation applications [31], assessing urban transport [32,33], evaluating road network quality [34,35], and studying population transport [36], among other applications.
This paper aims to address the gap in the literature on smart city mobility subindex formulation in the context of developing nations, specifically focusing on regions with limited access to high-resolution data. Additionally, it seeks to contribute to data-driven analyses of vehicle mobility in a highly urbanized tourist hotspot by examining geolocated GPS traces of vehicles and developing a dynamic mobility index that measures the ease of vehicle transport within the city.

2. Materials and Methods
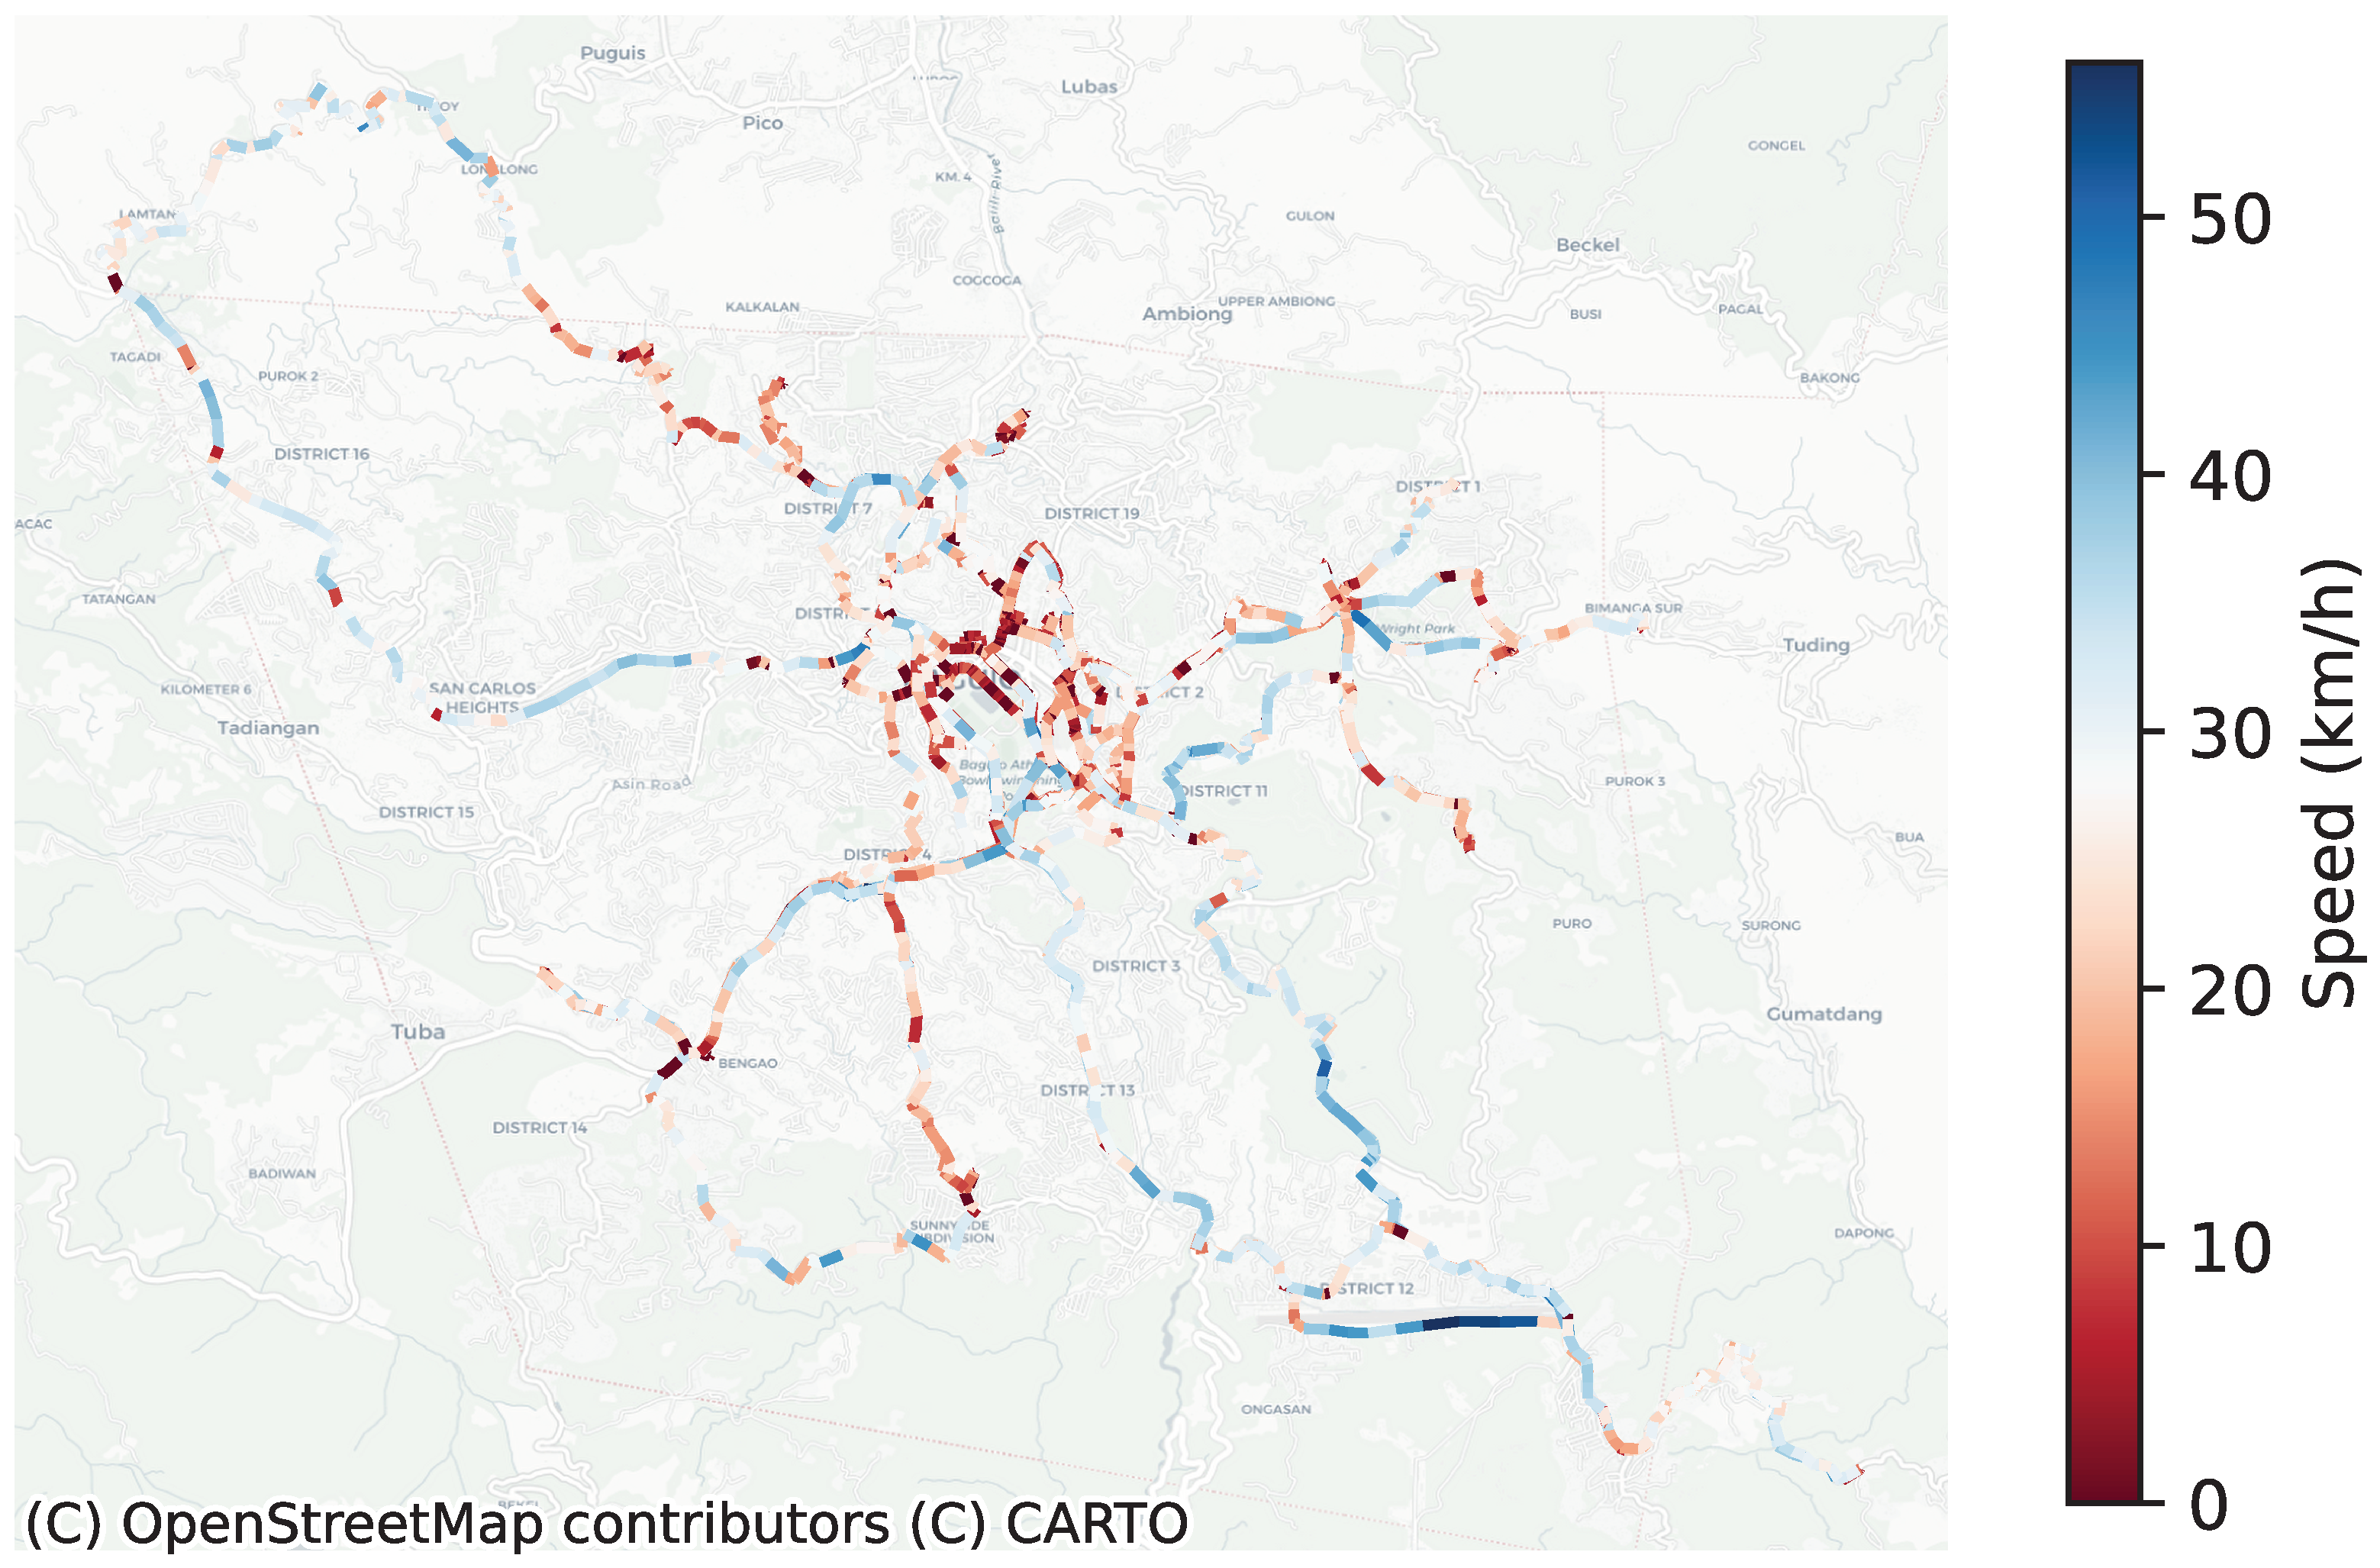
2.1. Study Location

Our study focuses on the city of Baguio, a highly urbanized city and a regional center for business, commerce, education, and government in the north of Luzon Island, The Philippines. The city sits within a plateau within the Cordillera mountain range; most of the city’s built-up area is on uneven, hilly terrain. The 2020 census put Baguio’s population at 366,358, and the city is also a popular tourist destination, owing to its cool climate. Its popularity as a tourist destination and its uneven terrain make it vulnerable to high congestion levels.
Figure 1 shows the political boundaries of Baguio and its city center. Economically, Baguio is classified as a “highly urbanized city”, corresponding to an annual revenue of PHP 2.18 billion (2023 USD 38 million).

2.2. GPS Dataset

Data were obtained from 500 GPS tracker units installed on a mix of vehicles in cooperation with city authorities. Table 1 lists the technical and operational specifications of the GPS trackers, while Table 2 lists the vehicles with installed trackers by type.
Public transportation within city limits is dominated by taxi services, which, due to the uneven terrain and resulting variations in road grade, commonly use sport utility vehicles seating up to four passengers. Taxi operators range from private individuals operating one or two units to companies that field more. As part of the collaboration with the local authorities, 399 taxi units were fitted with GPS trackers.
The next category consists of passenger jeepneys, with 61 vehicles fitted with GPS trackers. Analogous to minibuses in other countries, jeepneys are paratransit vehicles [37] that typically seat 12 to 22 passengers and are a common mode of public transport across The Philippines. Like taxi operators in the city, jeepney operators can be companies or private individuals. All operators of public transport vehicles, whether taxis or jeepneys, are required to register with the local government and receive a business permit to operate.
Finally, the remaining 40 GPS trackers were installed on vehicles owned by the local government (37 units) or by private volunteers (3 units). The 500 vehicles are thus used as probe vehicles for obtaining information on mobility conditions within the city.
The GPS data collection used in this study ran from October 2022 to July 2023. Collected data include coordinates in longitude and latitude, vehicle speed, time, and bearing; geolocation, speed, and time were extracted for further use.
Figure 2 shows a sample GPS trace from a randomly chosen vehicle (GPS tracker id: 869731050330141) on 17 July 2023, from 8 a.m. to 8 p.m. Notice that the vehicle exhibited a mix of slow speeds (red) and fast speeds (blue).

2.3. Mobility Index

We find that the vehicle speed distributions from the collected GPS data are bimodal, with a substantial peak at rest (0 km/h) and a subsidiary, nonzero peak. Motivated by this, we propose the Zone-based Speed Index (ZSI), a dynamic mobility index for a city. Given the partition of a city’s area into a set of nonoverlapping zones { z o n e 1 , z o n e 2 , } , the ZSI is calculated based on the classification of the zones as either “fast” or “slow”. Equation (1) gives the definition of the ZSI:
ZSI t = N f a s t t N s l o w t + N f a s t t ,
where N s l o w | f a s t t is the number of city zones classified as “slow (fast) zones” during time t (which may be instantaneous but in practice can be taken to be a time interval), and the denominator is the total number of zones for which speed data are available during t. The latter accounts for the fact that some zones may not have probe vehicles present within them during t and thus should be excluded from the calculation of the ZSI.
Classifying whether a city zone z o n e i is slow or fast relies on two speed distributions for that zone. The monthly speed distribution is used to calculate the speed threshold (which may thereby vary with month), while the distribution for one-hour time intervals within the same month is used to calculate average speeds, which are then compared with the monthly threshold. Matching vehicle geolocations with the speeds of probe vehicles creates hourly and monthly vehicle speed distributions per zone. We then perform k-medians clustering [38], a representative-based clustering algorithm, which partitions a data set (the monthly speeds for each zone) into k clusters depending on which median the data point is the closest to. Since the monthly speed distribution is bimodal, regardless of the zone in our data, k = 2 corresponds to one “slow” and one “fast” speed cluster. Algorithm 1 outlines how k-medians clustering is performed for this study. First, k is set to k = 2 , since we are clustering the monthly speed data as either fast or slow for each barangay in every month. Afterwards, k = 2 random initial representatives are chosen, serving as the centers of the initial clusters. The distances of all speed data points from the selected representatives are then calculated from each of the representatives. Finally, each data point is then assigned to the nearest cluster representative. After clustering, a new cluster representative or center that leads to a lower total distance from the cluster (from the center) is chosen. The process is repeated until convergence is achieved, i.e., until the cluster assignment remains unchanged in the succeeding steps. The k-medians algorithm is known to be robust in handling outliers. After clustering, the speed threshold for z o n e i and month M, v i * ( M ) is then calculated as the midpoint between the closest boundaries of the slow and fast clusters. The boundaries of the slow and fast clusters are the fastest speed data points belonging to the slow cluster, and the slowest speed points belonging to the fast cluster; thus, selecting the midpoint between these boundaries maximizes the separation of the two clusters.
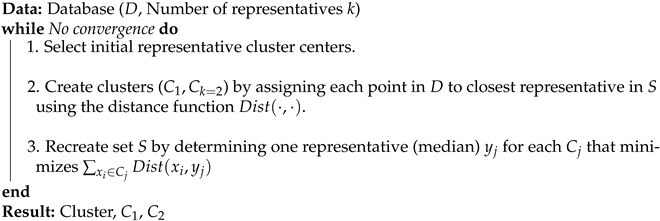
Algorithm 1 Pseudocode for k-medians
Applsci 13 12763 i001
We then use the speed distribution of the probe vehicles for z o n e i and interval t M to calculate the average speed v i ( t ) ¯ . Thus, N s l o w t and N f a s t t are given by the respective cardinalities of the set of zones where v i ( t ) ¯ is below or equal to the corresponding monthly zonal threshold (slow) or above it (fast):
N s l o w t = | { z o n e i v i ( t ) ¯ v i * ( M ) , t M } |
N f a s t t = | { z o n e i v i ( t ) ¯ > v i * ( M ) , t M } |
Finally, we calculate the ZSI for the city using Equation (1) above.
The zones may be regularly defined (e.g., grids) by traffic analysis considerations (e.g., traffic analysis zones, TAZs) or by other criteria; the only requirements are that the zones are nonoverlapping and completely cover the city’s spatial extent. For the zones of our study city, we chose to use the existing geographical subdivisions of The Philippine cities or towns into barangays (villages or wards), which play multiple roles, such as political–administrative units, local service areas, and planning regions. The results we present in this work are thus of immediate relevance for the local government authorities we are partnered with.

3. Results

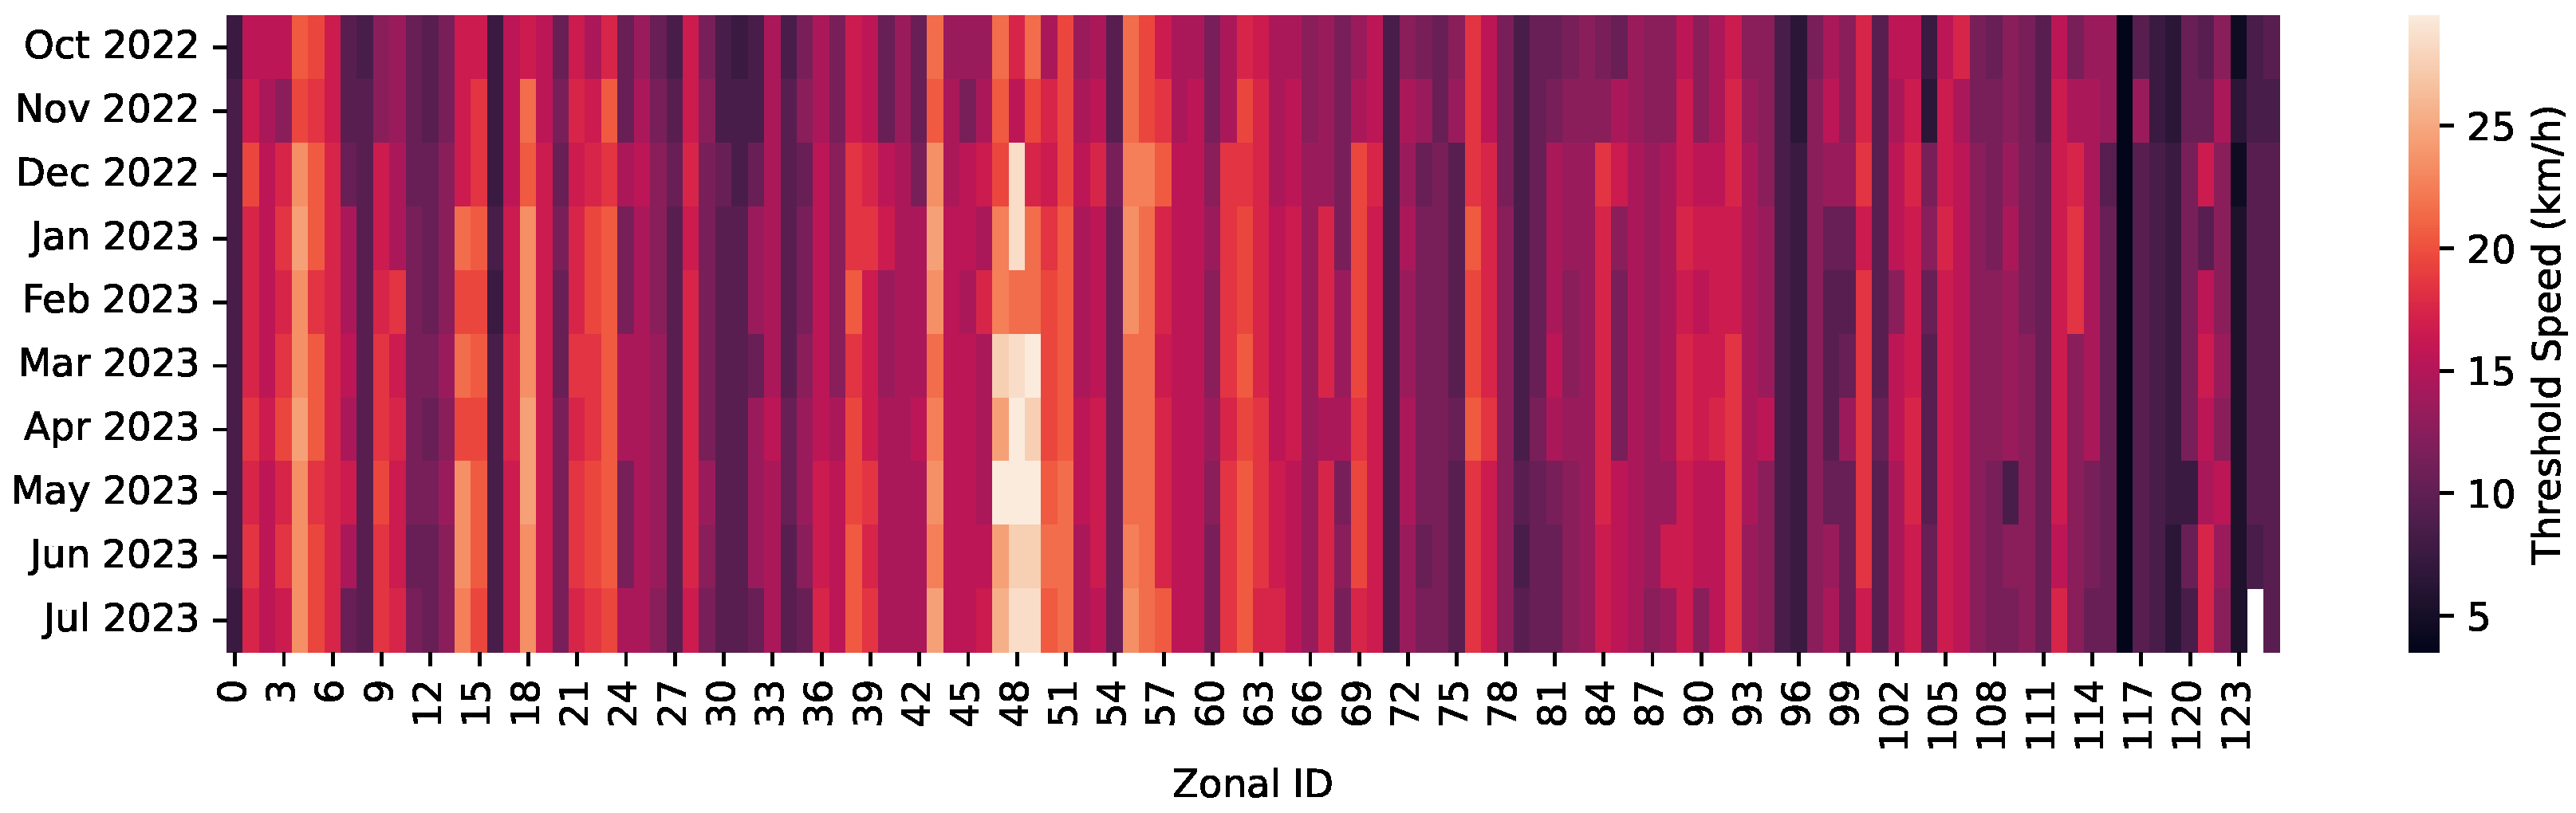
3.1. Monthly Zonal Speed Thresholds

We obtained GPS data for 126 out of the 129 administrative subdivisions of Baguio city. This indicates that the probe vehicles have spent time in all but three subzones of the city, and thus, the index we calculated in this work is representative of the city. Figure 3 shows the monthly variation in the threshold for each zone with GPS information logged from probe vehicles. While there are significant variations in the value of the threshold across zones, for each zone, the monthly variation in the threshold is, in fact, minimal. This indicates that the ZSI values can be compared across time and is thus a valid dynamic index for mobility within the city.

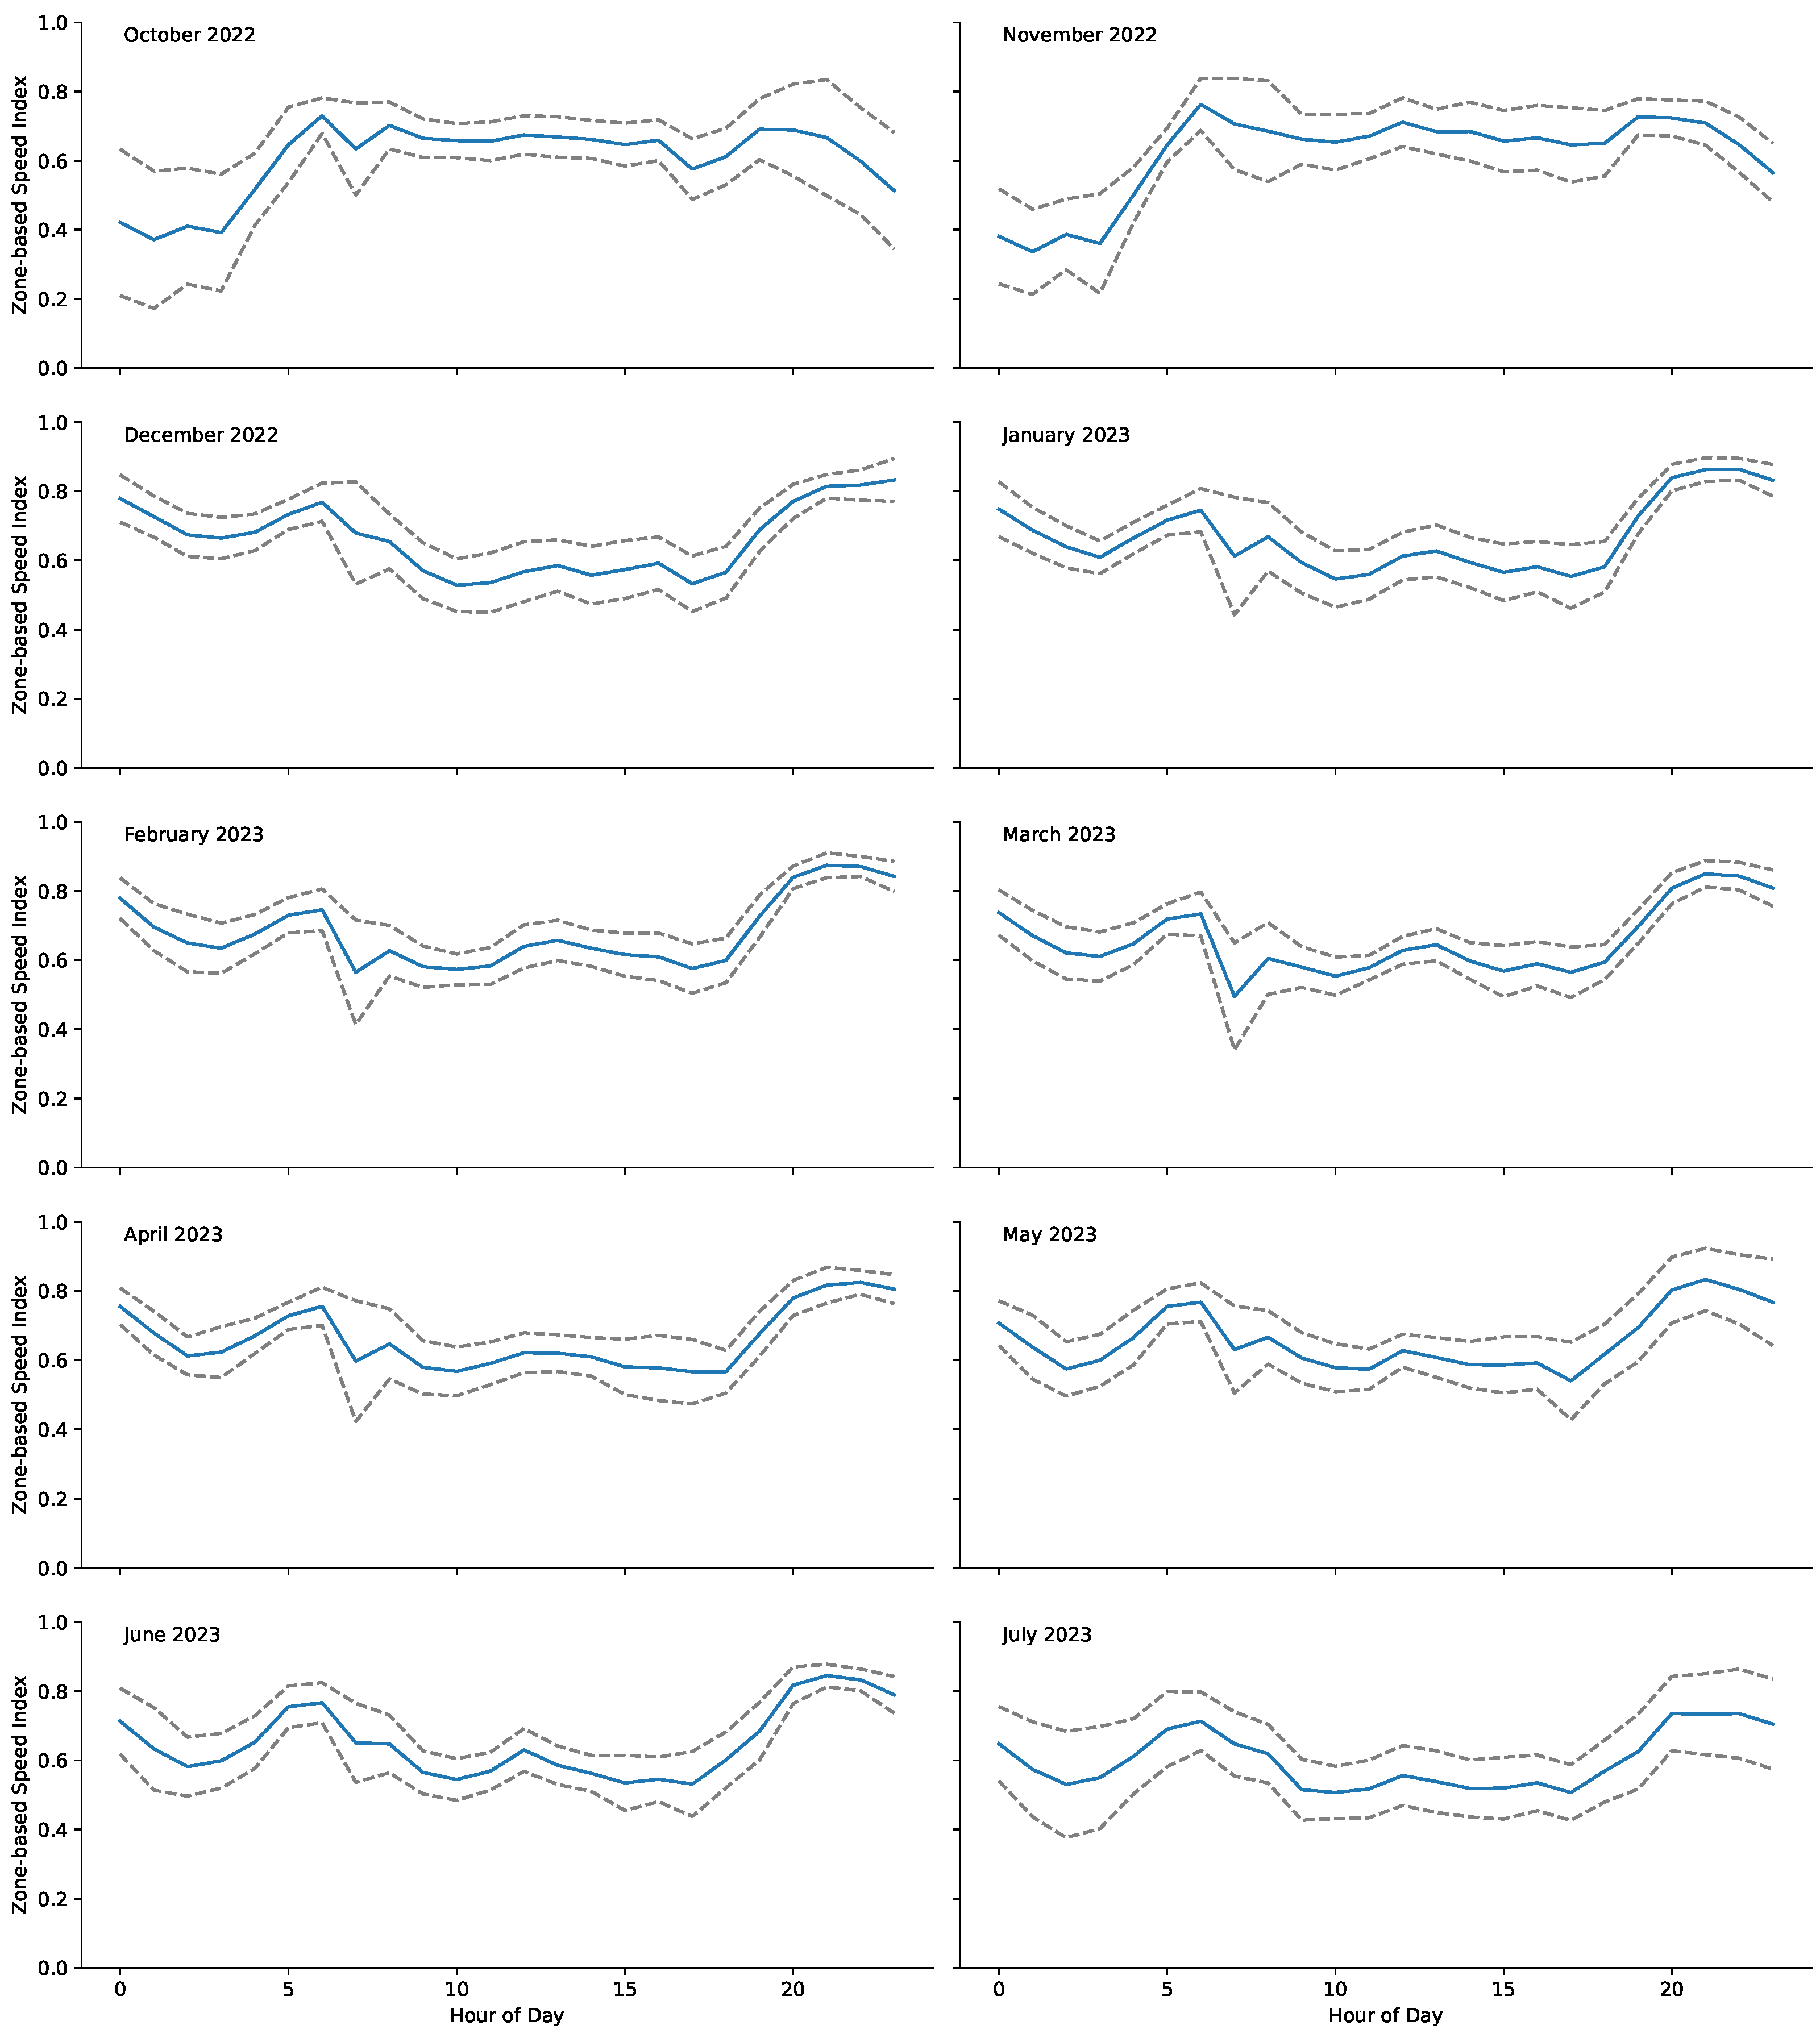
3.2. Monthly Zone-Based Speed Index

Figure 4 shows plots of the hourly average index per month, with their respective standard deviations. The maximum index for all months is close to 0.8, while the minimum varies significantly over different months. For October and November 2022, we notice that the lowest mobility indices are observed between 12 midnight and 5 a.m., while the index for the rest of the day is above 0.6 until before 10 p.m. This trend is observed only for these two months, and we surmise that this is related to pandemic concerns, as pandemic mitigation measures were still in force during those two months. These measures were lifted, and citizens started traveling freely in December 2022 during the long Christmas vacation season in the country.
In other months, we observe a similar trend of a high mobility index at midnight, between 5 a.m. to 6 a.m., and after 8 p.m. The mobility index drops close to 0.6 after 6 a.m. until 6 p.m. We observe that the degree of drop is more pronounced during months with long holidays, such as in December 2022 and April 2023. Similar trends are observed in months with several local tourism events, such as February 2023 and March 2023, and during rainy seasons or days with typhoons (June 2023 and July 2023). In Figure 5, the ability of the formulated ZSI to capture the changes in traffic conditions due to the supertyphoon Doksuri that entered the administrative area of Baguio city from 26–28 July 2023 is shown [39].

4. Discussion

In this work, we proposed the Zone-based Speed Index, a time-varying index for transport mobility in an urban area based on GPS data (speeds) collected from probe vehicles. This section examines several aspects of the data collected and the calculated ZSI across time.
First is the observed bimodality of the speed distribution, which holds across zones and time. The bimodality implies the existence of two speed regimes for the probe vehicles: a low-speed regime and a high-speed regime, something which we have observed during several visits to Baguio city and had previously been reported from GPS data in other cities as well [40]. The wide variations in the characteristics of each zone (such as different topographic, building, and land-use patterns) make the choice of using zone-specific speed thresholds natural, as is the fact that the ZSI is a city-level index, not a zone-level one.
In contrast to existing indices for mobility, which rely on a city-level aggregation or averaging of data, e.g., of travel times, the ZSI encodes the spatial extent of a desirable condition (high-speed zones) and thus complements existing indices in providing a fuller picture of mobility in a smart city.
Throughout the data-gathering period, the ZSI captured extraordinary events that caused mobility patterns to deviate from the typical behavior in our study area. Mobility patterns in the city during the closing stages of the COVID-19 pandemic regime (October and November 2022) were different from the mobility during the transition into the postpandemic era (December 2022 onwards). Furthermore, our mobility index demonstrated its effectiveness in capturing the fluctuations in vehicle mobility during various events, such as typhoons and holidays, thus enabling a comprehensive understanding of the impact of external factors on urban mobility patterns. The high-resolution (hourly) characterization of urban vehicle mobility provided by the ZSI holds significant promise in helping local government authorities develop and optimize transportation systems, especially in tourism hotspots, where efficient mobility is pivotal for both residents and visitors, as well as to monitor mobility conditions to avoid or mitigate the negative impact on public perceptions by traffic congestion.
Despite limitations, such as the absence of devices like induction loop detectors or CCTV cameras installed at as many sections of the city’s road network as possible (to measure other traffic quantities such as vehicle flux and density) and the possibility of low speeds having causes beyond traffic congestion, our proposed speed clustering index represents an important first step in measuring a resource-constrained city’s vehicle mobility index, which only requires the measurement of the speeds of probe vehicles among its public transport fleet via GPS. Our work and proposed mobility index is a contribution towards the literature and discourse on smart city indicators in a developing country context, something that is important, as a substantial fraction of the global population is expected to reside in such cities in the medium to long term. It is important that such indicators are able to reflect changing conditions to help local authorities in such contexts to make informed decisions, such as discouraging free movement during health emergencies or monitoring disruptions in mobility due to disasters, and the ZSI, a dynamic indicator relying on the collection of GPS data (which can be performed even in the absence of state-of-the-art telecommunications infrastructure), satisfies these requirements.

5. Conclusions

In conclusion, our study addressed the challenges of implementing smart city initiatives in the context of a developing country where there is a concern with access to high-resolution data. Additionally, we developed a dynamic mobility index that measures the ease of vehicle transport within the city by examining geolocated GPS traces of vehicles. This study particularly focused on the city of Baguio, The Philippines, a highly urbanized tourist hotspot in the country. The research utilized GPS data from probe vehicles, a public and private transport mix, to introduce the Zone-based Speed Index (ZSI). Based on speed clusters, this mobility index dynamically infers monthly thresholds, classifying zones as fast or slow. The proposed ZSI effectively captured fluctuations in vehicle mobility, such as the impact of typhoons and holidays, providing a high-resolution characterization of hourly urban vehicle mobility. The insights gained from this dynamic mobility index offer valuable contributions to the development and optimization of transportation systems in monitoring the state of city traffic and assessing the performance of smart city initiatives.

Author Contributions

Conceptualization, M.L., J.F.V. and C.M.; methodology, M.D., D.D., J.F.V. and M.L.; software, M.D., D.D. and M.L.; validation, M.L., M.D., D.D. and J.F.V.; formal analysis, M.L. and J.F.V.; investigation, M.L. and J.F.V.; resources, J.F.V.; data curation, J.F.V. and M.L.; writing—original draft preparation, M.L., J.F.V. and D.D.; writing—review and editing, M.L., J.F.V., M.D. and D.D.; visualization, M.L. and D.D.; supervision, C.M.; project administration, M.L., funding acquisition, C.M. All authors have read and agreed to the published version of the manuscript.

Funding

This research was funded by the Philippine Council for Industry, Energy and Emerging Technology Research and Development (DOST-PCIEERD) under Project MINERVA: Monitoring of Indicators for Efficient Redevelopment and Value Assessment, Grant # 2022-10237. The funding agency had no involvement in the preparation of the manuscript.

Data Availability Statement

The data presented in this study are available on request from the corresponding author. The data are not publicly available due to privacy and internal agreements made with the local government of Baguio city.

Acknowledgments

The authors are grateful for the assistance and support provided by the Local Government Unit of Baguio city.

Conflicts of Interest

The authors declare no conflict of interest. The funders had no role in the design of the study; in the collection, analyses, or interpretation of data; in the writing of the manuscript; or in the decision to publish the results.

References

  1. Wilson, B.; Chakraborty, A. The Environmental Impacts of Sprawl: Emergent Themes from the Past Decade of Planning Research. Sustainability 2013, 5, 3302–3327. [Google Scholar] [CrossRef]
  2. Jarah, S.; Zhou, B.; Abdullah, R.; Lu, Y.; Yu, W. Urbanization and Urban Sprawl Issues in City Structure: A Case of the Sulaymaniah Iraqi Kurdistan Region. Sustainability 2019, 11, 485. [Google Scholar] [CrossRef]
  3. Pan, Y.; Ma, L.; Tang, H.; Wu, Y.; Yang, Z. Land Use Transitions under Rapid Urbanization in Chengdu-Chongqing Region: A Perspective of Coupling Water and Land Resources. Land 2021, 10, 812. [Google Scholar] [CrossRef]
  4. Ali, M.S.; Adnan, M.; Noman, S.M.; Baqueri, S.F.A. Estimation of Traffic Congestion Cost-A Case Study of a Major Arterial in Karachi. Procedia Eng. 2014, 77, 37–44. [Google Scholar] [CrossRef]
  5. Falcocchio, J.C.; Levinson, H.S. The Costs and Other Consequences of Traffic Congestion. In Road Traffic Congestion: A Concise Guide; Springer International Publishing: Cham, Switzerland, 2015; pp. 159–182. [Google Scholar] [CrossRef]
  6. Afrin, T.; Yodo, N. A Survey of Road Traffic Congestion Measures towards a Sustainable and Resilient Transportation System. Sustainability 2020, 12, 4660. [Google Scholar] [CrossRef]
  7. Li, S.; Xing, J.; Yang, L.; Zhang, F. Transportation and the Environment in Developing Countries. Annu. Rev. Resour. Econ. 2020, 12, 389–409. [Google Scholar] [CrossRef]
  8. Samal, S.R.; Kumar, P.G.; Santhosh, J.C.; Santhakumar, M. Analysis of Traffic Congestion Impacts of Urban Road Network under Indian Condition. IOP Conf. Ser. Mater. Sci. Eng. 2020, 1006, 012002. [Google Scholar] [CrossRef]
  9. INRIX. INRIX Cost of Driving Infographic-US. Available online: https://inrix.com/resources/inrix-cost-of-driving-infographic-us/ (accessed on 25 October 2023).
  10. Fattah, M.A.; Morshed, S.R.; Kafy, A.A. Insights into the socio-economic impacts of traffic congestion in the port and industrial areas of Chittagong city, Bangladesh. Transp. Eng. 2022, 9, 100122. [Google Scholar] [CrossRef]
  11. Sharifi, A.; Khavarian-Garmsir, A.R. Urban Climate Adaptation and Mitigation; Elsevier: Amsterdam, The Netherlands, 2022. [Google Scholar] [CrossRef]
  12. Baibarac-Duignan, C.; de Lange, M. Controversing the datafied smart city: Conceptualising a ‘making-controversial’ approach to civic engagement. Big Data Soc. 2021, 8, 20539517211025557. [Google Scholar] [CrossRef]
  13. Cavada, M.; Hunt, D.; Rogers, C. Smart Cities: Contradicting Definitions and Unclear Measures. In Proceedings of the 4th World Sustainability Forum, Basel, Switzerland, 1–30 November 2014. [Google Scholar] [CrossRef]
  14. Meijer, A.; Bolívar, M.P.R. Governing the smart city: A review of the literature on smart urban governance. Int. Rev. Adm. Sci. 2016, 82, 392–408. [Google Scholar] [CrossRef]
  15. Sharifi, A. A typology of smart city assessment tools and indicator sets. Sustain. Cities Soc. 2020, 53, 101936. [Google Scholar] [CrossRef]
  16. Lai, C.M.T.; Cole, A. Measuring progress of smart cities: Indexing the smart city indices. Urban Gov. 2023, 3, 45–57. [Google Scholar] [CrossRef]
  17. Albino, V.; Berardi, U.; Dangelico, R.M. Smart cities: Definitions, dimensions, performance, and initiatives. J. Urban Technol. 2015, 22, 3–21. [Google Scholar] [CrossRef]
  18. Abu-Rayash, A.; Dincer, I. Development of integrated sustainability performance indicators for better management of smart cities. Sustain. Cities Soc. 2021, 67, 102704. [Google Scholar] [CrossRef]
  19. Calvillo, C.F.; Sánchez-Miralles, Á.; Villar, J. Synergies of electric urban transport systems and distributed energy resources in smart cities. IEEE Trans. Intell. Transp. Syst. 2017, 19, 2445–2453. [Google Scholar] [CrossRef]
  20. Majstorović, Ž.; Tišljarić, L.; Ivanjko, E.; Carić, T. Urban Traffic Signal Control under Mixed Traffic Flows: Literature Review. Appl. Sci. 2023, 13, 4484. [Google Scholar] [CrossRef]
  21. Dorosan, M.; Dailisan, D.; Valenzuela, J.F.; Monterola, C. Use of Machine Learning in Understanding Transport Dynamics of Land Use and Public Transportation in a Developing City. Cities 2024, 144, 104587. [Google Scholar] [CrossRef]
  22. Costa, P.; Neto, G.M.; Bertolde, A. Urban mobility indexes: A brief review of the literature. Transp. Res. Procedia 2017, 25, 3645–3655. [Google Scholar] [CrossRef]
  23. ESCAP. Sustainable Urban Transport Index (SUTI). Available online: https://www.unescap.org/our-work/transport/suti# (accessed on 25 October 2023).
  24. Mendiola, L.; González, P.; Cebollada, À. The relationship between urban development and the environmental impact mobility: A local case study. Land Use Policy 2015, 43, 119–128. [Google Scholar] [CrossRef]
  25. UN-Habitat. Assessing the Digital Divide, Understanding Internet Connectivity and Digital Literacy in Cities and Communities. Available online: https://unhabitat.org/sites/default/files/2021/11/assessing_the_digital_divide.pdf (accessed on 25 October 2023).
  26. Kim, J. Smart city trends: A focus on 5 countries and 15 companies. Cities 2022, 123, 103551. [Google Scholar] [CrossRef]
  27. Le-Klähn, D.T.; Hall, C.M. Tourist use of public transport at destinations—A review. Curr. Issues Tour. 2014, 18, 785–803. [Google Scholar] [CrossRef]
  28. Tan, P.Y.; Ismail, H.N. Reviews on interrelationship between transportation and tourism: Perspective on sustainability of urban tourism development. IOP Conf. Ser. Earth Environ. Sci. 2020, 447, 012065. [Google Scholar] [CrossRef]
  29. Wang, J.; Huang, X.; Gong, Z.; Cao, K. Dynamic assessment of tourism carrying capacity and its impacts on tourism economic growth in urban tourism destinations in China. J. Destin. Mark. Manag. 2020, 15, 100383. [Google Scholar] [CrossRef]
  30. Curtale, R.; Sarman, I.; Evler, J. Traffic Congestion in Rural Tourist Areas and Sustainable Mobility Services. The Case of Ticino (Switzerland) Valleys. Tour. Plan. Dev. 2021, 1–25. [Google Scholar] [CrossRef]
  31. Liu, Z.; Wang, R.; Japkowicz, N.; Cai, Y.; Tang, D.; Cai, X. Mobile app traffic flow feature extraction and selection for improving classification robustness. J. Netw. Comput. Appl. 2019, 125, 190–208. [Google Scholar] [CrossRef]
  32. Chaix, B.; Benmarhnia, T.; Kestens, Y.; Brondeel, R.; Perchoux, C.; Gerber, P.; Duncan, D.T. Combining sensor tracking with a GPS-based mobility survey to better measure physical activity in trips: Public transport generates walking. Int. J. Behav. Nutr. Phys. Act. 2019, 16, 1–13. [Google Scholar] [CrossRef]
  33. Siła-Nowicka, K.; Vandrol, J.; Oshan, T.; Long, J.A.; Demšar, U.; Fotheringham, A.S. Analysis of human mobility patterns from GPS trajectories and contextual information. Int. J. Geogr. Inf. Sci. 2016, 30, 881–906. [Google Scholar] [CrossRef]
  34. D’Andrea, E.; Marcelloni, F. Detection of traffic congestion and incidents from GPS trace analysis. Expert Syst. Appl. 2017, 73, 43–56. [Google Scholar] [CrossRef]
  35. Seliverstov, Y.; Starichenkov, A.; Nikitin, K. Using mobile applications to evaluate quality of road networks and transport mobility. Transp. Res. Procedia 2020, 50, 636–646. [Google Scholar] [CrossRef]
  36. Klous, G.; Smit, L.A.; Borlée, F.; Coutinho, R.A.; Kretzschmar, M.E.; Heederik, D.J.; Huss, A. Mobility assessment of a rural population in the Netherlands using GPS measurements. Int. J. Health Geogr. 2017, 16, 1–13. [Google Scholar] [CrossRef]
  37. Vergel, K. Public Transport Issues in Small/Medium Sized Cities of the Philippines and Initiates on Public Transport Vehicle Technologies; Tokyo Institute of Technology: Tokyo, Japan, 2012; Volume 21. [Google Scholar]
  38. Bradley, P.; Mangasarian, O.; Street, W. Clustering via Concave Minimization. In Proceedings of the Advances in Neural Information Processing Systems, Denver, CO, USA, 2–5 December 1996; Mozer, M., Jordan, M., Petsche, T., Eds.; MIT Press: Cambridge, MA, USA, 1996; Volume 9. [Google Scholar]
  39. ABS-CBN News. Super Typhoon Egay Whips Baguio City. Available online: https://news.abs-cbn.com/news/multimedia/photo/07/26/23/super-typhoon-egay-whips-baguio-city (accessed on 25 October 2023).
  40. Wang, Z.; Goodchild, A.; McCormack, E. A methodology for forecasting freeway travel time reliability using GPS data. Transp. Res. Procedia 2017, 25, 842–852. [Google Scholar] [CrossRef]
Figure 1. Map of the city of Baguio’s location within The Philippines. Zones corresponding to barangays are denoted by dashed lines, while the solid lines show the city boundaries. There are 129 zones spread throughout a land area of 57.51 km2.
Applsci 13 12763 g001
Figure 2. A sample GPS trace from the randomly chosen vehicle, taken on July 17, 2023, from 8 am to 8 pm (local time). Red indicates slow speeds, while blue indicates fast speeds.
Applsci 13 12763 g002
Figure 3. Monthly variation in zonal speed thresholds dictating whether a zone is classified as slow or fast. Most of the zones exhibit minimal variation in the speed threshold across time.
Applsci 13 12763 g003
Figure 4. Intraday variation in the Zone-based Speed Index (ZSI) for ten months spanning October 2022 to July 2023. Higher values of the ZSI indicate better mobility. The solid blue line corresponds to the mean, while the top and bottom dashed lines are one standard deviation on either side of the mean. Both average and standard deviation are calculated across the days of the given month.
Applsci 13 12763 g004
Figure 5. Hourly Zone-based Speed Index for the month of July 2023. The decrease in ZSI successfully captures the decrease in vehicle mobility when supertyphoon Doksuri passed through Baguio city on 26–28 July 2023 (red vertical lines).
Applsci 13 12763 g005
Table 1. GPS Technical and Operational Specifications.
PropertyMeasure
Position uncertainty5 m
Interval of data logging30 s (stationary)/100 m or 45 heading change (in motion)
Speed resolution0.1 km/h
Table 2. Breakdown of vehicles in Baguio city from which GPS data were collected. Each vehicle type is discussed in the main text.
Vehicle CategoryCount
Taxi399
Jeepney61
Government37
Private3
Total500
Disclaimer/Publisher’s Note: The statements, opinions and data contained in all publications are solely those of the individual author(s) and contributor(s) and not of MDPI and/or the editor(s). MDPI and/or the editor(s) disclaim responsibility for any injury to people or property resulting from any ideas, methods, instructions or products referred to in the content.

