1. Introduction
Cloud computing is a rapidly growing field and has applications in virtually all domains. With the advent of various cloud-computing platforms, developers and cloud architects need to compare these providers to identify the most viable platform for every specific use case and application. Based on these use cases, each cloud-provider platform offers unique advantages over its competitors in terms of the services available, quantitative metrics, integrations, and tools available. This project aims to compare and contrast two popular cloud-providing platforms, namely Microsoft Azure and Amazon Web Services (AWS). The primary goal of this project is to gain insights into the viability of the two most popular cloud platforms in terms of the deployment of machine learning (ML) applications, in particular, object-detection algorithms. This comparison allows developers to easily identify the best choice between these providers, which could have an extensive impact on their core project requirements such as performance and development costs.
The benefits of comparing cloud platforms for machine learning model deployment are numerous. In today’s dynamic technological landscape, selecting the right cloud platform to deploy machine learning models is a critical decision that can significantly impact the success of projects. The choice between cloud service providers, such as Azure and AWS, becomes increasingly challenging as developers and data scientists strive to meet specific project requirements. A thorough comparison of these platforms is crucial to empower practitioners with the insights needed to make informed decisions.
Nevertheless, these benefits extend beyond mere technical considerations. The suitability of a cloud provider directly influences the performance, scalability, and cost effectiveness of machine learning applications. By conducting a comprehensive analysis, developers can align their choice with the unique demands of their projects, ultimately optimizing the deployment process. This approach is particularly pertinent in the realm of machine learning, where nuances in infrastructure, tooling, and support for specialized algorithms can significantly impact outcomes.
This paper addresses a significant gap in the literature by
providing a comprehensive comparison of the cloud-provider platforms based on quantitative and qualitative metrics via both experimentation and theory,
suggesting the most suitable platform based on the importance of different factors to allow developers to make a more-informed choice on the best platform for their needs.
Quantitative metrics, rooted in experimental data, provide a tangible and objective basis for comparison. Metrics such as upload and download times, throughput, and inference times offer insights into the raw performance capabilities of each platform. However, a complete understanding of a cloud provider’s suitability goes beyond these metrics. Qualitative aspects, evaluated theoretically, delve into the broader ecosystem, considering factors like cost effectiveness, the availability of machine learning resources, and ease of deployment.
While quantitative metrics offer a precise measurement of performance, qualitative aspects introduce a holistic perspective, encompassing the user experience and the adaptability of the platform to diverse project requirements. A theoretical evaluation allows for a nuanced understanding of each platform’s capabilities, reflecting on their documentation, community support, and strategic direction. Combining both experimental and theoretical approaches ensures a well-rounded assessment that caters to the multifaceted needs of machine learning practitioners.
This paper examines quantitative metrics such as upload and download times, throughput, and inference time, as well as qualitative metrics such as cost effectiveness, the availability of machine learning resources, ease of deployment, and service-level agreements (SLAs). The paper measures the metrics by the deployment of the popular YOLOv8 object-detection model on both cloud platforms and uses the Python SDK for each platform to query the model and measure the metrics. On the other hand, qualitative metrics are compared based on the general availability and information provided by each platform. This paper then uses these metrics to compare the performance of the Azure and AWS platforms for object-detection models and justify the better platform. This paper ends with a comparison of each platform based on both empirical and theoretical metrics based on different business requirements to allow readers to choose a suitable platform based on their needs.
This paper is organized into three main sections. First,
Section 2 contains a literature review to identify and justify the gap in the literature in terms of a comparison of cloud providers with empirical testing and the lack of a requirement-wise suggestion for the better cloud platform. Next, in
Section 3, we explore the methodology to be followed with more details on the metrics to be measured and how the analysis for both quantitative and qualitative results will be conducted. Finally, in
Section 4, we examine the results and compare the platforms, providing a final comparison in general and based on business requirements.
The literature review conducted in
Section 2 highlights the scarcity of studies that bridge the gap between empirical experimentation and theoretical considerations. While some studies focus solely on quantitative benchmarks, few provide a holistic evaluation that considers the real-world implications for practitioners. Our methodology fills this void by adopting a dual-pronged approach, systematically exploring both the quantitative and qualitative facets of Azure and AWS. By undertaking a comprehensive examination of these cloud platforms, this paper contributes to the evolving discussion on cloud-provider selection, offering practitioners a well-rounded understanding of the strengths and limitations of Azure and AWS for machine learning model deployment. The emphasis on requirement-wise suggestions further distinguishes this study, providing actionable insights tailored to the specific needs of developers and data scientists.
Overall, by considering both technical and nontechnical aspects, this paper aims to provide a comprehensive and holistic comparison of Azure and AWS for machine learning applications, specifically focusing on object-detection algorithms. The findings of this study can assist developers, data scientists, and cloud architects in making informed decisions when selecting a cloud platform for their specific use case, taking into account both performance metrics and other factors that can impact the overall success and efficiency of their machine learning projects.
2. Literature Review
In this section, we review various papers related to the field and summarize the findings in each work. The primary focus is on comparing cloud-computing providers and algorithms for object detection. We also aim to identify metrics that can be used to compare cloud-computing providers. At the end of each section, we will conclude on the current gap in the literature that this paper will address.
2.1. Cloud-Provider Comparison
One of the ways architects and developers can compare cloud-computing providers would be to compare the qualitative factors. Ref. [
1] compares their technology specifications, model services, data center location, services available, microservices architecture, and cloud-computing management. In terms of the machine learning services available, Amazon AWS and the Google Cloud Platform (GCP) provide more options than Alibaba Cloud and Microsoft Azure. Similarly, ref. [
2] compares AWS, Azure, and the GCP in terms of the catalog of services provided by the platforms. They conclude that AWS has the broadest reliable and stable services. Furthermore, Azure provides extensive Microsoft tool integrations for users, and the GCP provides the best data and analytic tools. However, both these works fail to provide quantifiable metrics to compare these platforms, conduct no experimentation, and do not provide any guide on choosing the best platform based on business requirements.
Contrarily, some works have attempted to perform a quantitative analysis between cloud providers. Ref. [
3] uses a quantitative approach and provisions various types of AWS instances and compares response time, costs per inference, and the maximum request rate for these various instances. This paper provides a detailed analysis of the various possible CPU as well as GPU instances on AWS SageMaker. In addition, ref. [
4] identifies various metrics across multiple categories, such as general, performance, economics, and security metrics. Some of the ideal metrics that could be used for this project are the CPU load, mean hit time, response time, waiting time, price/performance ratio, mean time to change (MTTC), and cost. However, both of these works lack a comprehensive comparison of the cloud-computing platforms and do not provide any further assistance in application-specific comparisons.
To further improve the decision making, we need to consider the various possible architectures for deploying any system. For instance, ref. [
5] compares three possible architectures, namely, monolithic, microservice architecture operated by the cloud customer, and microservice architecture operated by the cloud provider. It concludes that using special services specifically designed to deploy and scale microservices, such as AWS Lambda and its alternatives, reduces infrastructure costs by 70% or more. Ref. [
6], on the other hand, compares multiple zero-downtime-deployment techniques, namely the Blue Green, Canary, and Rolling deployment techniques. They conclude that Blue Green is ideal for cloud infrastructures with container-based deployments, and Rolling deployment is ideal for infrastructures with data-center-based applications. On the other hand, these papers provide a rather general overview during their comparisons, lacking a more detailed holistic comparison.
In addition to these comparisons, several works have also examined fog computing, which is a decentralized infrastructure where compute and storage resources are placed at the edge of the cloud. Ref. [
7] deployed a deep-learning-based object-detection model on both fog and cloud environments. The authors analyzed the differences for both high-accuracy and low-latency operation modes using metrics such as the response time, jitter, network bandwidth, and power consumption. They identify that for the high-accuracy operation mode, the cloud-computing model is preferred for tasks that require heavy computation. However, for low-latency operation tasks, the fog-computing environment is ideal because of the significantly lower response time and jitter. Ref. [
8], on the other hand, performed a review of performance evaluation metrics to compare cloud, fog, and edge computing. Some of the common metrics applicable to these paradigms are resource utilization, response time, energy consumption, and latency. However, the authors do not deploy any application to compare these environments based on the listed metrics.
Overall, while numerous works have examined cloud-provider metrics by evaluating the performance and efficiency of different cloud architectures, none of them have explored the deployment of machine learning algorithms across different cloud providers nor conducted any experimentation to validate the performance of the platforms. Additionally, the lack of a conclusive result based on different business requirements indicates a significant gap in the literature.
2.2. Deep Learning on the Cloud
Cloud computing has had a profound impact on deep learning. It has revolutionized the way deep learning models are developed, deployed, and utilized. The main impacts include the improvements in scalability, cost efficiency, and high availability of resources. These impacts translate to the various metrics that need to be measured when comparing between cloud providers since they highlight the important factors that are considered when choosing a cloud provider for the process of model deployment.
The application of cloud computing in deep learning arises mainly from the requirement of quick real-time inference. For instance, using cloud infrastructure for deep learning is vital in domains such as security and medicine, where traits such as scalability, redundancy, and availability are of paramount importance, as systems in such domains generally deal with sensitive data and require low to no downtime for the optimal functioning of the systems [
9,
10,
11]. Therefore, the requirement of the high availability of deep learning model resources implies that metrics such as the latency, inference time, and throughput time of such deep learning systems are of prime importance when measuring the performance of the cloud ecosystems that these models are deployed in. Overall, the inherent necessity of low downtime for security and medical applications points to a need to quantitatively measure the various temporal metrics of a deep learning system in the cloud.
The availability and monetary cost of machine learning and deep learning resources in the cloud is another important factor when measuring performance. Papers such as [
12] illustrate the importance of cost and availability, particularly in the context of Internet-of-Things (IoT) devices. IoT systems have grown in popularity over the last few years because of their possible low cost and remote deployment capabilities. Hence, the lower cost and high availability of ML services via the cloud allows IoT systems to improve their use cases.
Cloud computing has also had an immense impact on Generative AI systems. It has been a key enabling factor in the development of massive Generative AI models such as LLMs (Large Language Models) [
13,
14] and Diffusion Models [
15]. FalconLLM [
13] is the one of the latest renditions in the line of LLMs and is currently one of the best-performing open-source language models. This model was trained on a cluster of 384 GPUs on AWS over a period of two months. Due to the fast-paced nature of the research and development in the field of Generative AI and LLMs, the ease of deployment of deep learning models on cloud platforms becomes a relevant discussion. Therefore, the choice between cloud providers can also be informed by their usability and richness in features to aid the deployment process of deep learning models. Overall, cloud computing addresses the practical needs of deep learning, and therefore the need arises to quantitatively and qualitatively measure the various metrics pertaining to the deployment cycle of a deep learning model in the cloud.
2.3. Object-Detection Algorithms
Object detection is a computer-vision technique used to locate instances of objects in images or videos. Object-detection algorithms generally use machine learning or deep learning to identify objects in an image or video, classify each object by using a set of bounding boxes, and associate each object with a class probability. Many object-detection algorithms have been developed through the years by using advanced methods and models. Object-detection algorithms have a wide range of applications across various industries and domains. These algorithms are used to locate and identify objects within images or video frames. Some of the common applications of object-detection algorithms include autonomous vehicles, surveillance and security, retail and inventory management, Augmented Reality (AR) and Virtual Reality (VR), healthcare, sports analysis, and many more. Numerous object-detection models exist, including but not limited to, You Only Look Once (YOLO), Single-Shot Detectors (SSD), Faster Region-based Convolutional Neural Networks (Faster R-CNNs), and Region-based Fully Convolutional Networks (R-FCNs). Overall, each model aims to address different limitations of the previously developed models, and the choice between them depends on the specific use case.
You Only Look Once (YOLO) is one of the most popular object-detection algorithms used widely in various object-detection use cases. Ref. [
16] performs an in-depth analysis of the various YOLO versions throughout the years and compares most of them by using Microsoft Common Objects in Context (COCO) as the standard dataset. The authors discuss that, over the years, most YOLO versions after YOLOv4 and YOLOv5 had a trade-off between speed and accuracy. For example, the latest version named YOLOv8 resulted in a higher Average Precision (AP) of 53.9% against the 50.7% of YOLOv5 on the same inputs. Similarly, ref. [
17] develops YOLO-LITE in order to provide a combination of relatively high accuracy and speed to non-GPU computers. It achieves an AP of 12.26% with a speed of 21 Frames Per Second (FPS) compared to Tiny-YOLOv2 with its AP of 23.7% and speed of only 2.4 FPS, which is extremely slow for real-world applications.
For the purpose of this paper, we are going to use the YOLOv8 object-detection model. This model is the latest version of the YOLO series and has faster inference times and a higher expected accuracy as in [
16]. This model has applications across various domains including healthcare, smart cities, and Unmanned Aerial Vehicle (UAV) detection. First, ref. [
18] presents a novel real-time Arrhythmia-detection application by using YOLOv8, showcasing its ability to identify irregular heart rhythms, thereby facilitating timely interventions. Next, ref. [
19] proposes an improved fire-detection approach for smart cities by using YOLOv8, where its real-time object detection proves instrumental in identifying and localizing fire incidents promptly. Finally, ref. [
20] introduces a UAV detection method based on YOLOv8, demonstrating its effectiveness in enhancing security measures by identifying and tracking small unmanned aerial vehicles. Overall, YOLOv8 emerges as a pivotal tool, addressing complex challenges and driving innovation in real-time object detection across healthcare, urban planning, and security domains.
The choice of model, however, has no significant bearing on the expected results. The aim of this paper is to measure the relative performance of their deployment on a cloud platform and not necessarily their prediction accuracy. Hence, metrics such as the mAP (mean Average Precision) and Intersection over Union (IoU) are not relevant for our purposes. Our selected YOLOv8 model will be deployed onto the different cloud platforms to test the various metrics mentioned in the previous sections.
3. Methodology
To compare AWS and Azure, we use a pretrained version of YOLOv8, deployed on either platform. The specifications of the images used for testing, the metrics to be measured, the techniques used to measure each metric, and the instances used during testing are described in the following section.
3.1. Dataset
To test the deployed YOLOv8 model, we used the latest iteration of the Common Objects in Context (COCO) dataset [
21]. This dataset is a large-scale image-recognition dataset for object detection, segmentation, and captioning tasks. It is a widely used dataset in computer-vision research and applications, most commonly to train and evaluate many state-of-the-art object detection and segmentation models. Researchers and developers primarily use the COCO dataset to benchmark and improve computer-vision algorithms. Therefore, it has become a standard benchmark in the field and has contributed to significant advancements in the development of computer-vision systems.
The COCO dataset is known for several key characteristics that make it valuable for computer-vision research and bench marking. It contains tens of thousands of images captured from various sources and their corresponding bounding boxes and labels. The objects in the images are are divided into 80 classes that cover a wide range of scenes and settings, depicting everyday life, including indoor and outdoor environments. There are almost 118,000 training images available in this dataset, with a median resolution of 640 × 480 pixels. Finally, the dataset was updated frequently to ensure it stays on par with advancements in computer-vision research. Overall, the COCO dataset is a comprehensive resource for researchers and developers working on various computer-vision tasks, including object recognition, segmentation, and image understanding. The primary reason for the choice of dataset is the fact that YOLOv8 [
22] is trained on the COCO dataset, which ensures that the results obtained are not influenced by the dataset and are only dependent on the cloud platforms that the models are being deployed on.
3.2. Metrics to Be Measured
Based on the available literature on comparisons of cloud platforms, and examining the key influential factors during cloud-platform choice, we use the following metrics:
Upload latency: Time taken to upload data into the platform’s storage. Presented in s/Mb.
Download latency: Time taken to download data from the platform’s storage. Presented in s/Mb.
Inference time: Time taken to perform inference on batches of 1024 images. Presented in s/Mb.
Throughput: Measure of the total time taken to retrieve images from storage and the object-detection algorithm inference time. Throughput = size_of_1024_images/total_time.
Monetary cost: one off, final monetary cost of the deployment of the application.
ML service catalog: the availability of resources to deploy machine learning models, in particular object-detection models, on the platform.
Ease of deployment: the ease of deployment in terms of the entire process needed to deploy an object-detection deep learning model such as YOLOv8 on the platform.
Service-level agreements: the robustness of the service-level agreements (SLAs) that outline the commitment between the service provider and a client in terms of connectivity and up-time.
3.3. Quantitative and Qualitative Comparison
Once we deploy the model on each platform, we use the Python SDK for each platform to perform the necessary quantitative analysis querying the model as a user. In fact, we also build a web application that is deployed on the cloud and can be used to upload an image and retrieve the bounding box annotations for the image by either Azure or AWS as per the selection.
To compare the upload latency, download latency, inference time, and throughput, we examine the distribution of the values per batch of 1024 images. With over 118,000 images, this gives us 116 batches with a single value for each variable per batch. We also examine the normalized times in terms of seconds per mebibyte and perform a statistical comparison by using the Kruskal–Wallis test of independence to determine if the distributions are statistically different from one another. This tells us if the methods are comparable or if one method is statistically better than the other.
For qualitative comparisons of the cost structure, availability of machine learning resources, and ease of deployment, we examine the literature, documentation, and our own experience with the platforms in this research to provide a comprehensive discussion and comparison, which includes justifying the use of certain deployment options.
3.4. Specifications of Instances Deployed
Both platforms followed a standardized set of steps for deployment. These steps included the upload of the training dataset as object storage, creating a notebook instance for model configuration, the creation and deployment of a model endpoint, and finally the deployment of the client application into a web server. Since both AWS and Azure have a different portfolio of services, this pipeline was created differently for each platform. A brief summary of the services provisioned per platform can be seen in
Table 1. The documentation for AWS [
23] and Azure [
24] provides a more detailed insight into the capabilities of the mentioned services.
3.4.1. AWS Evaluation
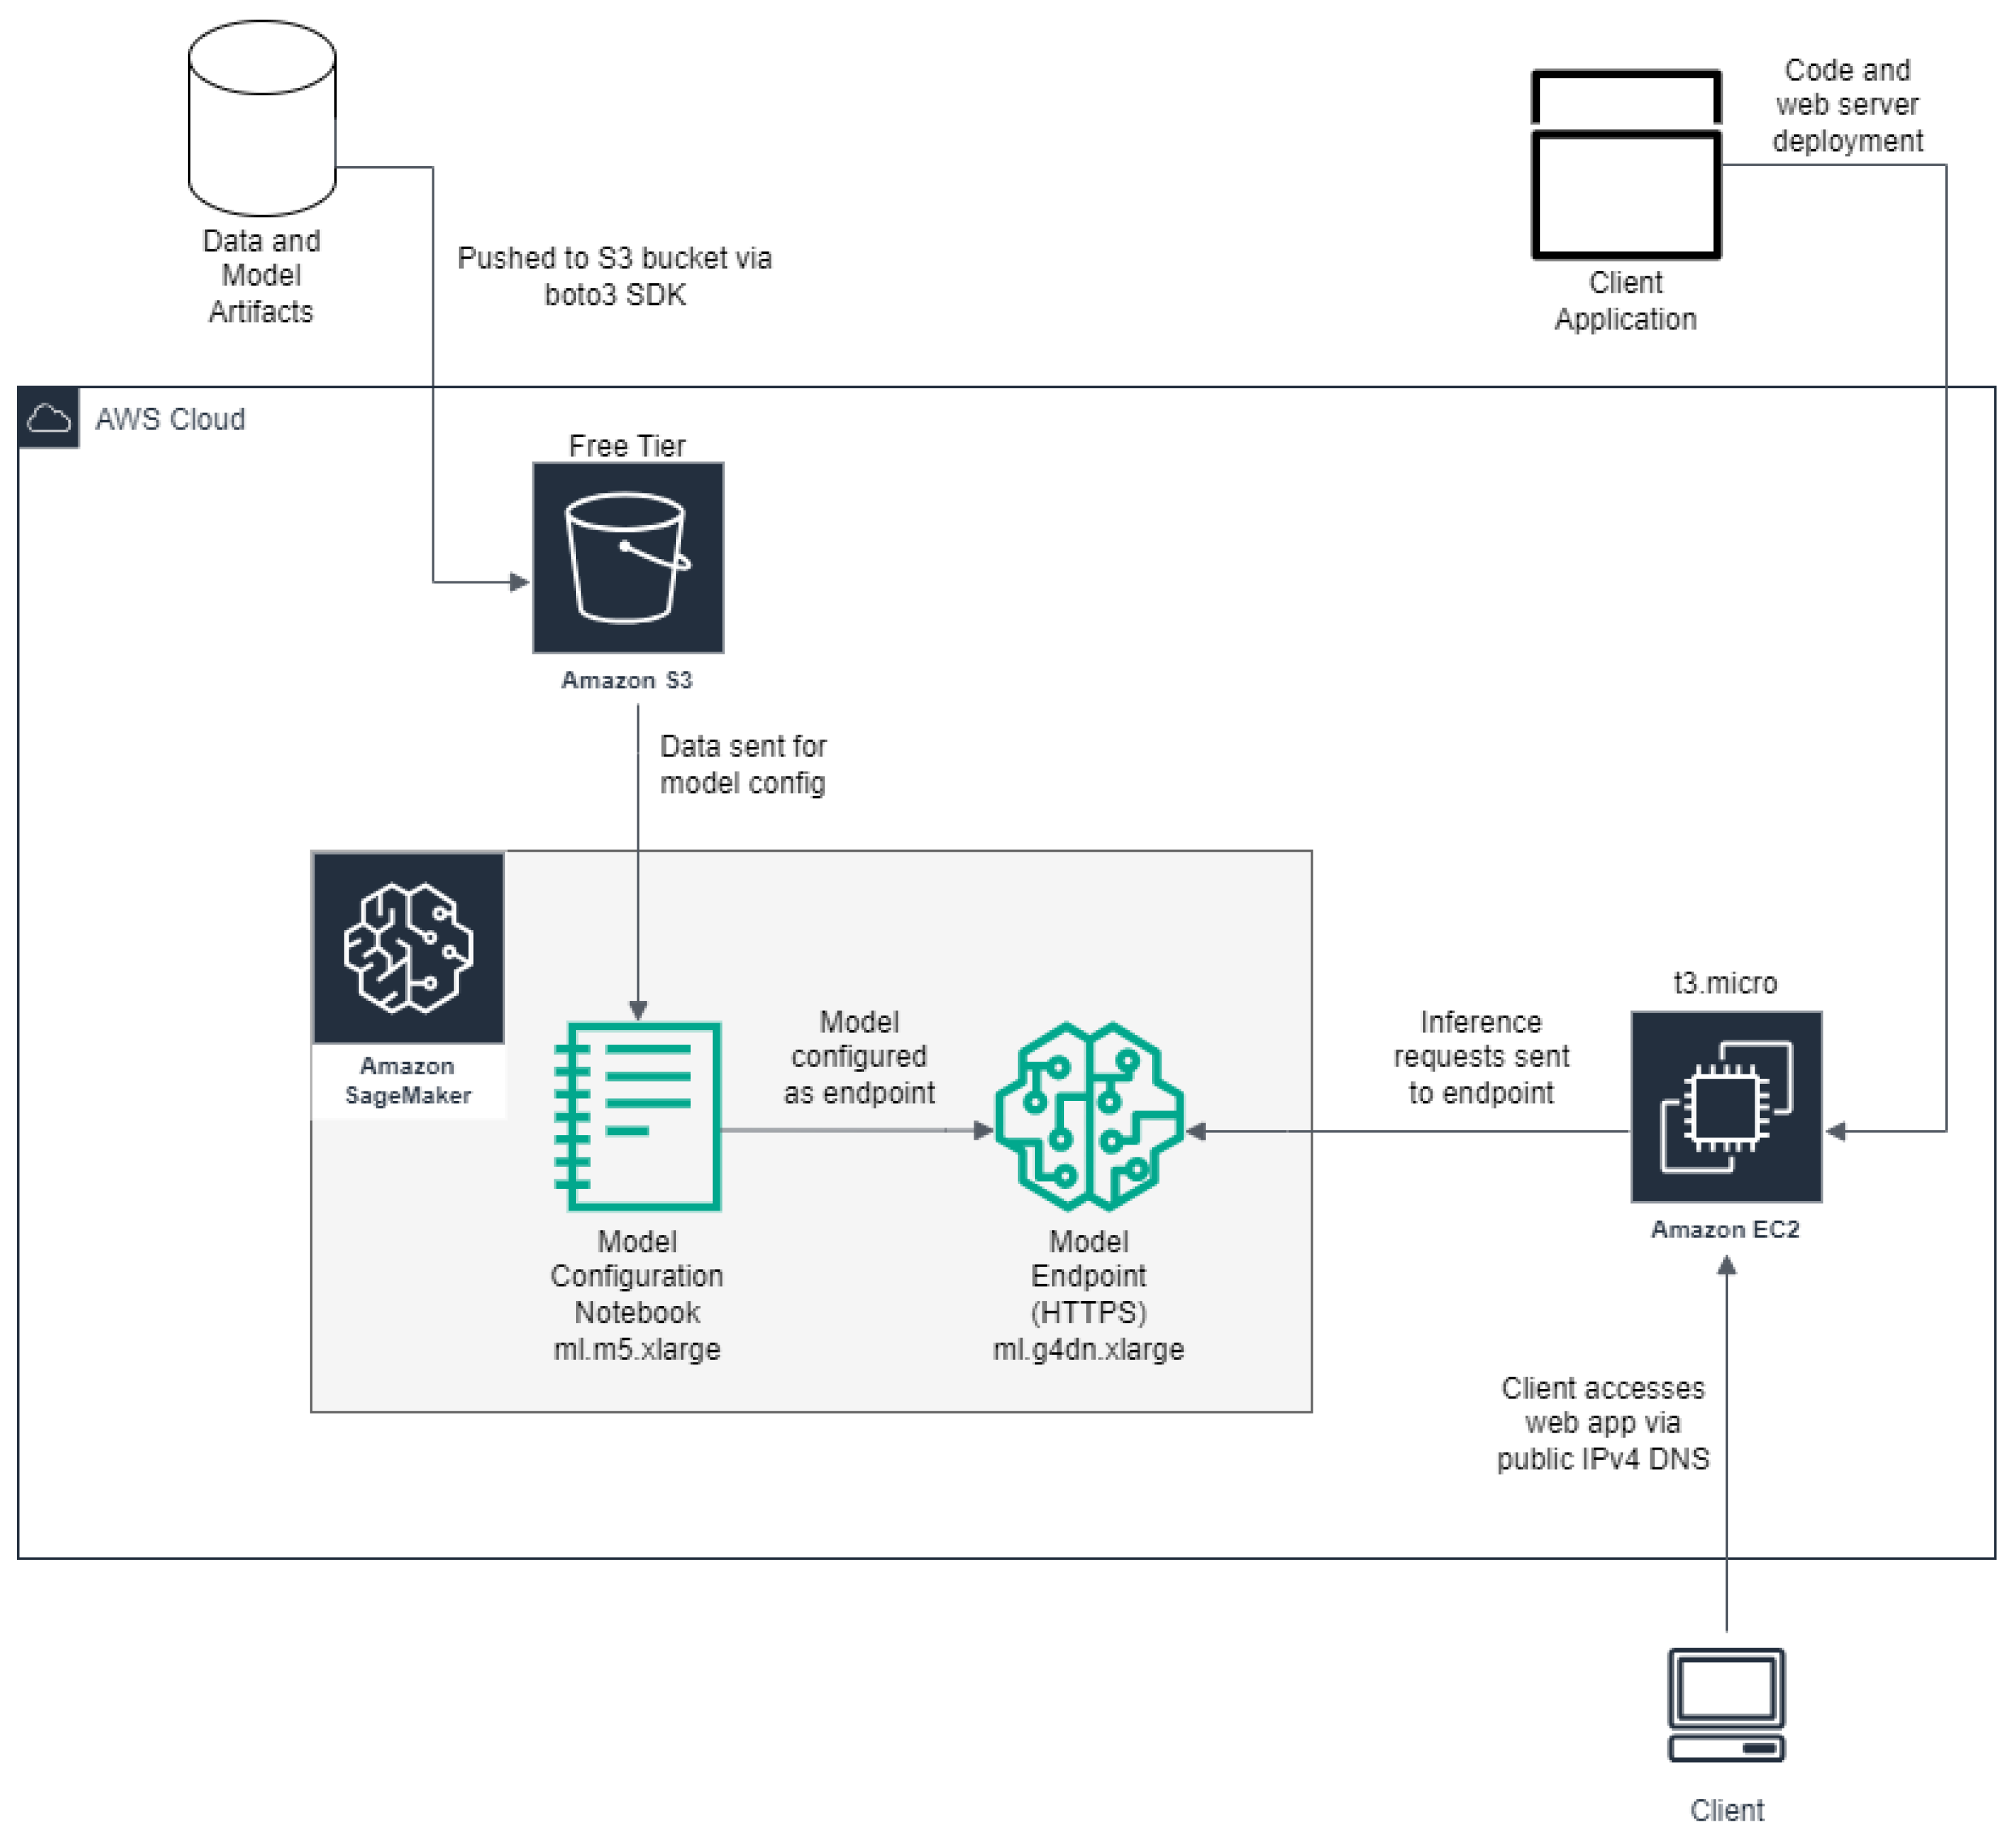
As in
Figure 1, the dataset was stored in an Amazon S3 bucket to make it accessible via the cloud. Next, a SageMaker notebook instance was used to create the model endpoint, with a SageMaker endpoint to deploy the model.
It is important to note that the model deployment was conducted on an ml.g4dn.xlarge instance, which has an Nvidia T4 tensor core GPU with 16 GB of VRAM. The use of a GPU is crucial since most machine learning models use a GPU for accelerated performance and is a key contributor for real-time inference.
Finally, to make our machine learning model accessible to users, we set up a client application. This application needed a dedicated server to function as a web server to process incoming requests. Hence, we used Amazon’s Elastic Compute Cloud (EC2) Infrastructure as a Service (IaaS) and deployed a virtual machine. Specifically, we used the t3.micro Linux instance as our client application was lightweight and highly efficient.
3.4.2. Azure Evaluation
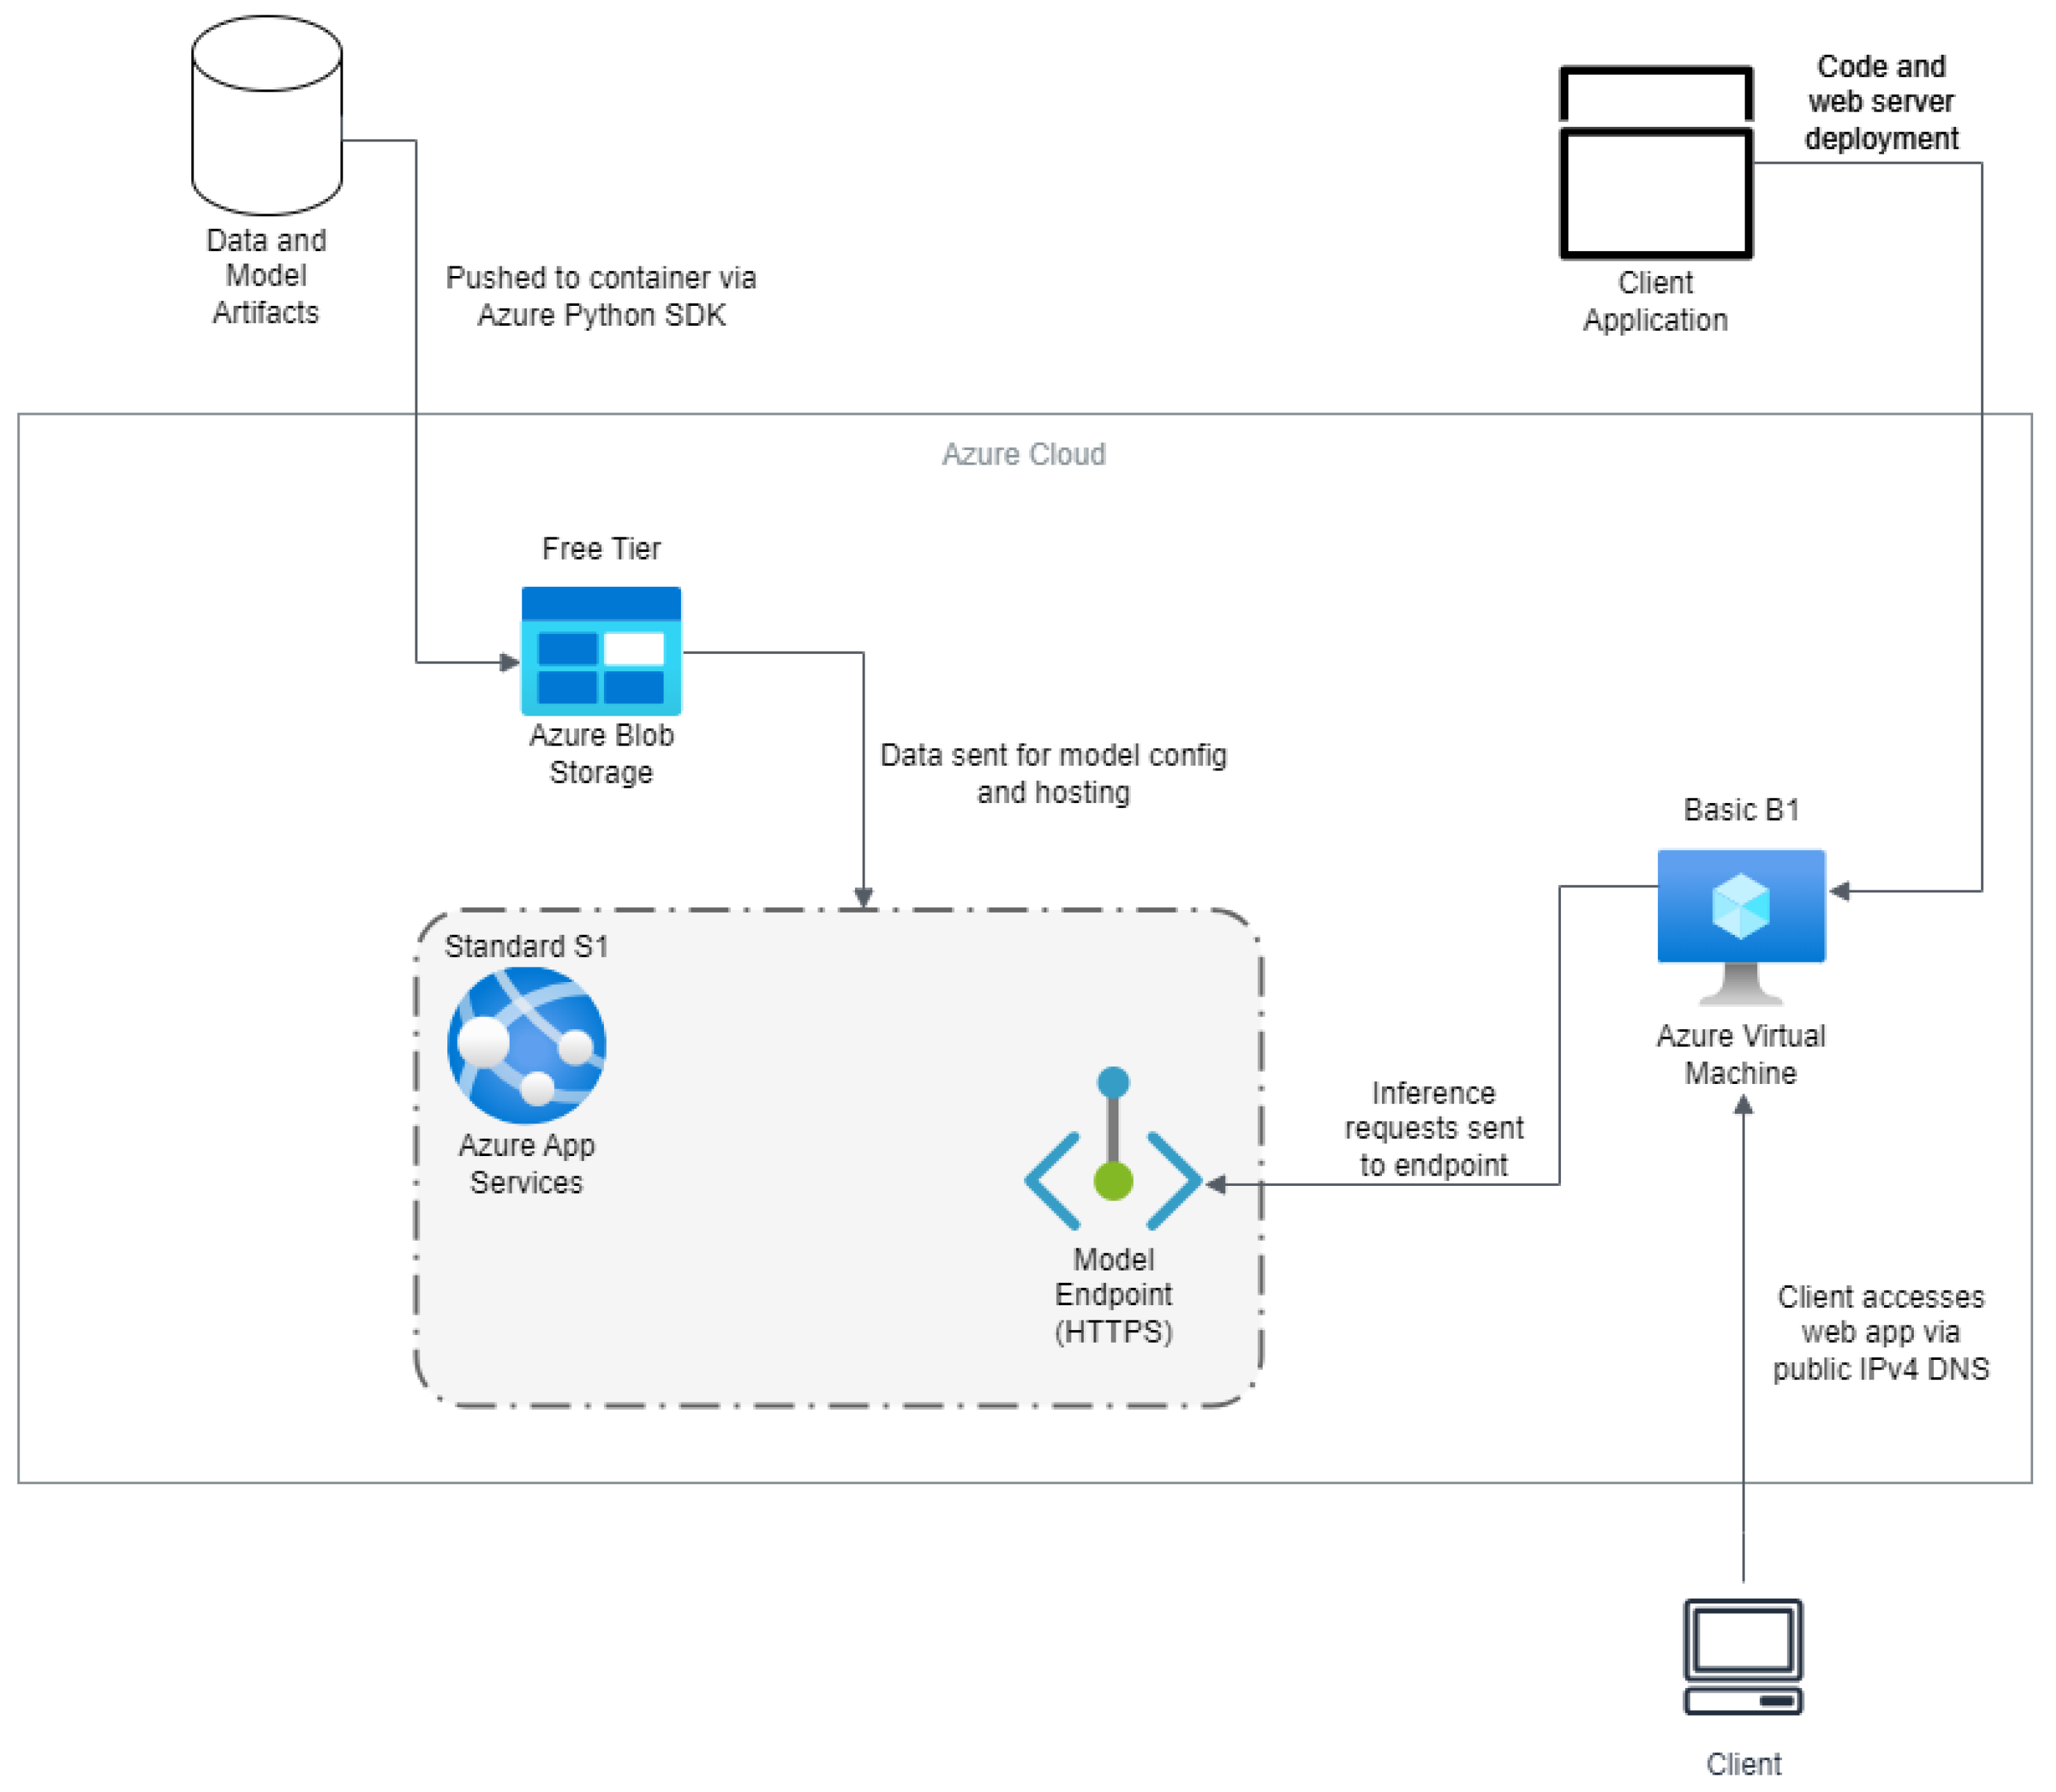
Similarly,
Figure 2 illustrates the Azure architecture used, where the dataset was stored on Azure Blob Storage. Next, to configure and deploy our machine learning model, we developed a Flask microservice that served as a web application. This web application was constructed because of Azure’s machine learning services not easily allowing for the model hosting of YOLOv8. It was deployed as a web service on Azure App Services with an endpoint by using Azure’s model endpoint.
Since Azure was unable to allocate GPUs for our research because of our free-tier plan and the surge in demand for GPU instances, we enabled autoscaling to compare with AWS GPU-based inference. Hence, autoscaling was enabled in this case to allow more requests to be processed per second, as discussed in [
25,
26], and make that comparable to the AWS GPU powered inference. We recommend this approach for the deployment of machine learning models when GPUs are not accessible to allow for low inference times when the application requires several requests per second. Lastly, we use an Azure VM to query the web application that hosts the model via a client application to be used for inference.
3.5. Description of Microservices Used
This project utilized four main services on both cloud providers, namely, storage, computing, machine learning, and web app services. The description of each service can be summarized as follows:
Storage: the storage resource used for this project is mainly object-storage services, used to store the data.
AWS: AWS offers object-storage services through the Amazon S3 service, which provides a platform for storing and retrieving large amounts of unstructured data.
Azure: Azure offers object-storage service through the Azure Blob Storage service, which offers a scalable platform for unstructured data.
Compute: The compute resource used for this project is mainly virtual machines that are used to host the infrastructure components of the client application. These include the frontend application code base and its corresponding web-server engine.
AWS: AWS offers compute instances through the Amazon EC2 service, which provides a resizable compute capacity in the cloud.
Azure: Azure offers compute instances through the Azure Virtual Machine service, which offers a scalable compute capacity for running applications.
Machine learning: The machine learning resources used in this project mainly pertain to AWS because of the reasons discussed in the previous section. The resources provided by the machine learning services include the building, training, and endpoint deployment of machine learning and deep learning models.
AWS: AWS offers machine learning services via its native machine learning platform as a service (PaaS) known as Amazon SageMaker. It is a fully managed machine learning platform that enables you to build, train, and deploy machine learning models.
Web application: The web application resources used in this project mainly pertain to Azure because of the reasons discussed in the previous section. The main aim of web application deployment is to expose a machine learning microservice that can be called by using a Representational State Transfer (REST) Application Programming Interface (API). The microservice accepts the Hypertext Transfer Protocol (HTTP) and Hypertext Transfer Protocol Secure (HTTPS) requests in JavaScript Object Notation (JSON) format while returning a JSON response containing the inference results.
4. Results and Discussion
This section presents a comprehensive analysis of the experiments conducted on AWS and Azure. It encompasses the outcomes for each metric, providing a detailed assessment of their performance. Finally, this section concludes with an overarching comparison between AWS and Azure, aligning the results with specific business requirements.
4.1. Download Latency
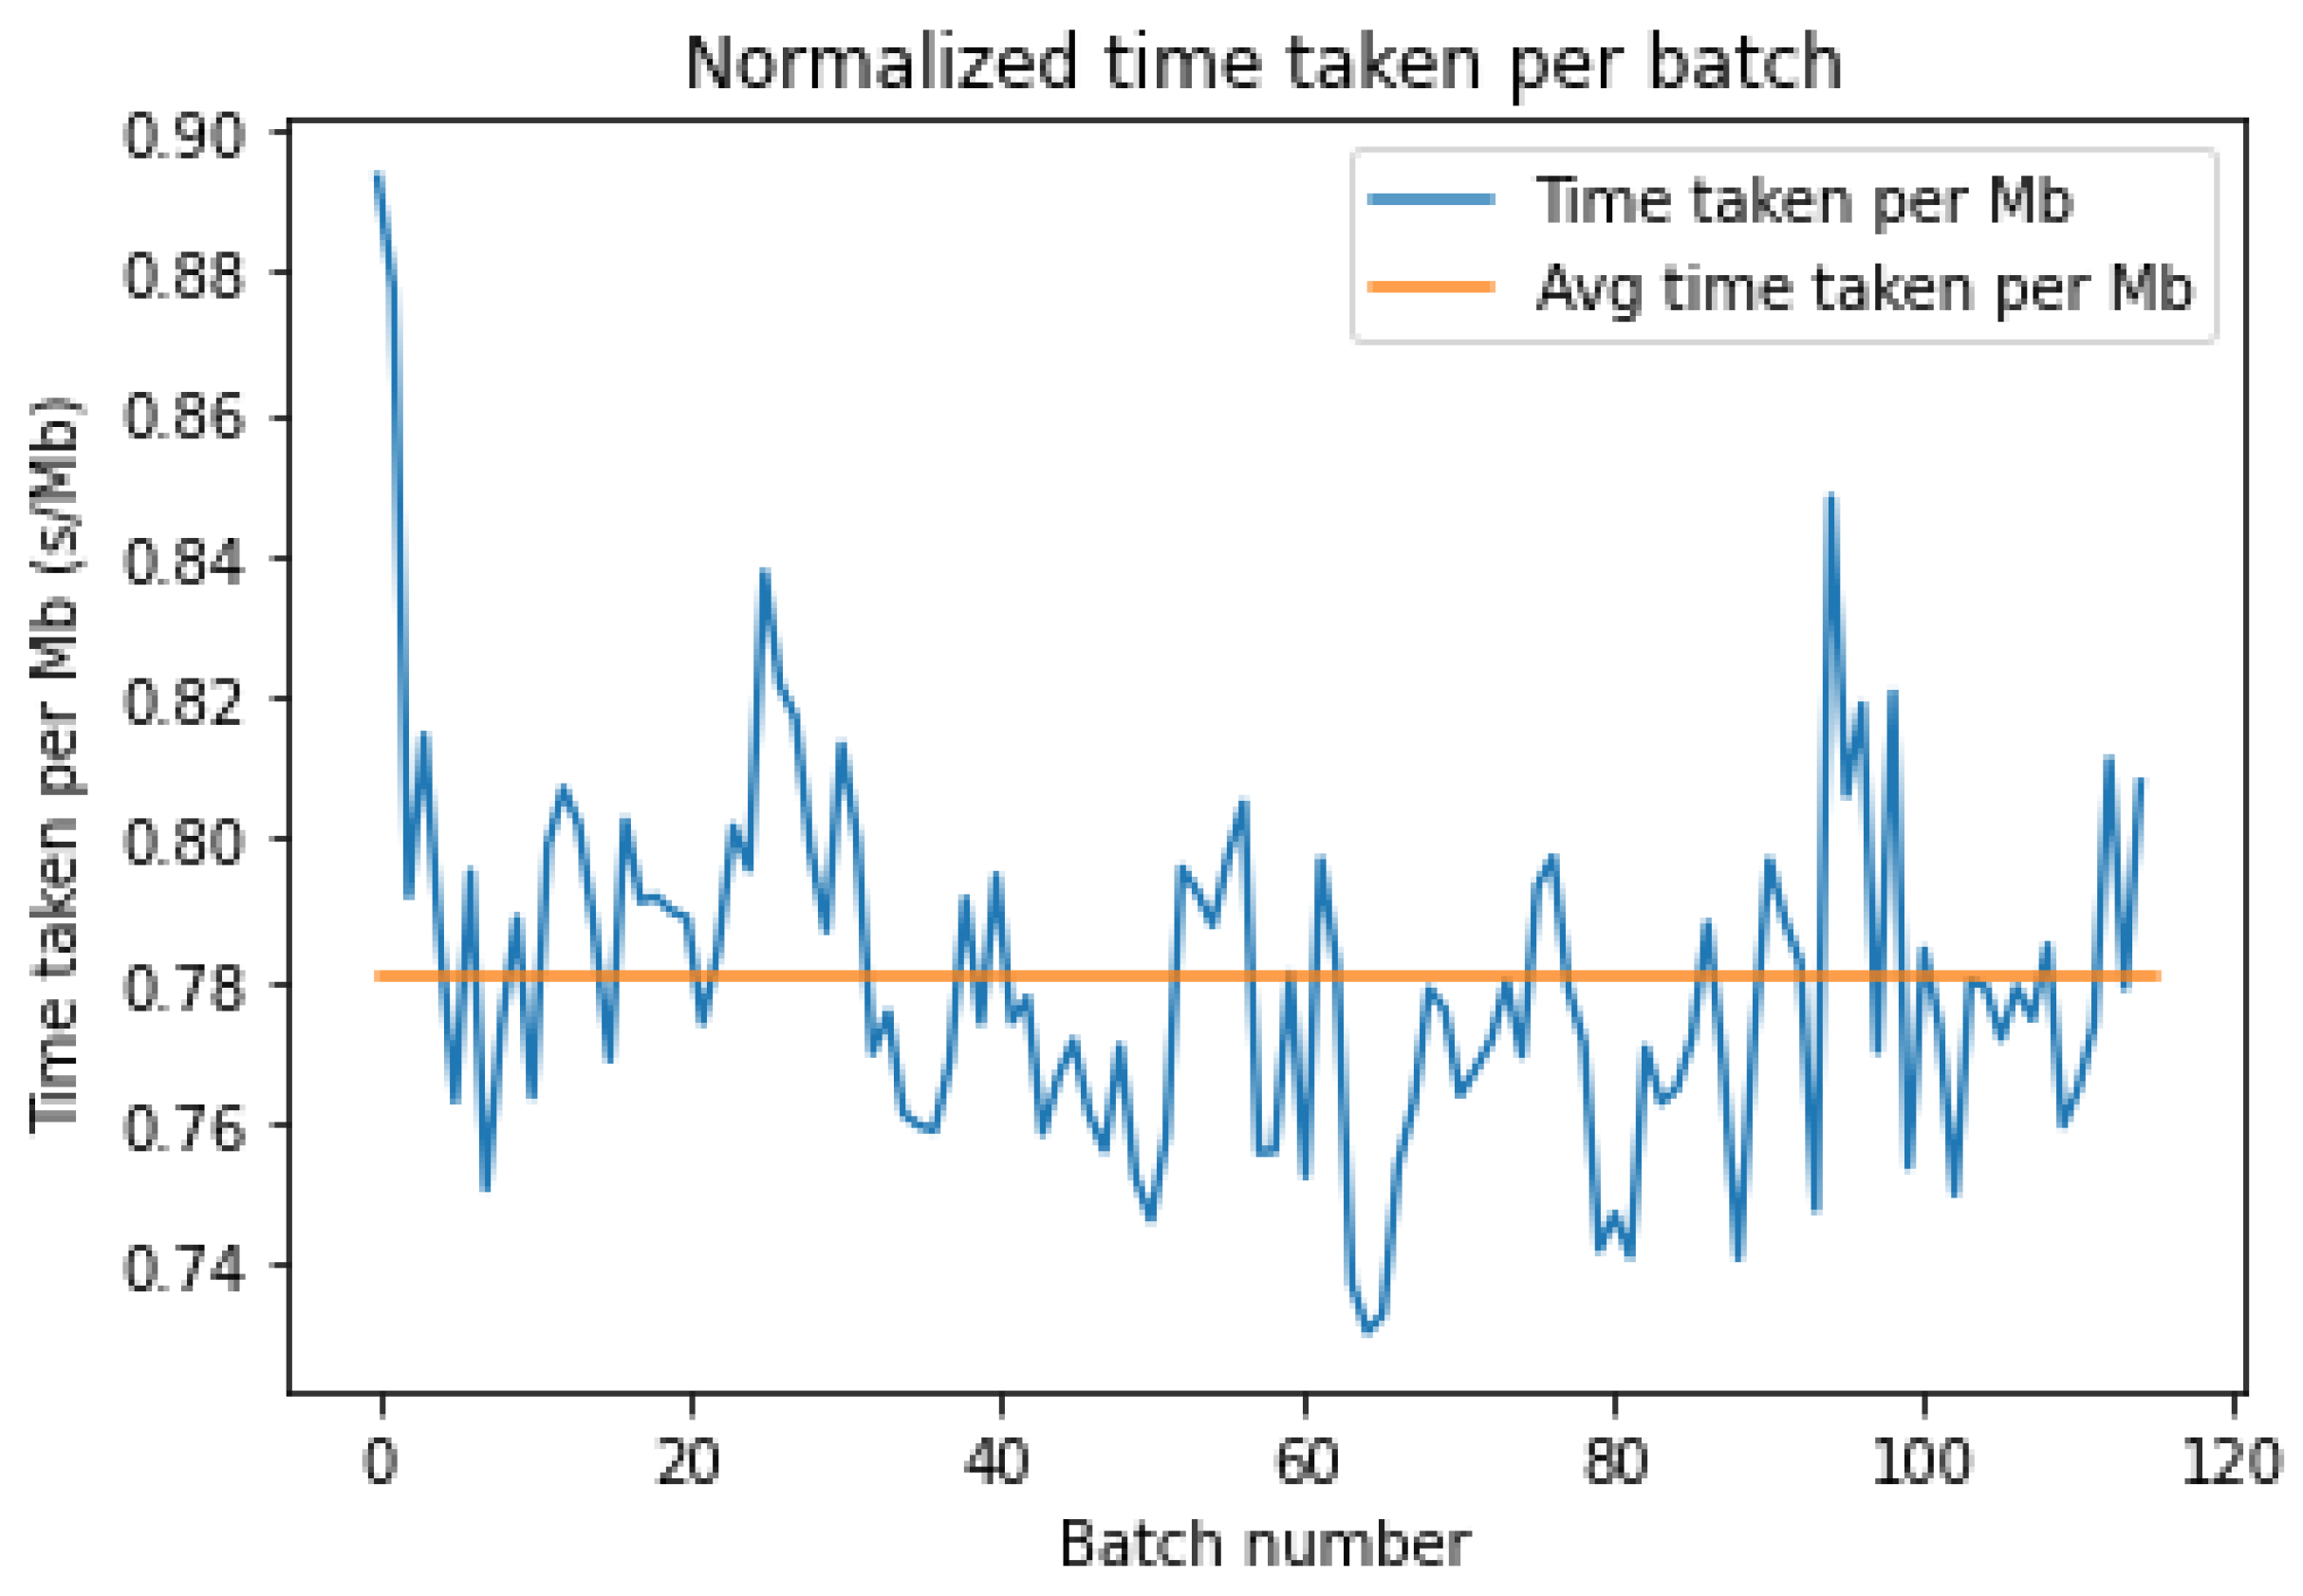
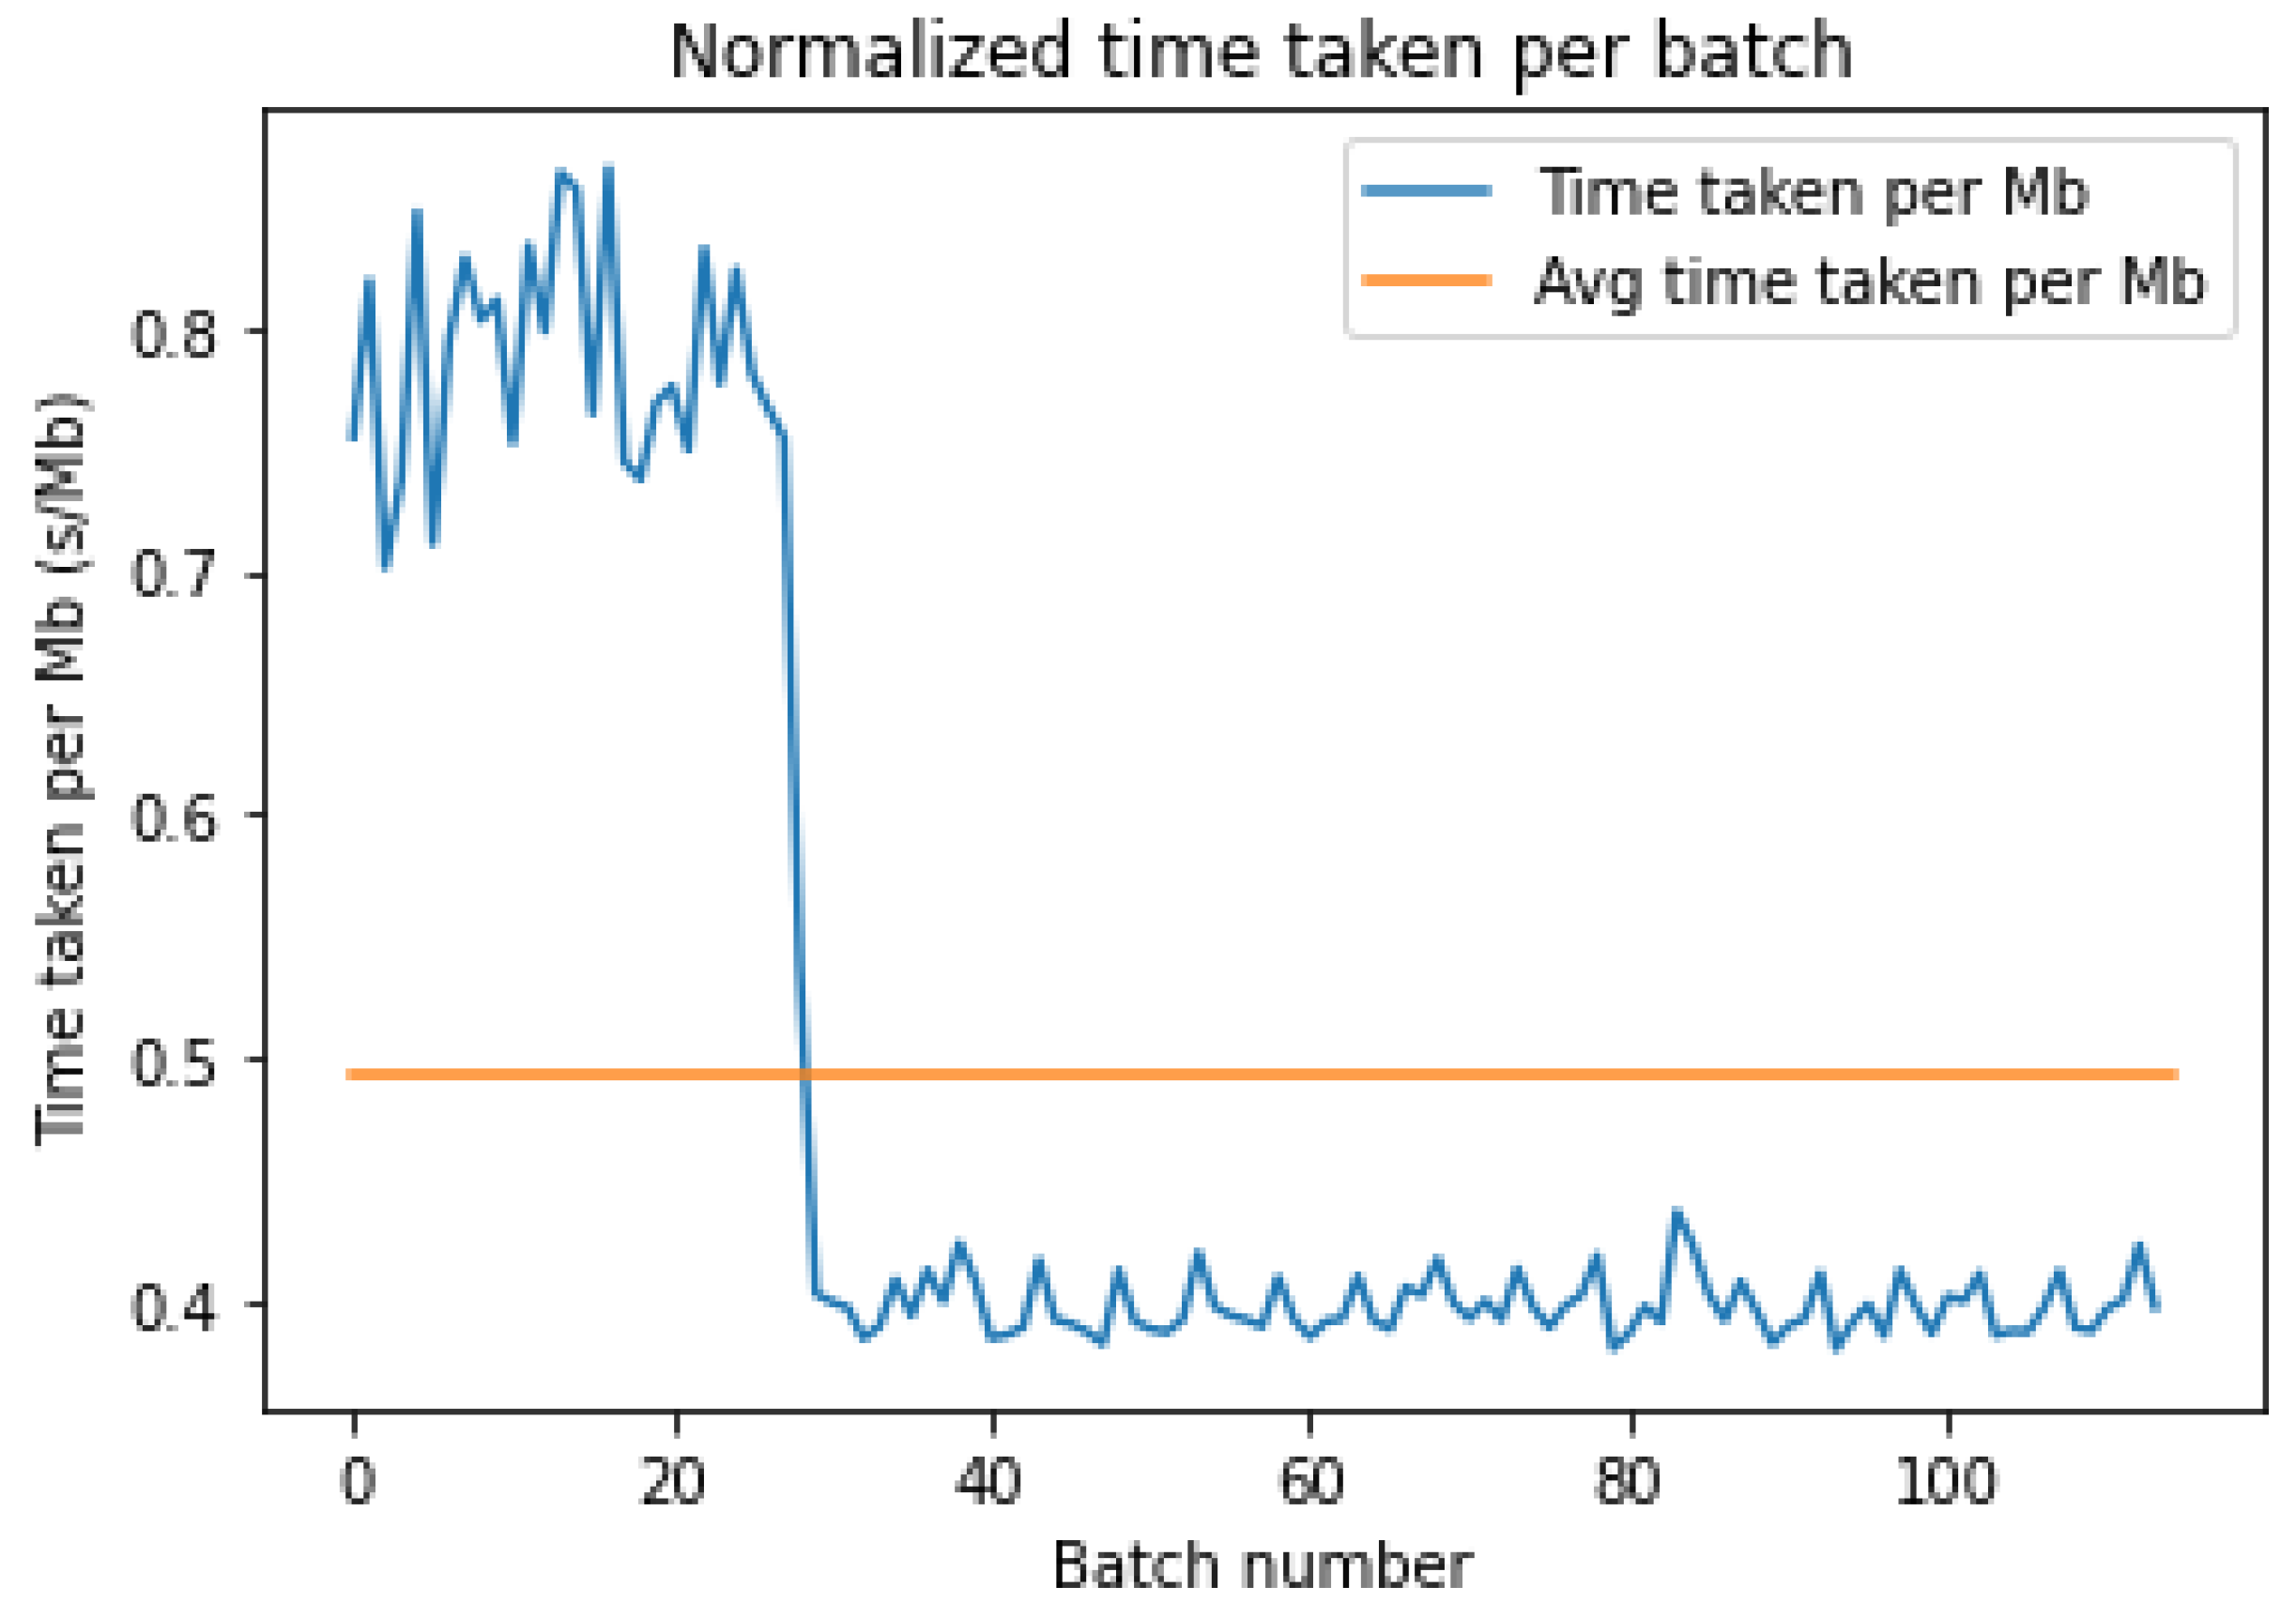
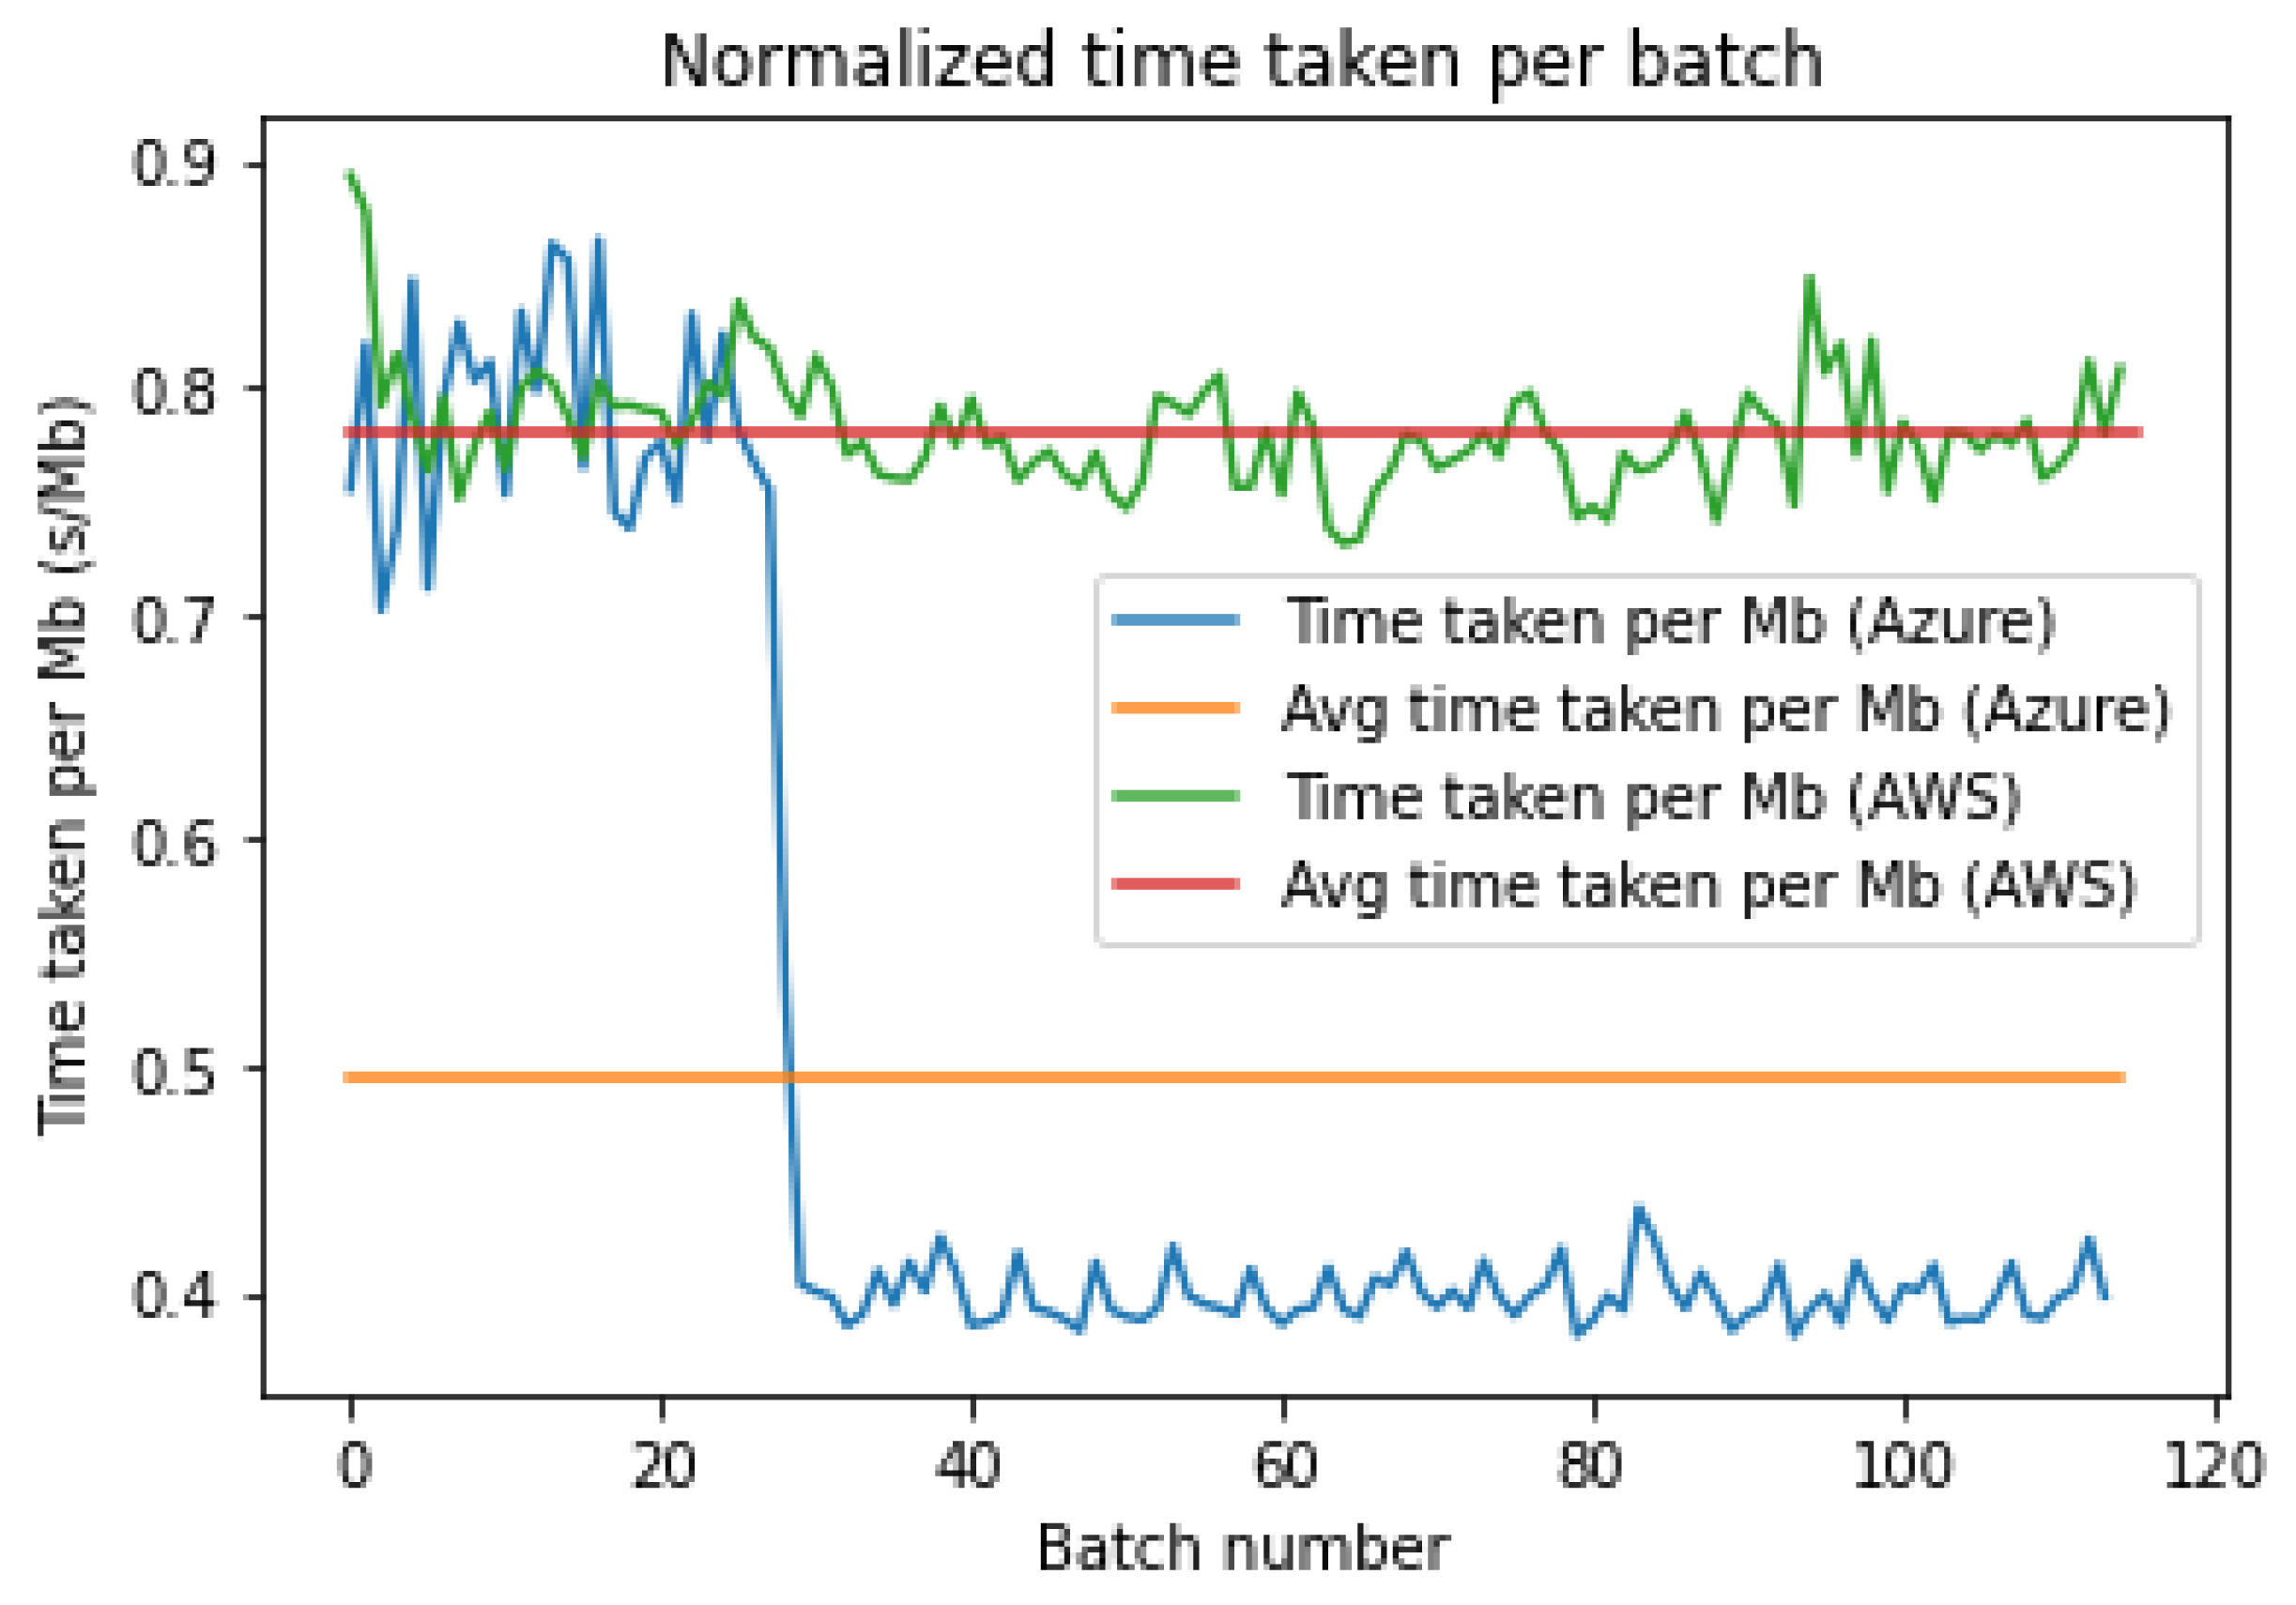
Figure 3 and
Figure 4 show the time taken in seconds per mebibyte of data for each batch to be downloaded from the storage platform. The fluctuations are not due to the varying sizes of the batches since the data above were normalized by the batch size. In fact, these fluctuations can be attributed to the varying latencies to the storage bucket. However, an interesting trend can be seen in
Figure 4 above, whereby there is a sharp drop in the download time per MB around the 30th batch, which reduces the average latency to lower than AWS.
As seen in
Table 2 above, the average and median download time for Azure is far lower, but it has a much higher standard deviation due to the initial high download time before batch 30.
As in
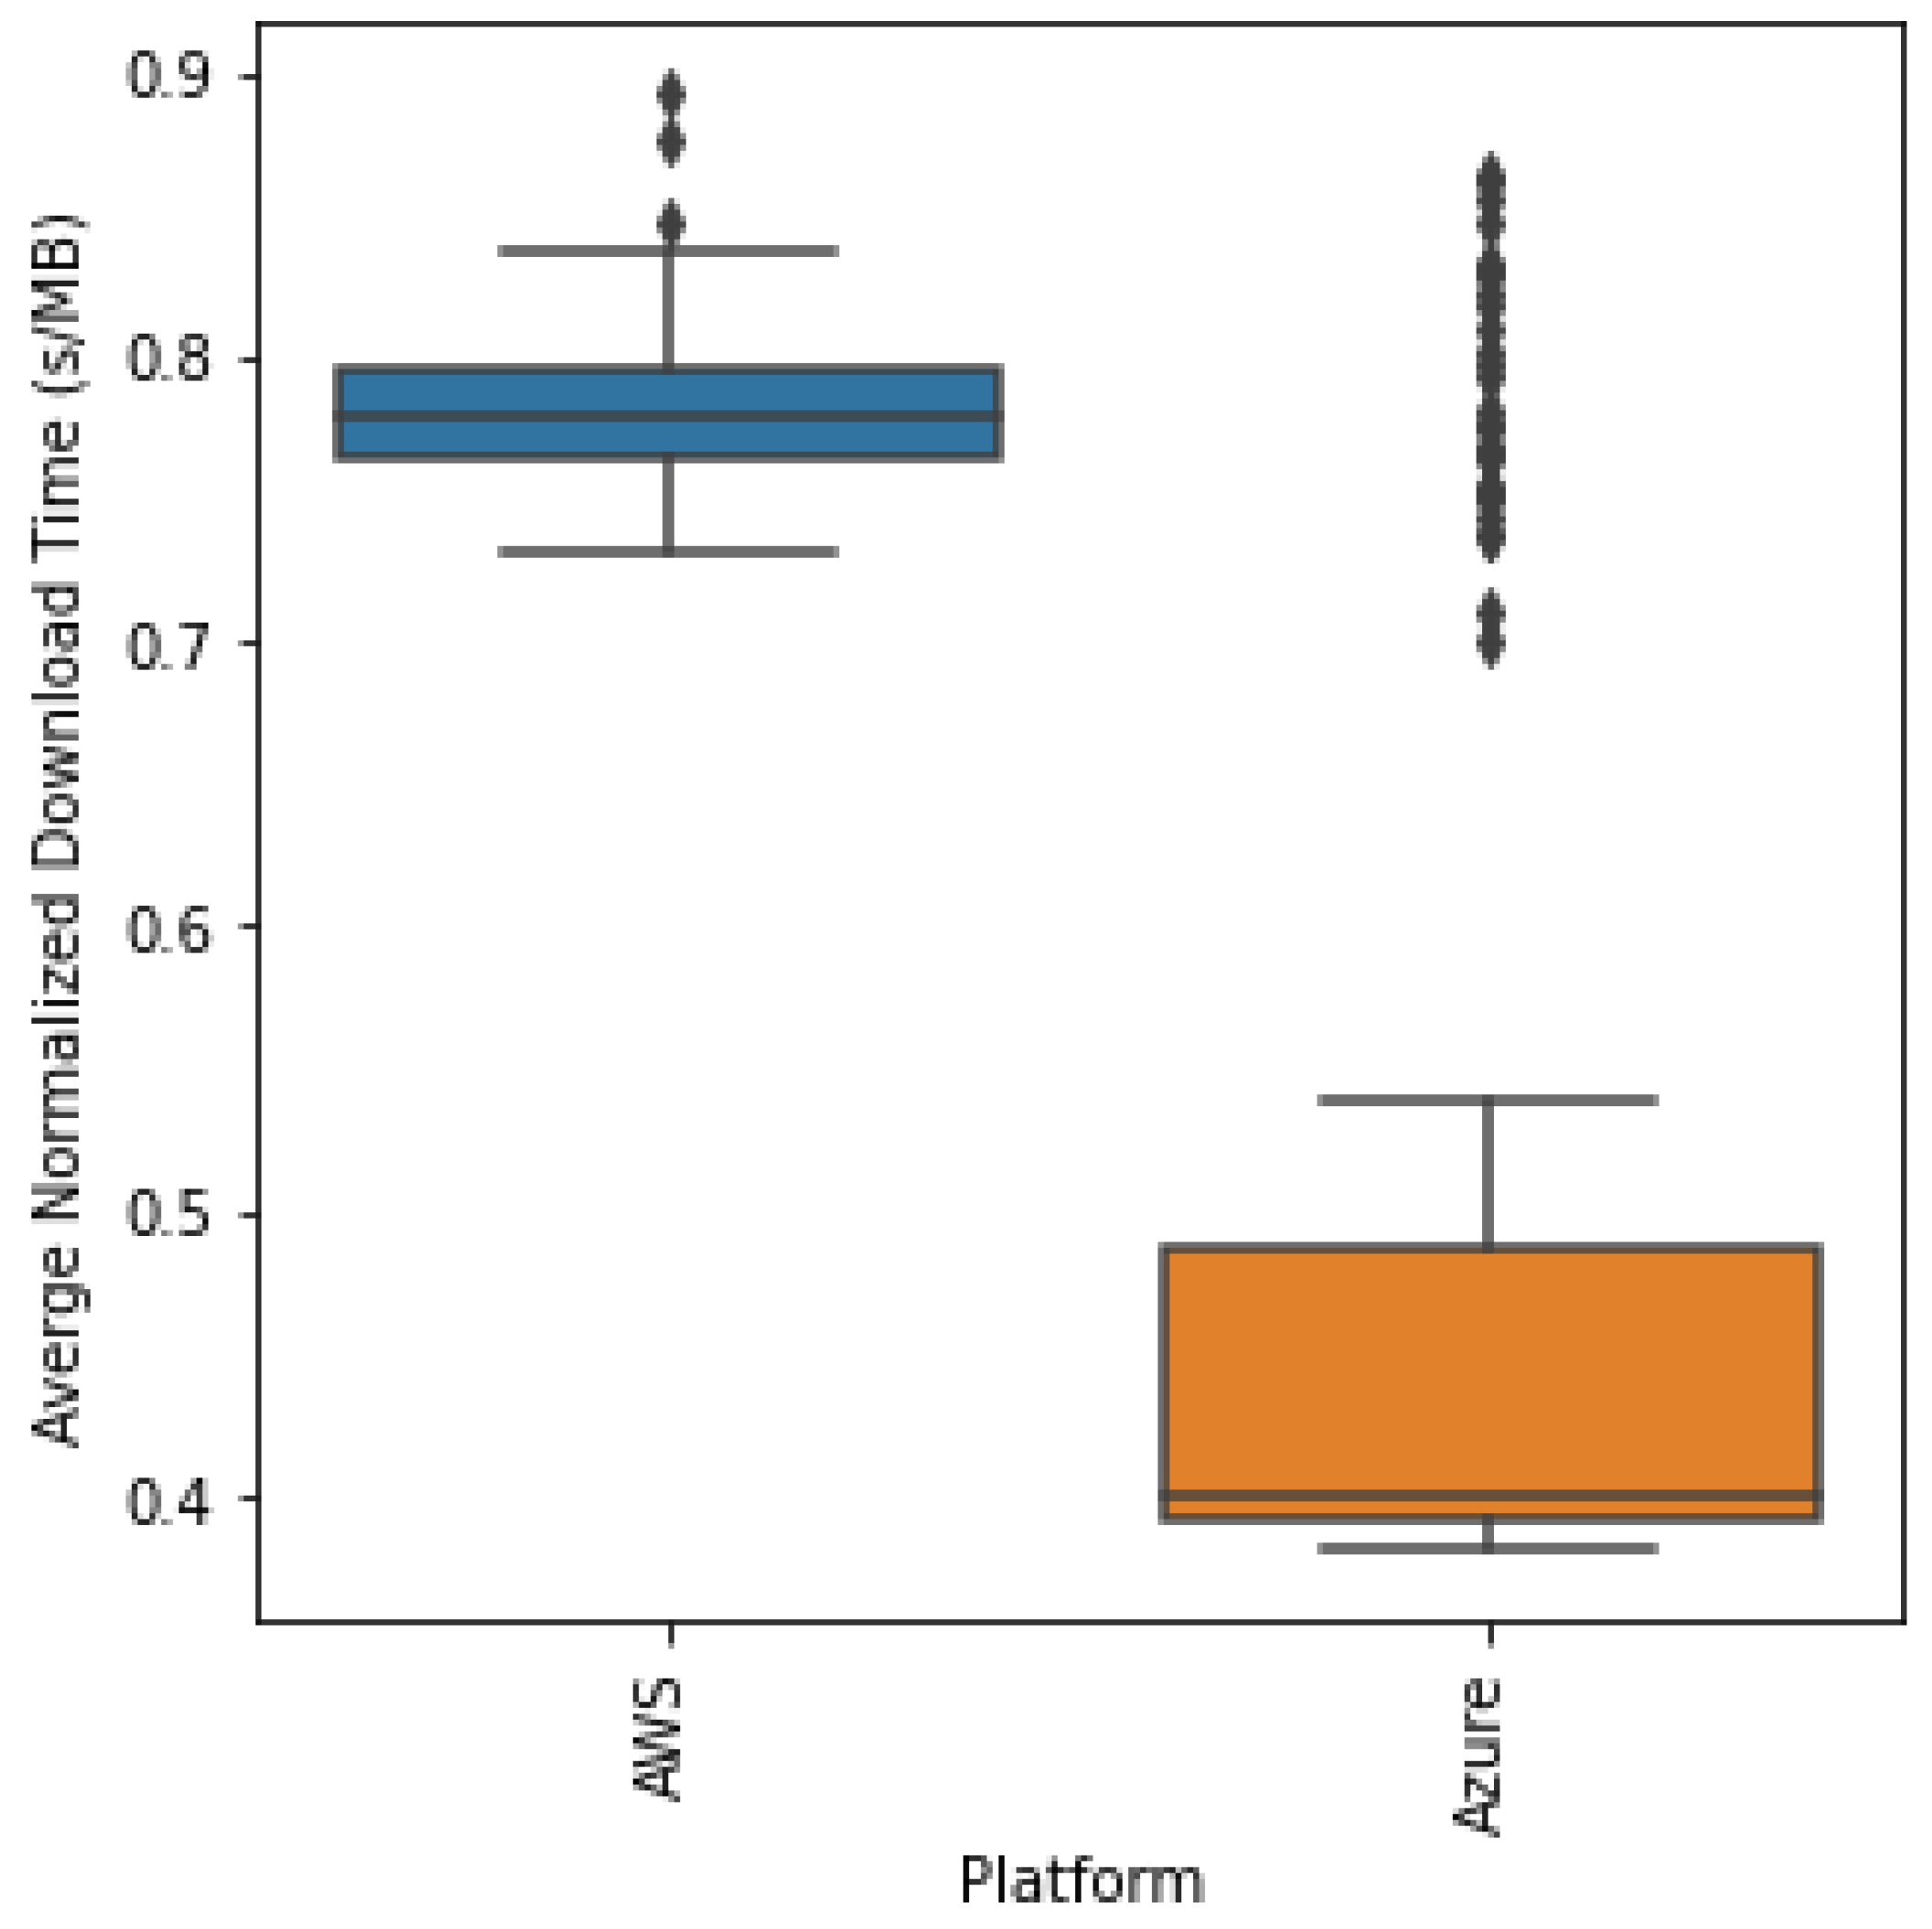
Figure 5, both platforms start out with a comparable download time, but after batch 30, we hypothesize that Azure pushes us up to higher priority, giving us faster download times due to its dynamic priority allocation. This leads Azure to have a 0.4 s/MB download while AWS remains high at 0.78 s/MB. We can statistically compare the distribution of the normalized download times as in the boxplot of the download times per platform shown in
Figure 6 below.
Clearly, as in
Figure 6, Azure has a lower download time overall but has several outliers in the data similar to AWS. Hence, we performed the Kruskal–Wallis test to statistically determine if the distributions are different. We obtained a statistic of 93.754 and a
p-value of 0.000 < 5%, allowing us to reject the null hypothesis and conclude that the distributions are actually statistically different, and Azure does indeed have a lower download time.
4.2. Upload Latency
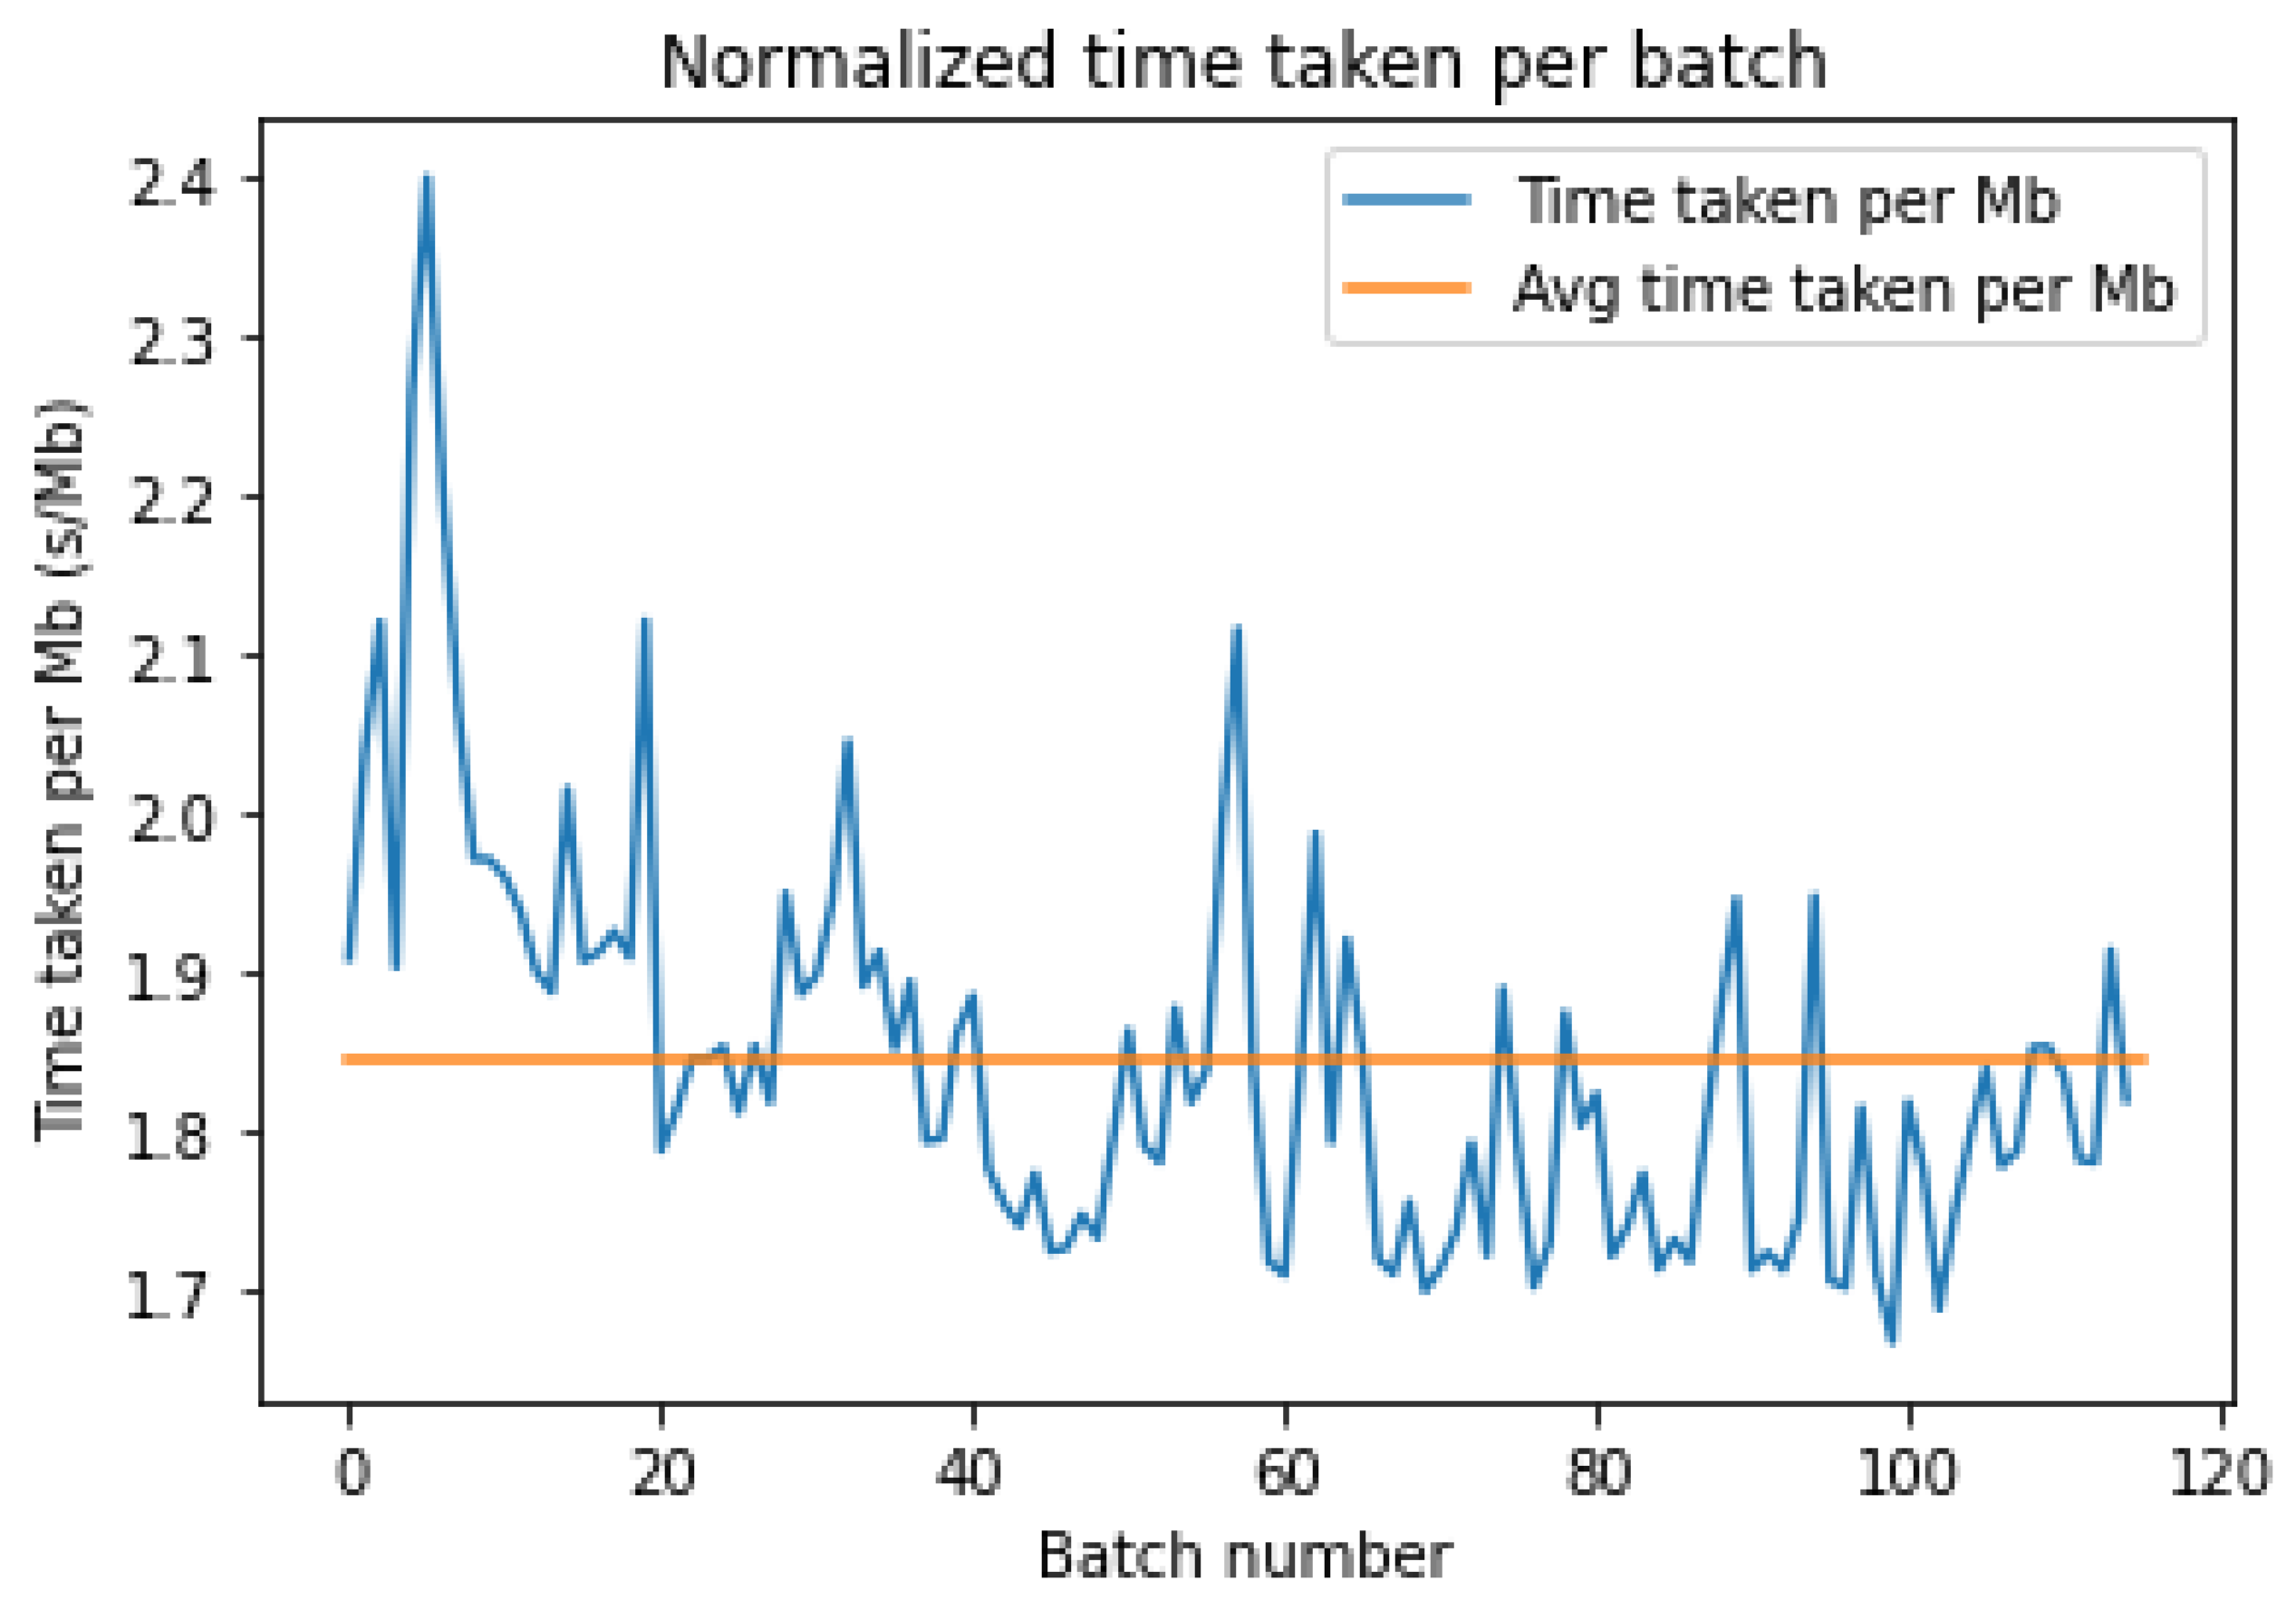
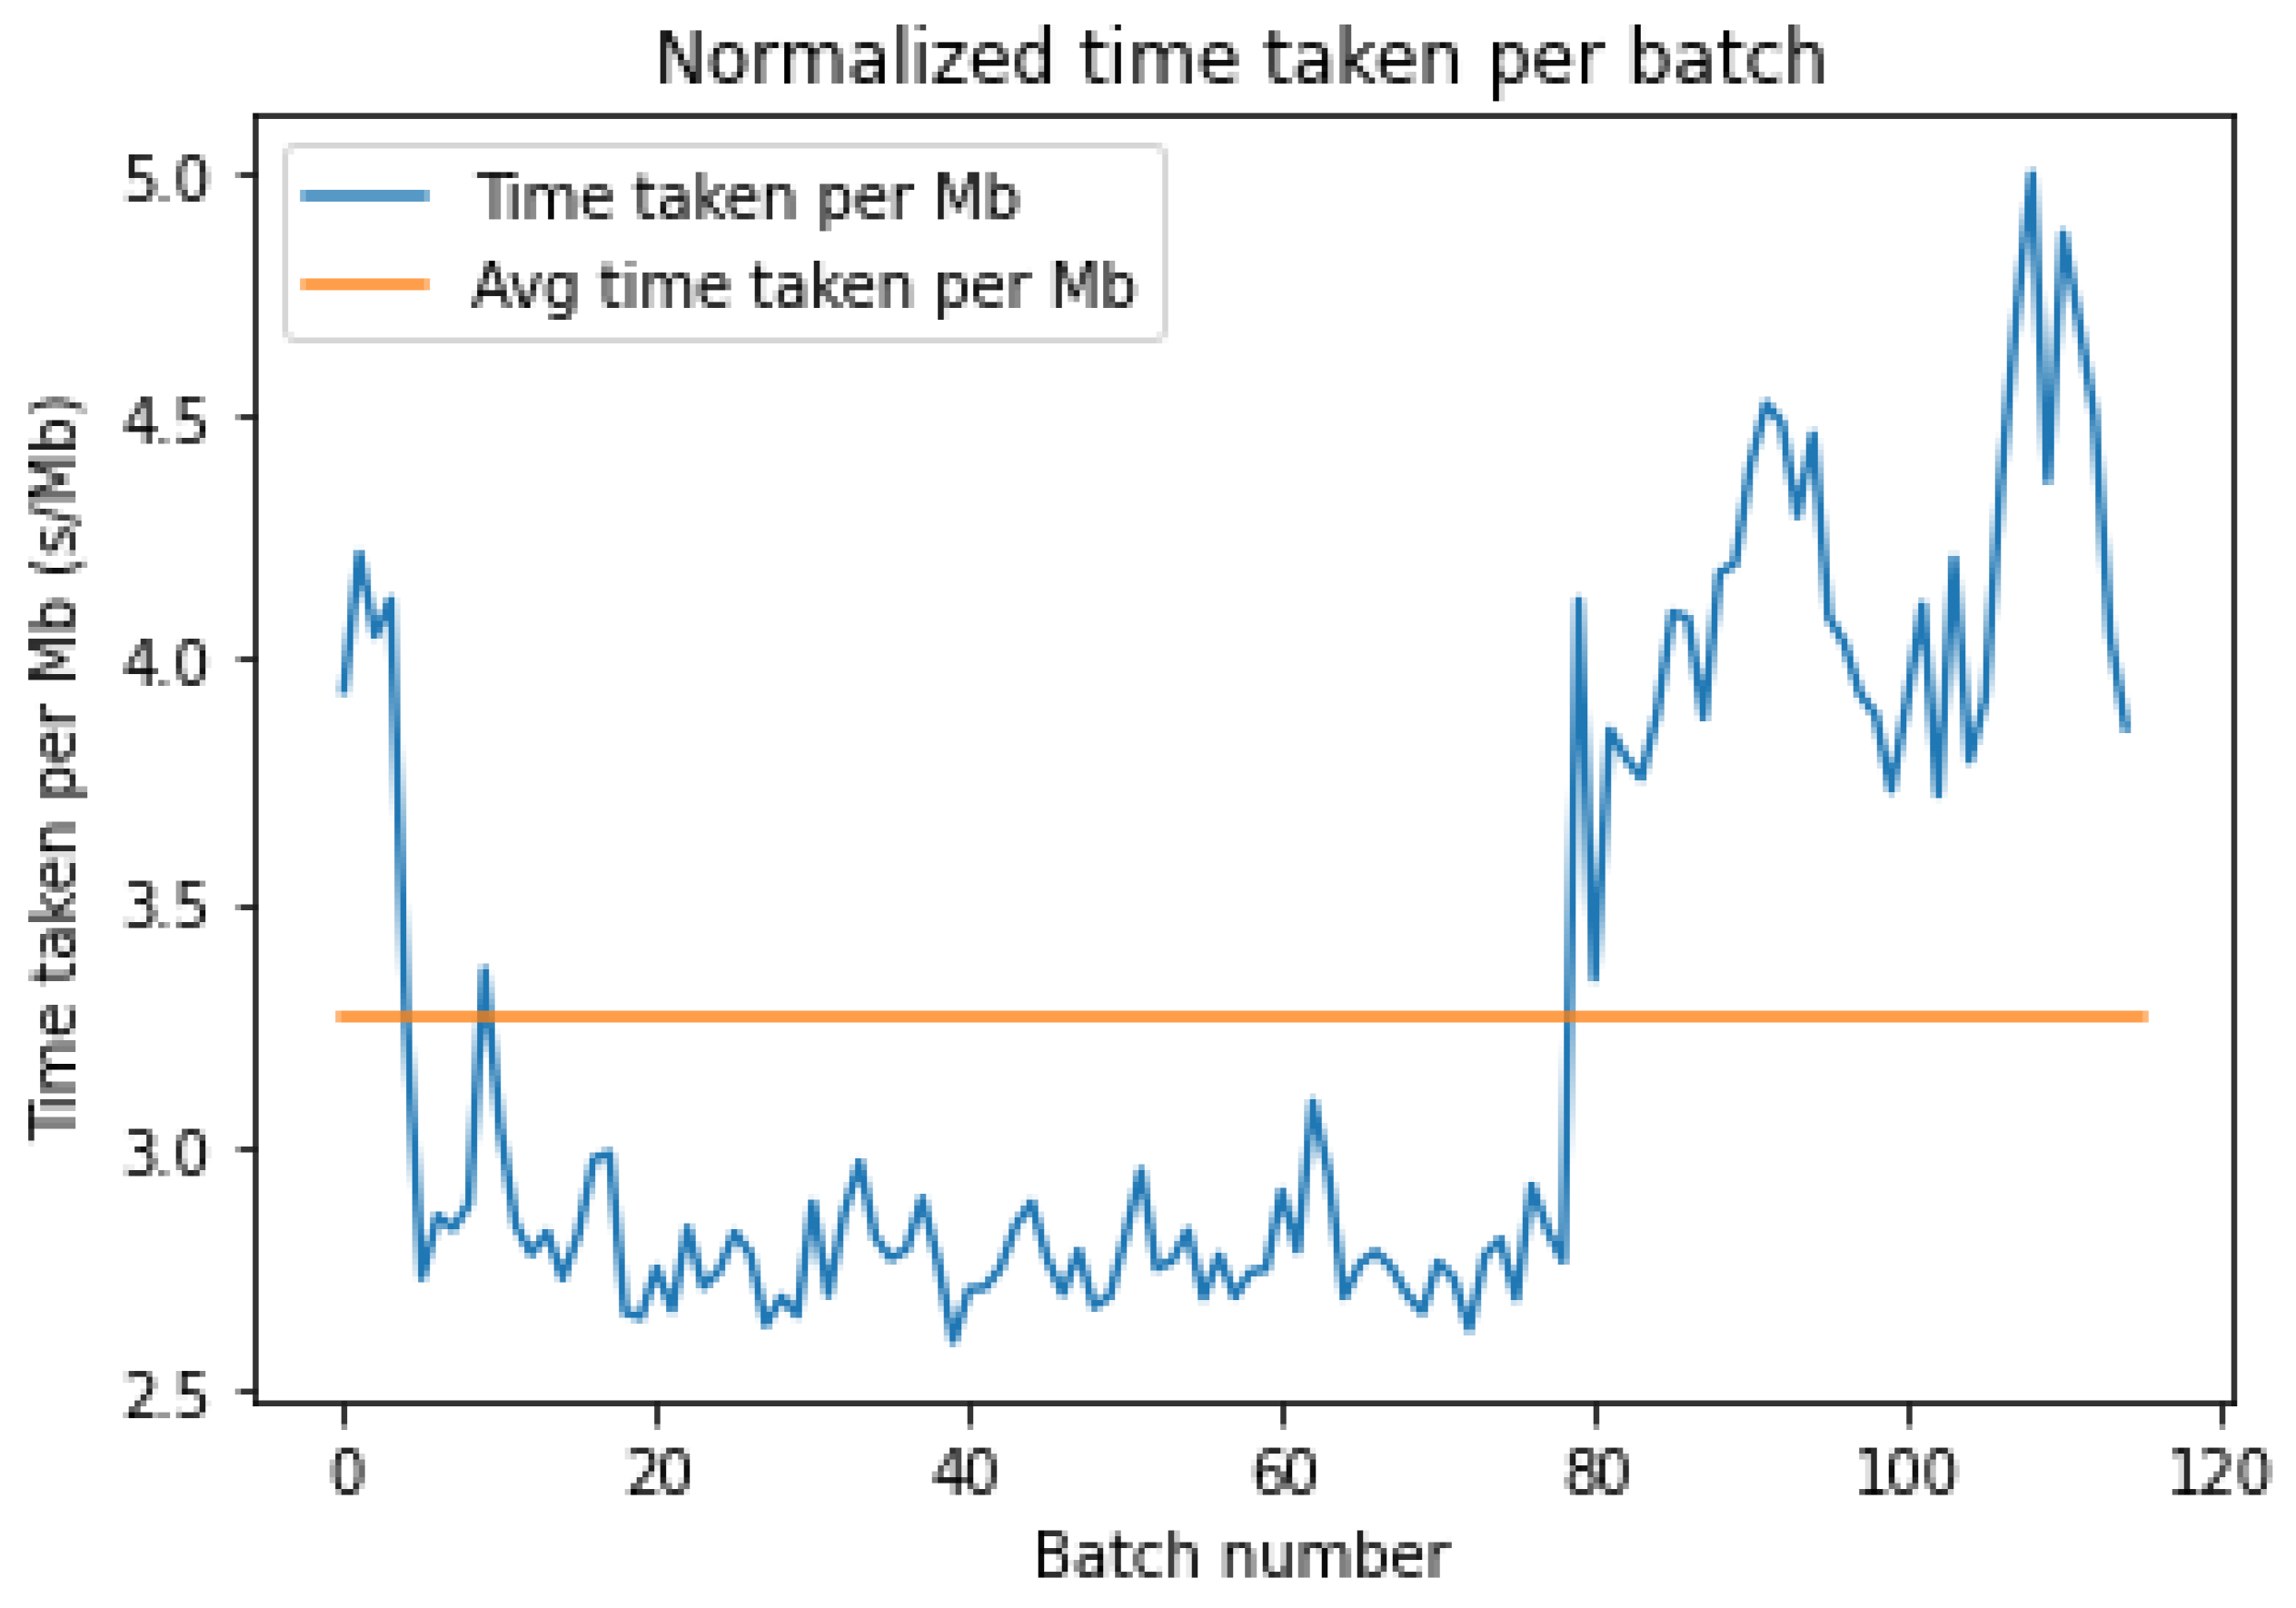
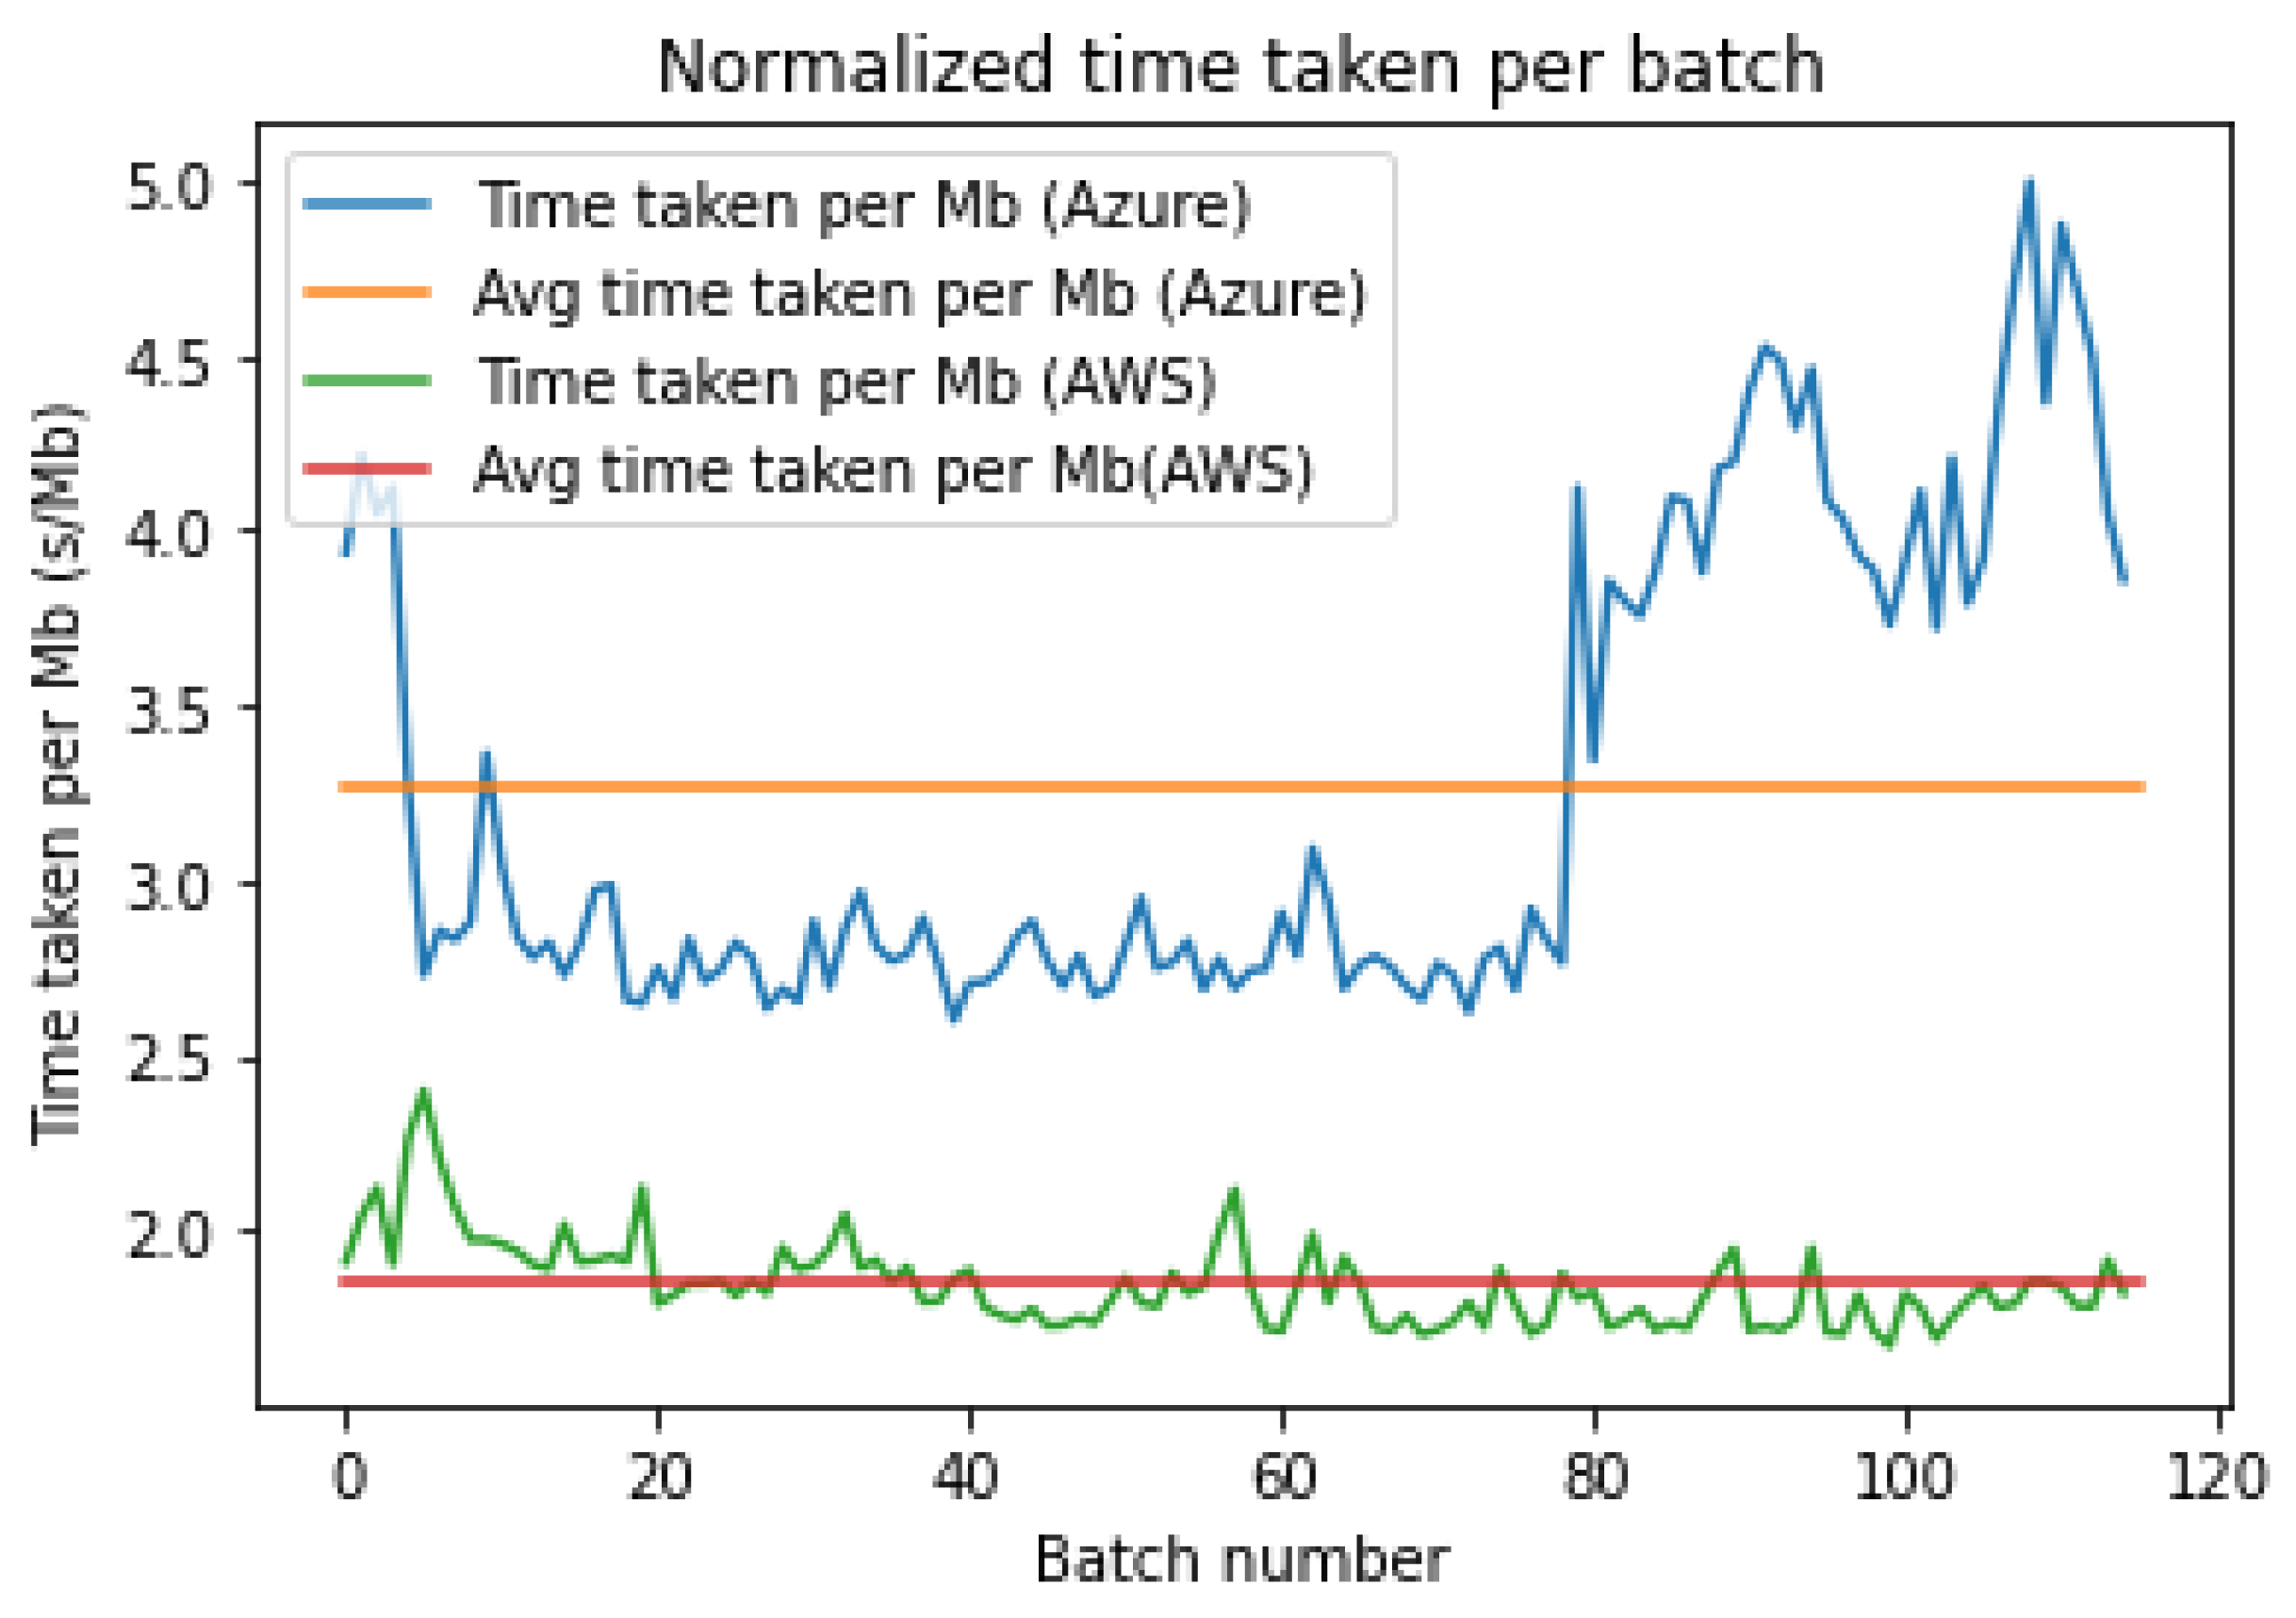
As seen in
Figure 7 and
Figure 8 above, we once again notice several fluctuations in the time taken to upload each MB. These are artifacts of the latency variance over the total time taken. We also notice a similar disparity in Azure, with the upload time sharply rising after batch 80. Moreover, the fluctuations seen in
Figure 7 are rather large, indicating an inconsistent nature of the latency for AWS. On the other hand, as shown in
Figure 8, the local fluctuations are smaller, but the large discrepancy at the start and end of the upload leads to a large variance in the latency times.
As seen in
Table 3 above, the average and median upload time for AWS is far lower and has a much lower standard deviation (four times lower) than Azure. The high variance for Azure is primarily due to the increase in times after batch 80.
Clearly, as in
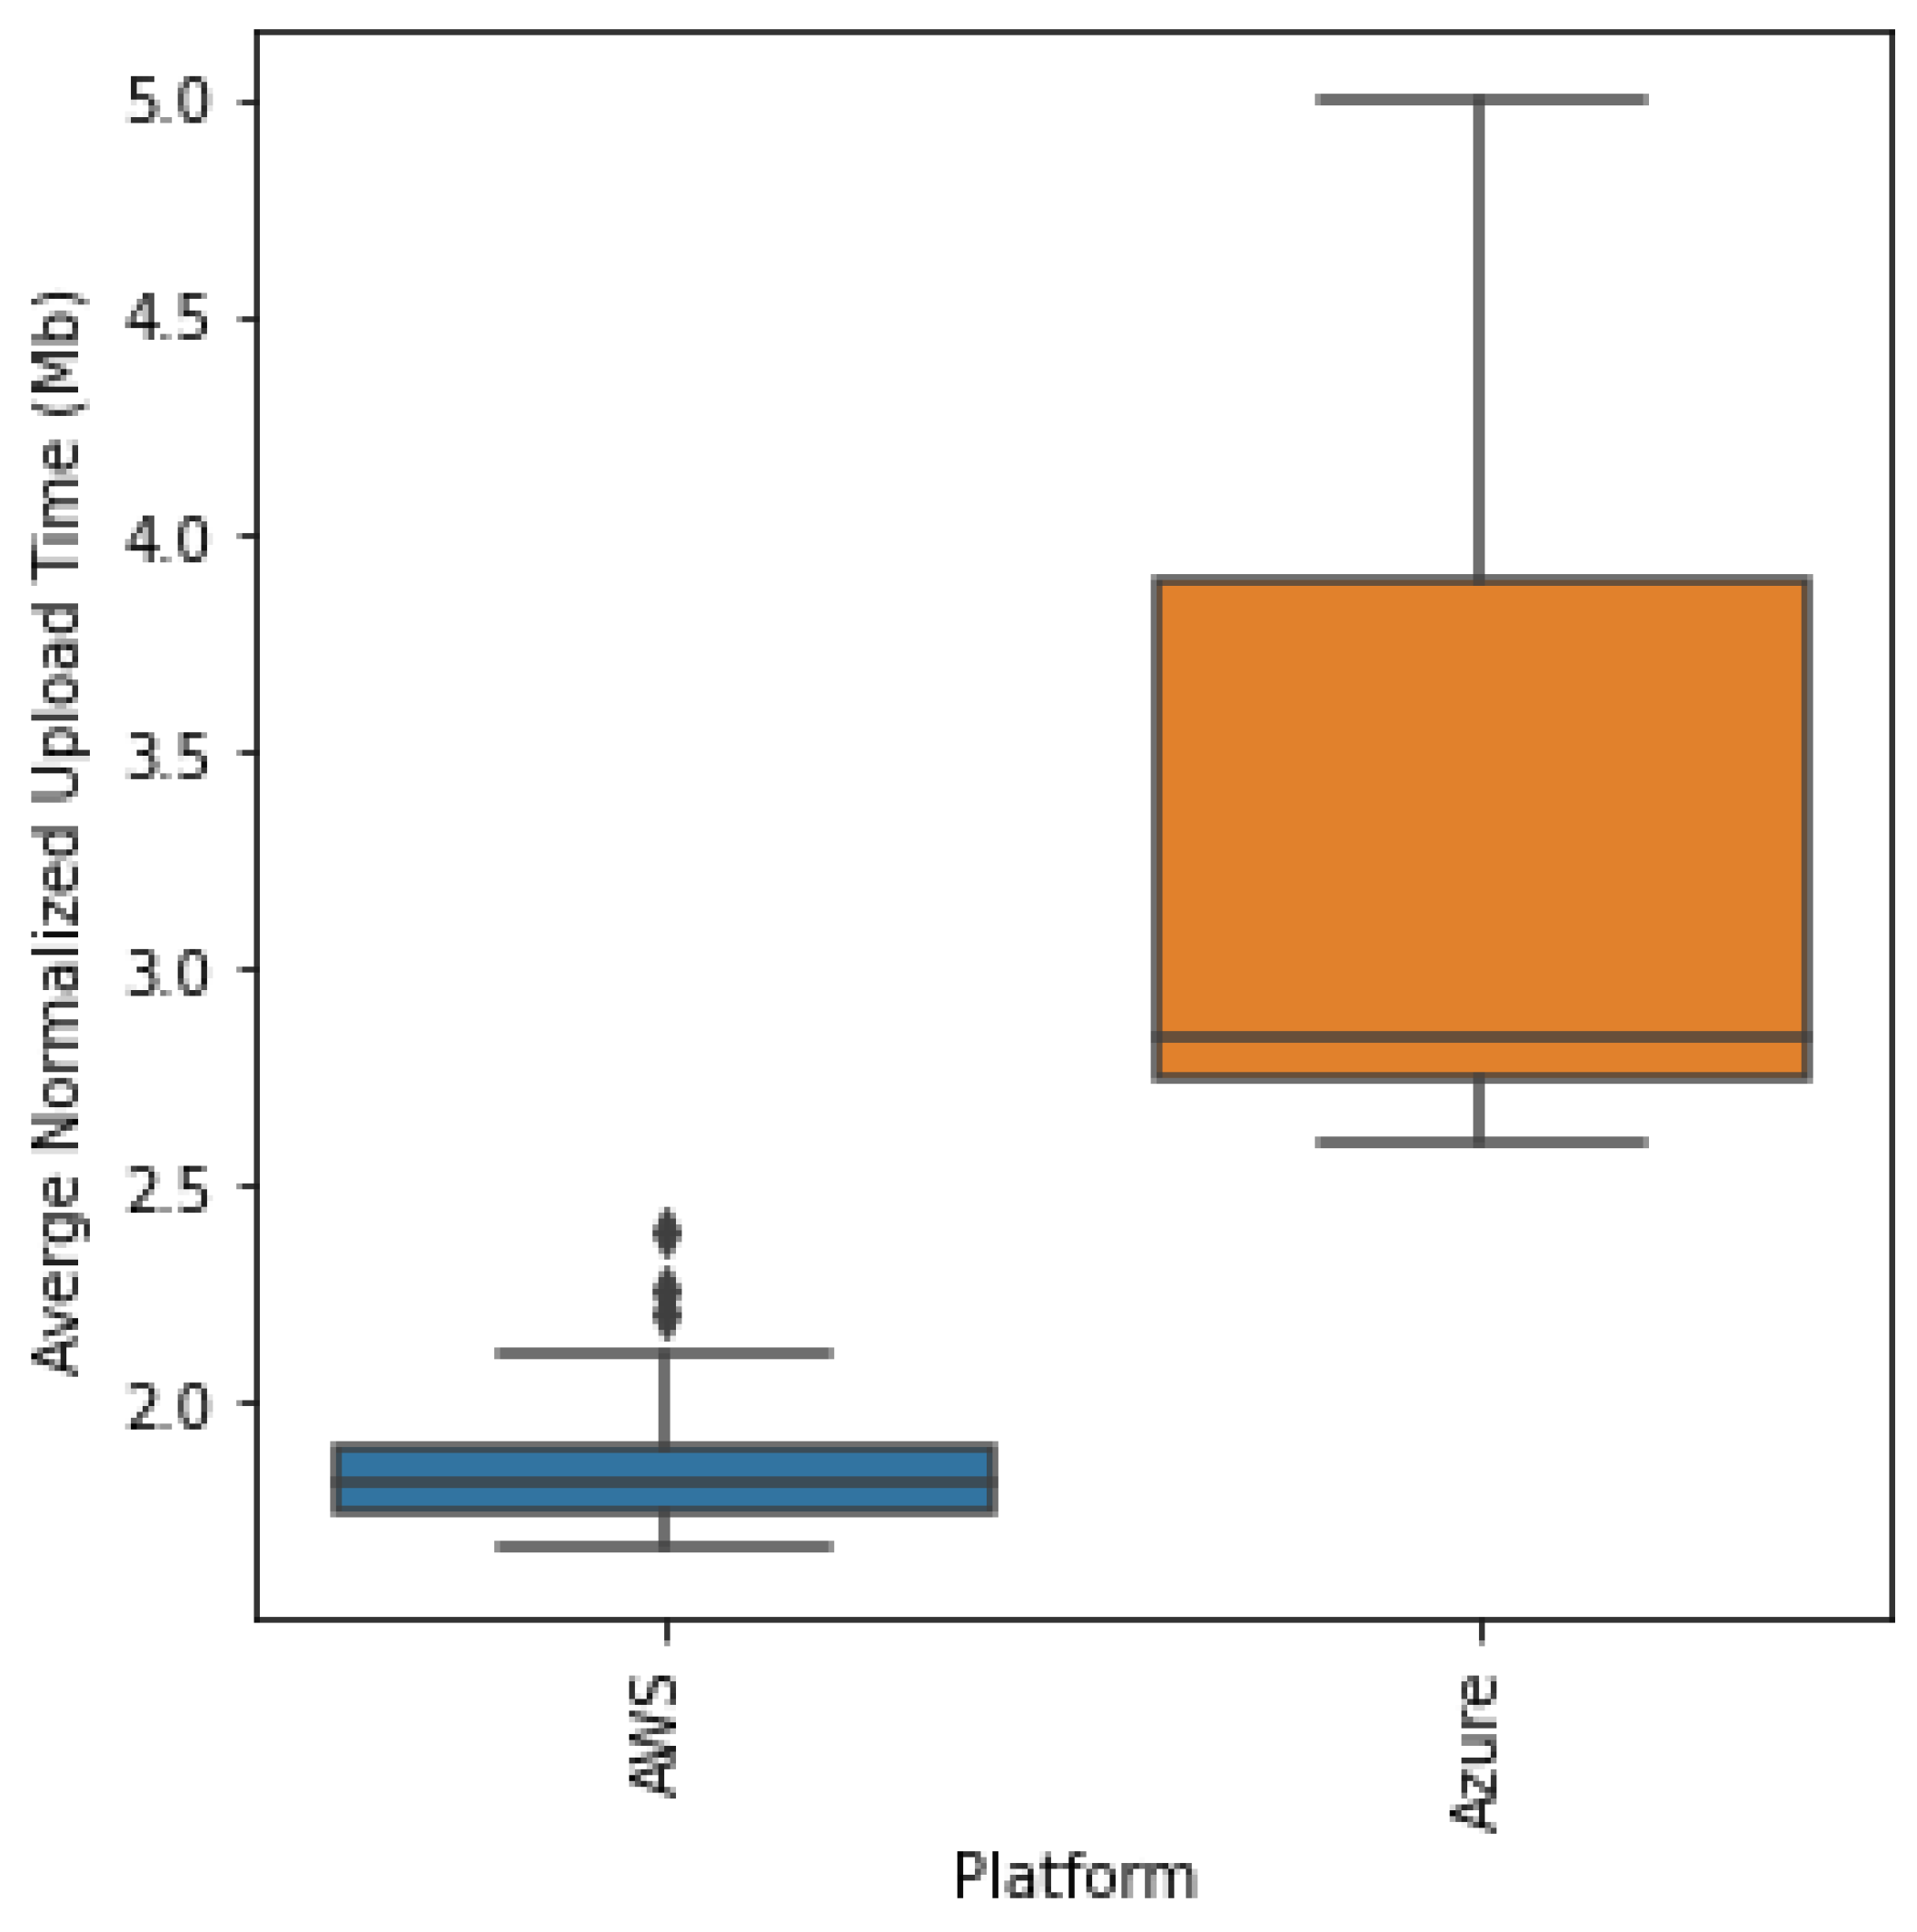
Figure 9, AWS has a far lower average upload time and a much more stable latency over the period of the upload compared to Azure. AWS provides a stable and fast connection to nonlocal locations compared to Azure. The increase in upload times after batch 80 may be because the Azure rate limited the uploads due to multiple requests through the Python SDK. We can statistically compare the distribution of the normalized upload times as in the boxplot of the upload times per platform shown in
Figure 10 below.
Clearly, as shown in
Figure 10, AWS has a lower upload time overall and has very few outliers, which are still below the minimum of the Azure batch upload time. Next, we perform the Kruskal–Wallis test to statistically determine if the distributions are different. We obtain a statistic of 171.753 and a
p-value of 0.000 < 5%, allowing us to reject the null hypothesis and conclude that the distributions are actually statistically different and AWS does indeed have a lower upload time compared to Azure.
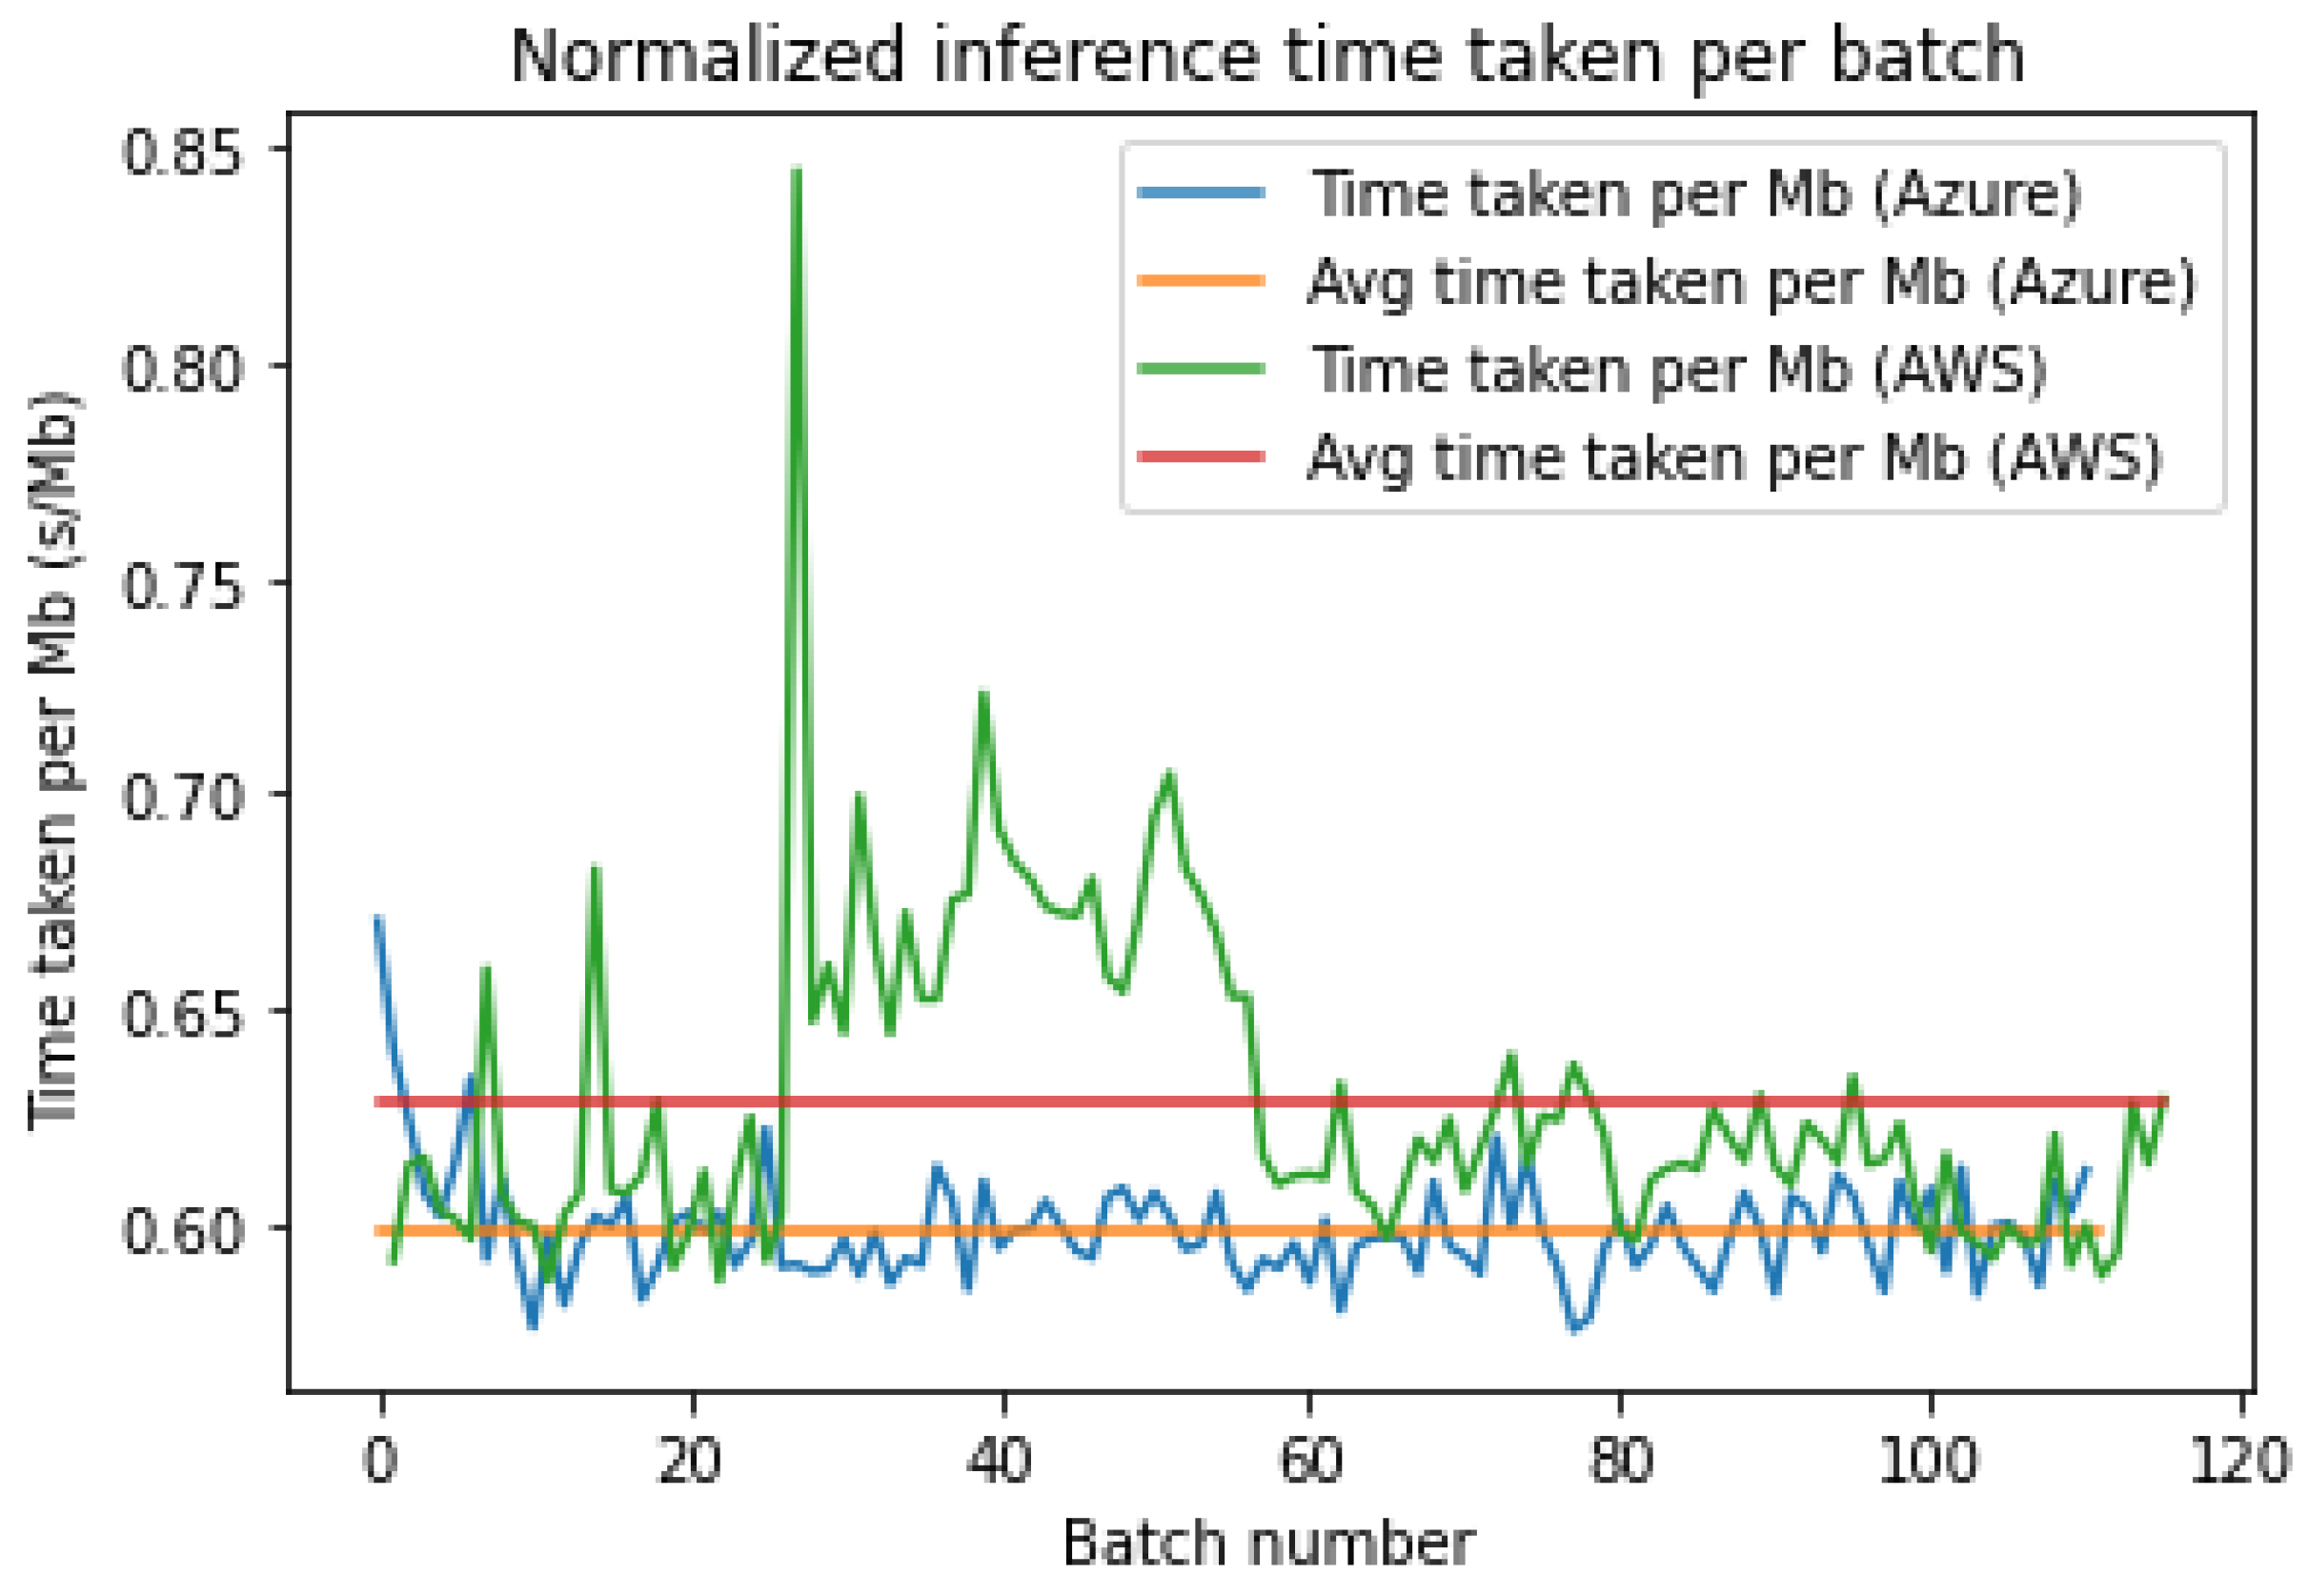
4.3. Inference Time
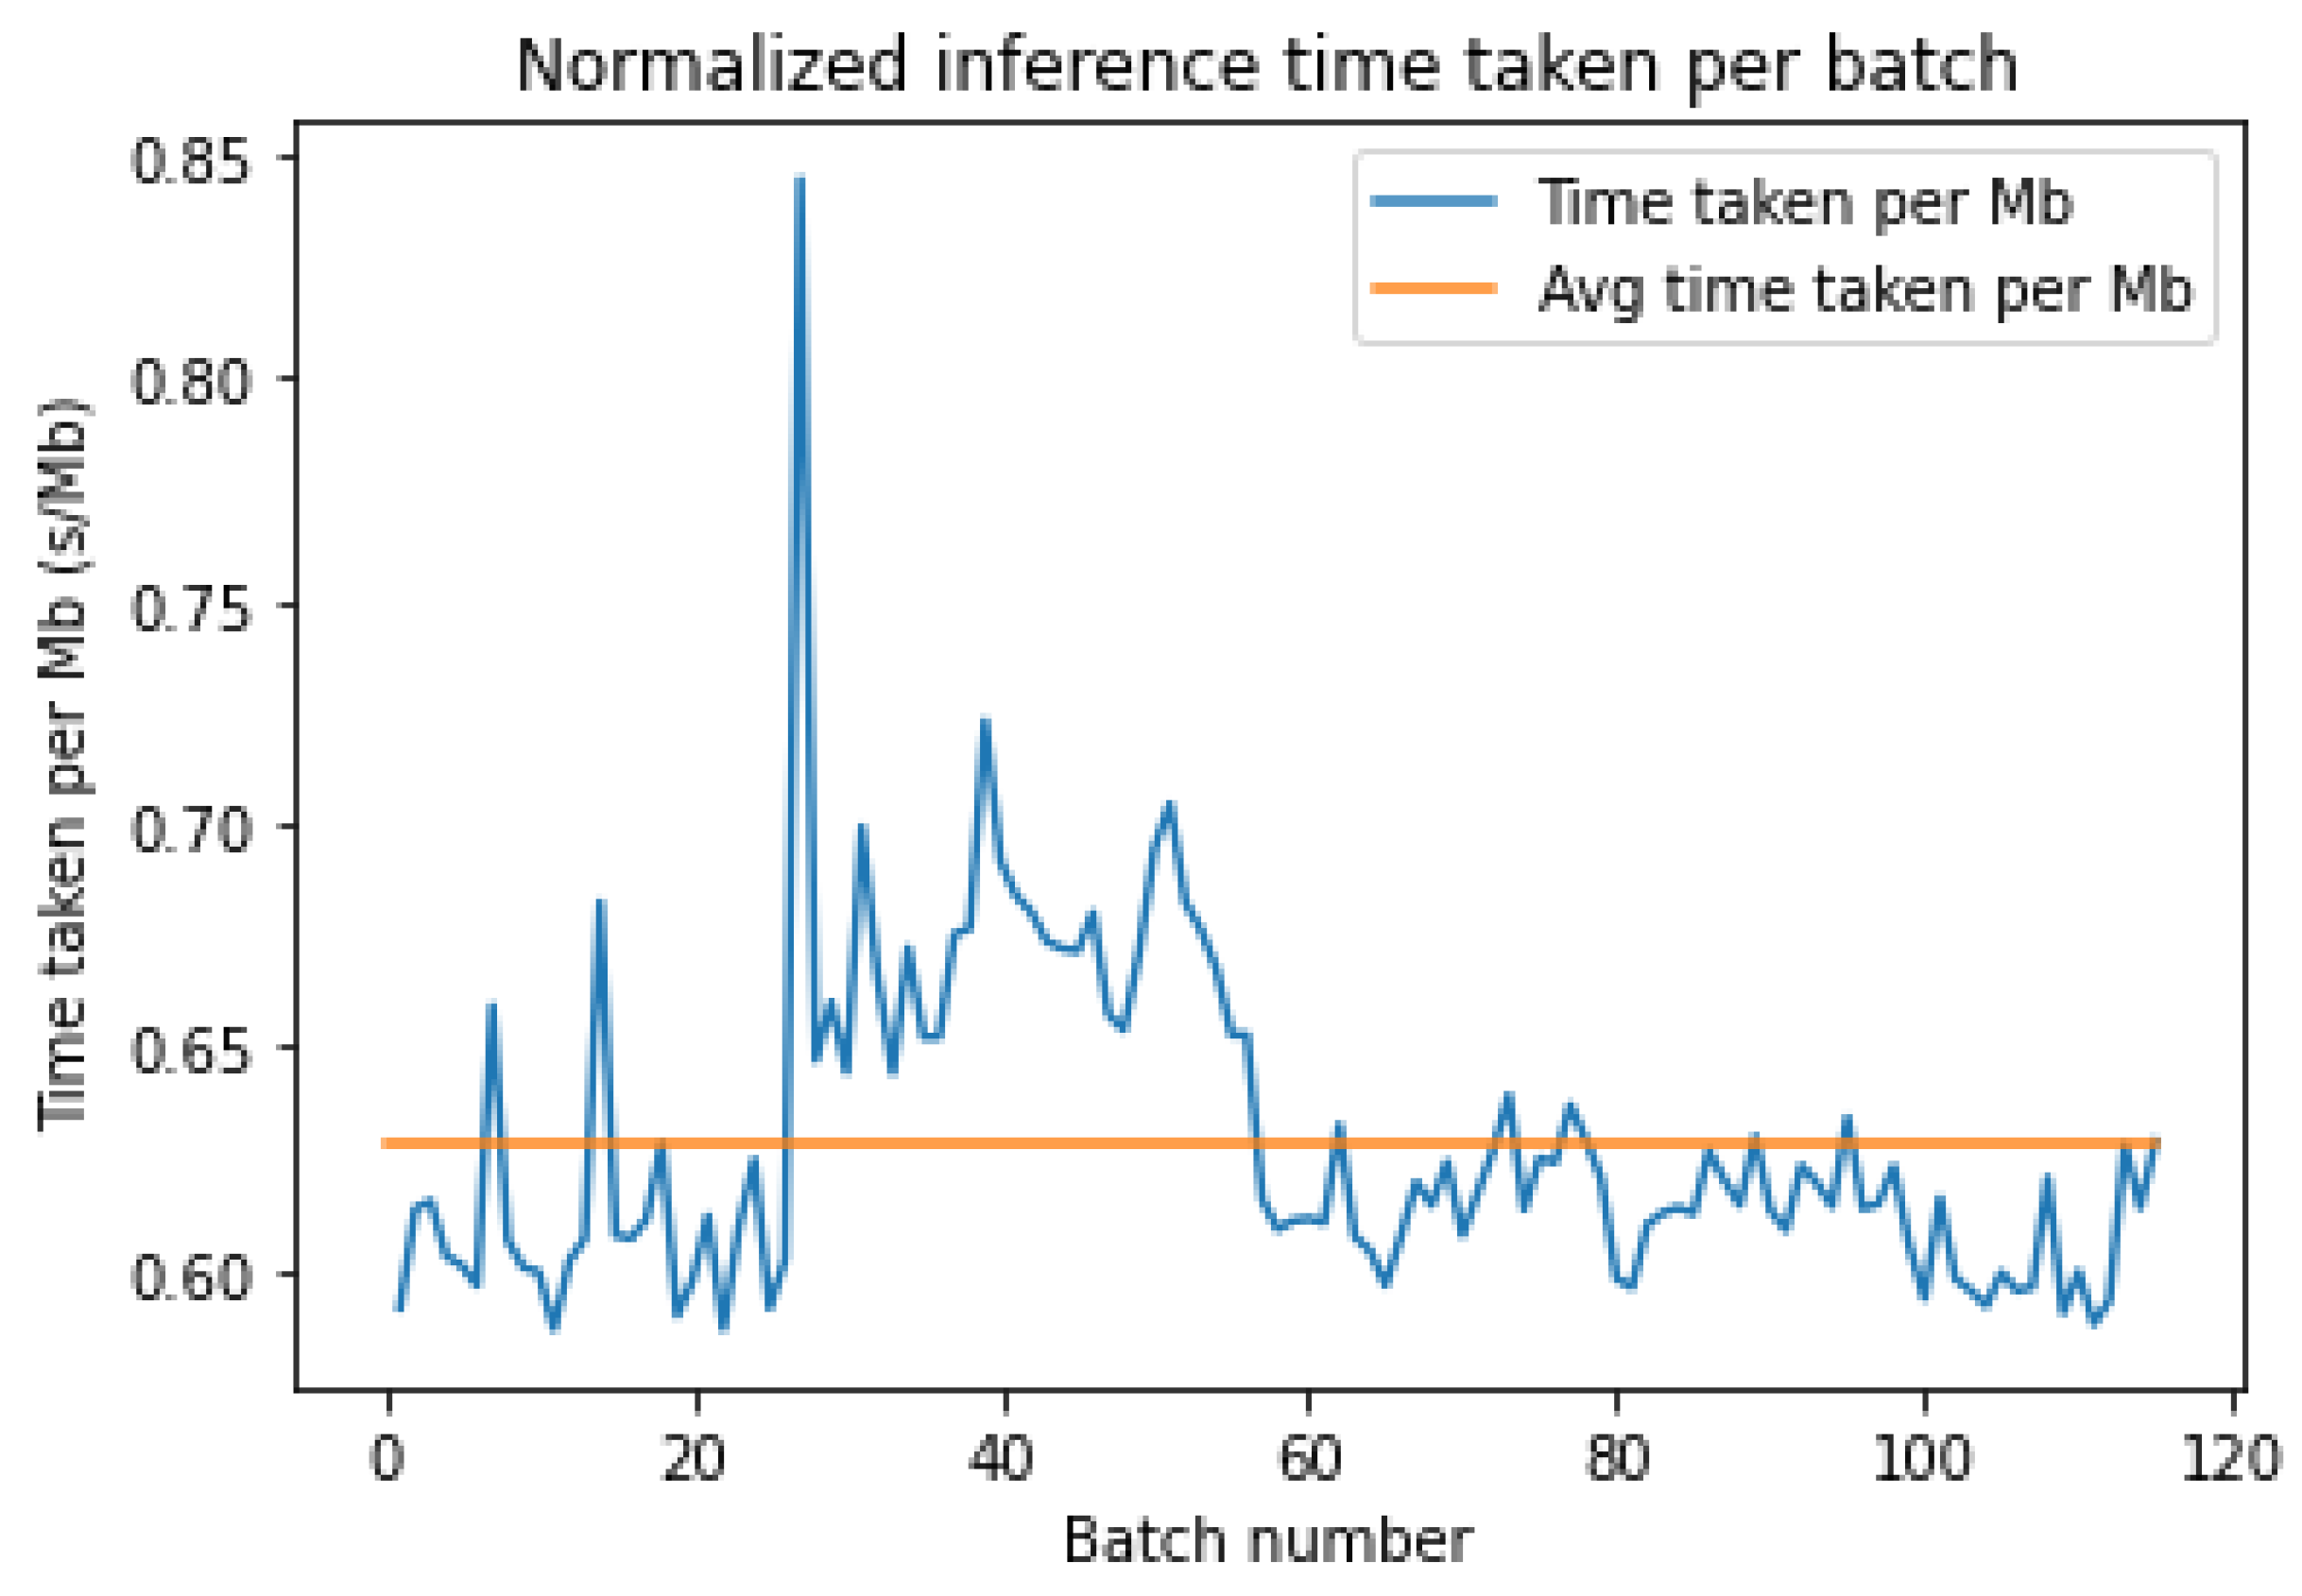
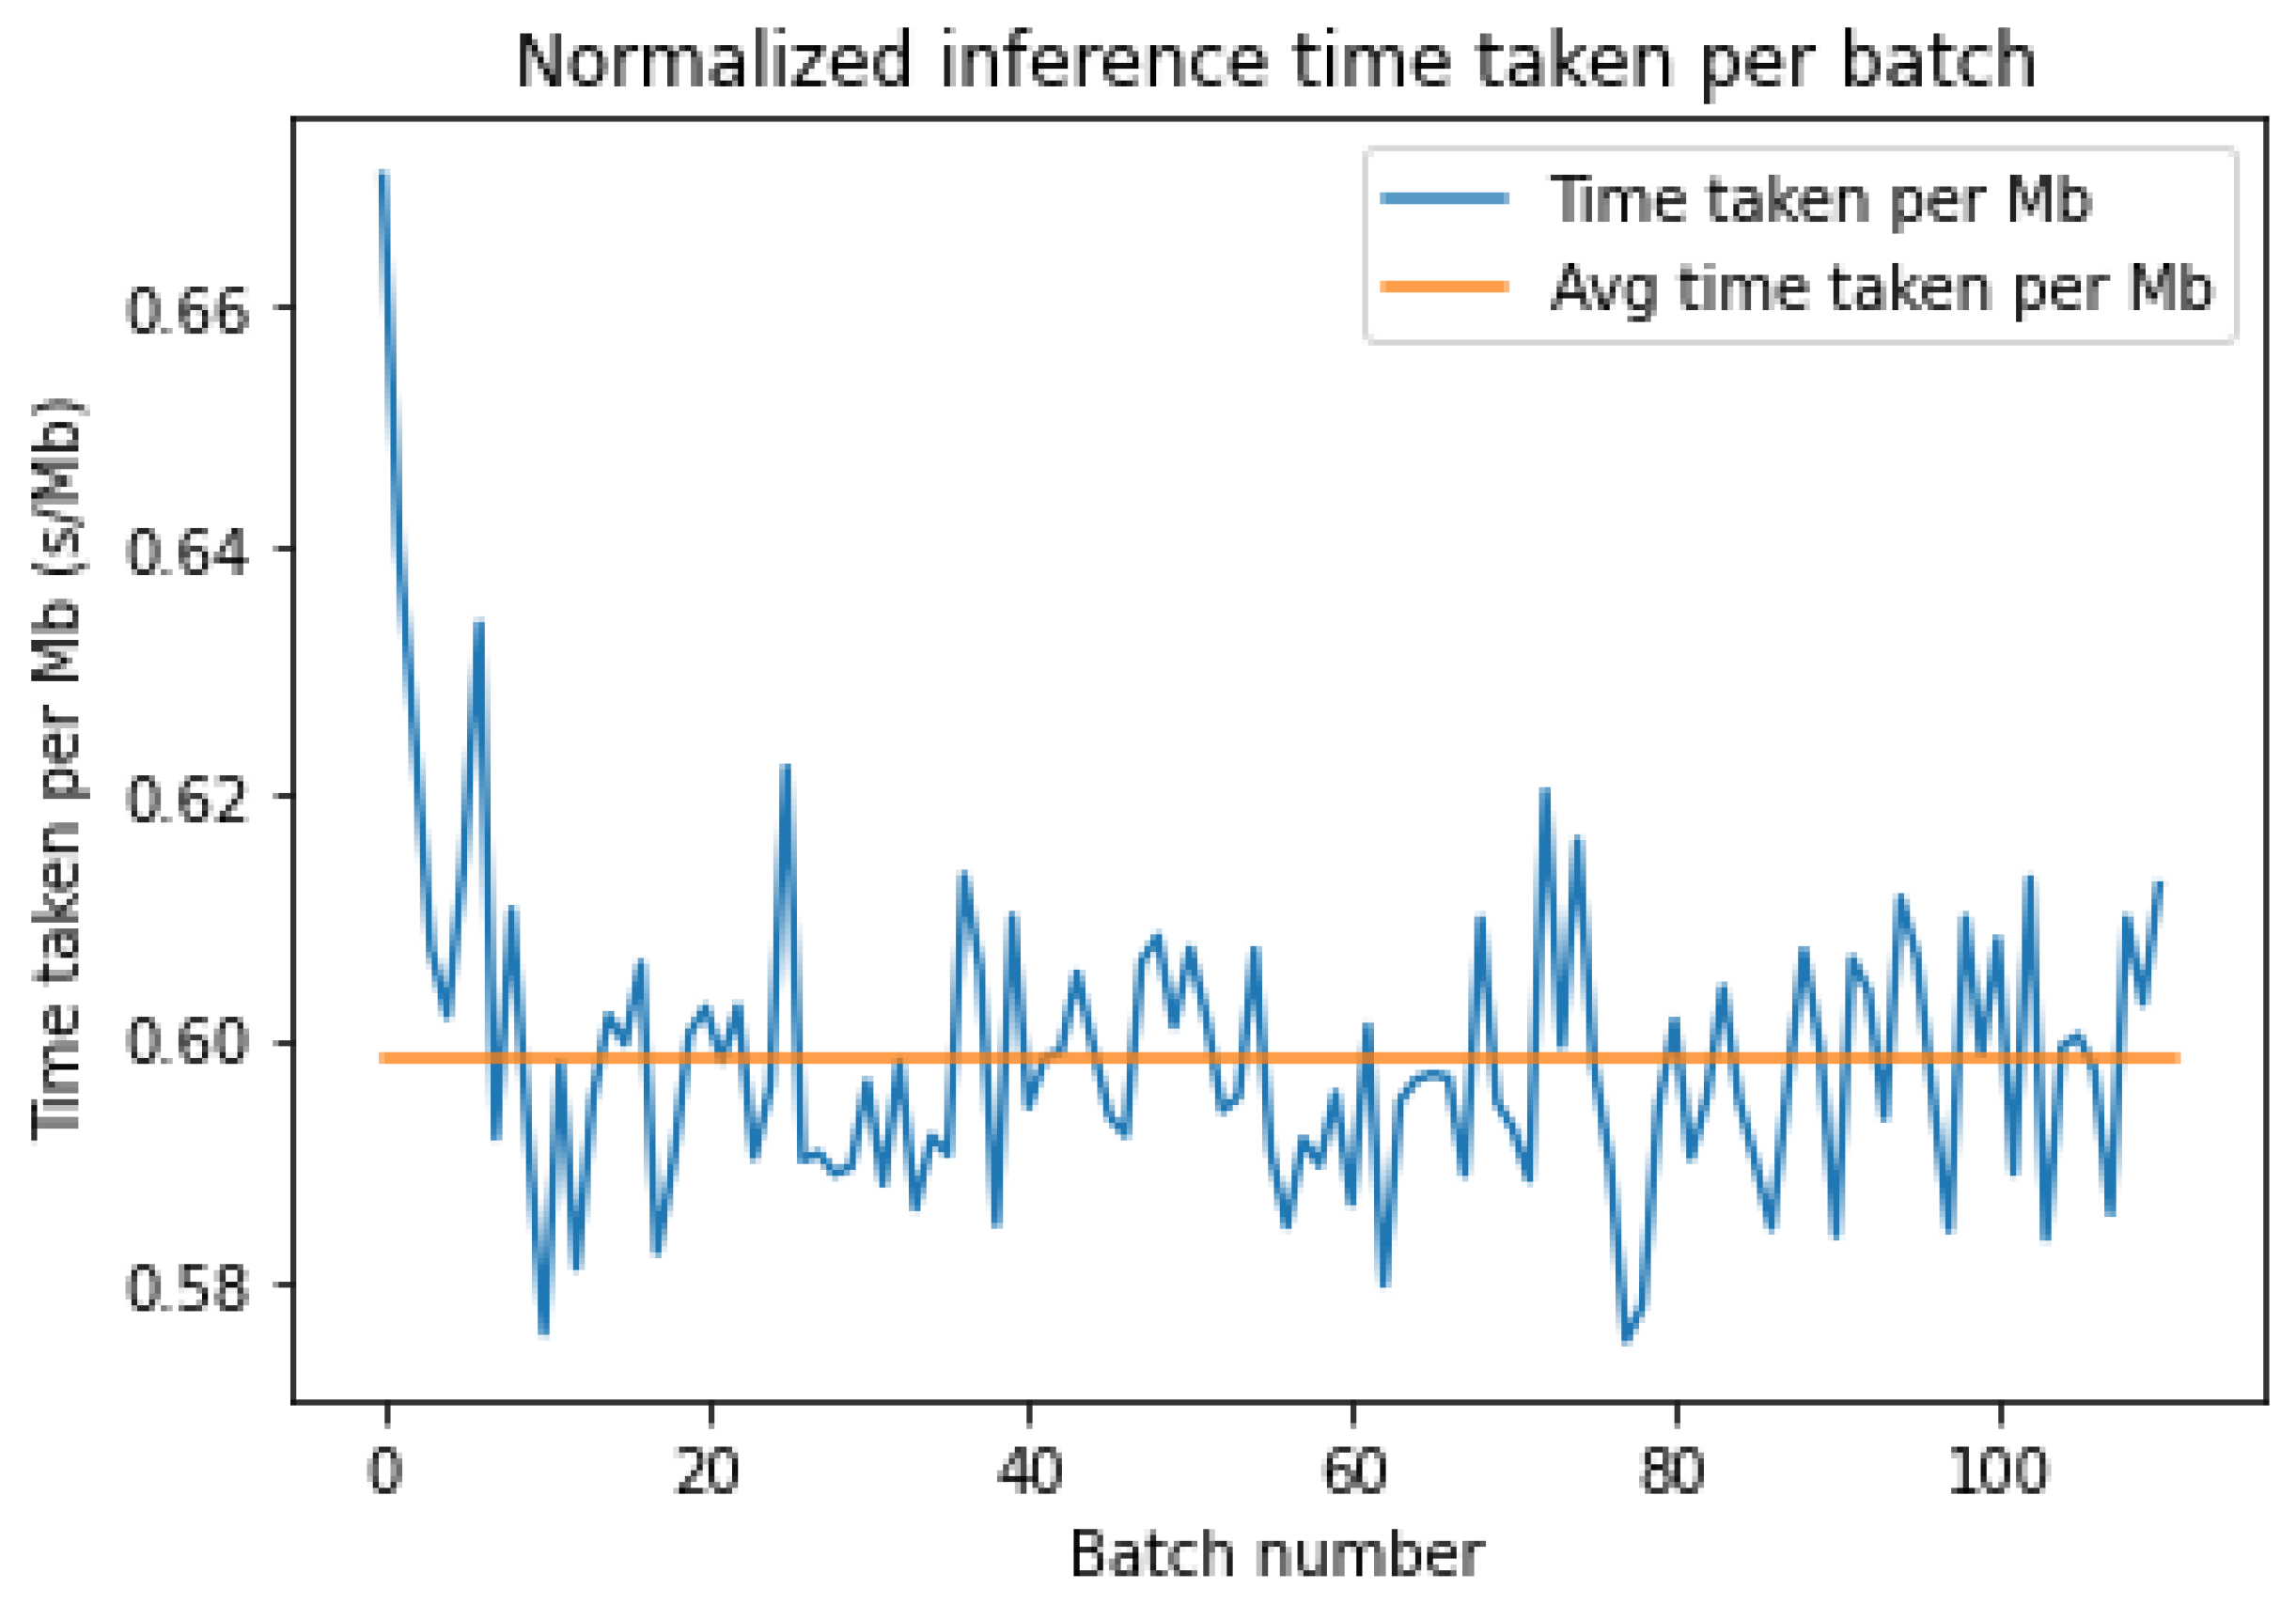
Figure 11 and
Figure 12 show the normalized inference times for each batch for either platform. Both of them have a similar average inference time, but AWS has a large change in the inference time between batches 30 and 60. Azure does not have a single large increase but has more frequent variations than AWS and hence can be considered less stable.
Table 4 above shows how AWS and Azure have similar average and median inference times very close to 0.60 s/MB, but Azure has a lower inference time average (0.60 vs. 0.63) and lower standard deviation (0.01 vs. 0.04) than AWS.
As in
Figure 13, both platforms initially and eventually have similar inference times but diverge between batches 30 and 55. This is most likely the reason that the average time for AWS is higher than Azure. Hence, the primary reason for the difference is most likely due to the disparity between epochs.
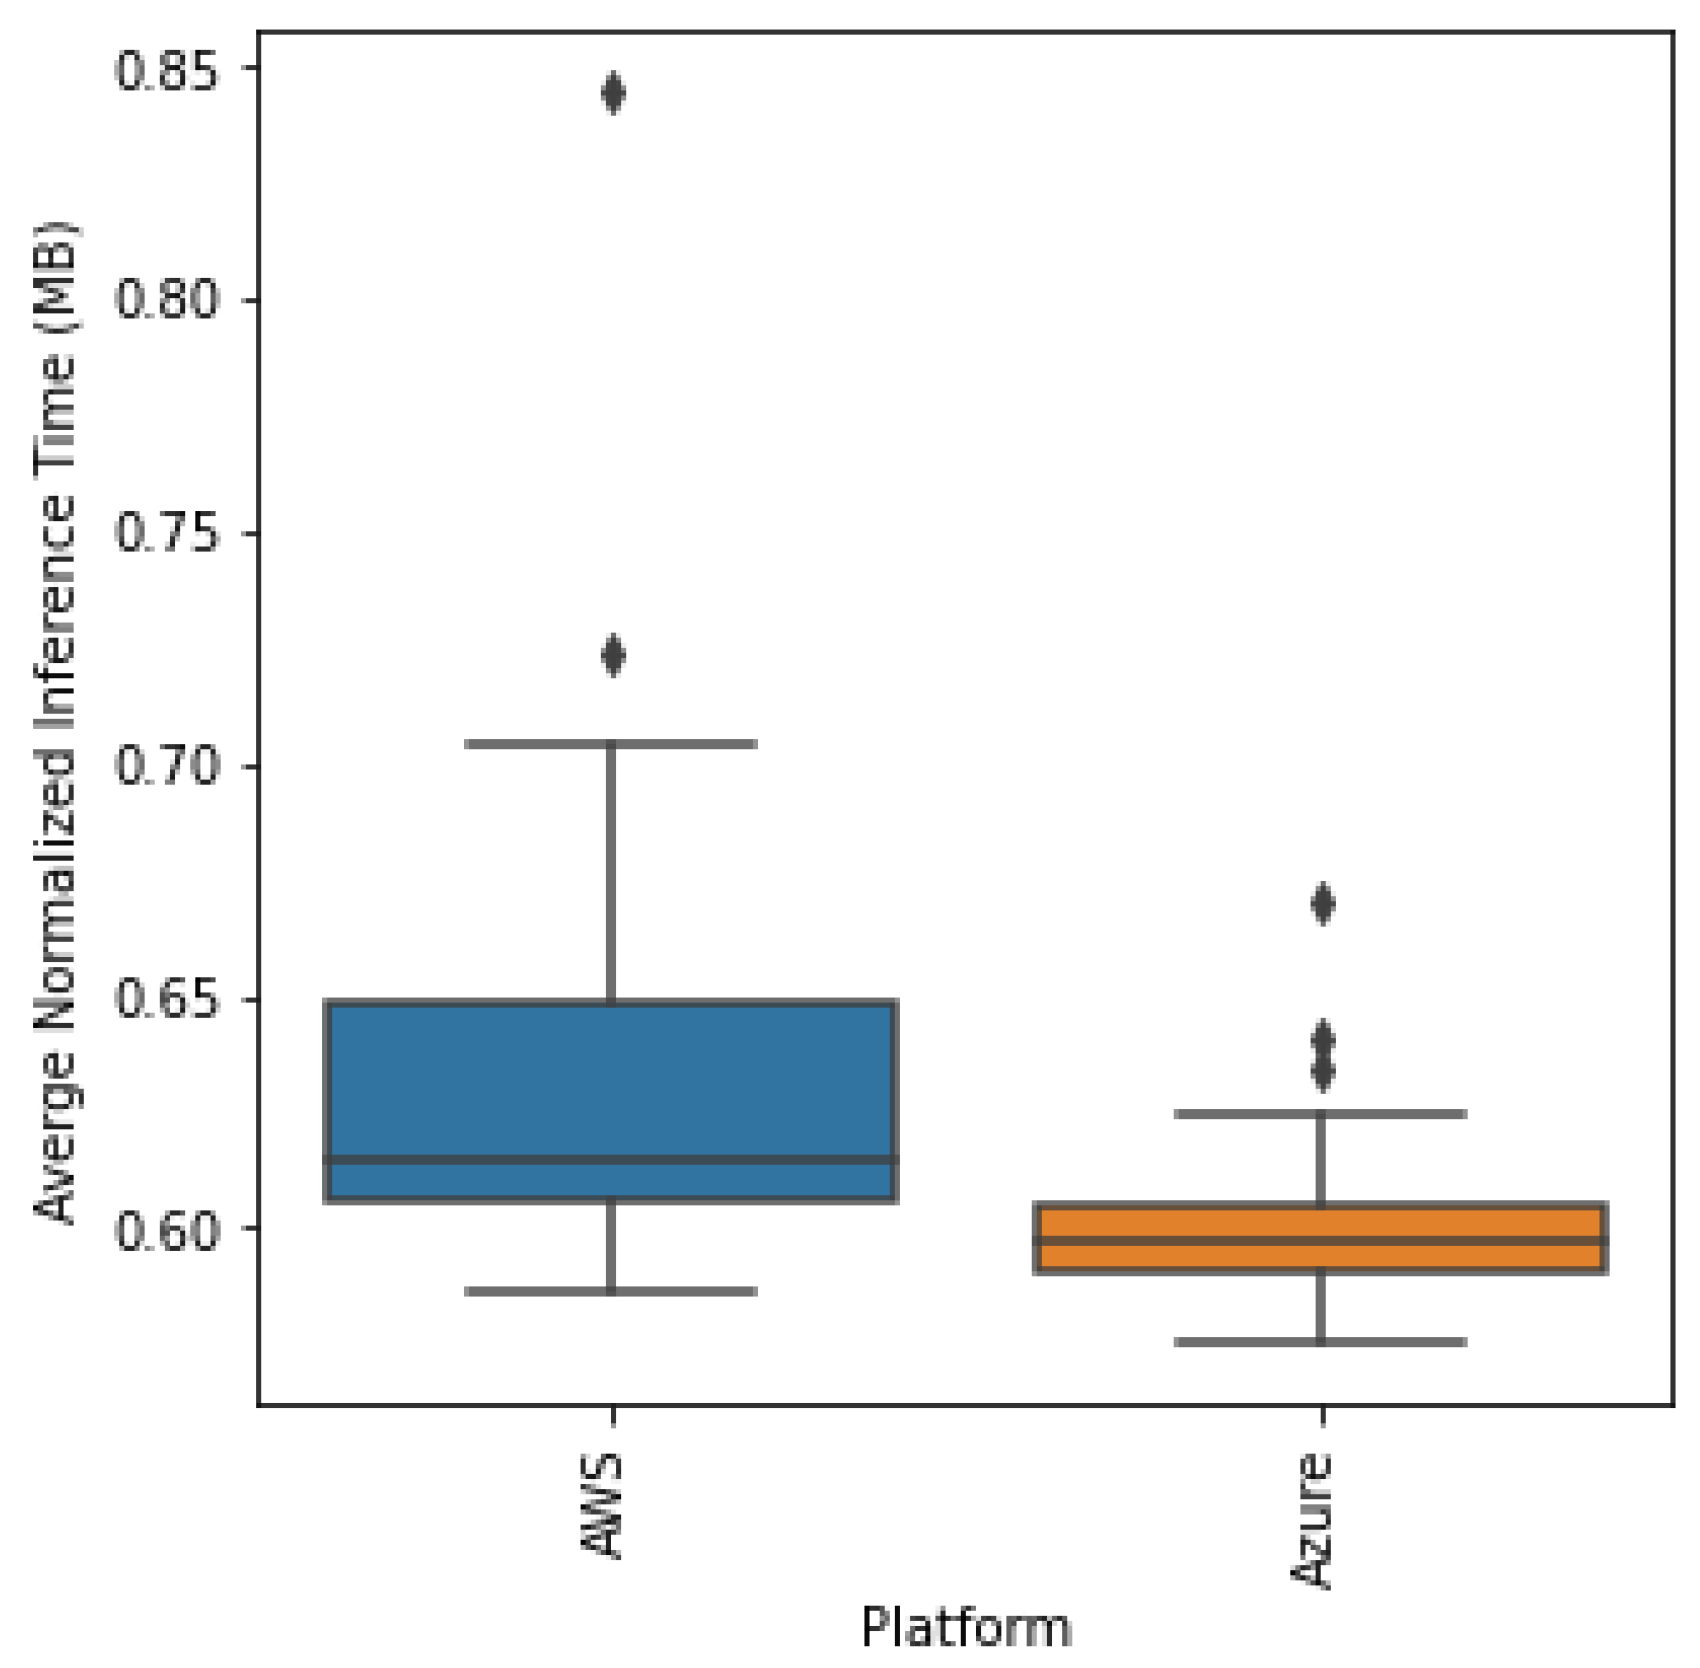
As seen in
Figure 14, the boxplots differ mostly by the interquartile range, which is lesser for Azure, which indicates more stability than AWS. Since there is an overlap between the two boxplots, we have to rely on the statistical test to confirm if the distributions are indeed different. Conducting the Kruskal–Wallis test on the two distributions, we obtained a statistic of 71.019 with a
p-value of almost 0, which indicates that the two distributions are indeed statistically different and Azure has a faster inference time than AWS.
This statistically faster inference time by Azure is likely due to the fact that autoscaling allowed for more instances to process each batch in parallel that led to lower inference times. This is most likely the reason that Azure did not have a spike in inference times for batches 30–55 since it just provisioned more instances to stablize the inference times.
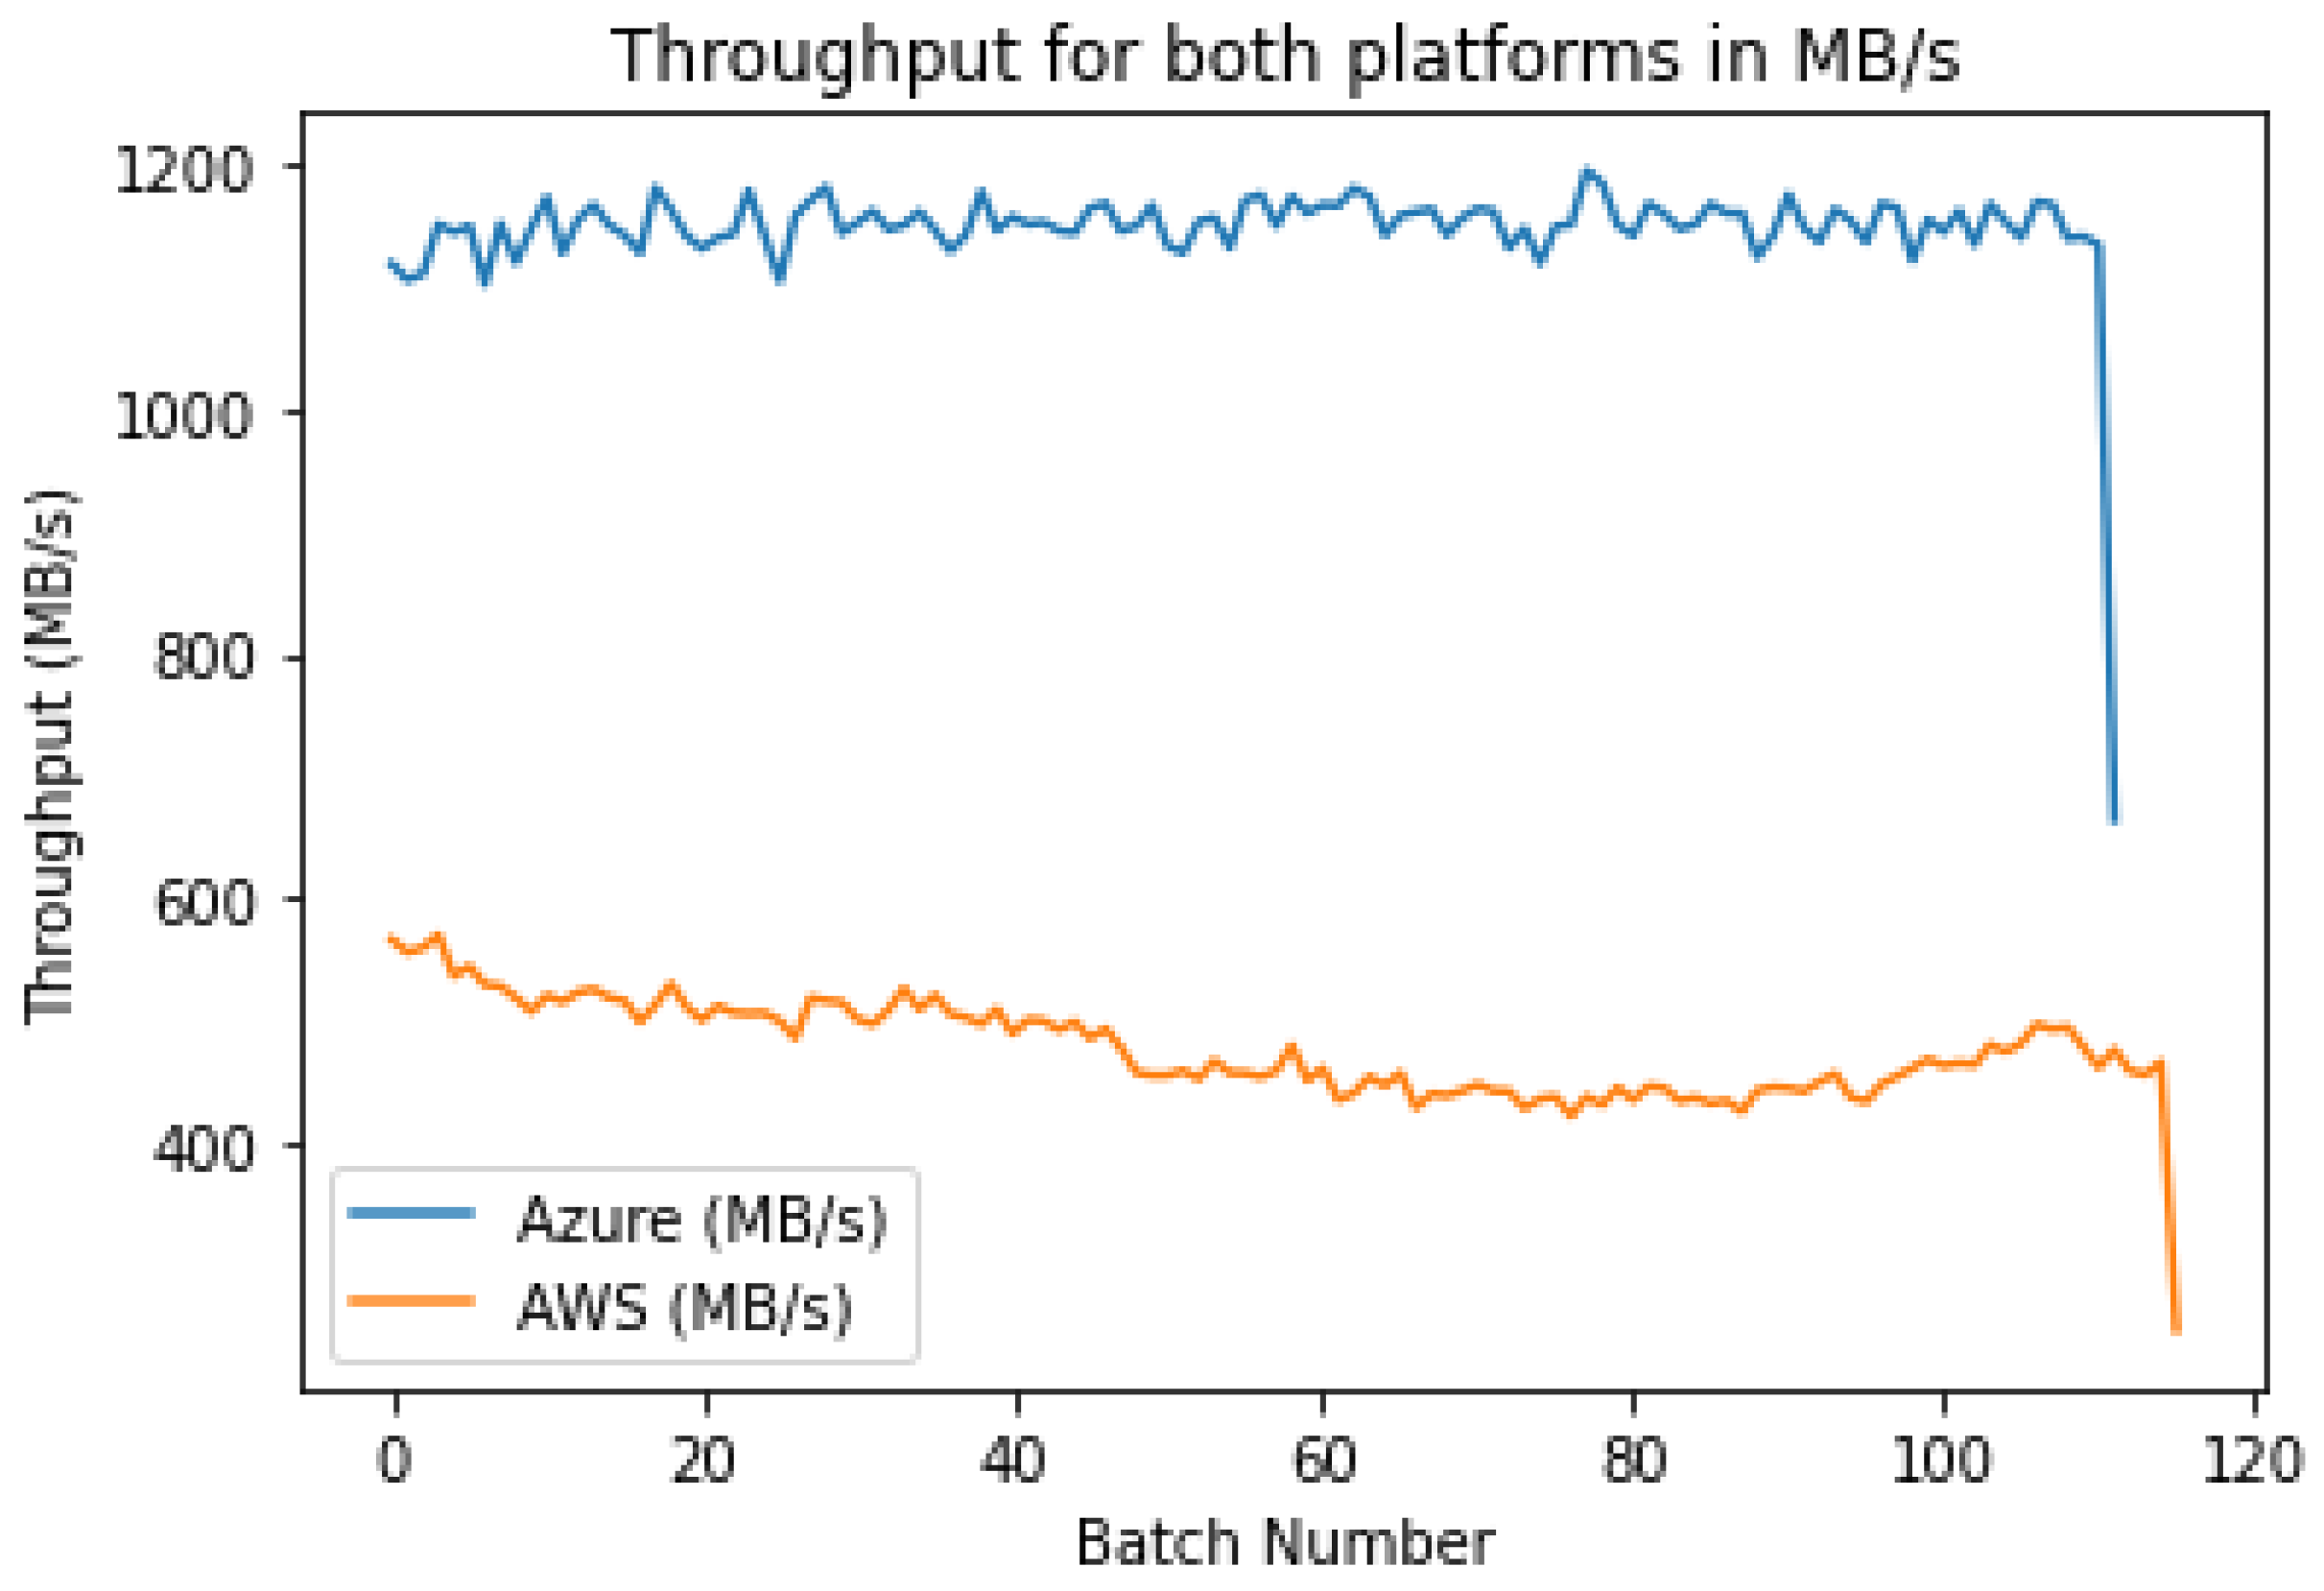
4.4. Throughput
Clearly, as in
Figure 15, the throughput for AWS is far less than the throughput for Azure, which indicates that Azure has a faster total retrieval and inference time for each batch. Hence, the amount of data processed per second is larger. Both the graphs have roughly stable trends across all batches, except for the last. The reason for the sharp drop at the last batch is because that batch had less than 1024 images since the total number of images is not a multiple of 1024.
It is evident from
Table 5 that AWS has less than half of the throughput that Azure provides. Hence, Azure is more suitable for applications that have large amounts of data that need to be processed quickly.
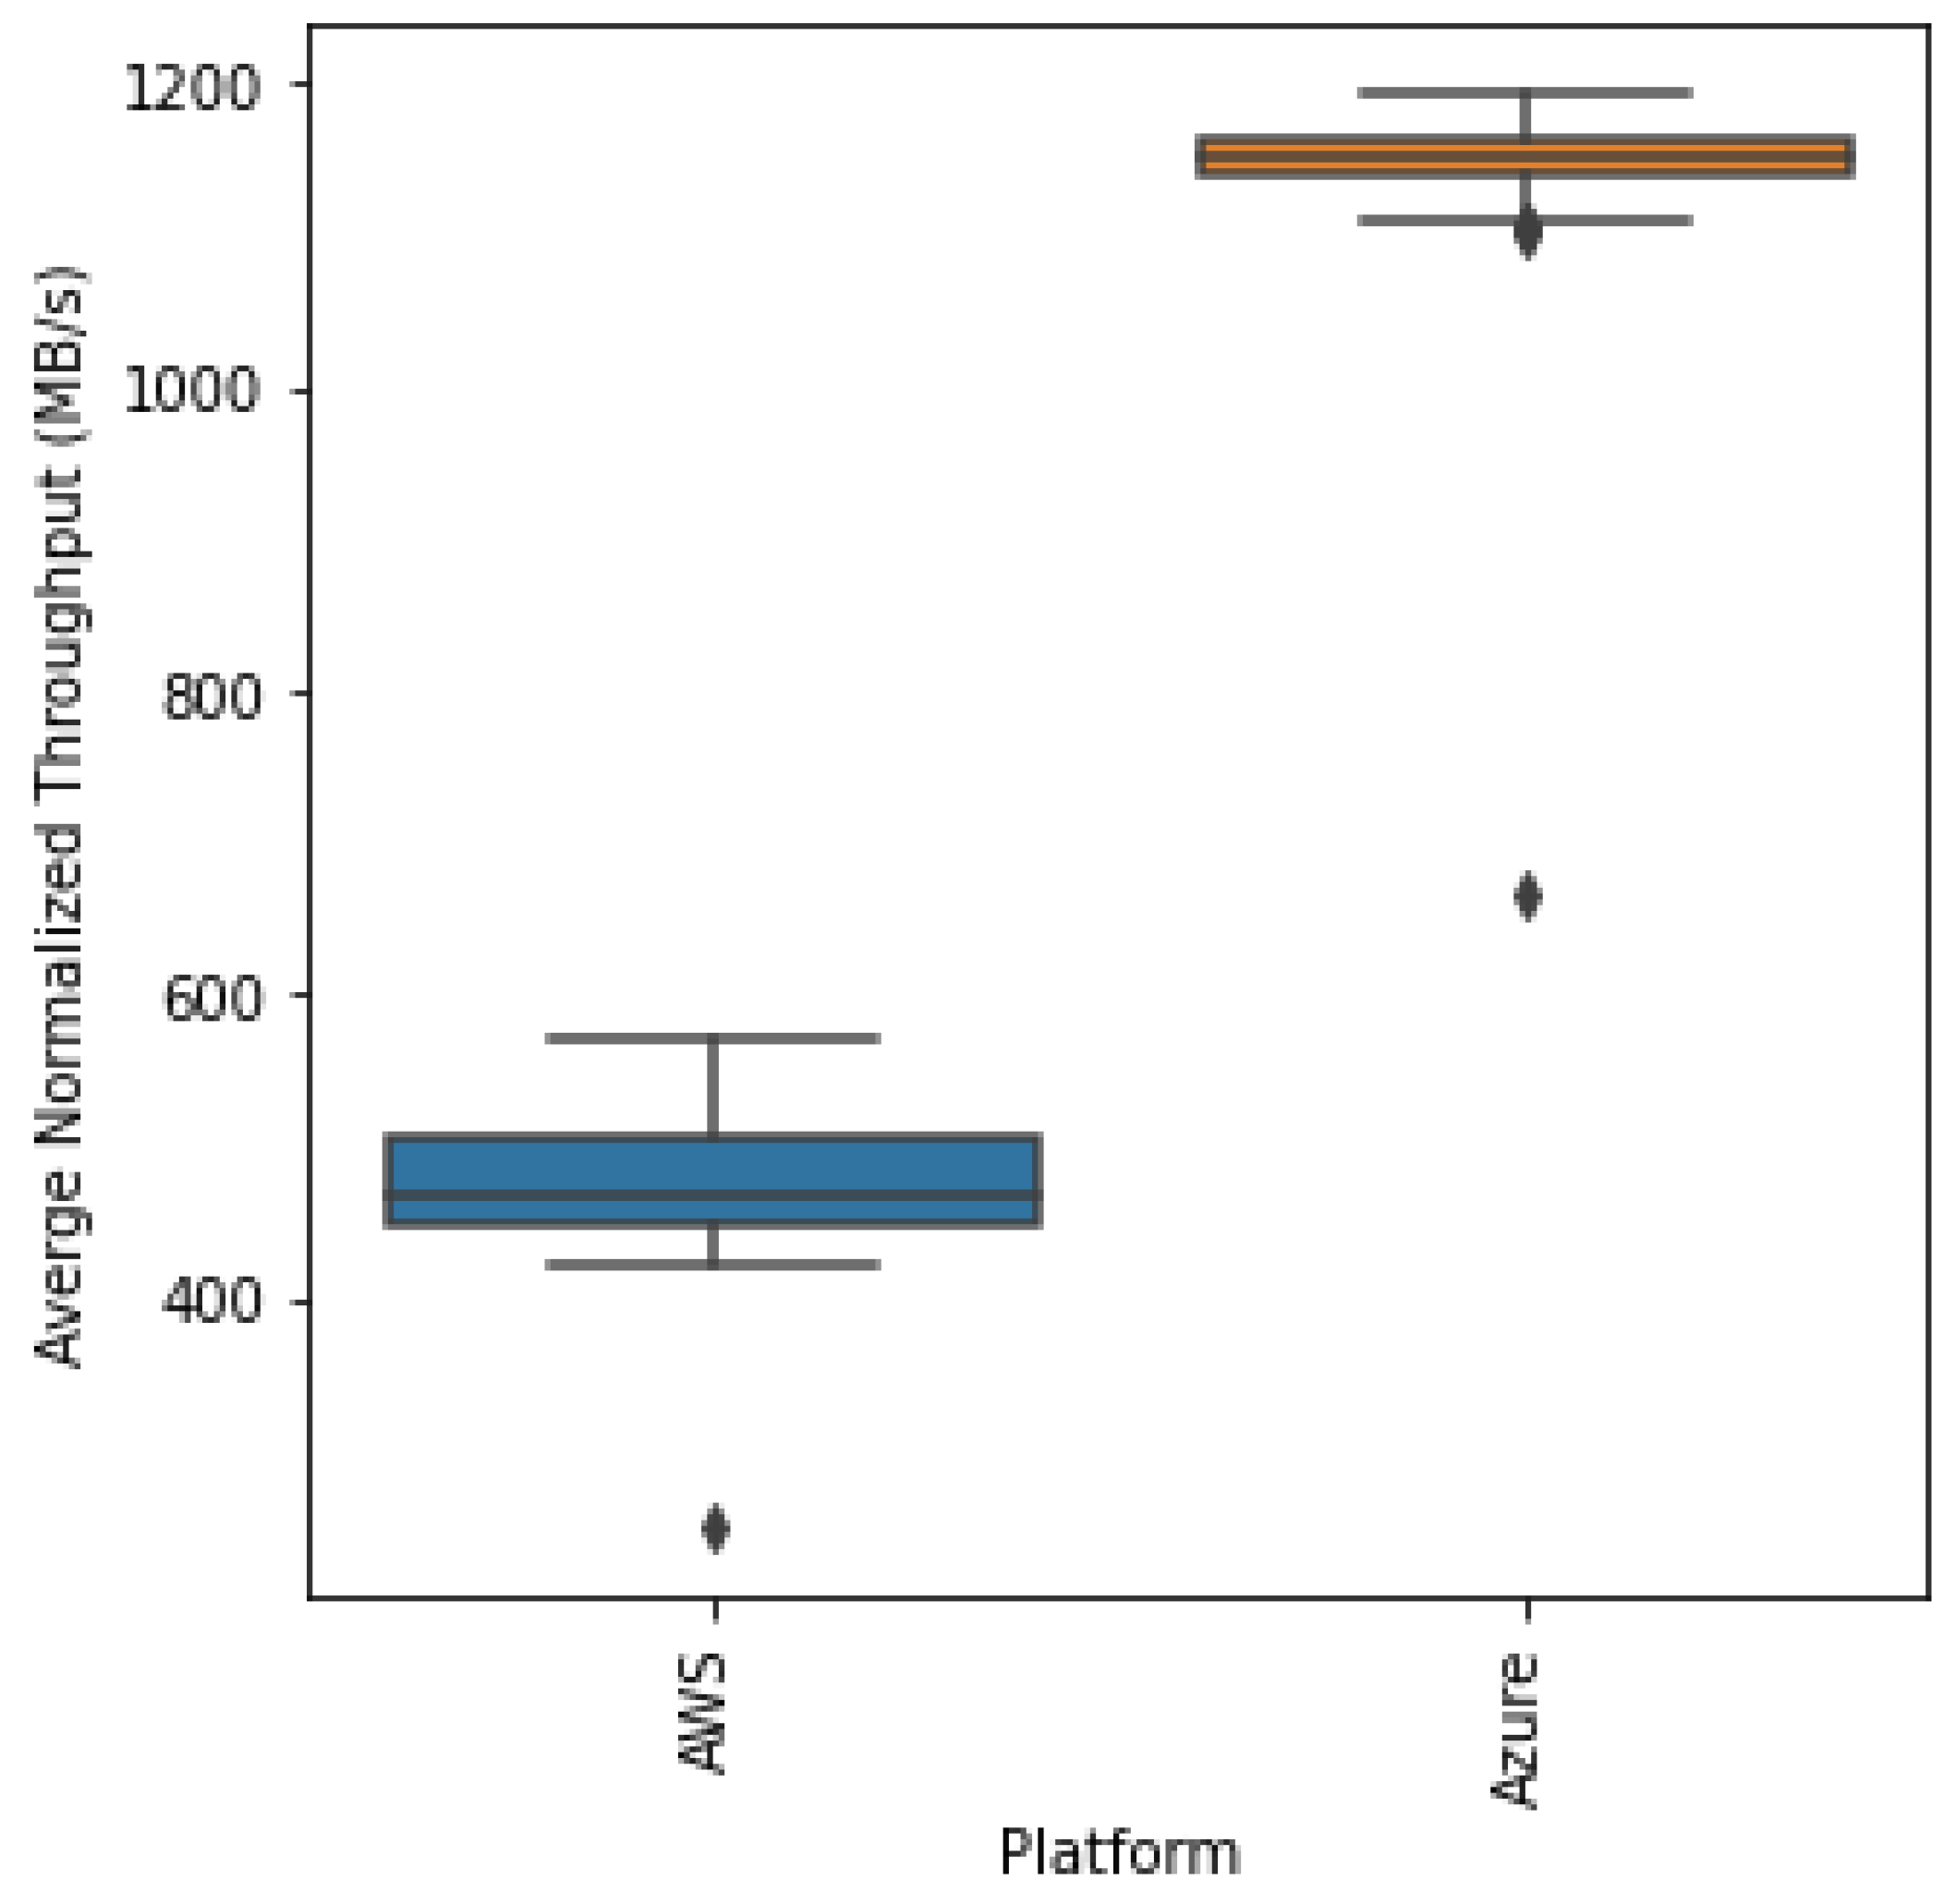
As in the boxplots of the throughput per platform, seen in
Figure 16, it is clear that the distribution of either platform has similar variance but varies heavily based on the mean and median throughput. Clearly, we expect the statistical test to indicate different distributions for both platforms. We obtain a statistic of 167.253 and a
p-value of almost 0, supporting our conclusion.
Once again, this high throughput for Azure is likely due to the faster upload times in conjunction with the autoscaling that kept the inference time low. This shows the importance of autoscaling in real-time inference allowing for the increased throughput of the whole pipeline.
4.5. Monetary Cost Analysis
AWS and Azure follow the industry standard pay-as-you-go pricing model, where users are billed based on their actual consumption of the various cloud resources. The pricing for compute instances on both platforms depends on factors such as instance type, operating system, region, and usage time. However, instances can be reserved for periods of either 1 year or 3 years because deployment can be availed at a much lower cost. Nevertheless, the costs presented in this paper are for standard pay-as-you-go pricing. Furthermore, the costs for Azure are presented in a range because of the Azure App Services autoscaling plan, and they can range between 1 and 10 instances based on the workload for the endpoint. The cost breakdown for each microservice in both platforms is given in
Table 6 and
Table 7.
The cost summaries provided for Amazon Web Services (AWS) and Microsoft Azure reveal some key differences in the pricing structures of these two cloud platforms. Notably, for a single CPU instance Azure appears to offer more competitive pricing, with a daily cost of USD 4.692 compared to USD 12.8736 for AWS. However, this lower cost may come at the expense of performance since a single CPU instance would produce inferior inference times and throughput to that of a GPU. Furthermore, we observe that Amazon EC2 offers a slightly lower hourly cost of USD 0.0104, whereas the Azure Virtual Machine offers an hourly cost of USD 0.0115. This disparity can be partially attributed to economies of scale, where AWS, being the larger and more established cloud provider, can leverage its extensive infrastructure and customer base to offer lower prices for compute resources. Finally, because of the autoscaling plan on Azure, the costs can reach up to USD 46.92 per day in order to achieve comparable inference times, but it has a higher throughput than AWS. This result implies that the cost behind availing high-performance computing is far higher in Azure, which may not be suitable for machine learning workloads that require strong computing capabilities. Overall, AWS seems to have a net cost advantage for high-performance workloads, which makes it a more cost-effective choice for many organizations.
4.6. ML Service Catalog
This section provides a detailed description of the machine learning service catalogs of each cloud provider. It highlights the existing microservices available to customers and their shortcomings under specific circumstances. It concludes with the overall comparative result in the case of model deployment.
4.6.1. AWS ML Services
AWS offers a comprehensive set of AI and ML services through the Bedrock and SageMaker platforms. Bedrock is largely used for building Generative AI applications through base models from Amazon and third-party model providers accessible through an API with options of customizing these models. SageMaker, on the other hand, offers a wide range of tools and platforms to address the major ML requirements such as data preparation, deployment, monitoring, and even no-code platforms. Moreover, AWS also provides AI services and tools that have business-specific use cases. These services include Amazon Forecast for business forecasting, Amazon DevOps Guru for monitoring devops, Amazon Transcribe for automated speech to text, and Amazon Rekognition for automated image recognition. There are several more services that are outside the scope of this paper. Overall, AWS boasts a rich ecosystem of ML services that address specific customer requirements.
4.6.2. Azure ML Services
Similarly, Azure offers a range of ML services. The most commonly used service is Azure Machine Learning (Azure ML), which allows users to use pretrained models or even train, deploy, and manage models by using Python and Command Line Interface (CLI). Azure Cognitive Services is another popular tool that has a set of prebuilt APIs that allows users to add intelligent features like object detection, OCR, speech to text, and translation on their applications. Azure also offers the Custom Vision platform, which is an image-recognition service that enables users to build, deploy, and manage their own image-recognition models. Lastly, Azure OpenAI provides a REST API access to OpenAI’s powerful language models such as GPT4, GPT3.5, and the Embedding series.
4.6.3. Comparison of ML Service Catalog
The team’s initial approach to deploying the model was conducted on Azure Machine Learning since it is the direct counterpart of AWS SageMaker. However, Azure Machine Learning could not support the model’s binary files, which are stored in the native PyTorch (.pth) format. Hence, we had to construct an alternate approach in order to make the model available as an HTTPS endpoint, which we achieved by deploying the model as a REST API-based microservice on Azure App Service.
In general, Azure and AWS offer a similar range of specialized microservices for specific use cases. For example, AWS Bedrock and Azure OpenAI have similar goals and uses. However, when comparing the PaaS solutions between both providers, AWS SageMaker offers several tools for custom ML and AI solutions, whereas Azure ML is highly restricted in its capabilities.
In addition to the service catalog, the scalability of cloud platforms is very important for ML applications, specifically when any business expects rapid growth in requests. Both Azure and AWS have similar offerings in terms of scalability, whereby they can allocate additional instances with a copy of the deployed application when the number of requests exceeds a preset threshold. Therefore, both platforms are able to easily service the need for highly scalable deployment options.
4.7. Ease of Deployment
The ease of deployment is quite relative and can depend on various factors. Based on our experiments, we experienced that the process for model deployment on Azure is considerably more complex and challenging than AWS. However, this notion can vary considerably between developers. New developers may find that the development and deployment tools on AWS are preferable to Azure. This sentiment may change amongst developers that primarily have experience on the Azure platform. Hence, the final conclusion drawn from this experience is that AWS offers more documentation and developer-friendly tools, which may encourage new developers to develop and deploy their machine learning models on the AWS ecosystem. Azure, on the other hand, may be preferable to experienced developers, who may have a better understanding of the underlying infrastructure requirements of Azure.
4.8. Service-Level Agreements
When comparing the SLAs of AWS and Azure in the realm of compute, storage, and networking services, a subtle difference emerges. According to [
27], AWS boasts a slightly higher SLA of 99.99%, while [
28] reports that Azure offers an SLA of 99.95%. This slight difference highlights Amazon’s commitment to providing extremely reliable infrastructure. While the variance between the two SLAs is relatively small, it underscores each providers’ dedication to ensuring optimal service availability. Organizations must weigh this difference alongside other factors such as specific service offerings, pricing models, and additional features when making decisions about cloud-service providers. Furthermore, it is essential to note that while AWS and Azure provide overarching SLAs of 99.99% and 99.95%, respectively, the SLA for each specific service within their comprehensive portfolios may vary, adding an additional layer of consideration for organizations tailoring their cloud infrastructure choices. Ultimately, both AWS and Azure maintain robust SLAs; however, AWS provides a slight edge over Azure in terms of SLAs.
4.9. Final Comparative Result
We can summarize the best platform for each metric in
Table 8 below.
As in
Table 8, when comparing Azure and AWS, it is evident that each platform excels in specific areas. AWS boasts a superior upload time, making it an excellent choice for users who prioritize efficient data transfer from their local environment to the cloud. On the other hand, Azure stands out with its superior download time, ensuring the swift and seamless retrieval of data from the cloud to the user’s local environment.
When it comes to inference time and throughput, Azure succeeds. The CPU cluster on Azure is optimized to provide slightly faster inference times, enabling the quicker processing of machine learning models and real-time decision making. Azure’s higher throughput capabilities allow for the handling of larger volumes of data, ensuring smooth and efficient data-processing workflows.
On the other hand, the AWS cost structure is generally considered to be more affordable. This affordability makes it an attractive option for businesses looking to optimize their cloud expenses. Furthermore, AWS holds an advantage in terms of its catalog of machine learning resources. The platform offers an extensive array of prebuilt machine learning models, frameworks, and tools, providing users with a wide range of options to meet their specific needs. This robust availability of ML resources on AWS can significantly benefit users who require a diverse set of capabilities for their machine learning projects. In addition, the ease of the deployment process on AWS is more seamless and developer friendly, making it an excellent choice for the rapid development of ML services. Finally, AWS offers a slight advantage in terms of its SLA, allowing customers to experience minimal downtime and maximum connectivity for their ML applications.
Ultimately, the choice between Azure and AWS depends on the specific requirements and priorities of the user or organization. Azure’s strengths in download time, inference time, and throughput make it a compelling option for those seeking efficient data transfer and processing. Meanwhile, AWS’s advantage in upload time, cost, catalog of ML resources, ease of deployment, and SLA caters well to users looking for comprehensive machine learning capabilities. It is essential to evaluate these factors and consider the specific needs and objectives before selecting the most suitable cloud platform.
Since both platforms have their merits and demerits, it is more useful to categorize them based on the business requirements and suggest the best platform for each. Based on the empirical results obtained and the discussion above, we can now identify the top eight common business requirements as inspired by [
29,
30] and conclude the best platform for each requirement, as in
Table 9 below.
Table 9 can be used as a guide to aid decision making on the suitable platform based on business-requirement importance. For more code-focused developers, AWS is more suitable since Azure offers more “no-code”/“low-code” alternatives and ML workflows, while AWS allows for easier integration through APIs and cloud notebooks that aide development, as in
Section 4.7. Moreover, training, developing, and deploying custom models is simpler in AWS since Amazon SageMaker provides a highly flexible and wide range of services that can be used in different stages in an ML pipeline. This amalgamates to provide an overall higher level of customization at any level of granularity, as discussed in
Section 4.6. Additionally, as shown by the analysis in
Section 4.5, AWS was more cost effective than Azure.
On the other hand, Azure has better templates and model workflows that can be used to quickly develop ML solutions and pipelines. Furthermore, applications with a requirement for real-time inference should favor Azure, as seen in
Section 4.3. Lastly, any data-intensive workloads require a higher throughput, which Azure excels at, as in
Section 4.4.
Overall, both platforms are constantly evolving in a highly competitive market for cloud service providers, and new features specific to the exact business need might need to be taken into account in addition to the suggestion provided in this paper.
5. Conclusions
In conclusion, this paper addressed a significant gap in the existing literature by conducting a comprehensive comparison of two prominent cloud platforms, AWS and Azure, specifically in the context of deploying machine learning models. Through both empirical and theoretical examination, we successfully tested and reported the results obtained from both platforms, shedding light on their respective capabilities and performance.
This paper has provided insights into the strengths and limitations of AWS and Azure for machine learning applications. Our findings highlight crucial aspects such as the upload time, download time, inference time, throughput, cost effectiveness, variety in the catalog of ML resources, and ease of use, which are all pivotal considerations for practitioners and researchers in the field.
Our results indicate that Azure exhibits a superior download time with an average of 0.49 s/MB, enabling efficient data transfer from local environments to the cloud. On the other hand, AWS demonstrates a better download time with an average of 1.84 s/MB, ensuring the seamless retrieval of data from the cloud to local environments. In addition, Azure’s infrastructure, along with autoscaling, leads to a faster inference time (average 0.60 s/MB) and higher throughput (1145.78 MB/s), facilitating real-time decision making and efficient data-processing workflows. However, the cost structure of AWS proves to be more affordable with a total cost of USD 0.5364 per day, making it an attractive option for businesses aiming to optimize their cloud expenditures. In addition, AWS offers a remarkable advantage in terms of the availability of machine learning resources, along with being easy to deploy machine learning models. Its diversified portfolio of developer tools and machine learning models provides users with a broad spectrum of options to cater to their specific needs and requirements. Finally, AWS offers a more robust SLA, ensuring the minimal downtime and maximum connectivity of deployed applications.
Nevertheless, with regard to the download and upload times in Azure, we speculated the presence of a dynamic priority allocation for read and write requests into Azure Blob Storage. This mechanism can significantly impact the data transfer efficiency and overall performance. To optimize the use of Azure Blob Storage for a wide range of applications, a deeper investigation is necessary to understand the mechanics of this allocation and its implications. By gaining a comprehensive understanding of this process, we can develop more-effective strategies and solutions to enhance the speed and reliability of data transfers, ultimately benefiting users across various use cases. Hence, we believe it is crucial to prioritize further research into the upload and download times within Azure Blob Storage.
Additionally, subsequent research concerning this topic might incorporate various other object-detection models other than YOLOv8. This evaluation could validate whether the noted performance is specific to the model or uniform across different algorithms. Moreover, a long-term performance assessment could provide understanding of the stability and reliability of cloud services, crucial for business applications demanding high availability. Lastly, an investigation into the scalability procedures and the flexibility that cloud-service providers present in relation to resource allotment and administration could be undertaken. Such an inquiry would be essential for enterprises expecting rapid growth. In conclusion, these potential avenues for future research not only promise a more comprehensive understanding of model-specific performance but also hold the key to ensuring the sustained reliability and scalability of cloud services, offering valuable insights for businesses navigating the dynamic landscape of cloud computing.
The comparative insights in this paper provide practitioners and researchers with a solid foundation for selecting the most suitable cloud platform for their machine learning projects. Furthermore, we provide the best platform for eight popular business requirements based on the results and analysis to allow cloud practitioners to better choose the most suitable platform for their needs. By understanding the nuanced differences between AWS and Azure, decision makers can make informed choices aligned with their priorities.
Therefore, this paper bridges the gap in the literature by conducting a thorough comparison of AWS and Azure in terms of deploying machine learning models through experimentation. The reported results contribute valuable knowledge to the field and empower individuals and organizations to make informed decisions when choosing a cloud platform for their machine learning endeavors. As the landscape of cloud computing and machine learning continue to evolve, these findings serve as a stepping stone for further research and advancements in this popular domain.


