

Geospatial Analysis for Tectonic Assessment and Soil Erosion Prioritization: A Case Study of Wadi Al-Lith, Red Sea Coast, Saudi Arabia


Abstract
:1. Introduction
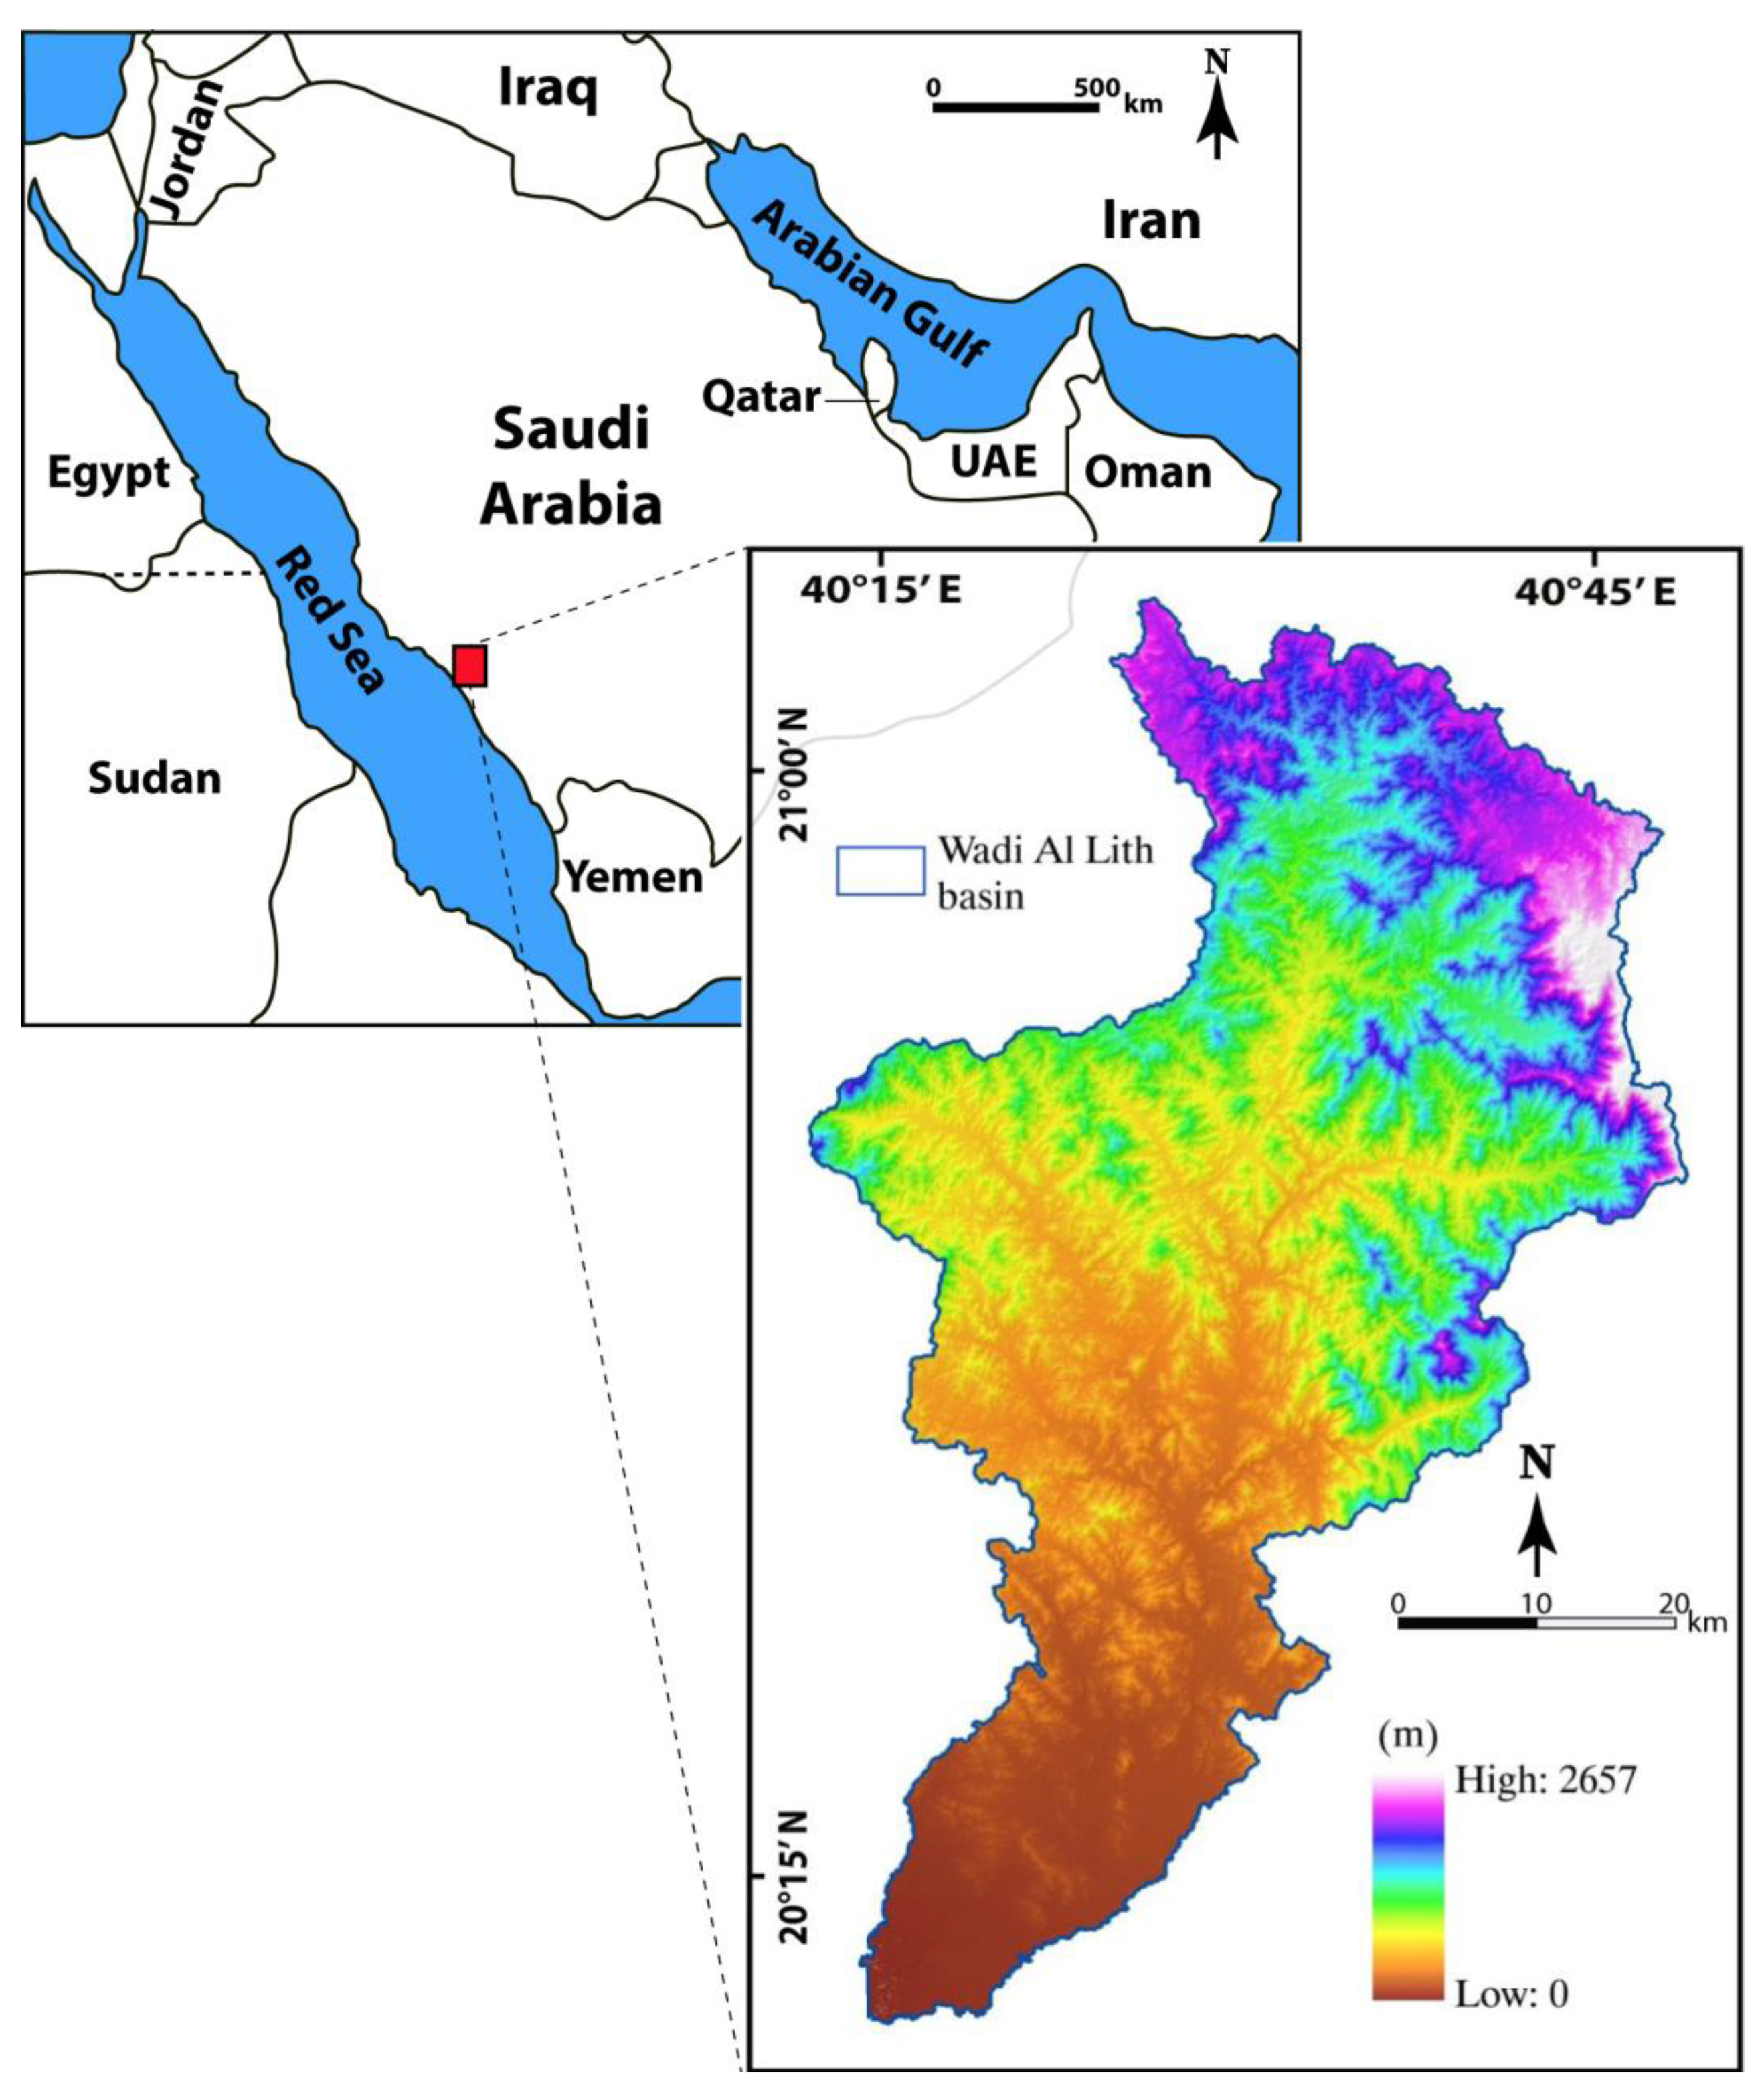
2. Study Area
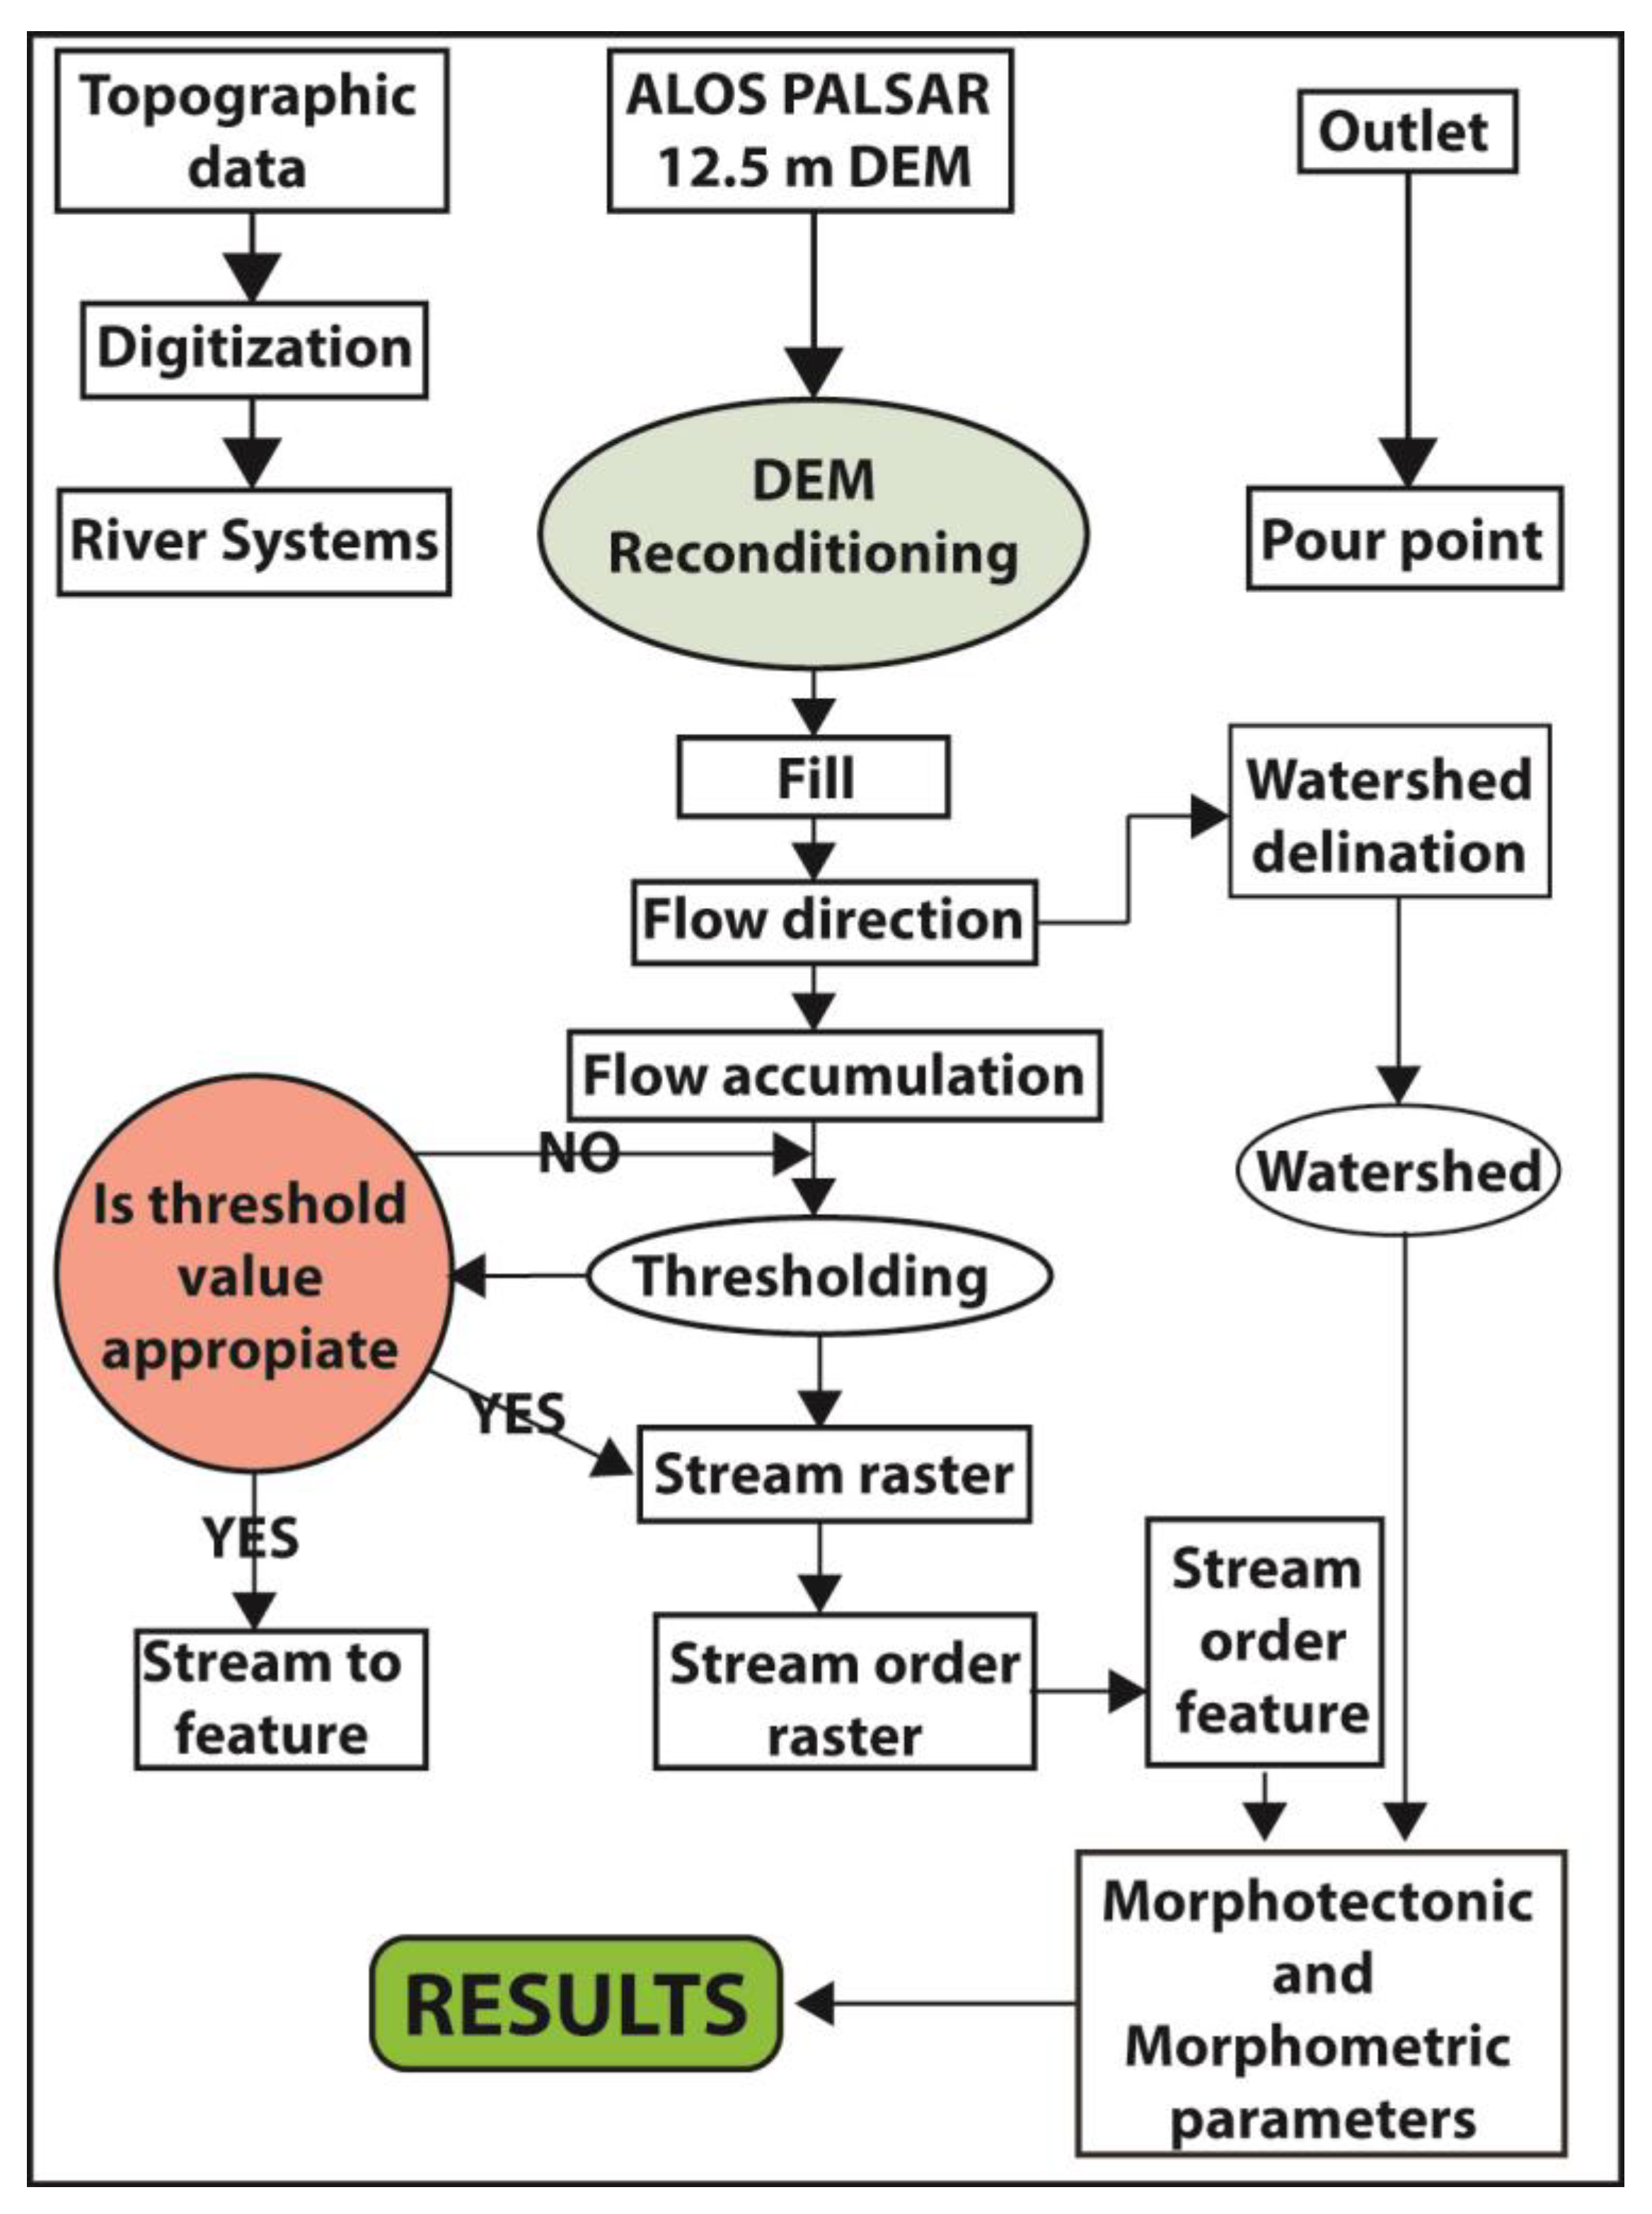
3. Material and Methods
3.1. Morphotectonic Analysis
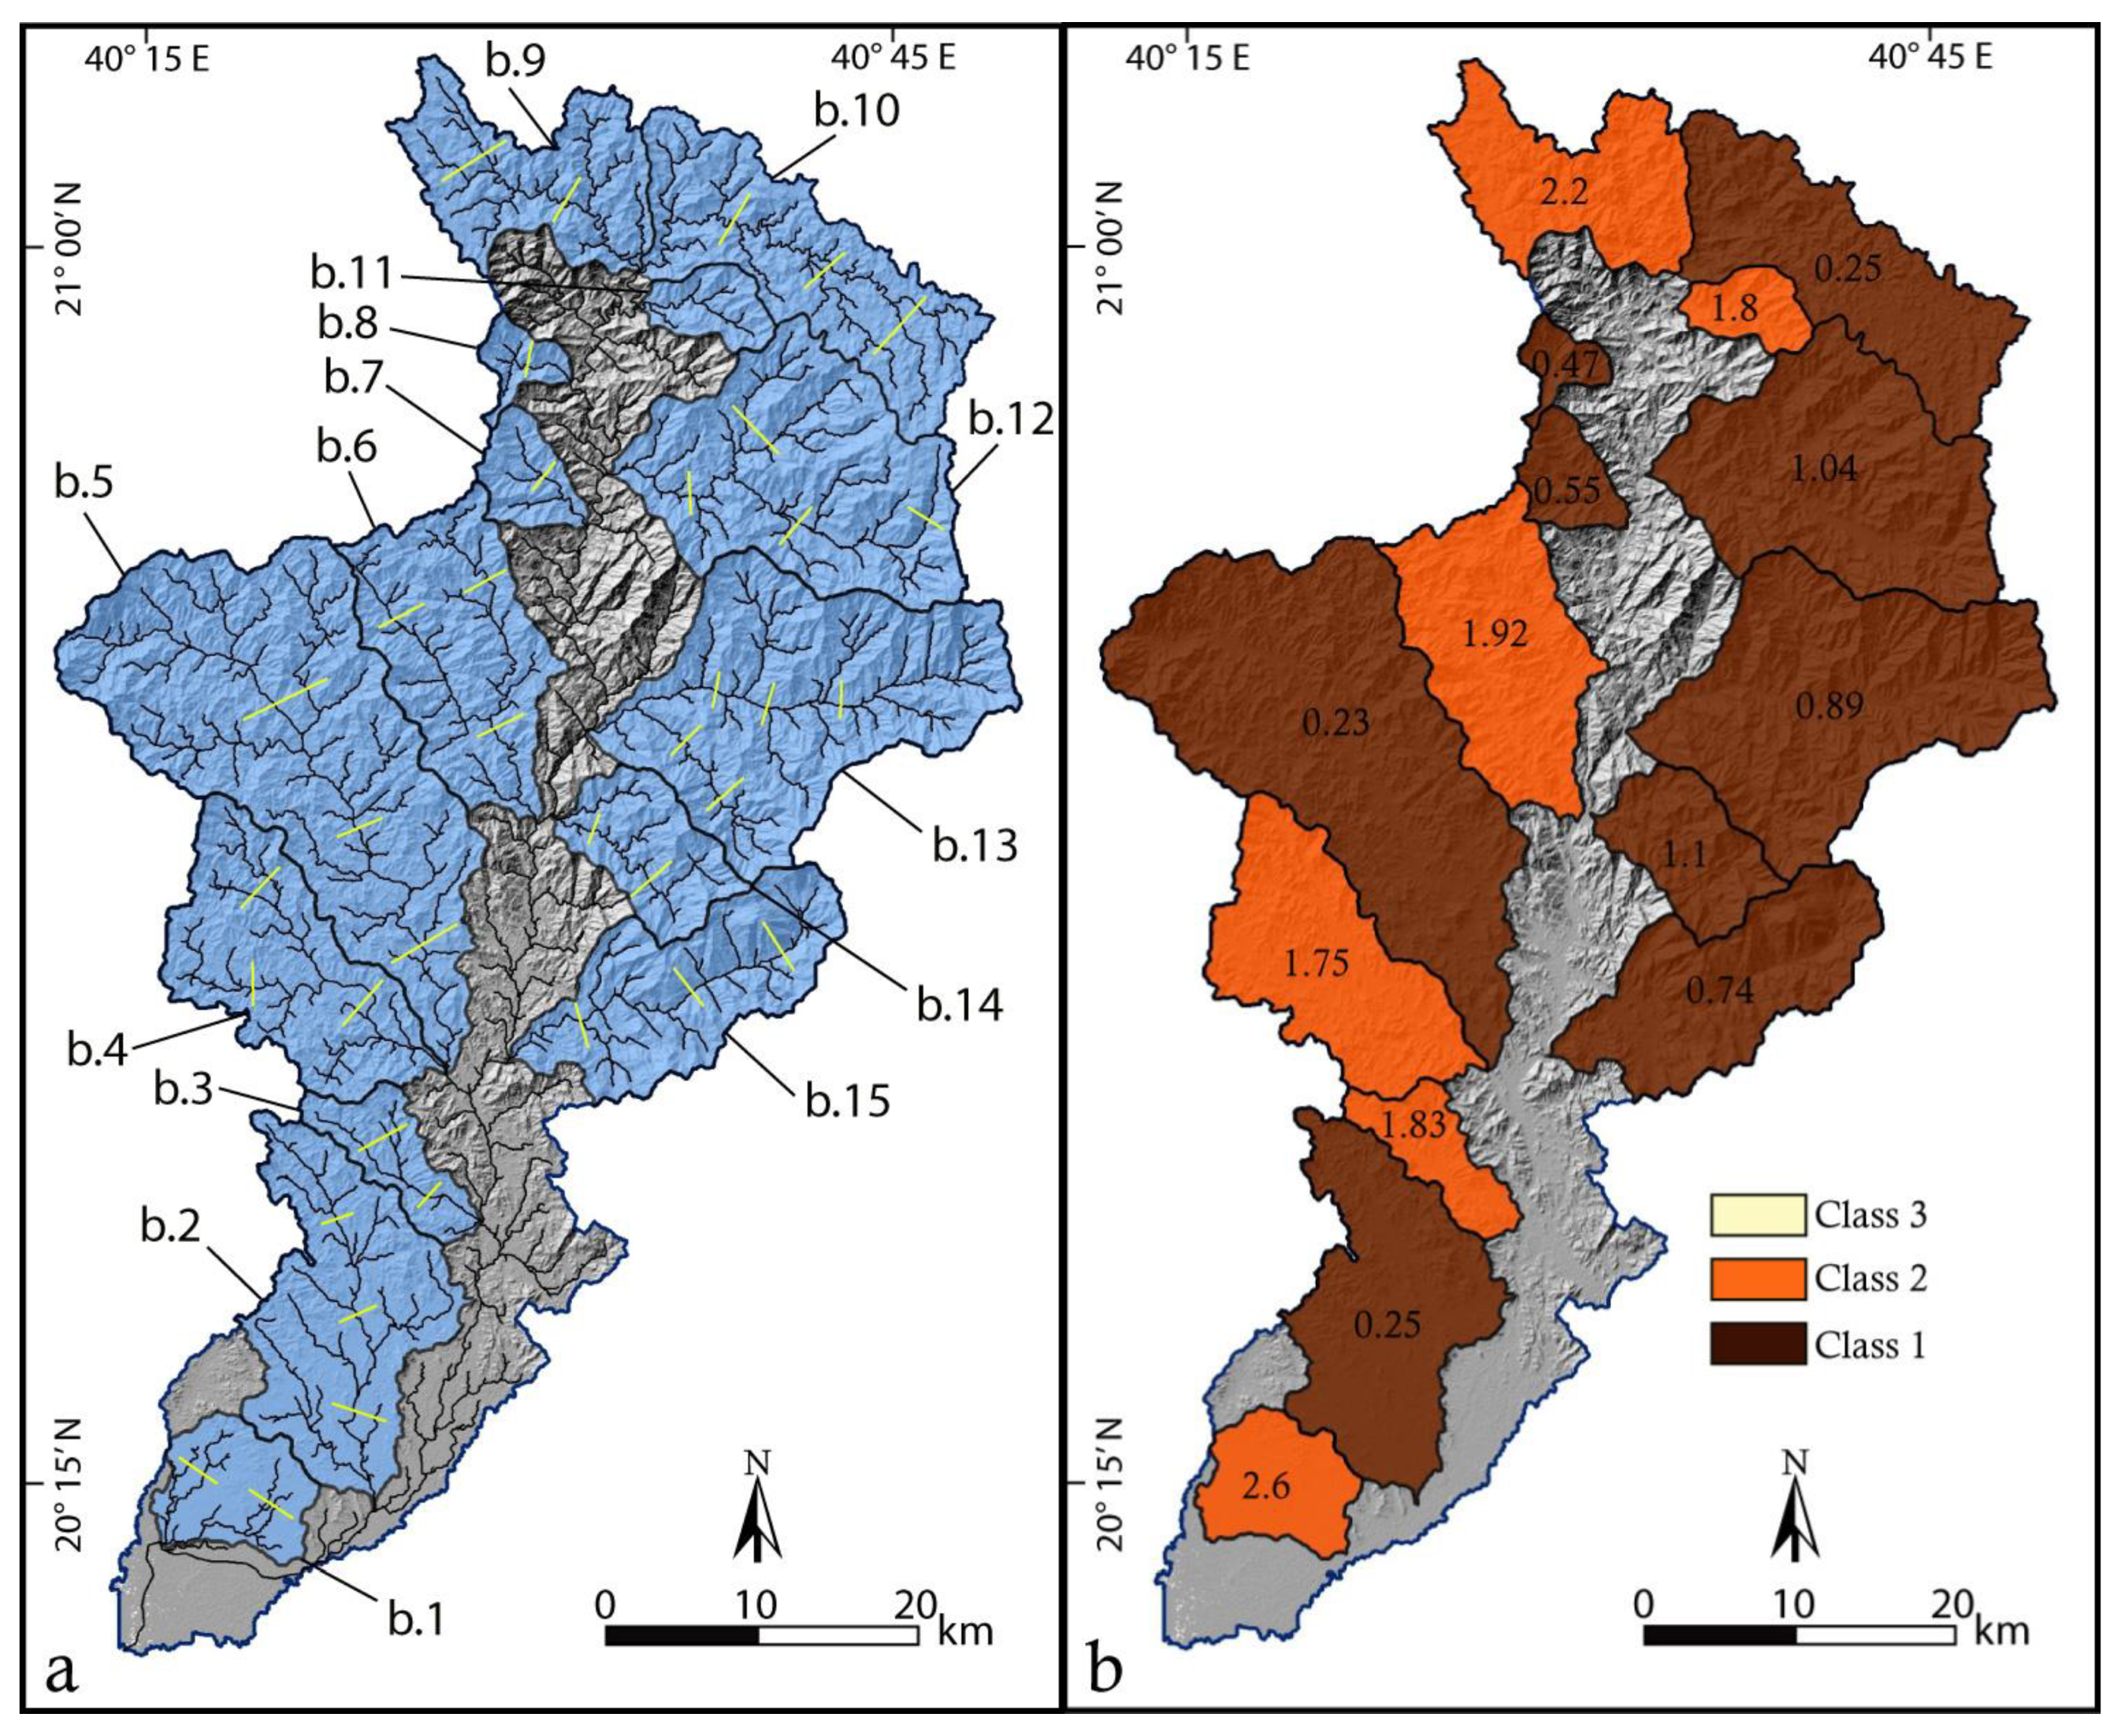
3.1.1. Valley Floor Width to Valley Floor Height Ratio (Vf)
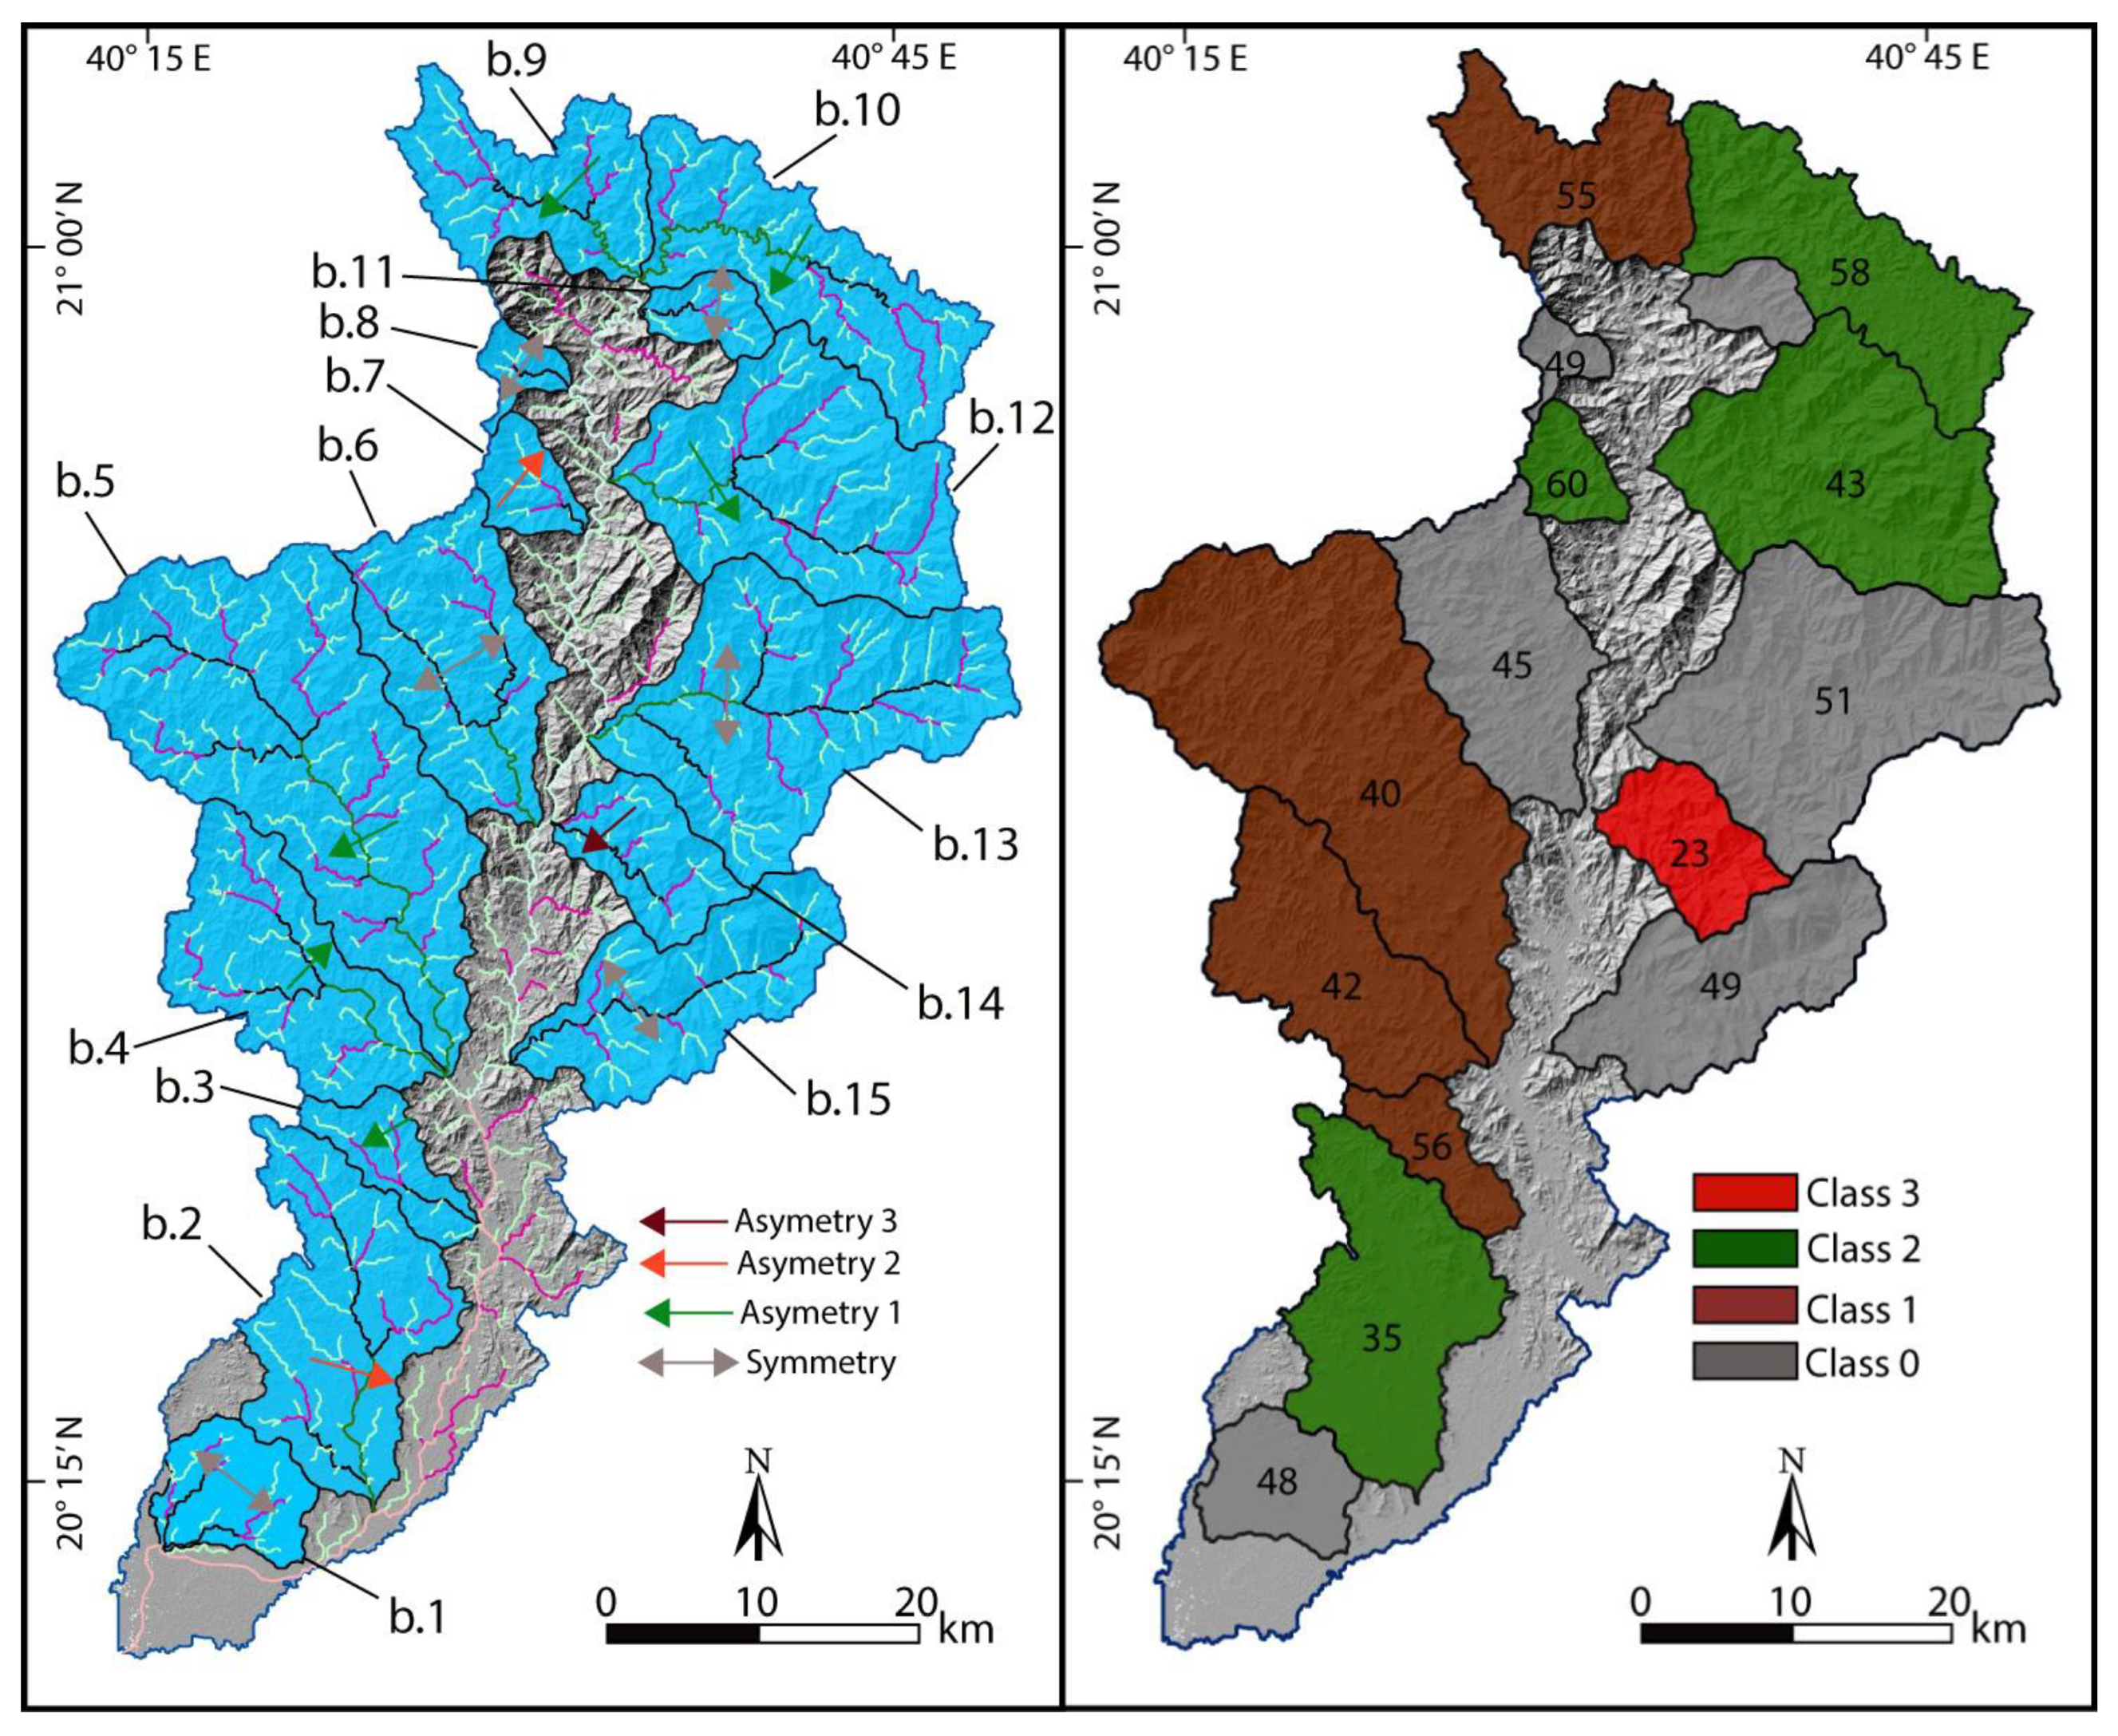
3.1.2. Asymmetry Factor (Af)
3.1.3. Drainage Basin Shape (Bs)
3.1.4. Hypsometric Integral (Hi)
3.1.5. Hypsometric Curve (Hc)
3.2. Relative Tectonic Activity Model (RTAM)
3.3. Morphometric Analysis

| Morphometric Parameters | Formula | References |
|---|---|---|
| Basin area (A) | Projected area enclosed by sub-basin boundary | [20] |
| Basin perimeter (P) Basin length (Lb) Stream orders (Lu) Stream numbers (Nu) Bifurcation ratio (Rb) Channel length (Lc) Fitness ratio (Rf) Form factor (Ff) Shape factor (Sh-f) Relative perimeter (Rp) Length area relation (Lr) Rotundity coefficient (Rc) Basin width (Wb) Drainage texture (Dt) Compactness coefficient (Cc) Elongation ratio (Re) Circularity ratio (Rc) Drainage density (Dd) Stream frequency (F) Channel maintenance constant (C-cm) Infiltration number (Inf) Drainage intensity (Di) Basin overland flow length (Lg) Basin relief (H) Relief ratio (Rhl) Ruggedness number (Rn) Melton ruggedness number (MRn) | Horizontal projection of length of basin divide Distance between outlet and farthest point on basin boundary Hierarchical order Nu = N1 + N2 + … Nn Rb = Nu/Nu + 1, where Nu is the number of streams of any given order, and Nu + 1 represents the number for the next higher order Lc = longest water path length in a given basin Rf = Lc/P Ff = A/Lb2 Sh-f = 1/Ff Rp = A/P Lr = 1.4 × A0.6 Rc = Lb2 × π/4A Wb = A/Lb Dt = Nu/P Cc = 0.282 × P/√A Re = Dc/Lb Rc = 4 π A/P2 Dd = Lu/A F = Nu/A C-cm = 1/Dd Inf = F × Dd Di = F/Dd Lg = 0.5 × Dd H = Z–Z, where Z and z are the highest elevation and lowest elevation, respectively Rhl = H/Lb Rn = Dd × (H/1000) MRn = H/0.5 A | [20] [20] [14] [21] [22] [9] [23] [24] [14] [20] [17] [14] [25] [21] [21] [20] [26] [14] [25] [20] [27] [28] [21] [29] [28] [14] [9] |
3.4. Basin Prioritization Model (BPM)
4. Results
4.1. Geometric Characteristics
4.2. Morphotectonic Analysis
4.2.1. Valley Floor Width to Valley Floor Height Ratio (Vf)
4.2.2. Asymmetry Factor (Af)
4.2.3. Drainage Basin Shape (Bs)
4.2.4. Hypsometric Integral (Hi)
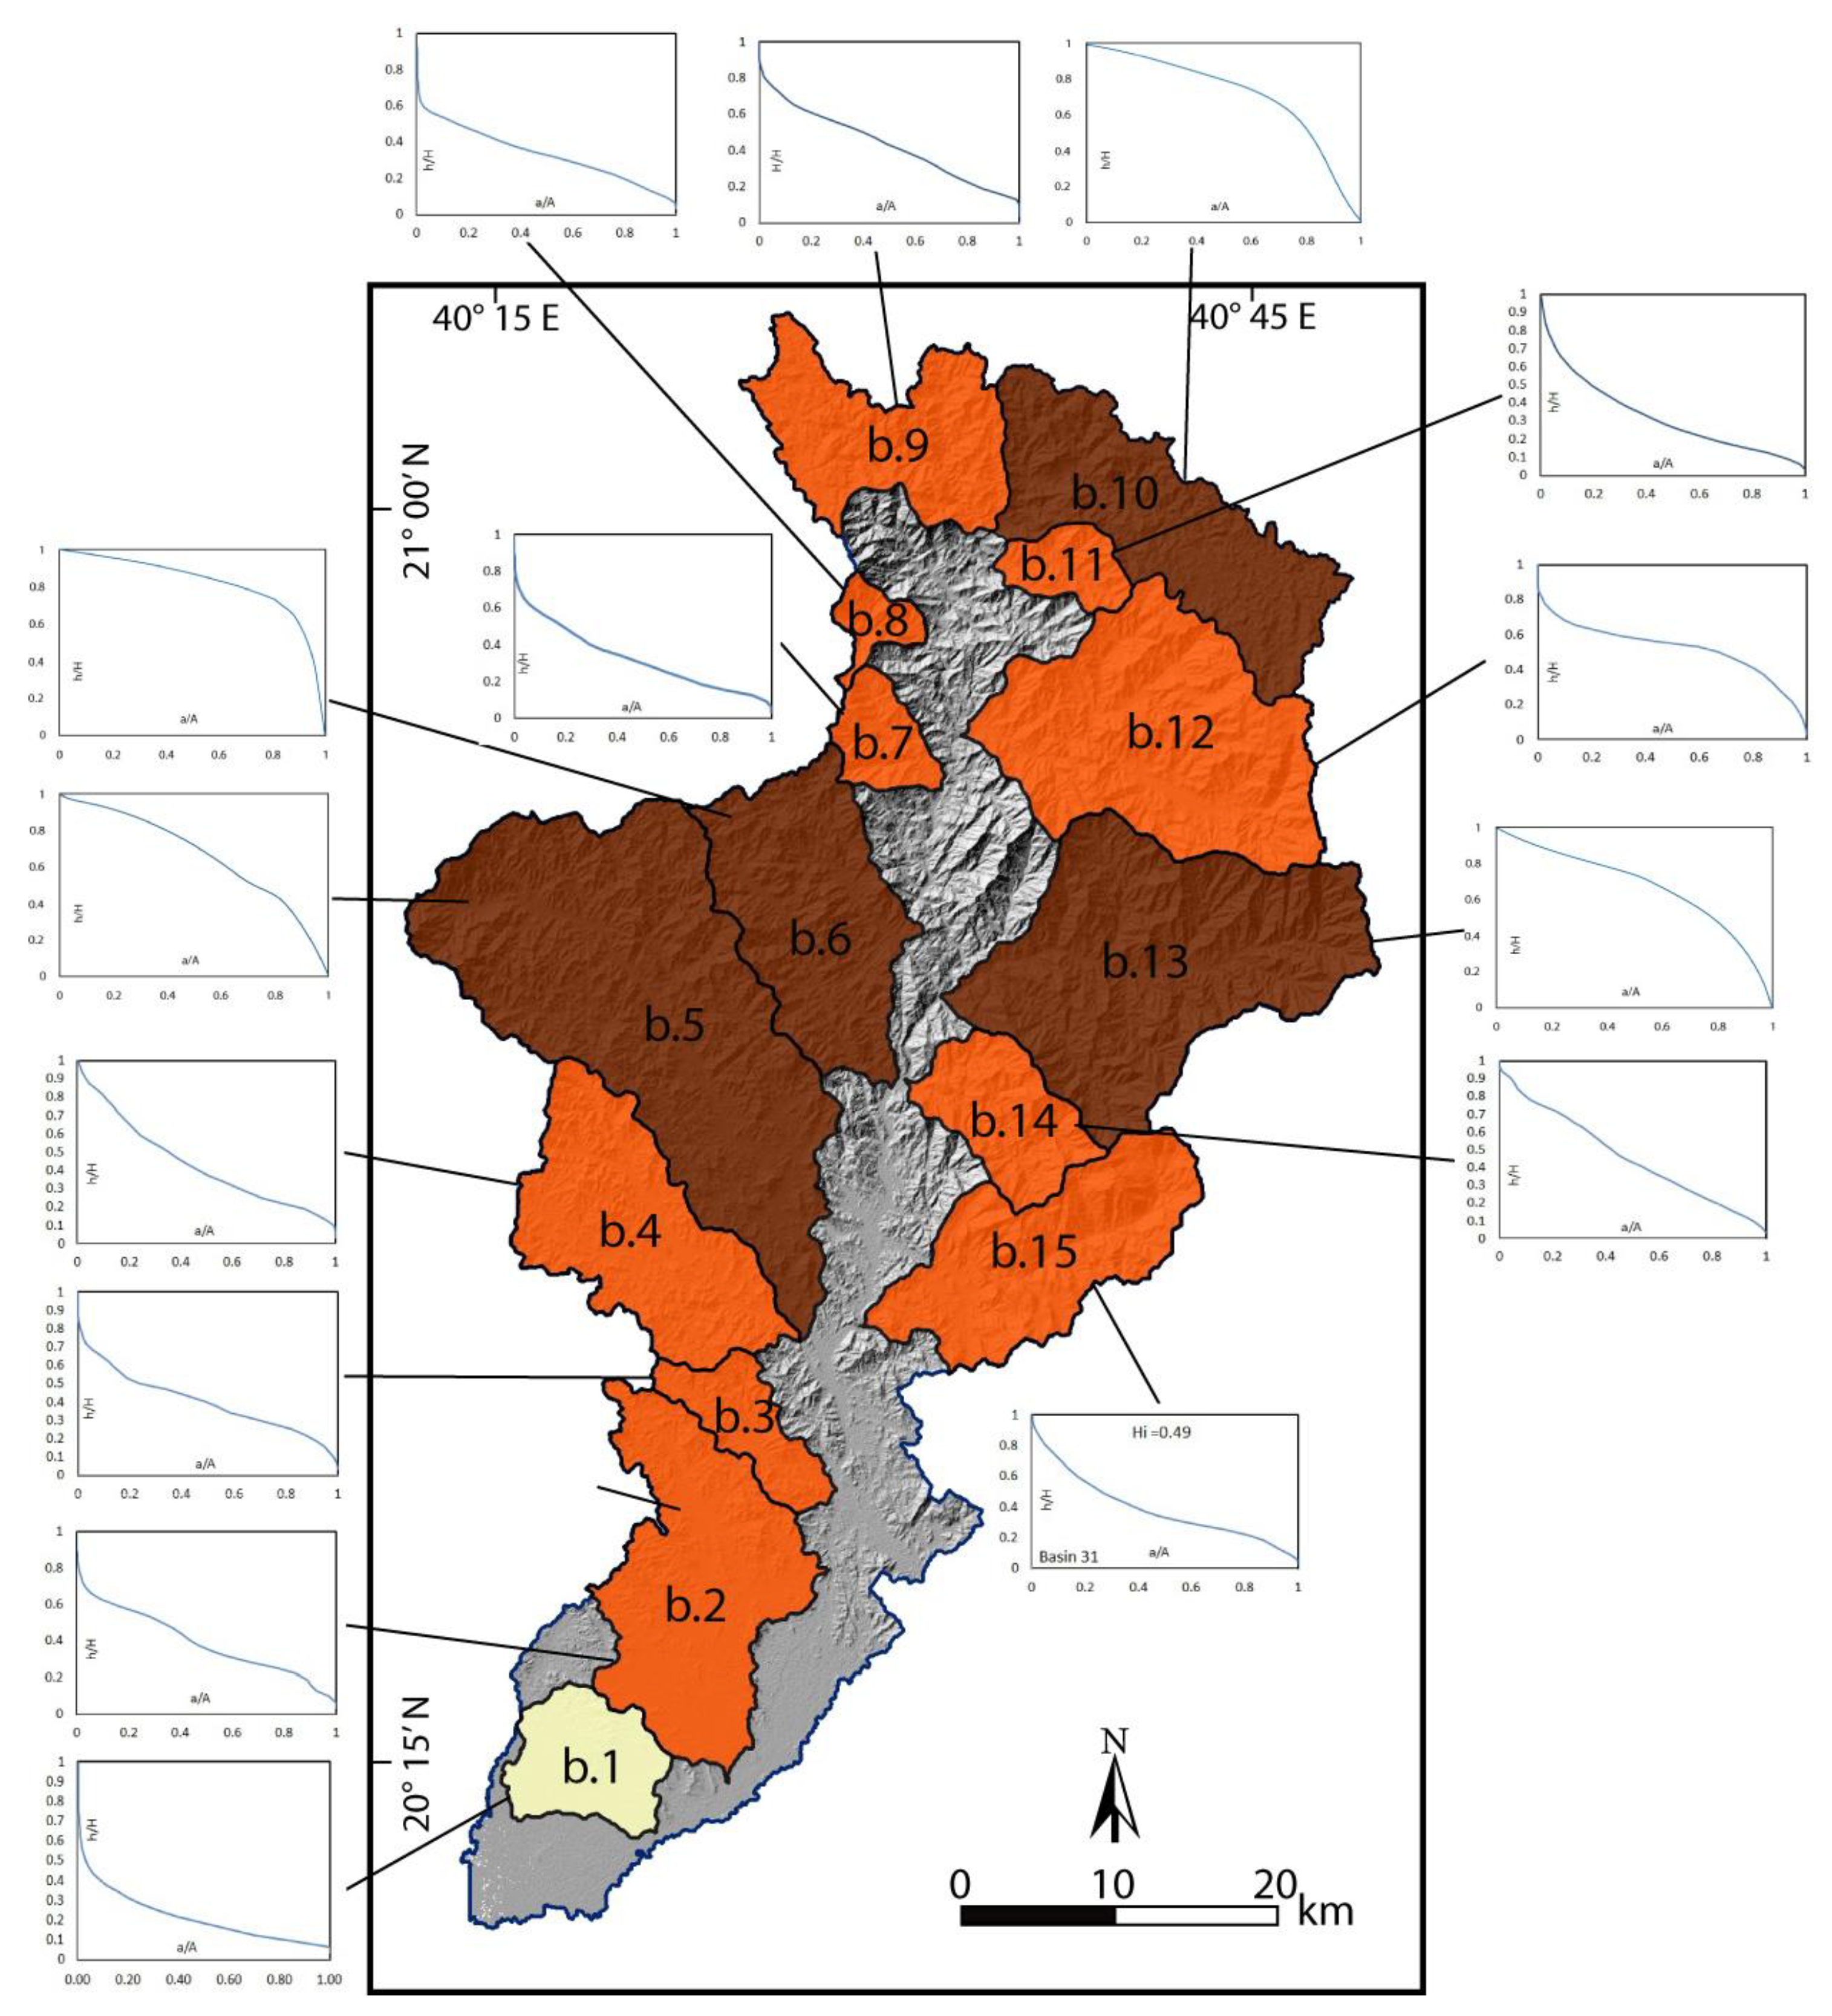
4.2.5. Hypsometric Curves (Hc)
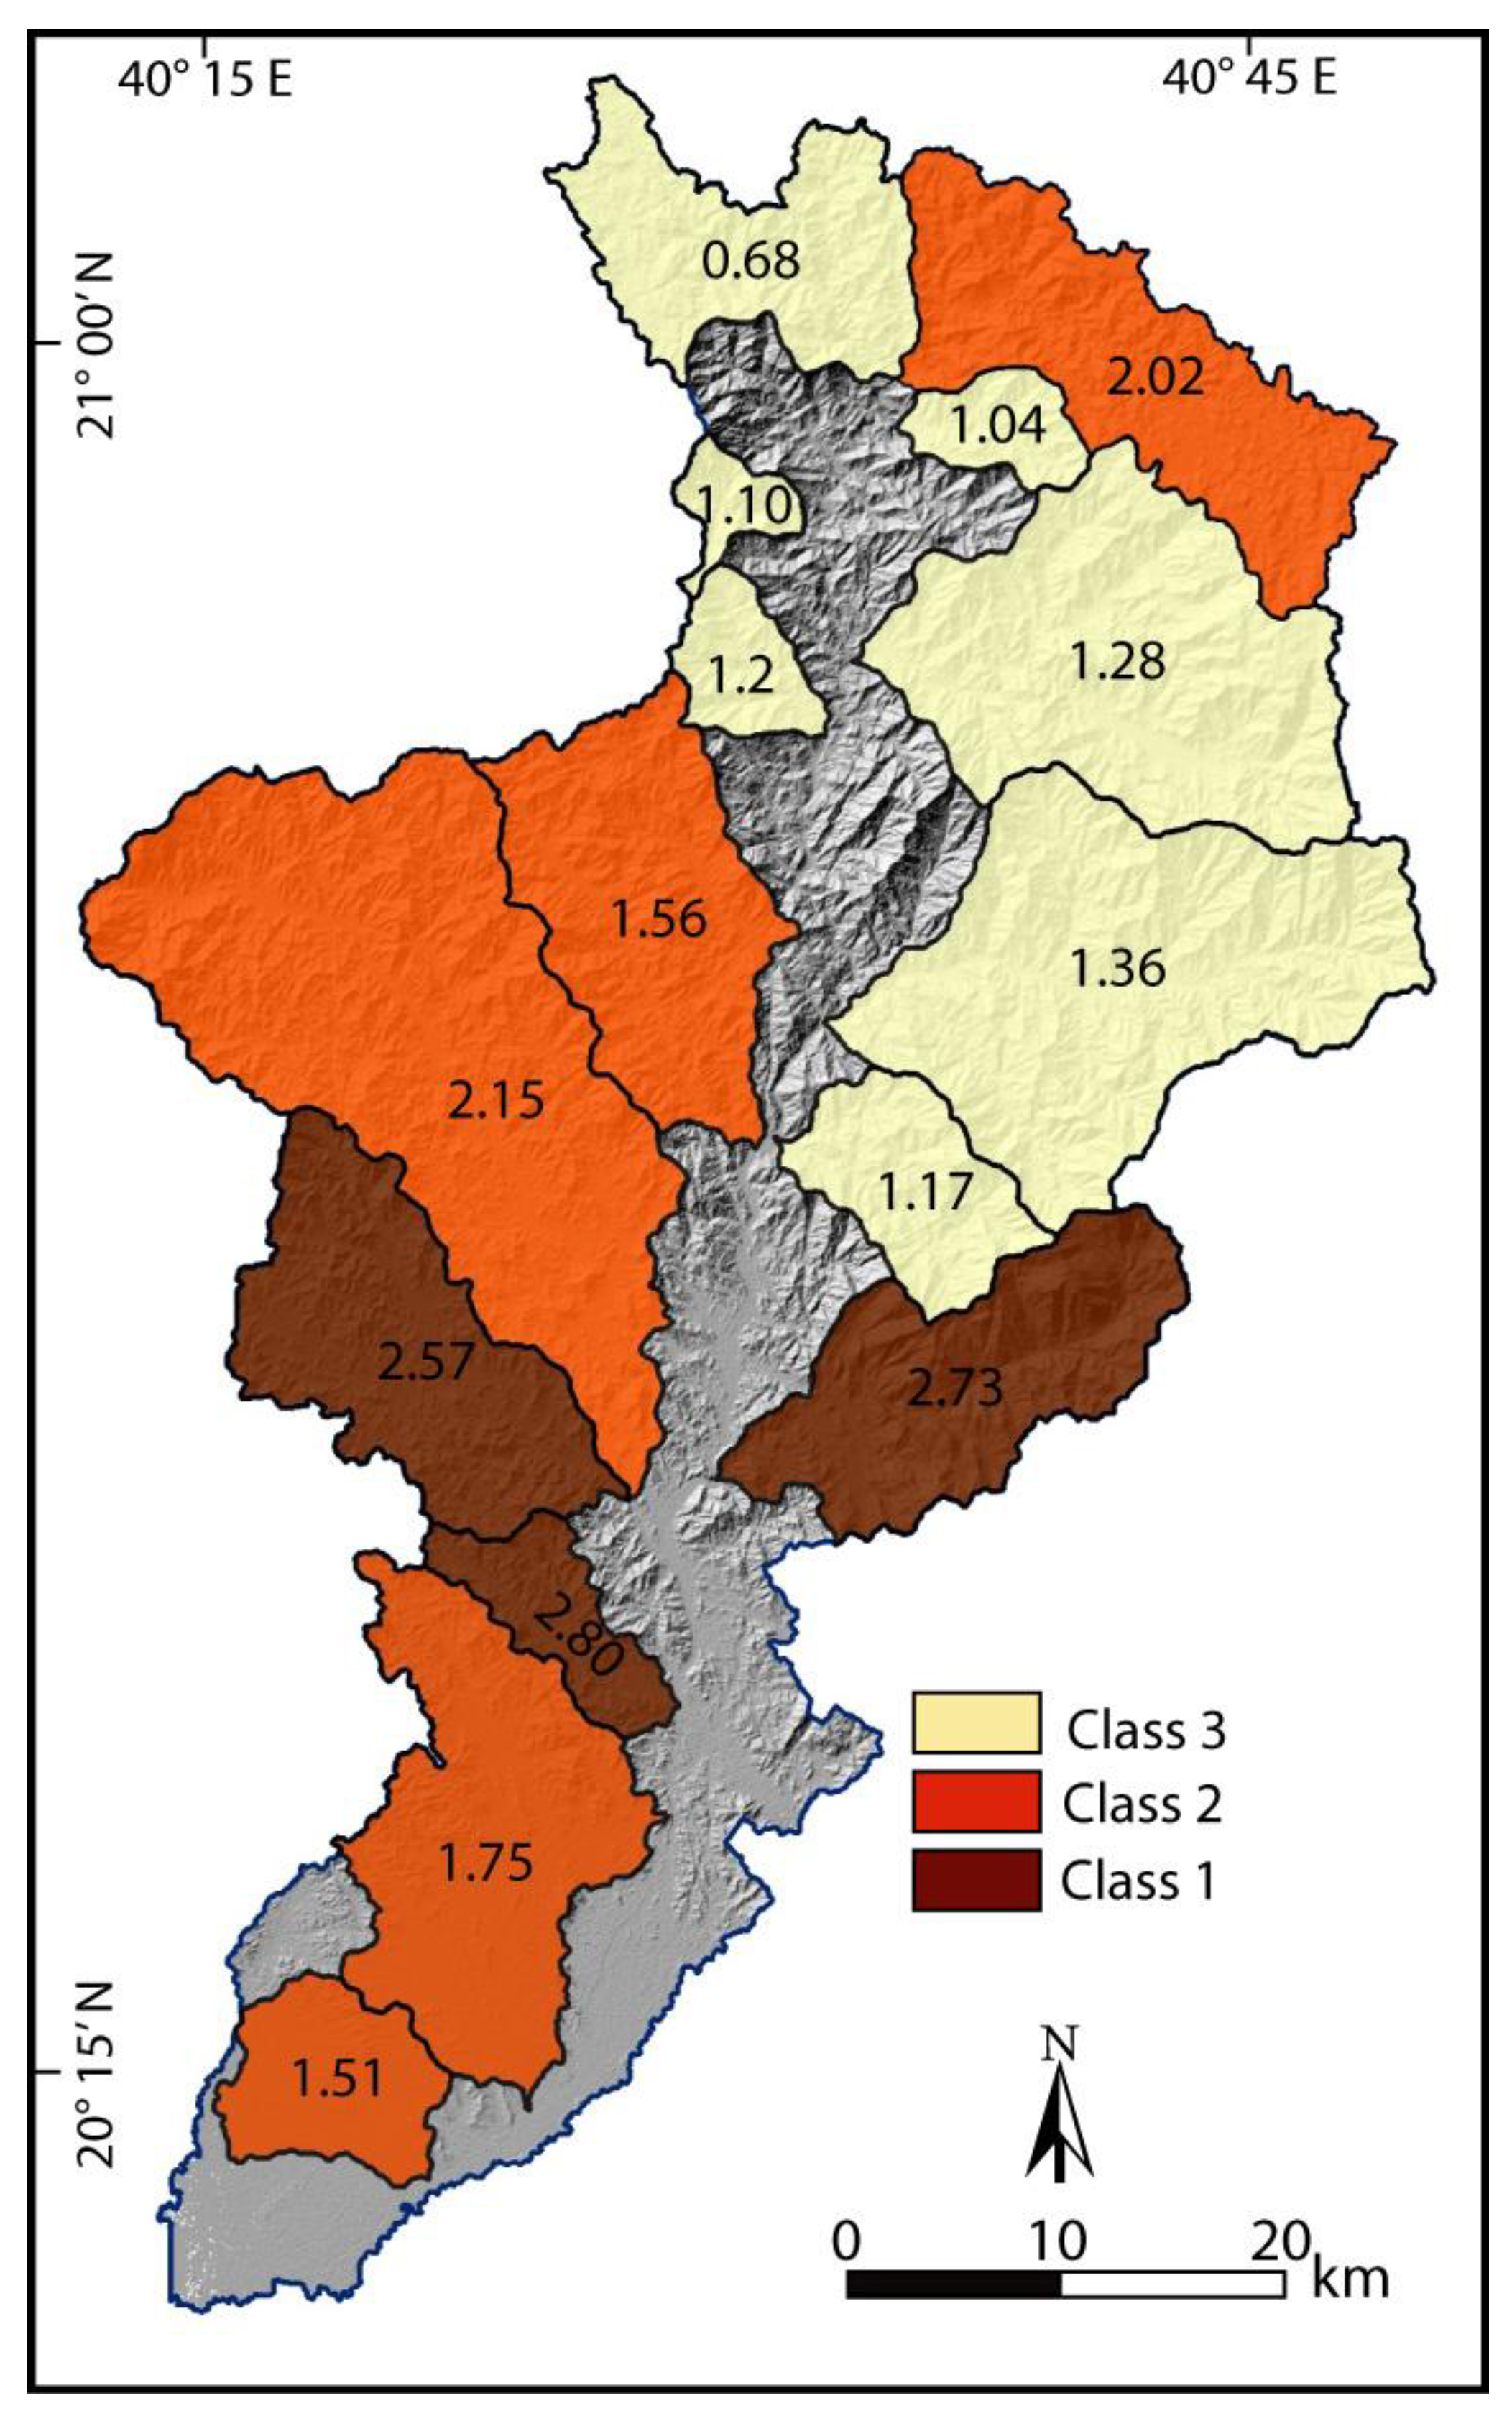
4.3. Relative Tectonic Activity Model (RTAM)
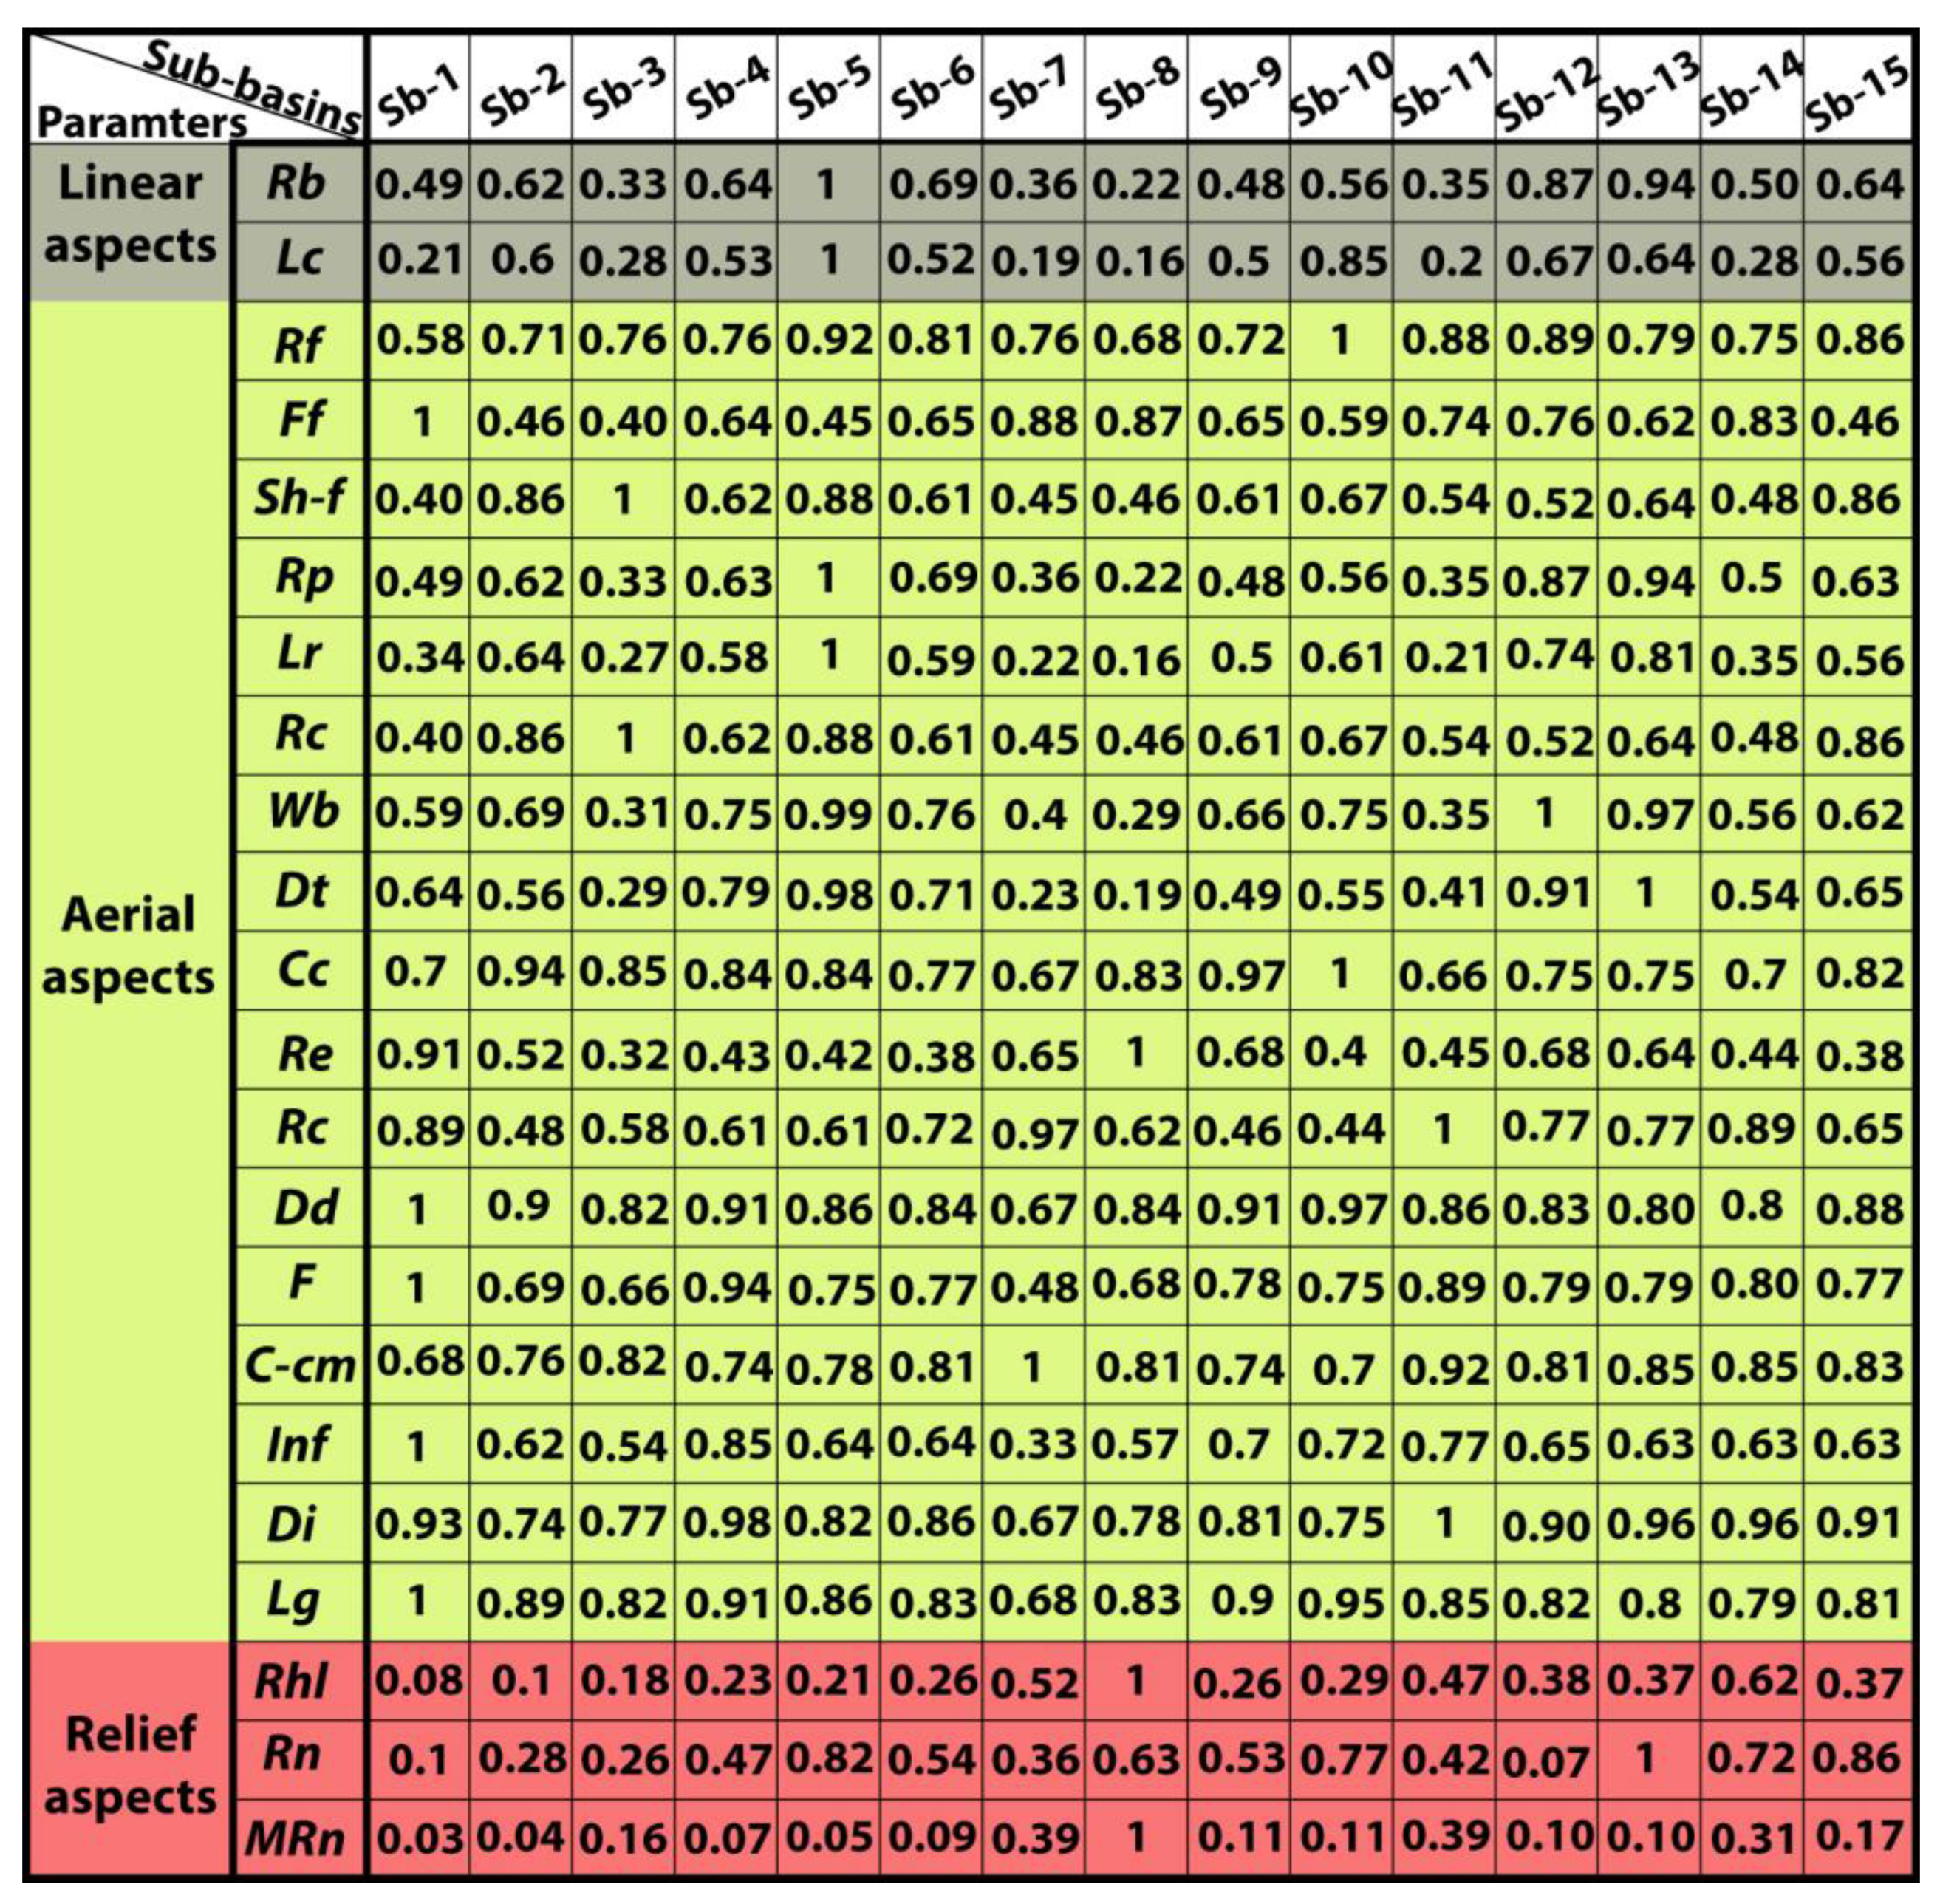
4.4. Morphometric Analysis
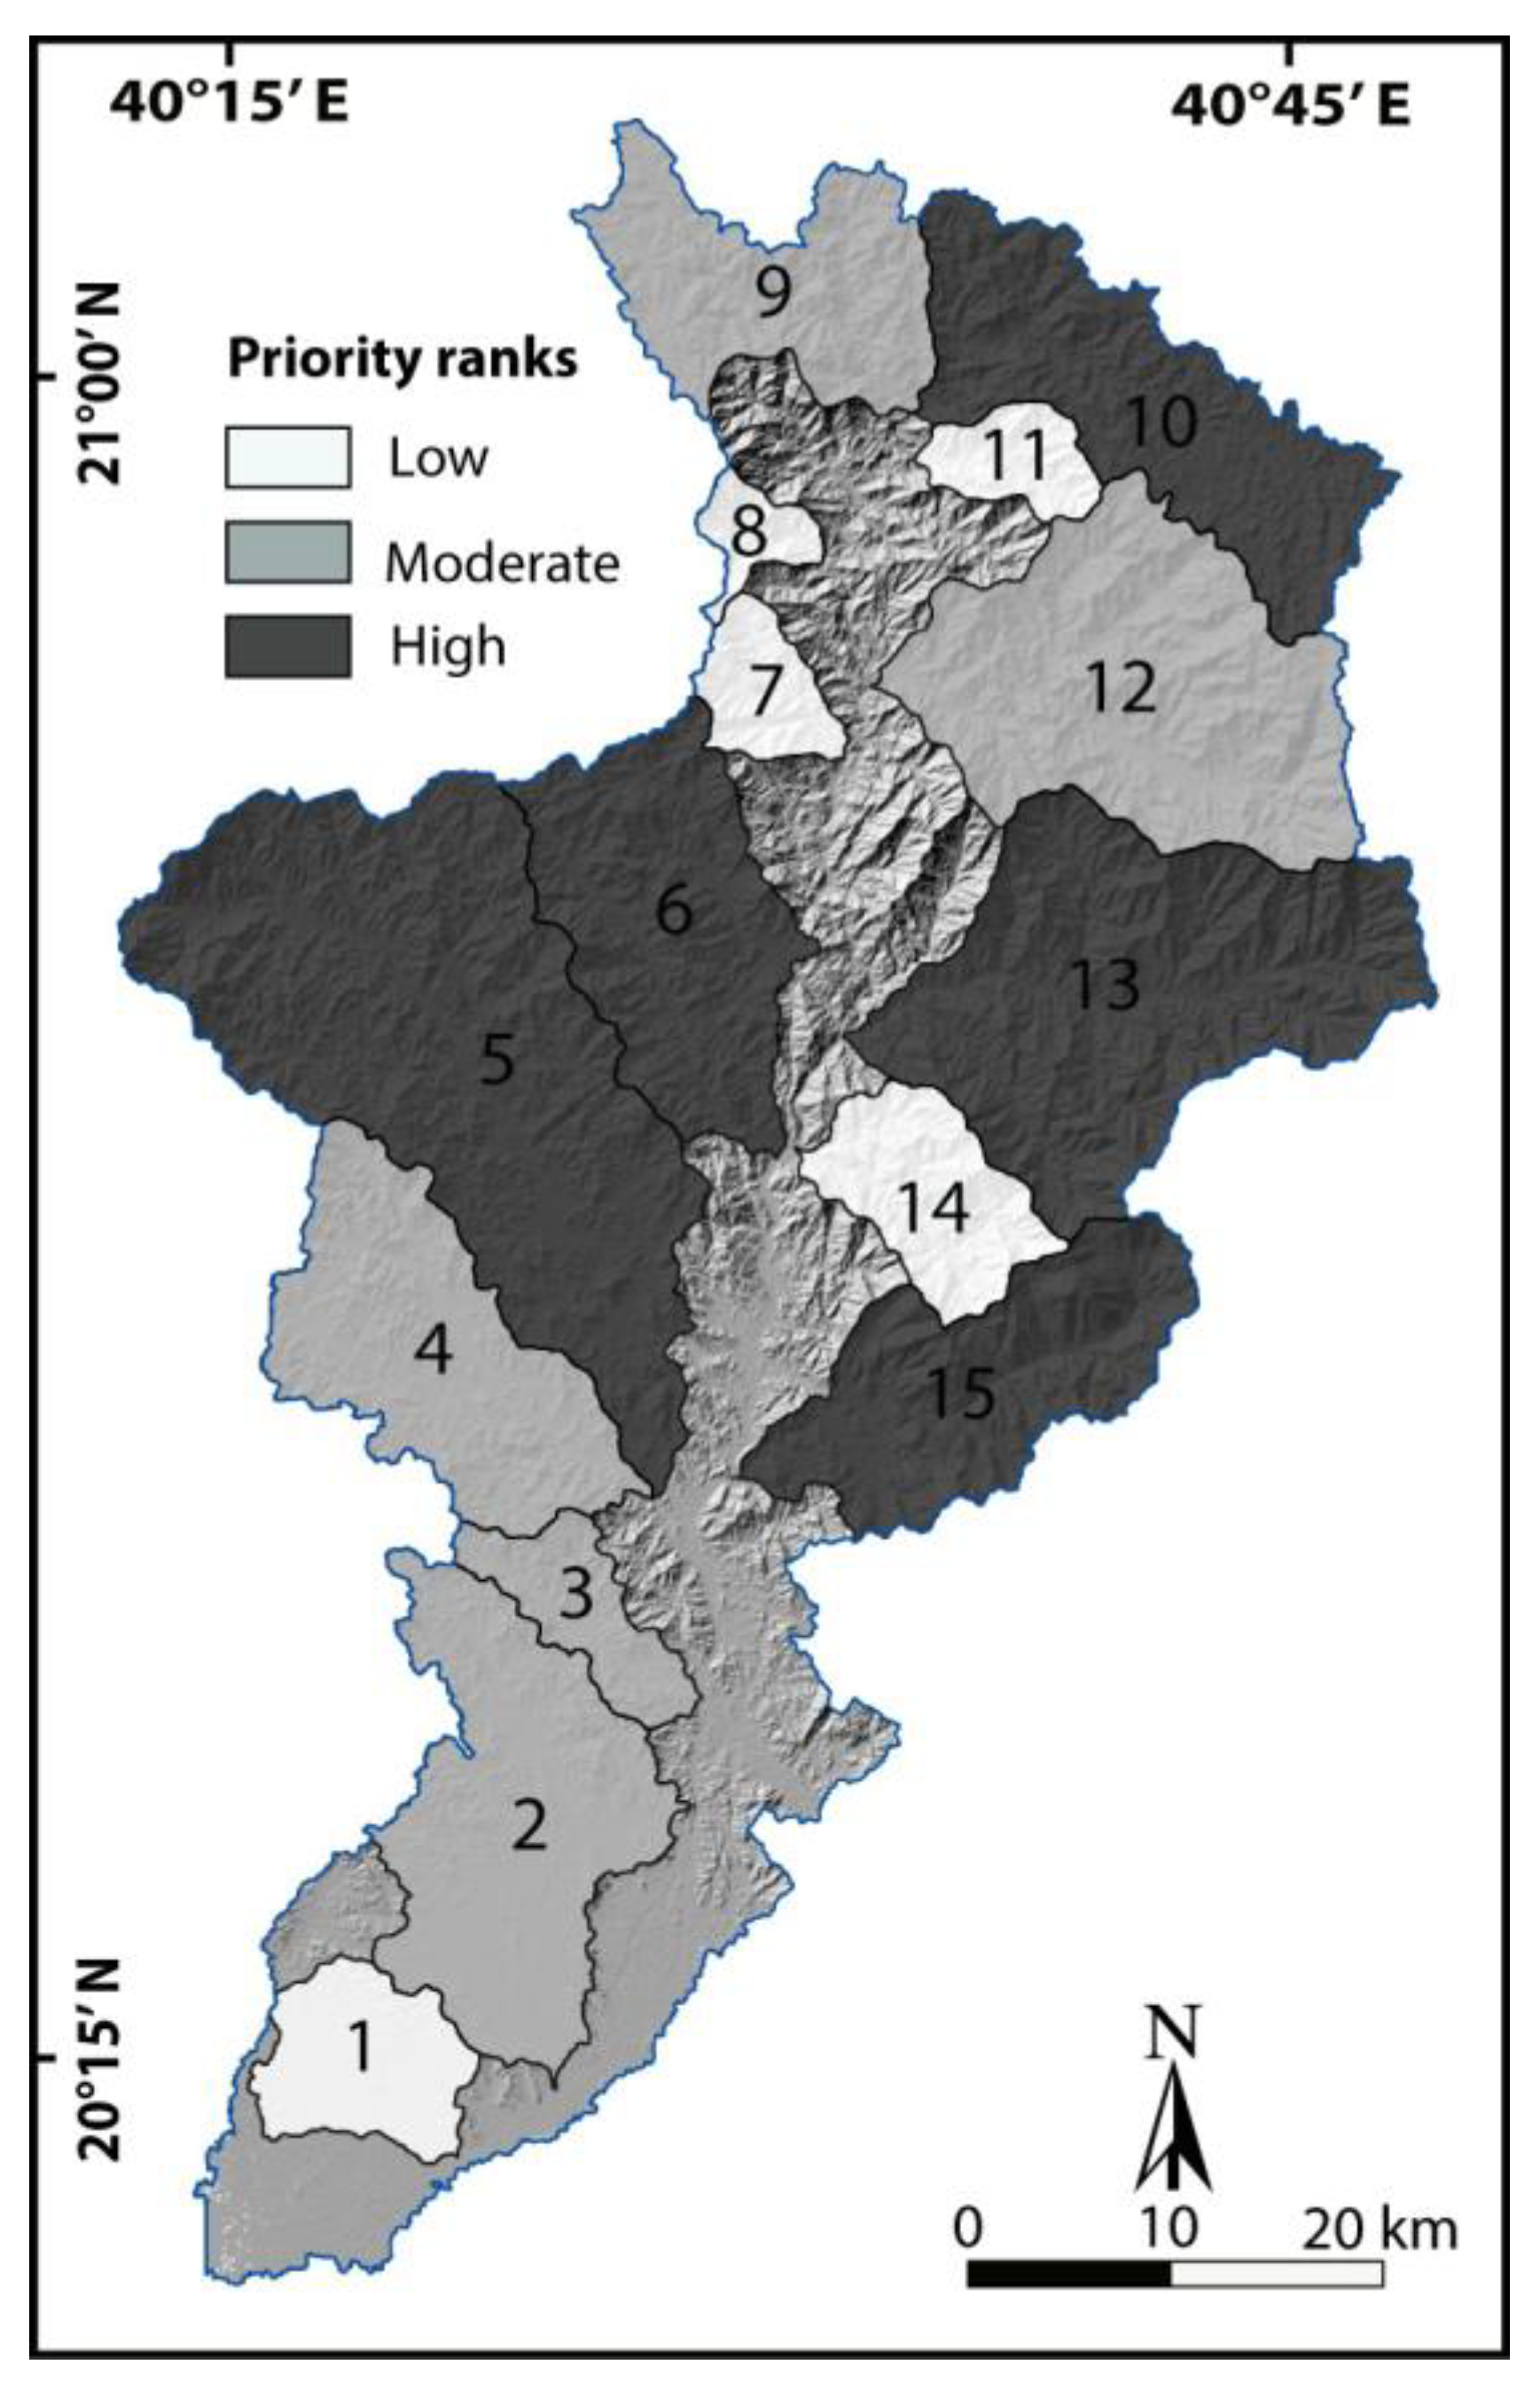
4.5. Soil Erosion Priorities and the Weighted Sum Method
5. Discussion
5.1. Discussion of Relative Tectonic Activity
5.2. Discussion of Soil Erosion Priorities
6. Conclusions
Author Contributions
Funding
Institutional Review Board Statement
Informed Consent Statement
Data Availability Statement
Acknowledgments
Conflicts of Interest
References
- Khalifa, A.; Çakir, Z.; Owen, L.A.; Kaya, Ş. Morphotectonic Analysis of the East Anatolian Fault, Turkey. Turk. J. Earth Sci. 2018, 27, 110–126. [Google Scholar] [CrossRef]
- Rekha, V.B.; George, A.V.; Rita, M. Morphometric Analysis and Micro-Watershed Prioritization of Peruvanthanam Sub-Watershed, the Manimala River Basin, Kerala, South India. Environ. Res. Eng. Manag. 2011, 57, 6–14. [Google Scholar]
- Abdullah, L.H.; Al Daghastani, H.S.; Bety, A.K.S. Evaluation of Neotectonic Activity Using Watershed Geomorphic Analysis: A Case Study in the West of Dokan Lake, Kurdistan Region, Iraq. Heliyon 2023, 9, e13187. [Google Scholar] [CrossRef] [PubMed]
- Agrawal, N.; Gupta, L.; Dixit, J. Geospatial Assessment of Active Tectonics Using SRTM DEM-Based Morphometric Approach for Meghalaya, India. All Earth 2022, 34, 39–54. [Google Scholar] [CrossRef]
- Shekar, P.R.; Mathew, A.; Abdo, H.G.; Almohamad, H.; Abdullah Al Dughairi, A.; Al-Mutiry, M. Prioritizing Sub-Watersheds for Soil Erosion Using Geospatial Techniques Based on Morphometric and Hypsometric Analysis: A Case Study of the Indian Wyra River Basin. Appl. Water Sci. 2023, 13, 160. [Google Scholar] [CrossRef]
- Rahmati, O.; Samadi, M.; Shahabi, H.; Azareh, A.; Rafiei-Sardooi, E.; Alilou, H.; Melesse, A.M.; Pradhan, B.; Chapi, K.; Shirzadi, A. SWPT: An Automated GIS-Based Tool for Prioritization of Sub-Watersheds Based on Morphometric and Topo-Hydrological Factors. Geosci. Front. 2019, 10, 2167–2175. [Google Scholar] [CrossRef]
- López-Pérez, A.; Fernández-Reynoso, D.S. Watershed Prioritization Using Morphometric Analysis and Vegetation Index: A Case Study of Huehuetan River Sub-Basin, Mexico. Arab. J. Geosci. 2021, 14, 1852. [Google Scholar] [CrossRef]
- Singh, W.R.; Barman, S.; Tirkey, G. Morphometric Analysis and Watershed Prioritization in Relation to Soil Erosion in Dudhnai Watershed. Appl. Water Sci. 2021, 11, 151. [Google Scholar] [CrossRef]
- Nooka Ratnam, K.; Srivastava, Y.K.; Venkateswara Rao, V.; Amminedu, E.; Murthy, K.S.R. Check Dam Positioning by Prioritization Micro-Watersheds Using SYI Model and Morphometric Analysis—Remote Sensing and GIS Perspective. J. Indian Soc. Remote Sens. 2005, 33, 25–38. [Google Scholar] [CrossRef]
- Khan, M.A.; Gupta, V.P.; Moharana, P.C. Watershed Prioritization Using Remote Sensing and Geographical Information System: A Case Study from Guhiya, India. J. Arid Environ. 2001, 49, 465–475. [Google Scholar] [CrossRef]
- Hussein, M.T.; Lashin, A.; Al Bassam, A.; Al Arifi, N.; Al Zahrani, I. Geothermal Power Potential at the Western Coastal Part of Saudi Arabia. Renew. Sustain. Energy Rev. 2013, 26, 668–684. [Google Scholar] [CrossRef]
- Elsebaie, I.H.; Kawara, A.Q.; Alnahit, A.O. Mapping and Assessment of Flood Risk in the Wadi Al-Lith Basin, Saudi Arabia. Water 2023, 15, 902. [Google Scholar] [CrossRef]
- Khalifa, A.; Bashir, B.; Alsalman, A.; Öğretmen, N. Morpho-Tectonic Assessment of the Abu-Dabbab Area, Eastern Desert, Egypt: Insights from Remote Sensing and Geospatial Analysis. ISPRS Int. J. Geo-Inf. 2021, 10, 784. [Google Scholar] [CrossRef]
- Strahler, A.N.; Strahler, A. Quantitative Geomorphology of Drainage Basins and Channel Networks. In Handbook of Applied Hydrology; Chow, V., Ed.; McGraw Hill: New York, NY, USA, 1964; pp. 439–476. [Google Scholar]
- Keller, E.A.; Pinter, N. Active Tectonics: Earthquakes, Uplift and Landscape, 2nd ed.; Prentice Hall: Upper Saddle River, NJ, USA, 2002. [Google Scholar]
- Bull, W.B.; McFadden, L.D. Tectonic Geomorphology North and South of the Garlock Fault, California. In Geomorphology in Arid Regions; Doehring, D.O., Ed.; Routledge: Abingdon-on-Thames, UK, 1977; Volume 304, pp. 559–589. [Google Scholar]
- Hack, J.T. Stream-Profile Analysis and Stream-Gradient Index. J. Res. United States Geol. Surv. 1973, 1, 421–429. [Google Scholar]
- Peters, G.; van Balen, R.T. Tectonic Geomorphology of the Northern Upper Rhine Graben, Germany. Glob. Planet. Chang. 2007, 58, 301–334. [Google Scholar] [CrossRef]
- Ahmed, S.A.; Chandrashekarappa, K.N.; Raj, S.K.; Nischitha, V.; Kavitha, G. Evaluation of Morphometric Parameters Derived from ASTER and SRTM DEM—A Study on Bandihole Sub-Watershed Basin in Karnataka. J. Indian Soc. Remote Sens. 2010, 38, 227–238. [Google Scholar] [CrossRef]
- Schumm, S.A. Evolution of Drainage Systems and Slopes in Badlands at Perth Amboy, New Jersey. Bull. Geol. Soc. Am. 1956, 67, 597–646. [Google Scholar] [CrossRef]
- Horton, R.E. Erosional Development of Streams and Their Drainage Basins: Hydrophysical Approach to Quantitative Morphology. Bull. Geol. Soc. Am. 1945, 56, 275–370. [Google Scholar] [CrossRef]
- Strahler, A.N. Quantitative Analysis of Watershed Geomorphology. Eos, Trans. Am. Geophys. Union 1957, 38, 913–920. [Google Scholar] [CrossRef]
- Melton, M.A. An Analysis of the Relations Among Elements of Climate, Surface Properties, and Geomorphology; Technical report (United Sates. Office of Naval Research), Lamont-Doherty Earth Observatory technical Reports, No. 11; Department of Geology, Columbia University: New York, NY, USA, 1957; Volume 99. [Google Scholar]
- Khalifa, A.; Bashir, B.; Alsalman, A.; Naik, S.P.; Nappi, R. Remotely Sensed Data, Morpho-Metric Analysis, and Integrated Method Approach for Flood Risk Assessment: Case Study of Wadi Al-Arish Landscape, Sinai, Egypt. Water 2023, 15, 1797. [Google Scholar] [CrossRef]
- Horton, R.E. Drainage-basin Characteristics. Eos, Trans. Am. Geophys. Union 1932, 13, 350–361. [Google Scholar] [CrossRef]
- Miller, V.C. A Quantitative Geomorphic Study of Drainage Basin Characteristics in the Clinch Mountain Area, Virginia and Tennessee; Department of Geology, Columbia University: New York, NY, USA, 1953; pp. 389–402. [Google Scholar]
- Khalifa, A.; Bashir, B.; Alsalman, A.; Bachir, H. Morphometric-Hydro Characterization of the Coastal Line between El-Qussier and Marsa-Alam, Egypt: Preliminary Flood Risk Signatures. Appl. Sci. 2022, 12, 6264. [Google Scholar] [CrossRef]
- Pareta, K.; Pareta, U. Quantitative Morphometric Analysis of a Watershed of Yamuna Basin, India Using ASTER (DEM) Data and GIS. Int. J. Geomat. Geosci. 2011, 2, 248–269. [Google Scholar]
- Strahler, A. Dynamic Basis of Geomorphology. Geol. Soc. Am. Bull. 1952, 63, 923–938. [Google Scholar] [CrossRef]
- Chauhan, P.; Chauniyal, D.D.; Singh, N.; Tiwari, R.K. Quantitative Geo-Morphometric and Land Cover-Based Micro-Watershed Prioritization in the Tons River Basin of the Lesser Himalaya. Environ. Earth Sci. 2016, 75, 1–17. [Google Scholar] [CrossRef]
- Raja Shekar, P.; Mathew, A. Detection of Land Use/Land Cover Changes in a Watershed: A Case Study of the Murredu Watershed in Telangana State, India. Watershed Ecol. Environ. 2023, 5, 46–55. [Google Scholar] [CrossRef]
- Bogale, A. Morphometric Analysis of a Drainage Basin Using Geographical Information System in Gilgel Abay Watershed, Lake Tana Basin, Upper Blue Nile Basin, Ethiopia. Appl. Water Sci. 2021, 11, 122. [Google Scholar] [CrossRef]
- Khalifa, A.; Çakir, Z.; Owen, L.A.; Kaya, Ş. Evaluation of the Relative Tectonic Activity of the Adıyaman Fault within the Arabian-Anatolian Plate Boundary (Eastern Turkey). Geol. Acta 2019, 17, 1–17. [Google Scholar] [CrossRef]
- Azor, A.; Keller, E.A.; Yeats, R.S. Geomorphic Indicators of Active Fold Growth: South Mountain-Oak Ridge Anticline, Ventura Basin, Southern California. Bull. Geol. Soc. Am. 2002, 114, 745–753. [Google Scholar] [CrossRef]
- El Hamdouni, R.; Irigaray, C.; Fernández, T.; Chacón, J.; Keller, E.A. Assessment of Relative Active Tectonics, Southwest Border of the Sierra Nevada (Southern Spain). Geomorphology 2008, 96, 150–173. [Google Scholar] [CrossRef]
- Xue, L.; Gani, N.D.; Abdelsalam, M.G. Geomorphologic Proxies for Bedrock Rivers: A Case Study from the Rwenzori Mountains, East African Rift System. Geomorphology 2017, 285, 374–398. [Google Scholar] [CrossRef]
- Aher, P.D.; Adinarayana, J.; Gorantiwar, S.D. Quantification of Morphometric Characterization and Prioritization for Management Planning in Semi-Arid Tropics of India: A Remote Sensing and GIS Approach. J. Hydrol. 2014, 511, 850–860. [Google Scholar] [CrossRef]
- Chandrashekar, H.; Lokesh, K.V.; Sameena, M.; roopa, J.; Ranganna, G. GIS –Based Morphometric Analysis of Two Reservoir Catchments of Arkavati River, Ramanagaram District, Karnataka. Aquat. Procedia 2015, 4, 1345–1353. [Google Scholar] [CrossRef]
- Bassey Eze, E.; Efiong, J. Morphometric Parameters of the Calabar River Basin: Implication for Hydrologic Processes. J. Geogr. Geol. 2010, 2, 18–26. [Google Scholar] [CrossRef]
- Nautiyal, M.D. Morphometric Analysis of a Drainage Basin Using Aerial Photographs: A Case Study of Khairkuli Basin, District Dehradun, U.P. J. Indian Soc. Remote Sens. 1994, 22, 251–261. [Google Scholar] [CrossRef]
- Hasan, M.S.U.; Adhikari, K.; Bhattacharyya, S. Morphometric Analysis Using Remote Sensing and GIS. J. Civ. Eng. Environ. Technol. 2017, 4, 17–22. [Google Scholar]


| Sub-Basins | Area (A) in km2 | Perimeter (P) in km | Length (Lu) in km | Elevations in m | Nu (I, II, III, IV, and V) | Lu in km |
|---|---|---|---|---|---|---|
| 1 | 76.83 | 40.13 | 10.89 | 1:191 | 36 (18, 10, 6, 1, and 1) | 52.95 |
| 2 3 4 5 6 7 8 9 10 11 12 13 14 15 | 223.28 54.32 188.40 458.20 190.92 39.30 21.75 146.08 203.51 35.57 278.09 328.08 82.09 177.71 | 92.61 41.30 76.12 118.5 70.32 27.68 25.59 77.53 93.55 25.96 82.21 89.43 41.74 71.77 | 27.18 14.42 21.22 39.31 21.22 8.27 6.21 18.59 22.99 8.61 23.63 28.48 12.43 24.24 | 41:618 134:701 188:1121 181:1893 336:1507 608:1577 844:2208 1083:2142 1082:2517 1017:1901 682:2585 404:2657 347:1978 204:2099 | 73 (37, 15, 13, 8, and 0) 17 (9, 4, 4, 0, and 0) 83 (42, 24, 11, 6, and 0) 161 (81, 36, 21, 23, and 0) 69 (35, 14, 17, 3, and 0) 9 (5, 2, 2, 0, and 0) 7 (4, 2, 1, 0, and 0) 53 (27, 14, 7, 5, and 0) 72 (36, 18, 7, 10, and 1) 15 (8, 4, 3, 0, and 0) 103 (52, 26, 15, 10, and 0) 123 (62, 29, 24, 8, and 0) 31 (16, 8, 7, 0, and 0) 65 (33, 12, 20, 0, and 0) | 137.40 30.76 118.37 273.28 109.62 18.43 12.47 91.35 134.56 21.03 158.92 197.31 44.86 99.41 |
| Sub-Basins | Vf Class | Af Class | Bs Class | Hi Class | Hc Class | Average | RTAM Class |
|---|---|---|---|---|---|---|---|
| 1 | 2 | - | 2 | 2 | 3 | 1.8 | 2 |
| 2 3 4 5 6 7 8 9 10 11 12 13 14 15 | 1 2 2 1 2 1 1 2 1 2 1 1 1 1 | 2 1 1 1 - 2 - 1 2 - 1 - 3 - | 2 1 1 2 2 3 3 3 2 3 3 3 3 1 | 1 2 1 1 1 2 2 1 1 2 1 1 3 1 | 2 2 2 1 1 2 2 2 1 2 2 1 2 2 | 1.6 1.6 1.4 1.2 1.2 1.8 1.4 1.8 1.4 2.2 1.6 1.2 2.2 1 | 2 2 2 1 1 3 2 3 2 3 2 1 3 1 |
| Sub-Basins | Rb | Ff | Dt | Dd | F | Re | Rc | Cc | Lg | Rhl | Rn | Compound Class | Priority |
|---|---|---|---|---|---|---|---|---|---|---|---|---|---|
| S-b1 | 10 | 15 | 7 | 1 | 15 | 14 | 12 | 3 | 1 | 15 | 14 | 9.72 | 15 |
| S-b2 | 7 | 3 | 8 | 5 | 4 | 9 | 3 | 13 | 5 | 14 | 12 | 7.54 | 7 |
| S-b3 | 14 | 1 | 13 | 12 | 2 | 1 | 4 | 12 | 12 | 13 | 13 | 8.81 | 10 |
| S-b4 | 6 | 7 | 4 | 4 | 14 | 6 | 5 | 11 | 3 | 11 | 9 | 7.271 | 6 |
| S-b5 | 1 | 2 | 2 | 8 | 5 | 5 | 6 | 10 | 6 | 12 | 3 | 5.45 | 1 |
| S-b6 | 4 | 8 | 5 | 9 | 7 | 3 | 9 | 7 | 8 | 10 | 7 | 7 | 4 |
| S-b7 | 12 | 14 | 14 | 15 | 1 | 11 | 15 | 2 | 11 | 3 | 11 | 9.90 | 14 |
| S-b8 | 15 | 13 | 15 | 10 | 3 | 15 | 7 | 9 | 9 | 1 | 6 | 9.36 | 13 |
| S-b9 | 11 | 9 | 11 | 3 | 9 | 13 | 2 | 14 | 4 | 9 | 8 | 8.45 | 9 |
| S-b10 | 8 | 5 | 9 | 2 | 6 | 4 | 1 | 15 | 2 | 8 | 4 | 5.81 | 2 |
| S-b11 | 13 | 11 | 12 | 7 | 13 | 8 | 14 | 1 | 7 | 4 | 10 | 9.09 | 11 |
| S-b12 | 3 | 12 | 3 | 11 | 10 | 12 | 11 | 5 | 10 | 5 | 15 | 8.18 | 8 |
| S-b13 | 2 | 6 | 1 | 13 | 11 | 10 | 10 | 6 | 14 | 6 | 1 | 7.270 | 5 |
| S-b14 | 9 | 10 | 10 | 14 | 12 | 7 | 13 | 4 | 15 | 2 | 5 | 9.18 | 12 |
| S-b15 | 5 | 4 | 6 | 6 | 8 | 2 | 8 | 8 | 13 | 7 | 2 | 6.27 | 3 |
| Morphometric Parameters | Priority | Priority Rank |
|---|---|---|
| S-b1 | 15 | Low |
| S-b2 | 7 | Moderate |
| S-b3 | 10 | Moderate |
| S-b4 | 6 | Moderate |
| S-b5 | 1 | High |
| S-b6 | 4 | High |
| S-b7 | 14 | Low |
| S-b8 | 13 | Low |
| S-b9 | 9 | Moderate |
| S-b10 | 2 | High |
| S-b11 | 11 | Low |
| S-b12 | 8 | Moderate |
| S-b13 | 5 | High |
| S-b14 | 12 | Low |
| S-b15 | 3 | High |
Disclaimer/Publisher’s Note: The statements, opinions and data contained in all publications are solely those of the individual author(s) and contributor(s) and not of MDPI and/or the editor(s). MDPI and/or the editor(s) disclaim responsibility for any injury to people or property resulting from any ideas, methods, instructions or products referred to in the content. |
© 2023 by the authors. Licensee MDPI, Basel, Switzerland. This article is an open access article distributed under the terms and conditions of the Creative Commons Attribution (CC BY) license (https://creativecommons.org/licenses/by/4.0/).
Share and Cite
Bashir, B.; Alsalman, A. Geospatial Analysis for Tectonic Assessment and Soil Erosion Prioritization: A Case Study of Wadi Al-Lith, Red Sea Coast, Saudi Arabia. Appl. Sci. 2023, 13, 12523. https://doi.org/10.3390/app132212523
Bashir B, Alsalman A. Geospatial Analysis for Tectonic Assessment and Soil Erosion Prioritization: A Case Study of Wadi Al-Lith, Red Sea Coast, Saudi Arabia. Applied Sciences. 2023; 13(22):12523. https://doi.org/10.3390/app132212523
Chicago/Turabian StyleBashir, Bashar, and Abdullah Alsalman. 2023. "Geospatial Analysis for Tectonic Assessment and Soil Erosion Prioritization: A Case Study of Wadi Al-Lith, Red Sea Coast, Saudi Arabia" Applied Sciences 13, no. 22: 12523. https://doi.org/10.3390/app132212523
APA StyleBashir, B., & Alsalman, A. (2023). Geospatial Analysis for Tectonic Assessment and Soil Erosion Prioritization: A Case Study of Wadi Al-Lith, Red Sea Coast, Saudi Arabia. Applied Sciences, 13(22), 12523. https://doi.org/10.3390/app132212523