Article

Study of the Impact of Aerodynamic Model Fidelity on the Flight Characteristics of Unconventional Aircraft

by
Tomasz Goetzendorf-Grabowski
* and
Agnieszka Kwiek
Institute of Aeronautics and Applied Mechanics, Warsaw University of Technology, Nowowiejska 24, 00-665 Warsaw, Poland
*
Author to whom correspondence should be addressed.
Appl. Sci. 2023, 13(22), 12522; https://doi.org/10.3390/app132212522
Submission received: 4 October 2023 / Revised: 11 November 2023 / Accepted: 14 November 2023 / Published: 20 November 2023
(This article belongs to the Section Aerospace Science and Engineering)

Abstract

:
The article presents a study on the influence of aerodynamic model fidelity on dynamic characteristics. The Simulation and Dynamic Stability Analysis (SDSA) package was used to calculate the dynamic characteristics, using both eigenvalues (linearized model) and a time history approach (nonlinear model). The tests were carried out for a rocket aircraft designed in a tailless configuration with a leading edge extension and rotating side plates. Due to these features, the rocket plane can be classified as an unconventional configuration, which requires special attention. Aerodynamic characteristics of the rocket plane were measured in a subsonic wind tunnel and calculated using Euler model equations-based software (MGAERO) and low-order potential-flow code (PANUKL). The paper presents the results of dynamic analysis in the form of standard modes of motion characteristics. A comparison of dynamic characteristics calculated using a set of aerodynamic data with different fidelity is shown and discussed. Both longitudinal and lateral cases were included. The presented results show that the potential methods, considered old-fashioned and despite many simplifications, are still an attractive tool and can be used to analyze even complex, unconventional configurations.

1. Introduction

Good handling qualities of an aircraft are key to ensuring safe flight. The problem of predicting the dynamic stability of an aircraft can be solved by flight testing a dynamically scaled aircraft model or by testing an aircraft prototype. This technique is most often used to definitively verify aircraft behavior and confirm that airworthiness regulations are met. These types of tests are performed at the end of the design process to confirm previous analyses.
The ability to determine the dynamic characteristics of the aircraft at an early stage of the project is very desirable, especially when we are dealing with an unconventional configuration where the experience and intuition of the designer may not be sufficient [1]. The problem of taking into account the dynamic stability of the aircraft has been the subject of more than one project, e.g., the SimSAC project [2]. There have also been numerous attempts to incorporate multidisciplinary optimization as a tool to shape aircraft configuration [3,4,5,6,7]. The key problem in this type of issue is the quality of the data, and in particular the fidelity of the aerodynamic characteristics. This problem has been raised in a number of works that examined the impact of aerodynamic data fidelity on the results of dynamic stability analyses [8,9] or the quality of simulations [10,11].
The aerodynamic characteristics necessary for dynamic analyses can be determined using engineering methods based on ESDU [12] or Datcom [13] reports, semi-empirical methods [14], experimental methods (wind tunnel) [15] or with the help of CFD (Computational Fluid Dynamics) methods of various classes. Nowadays, computational methods are widely used. However, despite the strong increase in computing power of modern computers, the issue of computational cost (time) is still important. Therefore, it is important to answer whether it is necessary to use higher fidelity methods (e.g., Euler) or whether simpler methods can be used, i.e., potential ones, the computational cost of which is significantly lower. This is even more important because, nowadays, design is strongly supported by a multidisciplinary optimization process [4,16], where aerodynamic calculations of complex configurations are performed many times during subsequent iterations. To ensure good handling qualities of the aircraft, it is necessary to check whether the computation method used is sufficiently reliable. Therefore, the research problem addressed in this article is to investigate the influence of aerodynamic fidelity on the dynamic characteristics of aircraft.
To address this problem, an aircraft with an unconventional configuration was selected, as it was particularly sensitive to the quality of the results. The rocket plane shown below was chosen as an example of an unconventional configuration designed to fly over a wide range of angles of attack and Mach numbers, which means it can be very useful as a case for this type of analysis.

2. Model

A rocket plane was selected as the object of the analyses presented above. The general layout is shown in Figure 1. The rocket plane belongs to the Modular Airplane System [17,18] that is dedicated to suborbital tourist flights. The system was inspired by the Ansari X-Prize competition [19]. The rocket plane has a compact, tailless design with small wing aspect ratio and a leading edge extension (LEX) [20]. The LEX generates vortex lift, which helps with flying in the deep stall conditions that can occur during the return phase when performing suborbital flight [21]. A study into the optimization of LEX shape for supersonic speeds is presented in [22]. The swept wing and thin symmetrical airfoil allow flight with supersonic speed, which occurs during the suborbital flight. In terms of control, the rocket plane can obtain trim condition in pitch channel by deflecting elevons. In addition, this rocket plane is equipped with side plates which can rotate and work as elevators as well. Due to the tailless configuration, LEX, and rotational side plate, the rocket plane can be classified as having an unconventional configuration. The fuselage shape is determined by the passengers’ arrangement in the cabin and the geometry of the rocket engine.
The goal of this paper is to investigate the impact of aerodynamic fidelity on the results of a plane’s dynamic stability. So, it was assumed that the rocket plane is a good choice due to the wide range of Mach numbers and AoAs because it allows the impact of both compressible and viscosity effects to be taken into account. For purposes of this paper, it was assumed that rocket plane is flying with engine on and at constant altitude. Moreover, the trim conditions are obtained only by elevon deflection. Results regarding utilization of side plates as an elevator can be found in [23]. All analyses presented in this paper were carried out for the rocket plane, for which the main geometry data, as well as mass and inertia data, are presented in Figure 2.

3. Aerodynamics

The aerodynamic characteristics were obtained using numerical and experimental methods. Different flow models (Euler, potential) were taken under analysis to check the impact of computational model fidelity on the dynamic analysis results. The reference base was experimental research, but due to the limited range of flow speeds in the wind tunnel, results for higher Mach numbers could not be obtained.

3.1. Wind Tunnel Investigation

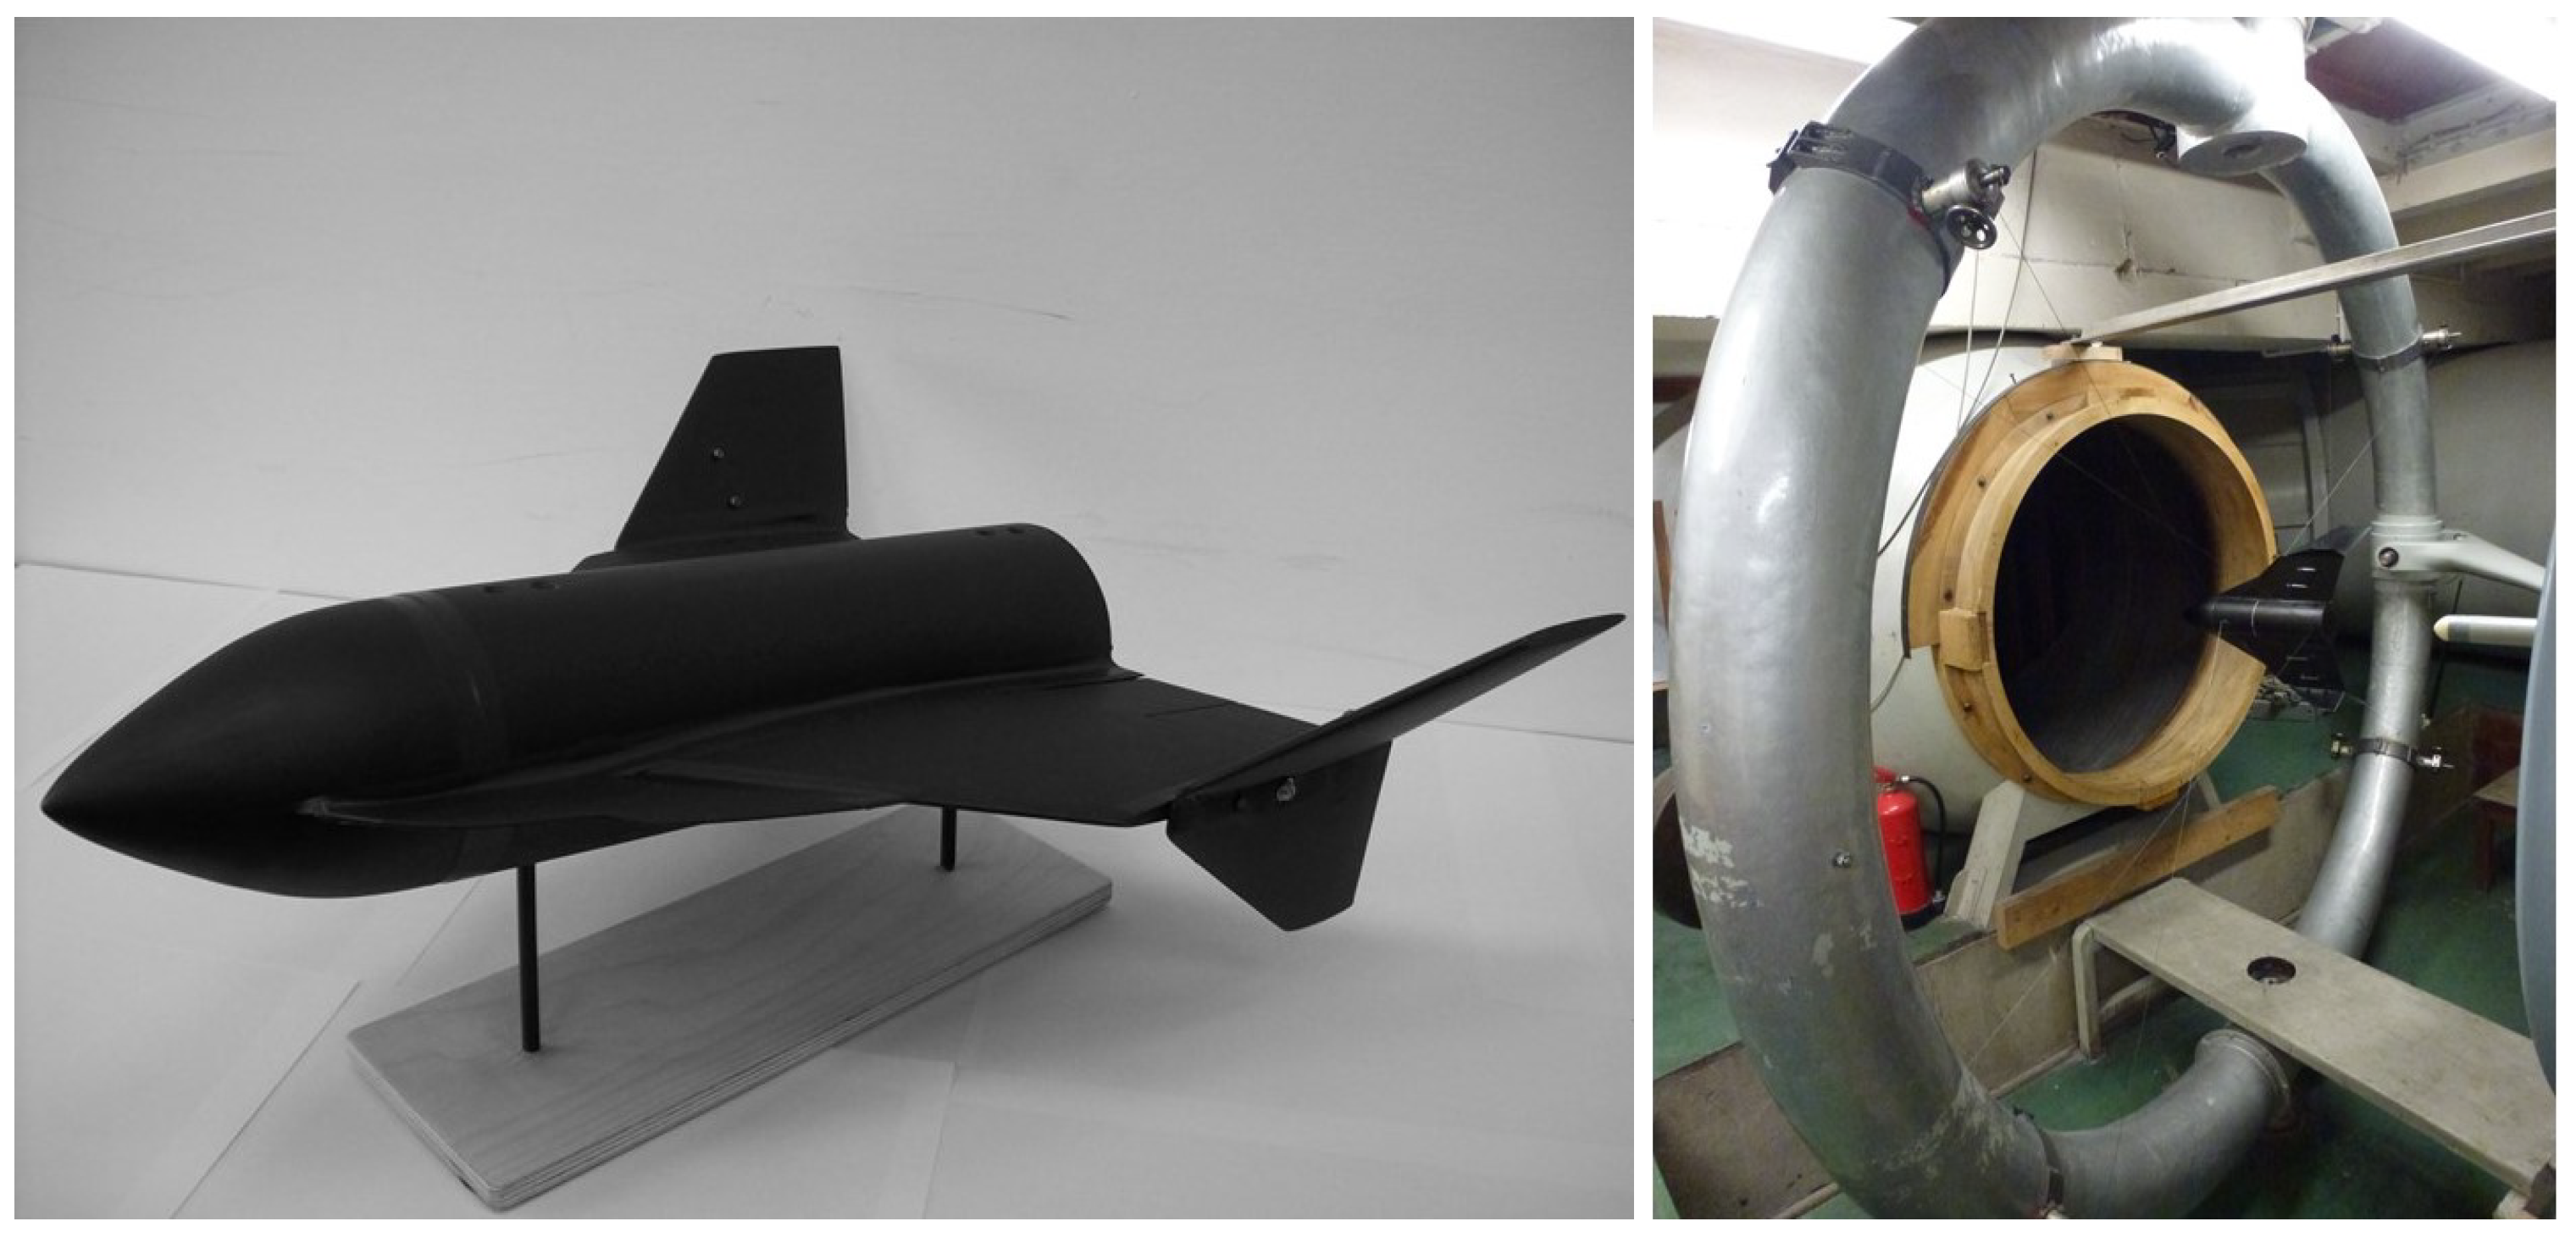
A scaled model of the rocket plane was built for the purpose of wind tunnel tests, see Figure 3, left. A subsonic open-section, closed-circuit wind tunnel was used. The experimental rig consisted of Witoszynski’s balance [24] and data acquisition system. The model installed to the balance is presented in Figure 3, right. Measurements were taken for speed equal to 40 m/s and AoAs from −5 to 40 degrees. In case of directional characteristics, AoAs equal to 0 and 27.5 degrees were used. The sideslip angle was changed from 0 to 40 degrees. Tests for higher Mach numbers were not carried out because of the wind tunnel speed limit. All moments and forces for longitudinal and directional characteristics were taken. Tests were carried out with the use of models that allowed for exchangeable components of the rocket plane. This paper considers only one configuration, which was denoted as 1211. Aerodynamic results for other configurations are presented in [25,26].
Damping derivatives were not measured due to the lack of excitation system and due to the design of the experimental rig.

3.2. Numerical Computation

The development of CFD methods and a large increase in computer power have resulted in the use of Navier–Stokes models more and more often [27,28], and potential methods are considered too simplified or even old-fashioned. The Euler model is sometimes considered a compromise between the computational cost and the fidelity of the obtained results. However, despite many simplifications, potential methods are still an attractive tool [29,30] and are used in aerodynamic analyses of even complex configurations [31]. Their low cost and relative ease of use compensate for their disadvantages and lower fidelity.

3.2.1. Physical and Mathematical Models

The full Navier–Stokes model is defined for fluid that conducts heat in unsteady and compressible flow. The Euler model corresponds to the Navier–Stokes equations with zero viscosity and zero thermal conductivity. Neglecting mass forces, it can be presented in the following form:
-
continuity equation
p t + div ( ρ V ) = 0
-
Euler equation:
V t + ( V grad ) V = 1 ρ grad p
-
state equation:
p = p ( ρ ρ ) κ
where:
V—flow velocity;
ρ —air density;
p–air pressure;
κ —adiabatic exponent.
Summarizing the Euler model is represented by the set of quasilinear partial differential equations that describe adiabatic and inviscid flow. To obtain potential model the irrotational flow is assumed ( rot V = 0 ) and the scalar function, called velocity potential ( Φ ), can be defined that satisfies the following condition:
grad Φ ( x , y , z , t ) = V
Additionally, assuming small disturbances ( Φ = Φ + φ , mod φ U ) and steady incompressible flow, the potential model in its simplest form can be obtained.
The compressibility effect can be taken into account using the Prandtl–Glauert (PG) or Karman–Tsien (KT) corrections [32]. Another approach is the PG transformation, which uses a coefficient ( β = 1 M 2 ) to scale the geometry, which, however, causes a loss of simplicity of the potential model and, consequently, significantly increases the computation time. The use of the corrections mentioned above or PG transformation is limited by the condition that there is no transonic flow, approximately stated by the requirement that the local Mach number does not exceed unity.

3.2.2. CFD Software

The aerodynamic characteristics were determined using software using the models defined above, i.e., the Euler model and the potential model. The simplifications of each model limit their fidelity in the calculation of aerodynamic drag (lack of viscosity) and in the analysis for higher values of angles of attack (potential model). In the first stage of the research, experimental results were compared with the characteristics obtained from calculations using both methods.
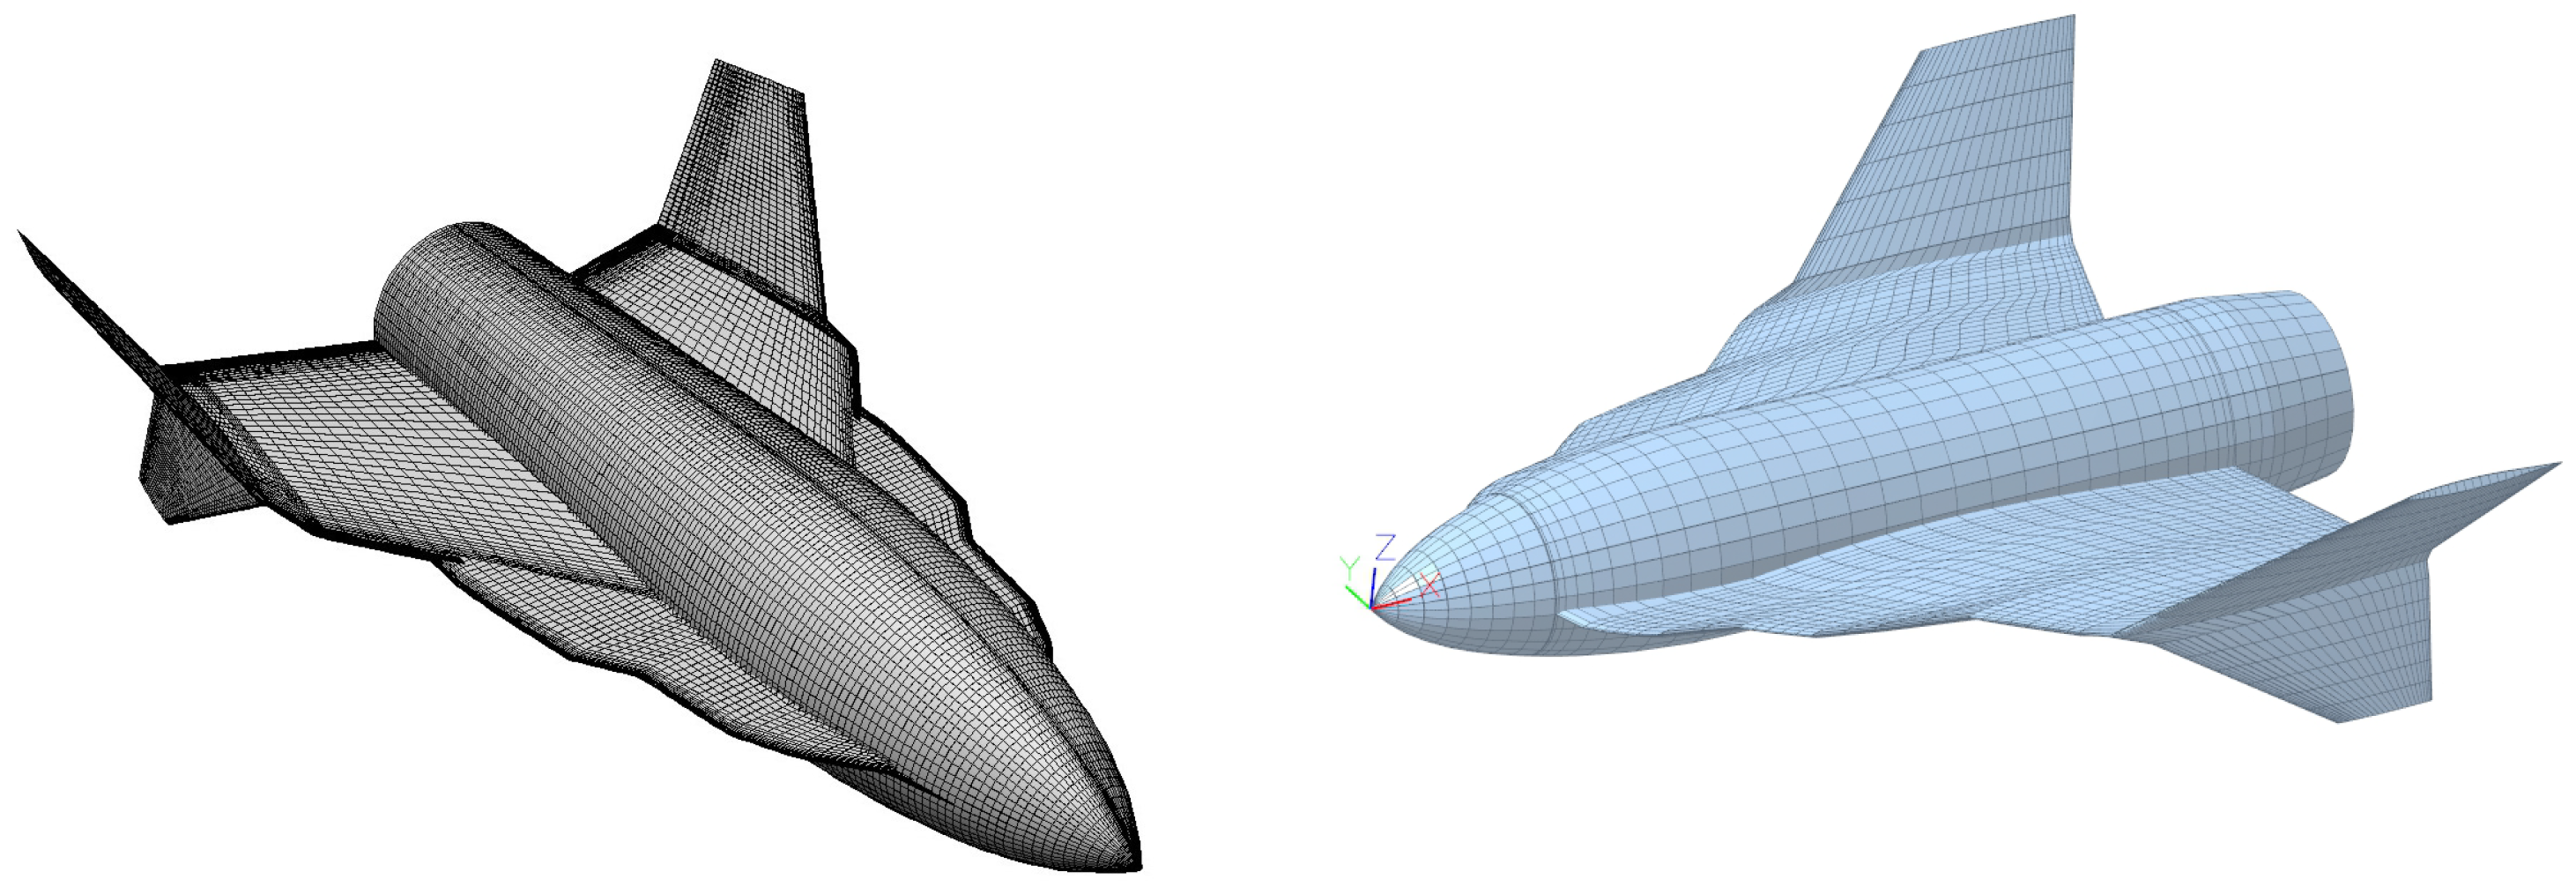
The commercial MGAERO (ver. 3.4) [33] program was used for aerodynamic analyses using the Euler model. For calculations using the potential (panel) method, PANUKL (ver. 2020, rev. 1067) [34] (in-house) software was used, tested many times in various projects. The PANUKL software implements all the compressibility correction methods described above. Finally, after testing all methods, KT correction was applied. The advantages of use of MGAERO are associated with preparation of a computational mesh. The computational mesh consist of grid on body surfaces which describes geometry of the object, in our case the rocket plane. The surface mesh on the body is described in the text file in a discrete form—as a list of sections and points. This allows for easy change of model geometry, especially because the components intersection does not have to be defined by the user—the software can find it automatically when components geometry is overlapping. The CAD model is not required to build or modify the mesh. The second kind of mesh which is needed to perform CFD computation is a volume mesh around the object, which in case of the MGAERO, must be created as set of blocks using multigrid strategy [35]. Again, blocks are defined in a text file by origin point, lengths, and division number, which also allows creating or modifying blocks quite easily. This methodology helps with fast model preparation. On the other hand, due to Euler flow equations, both compressible and vortex effects can be included. The time of computation is lower than, for example, ANSYS Fluent. Due to there being two types of meshes and divisions that must properly model both compressible and vortex effects, the MGAERO mesh will be significantly finer than the PANUKL mesh. The rocket plane model includes 7 multigrid levels, where the first level contains an element of 830 mm in size while the size of the grid on the last level is about 17.6 mm. Figure 4 shows the meshes created for analysis by both software, in case of the MGAERO, only the surface mesh is shown. During the preparation of the computational model in MGAERO, various mesh densities, especially block density and block arrangement, have been tested. Finally, the results were verified in the wind tunnel and a very good accordance was obtained; therefore, it was concluded that the mesh density is good enough. The computation time for the MGAERO depends on the case (angle of attack, Mach number, etc.). For example, in case of a low value (close to zero) of the angle of attack (AoA), the time needed to complete calculations was about 10 min, while in case of a moderate AoA (about 10 degrees), it took about 52 min (for M = 0.1) and up to 57 min for M = 0.7. For high angles of attack, it took even 70 min. PANUKL’s computations were significantly faster: a single angle of attack case with a compressibility correction (Karman–Tsien) took about 54 s. All results were obtained on a mid-range workstation.
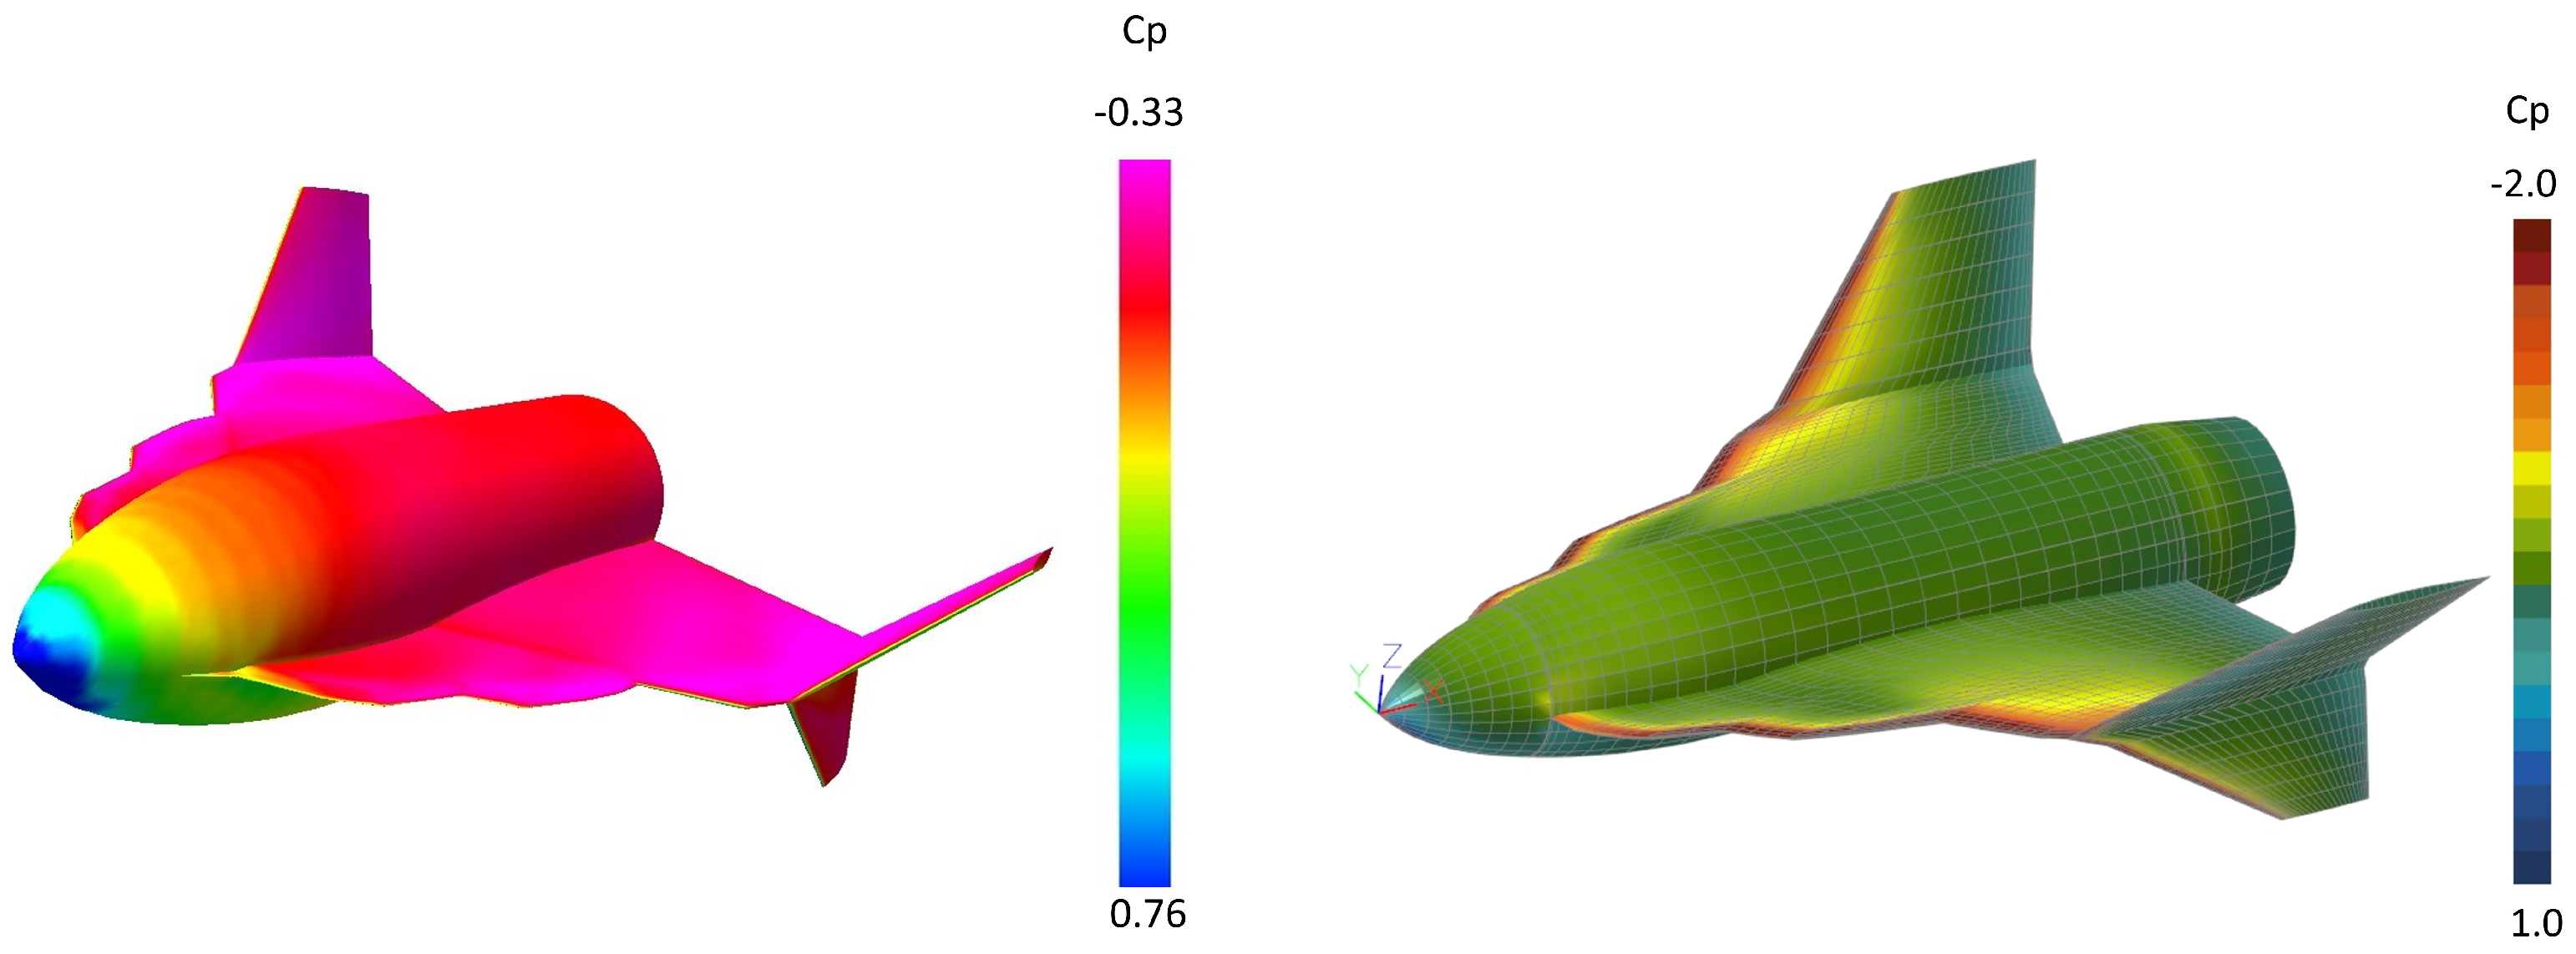
Examples of pressure distributions obtained by both methods are shown in Figure 5.

4. Dynamics

This chapter presents the mathematical model used to determine the dynamic characteristics of a rocket plane. Both linear and nonlinear approaches are presented and applied.

4.1. Physical Model

The physical model of an aircraft for motion analysis is based on the following assumptions:
  • The aircraft is a rigid body with six degrees of freedom:
  • Three translations along the axis—x,y,z;
  • Three rotations—pitch, roll, yaw;
  • Control surfaces are movable but cannot perform free vibrations;
  • Aerodynamics are quasi-steady [1,36,37,38], which means that aerodynamic characteristics depend on the current state, not on time. Therefore, a steady model of the flow assumed in both codes presented in the paper is applicable,
  • The atmosphere is conformable with standard atmosphere
  • The atmosphere is not disturbed and windless—the effect of wind can be modeled by modifying the airspeed vector.

4.2. Mathematical Model

The dynamic analyses were carried out by use of the SDSA [39] package developed and validated within the SimSAC project [2] and some other projects [6,40]. The equations of motion are derived from fundamental laws of mechanics—the balance of momentum theorem (Equation (5)) and the balance of the moment of momentum theorem (Equation (6)).
Π ¯ t + Ω ¯ × m ( V 0 ¯ + Ω ¯ × r c ¯ ) = F ¯
H ¯ 0 t + Ω ¯ × ( I 0 Ω ¯ ) + r c ¯ × m ( Ω ¯ × V 0 ¯ ) = M 0 ¯
where:
m—aircraft mass;
r c ¯ —center of gravity in the body axis system (vector);
I 0 —inertia tensor.
The necessary coordinate systems and the load components are presented in Figure 6. The assumed body axis system is typical for the flight dynamics discipline [36,37,38]. The equation of motion derived from the equations above can be written in the form (7).
d s d t = A 1 F ¯ ( s , s ˙ , t )
where:
s—state vector:
s = { u , v , w , p , q , r } T
A—inertia matrix:
A = m X u ˙ X v ˙ X w ˙ 0 S z S y Y u ˙ m Y v ˙ Y w ˙ S z 0 S x Z u ˙ Z v ˙ m Z w ˙ S y S x 0 L u ˙ S z L v ˙ S y L w ˙ J x J x y J x z S z M u ˙ M v ˙ S x M w ˙ J x y J y J y z S y N u ˙ S x N v ˙ N w ˙ J x z J y z J z

4.3. Linearization

The set of six dynamic Equations (7) must be completed with six kinematical equations that link global position coordinates with velocity components and attitude angles with angular rates. These twelve nonlinear equations constitute a mathematical model of the aircraft’s motion (flight), which was used to simulate selected maneuvers. In order to determine the dynamic stability characteristics, equation system (7) was extended with two kinematic equations that link the pitch angle and roll angle to angular rates. The set of eight equations was next linearized to the form [41]:
d s 8 d t = A 8 1 F 8 ¯ ( s 8 , t ) d s 8 d t = J 8 s 8
where:
s 8 = { u , v , w , p , q , r , φ , θ } T
J 8 = { ( A 8 1 F 8 ¯ ) i , j s j }
Then, the eigenvalue problem can be formulated:
[ J 8 I λ ] s 8 = 0
Solving the eigenvalue problem gives the frequency and damping coefficients. Solving the problem of eigenvectors allows the identification of the form of motion [41].
λ = ξ + i η
where:
ξ —damping coefficient;
η —frequency coefficient.
While the frequency and damping coefficients are given by directly solving eigenvalue problem (13), more useful measures—damping ratio and undampened natural frequency—can be obtained from the following formulas:
ω n = ξ 2 + η 2
ζ = ξ ω n
The period and time of damping halftime (or double time) can be computed as follows:
T = 2 π η
T 1 / 2 = l n ( 2 ) / ξ for ξ < 0 , T 2 = l n ( 2 ) / ξ for ξ > 0
The quantities defined above constitute the basic measures of handling qualities presented later in the article.

5. Results

The results presented in this chapter of the article are grouped into three parts. The first concerns aerodynamic characteristics, including stability derivatives, and the comparison of the calculation results with experimental data. The second one concerns the so-called handling qualities determined by taking into account the assumptions given in the previous chapter. And finally, the third group concerns the simulation of selected aircraft maneuvers.

5.1. Aerodynamics

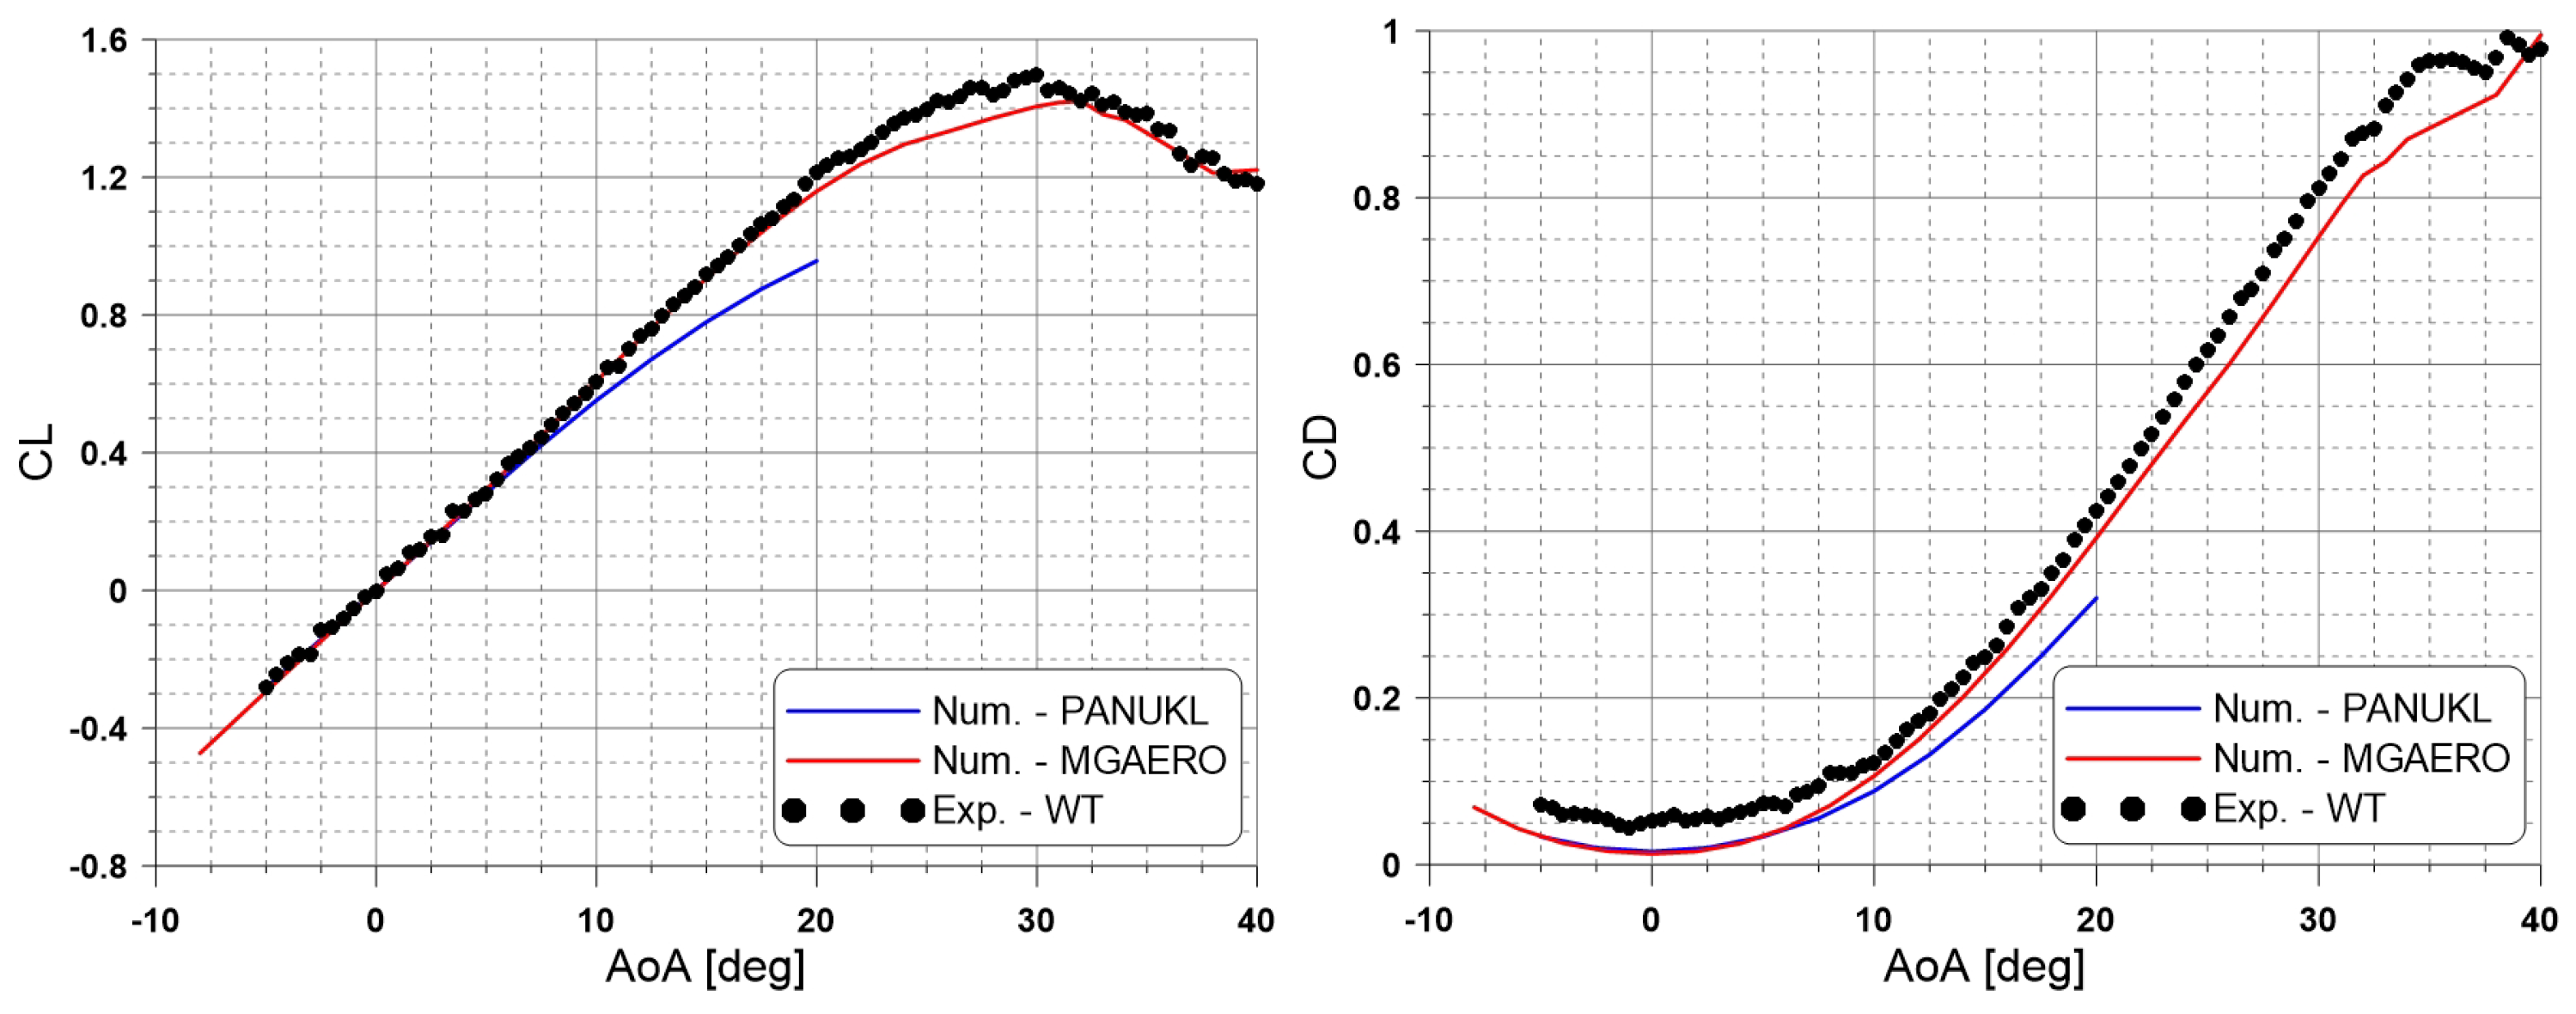
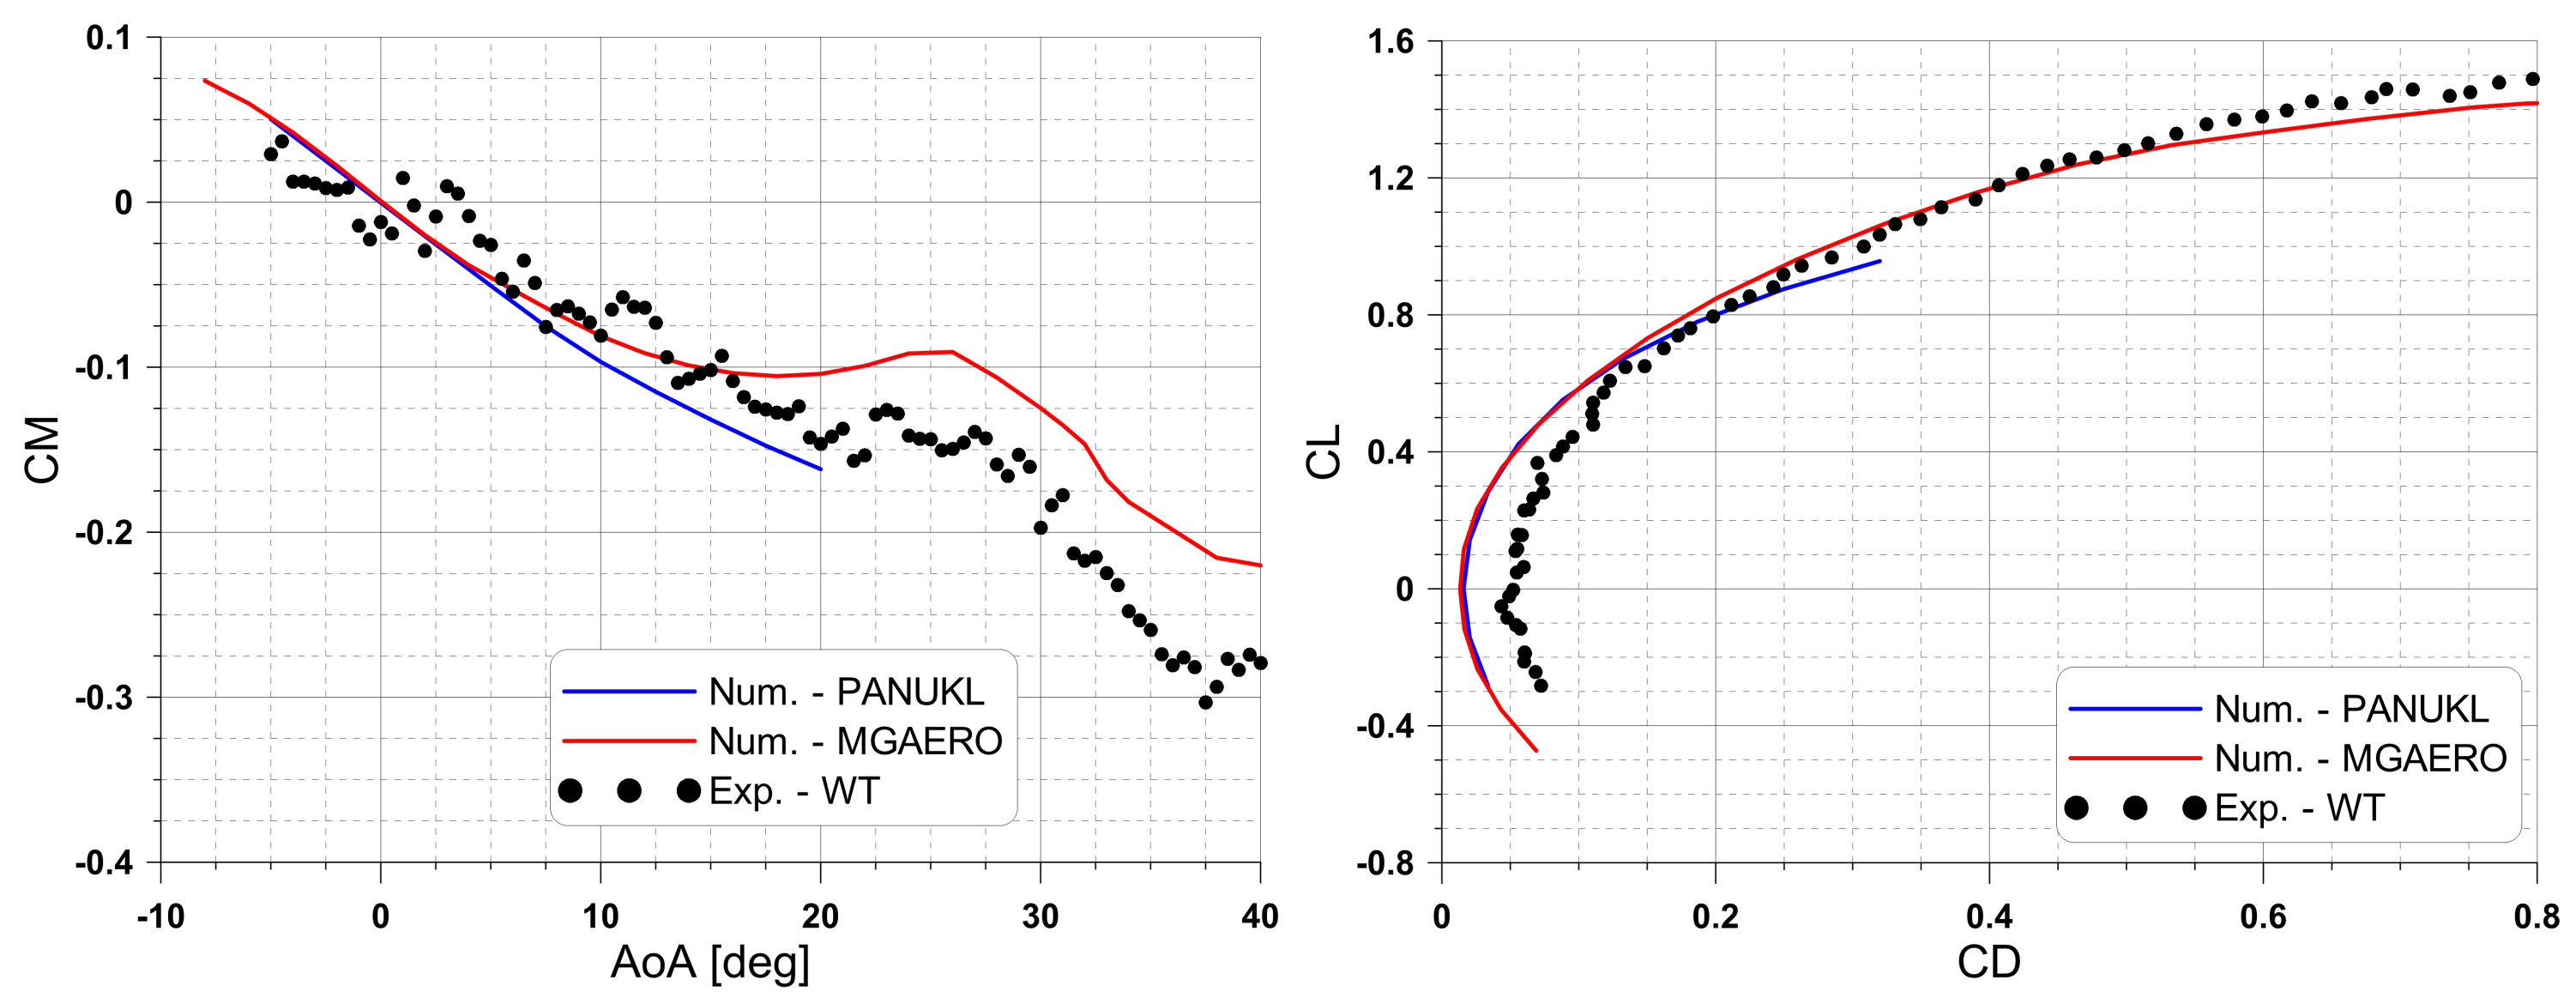
Generally, a good accordance between the numerical and experimental results for low AoA values was revealed. In Figure 7, the numerical results of the lift coefficient match the wind tunnel data exactly up to about 7 degrees. Above this value of AoA, a discrepancy with the PANUKL results occurs, which is associated with the presence of vortex lift which is not modeled by the potential flow. Also, a critical angle of attack cannot be determined by potential flow. In the nonlinear part of the lift coefficient, a discrepancy between the MGAERO and wind tunnel data occurs. This is caused by flow viscosity impact on vortex development as well as the surface roughness of the model engaged in wind tunnel tests. In terms of drag coefficient, both MGAERO and PANUKL do not model the viscosity effect, which results in a lack of friction drag. This component of the drag was calculated using a semi-empirical formula based on wetted area and equivalent friction coefficient [42]. However, due to the rocket plane’s unconventional configuration, surface roughness, and relatively low Reynolds number, the friction coefficient is underestimated. The minimum drag coefficient for both numerical sets is almost the same because the same empirical formula is used to estimate it. The discrepancy between the PANUKL and MGAERO drag coefficient occurs for the same point where the discrepancy for the lift occurred. This difference in drag is associated with the induced drag, which is greater in the case of MGAERO because the lift is greater due to the presence of vortex lift. Based on the CL(CD) (Figure 8, right), it can be concluded that the impact of the vortex on aerodynamic characteristics is stronger on the lift than the impact on the induced drag. The drag coefficient for 40 degrees is around 1.0, which is typical for designs with LEX, where the lift and drag coefficient for high AoAs are of the same order. In Figure 8, the pitching moment coefficient is shown, and the pitch up effect can be observed for both the wind tunnel data and the MGAERO results. This effect is associated with a crossflow which does not occur for the PANUKL due to the potential flow model. The difference between the wind tunnel data and the MGAERO results caused by the precision of setting the reference point using the Witoszyński’s balance.

5.2. Stability Derivatives

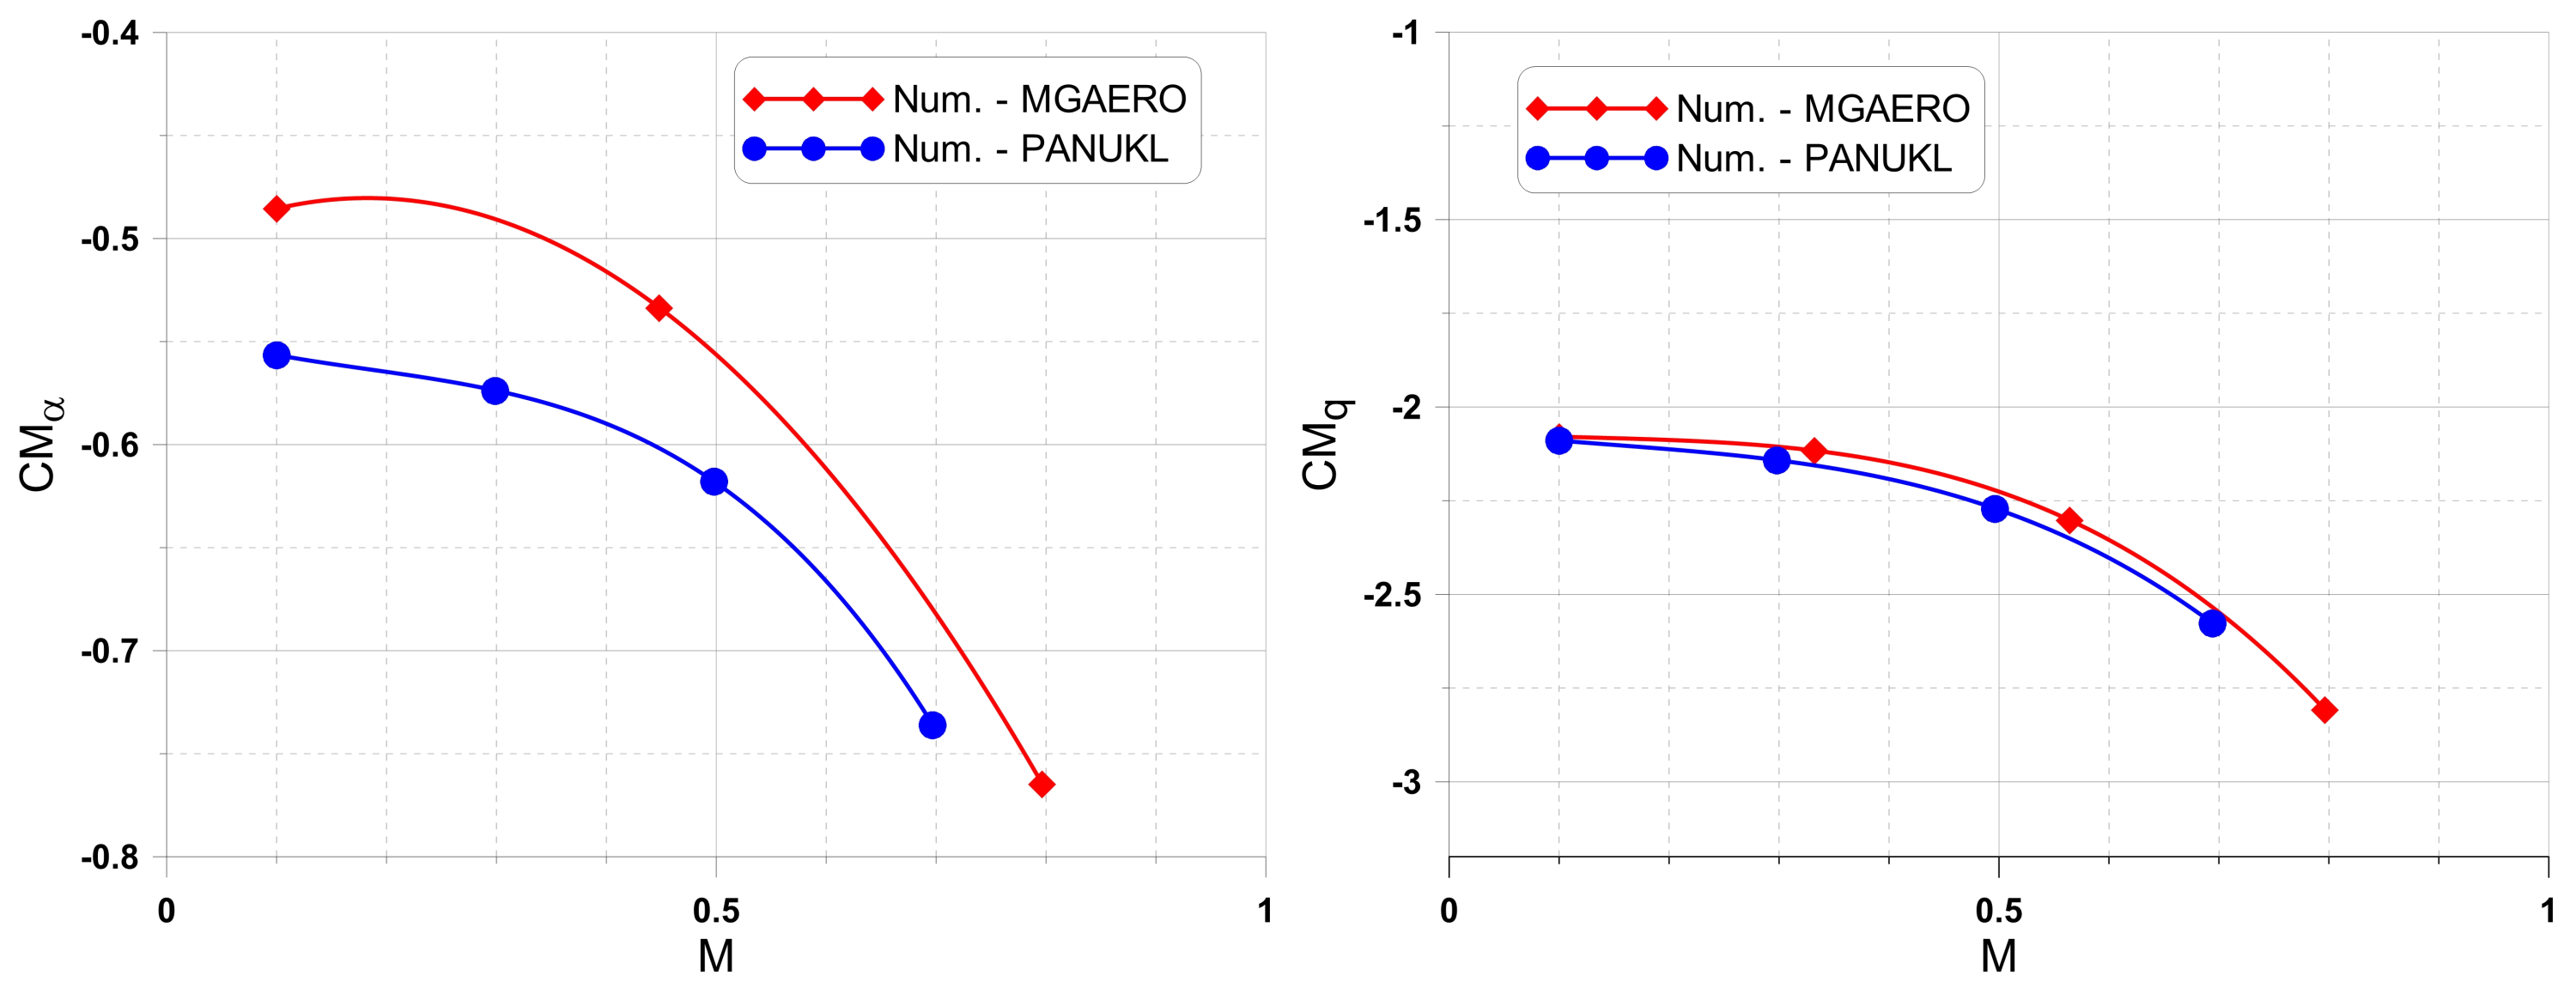
Aerodynamic derivatives, the most crucial from a stability point of view, are presented in this section. First, derivatives that play the most important role in the case of the longitudinal modes of motion are presented. The derivatives of the pitching moment with respect to the angle of attack and pitch rate versus the Mach number are shown in Figure 9. The graph on the left presents the derivative, which is the measure of the so-called static margin, and influences both longitudinal modes, i.e., phugoid and short-period oscillation. The trend of both sets of data is consistent. The MAGERO results show a lower static stability, which is caused by the presence of cross flow. The right graph presents damping derivative C m q . The results show that a very good accordance between methods was achieved and that the impact of compressible effect has negligible effect.
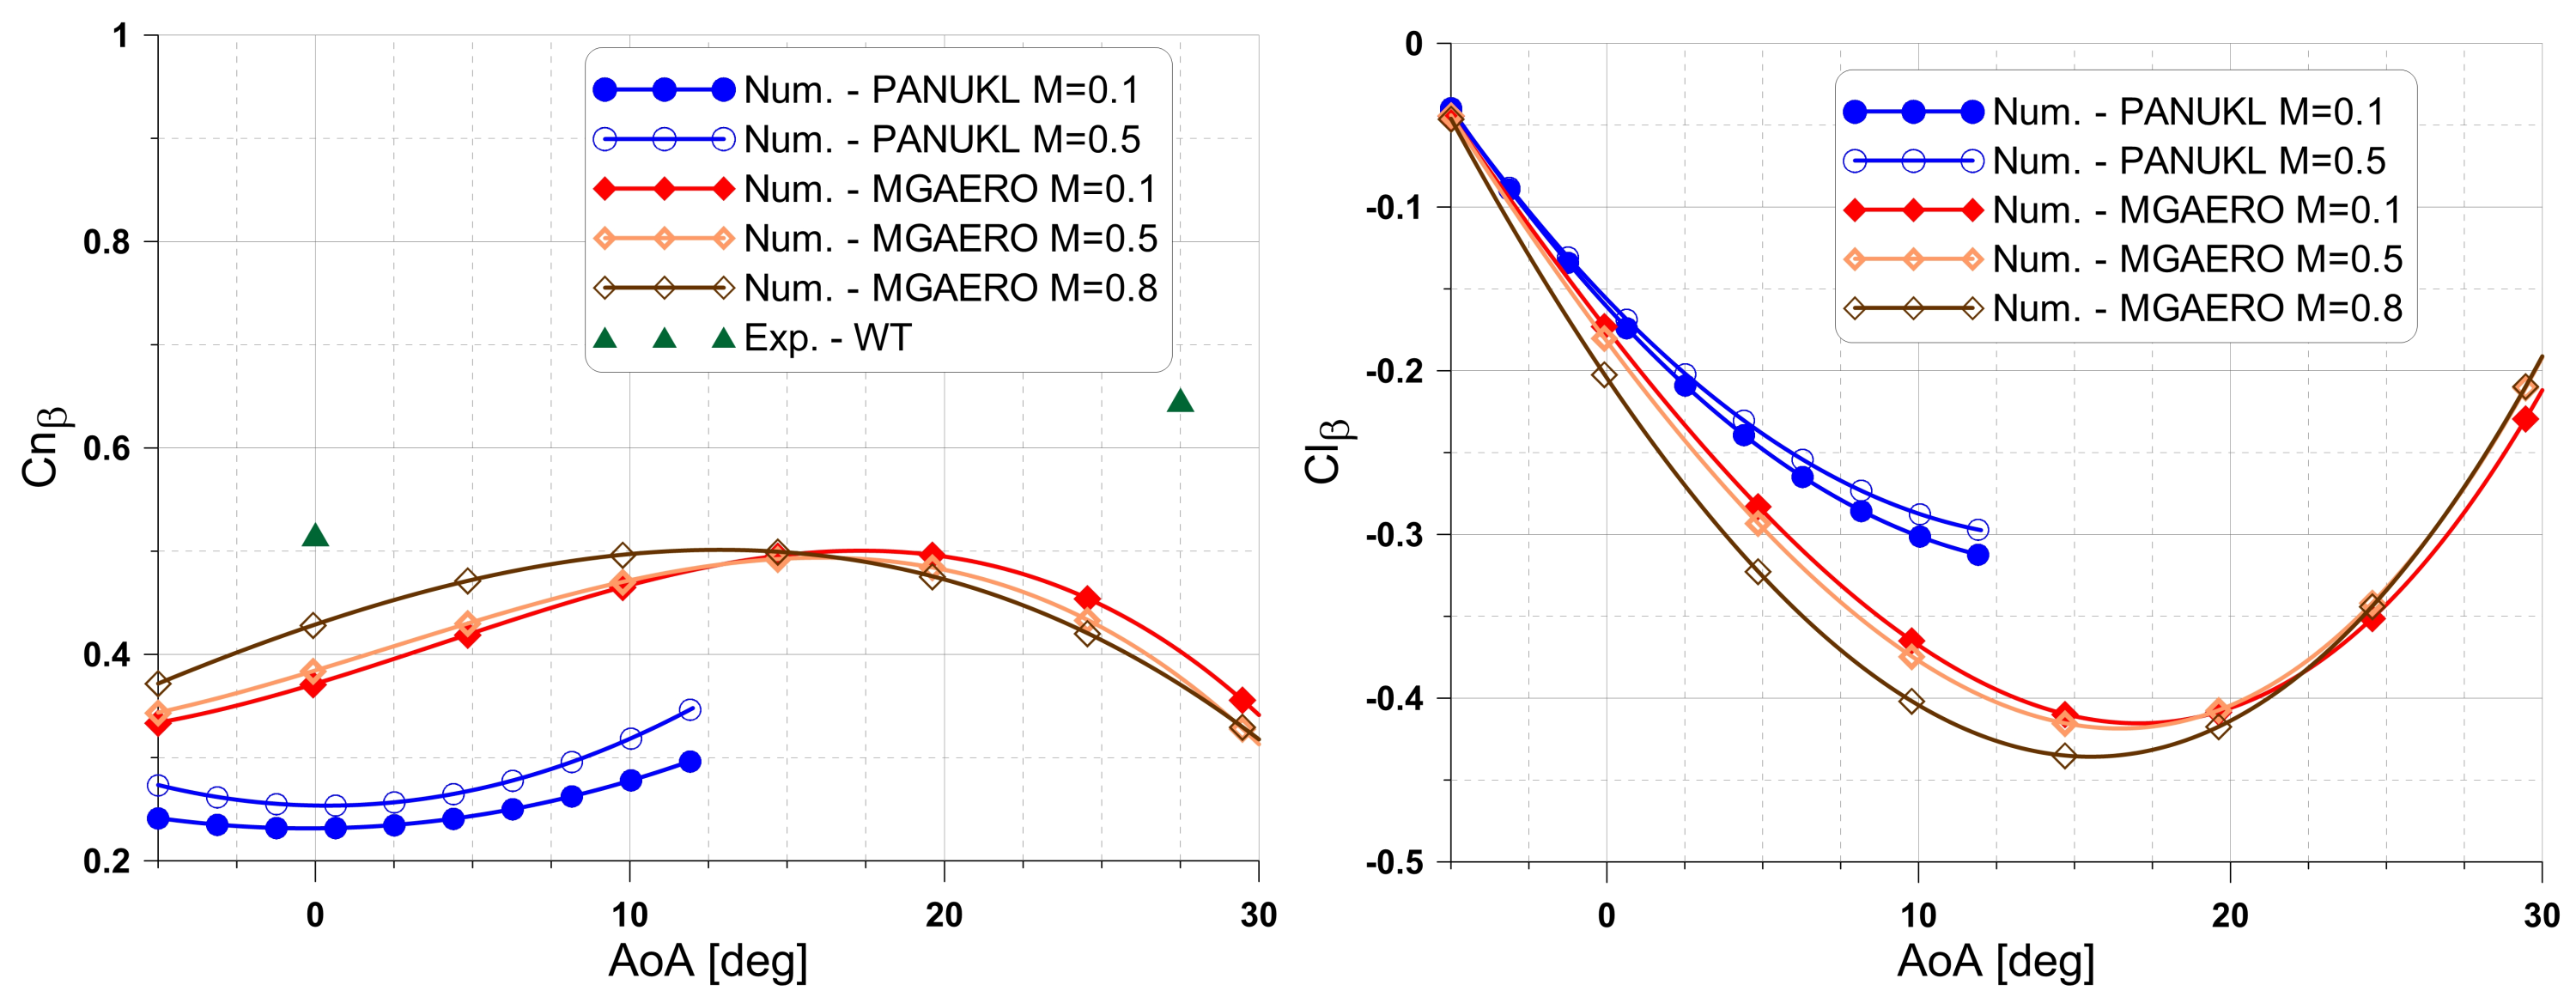
Figure 10 presents the most important derivatives for lateral modes of motion. The left graph shows the derivative of the yawing moment with respect to the sideslip angle. A notable difference between data sets is visible on the plot. In the case of the asymmetrical flow condition, a vortex around the side plates occurs. In the case of the potential flow, the derivative is the smallest because the increment in force due to vortex is not considered. In the MGAERO and wind tunnel results, the derivatives are significantly higher, but for higher AoAs, a decrement in derivative can be observed due to the change in vortex position (Figure 11). The last derivative that is shown (left graph) is the rolling moment derivative with respect to the side slip angle. A similar trend can be observed for the directional derivative, which is also associated with the change in vortex position.

5.3. Stability Characteristics

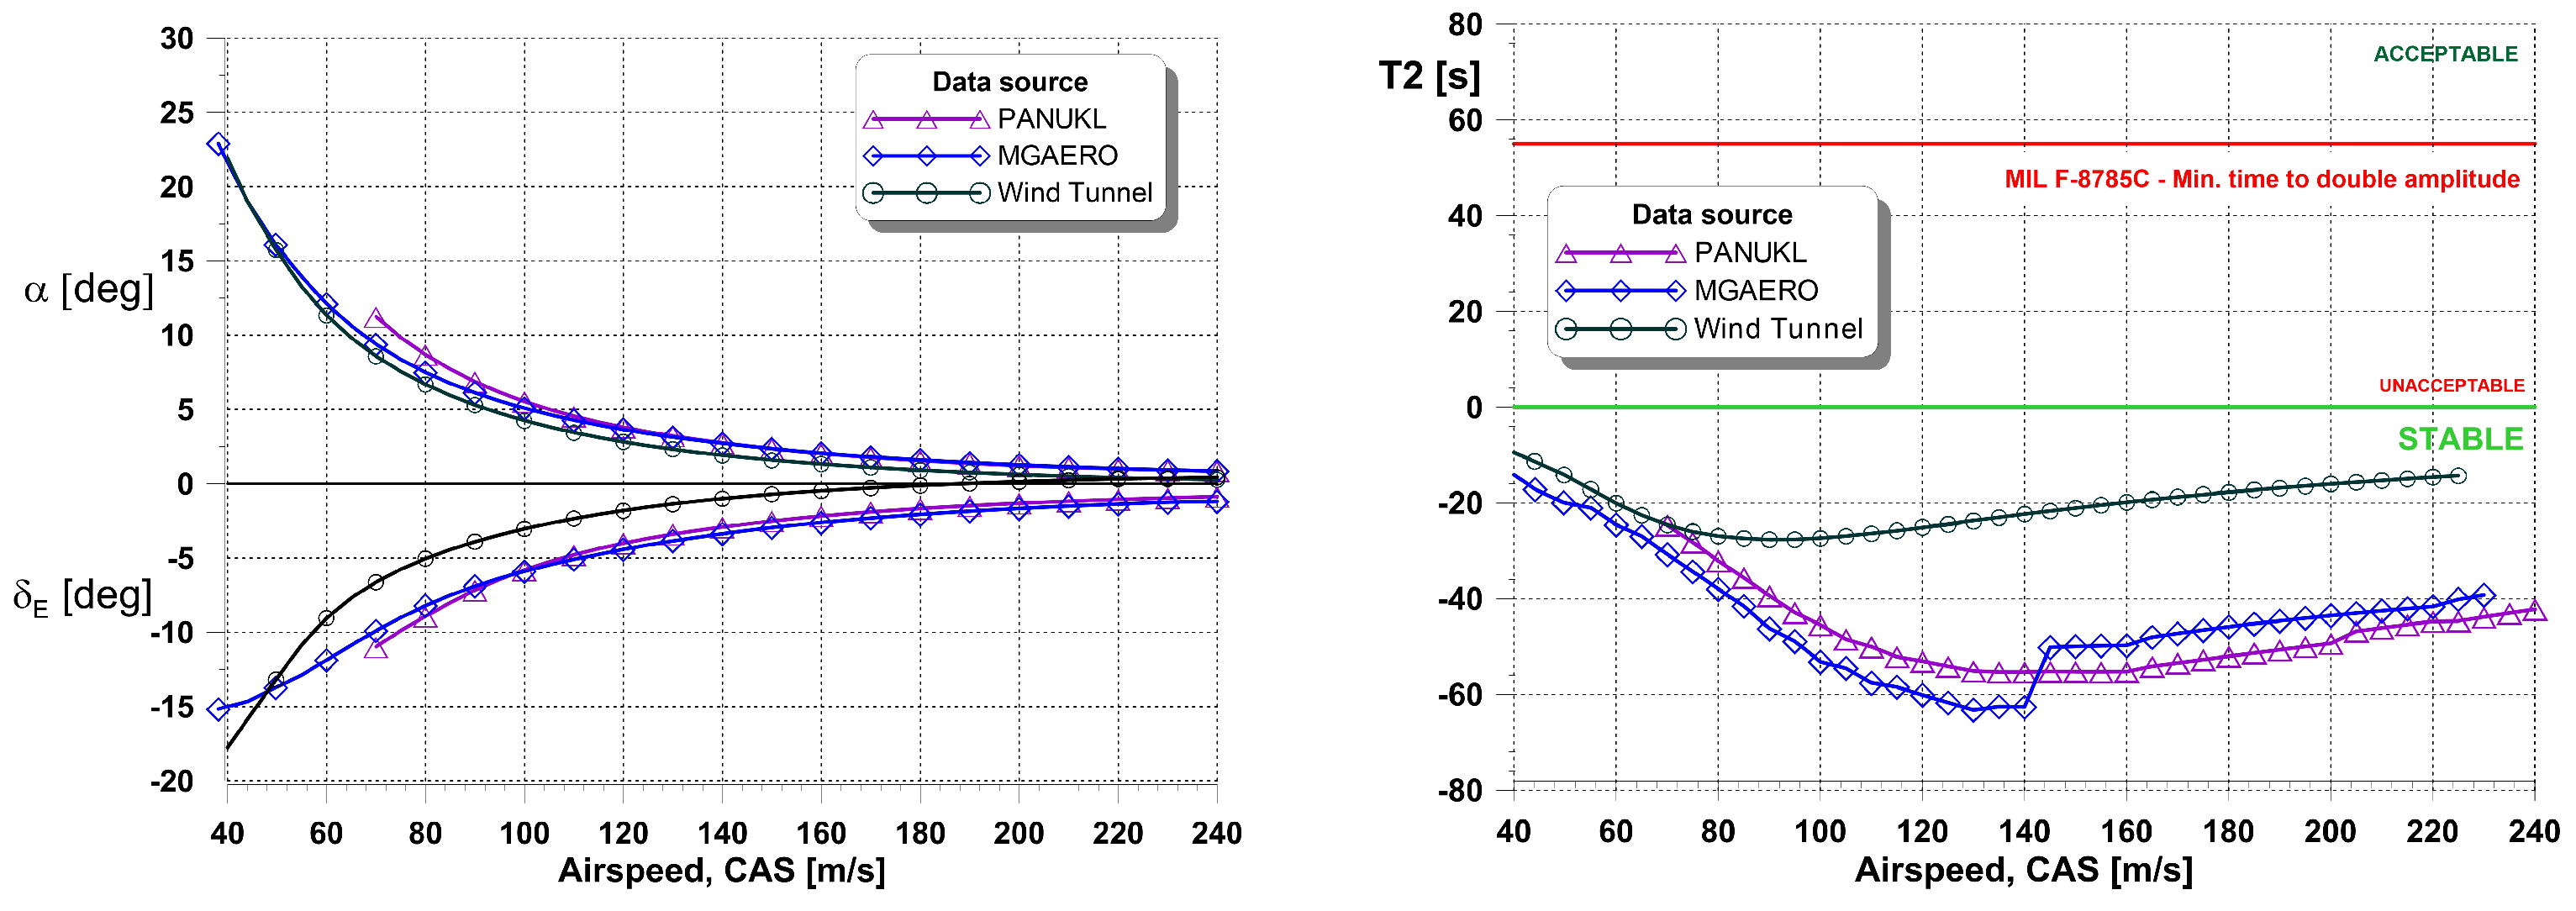
In the analysis of dynamic characteristics, the first stage is to check and evaluate the handling qualities. Because typically the modes of motion are determined as a response to small disturbances around the equilibrium state, their calculation is preceded by an equilibrium analysis, the results of which are presented in Figure 12, left. The graph shows the angle of attack and elevator deflection calculated from Equation (7) by equating the right side of the equation to zero. In the case of the angle of attack, the differences between the results for different source data are negligible. Some differences occur in the elevator deflection angle. However, these are small quantitative differences.
Figure 12 shows the time to double of the phugoid against the MIL [43] criteria. For both calculated aerodynamic characteristics, the results are very similar, while the results for the wind tunnel data indicate stronger damping, which is the result of a higher drag coefficient for a low lift coefficient, which relates to a higher flight speed.
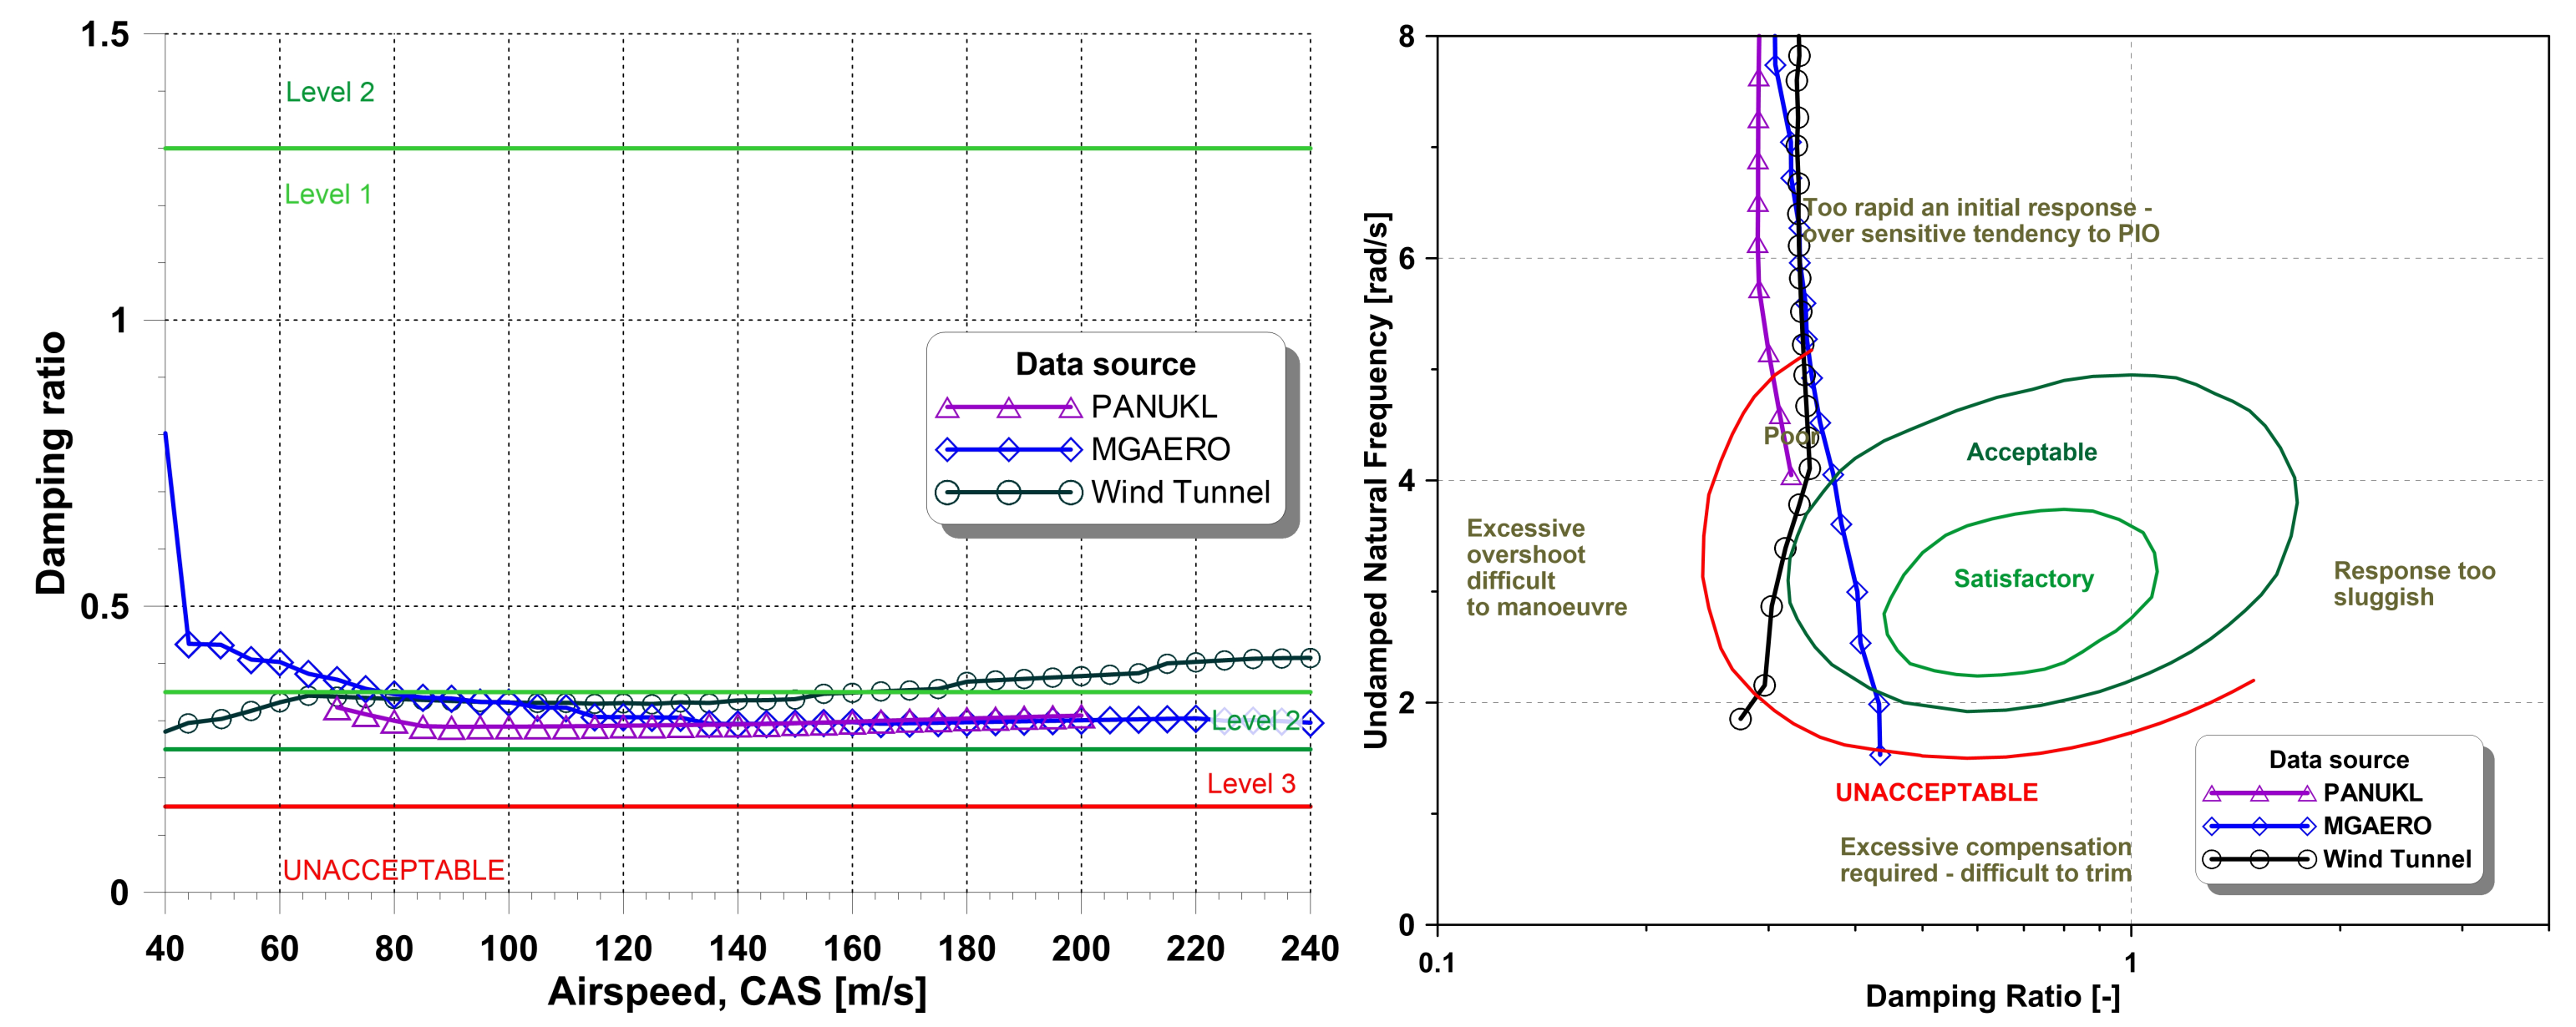
The second longitudinal mode of motion taken under analysis is short-period oscillation, which is crucial in handling qualities evaluation. Figure 13 presents the short-period characteristics against the background of MIL [43] and ESDU [12] criteria. The graph on the left shows the damping factor as a function of the calibrated airspeed. Slight differences occur for low airspeeds, which is the result of differences in the derivatives of the pitching moment at higher values of the angle of attack. For all three data sets, the characteristics are within the second acceptance level. The characteristics shown in the ESDU figure of merit (Figure 13, right) show equally small differences.
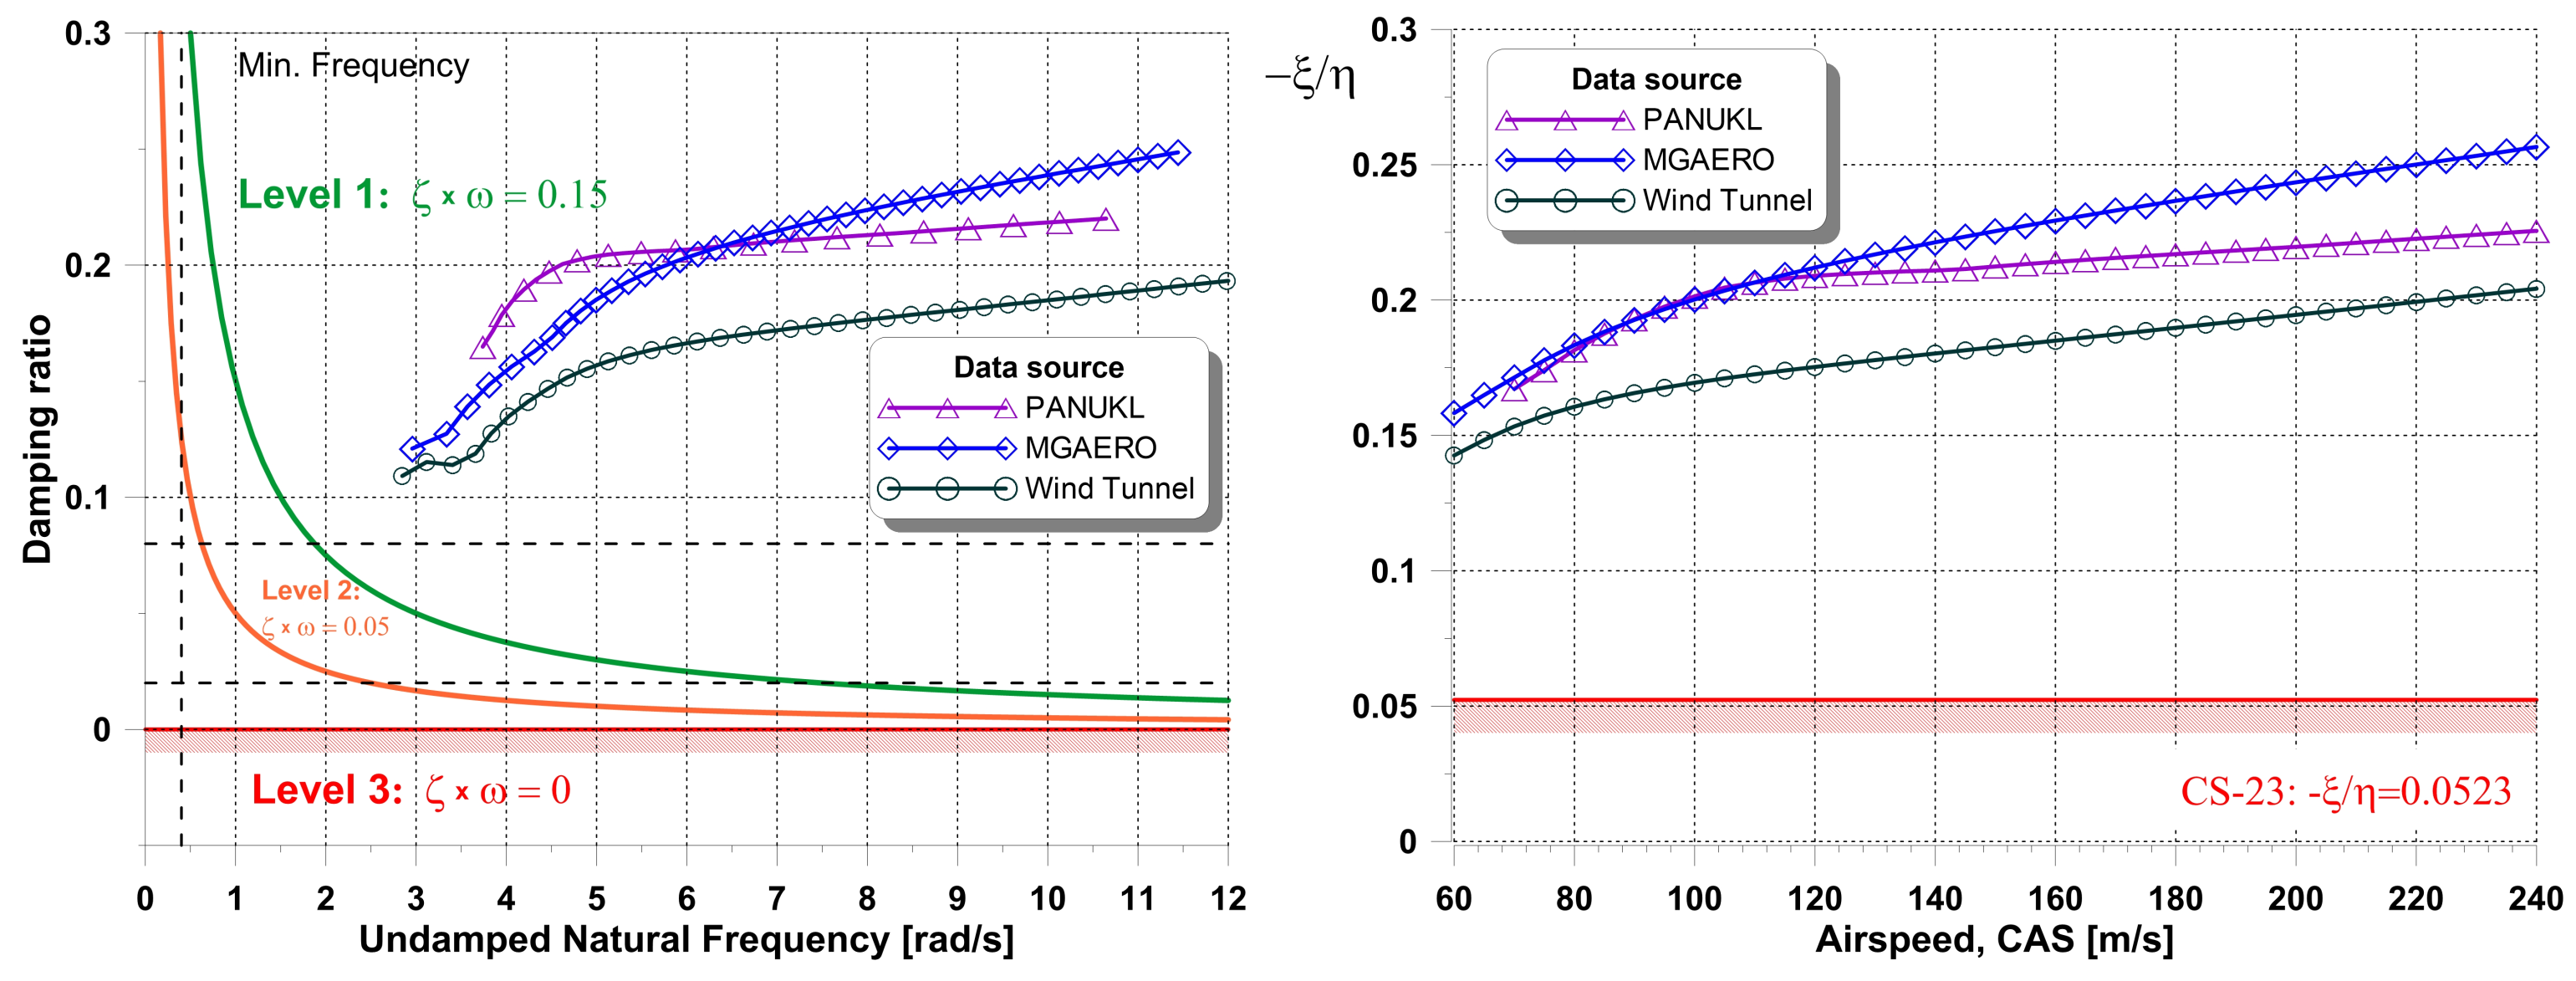
The most crucial mode of motion in case of lateral modes is the Dutch roll. Figure 14 presents its characteristic against the background of MIL [43] and EASA CS-23 [44] criteria. The results show good accordance with different source data despite some differences in the lateral derivative C l β .
Table 1 presented below shows the numerical values of oscillation parameters of periodical modes of motion. The results indicate very good compliance for all data sets, which in turn allows us to conclude that even the low-fidelity methods, i.e., potential methods, are good enough to generate data for dynamic analyses.

5.4. Maneuvers

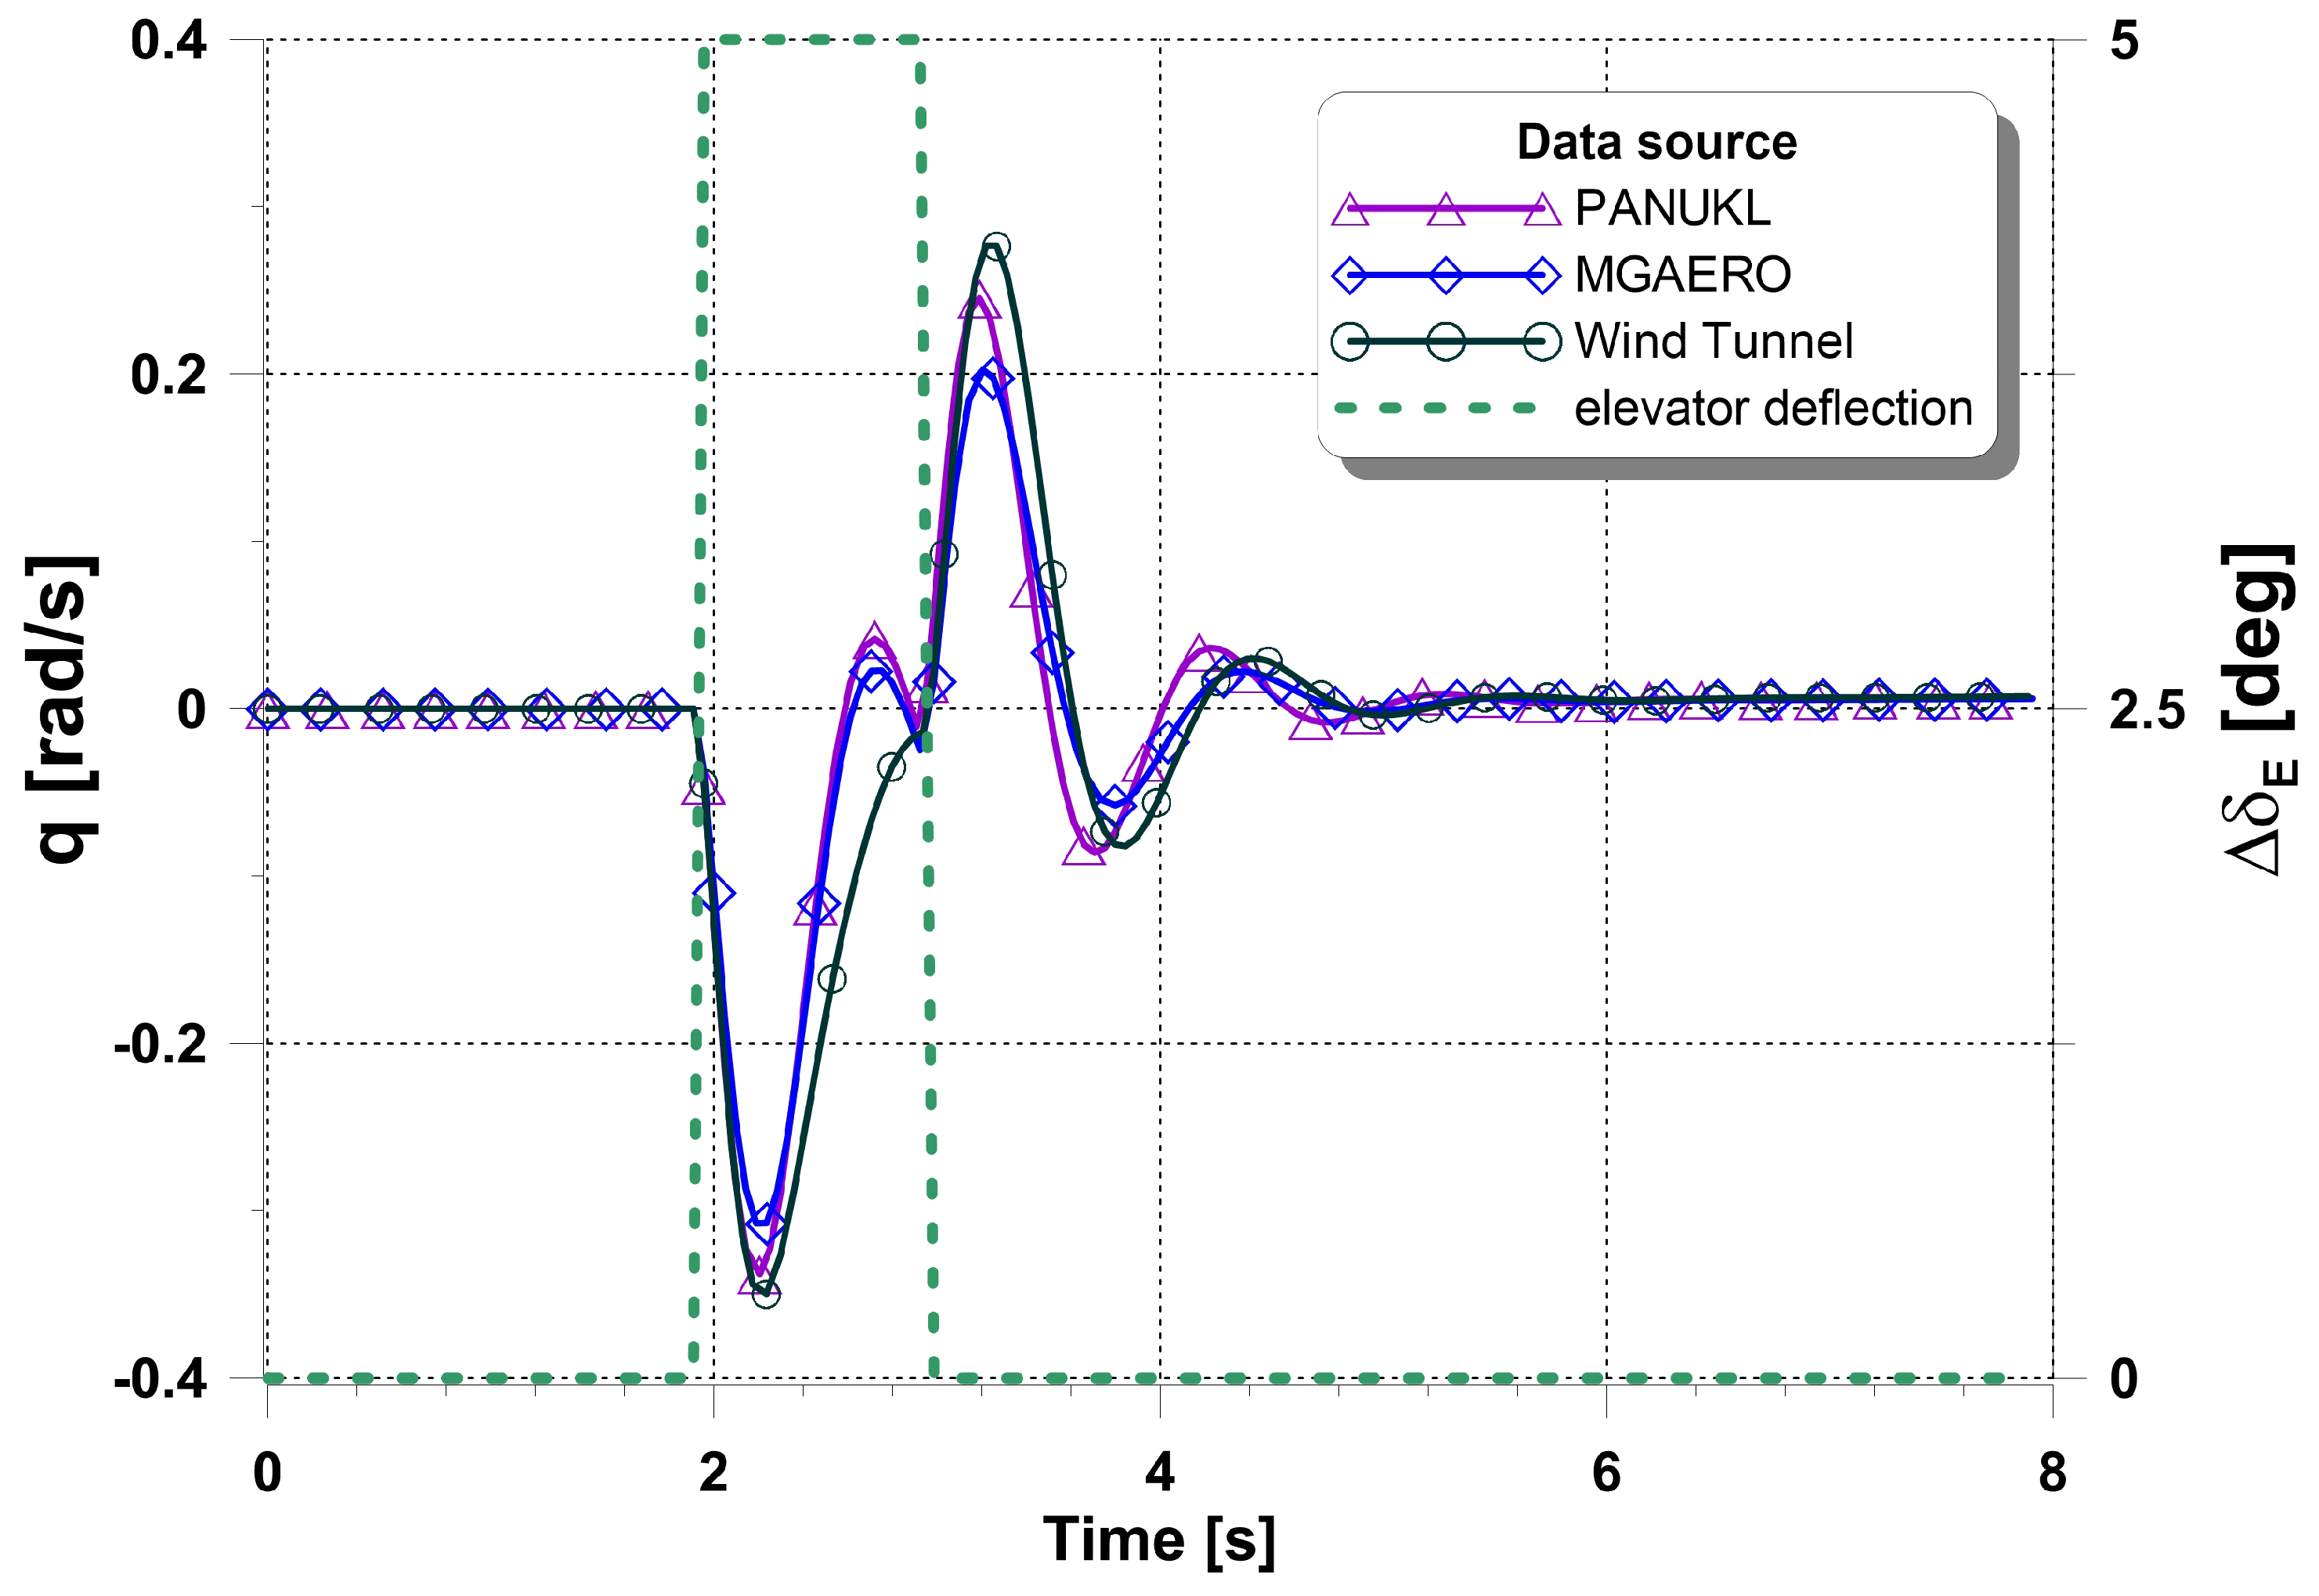
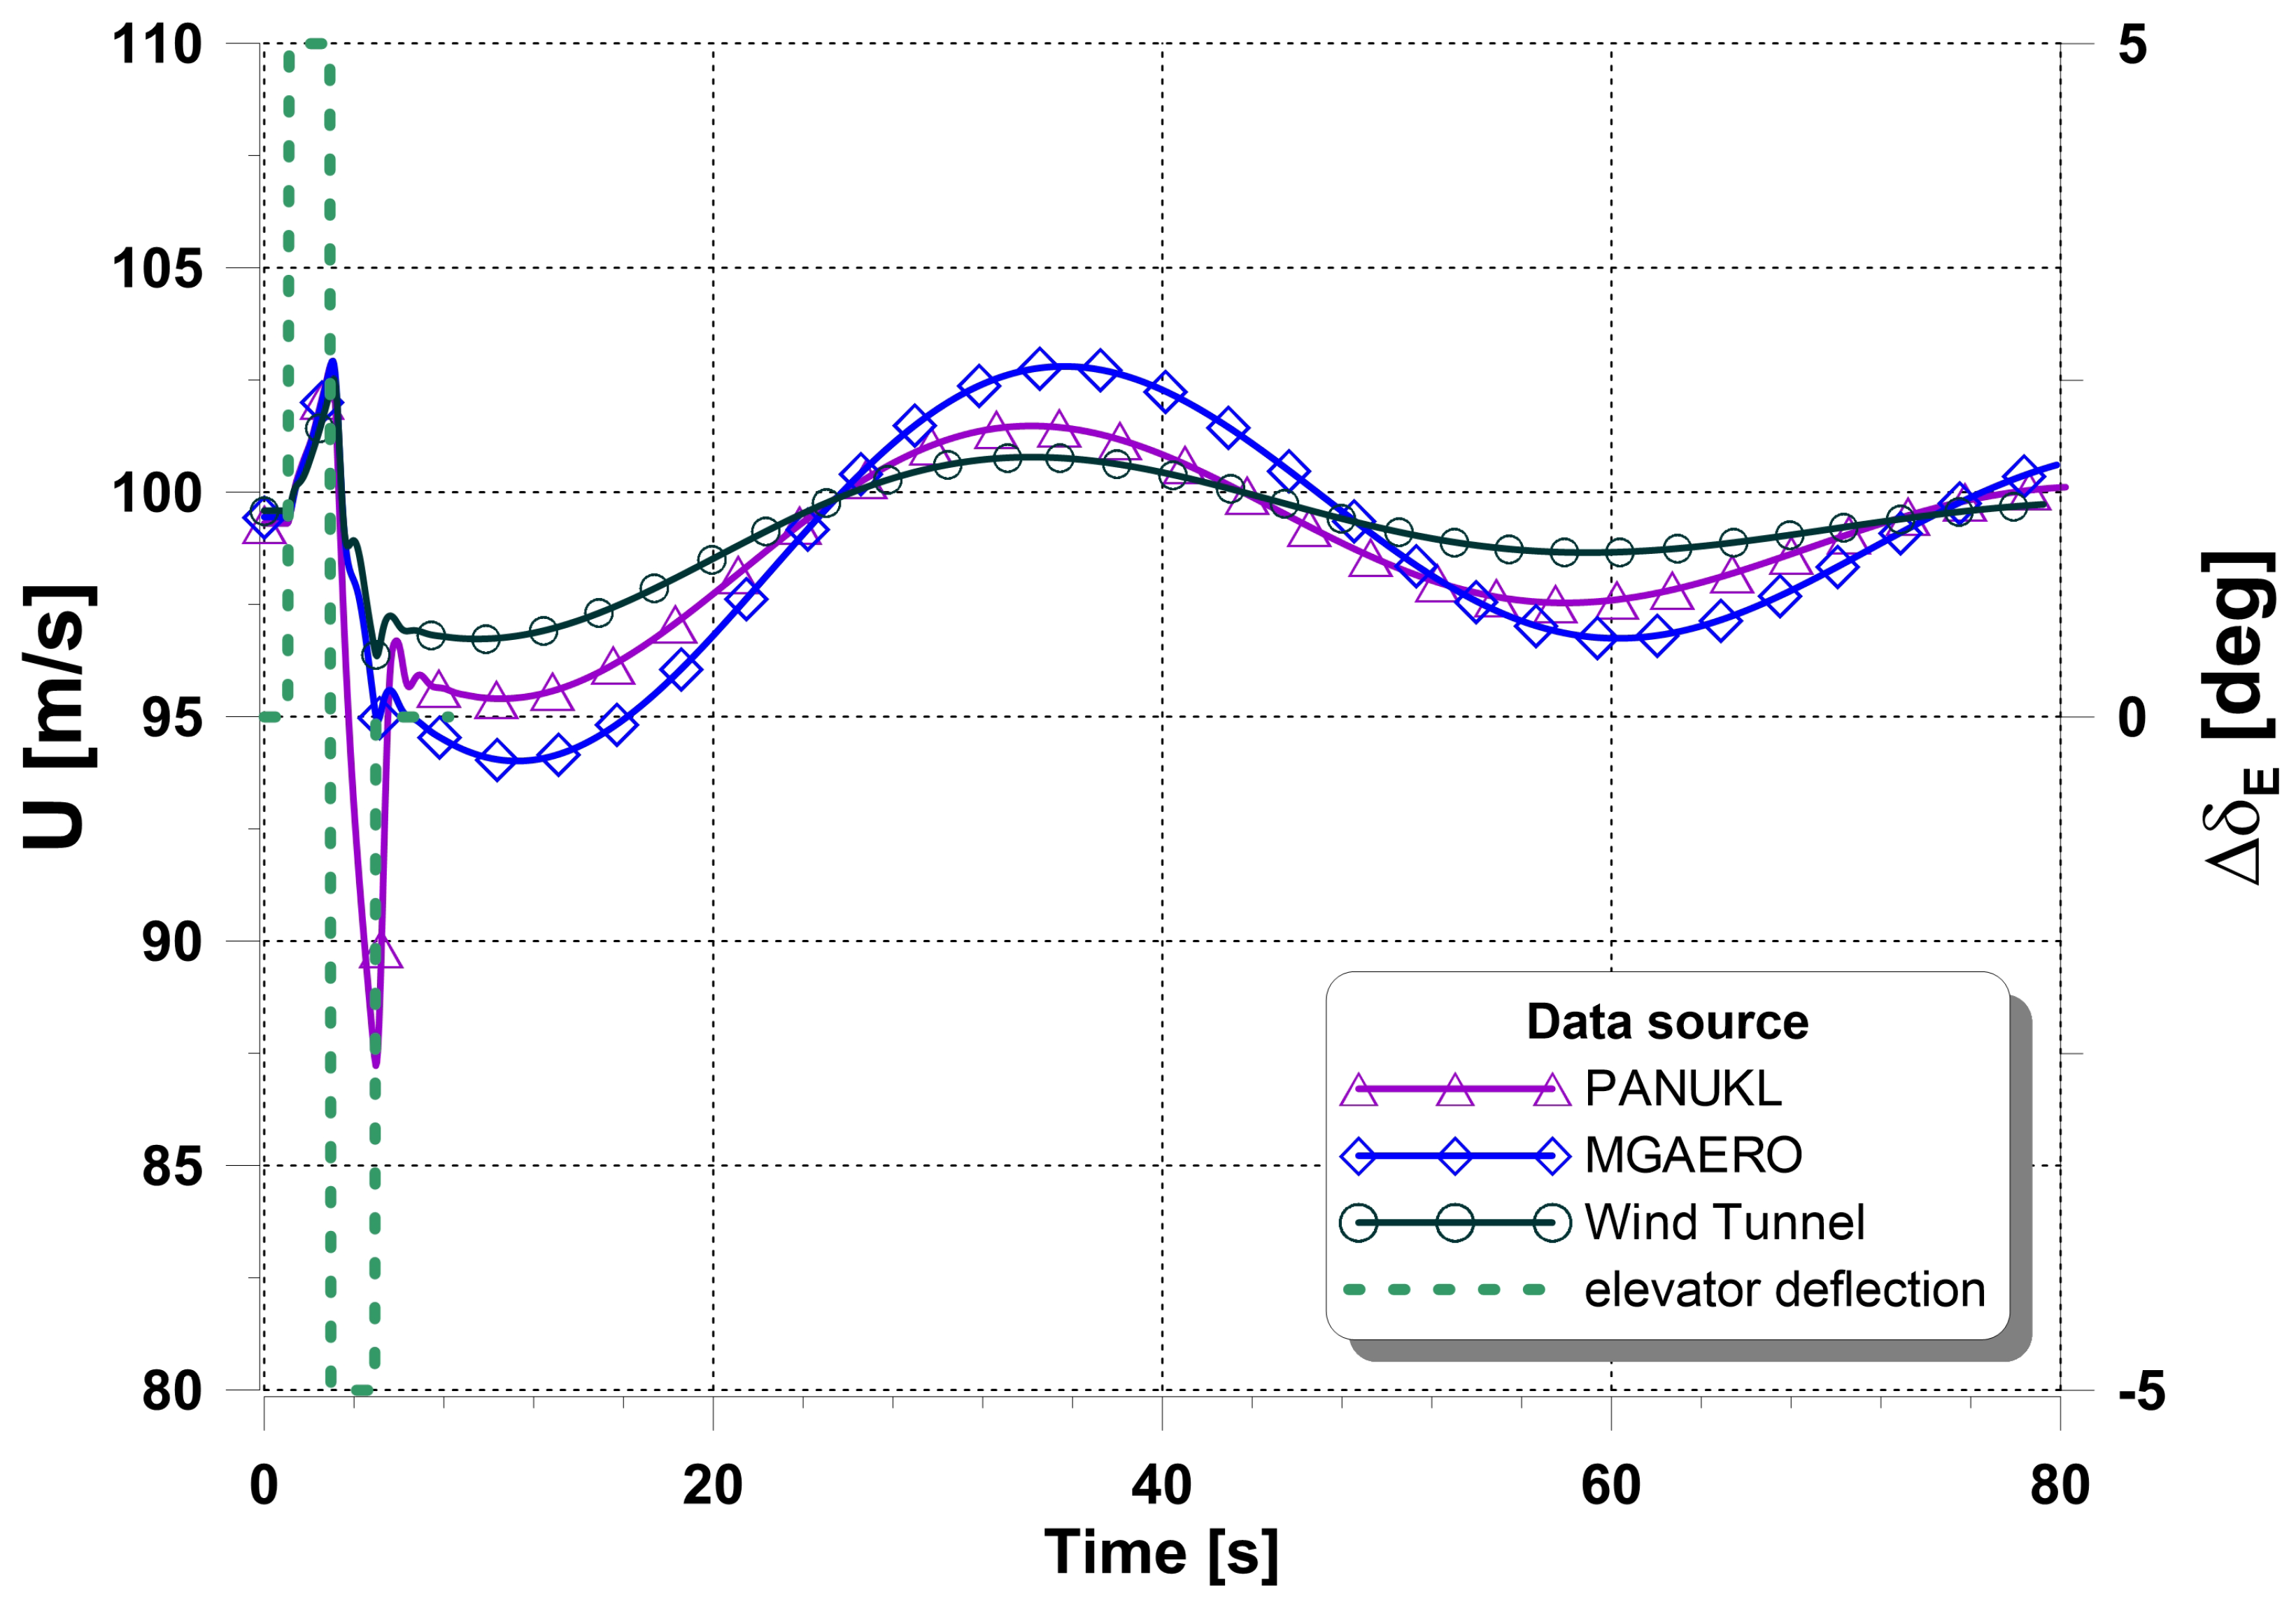
The graphs presented in this chapter are the result of numerical simulations of flight applying the nonlinear model to analyze the dynamic characteristics. Two basic longitudinal modes of motion were excited similarly as during real flight [45].
Figure 15 presents the short-period oscillation excited by the single-step control of elevator deflection. For all source data, the results show very good accordance. Figure 16 presents the phugoid oscillation excited by the double-step control of elevator deflection. Although the amplitude differs slightly, the period and damping are very similar for all source data.
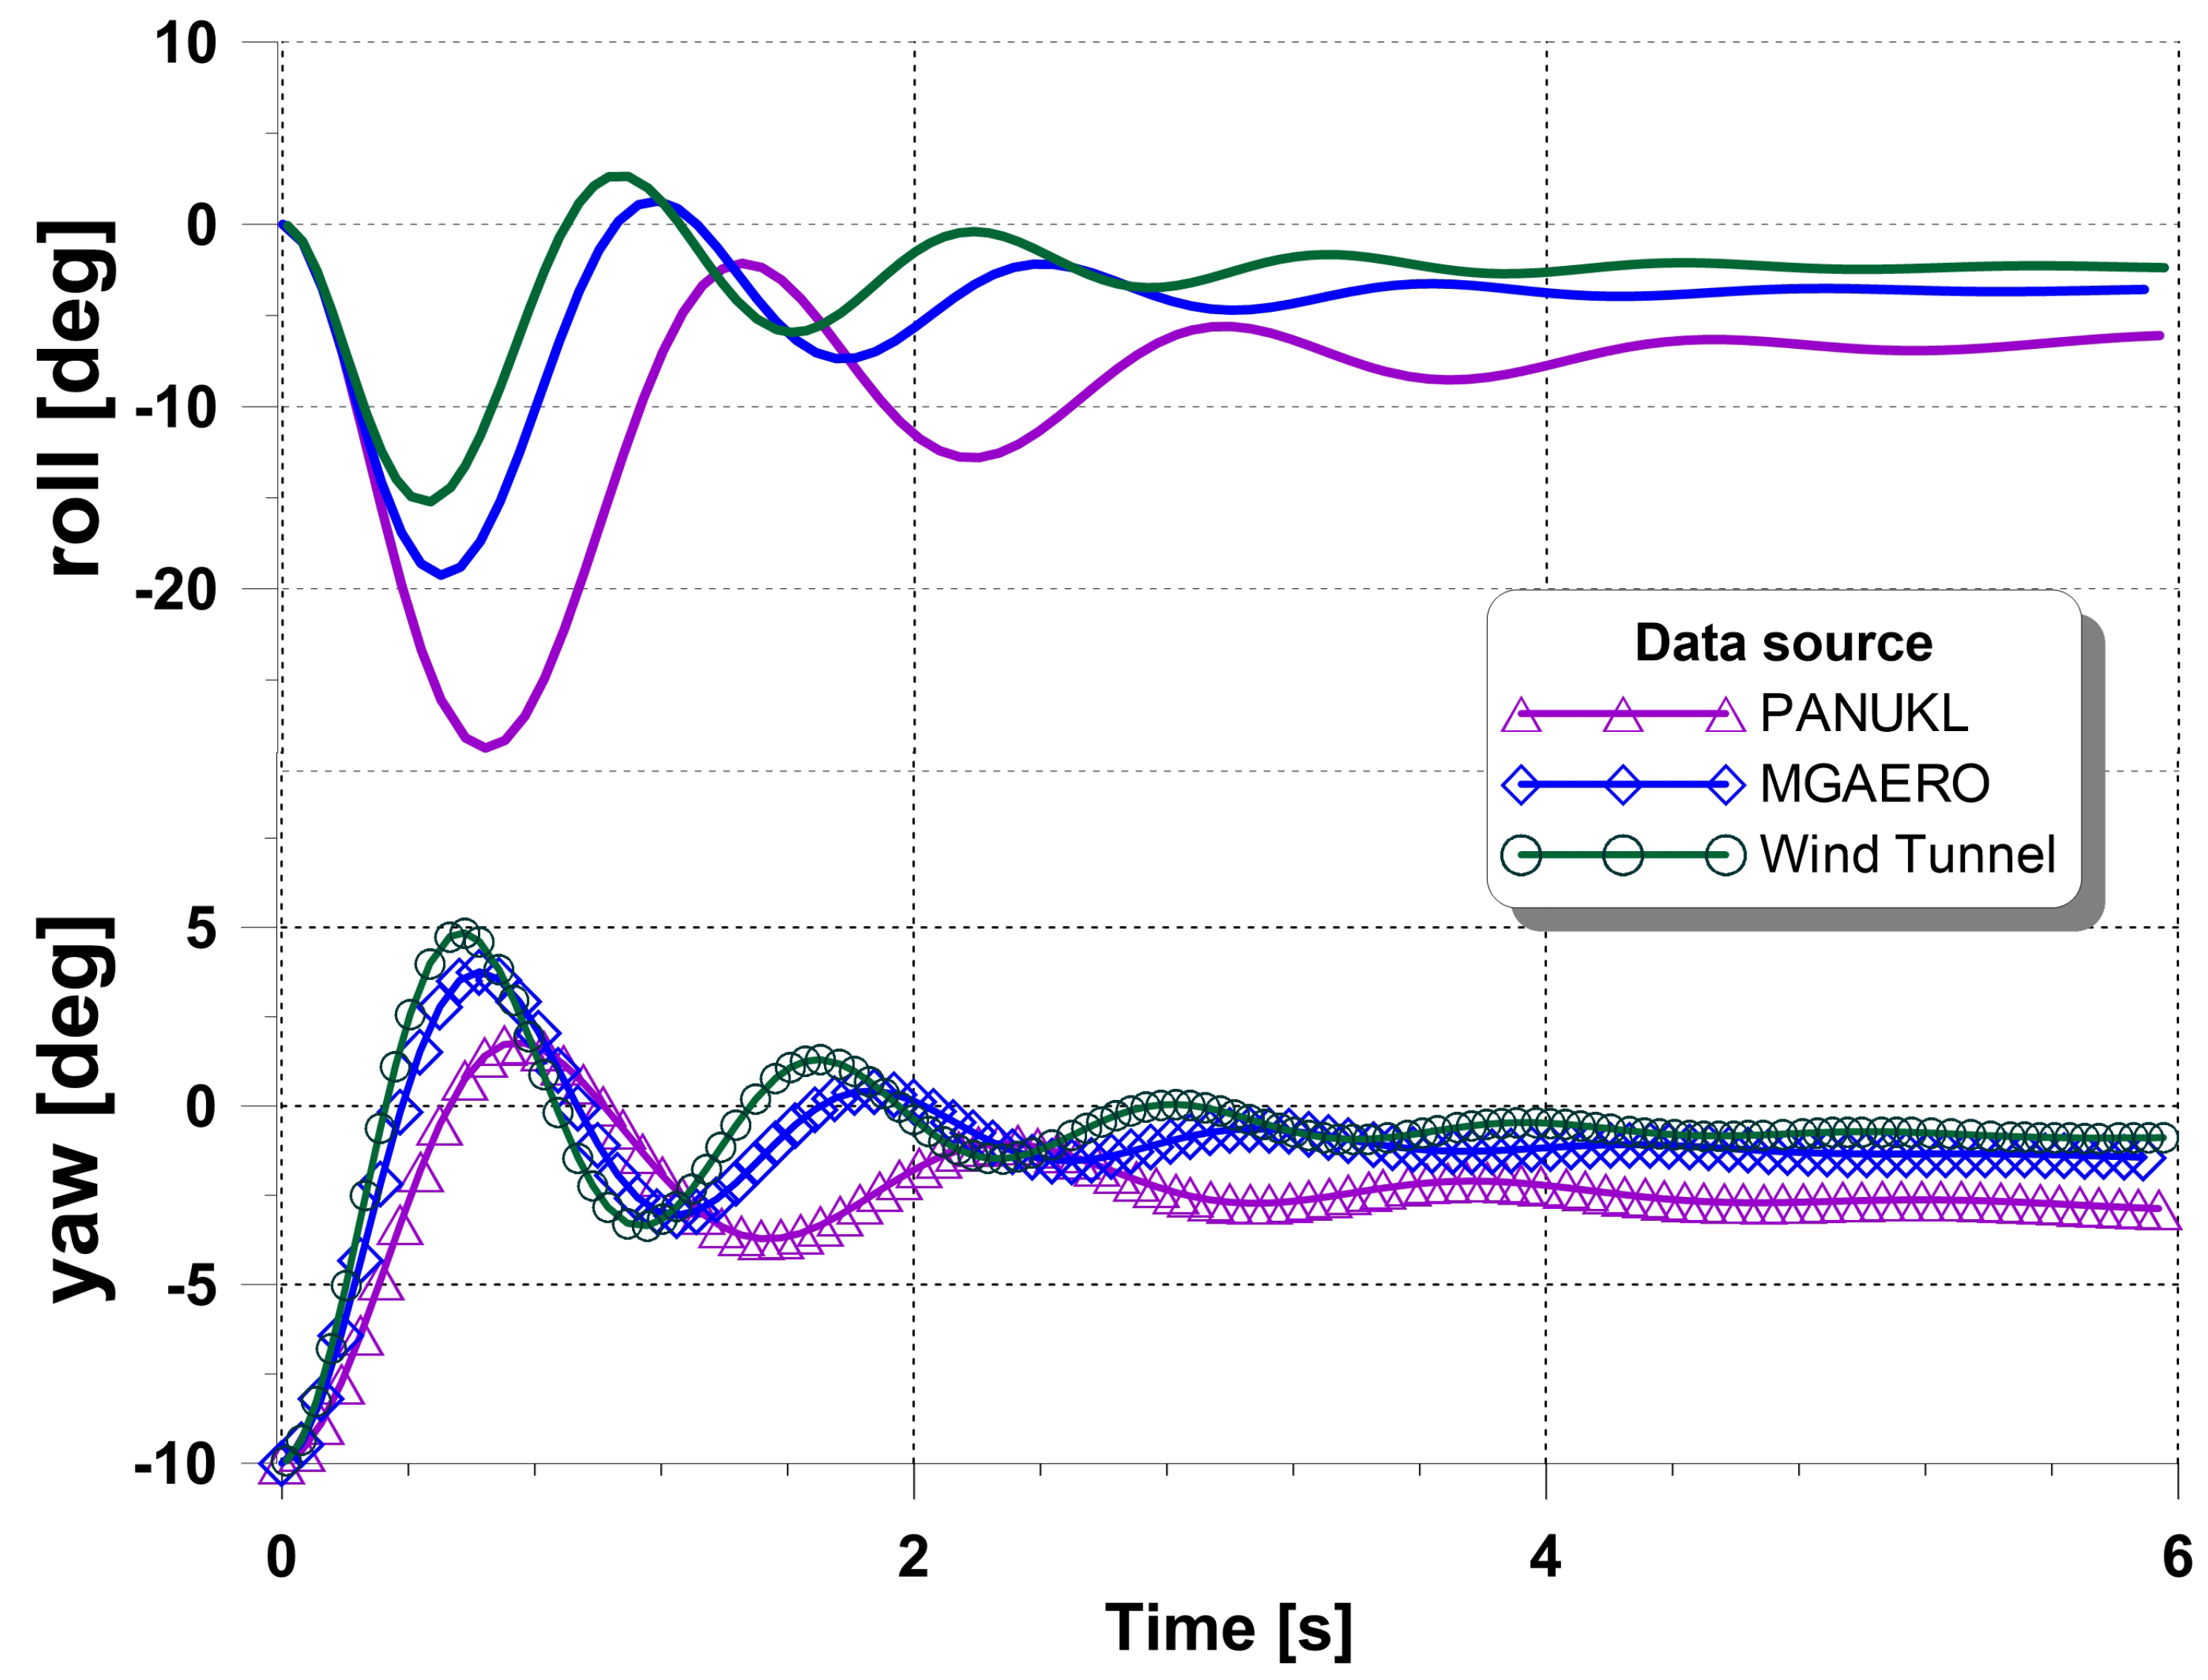
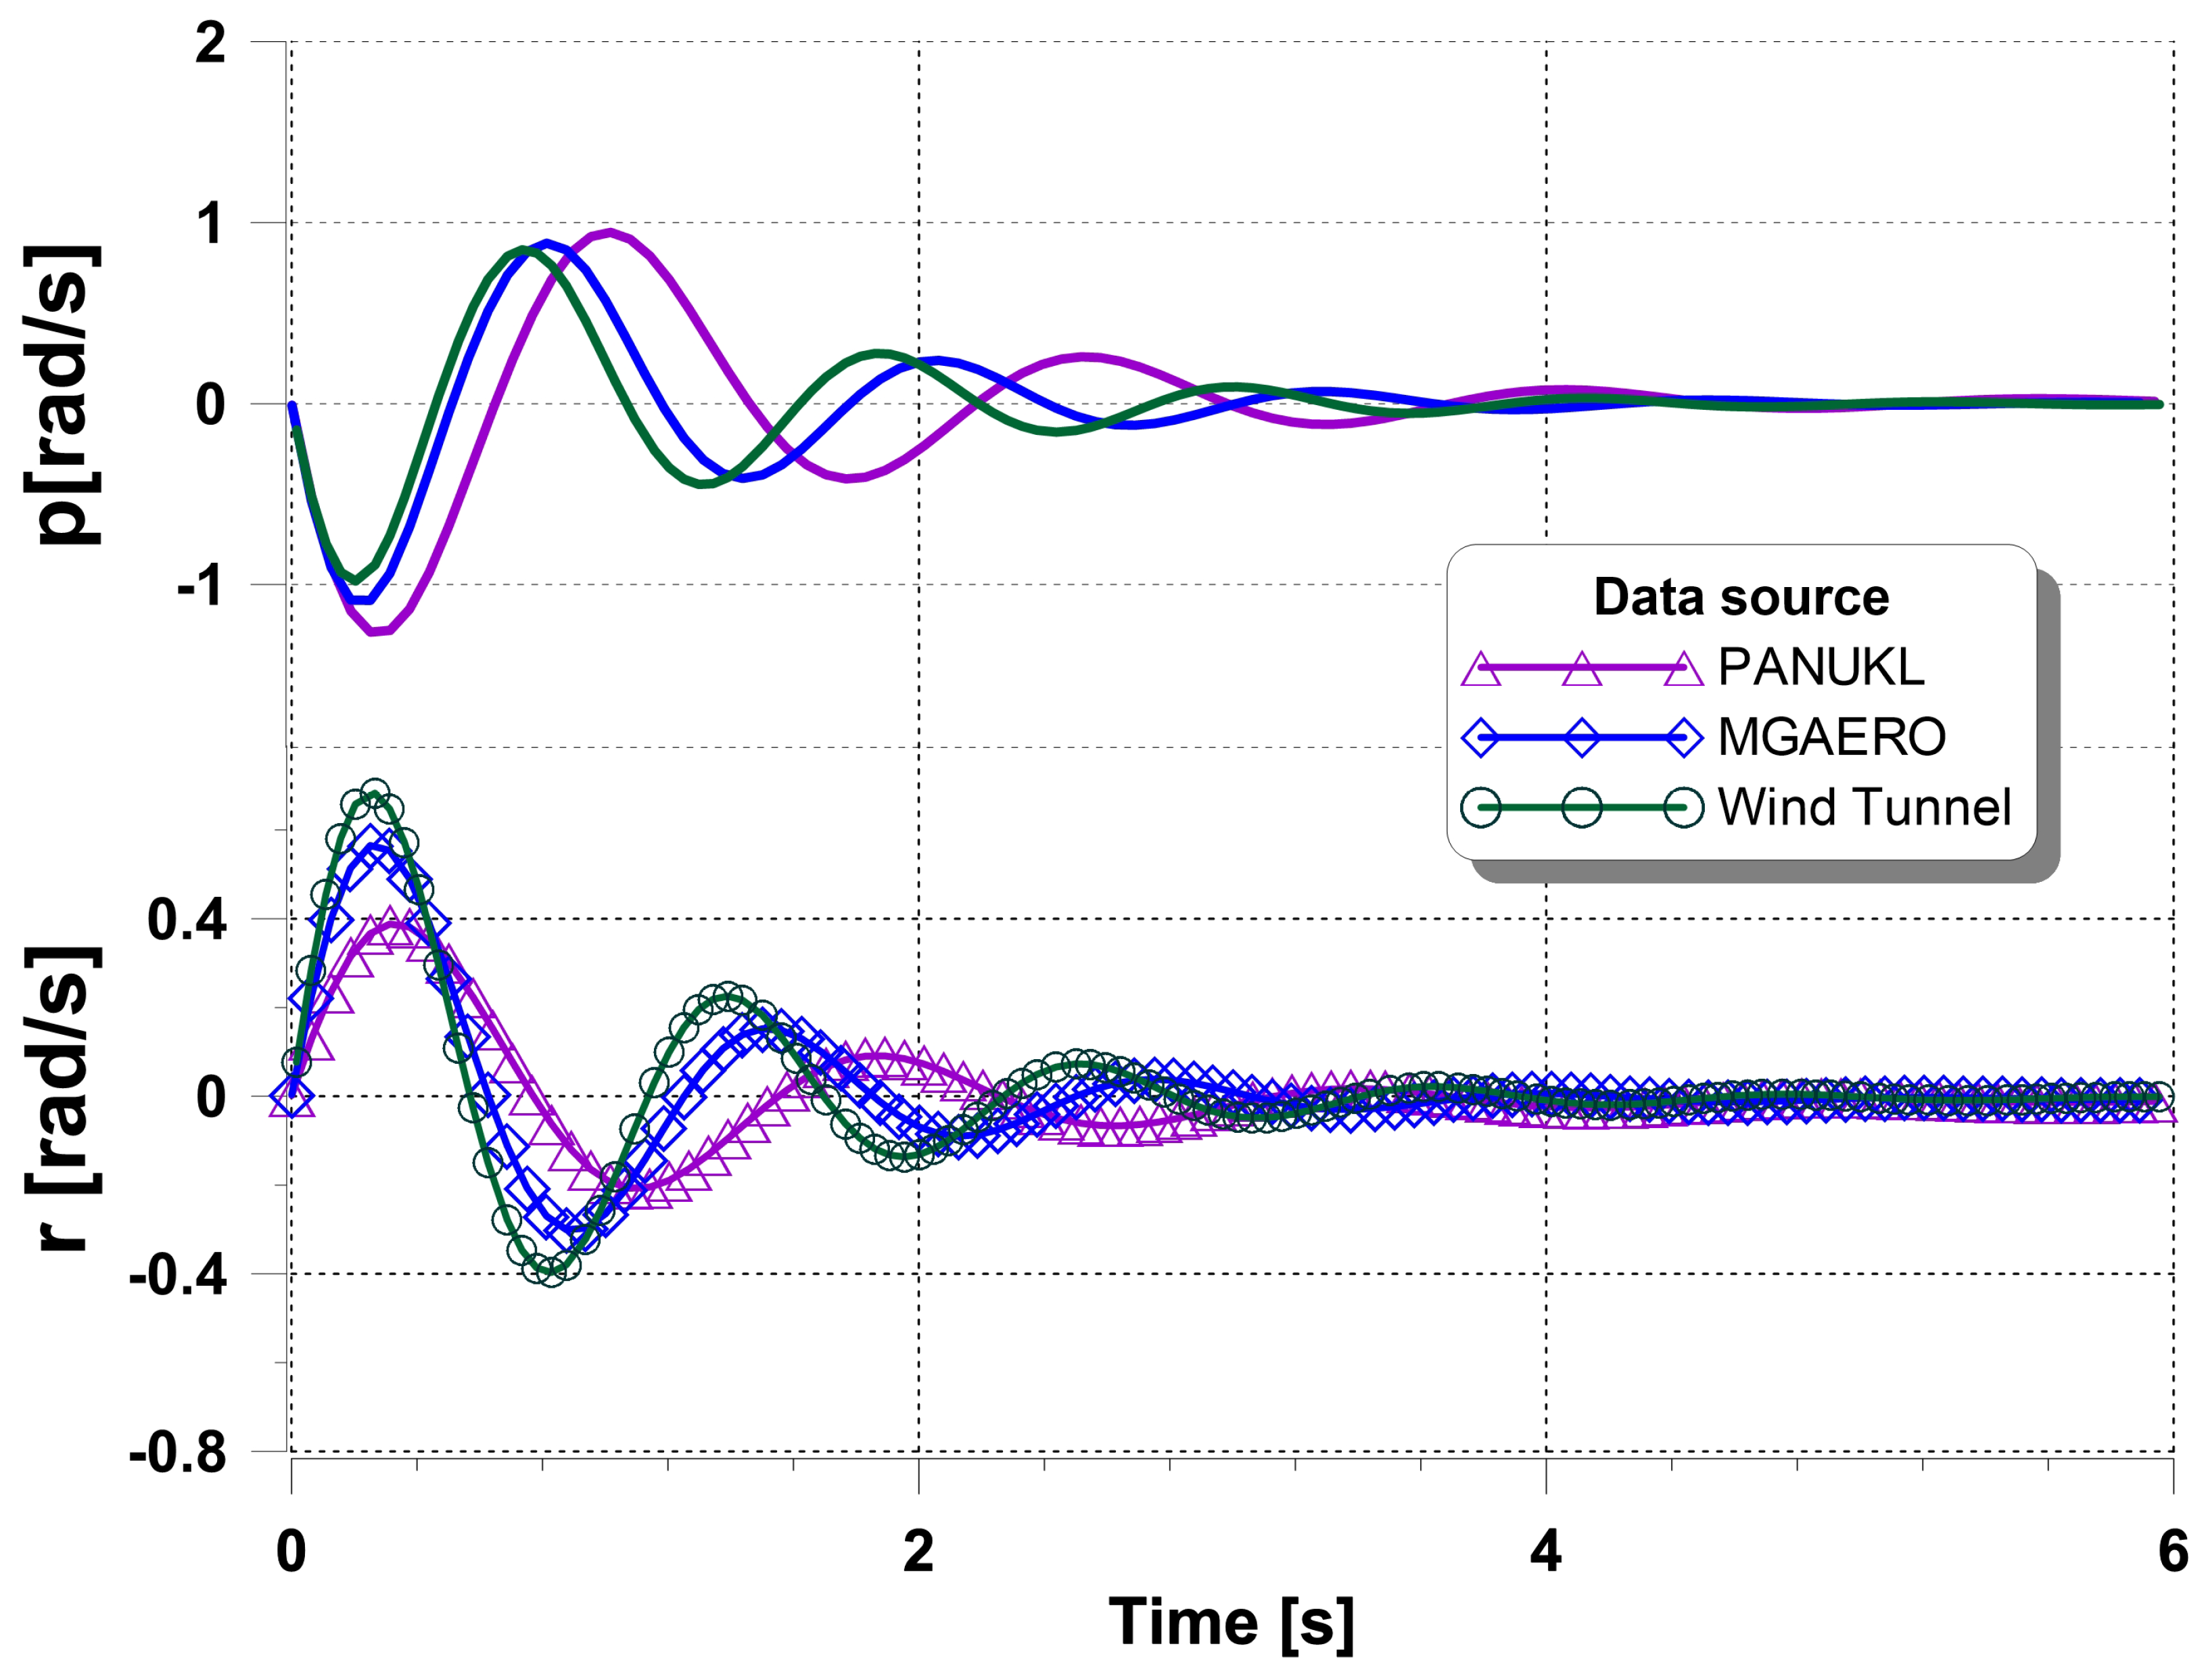
Figure 17, Figure 18 and Figure 19 present flight parameters during Dutch roll oscillations, excited via initial sideslip angle disturbance for an initial airspeed equal to 100 m/s (TAS). The side-slip angle, presented in Figure 17, is damped very similarly for all aerodynamic data sets, while the oscillation period is slightly longer for data obtained with the potential method.
The time histories of the lateral angles of attitude (yaw, roll—Figure 18) and the angular lateral rates (Figure 19) confirm the previous observations related to the influence of the aerodynamic data set on the period and damping of oscillation. The juxtaposition of these two lateral movements also shows the typical phase shift of roll and yaw. It is noteworthy that the deviation of the roll angle is larger for the set of data obtained using the potential method compared to the deviation of the roll rate.

6. Conclusions

The results of the analyses presented above allow for the formulation of certain concluding remarks, which, however, require a cautious approach when being applied in future research. The remarks can be written as follows:
  • Good accordance was achieved for longitudinal derivatives. The biggest difference was noticed for C m α , which is associated with lack of a cross-flow modeling in PANUKL—linear moment characteristics without pitch-up. The difference becomes lower with Mach number, where the pitch-up effect is less present.
  • In the case of directional derivatives, the biggest difference was noticed for C n β . This is associated with the geometry of the side plates that have a significant contribution in the yaw moment. Due to a significant dihedral angle, the flow around the side plates should be considered in the nonlinear range with a vortex (Figure 11); therefore, PANUKL underestimated these derivatives.
  • Good accordance was achieved for all dynamic tests for all source data, despite some differences in aerodynamic characteristics and stability derivatives; for all data sets, the qualitative results were the same (acceptable or not, according to stability criteria), and the differences were only quantitative:
    For the phugoid mode, a higher damping ratio was noticed for the wind tunnel data. In the pure numerical data, the difference in damping for low speed was negligible, while for higher speed, the damping was stronger for the MGAERO case due to presence of the compressible effect on the drag coefficient. The phugoid was the mode where the differences obtained between results were the biggest.
    For the short-period mode, the differences in both the damping ratio and undampened natural frequency were negligible. The short period was the mode where the differences obtained between results were the smallest.
    For the Dutch roll mode, a stronger damping ratio was noticed for the MGAERO data set, while the lowest damping ratio occurred for the wind tunnel data.
  • The potential method is quite efficient and good enough to estimate dynamic characteristics for the subsonic range and moderate angles of attack.
  • The use of the potential flow method to assess handling qualities of even an unconventional configuration can be utilized in the preliminary stage of design.
Despite the relatively old age of potential methods, they are still an attractive tool in the design process and, despite their lower fidelity, can be used as aerodynamic solvers in MDO processes.

Author Contributions

Conceptualization, A.K. and T.G.-G.; methodology, A.K. and T.G.-G.; software, T.G.-G.; resources, A.K.; investigation, A.K. and T.G.-G.; writing—original draft preparation, A.K. and T.G.-G.; writing—review and editing, A.K. and T.G.-G.; supervision, T.G.-G. All authors have read and agreed to the published version of the manuscript.

Funding

This research received no external funding.

Institutional Review Board Statement

Not applicable.

Informed Consent Statement

Not applicable.

Data Availability Statement

The data presented in this study are available in article.

Conflicts of Interest

The authors declare no conflict of interest.

References

  1. Goetzendorf-Grabowski, T. Flight dynamics of unconventional configurations. Prog. Aerosp. Sci. 2023, 137, 100885. [Google Scholar] [CrossRef]
  2. Rizzi, A. Modeling and simulating aircraft stability and control—The SimSAC project. Prog. Aerosp. Sci. 2011, 47, 573–588. [Google Scholar] [CrossRef]
  3. Smith, H.; Sziroczák, D.; Abbe, G.; Okonkwo, P. The GENUS aircraft conceptual design environment. Proc. Inst. Mech. Eng. Part J. Aerosp. Eng. 2018, 233, 2932–2947. [Google Scholar] [CrossRef]
  4. Mieloszyk, J.; Goetzendorf-Grabowski, T. Introduction of full flight dynamic stability constraints in aircraft multidisciplinary optimization. Aerosp. Sci. Technol. 2017, 68, 252–260. [Google Scholar] [CrossRef]
  5. Ciampa, P.D.; Prakasha, P.S.; Torrigiani, F.; Walther, J.N.; Lefebvre, T.; Bartoli, N.; Timmermans, H.; Vecchia, P.D.; Stingo, L.; Rajpal, D.; et al. Streamlining cross-organizational aircraft development: Results from the AGILE project. In Proceedings of the AIAA Aviation 2019 Forum, Dallas, TX, USA, 17–21 June 2019; American Institute of Aeronautics and Astronautics: Reston, VA, USA, 2019. [Google Scholar] [CrossRef]
  6. Mieloszyk, J.; Tarnowski, A.; Tomaszewski, A.; Goetzendorf-Grabowski, T. Validation of flight dynamic stability optimization constraints with flight tests. Aerosp. Sci. Technol. 2020, 106, 106193. [Google Scholar] [CrossRef]
  7. Reist, T.A.; Zingg, D.W.; Rakowitz, M.; Potter, G.; Banerjee, S. Multifidelity Optimization of Hybrid Wing–Body Aircraft with Stability and Control Requirements. J. Aircr. 2019, 56, 442–456. [Google Scholar] [CrossRef]
  8. Goetzendorf-Grabowski, T.; Rizzi, A.; Molitor, P.; Vos, J.B.; Sanchi, S.; Tomac, M. Coupling adaptive-fidelity CFD with S&C analysis to predict flying qualities. In Proceedings of the 27th AIAA Applied Aerodynamics Conference, San Antonio, TX, USA, 22–25 June 2009; American Institute of Aeronautics and Astronautics: Reston, VA, USA, 2009. [Google Scholar] [CrossRef]
  9. Mi, B.; Zhan, H. Review of Numerical Simulations on Aircraft Dynamic Stability Derivatives. Arch. Comput. Methods Eng. 2019, 27, 1515–1544. [Google Scholar] [CrossRef]
  10. Ghoreyshi, M.; Badcock, K.; Woodgate, M. Integration of multi-fidelity methods for generating an aerodynamic model for flight simulation. In Proceedings of the 46th AIAA Aerospace Sciences Meeting and Exhibit, Reno, NV, USA, 7–10 January 2008; American Institute of Aeronautics and Astronautics: Reston, VA, USA, 2008. [Google Scholar] [CrossRef]
  11. Goetzendorf-Grabowski, T. Influence of stability derivatives on a quality of simulation (supersonic flow). J. Theor. Appl. Mech. 1994, 32, 773–791. [Google Scholar]
  12. ESDU—Engineering Sciences Data Unit. 2022. Available online: https://www.esdu.com (accessed on 1 December 2022).
  13. Finck, R.D. USAF (United States Air Force) Stability and Control DATCOM (Data Compendium); Technical Report AFWAL-TR-83-3048, 1975–1977; Defense Technical Information Center: Fort Belvoir, VA, USA, 1978.
  14. Ciliberti, D.; Vecchia, P.D.; Nicolosi, F.; Marco, A.D. Aircraft directional stability and vertical tail design: A review of semi-empirical methods. Prog. Aerosp. Sci. 2017, 95, 140–172. [Google Scholar] [CrossRef]
  15. Gatto, A.; Lowenberg, M.H. Evaluation of a Three Degree of Freedom Test Rig for Stability Derivative Estimation. J. Aircr. 2006, 43, 1747–1761. [Google Scholar] [CrossRef]
  16. Goetzendorf-Grabowski, T. Multi-disciplinary optimization in aeronautical engineering. Proc. Inst. Mech. Eng. Part J. Aerosp. Eng. 2017, 231, 2305–2313. [Google Scholar] [CrossRef]
  17. Figat, M.; Galiński, C.; Kwiek, A. Modular aeroplane system—A concept and initial investigation. In Proceedings of the 28th Congress of the International Council of the Aeronautical Sciences, ICAS, Brisbane, Australia, 23–28 September 2012. [Google Scholar]
  18. Galiński, C.; Goetzendorf-Grabowski, T.; Mieszalski, D.; Stefanek, L. A concept of two-staged spaceplane for suborbital tourism. Trans. Inst. Aviat. 2007, 191, 33–42. [Google Scholar]
  19. Ansari Prize. 2023. Available online: https://www.xprize.org/prizes/ansari (accessed on 24 March 2023).
  20. Polhamus, E.C. A Concept of the Vortex Lift of Sharp-Edge Delta Wings Based on a Leading-Edge-Suction Analogy; NASA Technical Note NASA-TN-D-3767; Langley Research Center: Hampton, VA, USA, 1966. [Google Scholar]
  21. Kwiek, A.; Figat, M.; Goetzendorf-Grabowski, T. The Study of Selected Aspects of the Suborbital Vehicle Return Flight Trajectory. Aerospace 2023, 10, 489. [Google Scholar] [CrossRef]
  22. Figat, M.; Kwiek, A. Aerodynamic optimisation of the rocket plane in subsonic and supersonic flight conditions. Proc. Inst. Mech. Eng. Part J. Aerosp. Eng. 2017, 231, 2266–2281. [Google Scholar] [CrossRef]
  23. Kwiek, A. Study on control and stability of the rocket plane to space tourism. In Proceedings of the 29th Congress of the International Council of the Aeronautical Sciences, ICAS, St. Petersburg, Russia, 7–12 September 2014. [Google Scholar]
  24. Witoszyński, C. Travaux de L’Institut Aerodynamique de Varsovie; WUT: Wuhan, China, 1932; Volume V, (In Polish and French). [Google Scholar]
  25. Kwiek, A.; Figat, M. LEX and wing tip plates’ interaction on the Rocket Plane in tailless configuration. Aeronaut. J. 2016, 120, 255–270. [Google Scholar] [CrossRef]
  26. Kwiek, A.; Figat, M. An investigation into directional characteristics of the rocket plane in a tailless configuration. CEAS Space J. 2022, 15, 627–640. [Google Scholar] [CrossRef]
  27. Li, L.; Xu, W.; Tan, Y.; Yang, Y.; Yang, J.; Tan, D. Fluid-induced vibration evolution mechanism of multiphase free sink vortex and the multi-source vibration sensing method. Mech. Syst. Signal Process. 2023, 189, 110058. [Google Scholar] [CrossRef]
  28. Li, L.; Gu, Z.; Xu, W.; Tan, Y.; Fan, X.; Tan, D. Mixing mass transfer mechanism and dynamic control of gas-liquid-solid multiphase flow based on VOF-DEM coupling. Energy 2023, 272, 127015. [Google Scholar] [CrossRef]
  29. Hess, J. Review of the historical development of surface source methods. In Computational Methods in Potential Aerodynamics; Morino, L., Ed.; Springer: Berlin/Heidelberg, Germany, 1985. [Google Scholar]
  30. Goraj, Z.; Pietrucha, J. Classical Panel—A Routine Tool for Aerodynamic Calculations of Complex Aircraft Configurations: From Concept To Codes. J. Theor. Appl. Mech. 1995, 33, 843–878. [Google Scholar]
  31. Figat, M.; Goetzendorf-Grabowski, T.; Goraj, Z. Aerodynamic calculation of unmanned aircraft. Aircr. Eng. Aerosp. Technol. 2005, 77, 467–474. [Google Scholar] [CrossRef]
  32. Katz, J.; Plotkin, A. Low-speed aerodynamics. In Cambridge Aerospace Series, 2nd ed.; Number 13; Cambridge University Press: Cambridge, MA, USA, 2008. [Google Scholar]
  33. MGAERO. A Cartesian Multigrid Euler Code for Flow Around Arbitrary Configurations—User’s Manual Version 3.1.4. Proc. Inst. Mech. Eng. Part J. Aerosp. Eng. 2001, 231, 2146–2162. [Google Scholar]
  34. PANUKL—Package to Compute the Aerodynamic Characteristics of an Aircraft Using Low Order Panel Method. 2020. Available online: https://www.meil.pw.edu.pl/add/ADD/Teaching/Software/PANUKL (accessed on 1 May 2021).
  35. Mavriplis, D.J. Three-dimensional unstructured multigrid for the Euler equations. AIAA J. 1992, 30, 1753–1761. [Google Scholar] [CrossRef]
  36. Cook, M. Flight Dynamics Principles: A Linear Systems Approach to Aircraft Stability and Control, 3rd ed.; Butterworth-Heinemann: Oxford, UK, 2012. [Google Scholar]
  37. Etkin, B.; Reid, L.D. Dynamics of Flight: Stability and Control, 3rd ed.; Wiley: Hoboken, NJ, USA, 1996. [Google Scholar]
  38. Nelson, R. Flight Stability and Automatic Control, 2nd ed.; McGraw-Hill: New York, NY, USA, 1998. [Google Scholar]
  39. SDSA—Simulation and Dynamic Stability Analysis Application. 2020. Available online: https://www.meil.pw.edu.pl/add/ADD/Teaching/Software/SDSA (accessed on 1 May 2021).
  40. Goetzendorf-Grabowski, T.; Antoniewski, T. Three surface aircraft (TSA) configuration—Flying qualities evaluation. Aircr. Eng. Aerosp. Technol. 2016, 88, 277–284. [Google Scholar] [CrossRef]
  41. Goetzendorf-Grabowski, T.; Mieszalski, D.; Marcinkiewicz, E. Stability analysis using SDSA tool. Prog. Aerosp. Sci. 2011, 47, 636–646. [Google Scholar] [CrossRef]
  42. Raymer, D.P. Aircraft Design: A Concptual Approach, 4th ed.; AIAA (American Institute of Aeronautics & Astronautics): Reston, VA, USA, 2006. [Google Scholar]
  43. Defense Technical Information Center. MIL-F-8785C—Military Specification Flying Qualities of Piloted Airplanes; Defense Technical Information Center: Fort Belvoir, VA, USA, 1980.
  44. European Aviation Safety Agency. Certification Specifications for Normal, Utility, Aerobatic, and Commuter Category Aeroplanes—CS-23, Amendment 3; European Aviation Safety Agency: Cologne, Germany, 2012. [Google Scholar]
  45. Kimberlin, R.D. Flight Testing of Fixed-Wing Aircraft; AIAA (American Institute of Aeronautics & Astronautics): Reston, VA, USA, 2003. [Google Scholar]
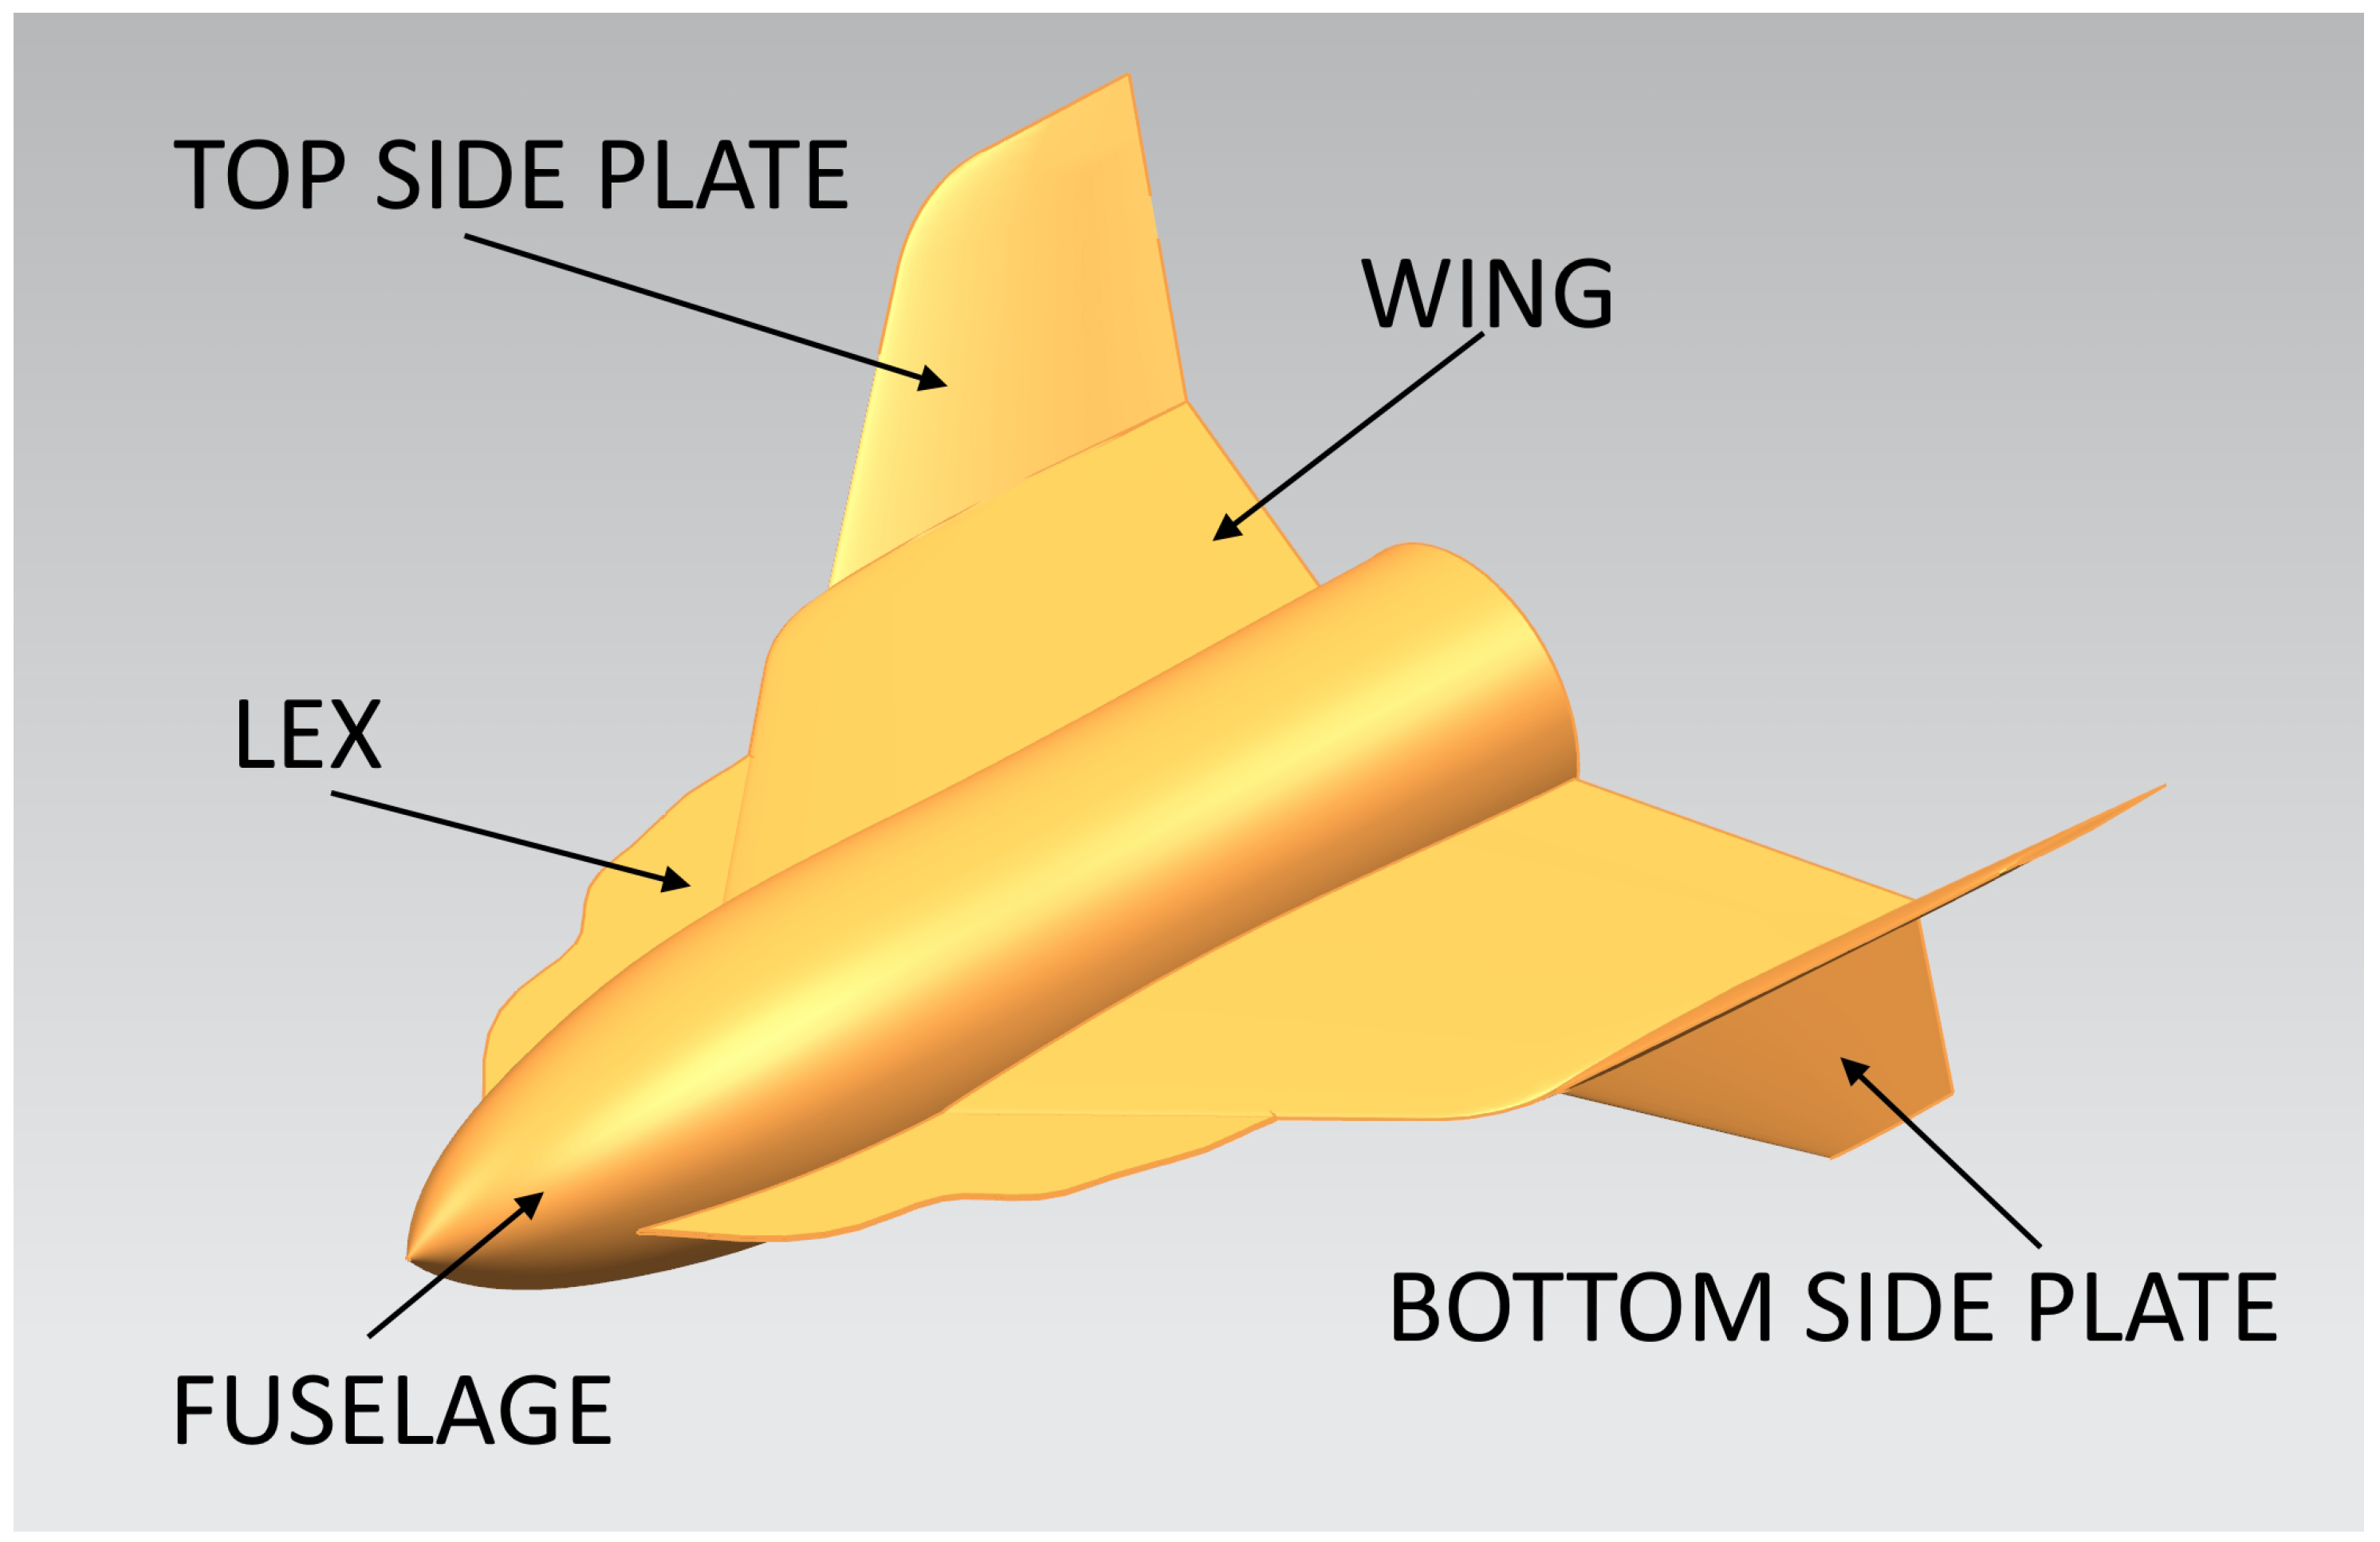
Figure 1. Rocket plane’s layout.
Applsci 13 12522 g001
Figure 2. Rocket plane—main dimensions.
Applsci 13 12522 g002
Figure 3. Model no. 1211 (left) and the test stand (right).
Applsci 13 12522 g003
Figure 4. MGAERO mesh—20,158 elements (left); PANUKL mesh—6524 panels (right).
Applsci 13 12522 g004
Figure 5. MGAERO—AoA = 12 degrees, M = 2.0 (left), PANUKL—AoA = 11.5 degrees, M = 0.5 (right).
Applsci 13 12522 g005
Figure 6. Coordinate systems and forces components.
Applsci 13 12522 g006
Figure 7. Basic aerodynamic characteristics obtained via various methods—lift coefficient vs. angle of attack (left); drag coefficient vs. angle of attack (right).
Applsci 13 12522 g007
Figure 8. Basic aerodynamic characteristics obtained via various methods—pitching moment coefficient vs. angle of attack (left); polar drag (right).
Applsci 13 12522 g008
Figure 9. Longitudinal stability derivatives vs. Mach number—pitching moment coefficient with respect to angle of attack (left); pitching moment coefficient with respect to pitch rate (right).
Applsci 13 12522 g009
Figure 10. Lateral stability derivatives vs. angle of attack for different Mach numbers—yawing moment coefficient with respect to sideslip angle (left); rolling moment coefficient with respect to sideslip angle (right).
Applsci 13 12522 g010
Figure 11. Vortex development on the side plates.
Applsci 13 12522 g011
Figure 12. Trim conditions—AoA and elevator deflection vs. CAS airspeed (left). Phugoid characteristics—time to double vs. CAS (right).
Applsci 13 12522 g012
Figure 13. Short-period characteristics against the background of MIL (left) and ESDU (right) criteria.
Applsci 13 12522 g013
Figure 14. Dutch roll characteristics against the background of MIL (left) and CS23 (right) criteria.
Applsci 13 12522 g014
Figure 15. Exciting of short-period oscillation via single-step elevator deflection.
Applsci 13 12522 g015
Figure 16. Exciting of phugoid oscillation via double-step elevator deflection.
Applsci 13 12522 g016
Figure 17. Dutch roll oscillation excited via initial disturbance of side-slip angle.
Applsci 13 12522 g017
Figure 18. Yaw and roll angle in Dutch roll oscillation.
Applsci 13 12522 g018
Figure 19. Yaw rate (R) and roll rate (P) in Dutch roll oscillation.
Applsci 13 12522 g019
Table 1. Undamped frequency (UnF) and damping ratio (DR) for typical periodical modes of motion.
MData SourcePhugoidShort PeriodDutch Roll
UnFDRUnFDRUnFDR
0.3Wind Tunnel0.12930.19565.22520.33645.36590.1612
MGAERO0.12820.13025.27630.34064.99470.1851
PANUKL0.13230.14725.73060.29064.06200.1844
0.745MGAERO0.12820.13025.27630.34064.99470.1851
PANUKL0.13230.14725.73060.29064.06200.1844
Disclaimer/Publisher’s Note: The statements, opinions and data contained in all publications are solely those of the individual author(s) and contributor(s) and not of MDPI and/or the editor(s). MDPI and/or the editor(s) disclaim responsibility for any injury to people or property resulting from any ideas, methods, instructions or products referred to in the content.