Article

Stress Corrosion Cracking Analysis of a Hot Blast Stove Shell with an Internal Combustion Chamber

Department of Mechanical Engineering, Sogang University, Seoul 04107, Republic of Korea
*
Author to whom correspondence should be addressed.
These authors contributed equally to this work.
Appl. Sci. 2023, 13(22), 12297; https://doi.org/10.3390/app132212297
Submission received: 17 October 2023 / Revised: 4 November 2023 / Accepted: 10 November 2023 / Published: 14 November 2023
(This article belongs to the Special Issue Advanced Finite Element Method and Its Applications)

Abstract

:
The stress corrosion cracking during the operation of the internal combustion hot blast stove was analysed. The computational fluid dynamics and finite element analysis models were established to analyse the temperature, stress and other variables related to the condensation of the water and acids. The corrosion characteristics of condensation of acid and the stress corrosion cracking of the metallic shell of the hot blast stove during the operation were predicted by applying the fluid temperature and mapping it to the solid temperature. The stress corrosion cracking surface mobility mechanism was adopted and modified with a weight concept to consider the effect of the acid condensation and its concentration. The regions that have higher crack propagation rates were analysed. The influence of the increase in the blast temperature on the crack propagation rate was studied with the increase in the blast temperature by 45 K and 90 K from the reference blast temperature. The maximum temperature of the refractory linings was 1847 K in the on-gas period, and the maximum change in the shell temperature was 5.2 K when the blast temperature was increased by 90 K. The maximum crack propagation rate for the reference blast temperature was evaluated as  7.61 × 10 7  m/s. The maximum value of the crack propagation rate was increased by 16.7% when the blast temperature increased by 90 K. The conical region was found to have higher crack propagation rates, which means that the conical region should be the region of interest for managing the internal combustion hot blast stoves.

1. Introduction

The long-term operation experience of hot blast stoves (HBSs) around the world reveals that stress corrosion cracking (SCC) is one of the main reasons for the failures of the structures that are exposed to acidic environments [1]. The stress corrosion cracking process has still not been fully elucidated, and several theories that predict SCC growth rates were set up to explain the causes of the structure collapse cases [2]. In addition, corrosion from condensed gases has been a problem in industries for long-term operation [3,4]. Various types of corrosion reactions can occur due to factors such as the operation temperature, combustion stoichiometry, and burner design. For SCC to happen, the following conditions must be present: an aqueous corrosive media (typically chlorides and hydrogen sulfide) along with applied or residual stresses. Moreover, the elevated temperature is known to increase the SCC growth rate.
The internal combustion-type HBS has a form in which a partition wall separates the combustion and checker chambers. During the HBS operation, the gas temperature undergoes cyclic changes ranging from 400 °C to 1200 °C. The duration of each cycle is approximately three hours, and over numerous cycles, the metallic shell may develop cracks. Despite the low internal pressure in the apparatus, a crack can pose a significant risk due to the high-temperature (1200 °C) oxygen-enriched air stream that can cause damage to the surrounding structures. Moreover, the corrosive atmosphere created by the flue gas inside the HBS, combined with the thermal stress, can lead to SCC. Such SCC can be assessed by non-destructive testing [5]. However, the size of the HBS is enormous, so checking all parts of the metallic shell is a challenging mission. Therefore, it is imperative to calculate the distribution of the higher SCC regions of the HBSs.
According to recent research, even small non-uniformities in temperature can cause thermal stress cracks on the metallic shell [6]. When the flue gas contains high NOx concentration, thermal insulation in the HBS can result in nitric SCC [1]. Ammonium and calcium nitrates can form when nitric acid in the flue gas reacts with insulation material and carbon steel. In operating conditions with a possibility of nitrates and NOx condensation, carbon steels are at substantial risk of experiencing SCC sooner or later. Intergranular corrosion is associated with SCC due to the presence of nitrates. Leferink and Huijbregts [7] examined the susceptibility of ferritic stainless steels to intergranular corrosion in nitrate solutions in their study. It was observed that the environment was sensitive to intergranular corrosion.
One of the critical parameters that affect the safety and efficiency of hot blast stoves (HBSs) is the acid dewpoint (ADP). ADP is the temperature at which acid vapours begin to condense and cause low-temperature corrosion (LTC), eventually threatening the HBS’s safety. Although higher exhaust temperatures can relieve LTC by increasing ADP, higher exhaust temperatures can result in lower thermal efficiency. ADP is a crucial parameter that guides the safe and efficient operation of HBSs. While there have been numerous investigations into the ADP of HBSs, a comprehensive review is still needed [1]. As a result, the ADP continues to be a widely discussed topic in the realm of coal combustion and energy utilisation.
SCC typically occurs at a microscopic or granular level, and even forces that would not typically damage the material can cause them to form and propagate. SCC can cause significant safety and economic issues, making it imperative to develop a model that can predict its growth rates. In recent decades, three primary methods have been used to define SCC growth rates: empirical, calculation, and deterministic.
Classical statistical analysis and artificial neural network methods are commonly used to develop empirical models. However, both approaches require a substantial amount of experimental data to be accurate and reliable [8,9]. While these models offer convenience and reasonable accuracy, they can be expensive and time-consuming, often necessitating extensive testing for various service environments [9].
Conversely, deterministic models focus on exploring the SCC mechanism to establish theoretical connections between the crack growth rate and parameters affecting the crack propagation rates [10,11,12,13]. A number of scholars have put forward various theoretical mechanisms and crack growth rate models to scientifically depict the SCC phenomenon [14,15,16,17,18].
Galvele [19] introduced the surface mobility mechanism (SMM) of stress corrosion cracking (SCC) to forecast the influence of temperature on SCC. Galvele [20] suggested that the SMM may be a valuable technique for predicting the susceptibility of metals and alloys to SCC in industrial operating conditions. The SMM has been successful in elucidating certain SCC scenarios where harmful films develop on the metal surface [21]. The most significant advantage of SMM is its ability to predict the corrosion penetration rate at any temperature. In their study, Vogt and Speidel [22] discovered that only a limited number of mechanisms could be subjected to experimental testing, with SMM being one of them. The most noteworthy contribution of SMM has been to emphasise the importance of adhering to the first principles of the SCC mechanism and considering factors like temperature, composition of the environment, and stress.
In evaluating the SCC, it is crucial to analyse the amount of acidic condensations and how much stress is applied to the structure. There are several parameters that affect the SCC, and some examples of the parameters are as follows: stress, type of acid, concentration of the acid condensate, and temperature. However, analysing the SCC of hot blast stoves is not simple since the fluid–structure interaction analysis is complex and computationally expensive, especially for enormous structures. In addition, the computational fluid dynamics (CFD) and finite element analysis (FEA) models are complicated. Due to these circumstances, an evaluation of the SCC with both CFD and FEA was barely conducted. Table 1 shows the literature that analysed the SCC with numerical analyses.
In this study, the surface mobility mechanism was adopted to predict the crack propagation rate (CPR) of the SCC on the hot blast stove. The water, nitric, and sulfuric acid condensation rates were predicted theoretically based on a CFD model of the hot blast stove. The thermo-mechanical stresses of the metallic shell were calculated utilising FEA. The effect of the concentration of acidic condensates was considered through the weight value concept, composed of the condensation rates of water, nitric, and sulfuric acids. The vulnerable points of the HBS were analysed from the point of view of the stress corrosion cracking. The influence of the blast temperature, one of the major operation parameters of the HBS, on the CPR was analysed with an increase in the blast temperature by 45 K and 90 K. The SCC calculation method combined with the CFD and FEA models presented in this paper can provide a fresh approach to evaluating the safety of hot blast stoves and similar applications such as heat exchangers, pressure vessels, and boilers.

2. Numerical Modelling

A numerical model was developed to calculate the SCC growth rate regarding the condensation of water and acid while operating the internal combustion hot blast stove. The effect of the acid condensation was taken into account as a weight factor to calculate the SCC growth rate. In this study, the primary focus was on investigating the SCC growth rate, while the computational fluid dynamics and thermal stress analysis models are not described in depth in this paper since these models were thoroughly documented in the authors’ previous publication [28]. A brief description of the computational fluid dynamics model for the hot blast stove is described in Appendix A. The layout of the utilised hot blast stove is depicted in Figure 1, which is the same HBS depicted in the authors’ previous publication.

2.1. SCC Growth Model

In SMM, the crack propagation velocity ( V p ) is given by Equation (1) [19]:
V p = D s L exp σ a 3 k T 1
where  D s  is the self-diffusion coefficient, L is the diffusion distance of the cation vacancies typically set as  10 8  m, a is the atomic diameter,  σ  is the stress, and k is the Boltzmann constant. Estimating the self-diffusion coefficient precisely is rather challenging, but it can be approximated using two Arrhenius terms. The dependence of each of them relies on the ratio of the melting temperature  T m  to the surface temperature T as the following equation:
D s = 740 × 10 4 exp 30 T m R T + 0.014 × 10 4 exp 13 T m R T .
AISI 420 stainless steel was utilised as the shell material of the HBS adopted in this study. The SCC depends on the acid concentration during the operation of the HBS. The following sections describe how the theoretical acid and water condensation rates were calculated to consider the effect of the acid concentration on the crack propagation velocity.

2.2. Theoretical Corrosion Rate

In the theoretical model, followed by the modelling used in the work by Jeong and Levy [29], the analysis takes into account both the transfer of mass between water and acid vapour and the transfer of heat from the flue gas to the metallic shell. A fixed region that includes the flue gas and the metallic shell is the control volume to derive the governing equations for the condensation rate. The metallic shell was assumed to have a smooth wall. Within this control volume, the transfer of heat and mass for the condensation of water, nitric, and sulfuric acids is taken into account. The numerical analysis procedure implemented to predict the acid corrosion rate was subdivided into three different parts:
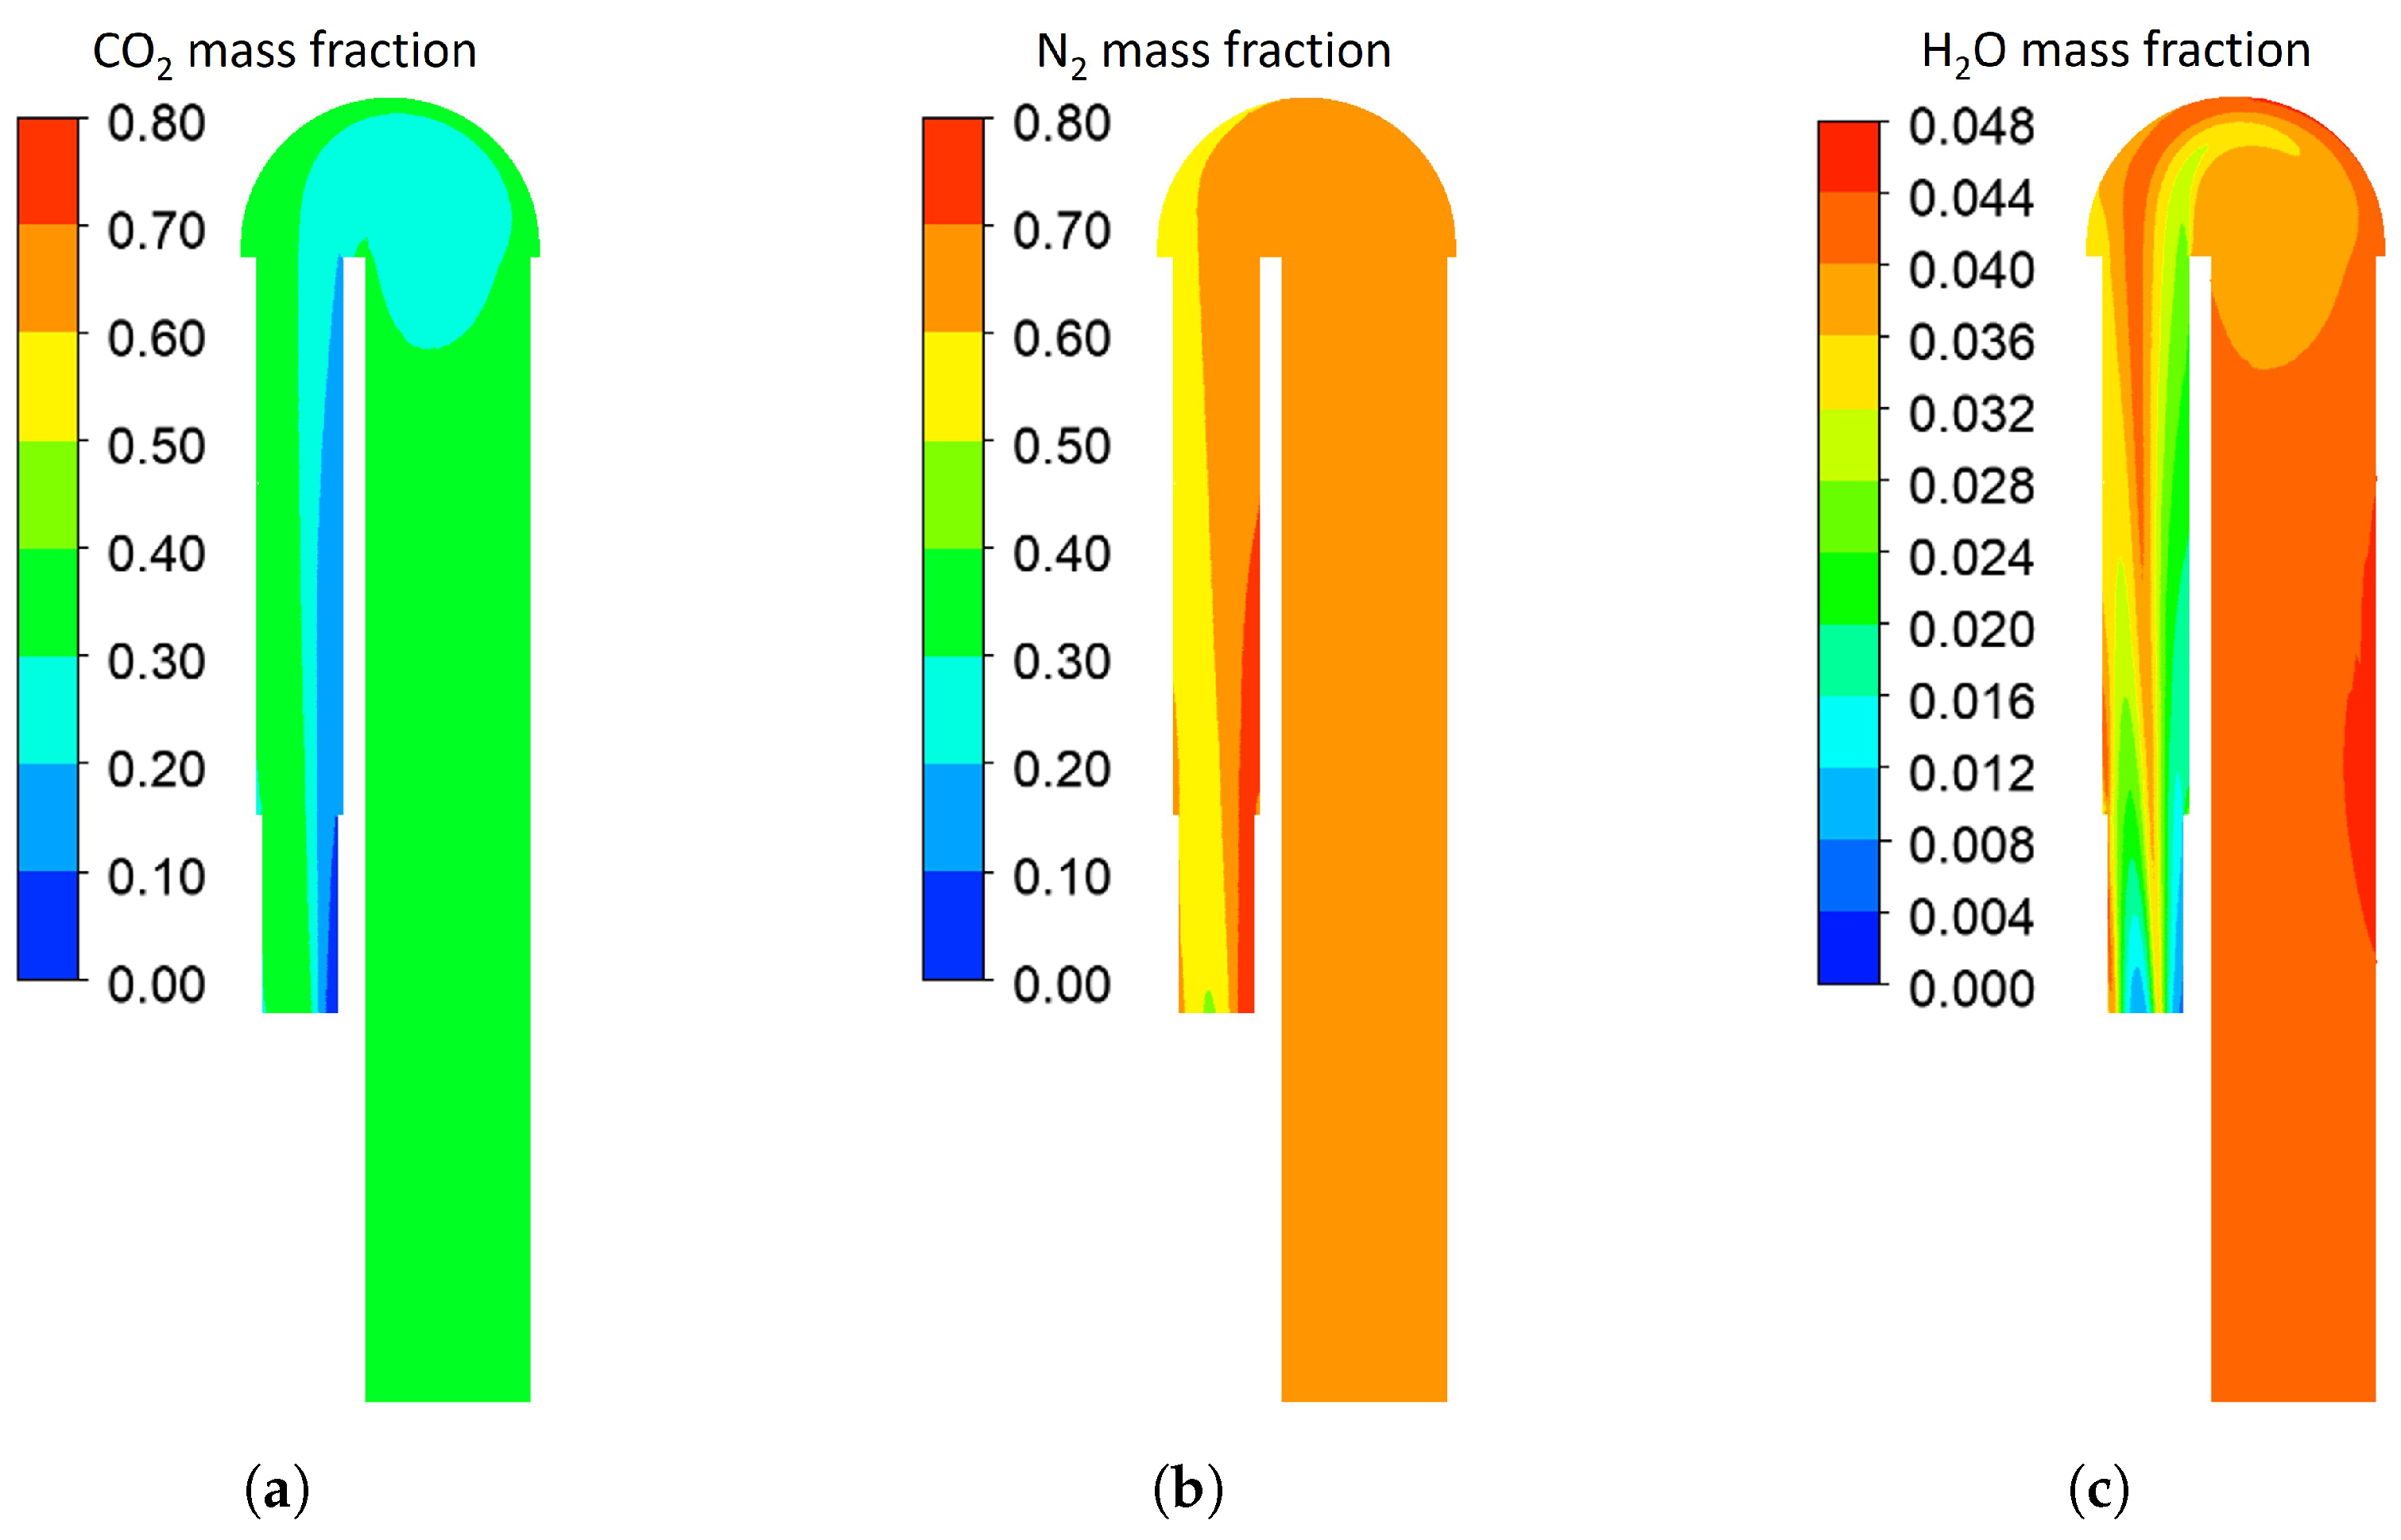
  • In the first part, based on the assumed mixed concentration (300 ppm) of NOx and SOx, the NO2 and SO3, which would cause the formation of HNO3 and H2SO4, were estimated as a function of the flue gas temperature employed by the function by Olsen et al. [30] and Fleig et al. [31]. The initial concentration of sulfur trioxide, nitrogen dioxide, and water in the flue gas for the reference blast temperature is described in Table 2.
  • The temperature difference between the shell and the flue gas was calculated based on the simulation results presented in the authors’ previously published paper [28]. The reaction mechanisms for sulfuric and nitric acids that are considered in the CFD analysis are listed in Table 3.
  • The acid distribution was calculated using the controlled condensation method to determine the SCC propagation rate.

2.2.1. Theoretical Water Condensation Rate

A direct relationship between the mass transfer coefficient of water, represented by  k H 2 O , and the concentration difference between the bulk flow and the interface is often used to estimate the water vapour condensation rate. The water vapour condensation rate  m ˙ cd , H 2 O  is calculated by the following ordinary differential equation:
d m ˙ cd , H 2 O = k H 2 O ( y H 2 O y i ) d A
where  y H 2 O  and  y i  are the mole fractions of the water vapour in the flue gas and at the interface, respectively, and A is the heat transfer area. By employing the Lewis relation, the mass diffusion of water and heat transfer were correlated, leading to the calculation of the mass transfer coefficient of the water,  k H 2 O . The mass transfer coefficient of the water is calculated as follows:
k H 2 O = h g M H 2 O C p , g M g y lm Le H 2 O - gas 2 / 3
where  h g  is the heat transfer coefficient of the wet flue gas side,  M H 2 O  and  M g  are the molecular weights of the water and the wet flue gas, respectively,  C p , g  is the specific heat of wet flue gas,  y lm  is the log-mean mole fraction difference of non-condensable gas, and  Le H 2 O - gas  is the Lewis number of the water vapour in the wet flue gas.  y lm  is expressed as the following Equation (5):
y lm = y ni y nb ln ( y ni y nb )
where  y ni  and  y nb  are the mole fractions of non-condensable gas at the interface and bulk flow, respectively. The convective heat transfer was estimated with the analytic adiabatic Y-plus method [32]. The Lewis number of the water vapour in the wet flue gas  Le H 2 O - gas  is expressed as Equation (6):
Le H 2 O - gas = α g D H 2 O - gas
where  D H 2 O - gas  is the mass diffusivity of the water vapour in the wet flue gas, and  α g  is the thermal diffusivity of the wet flue gas. Typically, the Lewis number for gases has the order of unity. From the given statement, it can be concluded that changes in the structural and thermal profiles occur at similar rates in flue gases that experience both heat transfer and mass diffusion processes simultaneously. Thus, it is possible to estimate mass diffusivity by utilising the following equation based on other properties:
D H 2 O - gas = α g α air D H 2 O - air .
where  α air  is the thermal diffusivity of air, and  D H 2 O - air  is the mass diffusivity of the water vapour in the air.
A vapour pressure equation based on the Antoine equation, which explains the correlation between vapour pressure and temperature of pure components, was used to determine the interfacial mole fraction of water vapour. The Antoine equation is described as follows [33]:
y i , H 2 O = exp 16.262 3799.89 / ( T i + 226.35 ) P tot
where  T i  is the interfacial temperature in °C, and  P tot  is the total pressure of the flue gas in kPa.

2.2.2. Theoretical Acid Condensation Rate

Equation (9) provides the derivation of the mass transfer coefficient for acid condensation.
k acid = h g M acid C p , g M g y l m Le acid-gas 2 / 3
where  M acid  is the molecular weight of the acid, and  L e acid-gas  is the Lewis number of the acid in the wet flue gas. Note that the non-condensable gas fraction contains the water vapour mole fraction until the point of water vapour condensation. As described in the previous section, two kinds of acids, sulfuric and nitric acids, were considered in this study. The sulfuric and nitric acids dew points were calculated based on the correlations from Verhoff and Banchero [34] and Kiang [35], respectively, as follows:
y i , H 2 SO 4 = exp 1 / T dew , H 2 SO 4 2.276 × 10 3 + 2.943 × 10 5 ln P H 2 O 6.2 × 10 6 ln P H 2 O 8.58 × 10 5 / P tot
y i , HNO 3 = exp 1 / T dew , HNO 3 3.6614 × 10 3 + 1.446 × 10 4 ln P H 2 O 7.56 × 10 6 ln P H 2 O 8.27 × 10 5 / P tot
where the subscripts H2SO4 and HNO3 denote sulfuric and nitric acids, respectively,  T dew  is the dew point temperature of the acids in K,  P H 2 O  and  P acid  are partial pressures of water vapour and each acid in mmHg, respectively. By inverting the equations mentioned above, one can obtain an expression for the acid mole fraction at the interface, denoted by  y i , acid , based on the interfacial temperature  T i , H 2 O  and the partial pressure  P i , H 2 O  of the water vapour. The mole fraction at the interface of each acid is expressed as follows:
1000 T dew , H 2 SO 4 = 2.276 2.943 × 10 2 ln P H 2 O 8.58 × 10 2 ln P H 2 SO 4 + 6.2 × 10 3 ln P H 2 O ln P H 2 SO 4
1000 T dew , HNO 3 = 3.6614 1.446 × 10 1 ln P H 2 O 8.27 × 10 2 ln P HNO 3 + 7.56 × 10 3 ln P H 2 O ln P HNO 3
where  y i , acid  is the mole fraction of each acid in %vol wet,  T i , H 2 O  is in K, and  P i , H 2 O  and  P tot  are in mmHg.
It is important to note that, until water vapour starts condensing, its mole fraction is considered part of the non-condensable gas fraction. The Lewis number of the acid for the wet flue gas can be expressed as follows:
Le acid-gas = α g D acid-gas
where  D acid-gas  is the mass diffusivity of the acid for the wet flue gas. The fact that the order of the Lewis number of the gas is unity also can be applied to the wet flue gases with acids. It makes it possible for the mass diffusivity of the acid for the wet flue gas to be expressed as the following equation similar to the water vapour:
D acid-gas = α g α air D acid-air
where  D acid-air  is the mass diffusivity of the acid in the air. The mass diffusivities of sulfuric and nitric acids in the air are expressed as the following Equations [36]:
D H 2 SO 4 acid-gas = 5.0032 × 10 6 + 1.04 × 10 8 T + 1.64 × 10 11 T 2 1.566 × 10 14 T 3
D H NO 3 acid-gas = 5.309 × 10 7 + 1.01 × 10 8 T + 2.128 × 10 11 T 2 2.045 × 10 14 T 3
where T is in K and  D acid-air  is in m 2 /s. The thermal diffusivity is the same for every species in the same medium, but the mass diffusivity varies. The Lewis number calculated for acids is higher than that of water vapour, indicating that acids have greater diffusive activity thermally than in mass diffusion. The condensation rate of the sulfuric acid can be calculated by integrating the following ordinary differential equation:
d m ˙ c d , acid = k m , acid ( y acid y i , acid ) d A
where  d m ˙ cd , acid  is the sulfuric acid condensation rate, and  k acid  is the mass transfer coefficient of sulfuric acid. The mole fractions of each acid in the flue gas and at the interface are represented by the parameters  y acid  and  y i , acid , respectively.

2.2.3. Numerical Calculation of Condensation Rates

MATLAB R2022a was utilised to determine the onset of the mass transfer and its rate for each node of the metallic shell. The variables already calculated from CFD analyses in the control volume were the gas temperature, gas flow rate, shell temperature, and gas mole fractions of water and acid vapours. The gas mole fractions were determined by functions of the temperature increased as a variable obtained from Valencia [36], and for the variable characteristics by temperature, the temperature variable calculated of initial mole fraction of NO2 and SO3 in NOx and SOx as 300 ppm. Since some variables were used in the fin heater exchanger of boilers, the result should be regarded as an approximation. To verify the accuracy, according to the data of temperature profile and acid condensation profile obtained from Valencia [36], the relationship of temperature with nitric acid condensation and the discrepancy ranged from 2% to 9%. The reason for this difference is that the value of the specific heat of the wet flue gas side in this study was used as an average value because the actual data of the HBS are unknown, and the acid condensation was provided with the same characteristics as both studies were studied as flue gas condensate at metallic shell surface. The hypothesis can be represented by the actual condensation behaviour of pipework instruments similar to hot blast stoves in the literature [29,36]. Therefore, since the condensation rate was successfully predicted by CFD analysis in the study where we established the hypothesis, we considered that the model could represent the trend of the condensation behaviour of hot blast stoves.

2.3. Calculation of the Phenomenological Relationship of SCC

The acid corrosion rates were measured considering the function of the data function of temperature and the condensation rates. In the end, some factors of the equation were added as the weights by employing the AHP. In any event, its most important contribution would have been to show that the SCC mechanism should start from the first principles employed by the SMM. Therefore, as an auxiliary variable, the corrosion rate is calculated by considering the water condensation rate, acid condensation rate, and the corrosion rate of concentration. The definition of acid concentration is to divide the acid condensation rate by the water condensation rate. Using the data applied by Prando et al. [37], corrosion rate values for H2SO4 and HNO3 could be calculated with temperature. In the end, the non-dimensional processing is based on the maximum value. The analytical hierarchy method was employed to calculate the weight of the corrosion rate. The setting of the hierarchical structure is to measure the nitride condensation rate  d m ˙ HN O 3  and sulfide condensation rate  d m ˙ H 2 S O 4 . The weight w of the corrosion rate could be estimated as the following equation:
w = d m ˙ HNO 3 + d m ˙ H 2 SO 4 d m ˙ H 2 O .
The weight value becomes zero if there is no acid condensation at the interface, meaning no corrosion occurs, and there will be no SCC. The weight value becomes unity if the sum of the acid condensation rate is the same as the water condensation rate, which means there will be the highest possibility of corrosion. Therefore, the crack propagation rate (CPR) in this study, considering the acid condensation rate, is written as follows:
CPR = w D s L exp σ a 3 k T 1 .

2.4. Operation Condition of the HBS

The HBS operation is classified into two periods: on-gas and on-blast. During the on-gas period, the combustion chamber receives air and fuel gas, which results in the production of flue gas. The heat from the flue gas is stored in the check bricks, and the gas is then exhausted through the flue gas outlet. During the on-blast period, cold air is drawn in through a cold air inlet and then absorbs heat from the checker bricks to produce the hot blast. The on-gas and on-blast periods were set as 80 and 100 min, respectively. The reference blast temperature was found to be 1345 K, which is the area-weighted average temperature at the hot blast outlet. The mass fraction of the fuel gas for the reference blast temperature is represented in Table 4. The excess air ratio for the combustion was 1.18. The analyses for the increase in the blast temperature for 45 K and 90 K were conducted by raising the coke oven gas ratio by 4% and 9%, respectively.

3. Results and Discussion

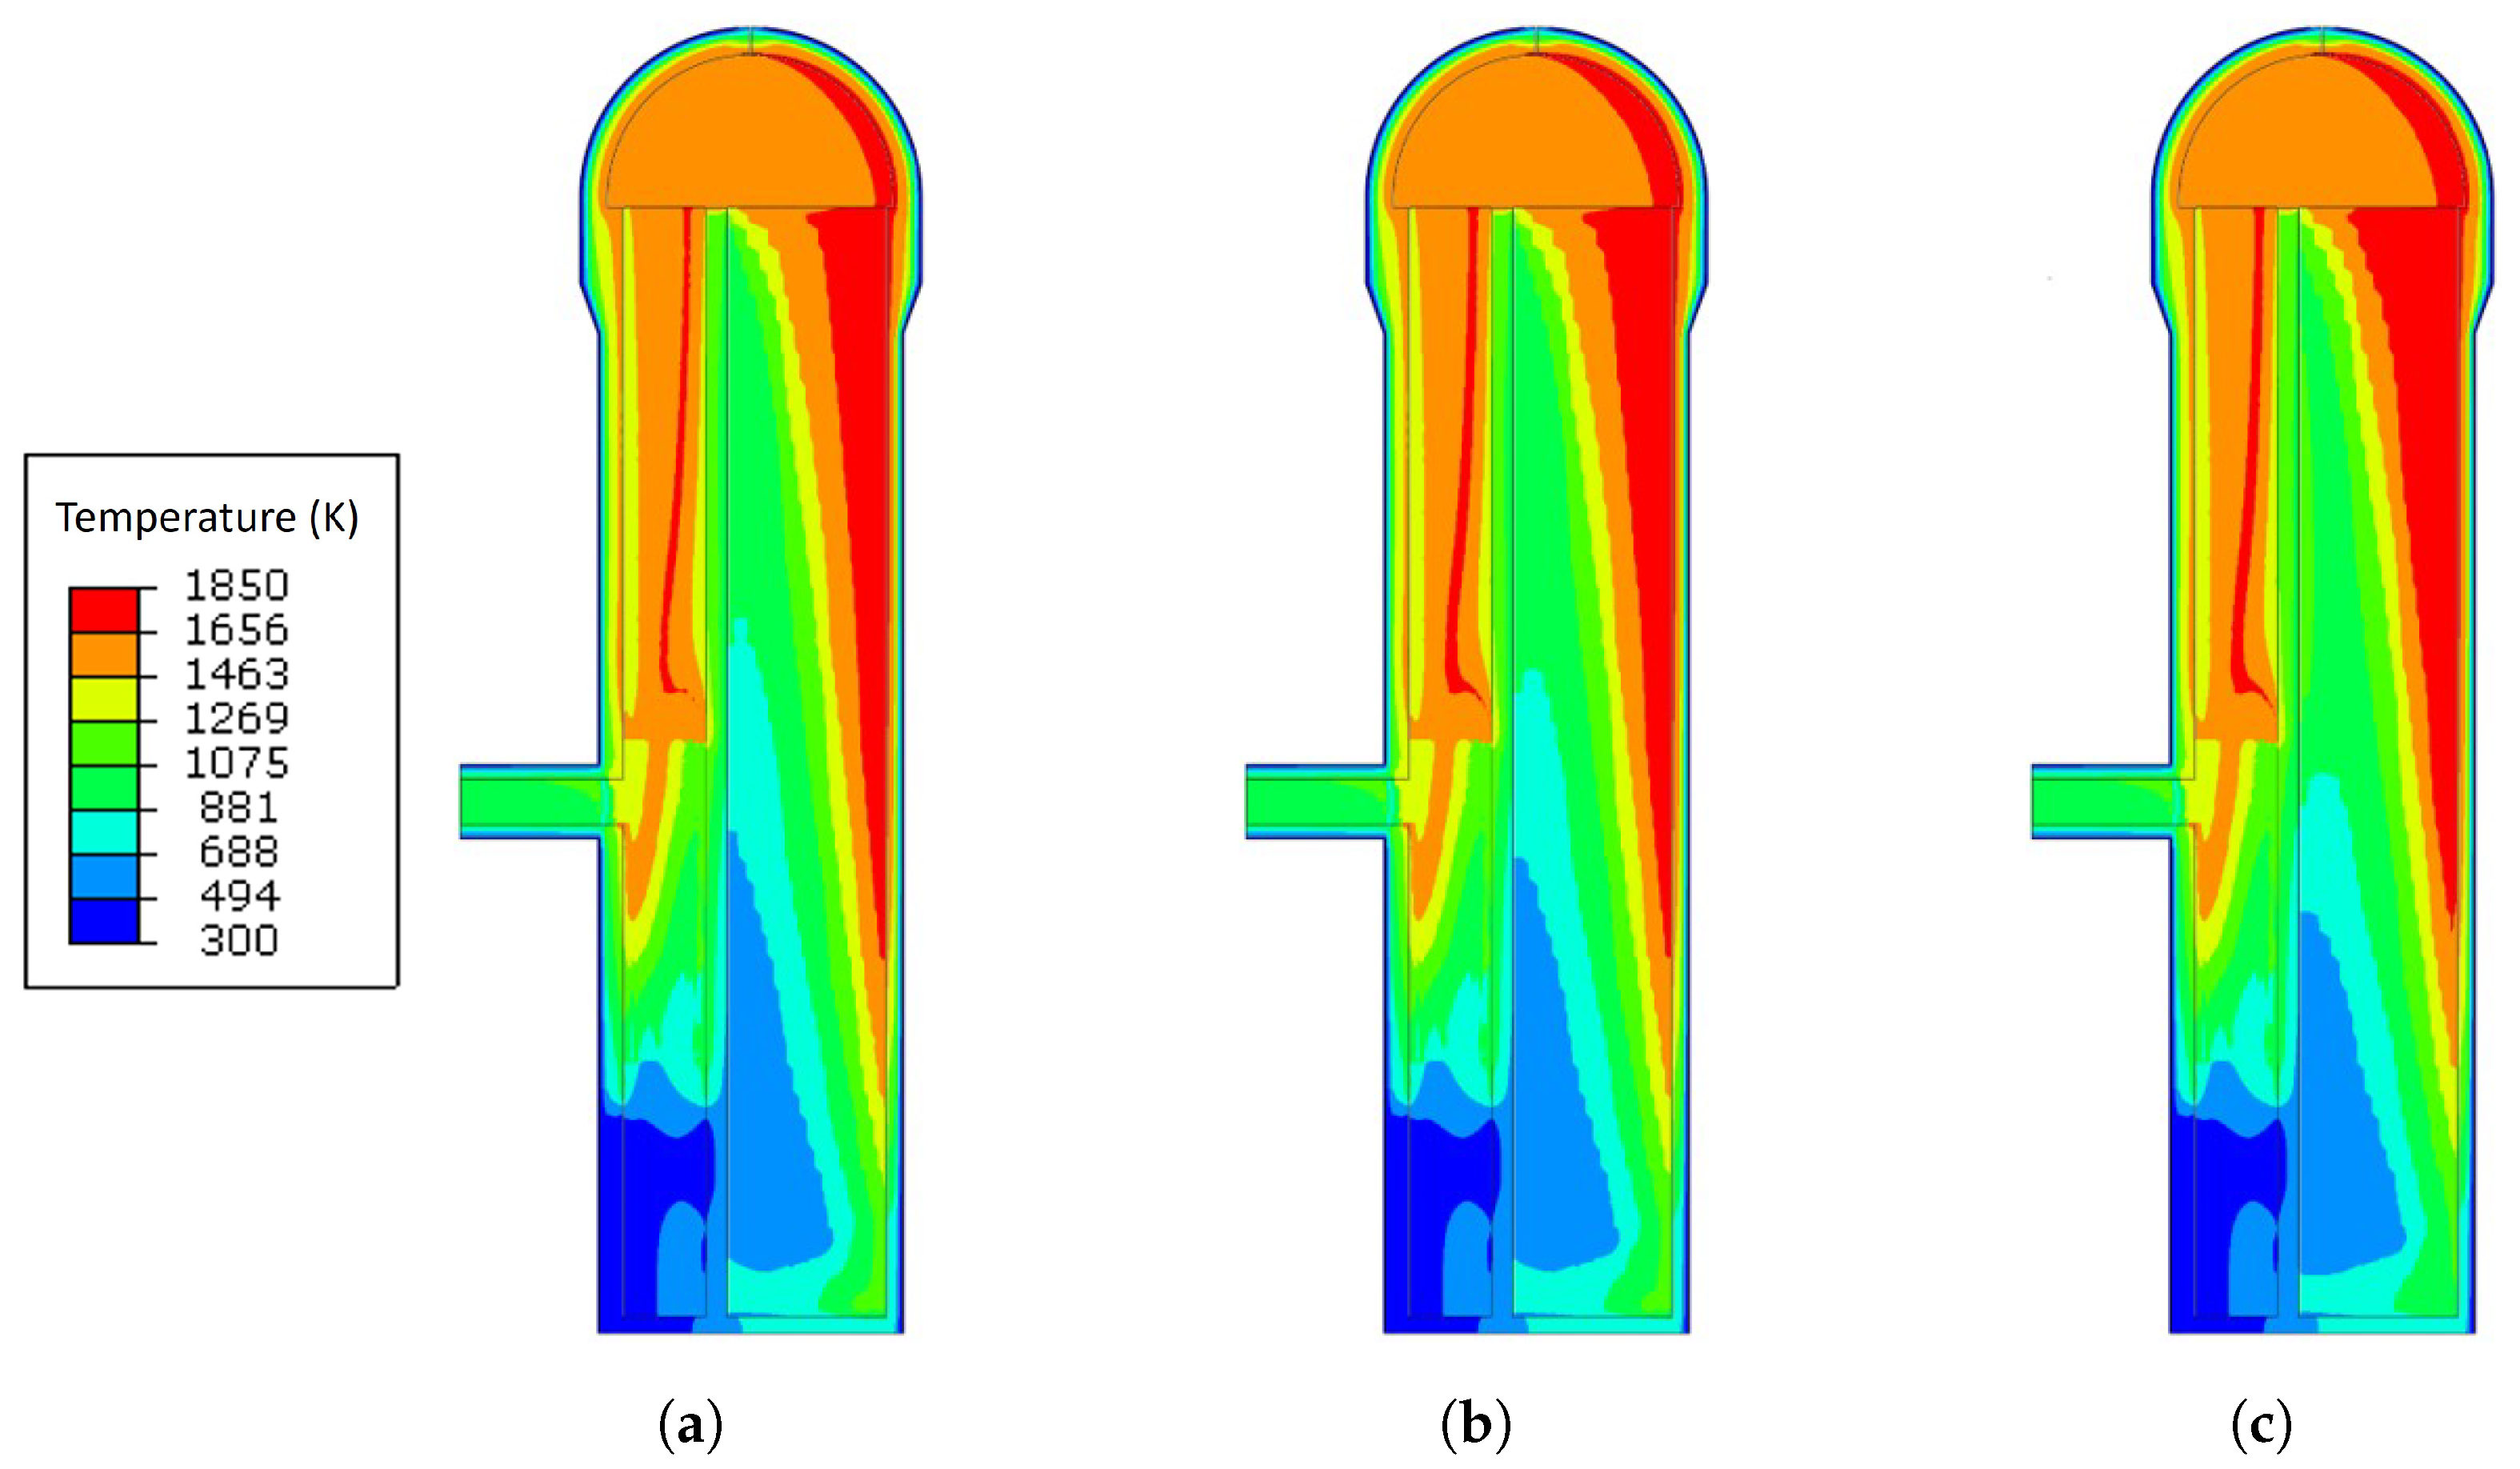
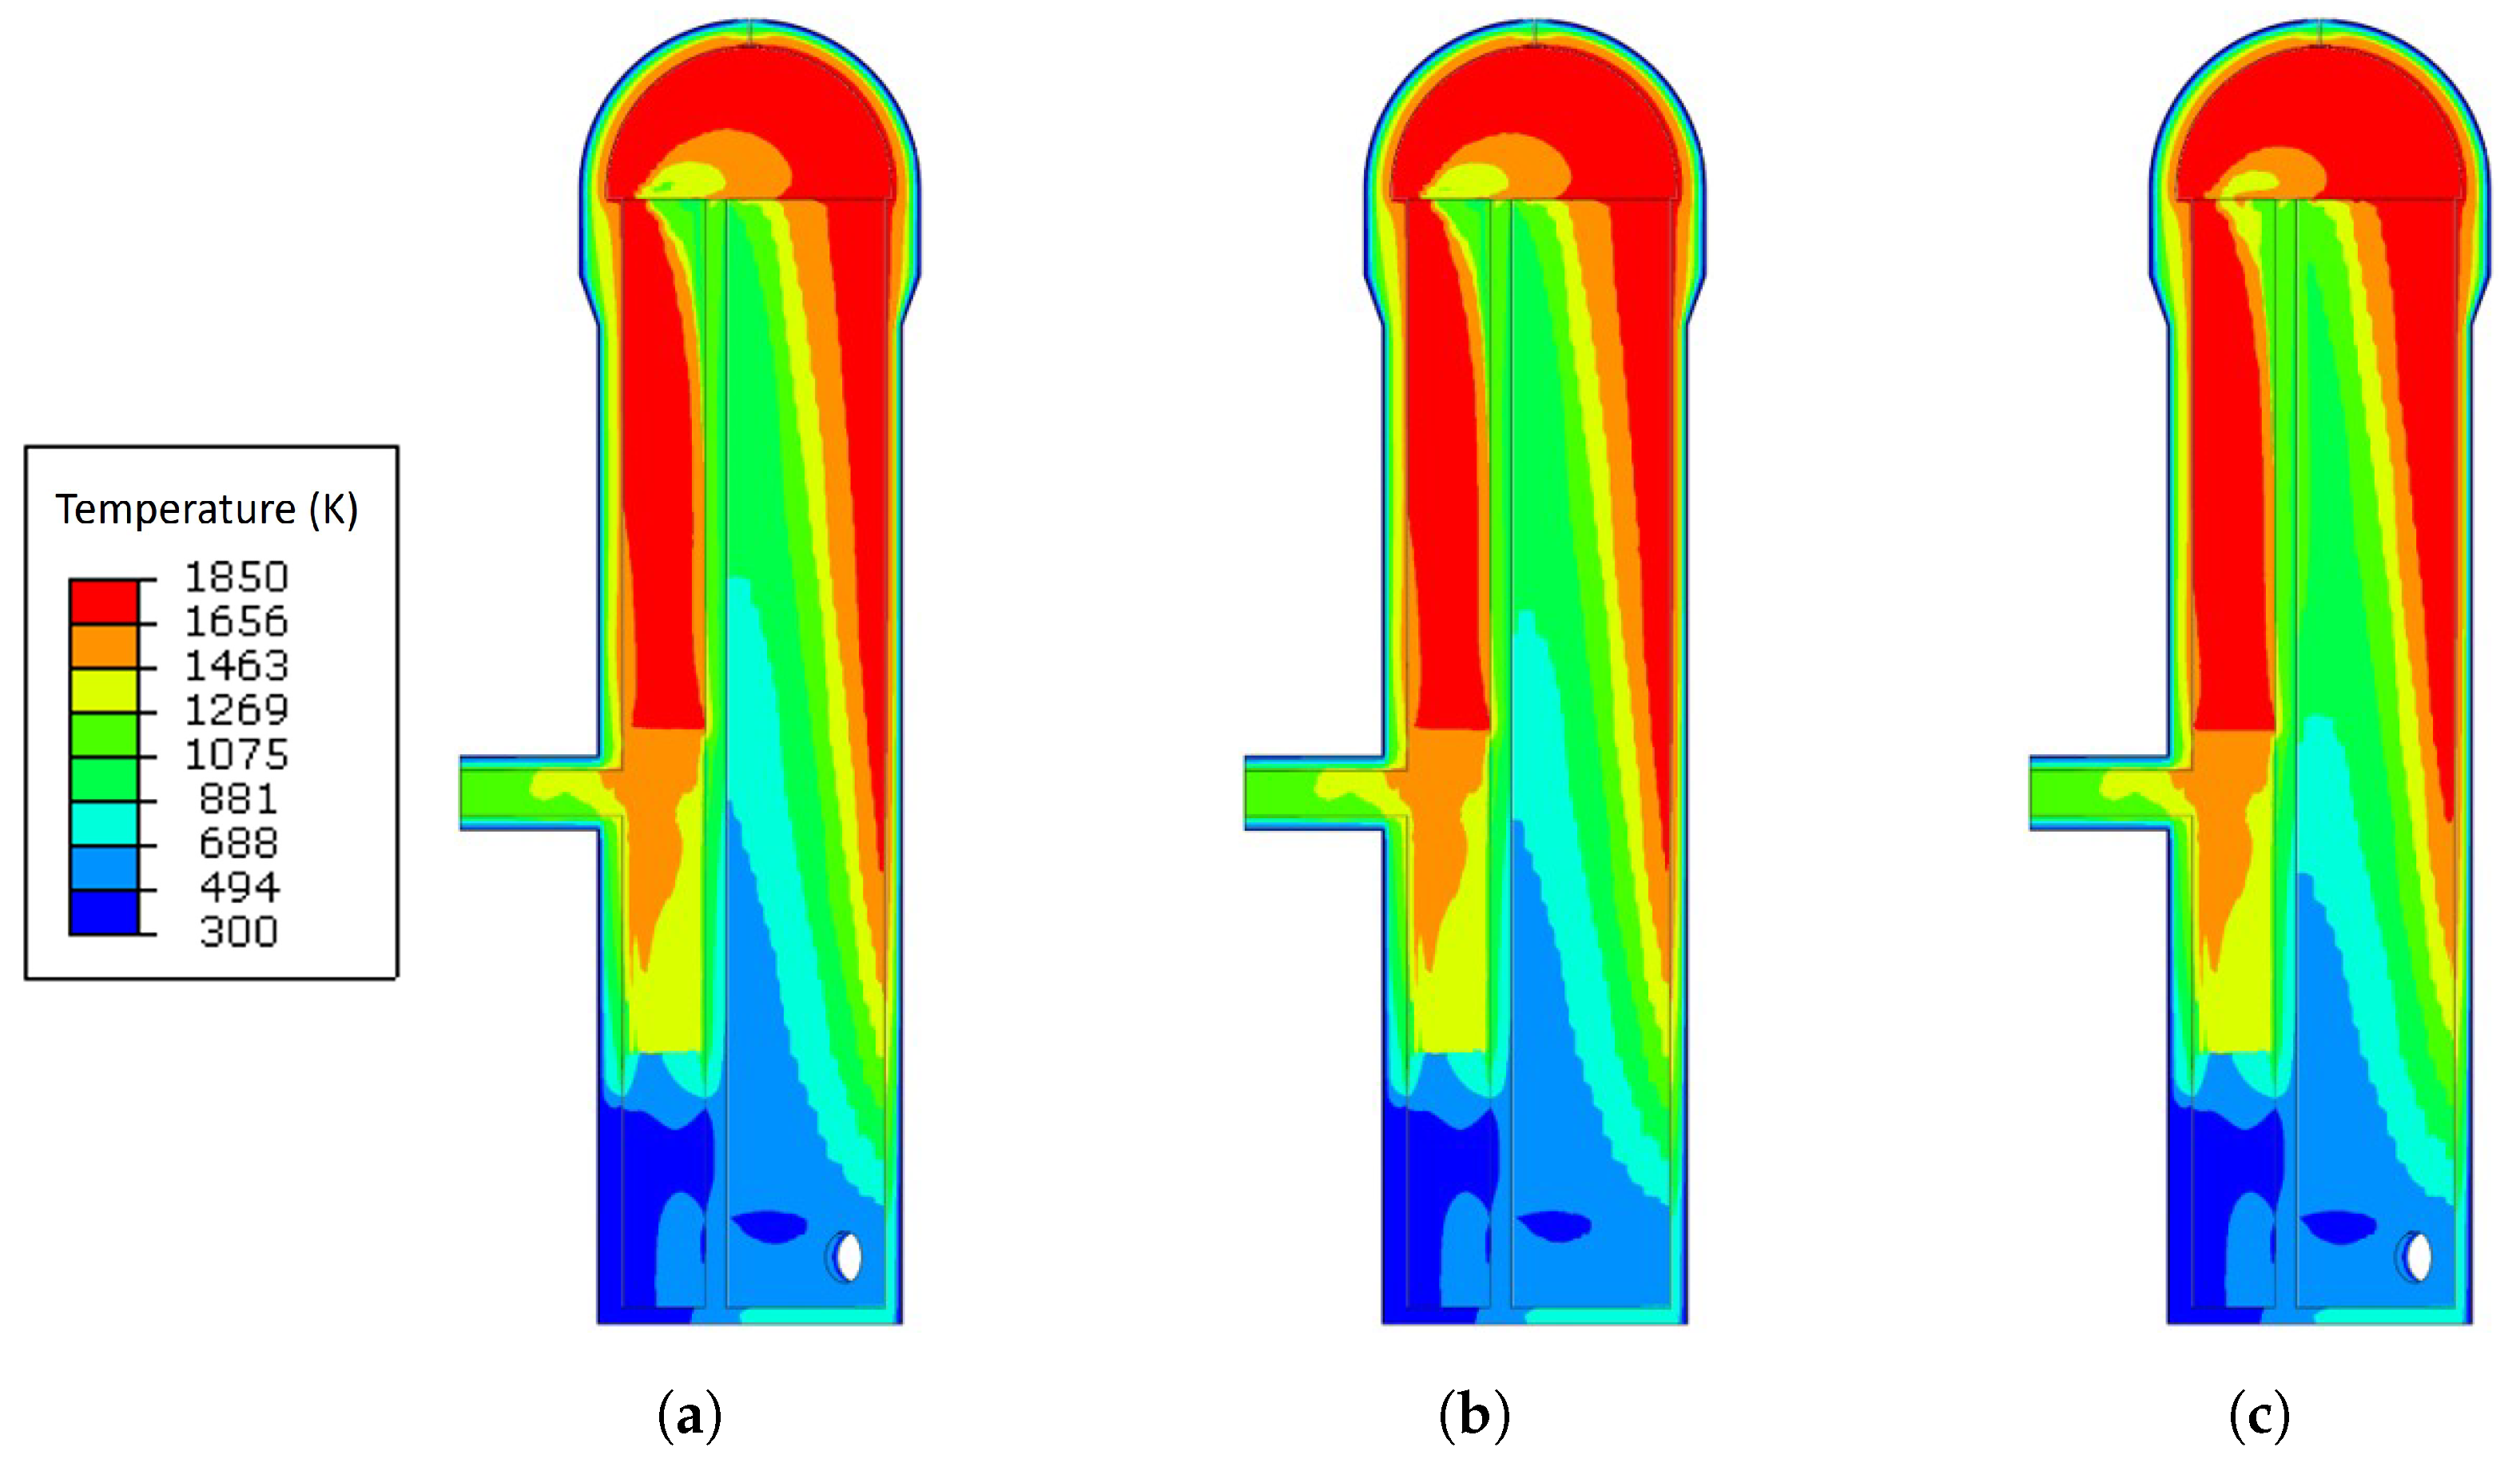
3.1. Temperature Analysis Results with Different Blast Temperatures

The temperature distributions in accordance with the increase in the blast temperature are described in Figure 2 and Figure 3. The temperature and stress calculation results for the reference blast temperature can be found in the authors’ previous publication [28]. Figure 2 shows the temperature distributions at  t = 40  min, at the midpoint of the on-gas period. Figure 2a shows the temperature distribution for the reference blast temperature. Figure 2b,c depict the temperature distribution for the blast temperature increased by 45 K and 90 K from the reference blast temperature, respectively. Figure 3 shows the temperature distribution at  t = 130  min, at the midpoint of the on-blast period. Figure 3a shows the temperature distribution for the reference blast temperature, and Figure 3b,c depict the distribution for the blast temperature increased by 45 K and 90 K from the reference blast temperature, respectively. When the blast temperature increased, the high-temperature region on the right-top side of the checker chamber expanded towards the separation wall in the on-gas period. The region near the ground level in the check chamber showed a similar temperature distribution, although the blast temperature increased. The temperature distribution in the combustion chamber remained similar as the blast temperature increased in the on-gas period. The temperature distribution in the dome also remained similar. The considerable difference in the temperature distribution between the on-gas and on-blast periods is shown from the dome and the combustion chamber. The high-temperature region in the dome was limited to the right side in the on-gas period. However, it expanded to most domains of the top region in the on-blast period. Moreover, combustion chamber temperature increased in most regions since the high-temperature blast passed through the hot blast outlet in the on-blast period. The change in the temperature field of the checker chamber showed a similar tendency to the one in the on-gas period when the blast temperature increased in the on-blast period. The high-temperature regions in the dome and the combustion chamber widened when the blast temperature increased in the on-blast period.
The maximum temperature was found to be 1847 K in the on-gas period. However, the top combustion HBS has a maximum temperature of around 1600 K [38]. Since the internal combustion HBS was developed earlier compared to the top combustion HBS, the internal combustion HBS has several demerits over the top combustion HBS. The internal combustion HBS has a higher maximum temperature than the top combustion HBS when they have the same blast temperature. Moreover, the temperature distribution is more uneven in the internal combustion HBS. As shown in Figure 2 and Figure 3, the higher temperature regions are distributed at the outer side of the checker chamber. However, the top combustion HBS shows a more even temperature distribution through the checker chamber.
Figure 4 shows the temperature distribution of the shell at  t = 130  min, which is at the midpoint of the on-blast period. Figure 4 shows that the temperature distribution of the shell changed slightly since the hot blast stove structure had a high heat capacity. The maximum change in the shell temperature was 5.2 K when the blast temperature was increased by 90 K, which means that the shell temperature barely changed even though the blast temperature increased.

3.2. Crack Propagation Velocity Prediction Results from SCC SMM

In the cases of HBSs, the apparent chemical composition could be more complex. The internal space of the HBS experiences a significant rate of NO2 formation when the temperature falls below 650 °C. On the metallic shell of the stove, the coldest area is where the formation of NO2 is most apparent. During the on-blast period, the temperature of the metallic shell may readily fall below the water dew point. Consequently, NO2 will dissolve in the water and undergo a reaction to form nitric acid. According to Blekkenhorst et al. [39], the nitric acid formation, combined with the dissolution of various compounds from the insulation material, results in an acidic condensate that produces a nitrate solution, which is responsible for the SCC of the stove shell.The brick layer in the HBS can result in the production of a calcium nitrate solution as a byproduct. The presence of sulfates in the deposits may lead to the condensation of sulfuric acid inside of the refractory linings near the gas side. In regions close to the shell with low temperatures, NO2 can either liquefy in the water that has condensed below the dew point or be converted into nitric acid and condense below the dew point. Ammonium and nitrate ions were detected in the condensed liquid, despite the absence of ammonium ions or ammonia in the gas [40]. Therefore, the chemical composition of acidic condensation and their melting temperature were reviewed in the table in the appendix, and the target melting temperature to use in the SMM was estimated at 770.8 °C.
Figure 5 shows the maximum principal stress field and crack propagation velocity  V p  caused by the temperature and maximum principal stress for the reference blast temperature. The crack propagation velocity is the average value through an operation cycle. The duration of the operation cycle is 180 min. The regions at which crack propagation velocity based on the original SCC SMM was expected to be the largest are the conical region of the upper combustion chamber and part of the hot blast outlet. The reason for this could be summarised as follows: the conical part of the upper combustion chamber was caused by the high temperature; the part of the hot blast outlet caused the maximum principal stress. In addition, this distribution means that the performance of characteristics of the SCC SMM are caused by temperature and stress. Meanwhile, these results could be used to evaluate some simple cases in the situation of acid concentration distributed evenly.

3.3. Prediction Results Combined with Acid Corrosion Rates

When the on-blast period begins and the HBS is pressurised, NO diffuses towards the metallic shell through the refractory linings. As the on-blast period continues, the concentration of NO reduces due to the oxidation of NO2. Moreover, NO2 diffuses back into the combustion chamber, contributing to the reduction in NO concentration. At the start of the next on-blast period, the concentration of NO2 increases due to the higher NO concentration and the subsequent increase in pressure resulting from the reaction. It is worth noting that, according to the reaction mechanisms for obtaining sulfuric and nitric acid, one mole of SO3 could lead to the formation of one mole of H2SO4. Meanwhile, one mole of NO2 could cause two moles of HNO3.
It can be seen in Figure 6 that the condensation of water, sulfuric, and nitric acids occurred at the bottom of the burner under the hot blast outlet for the reference blast temperature. Meanwhile, H2O and H2SO4 would condense at the conical part where the low-temperature region occurred. However, HNO3 would not expect a higher dew point at the upper region of the combustion chamber. The average surface temperature difference ranged from 20 °C to 50 °C. The binary system of nitric acid/water and sulfuric acid/water had dew points of 56 °C and 115 °C, respectively. Additionally, as previously stated, the condensation of acids leads to the corrosion of materials. The aim of this study was to predict this corrosion by conducting parametric studies on the condensation that occurred.
As mentioned above, the corrosion rate of the material is not only due to metallic material by the parameter of mass transfer coefficient of the interface but also depends on the environmental components present in the flue gas condensate. Therefore, in this study, the main variable parameters were the material and surface temperature, and the corrosion rate was considered as a function of the acid’s mass fraction and the temperature. Furthermore, once the location of the condensation region and the mass composition of the components in the target condensate are determined, the corrosion rate can be calculated using the diagrams developed by Blekkenhorst et al. [39] and Harp et al. [40]. The weight distribution showed the acid corrosion rates caused by the condensation, as shown in Figure 6d.
Figure 7 shows the comparison of crack propagation rate for the reference blast temperature while not considering the weight and considering the weight factor. By combining the weight, a high region disturbed at the hot blast outlet was affected throughout the operation by high temperature (above 400 K), where acid condensation should not exist. For the same reason, the crack propagation rate disturbed at the upper checker chamber decreased. Similarly, another important thing, as shown in the conical part between the checker chamber and the combustion chamber, was influenced by two main reasons: (i) thermal stress caused by the high temperature and (ii) acid condensation caused by the low temperature.
Figure 8 shows the crack propagation rate results according to the rise in the blast temperature deviation with the reference case, increased 45 K case, increased 90 K case, and the maximum crack propagation rate-raising tendency. The maximum value of the crack propagation rate for the reference blast temperature was  7.61 × 10 7  m/cycle. When the blast temperature increased by 90 K, the maximum value of the crack propagation rate compared to the reference case increased by about  1.27 × 10 7  m/cycle as 16.7%, and there was a tendency to show large CPR due to the high temperature. Figure 9 shows the maximum principal stress distribution of the shell on the conical part along the circumferential direction. It shows that the maximum principal stress did not change comparably even when the blast temperature increased by 90 K. A notable thing is that the crack propagation rate was increased. In contrast, there was no remarkable change in the maximum principal stress. Moreover, although the acid condensation value would be decreased, the SCC characteristics of increased temperature and the increased thermal stresses caused the CPR to have a much higher tendency. In addition, the tendency became lower compared with the cases of an increase of 45 K and 90 K.

3.4. Discussion

The characteristics of SCC change significantly depending on temperature and acid condensation. It is worth noting that, as the temperature increases, the CPR increases, from which it can be found that the damage expands as the temperature changes. Furthermore, acid condensation can lead to low-temperature corrosion (LTC) that can pose a safety threat. The model presented in this study aims to predict the stress corrosion cracking (SCC) growth rates, which can cause significant safety and economic issues due to their generality and severity. Additionally, the model predicts the distribution of these growth rates. Surface mobility mechanisms showed that an SCC mechanism should abide by first principles and account for the most appropriate variables, like temperature, environment composition, and stress.
Therefore, based on this fundamental characteristic, this paper aimed to study the characteristics of the SMM under operating conditions and added some impact factors to improve the performance of convenient and relatively accurate predictions. Considering that the method in this study is proposed to study the growth of cracks initiated from mechanical stress-caused notch, this indicates the possibility that the proposed CPR prediction procedure has very high accuracy and can be widely used in practical prediction applications under harsh and extreme operating conditions.
Similarly, even though the tendency of the CPR to increase the higher temperature is the same as the specimen experiment tendency, some more detailed results should be considered by adding more operation conditions to set up a series of operation rules. The analysis results can provide insight into limiting the region to be inspected and monitored in the HBSs.
In all cases analysed in this study, the probability of showing the SCC is higher in the conical region. An and Park [41] reported that the SCC occurred in the weld line of the combustion chamber of the external combustion HBS. From their study, it was found that the SCC occurred from the nitric and sulfuric acids with the residual stress in the heat-affected zone of the weld line. Even the residual stress from welding was not considered in this study; the thermo-mechanical stress can also initiate the SCC with the acidic condensates in the internal-combustion HBS. Therefore, monitoring the weld lines around the conical region of the internal-combustion HBS can be important from the safety management point of view.
The general relationship with the temperature was considered to fill the gap in the prediction of SCC considering the acid corrosion characteristics. However, some more detailed conditions should be added to reduce the discrepancy. Meanwhile, the study of the phenomenological relationship of SCC process variables that affect SCC characteristics by significantly changing the variables is also in great demand for the future.

4. Conclusions

In this study, the stress corrosion cracking behaviour of the internal combustion hot blast stove was analysed. The SCC SMM was modified to transform from a theoretical prediction of the stress corrosion crack in industrial problems. The weight calculated based on the water and acid condensation rates was applied to the crack propagation rate equation to consider the effect of the corrosion. By applying the fluid temperature and mapping to the shell temperature, the low-temperature corrosion (LTC) characteristics of condensed acid and the stress corrosion cracking in the metallic shell of the hot blast stoves while under operation could be predicted as distributions and values. The conclusions based on the analysis results can be summarised as follows:
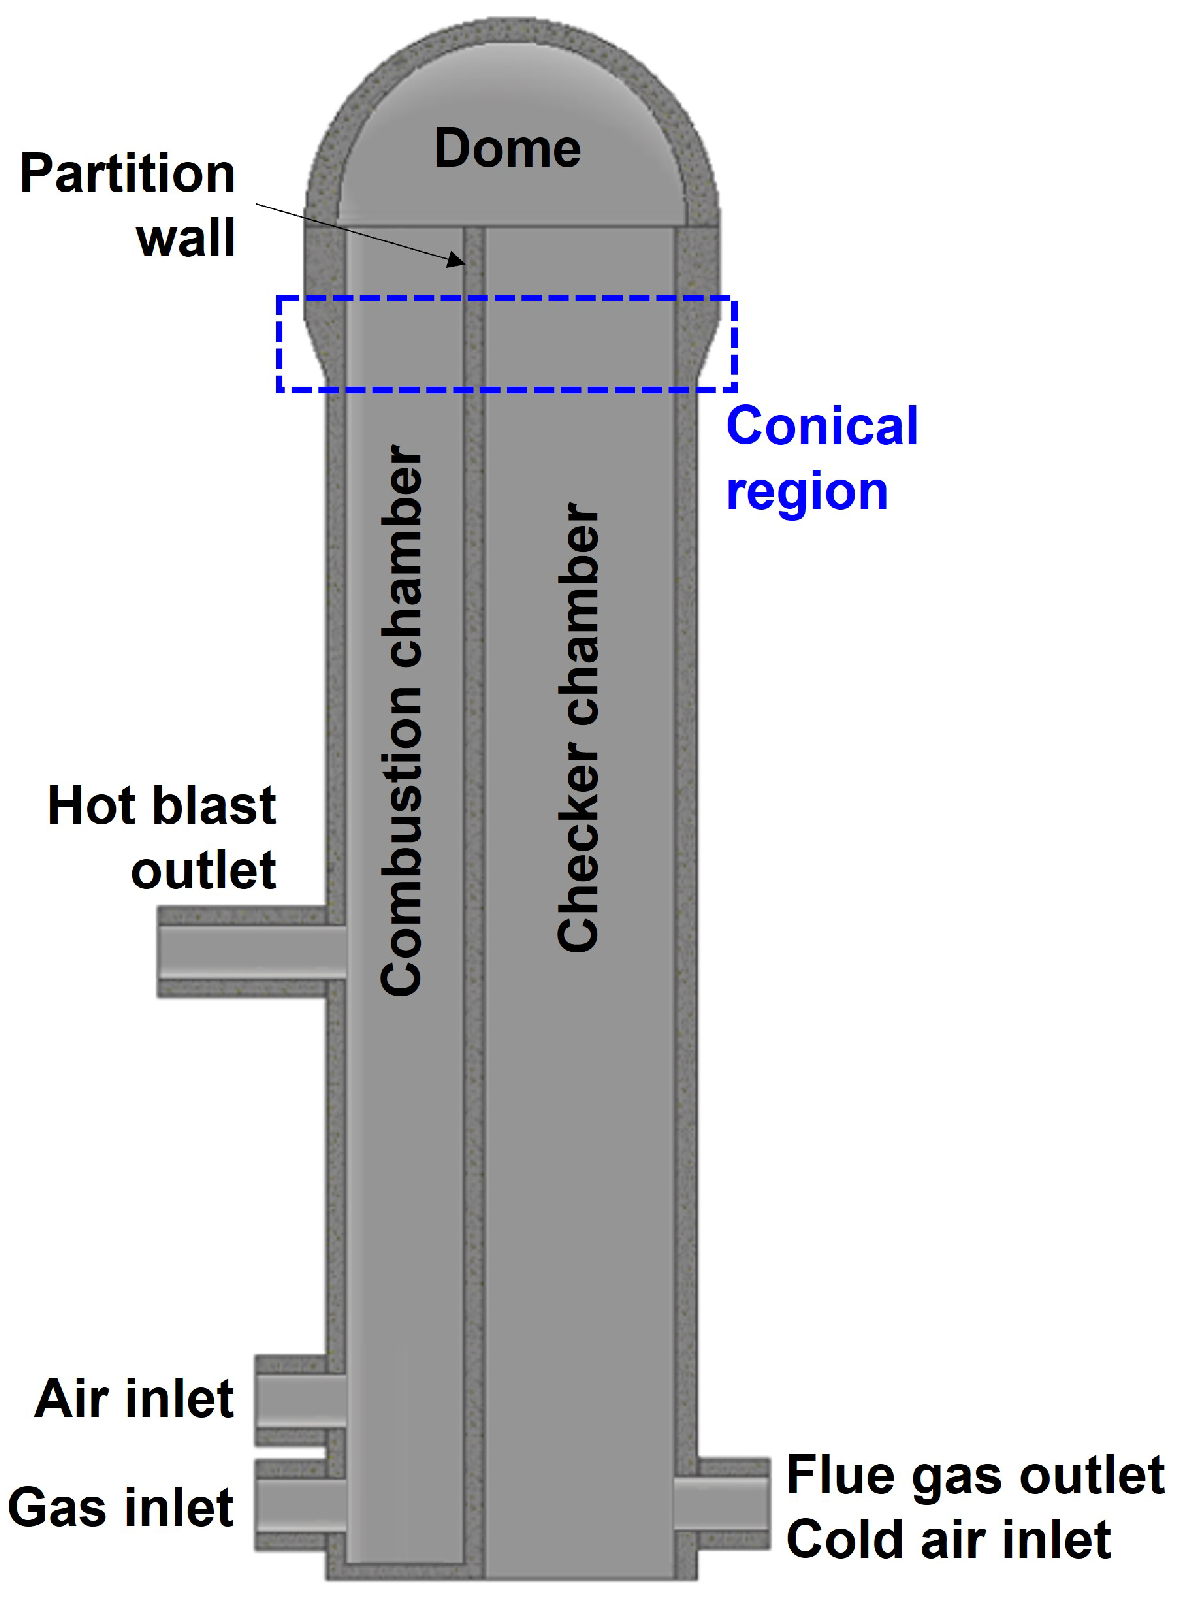
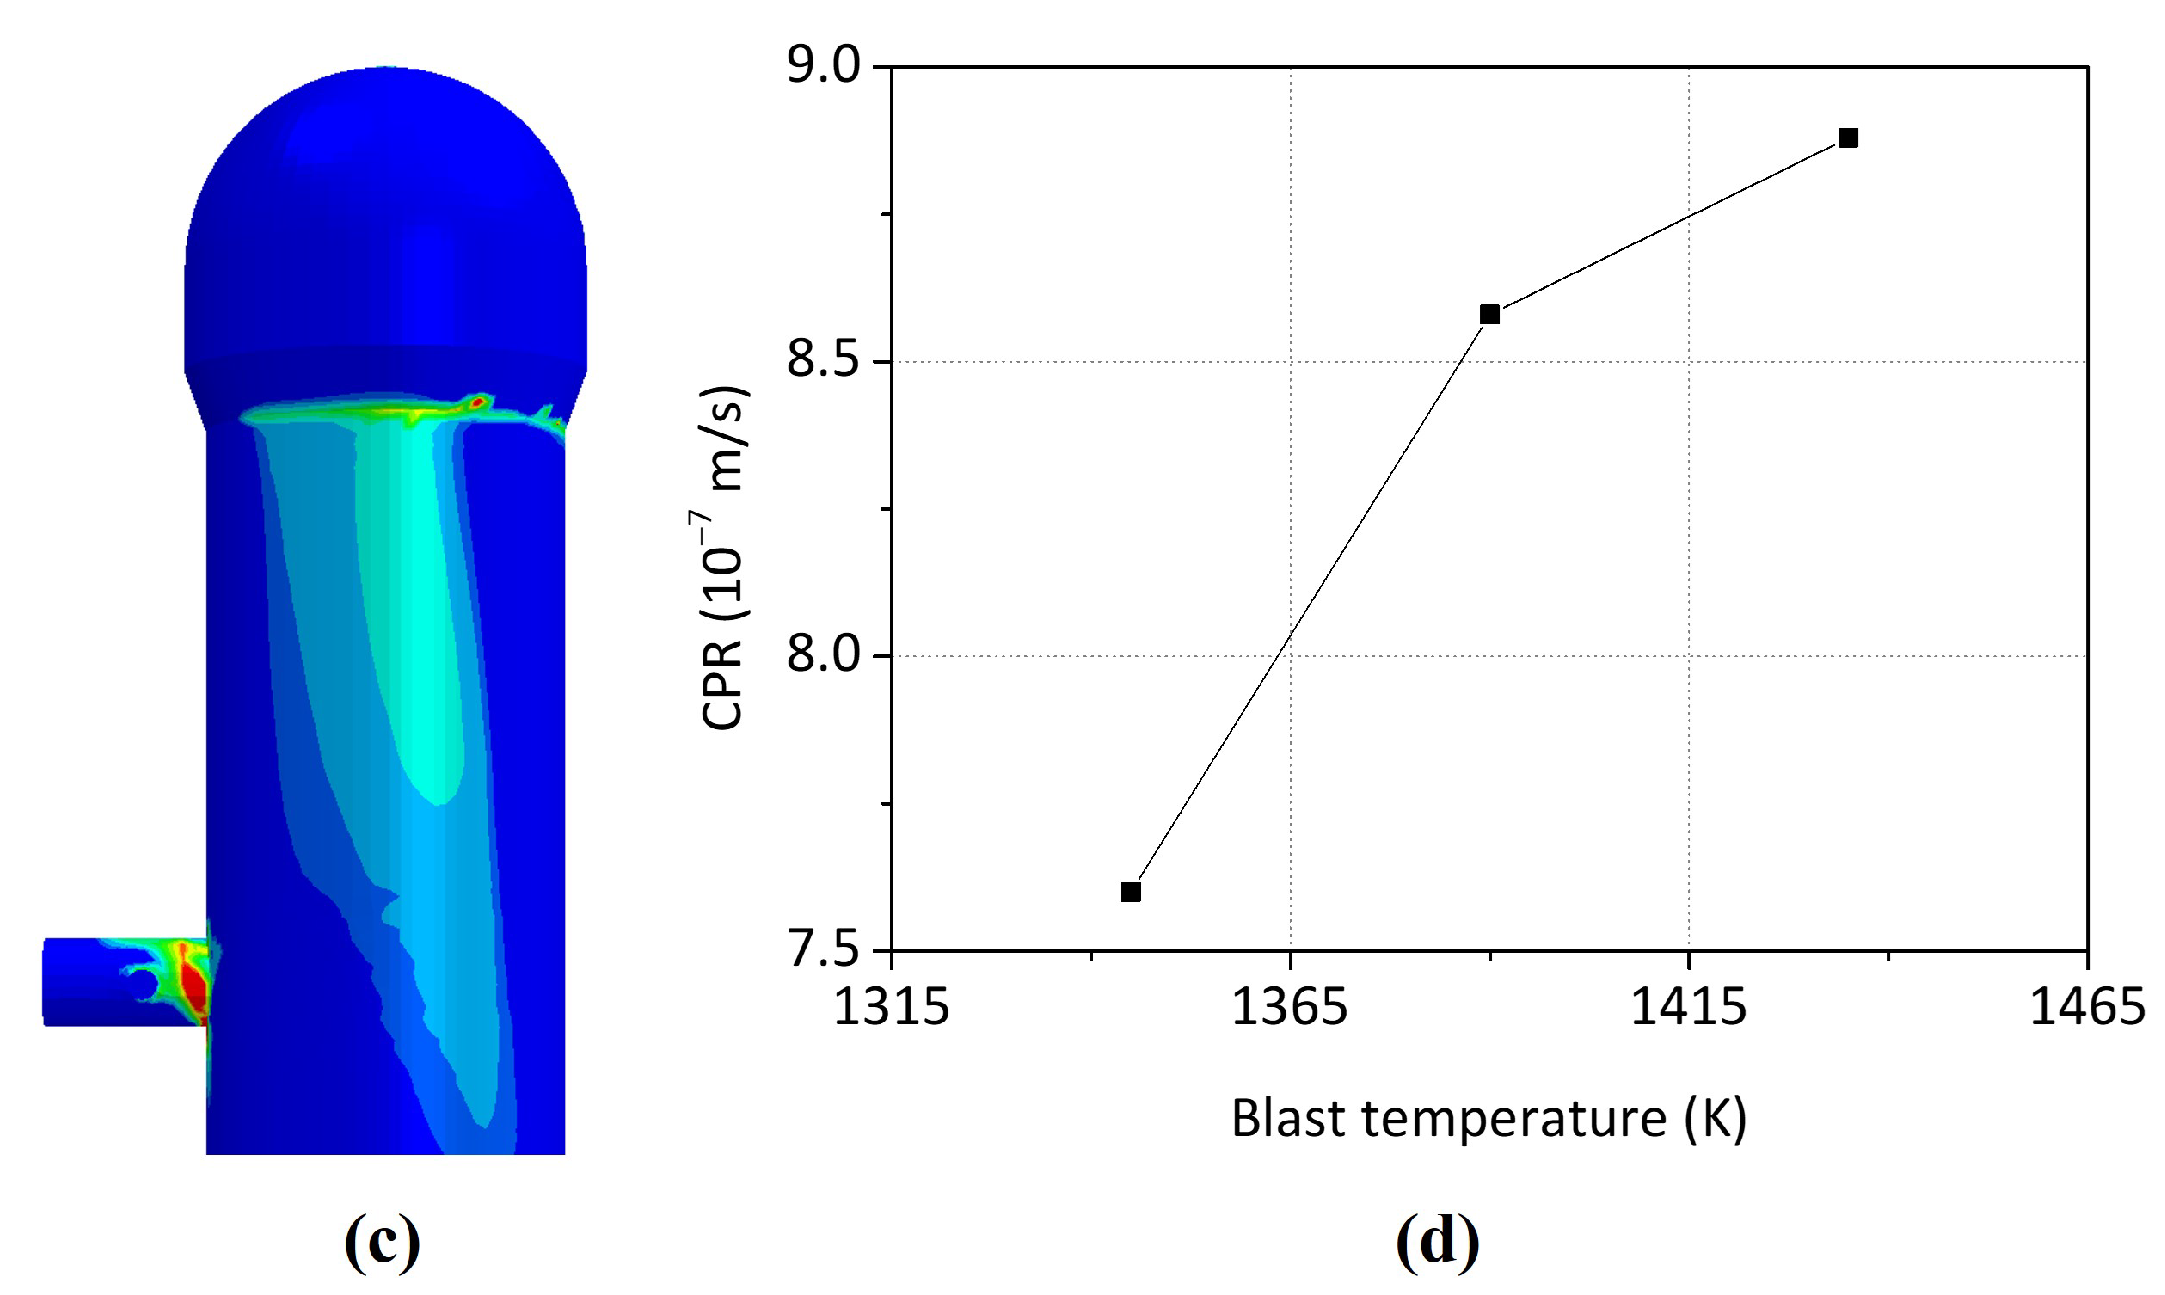
  • Without considering the weight factor, the crack propagation velocity was the largest at the conical region of the upper combustion chamber. The causes of the high crack propagation velocity are higher maximum principal stress and temperature distributions on the region.
  • The deposition rates of the water, sulfuric, and nitric acids were found to condense more at the lower part of the HBS. However, at the conical region between the checker and combustion chambers, the deposition rates were higher than in the other part of the conical region.
  • The weight factor on the crack propagation rate made it possible to consider the effect of the acid condensation rates on the crack propagation rates. The crack propagation rates in the regions with high temperatures became lower since there was no sufficient condensed acid to be expected.
  • The increase in the blast temperature had a low effect on the shell temperature. With the increase of 90 K on the blast temperature, the shell temperature only increased by 5.2 K maximum.
  • The blast temperature had less effect on the maximum principal stress generated during the operation. However, when the blast temperature was increased by 90 K, the maximum crack propagation rate was increased from  7.61 × 10 7  m/cycle to  8.88 × 10 7  m/cycle, which means that there was a 16.7% increase since the stress corrosion cracking is affected by the shell temperature.
Since the conical region showed higher crack propagation rates, monitoring the conical region can be important from the safety management perspective. Especially as the weld lines usually have residual stresses, the weld lines near the conical region should be the region of interest for managing the internal-combustion HBS. Suggestions for future work include applying the refined AHP method and the phenomenological relationship of the SCC process to evolution, including the application of damage models to access the damage evolution. In addition, the influence of the residual stresses from the weld lines on the SCC is also another candidate for future work.

Author Contributions

Conceptualisation, N.K.; methodology, D.P. and F.G.; software, D.P. and F.G.; validation, D.P. and F.G.; formal analysis, D.P. and F.G.; investigation, D.P. and F.G.; resources, N.K.; data curation, D.P. and F.G.; writing—original draft preparation, D.P. and F.G.; writing—review and editing, N.K.; visualisation, D.P. and F.G.; supervision, N.K.; project administration, N.K.; funding acquisition, N.K. All authors have read and agreed to the published version of the manuscript.

Funding

This research received no external funding.

Institutional Review Board Statement

Not applicable.

Informed Consent Statement

Not applicable.

Data Availability Statement

The data presented in this study are available on request from the corresponding author. The data are not publicly available due to privacy.

Conflicts of Interest

The authors declare no conflict of interest.

Abbreviations

The following abbreviations are used in this manuscript:
ADPacid dew point
CFDcomputational fluid dynamics
CPRcrack propagation rate
FEAfinite element analysis
HBShot blast stove
LTClow-temperature corrosion
SCCstress corrosion cracking
SMMsurface mobility mechanism

Appendix A. Computational Fluid Dynamics Model of the Hot Blast Stove

Here is a brief description of the computational fluid dynamic model of the hot blast stove. For a detailed description, refer to the authors’ previous publication [28].
The CFD model consisted of five models, which are the fluid flow, species transport, chemical reaction, radiation, and porous media models.
There are three assumptions in the fluid flow model: (a) the fluid is Newtonian fluid, (b) it follows an incompressible ideal gas law, and (c) turbulent flow regime. Based on the assumptions, the continuity, linear momentum, and energy equations are derived as follows:
ρ t + ρ u i x i = 0
( ρ u i ) t + ( ρ u i u j ) x j = p x i + x j μ u i x j + u j x i ρ u i u j ¯ + ρ g i
( ρ c p T ) t + ( ρ c p u i T ) x i = x i λ T x i ρ c p u i T ¯
where t is time,  ρ  is the fluid density,  u i  is the velocity component,  x i  is the Cartesian coordinate component, p is the pressure,  μ  is the dynamic viscosity,  g i  is the gravity component, T is the fluid temperature,  c p  is the fluid specific capacity, and  λ  is the fluid thermal conductivity. The standard k- ε  model with the standard wall function was utilised for the turbulent flow of the hot blast stove. The transport equations are described as follows:
( ρ k ) t + ( ρ k u i ) x i = x i μ + μ t σ k k x i + G k + G b ρ ε
( ρ ε ) t + ( ρ ε u i ) x i = x i μ + μ t σ ε ε x i + C 1 ε ε k ( G k + C 3 ε G b ) C 2 ε ρ ε 2 k
where k and  ε  are the turbulent kinetic energy and its dissipation,  C 1 ε C 2 ε , and  C 3 ε  are the model constants.  σ k  and  σ ε  are the turbulent Prandtl numbers for k and  ε μ t  is the turbulent viscosity, respectively.  G k  and  G b  are the generation of turbulence kinetic energy due to the mean velocity and buoyancy, respectively.  C 3 ε  determines the buoyancy effect on  ε μ t G k G b , and  C 3 ε  are defined as follows:
μ t = ρ C μ k 2 ε G k = ρ u i u j ¯ u j x i G b = g i μ t ρ Pr t ρ x i C 3 ε = tanh u g / u g p
where  C μ  is the model constant, and  Pr t  is the turbulent Prandtl number for energy.  u g  and  u g p  are the velocity components parallel and perpendicular to the gravitational vector, respectively.
The species transport model can analyse the mixing characteristics between the fuel gas and air. Solving the following convection–diffusion equation gives the local mass fraction of the species i:
( ρ Y i ) t + · ρ u Y i = · J i + R i
where u is the velocity vector,  Y i J i , and  R i  are the local mass fraction, the diffusion flux, and the net rate of production of species i, respectively. The diffusion flux can be expressed as follows using Fick’s law:
J i = ρ D i , m + μ t Sc t Y i D T , i T T
where  D i , m  is the mass diffusion coefficient for species i in the mixture,  D T , i  is the thermal diffusion coefficient, and  Sc t  is the turbulent Schmidt number.
The combustion process was analysed with the eddy-dissipation model.  R i , r , the net rate of production of species i due to reaction r, is given by the smaller value of the values computed with Equations (A9) and (A10).
R i , r = v i , r M w , i A ρ ε k min R Y R v R , r M w , R
R i , r = v i , r M w , i A B ρ ε k P Y P j N v j , r M w , j
Y P  is the mass fraction of product species P Y R  is the mass fraction of a particular reactant R M w , i  is the molecular weight of species i v i , r  is the stoichiometric coefficient for reactant i, and  v i , r  is the stoichiometric coefficient for a product i in reaction r. A and B are empirical constants.
The discrete ordinates radiation model was utilised to consider the radiation effect during the operation of the hot blast stove. The radiative transfer equation of the discrete ordinates model is expressed as follows:
· I ( r , s ) s + ( a + σ s ) I ( r , s ) = a n 2 σ T 4 π + σ s 4 π 0 4 π I ( r , s ) Φ ( s · s ) d Ω
where I is the radiation intensity that depends on the position r and direction s s  is the scattering direction vector, a is the absorption coefficient, n is the refractive index,  σ s  is the scattering coefficient,  Φ  is the phase function,  Ω  is the solid angle, and  σ  is the Stefan–Boltzmann constant.
The checker bricks in the check chamber were considered to be porous media. The volume-averaged mass and momentum conservation equations for single-phase flow through porous media are described as follows:
( γ ρ ) t + · ( γ ρ u ) = 0
( γ ρ u i ) t + ( γ ρ u i u j ) x j = ( γ p ) x i + x j γ μ u i x j + u j x i γ ρ u i u j ¯ + γ ρ g i γ 2 μ K + γ 3 C 2 2 ρ u u i
where  γ  is the porosity, K is the permeability, and  C 2  is the inertial resistance factor. The energy equations of the fluid and solids are described as follows:
( γ ρ c p T ) t + γ ρ c p u i T x i = x i γ λ T x i γ ρ c p u i T ¯ + h β ( T s T )
[ ( 1 γ ) ρ s c p , s T s ] t = x i ( 1 γ ) λ s T s x i + h β ( T T s )
where subscript s denotes the solid,  β  is the surface area density, and h is the heat transfer coefficient for the interface between the fluid and the solid.
Some of the CFD analysis results are depicted in Figure A1, which are the mass fractions of CO2, N2, and H2O during the on-gas period for the reference blast temperature.
Figure A1. Mass fractions of (a) CO2, (b) N2, and (c) H2O during the on-gas period for the reference blast temperature.
Applsci 13 12297 g0a1

References

  1. Huijbregts, W.; Leferink, R. Latest advances in the understanding of acid dewpoint corrosion: Corrosion and stress corrosion cracking in combustion gas condensates. Anti-Corros. Methods Mater. 2004, 51, 173–188. [Google Scholar] [CrossRef]
  2. Sanchez, J.; Fullea, J.; Andrade, C.; Alonso, C. Stress corrosion cracking mechanism of prestressing steels in bicarbonate solutions. Corros. Sci. 2007, 49, 4069–4080. [Google Scholar] [CrossRef]
  3. Cattant, F.; Crusset, D.; Féron, D. Corrosion issues in nuclear industry today. Mater. Today 2008, 11, 32–37. [Google Scholar] [CrossRef]
  4. Linden, D. Long term operating experience with corrosion control in industrial axial flor compressors. In Proceedings of the 40th Turbomachinery Symposium, Houston, TX, USA, 24–27 September 2011. [Google Scholar]
  5. Dwivedi, S.K.; Vishwakarma, M.; Soni, A. Advances and researches on non destructive testing: A review. Mater. Today Proc. 2018, 5, 3690–3698. [Google Scholar] [CrossRef]
  6. Cherniavsky, A. Estimation of the causes of cracking in the casing of a hot blast duct. Eng. Fail. Anal. 2020, 116, 104738. [Google Scholar] [CrossRef]
  7. Leferink, R.; Huijbregts, W. Nitrate stress corrosion cracking in waste heat recovery boilers. Anti-Corros. Methods Mater. 2002, 49, 118–126. [Google Scholar] [CrossRef]
  8. Scott, P.M. An Analysis of Primary Water Stress Corrosion Cracking in PWR Steam Generators. In Proceedings of the NEA/CSNI-UNIPEDE Specialist Meeting on Operating Experience with Steam Generators, Brussels, Belgium, 16–20 September 1991. [Google Scholar]
  9. Jenks, A.R.; White, G.A.; Crooker, P. Crack growth rates for evaluating PWSCC of thick-wall alloy 690 material and alloy 52, 152, and variant welds. In Proceedings of the Pressure Vessels and Piping Conference, Waikoloa, HI, USA, 16–20 July 2017; American Society of Mechanical Engineers: New York, NY, USA, 2017; Volume 58004, p. V06BT06A012. [Google Scholar]
  10. Woodtli, J.; Kieselbach, R. Damage due to hydrogen embrittlement and stress corrosion cracking. Eng. Fail. Anal. 2000, 7, 427–450. [Google Scholar] [CrossRef]
  11. Logan, H.L. Film-rupture mechanism of stress corrosion. J. Res. Natl. Bur. Stand. 1952, 48, 99–105. [Google Scholar] [CrossRef]
  12. Vermilyea, D.A. A theory for the propagation of stress corrosion cracks in metals. J. Electrochem. Soc. 1972, 119, 405. [Google Scholar] [CrossRef]
  13. Shi, J.; Fekete, B.; Wang, J.; Macdonald, D.D. Customization of the coupled environment fracture model for predicting stress corrosion cracking in Alloy 600 in PWR environment. Corros. Sci. 2018, 139, 58–67. [Google Scholar] [CrossRef]
  14. Hall, M., Jr. An alternative to the Shoji crack tip strain rate equation. Corros. Sci. 2008, 50, 2902–2905. [Google Scholar] [CrossRef]
  15. Shoji, T.; Suzuki, S.; Ballinger, R. Theoretical Prediction of SCC Growth Behavior—Threshold and Plateau Growth Rate; Technical Report; NACE International: Houston, TX, USA, 1995. [Google Scholar]
  16. Speidel, M.O. Stress corrosion cracking of stainless steels in NaCl solutions. Metall. Trans. A 1981, 12, 779–789. [Google Scholar] [CrossRef]
  17. Fan, T.; Sutton, M.; Zhang, L. Plane stress steady crack growth in a power-law hardening material. Int. J. Fract. 1997, 86, 327–341. [Google Scholar] [CrossRef]
  18. Koshiishi, M.; Hashimoto, T.; Obata, R. Application of the FRI crack growth model for neutron-irradiated stainless steels in high-temperature water of a boiling water reactor environment. Corros. Sci. 2017, 123, 278–288. [Google Scholar] [CrossRef]
  19. Galvele, J. A stress corrosion cracking mechanism based on surface mobility. Corros. Sci. 1987, 27, 1–33. [Google Scholar] [CrossRef]
  20. Galvele, J. Surface mobility mechanism of stress-corrosion cracking. Corros. Sci. 1993, 35, 419–434. [Google Scholar] [CrossRef]
  21. Galvele, J. Recent developments in the surface-mobility stress-corrosion-cracking mechanism. Electrochim. Acta 2000, 45, 3537–3541. [Google Scholar] [CrossRef]
  22. Vogt, H.; Speidel, M. Stress corrosion cracking of two aluminium alloys: A comparison between experimental observations and data based on modelling. Corros. Sci. 1998, 40, 251–270. [Google Scholar] [CrossRef]
  23. Kim, S.; Yu, H.; Nam, K.; Choi, B. Failure analysis and structural improvement for cracked circular finned tube. Eng. Fail. Anal. 2018, 92, 95–106. [Google Scholar] [CrossRef]
  24. Mou, Y.; Lian, Z.; Yu, H.; Lin, T.; Han, Z.; Zhang, Q. SCC evaluation of composite materials for natural gas absorber based on experimental and numerical methods. Eng. Fail. Anal. 2020, 110, 104450. [Google Scholar] [CrossRef]
  25. Wang, W.Y.; Tseng, Y.S.; Yeh, T.K. Evaluation of crack growth of chloride-induced stress corrosion cracking in dry storage system under different environmental conditions. Prog. Nucl. Energy 2020, 130, 103534. [Google Scholar] [CrossRef]
  26. Ramírez, E.I.; Figueroa, C.G.; Romero, J.L.; Ramos, E.; Schouwenaars, R.; Ortiz, A. Stress corrosion cracking of the slip-ring connectors of a 2 MW wind turbine. Eng. Fail. Anal. 2022, 141, 106732. [Google Scholar] [CrossRef]
  27. Wang, W.Y.; Tseng, Y.S.; Yeh, T.K. Tolerance assessment and crack growth of chloride-induced stress corrosion cracking for Chinshan dry storage system. Prog. Nucl. Energy 2022, 147, 104210. [Google Scholar] [CrossRef]
  28. Park, D.; Guo, F.; Choi, J.; Park, J.H.; Kim, N. Temperature and Thermal Stress Analysis of a Hot Blast Stove with an Internal Combustion Chamber. Processes 2023, 11, 707. [Google Scholar] [CrossRef]
  29. Jeong, K.; Levy, E.K. Theoretical prediction of sulfuric acid condensation rates in boiler flue gas. Int. J. Heat Mass Transf. 2012, 55, 8010–8019. [Google Scholar] [CrossRef]
  30. Olsen, D.B.; Kohls, M.; Arney, G. Impact of oxidation catalysts on exhaust NO2/NOx ratio from lean-burn natural gas engines. J. Air Waste Manag. Assoc. 2010, 60, 867–874. [Google Scholar] [CrossRef]
  31. Fleig, D.; Andersson, K.; Normann, F.; Johnsson, F. SO3 formation under oxyfuel combustion conditions. Ind. Eng. Chem. Res. 2011, 50, 8505–8514. [Google Scholar] [CrossRef]
  32. Karamavruc, A. Obtaining bulk flow based heat transfer coefficients for thermal evaluation of turbochargers. In Proceedings of the IMechE Conference, C6231-110, London, UK, 17–18 May 2016. [Google Scholar]
  33. Antoine, M.C. Nouvelle relation entre les tensions et les temperatures. C. R. Held Seanc. Acad. Sci. Paris 1888, 107, 681–684. [Google Scholar]
  34. Verhoff, F.; Banchero, J. Predicting Dew Points of Flue Gases. Chem. Eng. Prog. 1974, 78, 71–72. [Google Scholar]
  35. Kiang, Y.H. Predicting Dew Points of Acid Gases. Chem. Eng. 1981, 88, 127. [Google Scholar]
  36. Valencia, M.P.P. Condensation of Water Vapor and Acid Mixtures From Exhaust Gases; Institut für Energietechnik: Esslingen, Germany, 2004. [Google Scholar]
  37. Prando, D.; Brenna, A.; Diamanti, M.V.; Beretta, S.; Bolzoni, F.; Ormellese, M.; Pedeferri, M. Corrosion of titanium: Part 1: Aggressive environments and main forms of degradation. J. Appl. Biomater. Funct. Mater. 2017, 15, e291–e302. [Google Scholar] [CrossRef] [PubMed]
  38. Qi, F.; Liu, Z.; Yao, C.; Li, B. Numerical study and structural optimization of a top combustion hot blast stove. Adv. Mech. Eng. 2015, 7, 709675. [Google Scholar] [CrossRef]
  39. Blekkenhorst, F.; Brandenburg, J.; Stolwijk, C. Stress corrosion cracking in hot blast stoves at Hoogovens Ijmuiden. Iron Steel Eng. 1980, 57, 55–59. [Google Scholar]
  40. Harp, G.; Klima, R.; Sucker, D. Gastatmosphaere und Kondensat beim Winderhitzerprozess im Hinblick auf die Spannungsrisskorrosion. Stahl Eisen 1985, 105, 99–104. [Google Scholar]
  41. An, G.H.; Park, T.J. Mechanism of Stress Corrosion Cracking of Hot Stove Shells and Preventive Measures. In Proceedings of the Korean Society of Tribologists and Lubrication Engineers Conference, Korean Tribology Society, Busan, Republic of Korea, 16–17 May 2002; pp. 279–284. [Google Scholar]
Figure 1. Layout of the internal combustion hot blast stove utilised in this study [28].
Applsci 13 12297 g001
Figure 2. Temperature distributions of the refractory linings at the midpoint of the on-gas period ( t = 40  min) for (a) the reference blast temperature [28], and for the blast temperature increased by (b) 45 K and (c) 90 K.
Applsci 13 12297 g002
Figure 3. Temperature distributions of the refractory linings at the midpoint of the on-blast period ( t = 130  min) for (a) the reference blast temperature [28], and for the blast temperature increased by (b) 45 K and (c) 90 K.
Applsci 13 12297 g003
Figure 4. Temperature distributions of the shell at the midpoint of the on-blast period ( t = 130  min) for (a) the reference blast temperature [28], and for the blast temperature increased by (b) 45 K and (c) 90 K.
Applsci 13 12297 g004
Figure 5. (a) Maximum principal stress [28] and (b) average crack propagation velocity through an operation cycle of the shell for the reference blast temperature. The crack propagation velocity was calculated based on the original SCC SMM.
Applsci 13 12297 g005
Figure 6. The average deposition rates of (a) the water, (b) sulfuric, and (c) nitric acids through an operation cycle for the reference blast temperature and (d) corresponding weight value. The weight value was calculated based on the deposition rates.
Applsci 13 12297 g006
Figure 7. The average crack propagation rates through an operation cycle for the reference blast temperature (a) without and (b) with considering the weight factor.
Applsci 13 12297 g007
Figure 8. The average crack propagation rates for (a) reference blast temperature and for the blast temperature increased by (b) 45 K and (c) 90 K through an operation cycle. (d) The comparison of the maximum crack propagation rate for the different blast temperatures.
Applsci 13 12297 g008aApplsci 13 12297 g008b
Figure 9. Maximum principal stress of the shell on the conical part along the circumferential direction for the reference blast temperature [28] and for the blast temperature increased by 45 K and 90 K.
Applsci 13 12297 g009
Table 1. Literatures that analysed the SCC with the numerical analyses.
LiteratureTarget ComponentAnalysis Method
Kim et al. [23]Circular finned tubeCFD and FEA
Mou et al. [24]Natural gas absorber made of composite materialsFEA
Wang et al. [25]Dry storage systemCFD
Ramírez et al. [26]Slip-ring connectors of wind turbineFEA
Wang et al. [27]Dry storage systemCFD
Table 2. The initial concentration of sulfur trioxide, nitrogen dioxide, and water in the flue gas for the reference blast temperature.
SpeciesInitial Concentration
SO3780 mg/m 3
NO2564 mg/m 3
H2O6% wet
Table 3. Reaction mechanisms considered in the CFD analysis.
CompoundTemperature Range (°C)Reaction Mechanism
Sulfuric acid   T > 1200   S ( g ) + O 2 ( g ) SO 2 ( g )
  400 < T 1200   SO 2 ( g ) + 1 2 O 2 ( g ) SO 3 ( g )
  120 T 400   SO 3 ( g ) + H 2 O ( g ) H 2 SO 4 ( g )
  T < T dew , H 2 SO 4 Condensation of H2SO4
Nitric acid   650 < T < 1200   N 2 ( g ) + O 2 ( g ) NO ( g )
  150 < T 650   2 NO ( g ) + O 2 ( g ) 2 NO 2 ( g )
  120 T 400   2 NO ( g ) + O 2 ( g ) 2 NO 2 ( g )
  T < T dew , HNO 3 NO 2 ( g ) + H 2 O ( g ) 2 HNO 3 ( l ) + NO ( g )
Condensation of HNO3
Table 4. Mass fraction of the fuel gas [28].
ComponentCO2O2COH2H2ON2
Composition (%)18.10.124.50.30.256.8
Disclaimer/Publisher’s Note: The statements, opinions and data contained in all publications are solely those of the individual author(s) and contributor(s) and not of MDPI and/or the editor(s). MDPI and/or the editor(s) disclaim responsibility for any injury to people or property resulting from any ideas, methods, instructions or products referred to in the content.

