Article

Effect of Artificial Saliva Modification on the Corrosion Resistance and Electronic Properties of Bego Wirobond® C Dental Alloys

by
Bożena Łosiewicz
1,*,
Patrycja Osak
1,
Julian Kubisztal
1 and
Karolina Górka-Kulikowska
2
1
Institute of Materials Engineering, Faculty of Science and Technology, University of Silesia in Katowice, 41-500 Chorzów, Poland
2
Department of Biomaterials and Experimental Dentistry, Poznan University of Medical Sciences, 60-812 Poznań, Poland
*
Author to whom correspondence should be addressed.
Appl. Sci. 2023, 13(22), 12185; https://doi.org/10.3390/app132212185
Submission received: 17 October 2023 / Revised: 3 November 2023 / Accepted: 8 November 2023 / Published: 9 November 2023
(This article belongs to the Special Issue Materials and Technologies in Oral Research 2nd Edition)

Abstract

:
Wirobond® C is a commercial dental casting alloy suitable for the fabrication of crowns, bridges, and metal ceramic restorations. This study aims to investigate the effect of ready-to-use Listerine® and Meridol® mouthwashes and sodium fluoride on the resistance of CoCrMo dental alloys to electrochemical corrosion in artificial saliva at 37 °C. SEM, EDS, SKP, and microhardness investigations were carried out to characterize the material under study. The in vitro corrosion resistance of the CoCrMo alloy was conducted using the open-circuit potential method, electrochemical impedance spectroscopy, and anodic polarization curves. The presence of Co 59.8(8) wt.%, Cr 31.5(4) wt.%, and Mo 8.8(6) wt.% was confirmed. The CoCrMo alloy was characterized by a Vickers microhardness value of 445(31) µHV0.3. Based on the EIS data, the capacitive behavior and high corrosion resistance of the CoCrMo alloy were revealed. The kinetics of pitting corrosion in the artificial saliva were lower after being modified with NaF, Listerine®, and Meridol® mouthwashes. The potentiodynamic characteristics revealed the passive behavior of the CoCrMo alloy in all solutions. Based on the SKP measurements of the CoCrMo alloy after corrosion tests, the effect of artificial saliva modification on the electronic properties of Bego Wirobond® C dental alloy was found.

1. Introduction

The requirements that a dental metal biomaterial must meet for applications with living tissue are primarily biocompatibility in the tissues and fluids of the dental organ, as well as good corrosion resistance, tissue compatibility, resistance to abrasive wear, appropriate electrical properties, a lack of initiation of unfavorable reactions in peri-implant tissues, specific mechanical properties, and acceptable manufacturing costs. The corrosion of dental alloys may have biological, functional, and aesthetic consequences. Biological consequences are of the greatest importance. Metallic construction biomaterials introduced into the oral cavity contribute to the formation of electrochemical phenomena. These phenomena have a negative impact, both locally and generally, on the human body. Therefore, metallic materials’ corrosion resistance is a very important factor influencing their suitability in prosthetic applications [1,2,3,4,5,6,7,8,9].
Metal materials constitute the widest group of biomaterials used in dental prosthetics, oral surgery, and orthodontics. Precious and base metals and their alloys are mainly used in dental prosthetics. Precious metals such as gold and platinum have been used for many years, but for economic reasons, their use has been significantly limited [10,11]. Titanium [1,2,3,5,6,8,12,13] and cobalt [14,15,16,17] alloys are widely used in dental prosthetics, which is why they have taken a permanent position in dental practice instead of precious metals. Metal materials used for the production of implants can be divided into short-term ones, the duration of which should not exceed two years in the human body, including cobalt alloys and austenitic steels, and long-term ones, such as titanium and its alloys, where the service life can reach up to 25 years. The currently used cobalt alloys can be divided into three groups: (i) Vitalium-type foundry alloys, (ii) wrought alloys, and (iii) alloys produced by powder metallurgy. Cobalt-casting alloys are most frequently used for the production of components used for biomedical implants [14,15,16,17]. Cobalt-based alloys are classified as materials with good biotolerance, resulting from the presence of a passive layer on their surface. This layer is mainly composed of chromium oxide, which is formed spontaneously. Their suitability for implantation was determined by their greater biocompatibility in the environment of tissues and body fluids compared to austenitic CrNiMo steels and Ti6Al4V alloys, their greater resistance to pitting and crevice corrosion, and their lower susceptibility to initiating fatigue cracks. The tendency of the CoCrMo alloy to crevice corrosion is ten times lower than that of CrNiMo steel. These alloys also show good resistance to pitting and crevice corrosion in chloride solutions and physiological salts. Their mechanical properties and corrosion resistance are determined by their chemical composition and structure, depending on the type of technology and manufacturing conditions. In this respect, they can be divided into foundry and plastically processed alloys. Prosthetic implants are mainly made from casting alloys. However, plastically processed alloys are sometimes used to produce plates, bone screws, points, wires, and shaped elements for anastomoses, as well as frames of removable dentures [15,16,17].
When testing the corrosion resistance of dental alloys in vitro, the aim is to obtain conditions most similar to those in the oral cavity [1,2,13,14,15]. Due to the very low corrosion rate of dental alloys, corrosion symptoms are not visually noticeable in most cases. This limits in vivo corrosion testing, which can only be performed in cases where the corroding metal components are removable. An increase in interest in the CoCrMo alloy has been observed in the literature in recent years [14,15,16,17]. This alloy is widely used in dental practice. An increasing number of publications are devoted to electrochemical tests using electrochemical impedance spectroscopy (EIS), which provides more research possibilities compared to direct current methods and allows us to carefully determine the mechanism and kinetics of electrochemical corrosion.
The main aim of this study is therefore to determine the corrosion resistance of the CoCrMo dental alloy in a standard corrosive environment consisting of 0.9% NaCl solution (saline) in accordance the ISO 10271 standard [18] and in solutions of modified artificial saliva. Artificial saliva solutions with neutral and acidic pH values were modified with NaF, which is the main ingredient of toothpastes and mouthwashes with alcoholic (Meridol®) and aqueous (Listerine®) solvents. Classic electrochemical methods, such as the open-circuit potential method and the anodic polarization curve method, were used to carefully determine the mechanism and kinetics of electrochemical corrosion, combined with the complementary EIS research technique. The effect of modifying the corrosion environment on the electronic properties of the CoCrMo alloy is also discussed.

2. Materials and Methods

2.1. Surface Preparation of Samples

The biomaterial under study was a dental Wirobond® C cobalt–chrome metal-to-ceramic alloy (BEGO Bremer Goldschlägerei Wilh. Herbst GmbH & Co. KG, Bremen, Germany), which complies with ISO 22674 [19] and ISO 9693-1 [20] standards. Wirobond® C is produced in accordance with the ISO 13485 standard [21] and is approved as a class IIa medical device. This alloy is commercially used for the fabrication of prosthetic restorations, or sections thereof, with thin cross-sections exposed to very high loads, e.g., removable partial dentures, clasps, veneered crowns, long-span bridgework or bridges with small cross-sections, bars, retainers, and implant-supported superstructures (Figure 1).
The Wirobond® alloy does not contain nickel, cadmium, beryllium, or lead. It is primarily intended for patients allergic to nickel. Cerium in its chemical composition ensures a high bond strength with the ceramic, minimizing the risk of subsequent flaking or chipping. This cobalt-based dental casting alloy does not cause a chemical reaction in the patient’s mouth. It does not require oxidation. It is characterized by simple processing and casting, as well as its carbon-free composition (making its especially suitable for laser welding), high adhesion to ceramics, and low heat conductivity (ensuring pulp protection and high wearing comfort for the patient) (Table 1). The Wirobond® alloy is biocompatible, corrosion-resistant (thanks to a firmly adhering passive layer), and can easily be laser-welded. It is as flexible as precious metals. No cytotoxic potential was determined, in accordance with the ISO 10993-5 standard [25].
The Wirobond® C dental alloy was provided in the form of cylinders, from which disc-shaped samples were cut with thicknesses of 3 mm. The samples were included in graphite using an ATM Opal 400 hot mounting press (Spectrographic Ltd., Guiseley, Leeds, UK) at a pressure of 3.5 bars at 180 °C for 10 min. The included samples were ground using the metallographic grinding and polishing machine Metkon Forcipol 102 (Metkon Instruments Inc., Bursa, Turkey) on P320-P2500 abrasive papers (Buehler Ltd., Lake Bluff, IL, USA) and were polished using colloidal SiO2 suspension (0.04 μm grain size, Struers, Cleveland, OH, USA). The polished samples were degreased in acetone (Avantor Performance Materials Poland S.A., Gliwice, Poland) for 20 min using an ultrasonic cleaner USC-TH (VWR International, PA, USA), and then sonicated in ultrapure water (Milli-Q Advantage A10 Water Purification System, Millipore SAS, Molsheim, France) for 20 min.

2.2. SEM and EDS Study of the CoCrMo Alloy

Microstructure investigations centered around the CoCrMo alloy were conducted using a JEOL JSM-6480 scanning electron microscope (SEM, Peabody, MA, USA). A resolution of 3 nm and a voltage acceleration of 20 kV were applied. The microanalysis of the local chemical composition of samples was performed using the EDS method.

2.3. Microhardness of the CoCrMo Alloy

The micromechanical properties of the CoCrMo alloy were examined in the microhardness test using a Wilson®–WolpertTM Microindentation Tester 401MVD (Wilson Instruments, LLC, Carthage, TX, USA). The Vickers method was used in the study with a Vickers indenter as a square-based pyramidal-shaped diamond indenter with face angles of 136°, in accordance with the ISO 6507-1:2018 standard [26]. A hardness scale of HV = 0.1 was used. A maximum indentation load of 0.3 N was used for 10 to 15 s.

2.4. Corrosion Resistance of the CoCrMo Alloy

The in vitro corrosion resistance of the CoCrMo electrode to electrochemical corrosion was conducted in artificial saliva solutions of pH 7.4(1) and pH 5.5(1), in accordance with the AFNOR/NF standard S90-701 [27]. The chemical compositions of artificial saliva solution intended for corrosion testing are given in Table 2. The artificial saliva solution modifiers were 0.1 M NaF solution and 15 mL of commercial antiseptic Listerine Total Care Teeth Protection® mouthwash (McNeil Consumer Healthcare McNeil-PPC, Inc., Fort Washington, PA, USA) with alcohol (21.6% v/v) and alcohol-free Meridol® mouthwash (Colgate-Palmolive Company, NY, USA). For comparison purposes, a 3.5% NaCl solution (saline) of pH 7.4(1), in accordance with the ISO 10271:2021 standard, was also used [18]. All solutions were prepared using ultrapure water and reagents pure for chemical analysis (Avantor Performance Materials Poland S.A., Gliwice, Poland).
An electrochemical cell with a three-electrode configuration was used; the working electrode (WE) was the CoCrMo alloy, the counter electrode (CE) was a Pt foil, and the reference electrode (RE) was a saturated calomel electrode (SCE). Electrochemical measurements were conducted at 37(2) °C in deaerated solutions, in accordance with the ISO 10271:2021 standard [18], using the Autolab/PGSTAT12 (Metrohm Autolab B.V., Utrecht, The Netherlands). The open-circuit potential (EOC) was registered for a time (t) of 2 h. The EIS spectra were recorded at the EOC in the frequency range (f) of 20 kHz–10 mHz. An amplitude of the sinusoidal signal was 10 mV. Electrical equivalent circuits using the EQUIVCRT program with a circuit description code based on Boukamp [28] and the complex non-linear least squares (CNLS) method were used to interpret the EIS spectra according to Frequency Response Analysis (FRA) for Windows version 4.9. Anodic polarization curves were recorded in a potential range from 150 mV (more negative than EOC) to 1 V at a polarization rate of 1 mVs−1.

2.5. Scanning Kelvin Probe Measurements of the CoCrMo Alloy

The electronic properties of the CoCrMo alloy before and after corrosion tests were studied using the non-contact scanning Kelvin probe (SKP) method in the air. A M370 scanning electrochemical workstation (Prinston Applied Research), with a built-in SKP370 module and a VCAM3 optical video microscope, was used alongside a tungsten microprobe U-SKP-150 (Uniscan Instruments) with a diameter of 150 µm. The microprobe tip was approximately 100 µm away from the sample surface. The scanning was performed across an area of 2.5 × 2 mm2. Changes in the contact potential difference (CPD) distribution on the surface of samples were determined using the height tracking mode. The microprobe scanned at a sweep scan mode with a velocity of 20 µm s−1. M370 scanning electrochemical workstation software (version 2.45) was used to measure and analyze the obtained results.

3. Results and Discussion

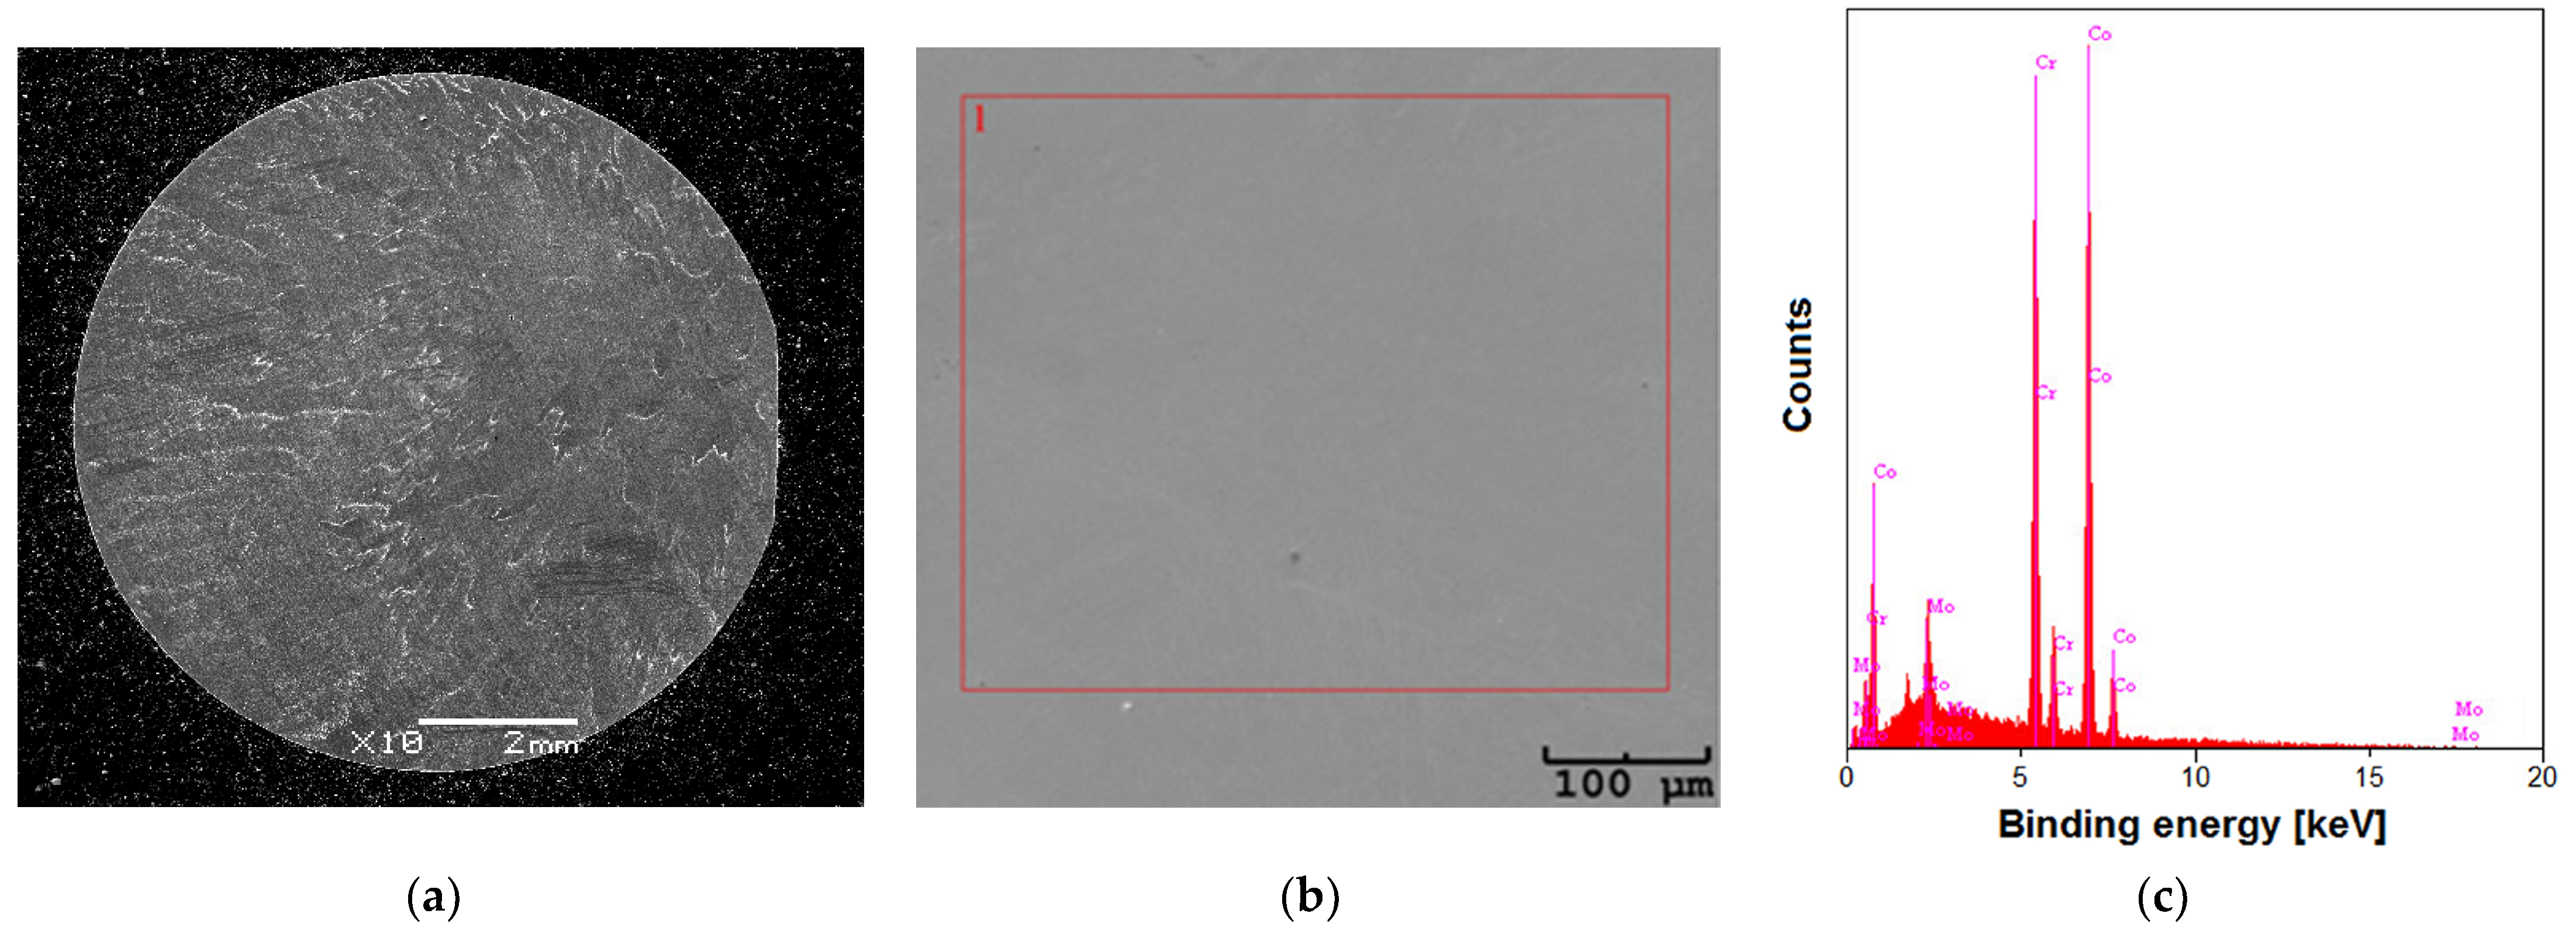
3.1. Microstructure and Chemical Composition of the CoCrMo Alloy

To control the chemical composition of the CoCrMo alloy, the included samples (as shown in Figure 2a) were studied using the EDS method. Figure 2b presents a SEM image of the surface morphology of the tested alloy in the microregion selected for EDS microanalysis. The exemplary EDS spectrum is displayed in Figure 2c. Based on the binding energy of the characteristic peaks, the presence of Co 59.8(8) wt.%, Cr 31.5(4) wt.%, and Mo 8.8(6) wt.% was recorded. The obtained chemical composition results are in very good agreement with the chemical composition results provided by the manufacturer of the CoCrMo alloy.

3.2. Micromechanical Properties of the CoCrMo Alloy

Vickers microhardness tests were performed for two samples of the CoCrMo alloy at 10 measuring points. The obtained results of the Vickers microhardness are presented in Table 3.
The Vickers microhardness test was performed on the samples in the initial state. Based on the obtained results, it is shown that the tested samples were characterized by similar microhardness values, with an average Vickers microhardness value of 445(31) µHV0.3. The alloy owes its high microhardness to the presence of Cr, which increases resistance to the shape change [29].

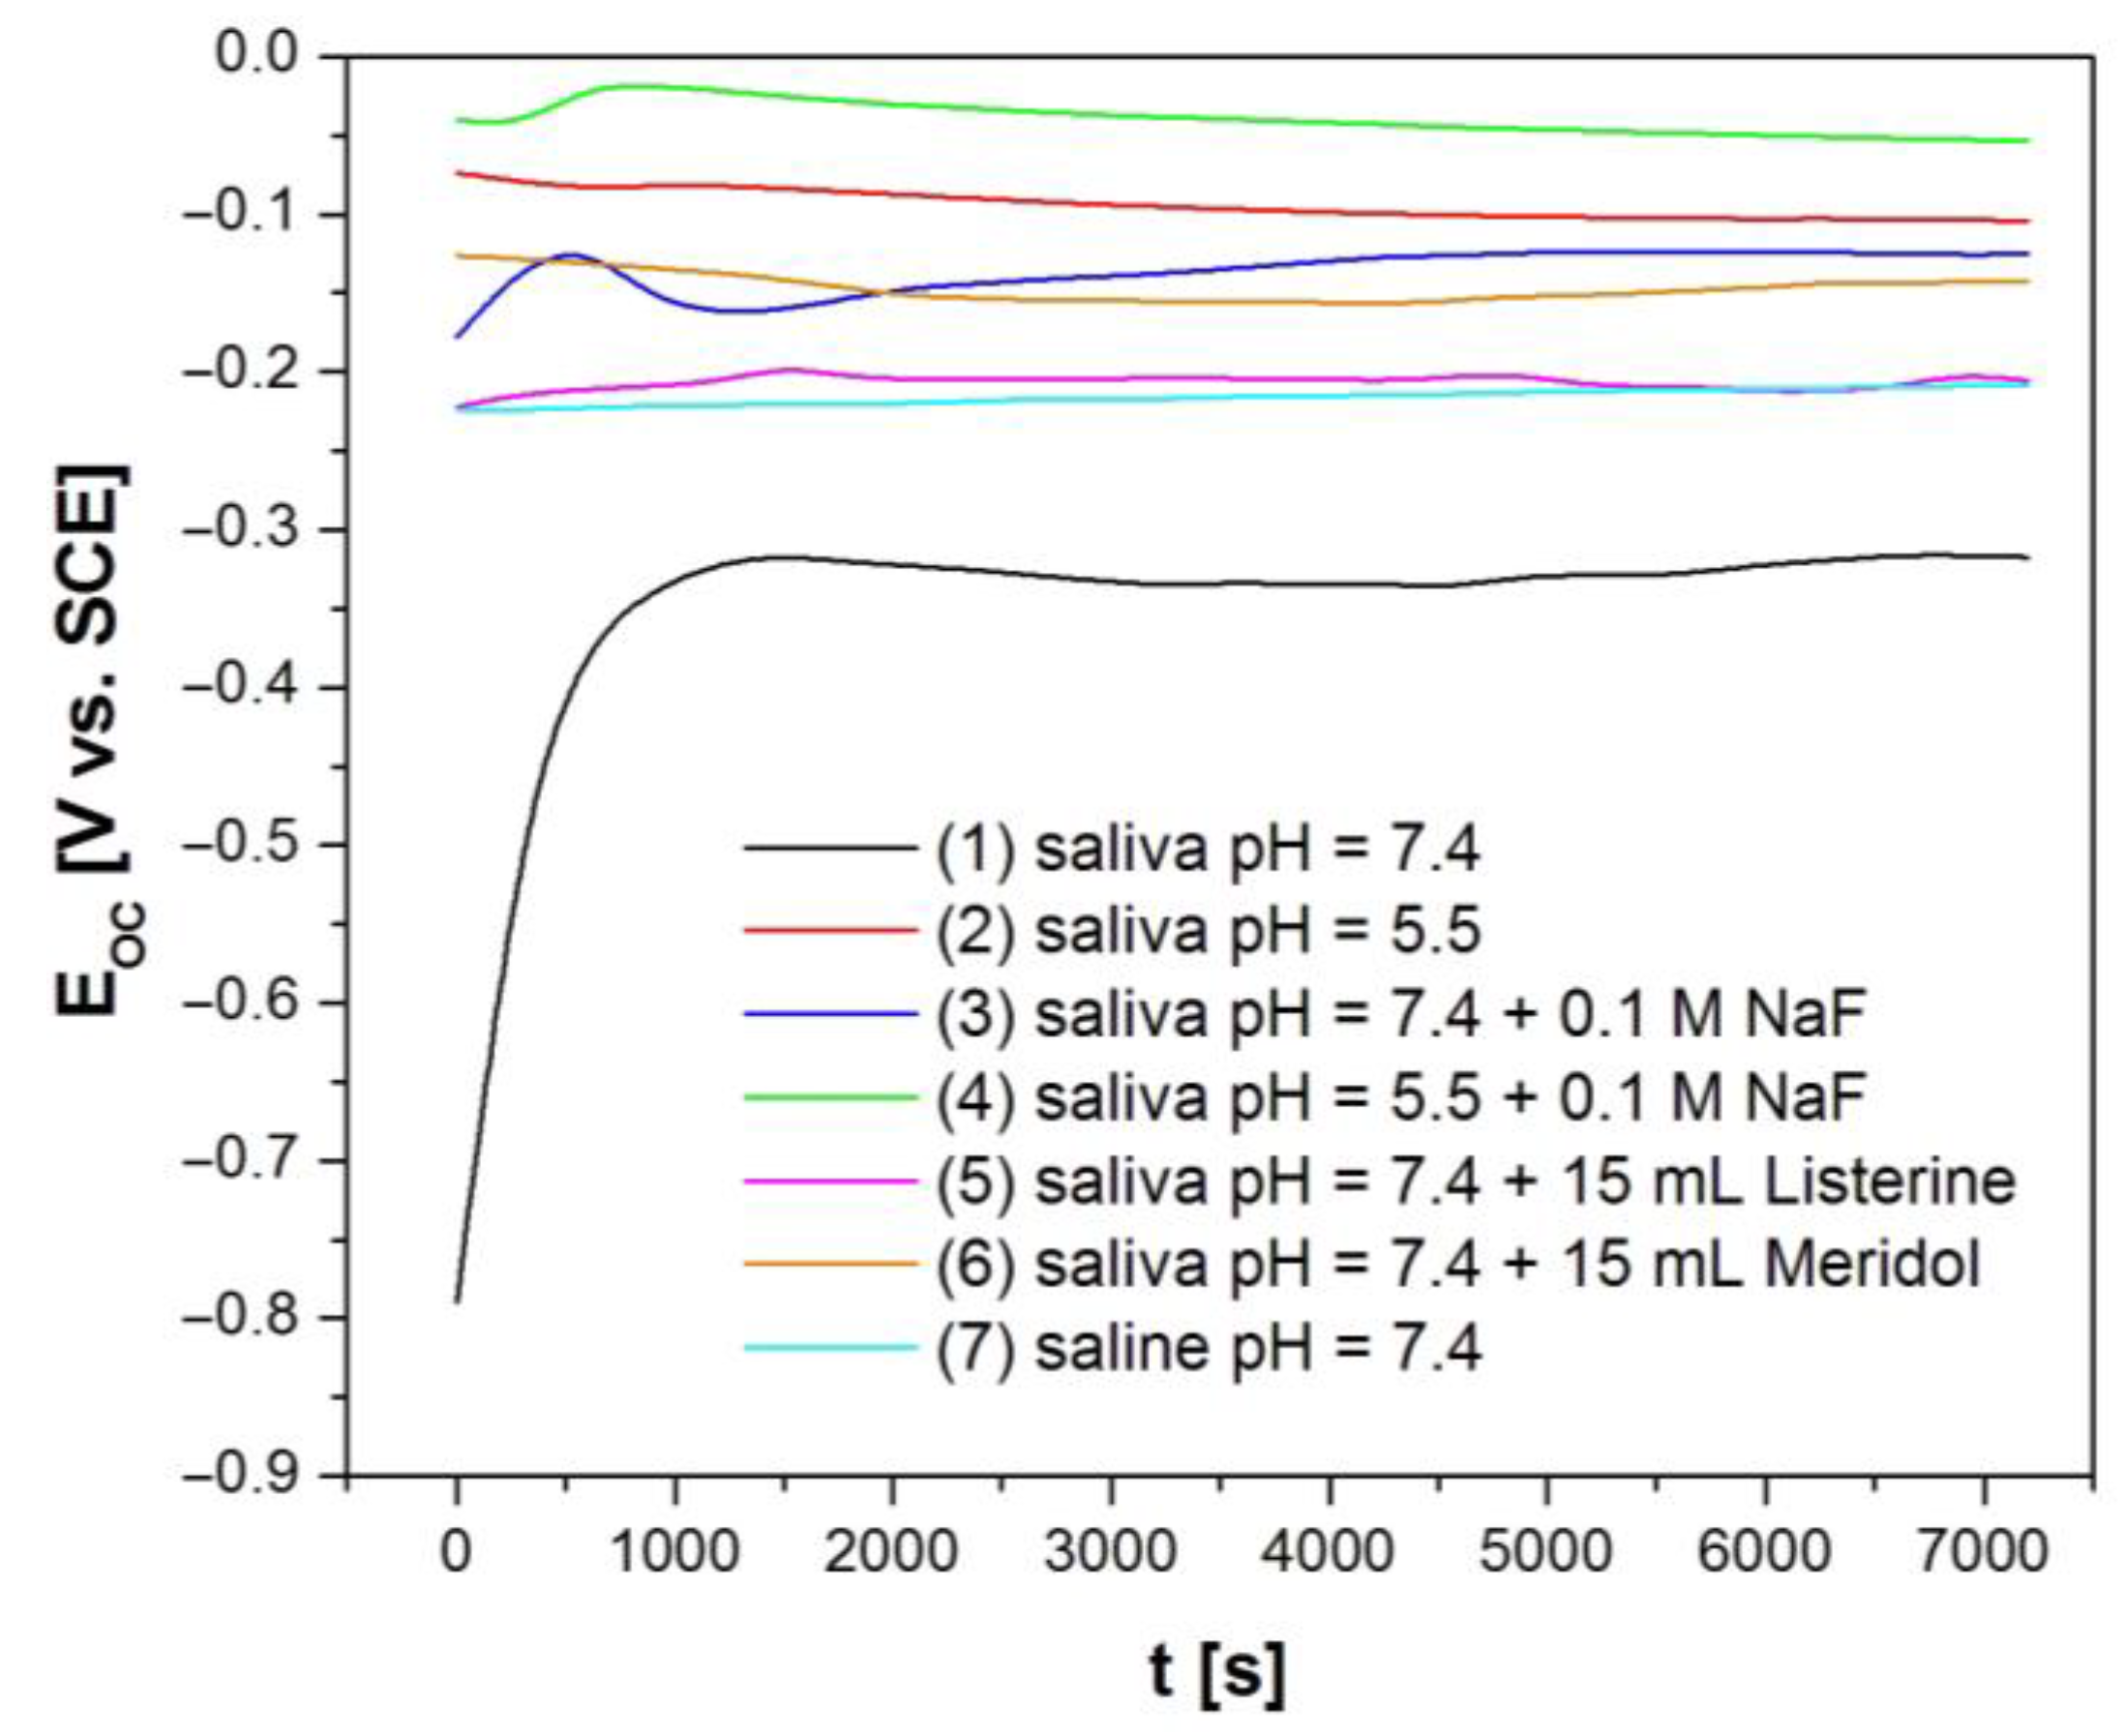
3.3. In Vitro Electrochemical Tests Using the Open-Circuit Potential Method

A summary of the experimentally obtained relationships EOC = f(t) for the CoCrMo electrode in the artificial saliva solution before and after modification, and comparatively in the physiological saline, is presented in Figure 3. From the course of the obtained EOC = f(t) curves for the tested electrode in the corrosion environments used, it is possible to make conclusions about the ability of the CoCrMo alloy to self-passivate in the environment of body fluids and physiological saline, as well as to initially predict the rate of corrosion changes occurring on the surface of the tested material.
After approximately 7200 s, the ion–electron equilibrium was established at the interface between the surface of the tested electrode and all the electrolytes used, resulting in a stabilized EOC value. The most negative EOC value of −317(63) mV was recorded for the CoCrMo alloy in an (1) artificial saliva solution with pH = 7.4 [30], the lowest corrosion resistance of the tested alloy. In an (2) artificial saliva solution with pH = 5.5, which simulates the inflammation of the body, the EOC value increased more than threefold, and in a physiological (7) saline solution with pH = 7.4, it increased more than one and a half times compared to the (1) artificial saliva solution with a physiological pH. The obtained EOC = f(t) characteristics also indicate that modifications in the artificial saliva solution with both (1) pH = 7.4 and (2) pH = 5.5 caused an increase in the EOC value for the CoCrMo electrode. The tested electrode showed the highest open-circuit potential value in (4) artificial saliva solution with pH = 5.5, as well as the addition of 0.1 M NaF and EOC = −53(10) mV.
After modifying the artificial saliva solution with pH = 7.4 with Listerine® (5) and Meridol® (6) mouthwashes, the EOC value for the CoCrMo electrode increased to −0.205(41) mV and −0.143(28) mV, respectively. Further electrochemical measurements were carried out, assuming that the obtained EOC values could be treated as approximate corrosion potential values (Ecor).

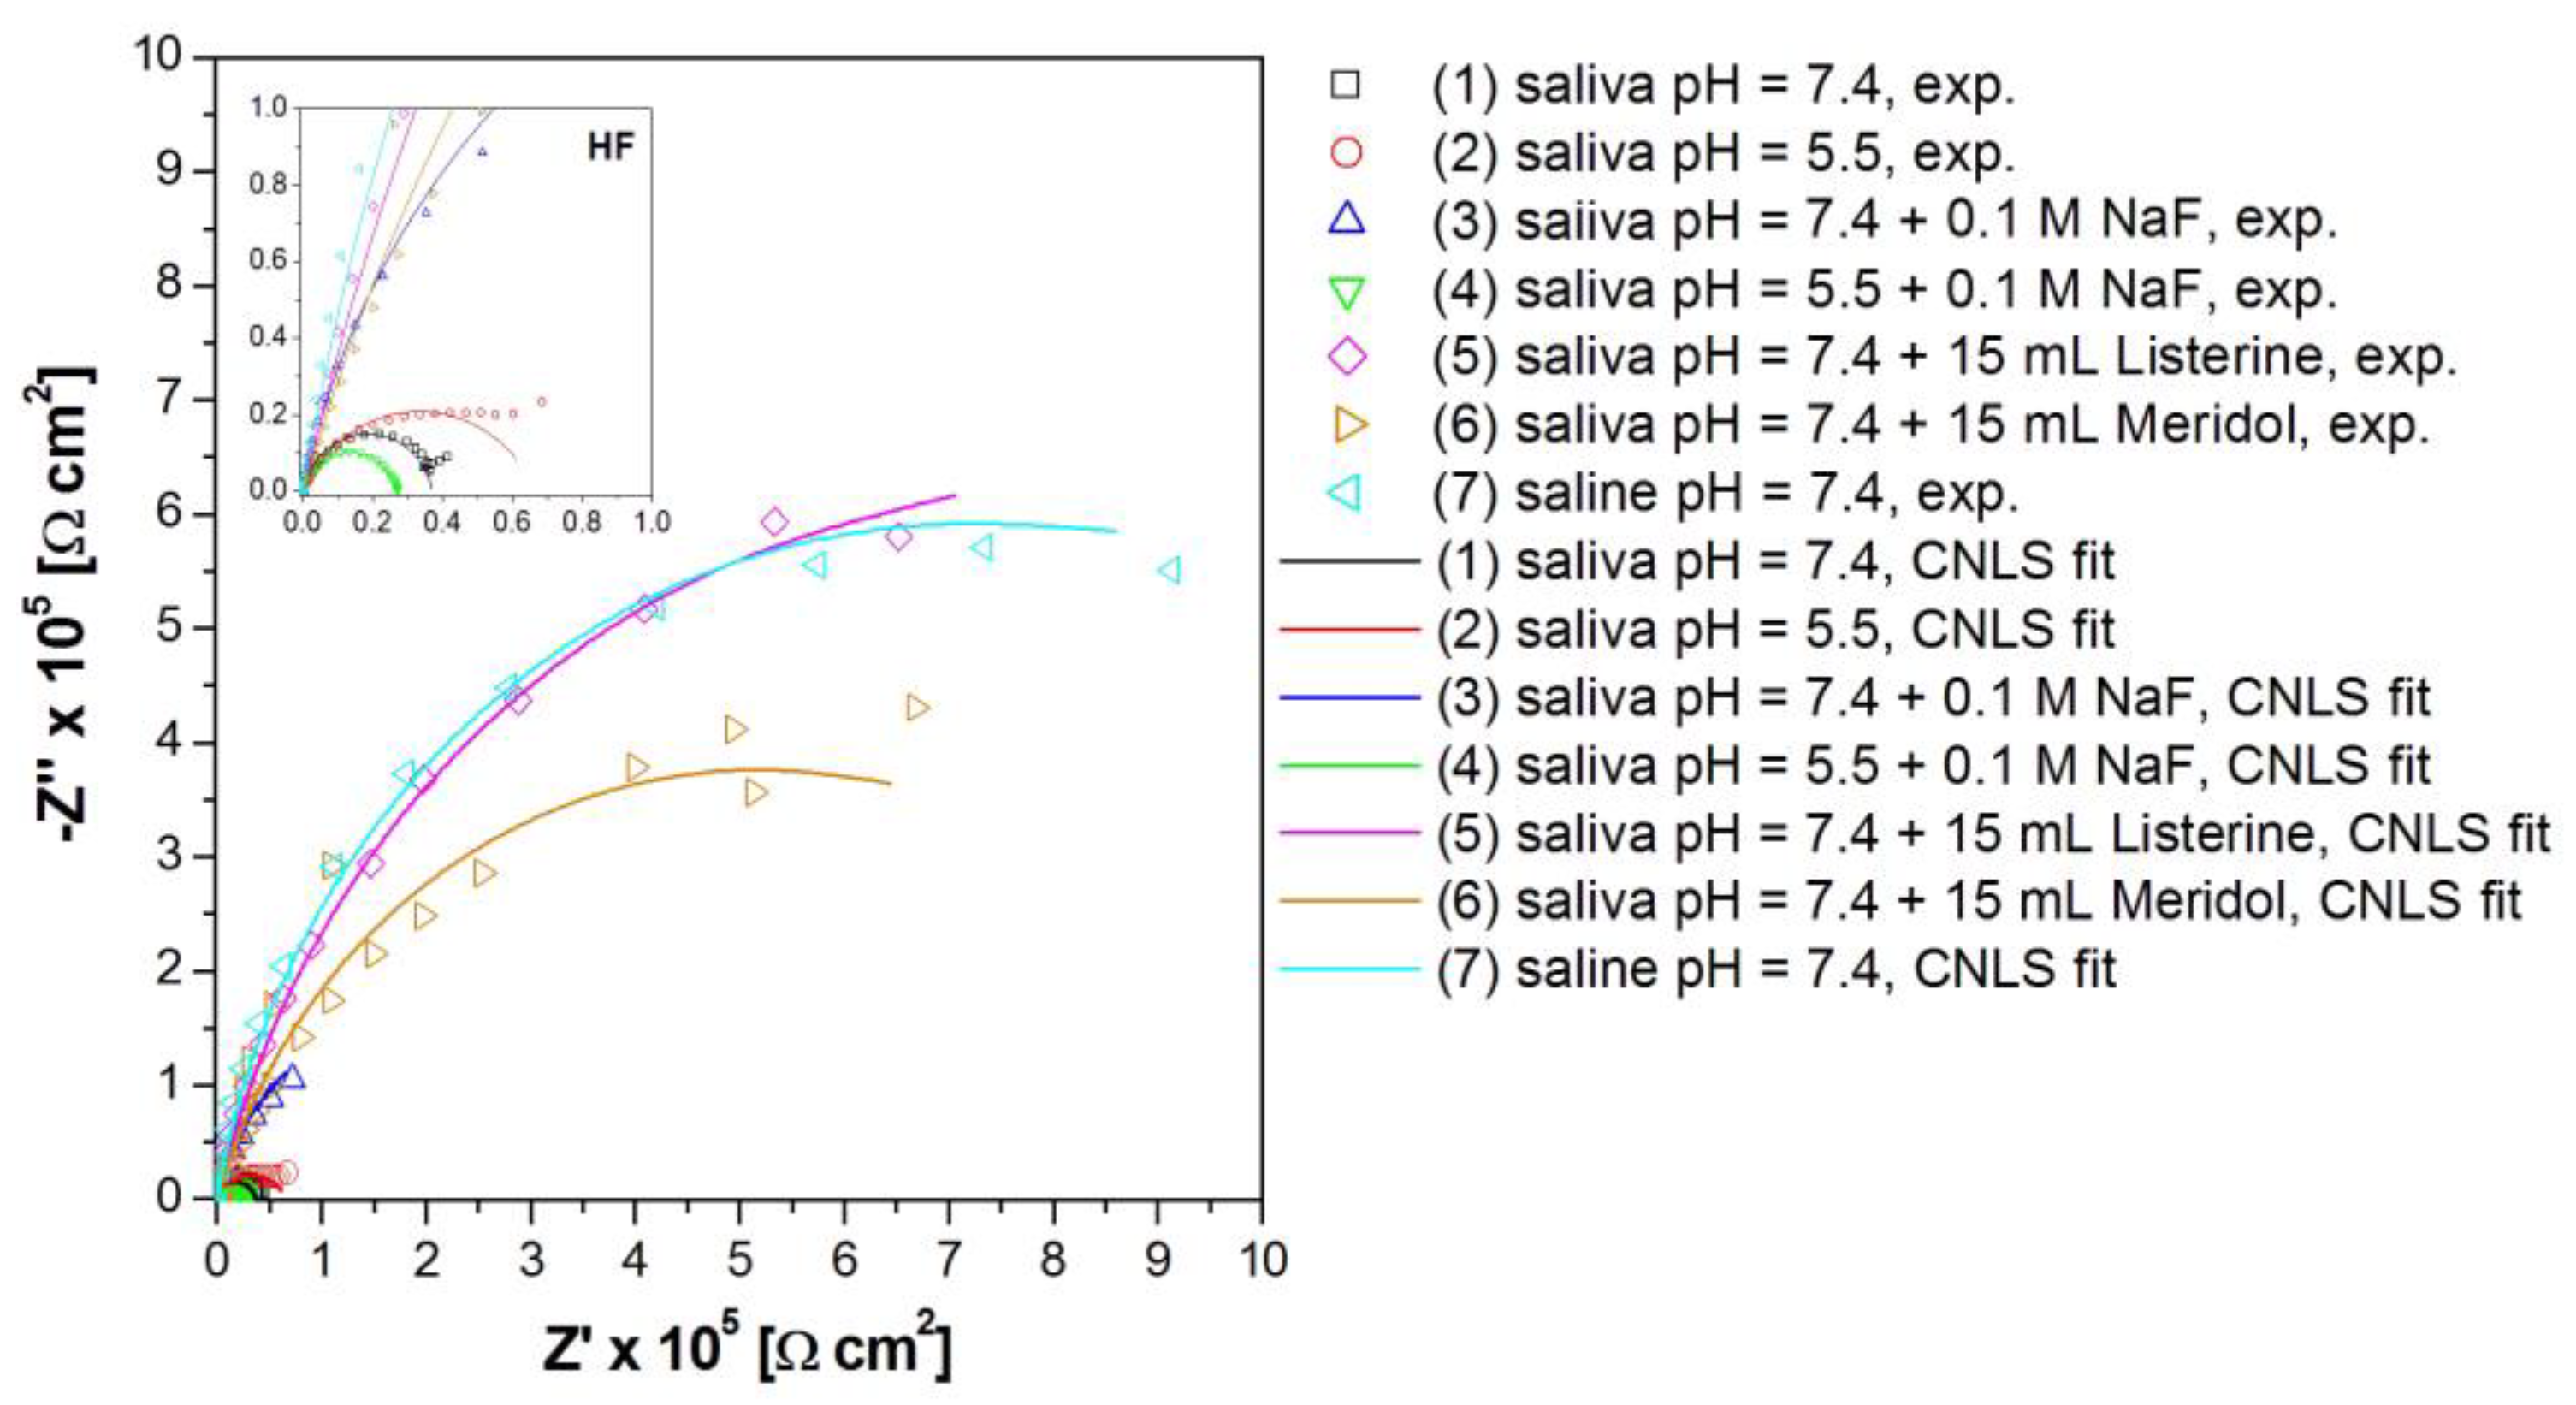
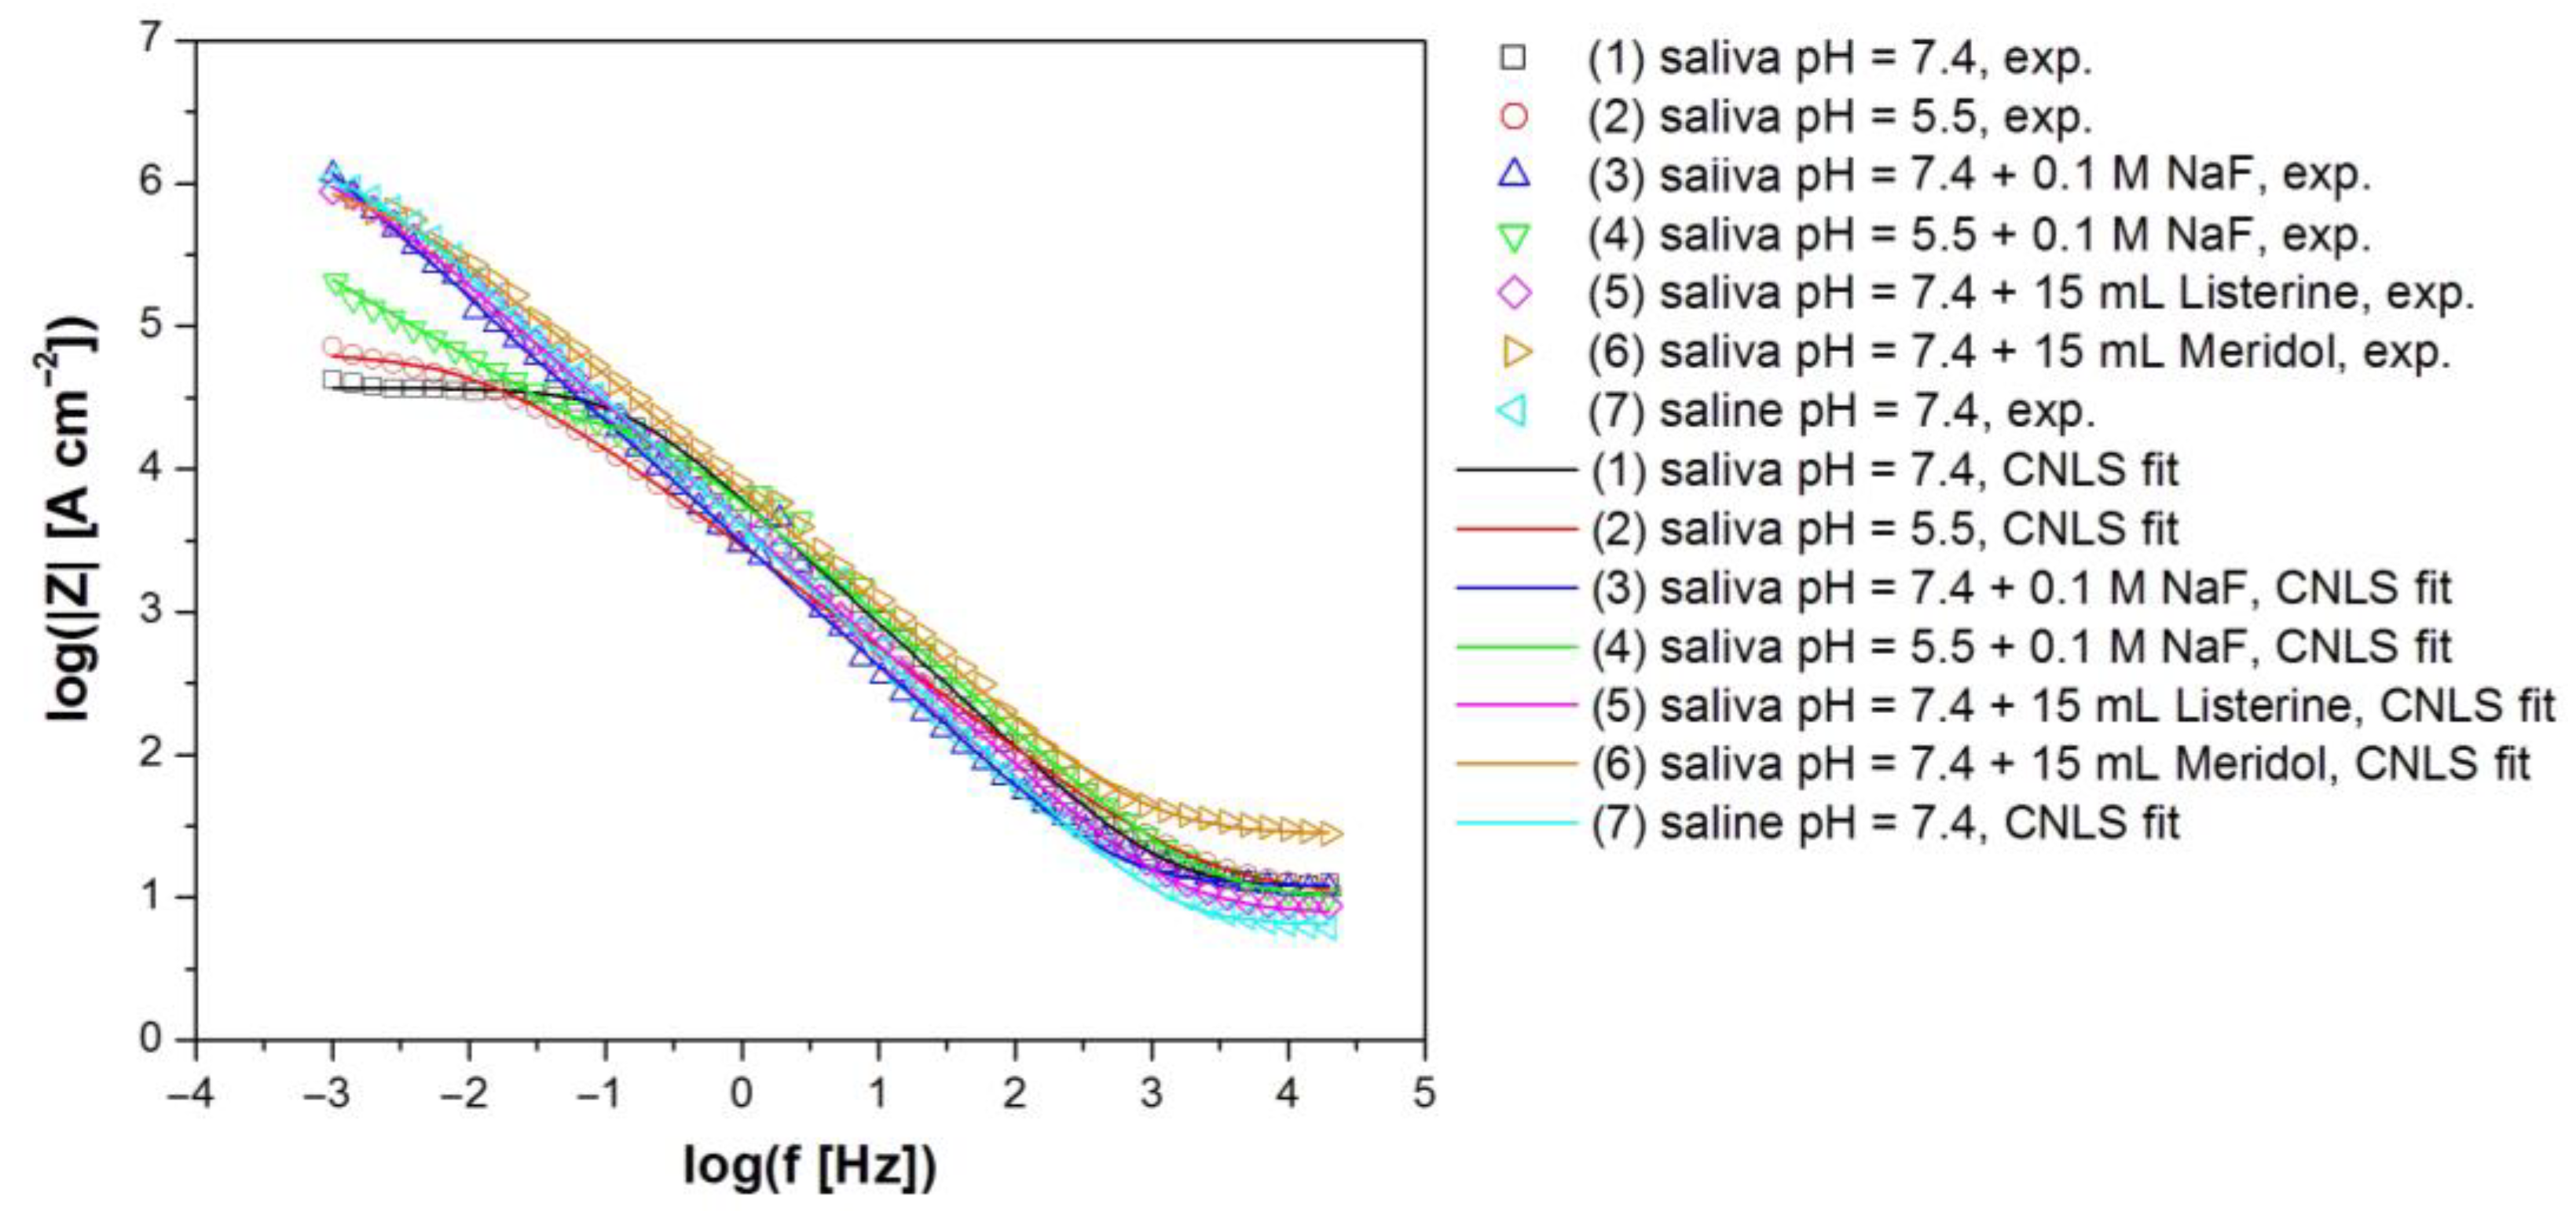
3.4. In Vitro Electrochemical Study Using Electrochemical Impedance Spectroscopy

To determine the mechanism and kinetics of electrochemical corrosion occurring on the surface of the CoCrMo electrode in the environment of artificial saliva before and after modification, and comparatively in a saline, a complementary electrochemical impedance spectroscopy (EIS) method was used.
Figure 4 shows the CPE1 model, consisting of electrolyte resistance (Rs) and a parallel system of a constant-phase element (CPE) combined with charge transfer resistance (Rct). The best fitting of experimental EIS data with the software-generated model curve for the real and imaginary part of the circuit impedance was obtained depending on the frequency of changes in the measurement signal for all the corrosive environments used (Figure 5, Figure 6 and Figure 7). The CPE1 equivalent electrical circuit with a one-time constant is characteristic of an electrode material with an undifferentiated surface morphology, with shallow pits on the surface. For the purposes of CNLS fitting, CPE was used instead of a capacitor, which was treated in the considerations as a “leaky” capacitor with non-zero real and imaginary components. The CPE impedance ( Z ^ CPE ) is given via Equation (1) [31]:
Z ^ CPE = 1 T ( j ω ) φ
where T [F cm−2 sϕ−1] is a capacitive parameter, which is a function of the electrode potential, and the dimensionless parameter ϕ is the angle of rotation of the purely capacitive line on the Nyquist plot (α = 90° (1 − ϕ)).
In the Nyquist spectral spectrum for the CoCrMo electrode in all the tested corrosion environments, only one semicircle was observed in the entire range of tested frequencies, the radius of which depended on the type of corrosion environment (Figure 5). As a result of adding modifiers, in the form of NaF (3) (4) and mouthwashes (5) (6), to the artificial saliva environment (1) (2), there was a tendency for the recorded semicircle in the spectrum to become increasingly blurred. This means that the electrochemical corrosion process occurs more easily in the environment of unmodified artificial saliva.
The Bode diagrams presented in Figure 6 and Figure 7 confirm a very good fit of the experimental data in relation to the software-generated model curve. The phase angle shift value provides important information about the mechanism and kinetics of the ongoing corrosion processes. Obtaining the shape of Bode diagrams in the form Φ = f(logf), as shown in Figure 6, is characteristic of pitting corrosion that occurs on the passivated material [5,8,13,30]. An increase in the phase angle shift value is proportional to the increase in the corrosion resistance of the material. Moreover, as shown in Figure 6, there was only one time constant for the samples tested in all environments, which means that the electrochemical corrosion process took place in one stage. The Φ = f (logf) graphs were characterized by a wide plateau range visible for the middle frequencies and one maximum, which demonstrates the high corrosion resistance of the passivated material. The high resistance of the tested alloy can be attributed to the elements Cr and Mo, which are characterized by excellent resistance in extremely aggressive corrosive environments. The widest plateau ranges were observed for the CoCrMo electrode in an artificial saliva environment with the addition of Meridol® (6) and Listerine® (5) mouthwashes. The narrowest plateau range was characterized by the tested electrode in a solution of artificial saliva with pH = 7.4 (1). The remaining environments had very similar plateau ranges.
The Bode plot in the form of log|Z| = f(log f) provides information about the corrosion resistance of the tested material in a given environment (Figure 7). The highest corrosion resistance was demonstrated by the sample in the artificial saliva environment at a neutral pH with the addition of NaF (3); the logarithm value of the impedance modulus at the lowest tested frequency f = 1 mHz was 6.06 Ω cm2. A slight decrease in the log value of |Z|f = 1 mHz = 6.03 Ω cm2 was observed in the case of the sample tested in the saline environment (7). For artificial saliva with pH = 7.4 following the addition of Meridol® mouthwash (6) (log |Z|f = 1 mHz = 5.9 Ω cm2) and Listerine® (5) (log |Z|f = 1 mHz = 5.94 Ω cm2), we observed a slight difference in the impedance modulus, which is caused by the different chemical compositions of the added fluids. One of the basic factors influencing the corrosion resistance of a material is the chemical composition of the corrosive environment. In an acidic artificial saliva solution after modifying the environment with NaF (4), the log |Z|f = 1 mHz value was 5.32 Ω cm2, and, in a neutral environment with the addition of NaF (3), the log |Z|f = 1 mHz value was 6.06 Ω cm2. In the environment of neutral artificial saliva (1), the log |Z|f = 1 mHz value was 4.62 Ω cm2; this is the lowest value obtained in impedance tests, which is associated with the lowest corrosion resistance of the sample in this environment. Figure 7 clearly shows that the corrosion resistance of the CoCrMo electrode is in the range between good and basic protection against electrochemical corrosion. Depending on the modifiers added to the tested environment, an increase in the corrosion resistance of the tested material can be observed.
In the case of a NaF-modified artificial saliva solution (3) (4), fluoride ions act to improve the corrosion resistance of the CoCrMo electrode. The drop in pH (acidification) accelerates corrosion due to the increased intensity of hydrogen depolarization. The corrosion rate increases significantly in the presence of aggressive chloride ions (Cl). Additionally, chloride ions inhibit the formation of passive layers and can also penetrate the oxide layer through pores or lattice defects and destroy it, which then leads to the corrosion of deeper parts of the metal. In order to explain the impedance behavior of the CoCrMo electrode in the tested corrosion environments, the model for the electrical equivalent circuit CPE1, presented in Figure 4, was used. The detailed error in determining the parameters was below 28% (Table 4). The ϕ values ranged from 0.720 to 0.881.
The Rct parameter was characterized by the highest value of 1.59(16) × 106 Ω cm2 for the electrode in the environment of artificial saliva with the addition of Listerine® mouthwash (5), which has the strongest protective properties (Table 4). The corrosion resistance decreased successively, but it is of the same order of 106 in saline (7), and saliva with pH = 7.4 following the addition of Meridol® mouthwash (6). The electrode in the artificial saliva solution with pH = 7.4 + 0.1 M NaF (3) decreased by an order of magnitude. Saliva with pH = 5.5 before (2) (Rct = 6.6(11) × 104 Ω cm2) and after the addition of NaF (4) (Rct = 2.71(16) × 104 Ω cm2), and in saliva with pH = 7.4 (1) (Rct = 3.71(21) × 104 Ω cm2), was characterized by the lowest Rct values. The smaller the R2, the faster kinetics of the pitting corrosion of the CoCrMo electrode.
Extrapolating a straight line with a slope equal to −1 in the Bode system log |Z| = f(logf) allows the parameter that ascertains the capacity of the electrical double layer (Cdl) to be determined (Table 4). A high Cdl value indicates the greater exposure of the CoCrMo electrode surface to pitting corrosion due to the faster kinetics of the electrochemical process. Based on the discussion of results obtained using the EIS method, it can be concluded that the corrosion resistance of the CoCrMo dental alloy improved, caused by the presence of Meridol® (6) and Listerine® (5) mouthwashes in a neutral environment. Both the acidic reaction of the environment and the presence of Cl ions reduced the corrosion resistance of the tested electrode in the environment of body fluids. Chloride anions initiated the growth and expansion of pits in the self-passive oxide layer on the electrode surface, which were the main causes of the deterioration of parameters, such as Rct, as confirmed by the corrosion current density values determined in direct current electrochemical tests. The Cdl values for the CoCrMo electrode in a physiological saline (1) were relatively high, which proves the material’s strong ability to corrode in an environment containing Cl ions.
The addition of NaF to the artificial saliva environment reduced the Cdl value in both acidic (4) and neutral (3) environments. The increase in Rct value was caused by modifications in the corrosive environment in the form of mouthwashes. A change in the pH of the electrolyte may destabilize the passive layer due to local anodic reactions. The drop in pH meant that there was an increased concentration of H+ ions due to the hydrolysis of cations, which made it harder for the passive film to form and for corrosion reactions to occur more easily. The additives used, although in small amounts, had a significant impact on individual corrosion resistance parameters. The use of EIS allowed for the determination of parameters defining the mechanism of the corrosion processes that occur. It was found that this is an activation mechanism, which involves transferring charged particles to the outside, resulting from the dissolution of the material, through the corrosive environment, where they combine with ions coming from the corrosive environment. The result of such a connection is the formation of a passive layer—a protective layer of the material.

3.5. In Vitro Electrochemical Tests Using the Potentiodynamic Method

The next stage in electrochemical research involves conducting the potentiodynamic method in order to determine the susceptibility of the CoCrMo electrode to pitting corrosion in the tested environments. The obtained anodic polarization curves, showing the relationship log|j| = f(E) for the tested material in body fluid solutions, are presented in Figure 8. These tests were carried out at a polarization rate v = 1 mV s−1. The current density values were logarithmized in order to determine the parameters characterizing the corrosion resistance of the tested electrode in particular environments. The CoCrMo electrode showed passive behavior in each tested environment, thanks to its optimal chemical composition, where the Cr and Mo contents were within the limits, ensuring the highest corrosion resistance [29].
The corrosion potential values determined for the tested material in individual environments vary depending on the pH of the solutions used and the presence of additives in the form of mouthwashes and NaF introduced into the solutions as modifiers. The corrosion potential (Ecor) of the tested electrode and the corresponding corrosion current density (jcor) vary depending on the environment used. The most negative (cathodic) value was shown by CoCrMo in the (1) artificial saliva solution with pH = 7.4 (Ecor = −365 mV, jcor = 1.25 × 10⁻⁸ A cm−2) [30]. A strongly cathodic value of the corrosion potential was also observed in (7) saline at pH = 7.4 (Ecor = −237 mV, jcor = 2.27 × 10⁻⁹ A cm−2). The CoCrMo alloy tested in the environment of artificial saliva with the addition of Listerine® (5) and Meridol® (6) mouthwashes had similar corrosion potential values of Ecor = −295 (jcor = 1.65 × 10⁻⁹ A cm−2) and −203 mV (jcor = 4.53 × 10⁻⁹ A cm−2), respectively. In the artificial saliva solution with pH = 7.4 (3) and pH = 5.5 (4) enriched with NaF, we observed the most positive corrosion potential values of Ecor = −174 (jcor = 6.85 × 10⁻⁹ A cm−2) and −128 mV (jcor = 5.47 × 10⁻⁹ A cm−2), respectively. This is related to the presence of fluoride anions in the solution which facilitate the formation of a chromium(III) oxide layer on the electrode surface, in accordance with Okamoto’s theory [32]. Corrosion damage is caused by the adsorption of aggressive chloride ions on the metal surface which penetrate through the passive layer. Chloride anions hinder the incorporation of metal ions into the metal layer and facilitate their penetration into the solution. The highest jcor value of 2.21(24) × 10−8 A cm−2 was observed in (2) artificial saliva with pH = 5.5, which indicates the highest rate of electrochemical corrosion in an inflammation-simulating environment with a Ecor value of −160 mV.
Based on the obtained electrochemical results, a three-layer model centered around the formation of a passive layer on the CoCrMo alloy in the tested corrosion environments can be proposed. It describes the process and chemical description of the reaction of creating a passive layer on the tested material. When the CoCrMo alloy (electrode) is immersed in the corrosive medium and the external voltage is applied to the system, chromium dissolution is initiated according to the Pourbaix diagram [33]. The ongoing process of active chromium dissolution is described by the following reaction:
Cr → (Cr)n+ + ne.
Chromium cations enter the solution to reach a lower energy level. On the surface of the material, they combine with oxygen ions to form the nuclei of a passive layer. The continuous increase in potential causes the growth of chromium oxide on the surface of the material and a passive layer is eventually formed, according to the formula:
2 Cr O 4 2 + 6 H + + 6 e Cr 2 O 3 + 4 OH + H 2 O .
The reaction in a medium with the addition of Cl ions proceeds as follows:
(Cr)n+ Cln + mH2O → Cr(OH)n + 2mH+ + nHCl.
After the dissolution of the “protective” layer, the active state returns, which is associated with another intense impact of the environment on the material, and there is effective evolution of oxygen on the surface of the layer and from the dissolved passive layer itself (which has been observed experimentally), according to the following formula:
O2 + 4H+ + 4e → 2H2O.
and the process of pitting on the surface of the material begins. The thickness of the entire protective layer ranges can vary around several nanometers.
The metallic cobalt dissolution reaction, in accordance with the thermodynamic data for the Co-H2O system, presented in the form of a Pourbaix diagram [32], is as follows:
Co0 + 2H+ → Co 2+ + H2.
Chromium dissolution reaction:
Cr3+ + H2O ↔ Cr(OH)2+ + H+,
Cr(OH)2+ + H2O ↔ Cr(OH)2− + H+,
Cr(OH)3(S) ↔ Cr3+ + 3OH.
The molybdenum dissolution reaction occurs according to the following reaction:
Mo3+ + 2H2O ↔ MoO2 + 4H+ + e.

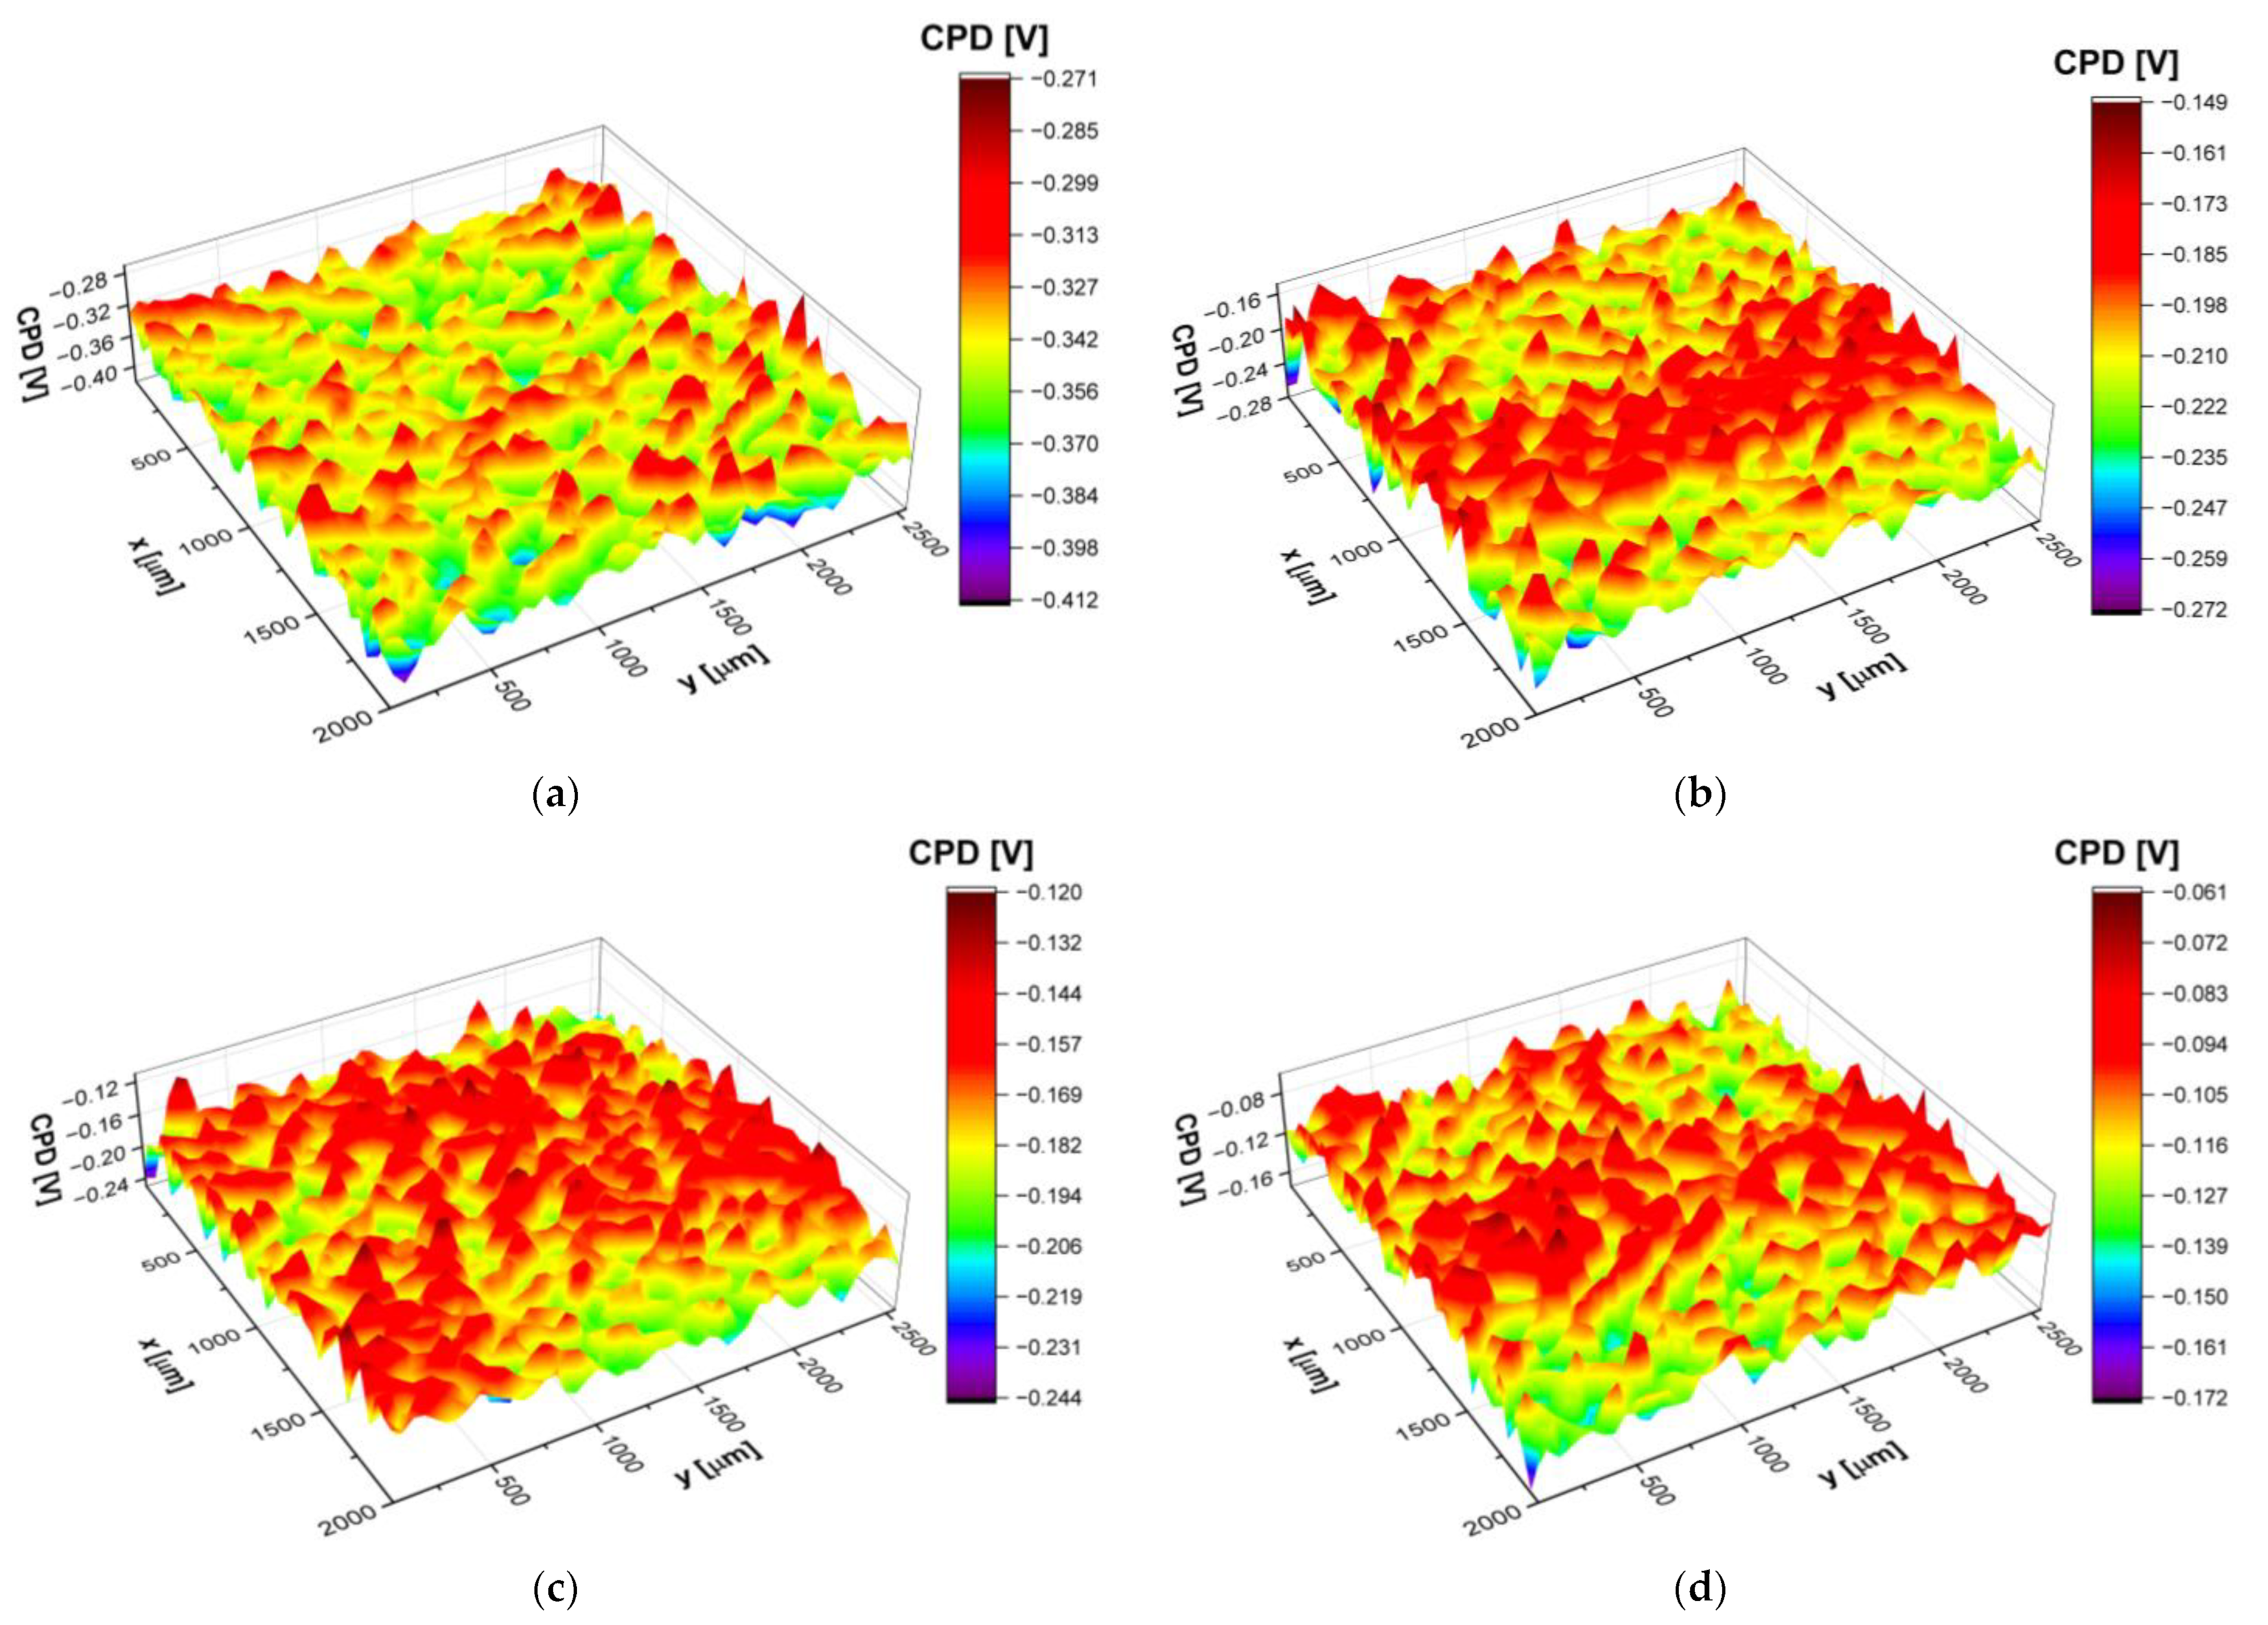
3.6. Scanning Kelvin Probe Study of the CoCrMo Alloy Surface

Using the SKP method, the surfaces of the CoCrMo electrode subjected to the corrosion process in various solutions were analyzed. The SKP technique allowed for the determination of the contact potential difference (CPD) distribution on the sample surface (Figure 9).
Based on the registered 3D maps, parameters characterizing the surface state, such as the arithmetic average of CPD heights (CPDav), the root mean square deviation of CPD heights (CPDrms), the skewness (CPDsk), and the kurtosis (CPDku), were determined and are shown in Table 5. The highest average contact potential difference value was obtained for the sample tested in saliva with pH = 5.5 (2). Samples after the corrosion tests in saliva with pH = 5.5 + 0.1 M NaF (4) and saliva with pH = 7.4 + 0.1 M NaF (3) exhibited approximately 50% lower values of CPDav compared to samples after being tested in saliva with pH = 5.5 (2). In turn, the CPDav determined for samples after being tested in saliva with pH = 7.4 + 15 mL of Meridol® (6) was around 80% lower. For the samples tested in saline with pH = 7.4 (7), saliva with pH = 7.4 + 15 mL of Listerine® (5), and saliva with pH = 7.4 (1), the averages of measured CPD heights were 2.1, 2.7, and 3.1 times lower, respectively, compared to the samples after being tested in saliva with pH = 5.5 (2). The CPDav parameter suggests that the samples tested in saliva with pH = 5.5 (2) exhibited the lowest electrochemical activity among all the tested samples. In contrast, the sample subject to corrosion tests in saliva with pH = 7.4 (1) had the most electrochemically active surface. Keeping in mind that the material from which the samples were made was the same and that the samples underwent similar potential current treatments, it can be concluded that measured CPDav values depend on the composition of the solution. Thus, the sample tested in saliva with pH = 5.5 (2) was most likely subjected to the least aggressive environment, whereas the sample studied in saliva with pH = 7.4 (1) was soaked in the most aggressive one.
The CPDrms values determined for samples in all corrosion solutions varied from 17 mV to 21 mV. This indicates that the deviation of CPD heights from the average value is comparable for all the investigated samples. Skewness and kurtosis quantitatively describe the shape of the CPD distribution. As shown in Table 4, both parameters vary from about −0.1 to about 0.2, indicating that the CPD distribution is of a Gaussian type. Moreover, CPDsk and CPDku close to zero indicate that the contact potential difference heights are symmetrically distributed around the average and that no areas with relatively large/small CPD values are observed on the examined surfaces.
CoCrMo alloys have been widely used in dentistry for many years for partial dentures, replacing gold alloys [22,23,24,34,35,36,37,38,39]. During prosthetic and clinical treatment, one of the most important aspects is the precision of the reconstruction. Clinical studies show that the proper reconstruction of the tooth crown guarantees durability and prevents the infiltration of bacteria into the tissues [34]. Research shows that, in CoCrMo alloys, metal ions constituting the alloy components are released into the body to a small extent, even in an acidic environment [35,36,37,38]. CoCrMo alloys, particularly those used in partial dentures, are resistant to abrasion and temperature changes under artificial aging conditions, which proves that the alloy is resistant to repeated insertions and the removal of dentures [39]. The abrasion resistance of this material allows the hygiene of the prosthesis to be properly maintained [40]. Additionally, research shows that metal alloys such as CoCrMo are less exposed to the colonization of bacteria, in particular Candida spp., which is responsible for the development of oral candidiasis and, consequently, the inability to use dentures [41]. The results of the conducted research in this study indicate that, in clinical practice, the use of toothpastes containing sodium fluoride as an ingredient, as well as alcoholic and water-based commercial mouthwashes, will also influence the durability of the Wirobond® C dental alloy.

4. Conclusions

The results of the research obtained in this study acted as the basis for formulating the following conclusions:
The corrosion resistance tests centered around the Bego Wirobond® C dental alloy containing Co 59.8(8) wt.%, Cr 31.5(4) wt.%, and Mo 8.8(6) wt.% in the environment of artificial saliva, both before (1) (2) and after being modified with NaF (3) (4), Listerine® (5), and Meridol® (6) mouthwashes, and comparatively in a physiological saline solution (7), revealed the susceptibility of the tested material to pitting corrosion. The results obtained using the anodic polarization curves j = f(E) confirmed the passivation process that takes place on the tested material. The lowest corrosion resistance was obtained in the artificial saliva solution with pH = 7.4 (1). The highest corrosion resistance for the CoCrMo dental alloy after electrochemical tests was obtained in a saliva solution with pH = 5.5 and the addition of NaF (4). The corrosion resistance of the CoCrMo alloy is related to the chemical composition of the environment in which the corrosion tests were carried out. The results obtained were unambiguous, indicating the effects of modifying the artificial saliva environment on the resistance of the CoCrMo dental alloy. It was shown that F ions help to improve corrosion resistance in the artificial saliva environment by supporting the construction of the passive layer.
The use of electrochemical impedance spectroscopy in the study of pitting corrosion that occurs on the CoCrMo alloy in the tested corrosion environments allowed the impedance of the electrode–solution interface to be characterized by approximating the impedance data using the CPE1 model of the electrical equivalent circuit. On the basis of the obtained impedance spectra, the activation mechanism of the corrosion processes was found in all of the subject’s environments.
The SKP characterization of the CoCrMo alloy after corrosion tests revealed the effect of artificial saliva modification on the electronic properties of the Bego Wirobond® C dental alloy.

Author Contributions

Conceptualization, B.Ł. and K.G.-K.; methodology, B.Ł., P.O. and J.K.; validation, P.O., J.K. and K.G.-K.; formal analysis, B.Ł., P.O., J.K. and K.G.-K.; investigation, B.Ł., P.O., J.K., and K.G.-K.; resources, B.Ł. and K.G.-K.; data curation, P.O. and J.K.; writing—original draft preparation, B.Ł., P.O. and J.K.; writing—review and editing, K.G.-K.; visualization, P.O. and J.K.; funding acquisition, B.Ł. All authors have read and agreed to the published version of the manuscript.

Funding

This research received no external funding.

Institutional Review Board Statement

Not applicable.

Informed Consent Statement

Not applicable.

Data Availability Statement

Data are contained within the article.

Conflicts of Interest

The authors declare no conflict of interest.

References

  1. Petković Didović, M.; Jelovica Badovinac, I.; Fiket, Ž.; Žigon, J.; Rinčić Mlinarić, M.; Čanadi Jurešić, G. Cytotoxicity of Metal Ions Released from NiTi and Stainless Steel Orthodontic Appliances, Part 1: Surface Morphology and Ion Release Variations. Materials 2023, 16, 4156. [Google Scholar] [CrossRef] [PubMed]
  2. Robles, D.; Brizuela, A.; Fernández-Domínguez, M.; Gil, J. Corrosion Resistance and Titanium Ion Release of Hybrid Dental Implants. Materials 2023, 16, 3650. [Google Scholar] [CrossRef] [PubMed]
  3. Correa-Rossi, M.; Romero-Resendiz, L.; Leal-Bayerlein, D.; Garcia-Alves, A.L.; Segovia-López, F.; Amigó-Borrás, V. Mechanical, Corrosion, and Ion Release Studies of Ti-34Nb-6Sn Alloy with Comparable to the Bone Elastic Modulus by Powder Metallurgy Method. Powders 2022, 1, 3–17. [Google Scholar] [CrossRef]
  4. Arakelyan, M.; Spagnuolo, G.; Iaculli, F.; Dikopova, N.; Antoshin, A.; Timashev, P.; Turkina, A. Minimization of adverse effects associated with dental alloys. Materials 2022, 15, 7476. [Google Scholar] [CrossRef]
  5. Dudek, K.; Dulski, M.; Łosiewicz, B. Functionalization of the NiTi shape memory alloy surface by HAp/SiO2/Ag hybrid coatings formed on SiO2-TiO2 glass interlayer. Materials 2020, 13, 1648. [Google Scholar] [CrossRef] [PubMed]
  6. Aniołek, K.; Łosiewicz, B.; Kubisztal, J.; Osak, P.; Stróż, A.; Barylski, A.; Kaptacz, S. Mechanical properties, corrosion resistance and bioactivity of oxide layers formed by isothermal oxidation of Ti–6Al–7Nb alloy. Coatings 2021, 11, 505. [Google Scholar] [CrossRef]
  7. Zatkalíková, V.; Halanda, J.; Vaňa, D.; Uhríčik, M.; Markovičová, L.; Štrbák, M.; Kuchariková, L. Corrosion Resistance of AISI 316L Stainless Steel Biomaterial after Plasma Immersion Ion Implantation of Nitrogen. Materials 2021, 14, 6790. [Google Scholar] [CrossRef] [PubMed]
  8. Szklarska, M.; Dercz, G.; Simka, W.; Łosiewicz, B.A.c. impedance study on the interfacial properties of passivated Ti13Zr13Nb alloy in physiological saline solution. Surf. Interface Anal. 2014, 46, 698–701. [Google Scholar] [CrossRef]
  9. Motoyoshi, M. (Ed.) Current Techniques and Materials in Dentistry; MDPI AG: Basel, Switzerland, 2022; ISBN 3036544135. [Google Scholar]
  10. Givan, D.A. Precious metal alloys for dental applications. In Precious Metals for Biomedical Applications; Elsevier: Amsterdam, The Netherlands, 2014; pp. 109–129. [Google Scholar] [CrossRef]
  11. Sinyakova, E.F.; Vasilyeva, I.G.; Oreshonkov, A.S.; Goryainov, S.V.; Karmanov, N.S. Formation of Noble Metal Phases (Pt, Pd, Rh, Ru, Ir, Au, Ag) in the Process of Fractional Crystallization of the CuFeS2 Melt. Minerals 2022, 12, 1136. [Google Scholar] [CrossRef]
  12. Stróż, A.; Dercz, G.; Chmiela, B.; Stróż, D.; Łosiewicz, B. Electrochemical formation of second generation TiO2 nanotubes on Ti13Nb13Zr alloy for biomedical applications. Acta Phys. Pol. 2016, 130, 1079–1080. [Google Scholar] [CrossRef]
  13. Łosiewicz, B.; Osak, P.; Maszybrocka, J.; Kubisztal, J.; Stach, S. Effect of autoclaving time on corrosion resistance of sandblasted Ti G4 in artificial saliva. Materials 2020, 13, 4154. [Google Scholar] [CrossRef] [PubMed]
  14. Padrós, R.; Giner-Tarrida, L.; Herrero-Climent, M.; Punset, M.; Gil, F.J. Corrosion Resistance and Ion Release of Dental Prosthesis of CoCr Obtained by CAD-CAM Milling, Casting and Laser Sintering. Metals 2020, 10, 827. [Google Scholar] [CrossRef]
  15. Uriciuc, W.A.; Boșca, A.B.; Băbțan, A.-M.; Vermeșan, H.; Cristea, C.; Tertiș, M.; Pășcuță, P.; Borodi, G.; Suciu, M.; Barbu-Tudoran, L.; et al. Study on the Surface of Cobalt-Chromium Dental Alloys and Their Behavior in Oral Cavity as Cast Materials. Materials 2022, 15, 3052. [Google Scholar] [CrossRef]
  16. Kajzer, W.; Szewczenko, J.; Kajzer, A.; Basiaga, M.; Jaworska, J.; Jelonek, K.; Nowińska, K.; Kaczmarek, M.; Orłowska, A. Physical Properties of Electropolished CoCrMo Alloy Coated with Biodegradable Polymeric Coatings Releasing Heparin after Prolonged Exposure to Artificial Urine. Materials 2021, 14, 2551. [Google Scholar] [CrossRef] [PubMed]
  17. Mace, A.; Khullar, P.; Bouknight, C.; Gilbert, J.L. Corrosion properties of low carbon CoCrMo and additively manufactured CoCr alloys for dental applications. Dent. Mater. 2022, 38, 1184–1193. [Google Scholar] [CrossRef] [PubMed]
  18. ISO 10271:2021; Dentistry—Corrosion Test Methods for Metallic Materials. ISO: Geneva, Switzerland, 2021.
  19. ISO 22674:2023-03; Dentistry—Metallic Materials for Fixed and Removable Restorations and Appliances. ISO: Geneva, Switzerland, 2023.
  20. ISO 9693-1:2012; Dentistry—Compatibility Testing—Part 1: Metal-Ceramic Systems. ISO: Geneva, Switzerland, 2012.
  21. ISO 13485:2016-04; Medical Devices—Quality Management System—Requirements for Regulatory Purposes. ISO: Geneva, Switzerland, 2012.
  22. Tehnicaldent. Available online: https://www.tehnicaldent.ro/11606-wirobond-c (accessed on 10 October 2023).
  23. Gyenesdent. Available online: https://gyenesdent.at/zahnersatz-gyor-ungarn (accessed on 10 October 2023).
  24. Bnb-dental. Available online: https://bnb-dental.com/producto/wirobond-c-bego-por-1gr (accessed on 11 October 2023).
  25. ISO 10993-5:2009; Biological Evaluation of Medical Devices—Part 5: Tests for In Vitro Cytotoxicity. ISO: Geneva, Switzerland, 2009.
  26. ISO 6507-1:2018-05; Metallic Materials—Vickers Hardness Test—Part 1: Test Method. ISO: Geneva, Switzerland, 2018.
  27. AFNOR/NF Standard S90-701; Matériel Médico-Chirurgical—Biocompatibilité des Matériaux et Dispositifs Médicaux—Méthodes d’extraction. French Standardization Association: Paris, France, 1988.
  28. Boukamp, B.A. A Linear Kronig-Kramers transform test for immittance data validation. J. Electrochem. Soc. 1995, 142, 1885–1894. [Google Scholar] [CrossRef]
  29. Branzoi, I.V.; Iordoc, M.; Codescu, M.M. Corrosion behaviour of CoCrMo and CoCrTi alloys in simulated body fluids. UPB Sci. Bull. Ser. B Chem. Mater. Sci. 2007, 69, 11–18. [Google Scholar]
  30. Łosiewicz, B.; Osak, P.; Górka-Kulikowska, K. Electrophoretic Deposition of Multi-Walled Carbon Nanotubes Coatings on CoCrMo Alloy for Biomedical Applications. Micromachines 2023. under review. [Google Scholar]
  31. Lasia, A. Electrochemical Impedance Spectroscopy and Its Applications; Springer Science + Business Media: New York, NY, USA, 2014; ISBN 978-1-4614-8932-0. [Google Scholar]
  32. Okamoto, G. Passive film of 18-8 stainless steel structure and its function. Corros. Sci. 1973, 13, 471–489. [Google Scholar] [CrossRef]
  33. Takeno, N. Atlas of Eh-pH Diagrams—Intercomparison of Thermodynamic Databases; Open File Report No. 419; Geological Survey of Japan: Tsukuba, Japan, 2005. [Google Scholar]
  34. Chang, H.-S.; Peng, Y.-T.; Hung, W.-L.; Hsu, M.-L. Evaluation of Marginal Adaptation of Co-Cr-Mo Metal Crowns Fabricated by Traditional Method and Computer-Aided Technologies. J. Dent. Sci. 2019, 14, 288–294. [Google Scholar] [CrossRef]
  35. Puskar, T.; Jevremovic, D.; Williams, R.J.; Eggbeer, D.; Vukelic, D.; Budak, I. A Comparative Analysis of the Corrosive Effect of Artificial Saliva of Variable pH on DMLS and Cast Co-Cr-Mo Dental Alloy. Materials 2014, 7, 6486–6501. [Google Scholar] [CrossRef] [PubMed]
  36. Galo, R.; Ribeiro, R.F.; Rodrigues, R.C.S.; Rocha, L.A.; Mattos, M.D.G.C.D. Effects of Chemical Composition on the Corrosion of Dental Alloys. Braz. Dent. J. 2012, 23, 141–148. [Google Scholar] [CrossRef] [PubMed]
  37. Pupim, D.; Peixoto, R.F.; Macedo, A.P.; Palma-Dibb, R.G.; Mattos, M.D.G.C.D.; Galo, R. Influence of the Commercial Mouthwashes on the Corrosion Behaviour of Dental Alloy. Mater. Res. 2022, 25, e20210385. [Google Scholar] [CrossRef]
  38. Molina, C.; Nogués, L.; Martinez-Gomis, J.; Peraire, M.; Salsench, J.; Sevilla, P.; Gil, F.J. Dental casting alloys behaviour during power toothbrushing with toothpastes of various abrasivities. Part II: Corrosion and ion release. J. Mater. Sci. Mater. Med. 2008, 19, 3015–3019. [Google Scholar] [CrossRef]
  39. Mayinger, F.; Micovic, D.; Schleich, A.; Roos, M.; Eichberger, M.; Stawarczyk, B. Retention Force of Polyetheretherketone and Cobalt-Chrome-Molybdenum Removable Dental Prosthesis Clasps after Artificial Aging. Clin. Oral Investig. 2021, 25, 3141–3149. [Google Scholar] [CrossRef] [PubMed]
  40. Mylonas, P.; Milward, P.; McAndrew, R. Denture Cleanliness and Hygiene: An Overview. Br. Dent. J. 2022, 233, 20–26. [Google Scholar] [CrossRef] [PubMed]
  41. Rocha Gusmão, J.M.; Ferreira dos Santos, S.S.; Piero Neisser, M.; Cardoso Jorge, A.O.; Ivan, F. Correlation between Factors Associated with the Removable Partial Dentures Use and Candida Spp. in Saliva. Gerodontology 2011, 28, 283–288. [Google Scholar] [CrossRef]
Figure 1. Wirobond® C dental alloy. (a) Ref [22]; (b) the alloy used in the dental and prosthetic office for partial dentures [23]; (c) the trading condition of the alloy (available as cylinders) [24].
Applsci 13 12185 g001
Figure 2. The commercial CoCrMo alloy. (a) SEM image of the sample after inclusion in graphite; (b) SEM image of the surface morphology in the selected microregion marked as the red square for EDS microanalysis; (c) EDS spectrum collected in the investigated microregion.
Applsci 13 12185 g002
Figure 3. The relationship EOC = f(t) for the CoCrMo electrode in the applied corrosion environments at 37 °C.
Applsci 13 12185 g003
Figure 4. CPE1 model for the equivalent electrical circuit (used for the pitting corrosion of the CoCrMo electrode in the biological environment).
Applsci 13 12185 g004
Figure 5. Experimental (symbols) and simulated (lines) Nyquist diagrams in the form −Z″ = f(Z′) for the CoCrMo electrode in the applied corrosion environments at a temperature of 37 °C. The inset shows the high-frequency (HF) part.
Applsci 13 12185 g005
Figure 6. Experimental (symbols) and simulated (lines) Bode diagrams in the form of Φ = f(log f) for the CoCrMo electrode in the applied corrosion environments at a temperature of 37 °C.
Applsci 13 12185 g006
Figure 7. Experimental (symbols) and simulated (lines) Bode diagrams in the form of log|Z| = f(log f) for the CoCrMo electrode in the applied corrosion environments at a temperature of 37 °C.
Applsci 13 12185 g007
Figure 8. Anodic polarization curves for the CoCrMo electrode in the applied corrosion environments at 37 °C.
Applsci 13 12185 g008
Figure 9. Exemplary contact potential difference (CPD) map for the CoCrMo electrode after corrosion tests in: (a) (1) saliva with pH = 7.4; (b) (6) saliva with pH = 7.4 + 15 mL of Meridol®; (c) (3) saliva with pH = 7.4 + 0.1 M NaF; (d) (2) saliva with pH = 5.5.
Applsci 13 12185 g009
Table 1. Wirobond® C dental alloy characteristics.
ParameterValue
Type (accord. to ISO 22674)4
Density8.5 g cm−3
Preheating temperature900–1000 °C
Solidus and liquidus temperature1360 °C, 1420 °C
Casting temperature 1500 °C
Young’s modulus180 GPa
Proof strength (Rp0.2)440 MPa
Ultimate strength (Rm)780 MPa
Elongation after fracture 16%
Vickers hardness310 HV10
Coefficient of thermal expansion (CTE)
25–500 °C, 10−6 K−1
14.3
Table 2. Chemical compositions of artificial saliva solutions prepared according to the AFNOR/NF standard S90-701 intended for testing the corrosion of the Wirobond® C dental alloy [27].
ComponentConcentration [mM]
Na2HPO41
KH2PO41.5
NaHCO318
KSCN 3
NaCl115
KCl 16
Table 3. Vickers microhardness results for the Wirobond® C dental alloy.
Number of MeasurementSample 1
[μHV0.3]
Sample 2
[μHV0.3]
1432468
2415418
3505414
4475456
5450488
6404472
7410453
8440401
9467417
10480443
Average value445
Standard deviation31
Table 4. Parameters of the electrical equivalent circuit obtained on the basis of the CNLS fitting of experimental EIS data for the CoCrMo electrode in the biological environment at 37 °C (see Figure 5, Figure 6 and Figure 7).
Electrolyte TypeR1
(Ω cm2)
CPE1-T
(F cm−2 sϕ−1)
CPE1R2
(Ω cm2)
Cdl
(F cm−2)
(1) saliva with pH = 7.4 [30]11.72(92)0.74(9) × 10−50.880(14)3.71(21) × 1044.11 × 10−6
(2) saliva with pH = 5.510.33(65)0.24(2) × 10−50.720(6)6.6(11) × 1047.72 × 10−6
(3) saliva with pH = 7.4 + 0.1 M NaF12.13(63)0.14(12) × 10−40.862(8)4.10(35) × 1057.00 × 10−6
(4) saliva with pH = 5.5 + 0.1 M NaF9.64(61)0.37(3) × 10−50.820(10)2.71(16) × 1047.77 × 10−7
(5) saliva with pH = 7.4 + 15 mL of Listerine®7.79(32)0.83(4) × 10−50.843(4)1.59(16) × 1065.26 × 10−6
(6) saliva with pH = 7.4 + 15 mL of Meridol®27.43(35)0.27(6) × 10−50.800(16)1.03(29) × 1069.97 × 10−7
(7) saline with pH = 7.4 6.39(34)0.14(9) × 10−40.881(5)1.43(17) × 1067.81 × 10−6
Table 5. Statistical parameters calculated using CPD maps of the CoCrMo alloy. CPDav is the arithmetic average, CPDrms is the root mean square deviation, CPDsk is the skewness, and CPDku is the excess kurtosis.
Electrolyte TypeCPDav
[mV]
CPDrms
[mV]
CPDskCPDku
(1) saliva with pH = 7.4−346.318.60.0010.10
(2) saliva with pH = 5.5−112.616.50.05−0.14
(3) saliva with pH = 7.4 + 0.1 M NaF−172.717.7−0.060.04
(4) saliva with pH = 5.5 + 0.1 M NaF−169.316.4−0.120.06
(5) saliva with pH = 7.4 + 15 mL of Listerine®−306.021.00.170.13
(6) saliva with pH = 7.4 + 15 mL of Meridol®−204.617.5−0.070.21
(7) saline with pH = 7.4−235.616.6−0.080.11
Disclaimer/Publisher’s Note: The statements, opinions and data contained in all publications are solely those of the individual author(s) and contributor(s) and not of MDPI and/or the editor(s). MDPI and/or the editor(s) disclaim responsibility for any injury to people or property resulting from any ideas, methods, instructions or products referred to in the content.

