
Experimental Studies on the Seismic Performance of Underwater Concrete Piers Strengthened by Self-Stressed Anti-Washout Concrete and Segments


Abstract
:1. Introduction
2. Experimental Program
2.1. Specimen Grouping and Design
2.1.1. Specimen Grouping and Comparison Setting
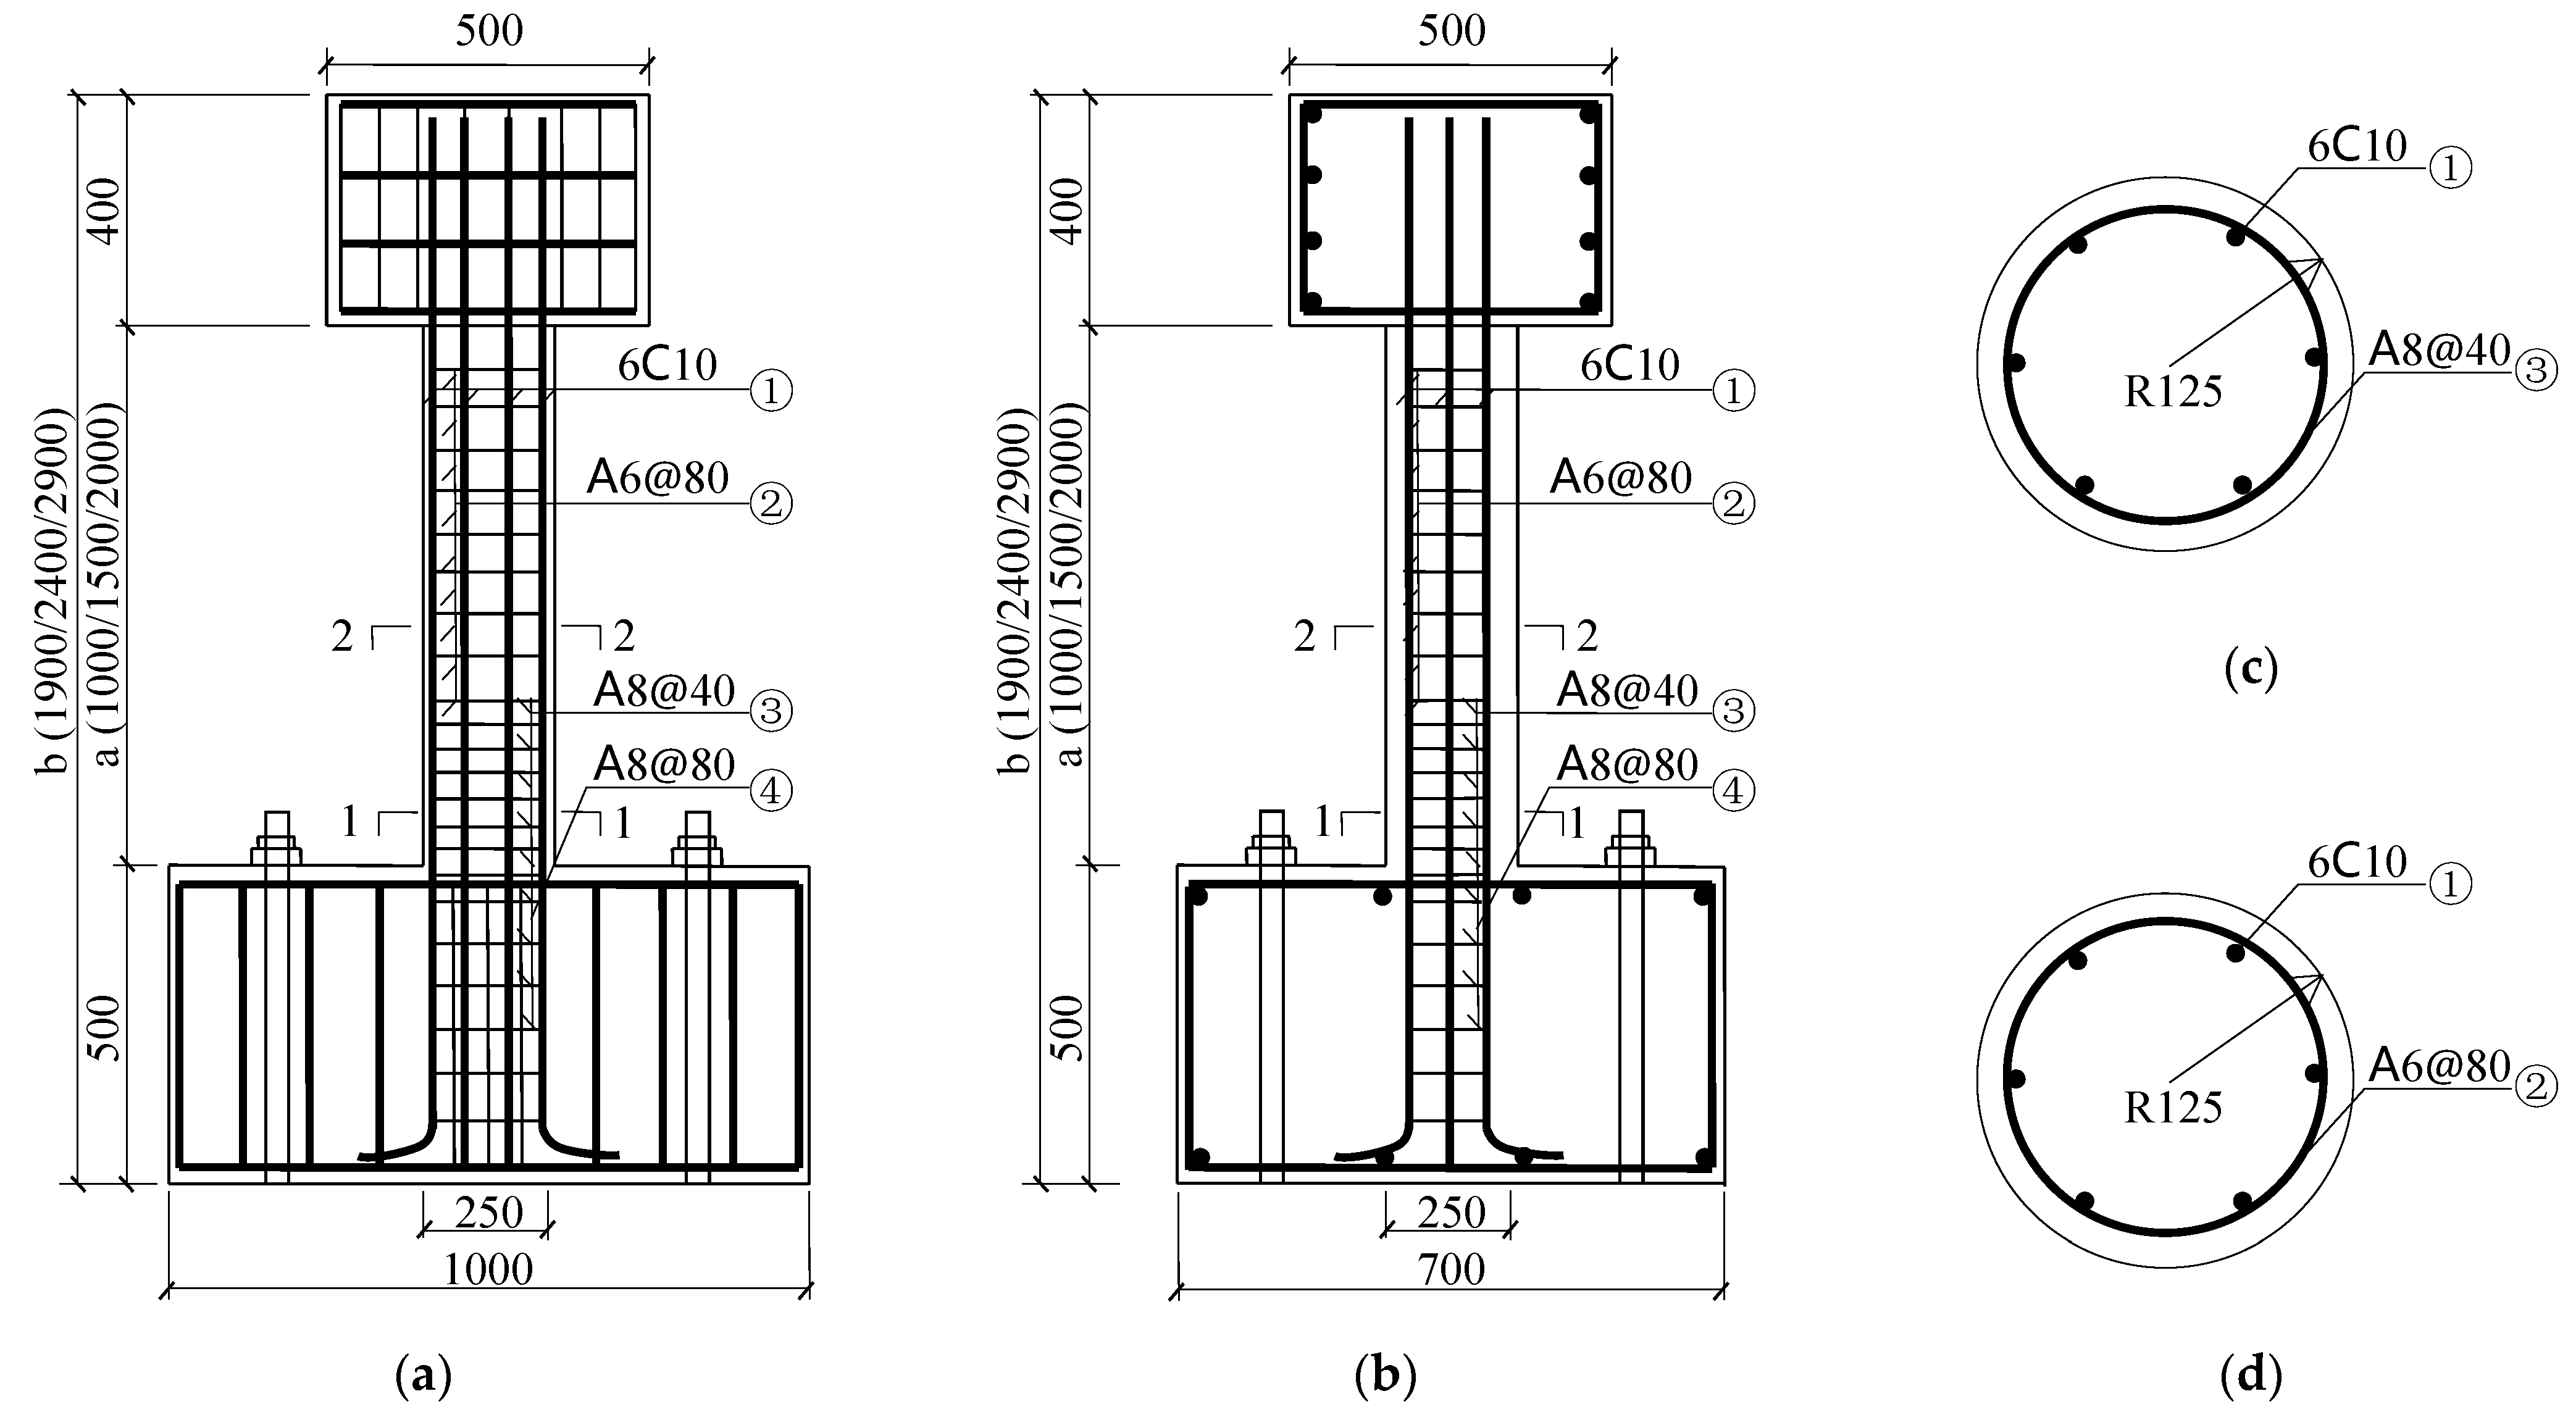
2.1.2. Unreinforced Core Pier Column Design
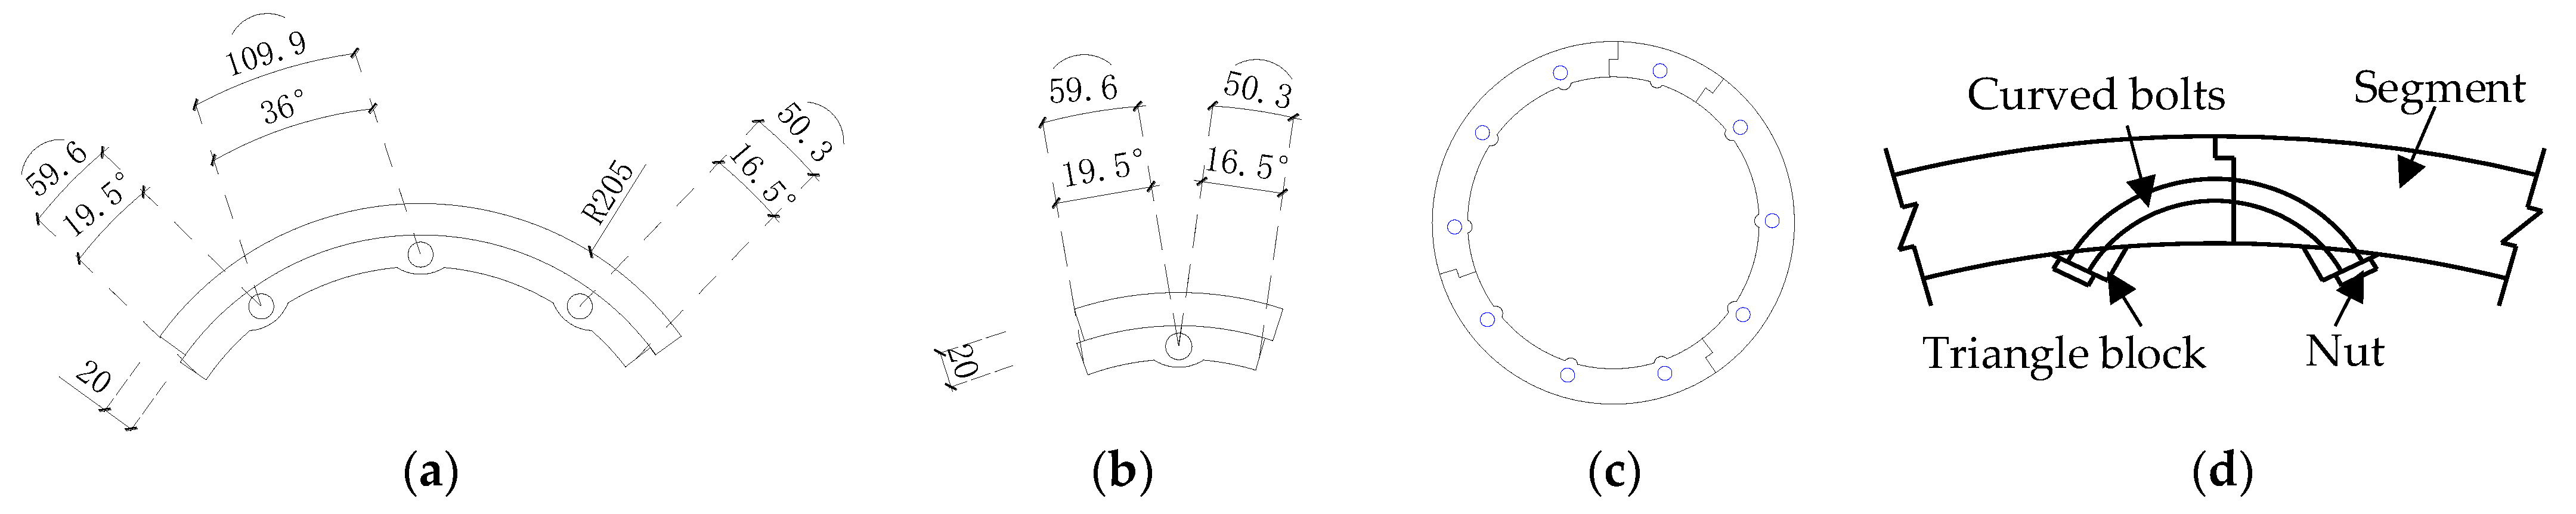
2.1.3. LCSS Design
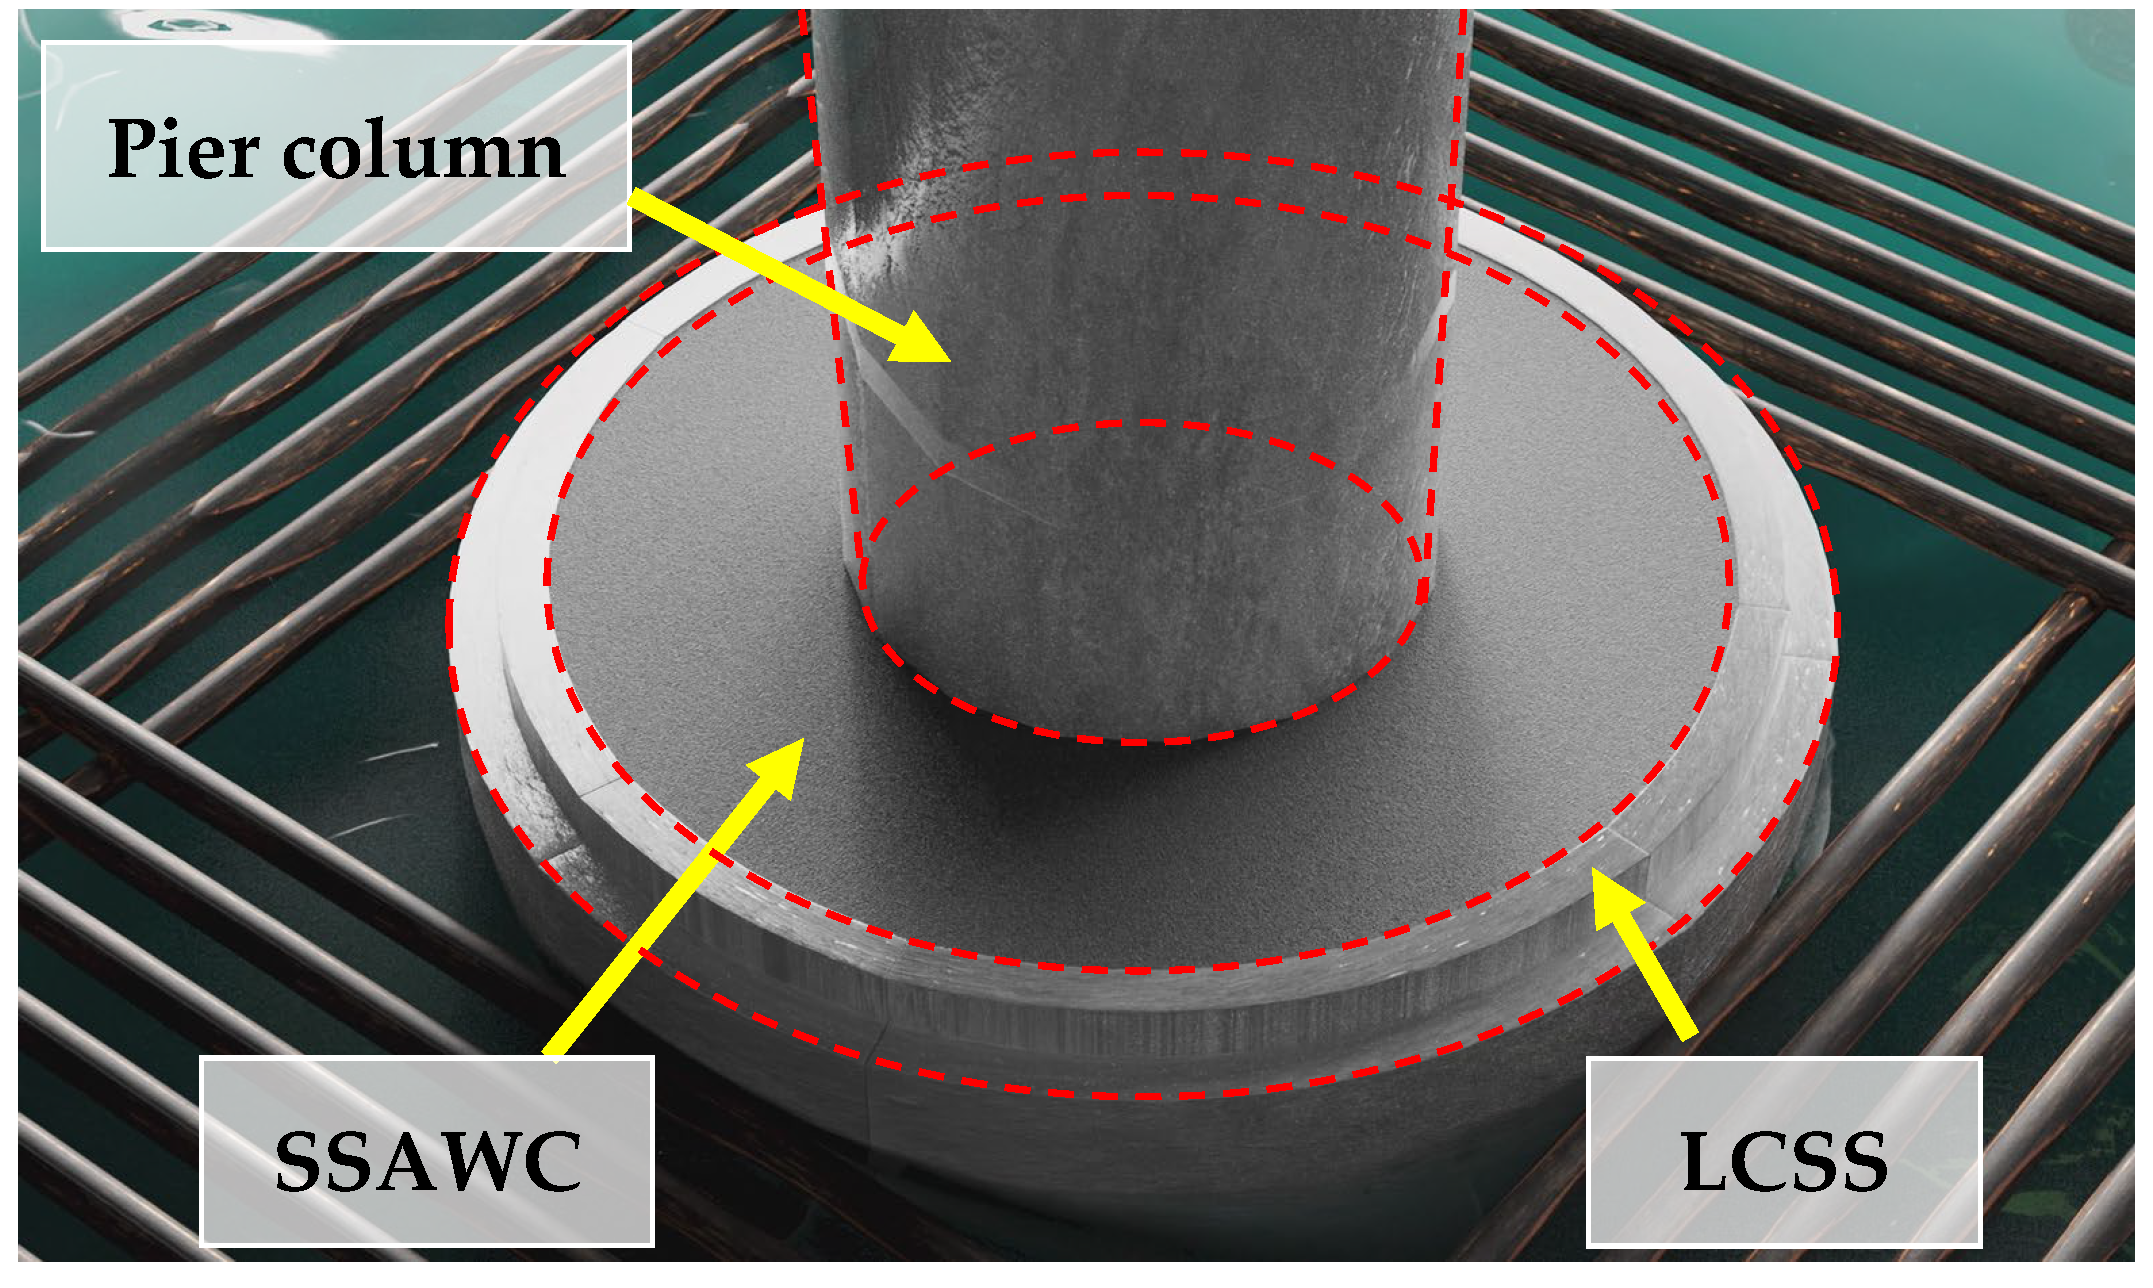
2.1.4. SSAWC Design

| Filled Concrete | Cement | Expansive Agent | Anti-Dispersion Agent | Sand | Stone | Water-Reducing Agent | Water |
|---|---|---|---|---|---|---|---|
| SSAWC | 460.98 | 51.22 | 15.37 | 623.28 | 923.92 | 7.68 | 210 |
| AWC | 512.20 | 0 | 15.37 | 623.28 | 923.92 | 7.68 | 210 |
| Material | Elastic Modulus (GPa) | Compressive Strength (MPa) | Axial Compressive Strength (MPa) | Axial Tensile/Yield Strength (MPa) | Poisson’s Ratio | Area (mm2) | Initial Setting Time (h) | Final Setting Time (h) |
|---|---|---|---|---|---|---|---|---|
| C30 concrete in column | 29.61 | 29.51 | 22.43 | 2.54 | 0.2 | 11.6 | 16.2 | |
| C40 filled concrete (AWC) | 33.16 | 42.56 | 32.35 | 3.11 | 0.2 | 18.3 | 21.0 | |
| C40 filled concrete (SSAWC) | 33.23 | 42.88 | 32.59 | 3.12 | 0.2 | 15.4 | 17.8 | |
| C40 concrete in LCSS | 33.45 | 43.96 | 33.72 | 3.16 | 0.2 | 9.5 | 14.4 | |
| Welded steel wire mesh | 180 | 210 | 0.3 | 1.13 | ||||
| 10 mm HRB400 steel rebar | 200 | 415 | 0.3 | 78.50 | ||||
| 8 mm HPB300 steel rebar | 200 | 355 | 0.3 | 50.24 | ||||
| 6 mm HPB300 steel rebar | 200 | 351 | 0.3 | 28.26 | ||||
| Circumferential/longitudinal bolts | 206 | 640 | 0.3 | 28.26/ 50.24 |
2.2. Specimen Preparation
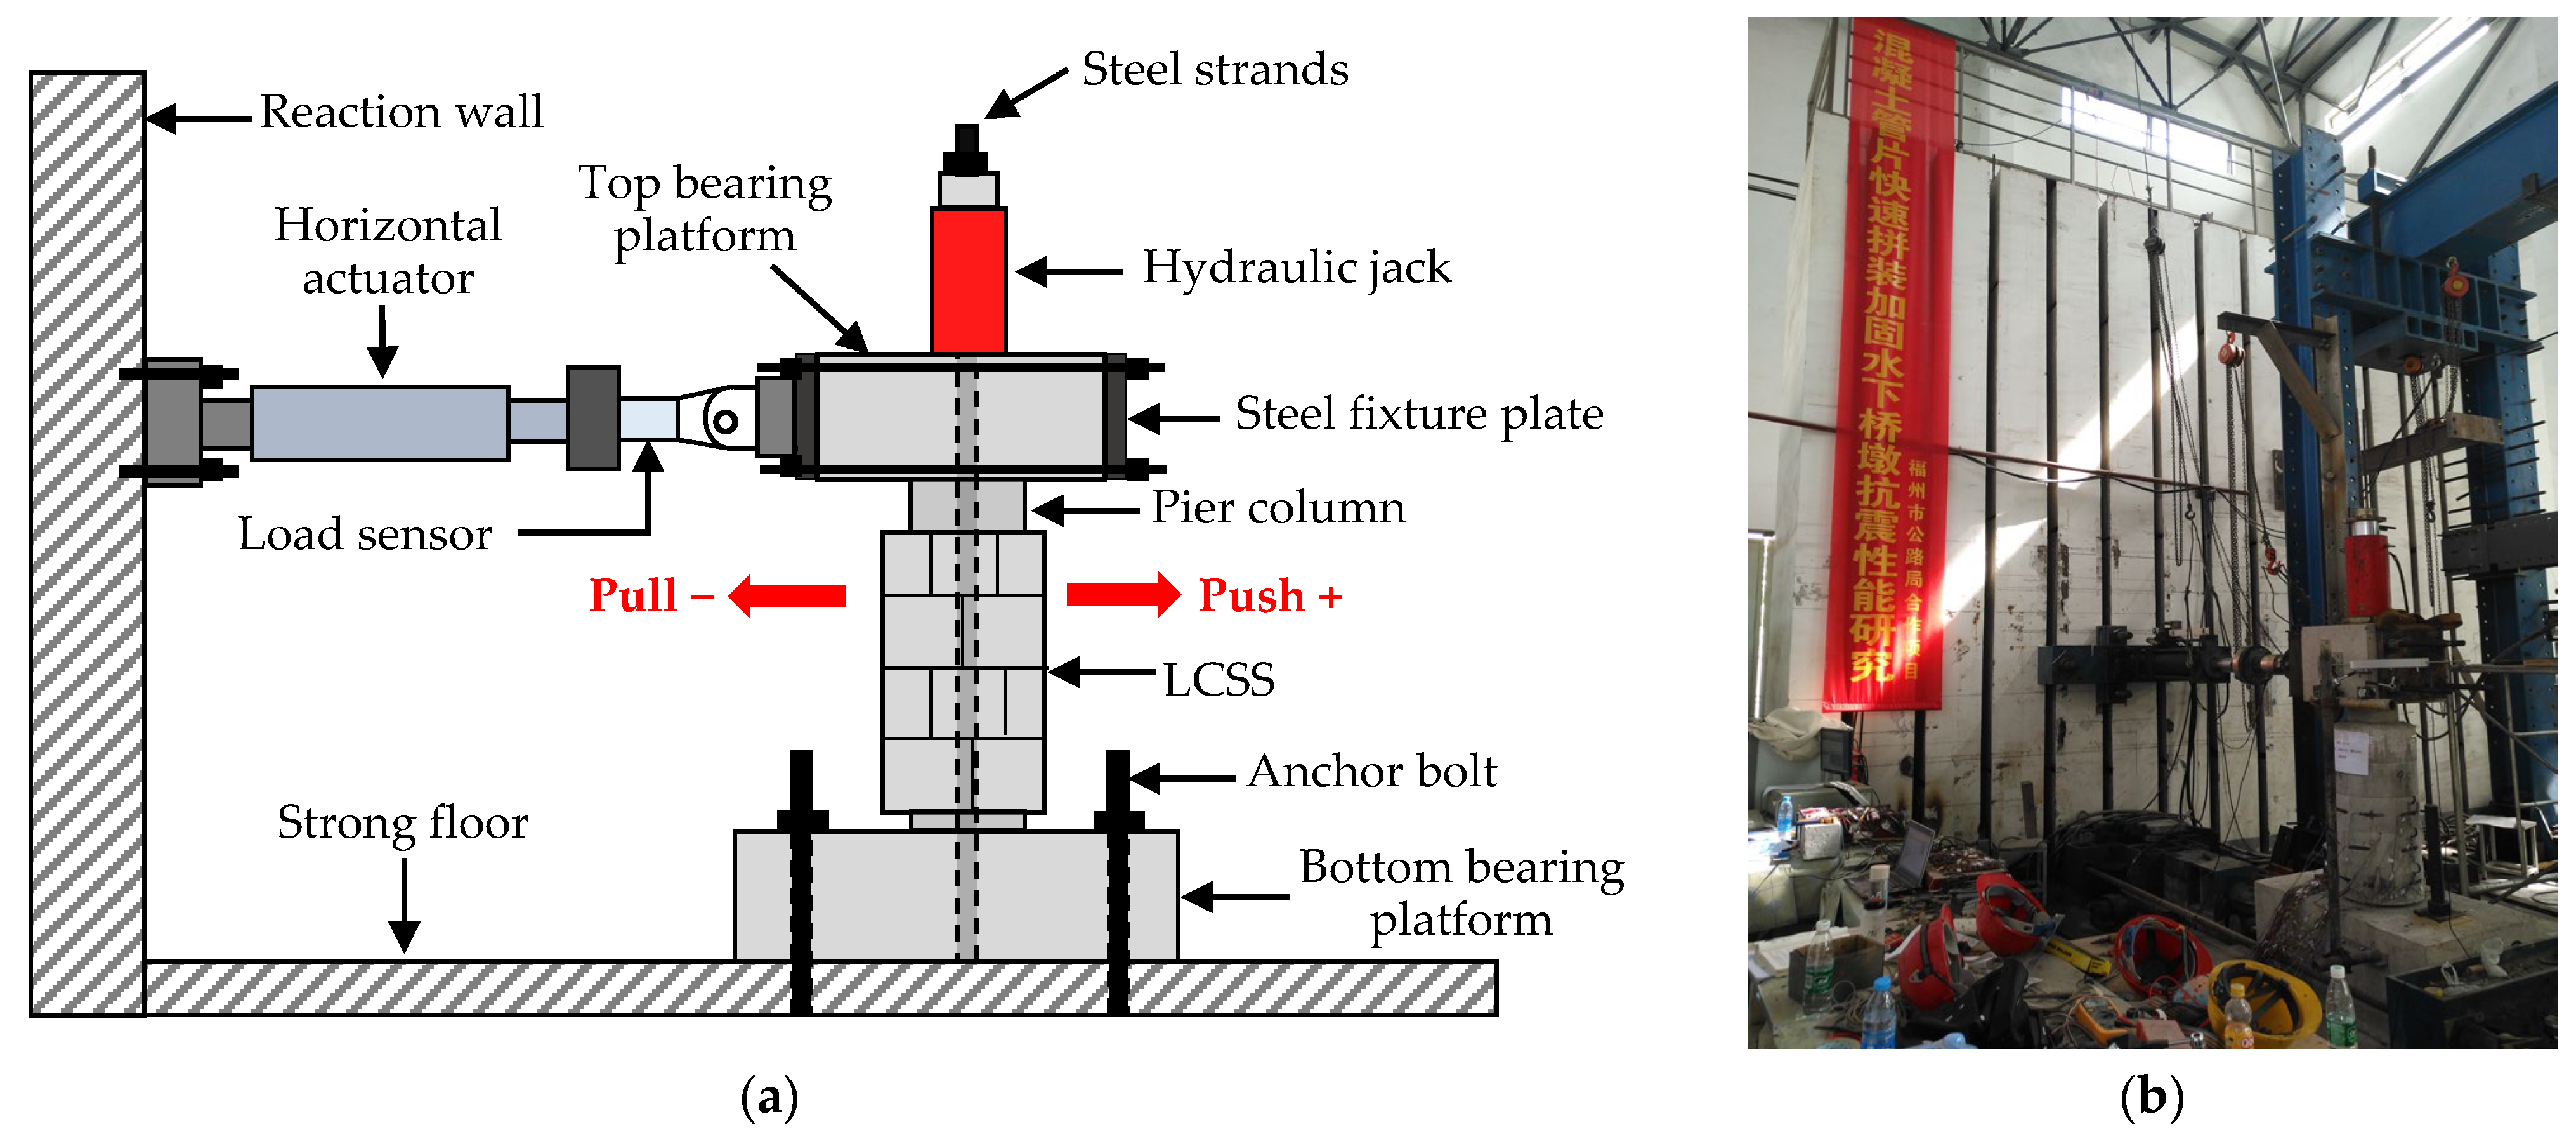
2.3. Test Setup
3. Experiment Results and Discussion
3.1. Failure Process and Modes
3.1.1. Unreinforced Specimens
3.1.2. Strengthened Specimens
3.2. Seismic Performance Analysis
3.2.1. Experimental Results of Seismic Performance Indicators
- (1)
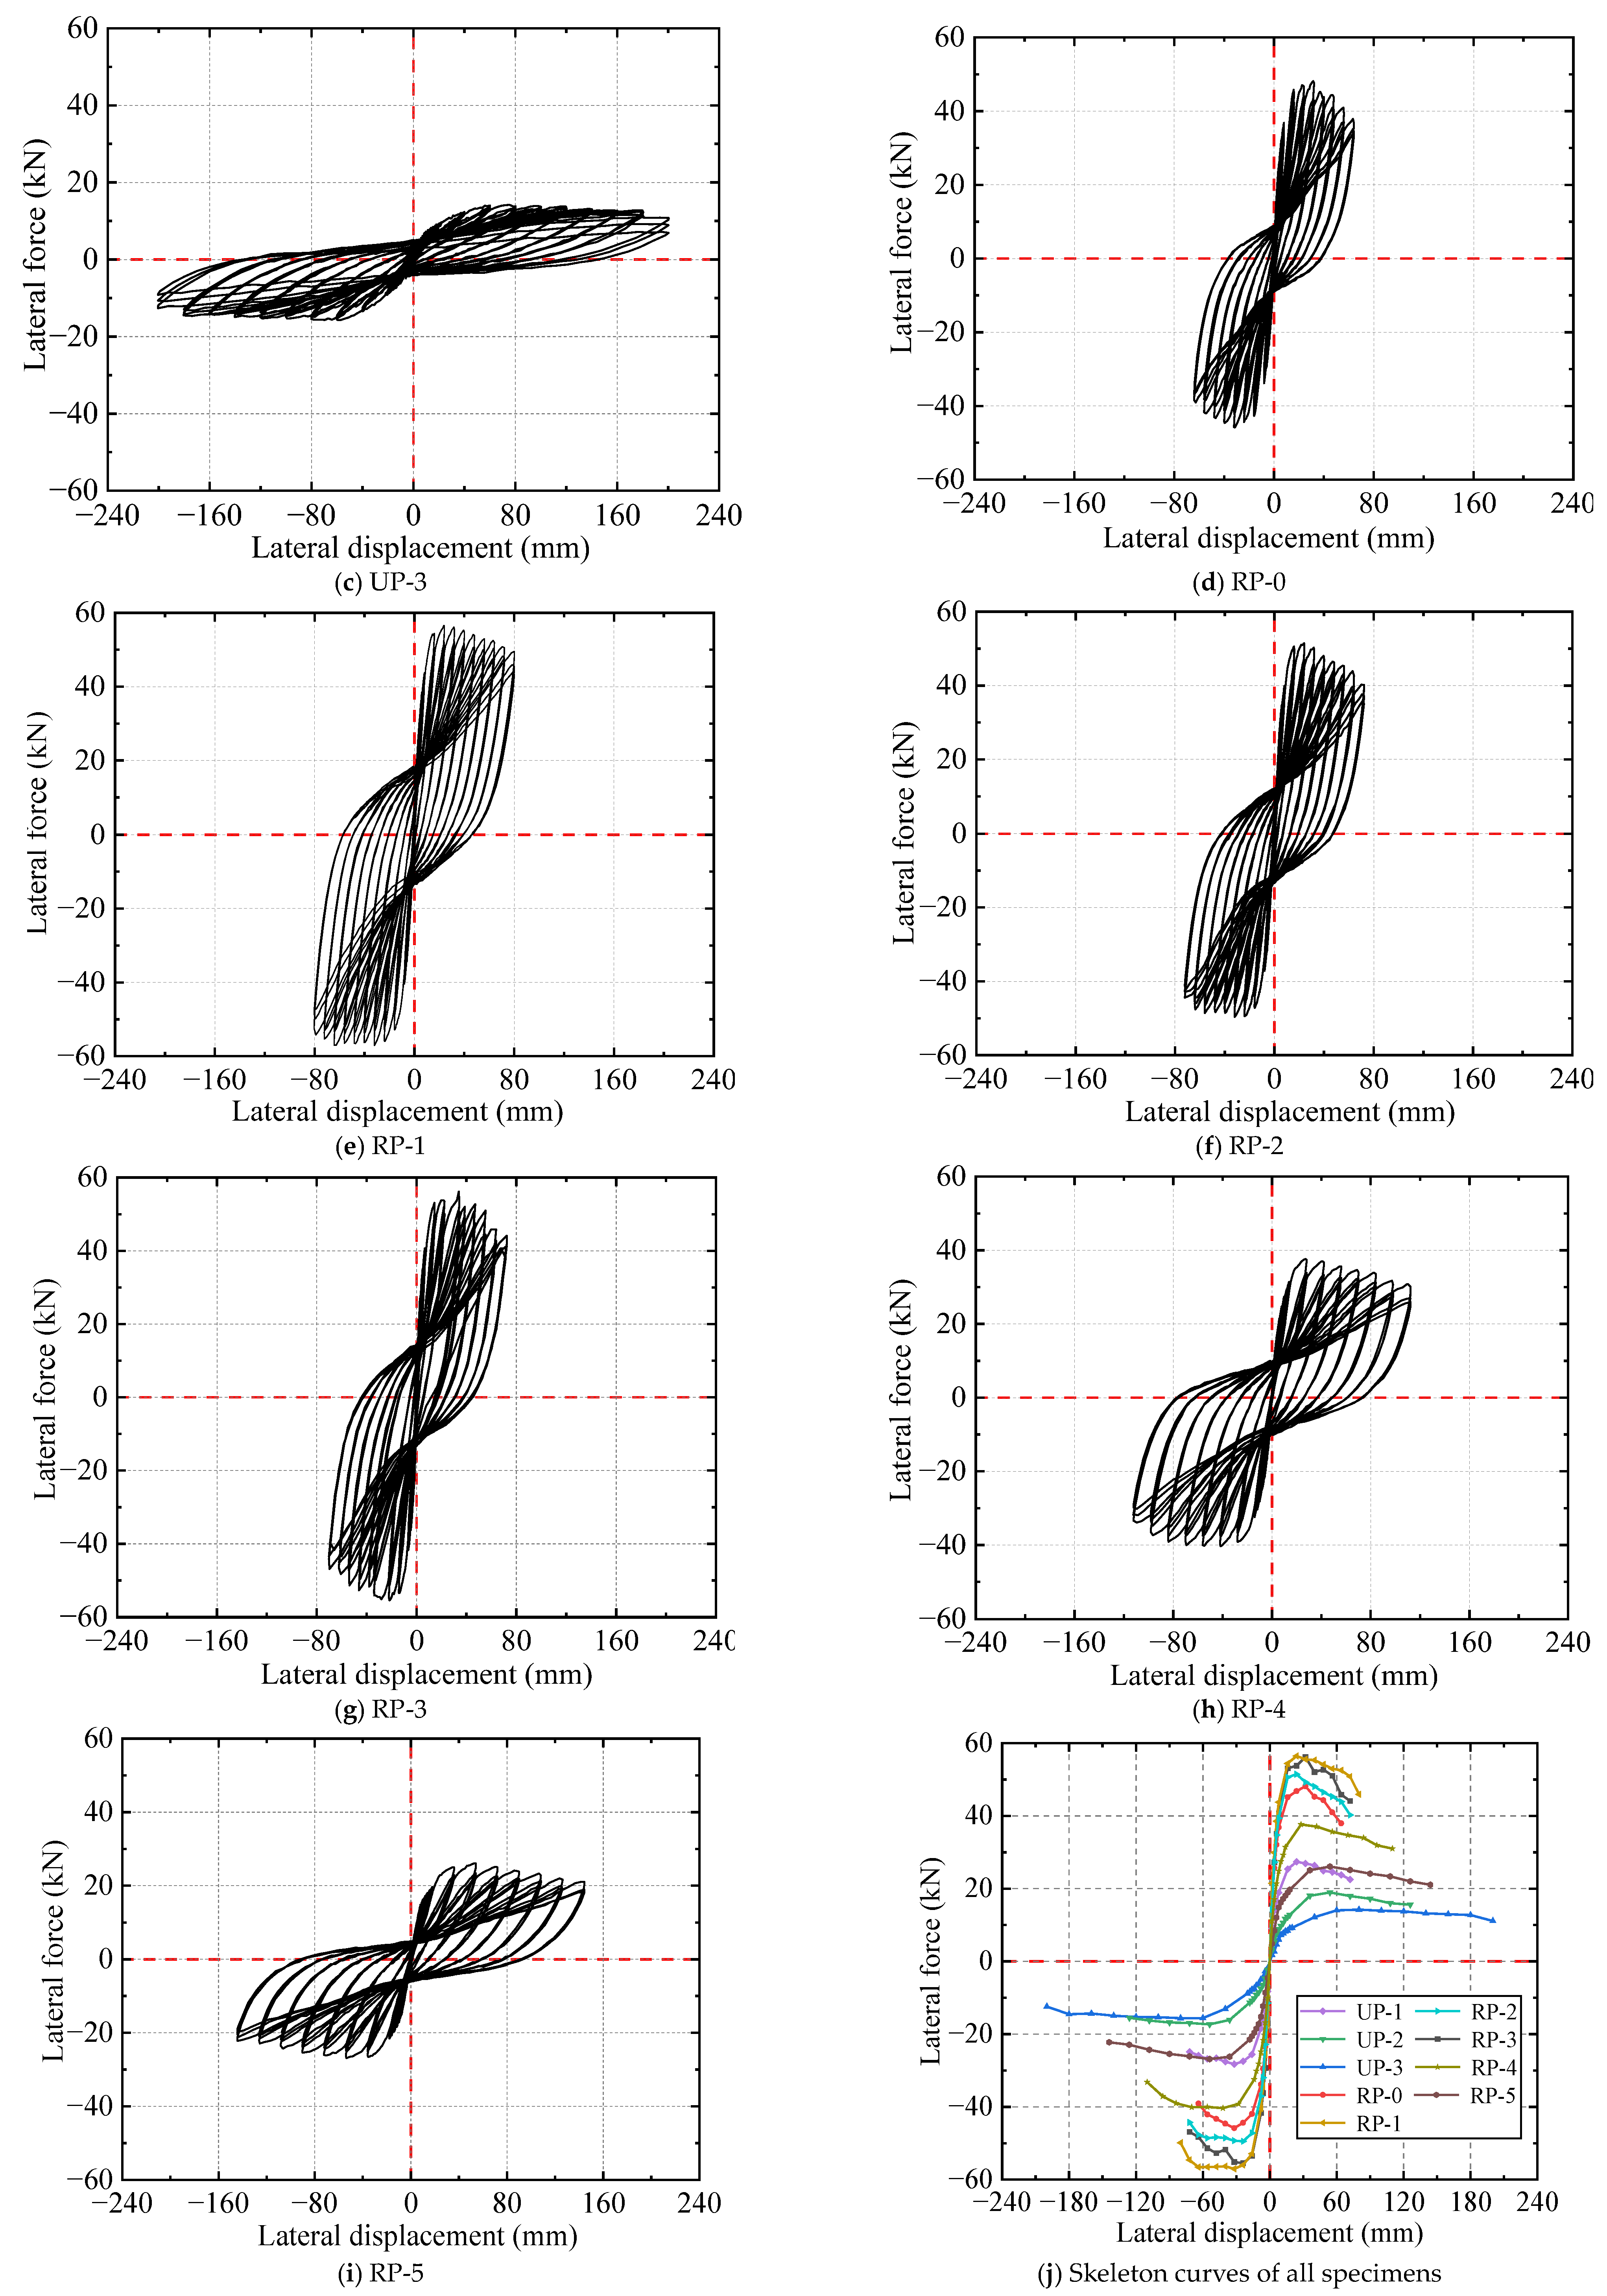
- Hysteretic Curves and Skeleton Curves
- (2)
- Bearing Capacity, Displacement, and Ductility
- (3)
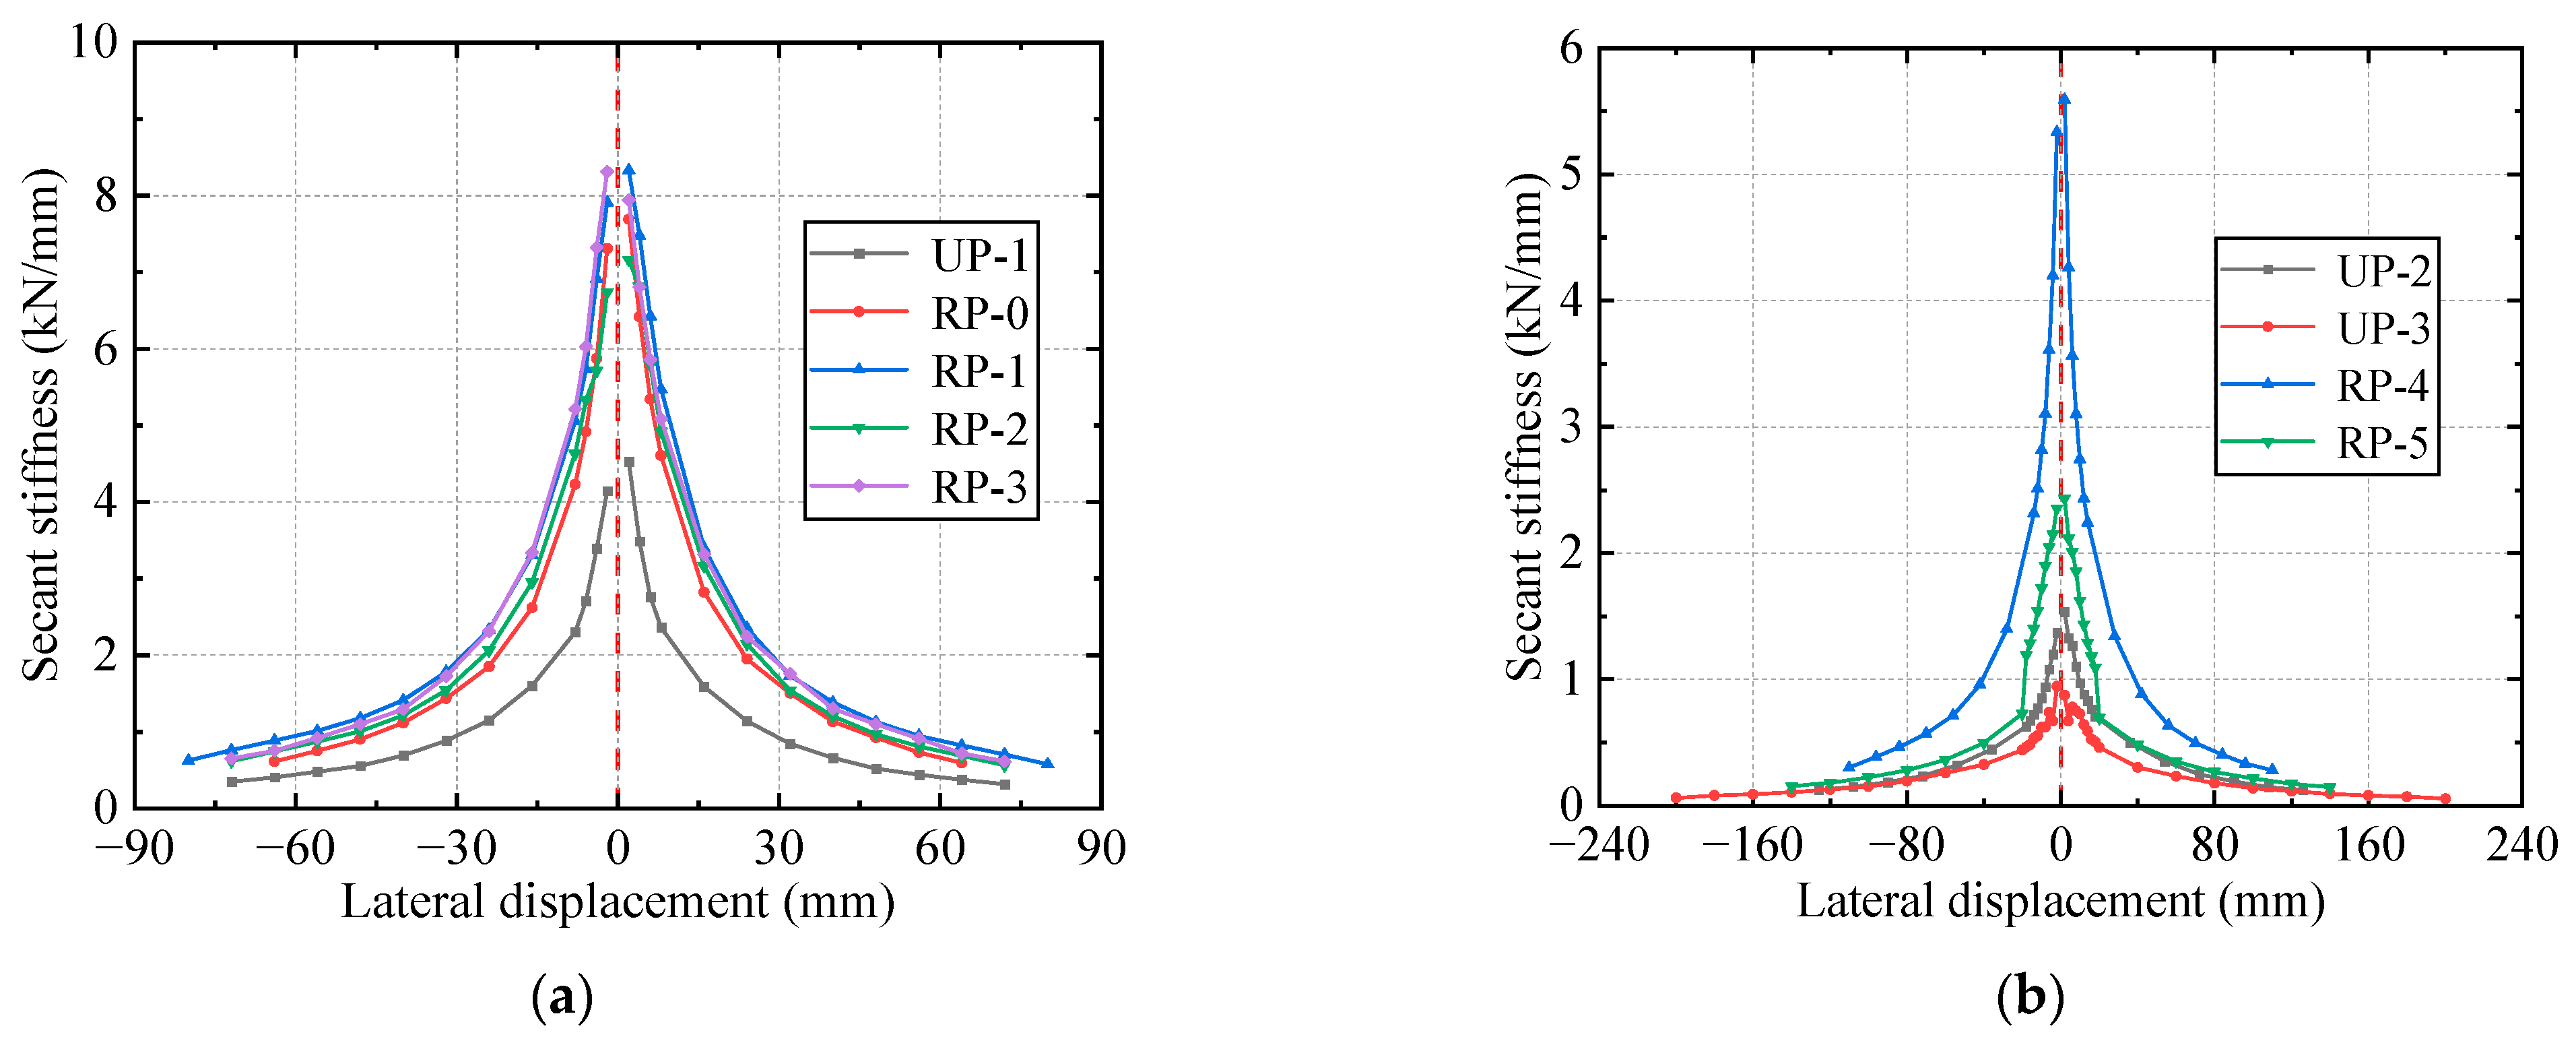
- Stiffness degradation
- (4)
- Energy Dissipation
3.2.2. Comparative Analysis Based on Different Influencing Factors
- (1)
- Seismic strengthening effect of the IPCSAM
- (2)
- Influence of self-stress on the strengthening effect
- (3)
- Influence of the LCSS reinforcement ratio on the strengthening effect
- (4)
- Influence of initial damage on the strengthening effect
- (5)
- Influence of length–diameter ratio on the strengthening effect
4. Extended Parameter Analysis
4.1. Finite Element Numerical Model
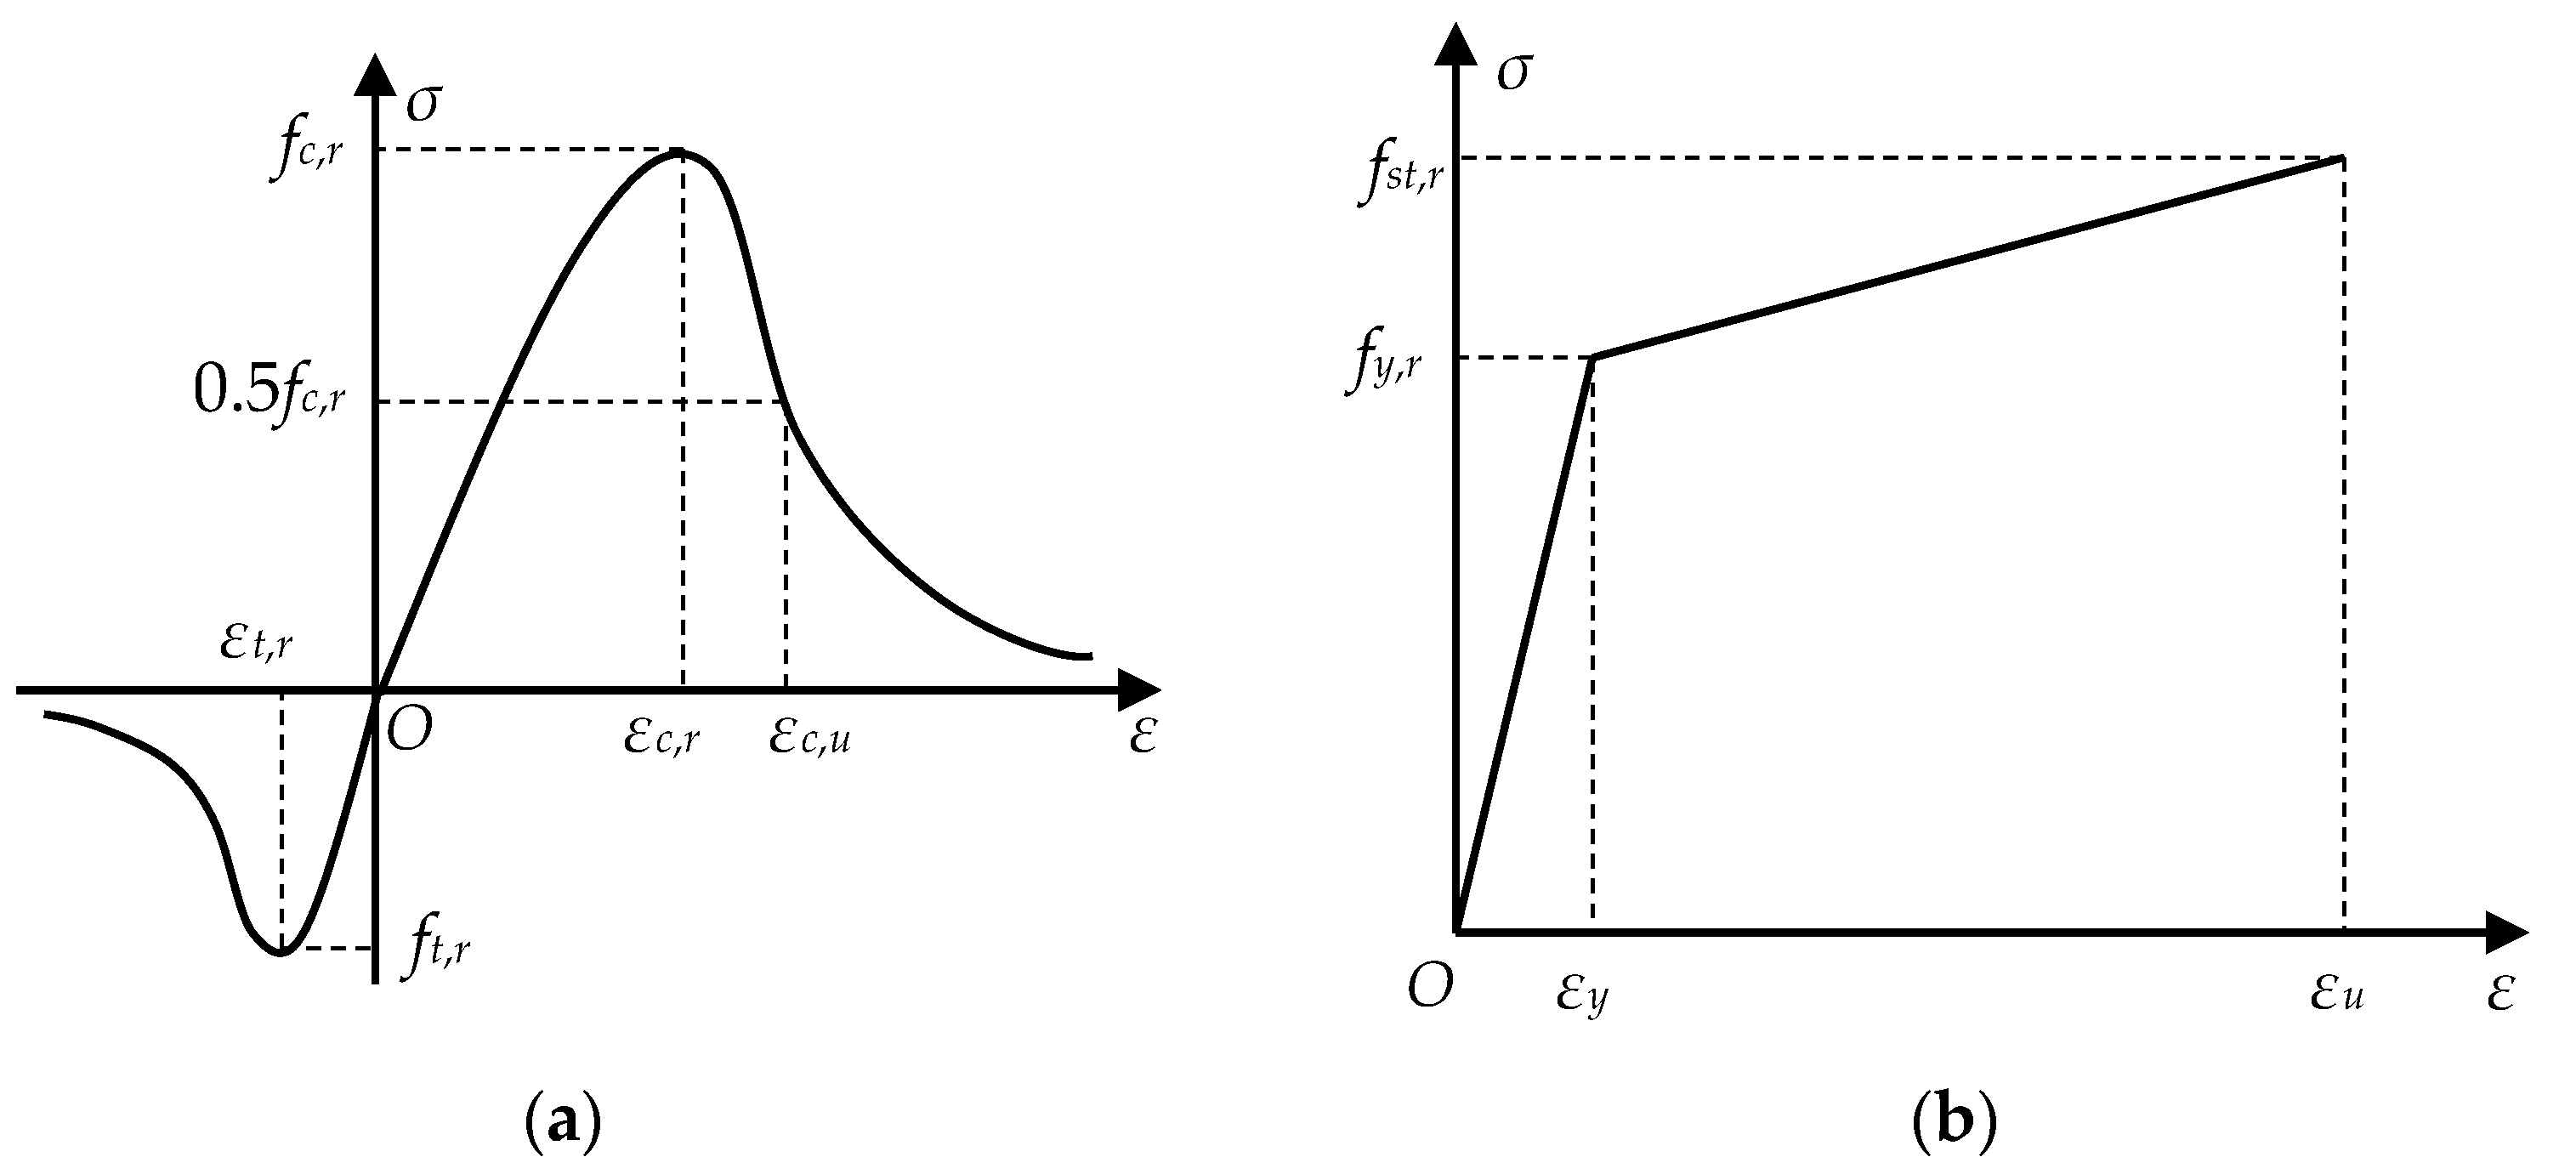
4.1.1. Material Constitutive Relationship and Parameter Setting
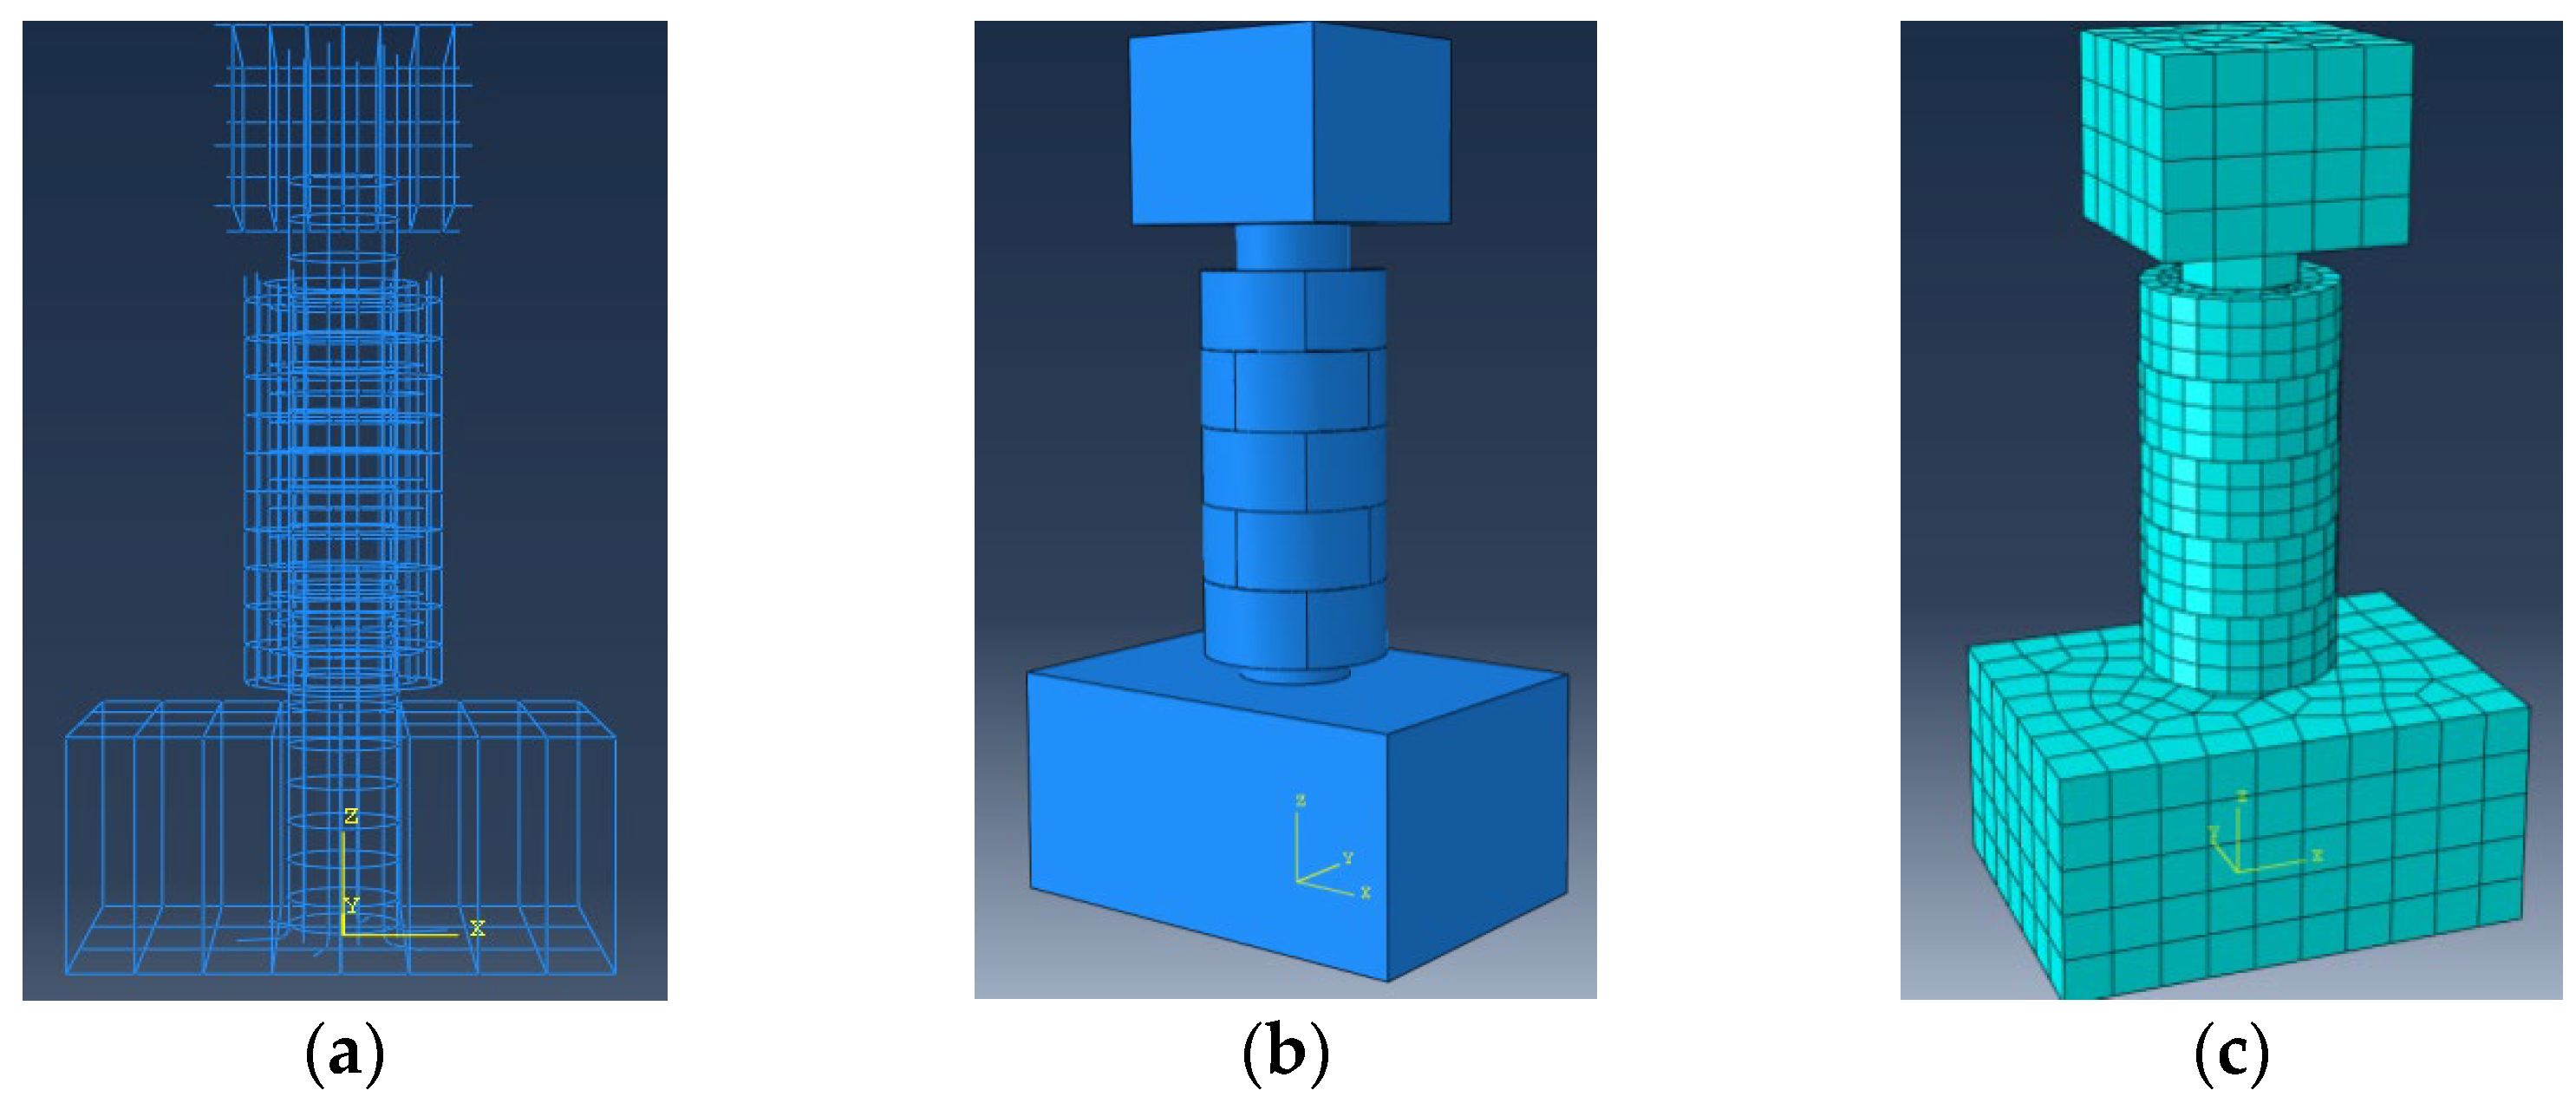
4.1.2. Numerical Model Establishment
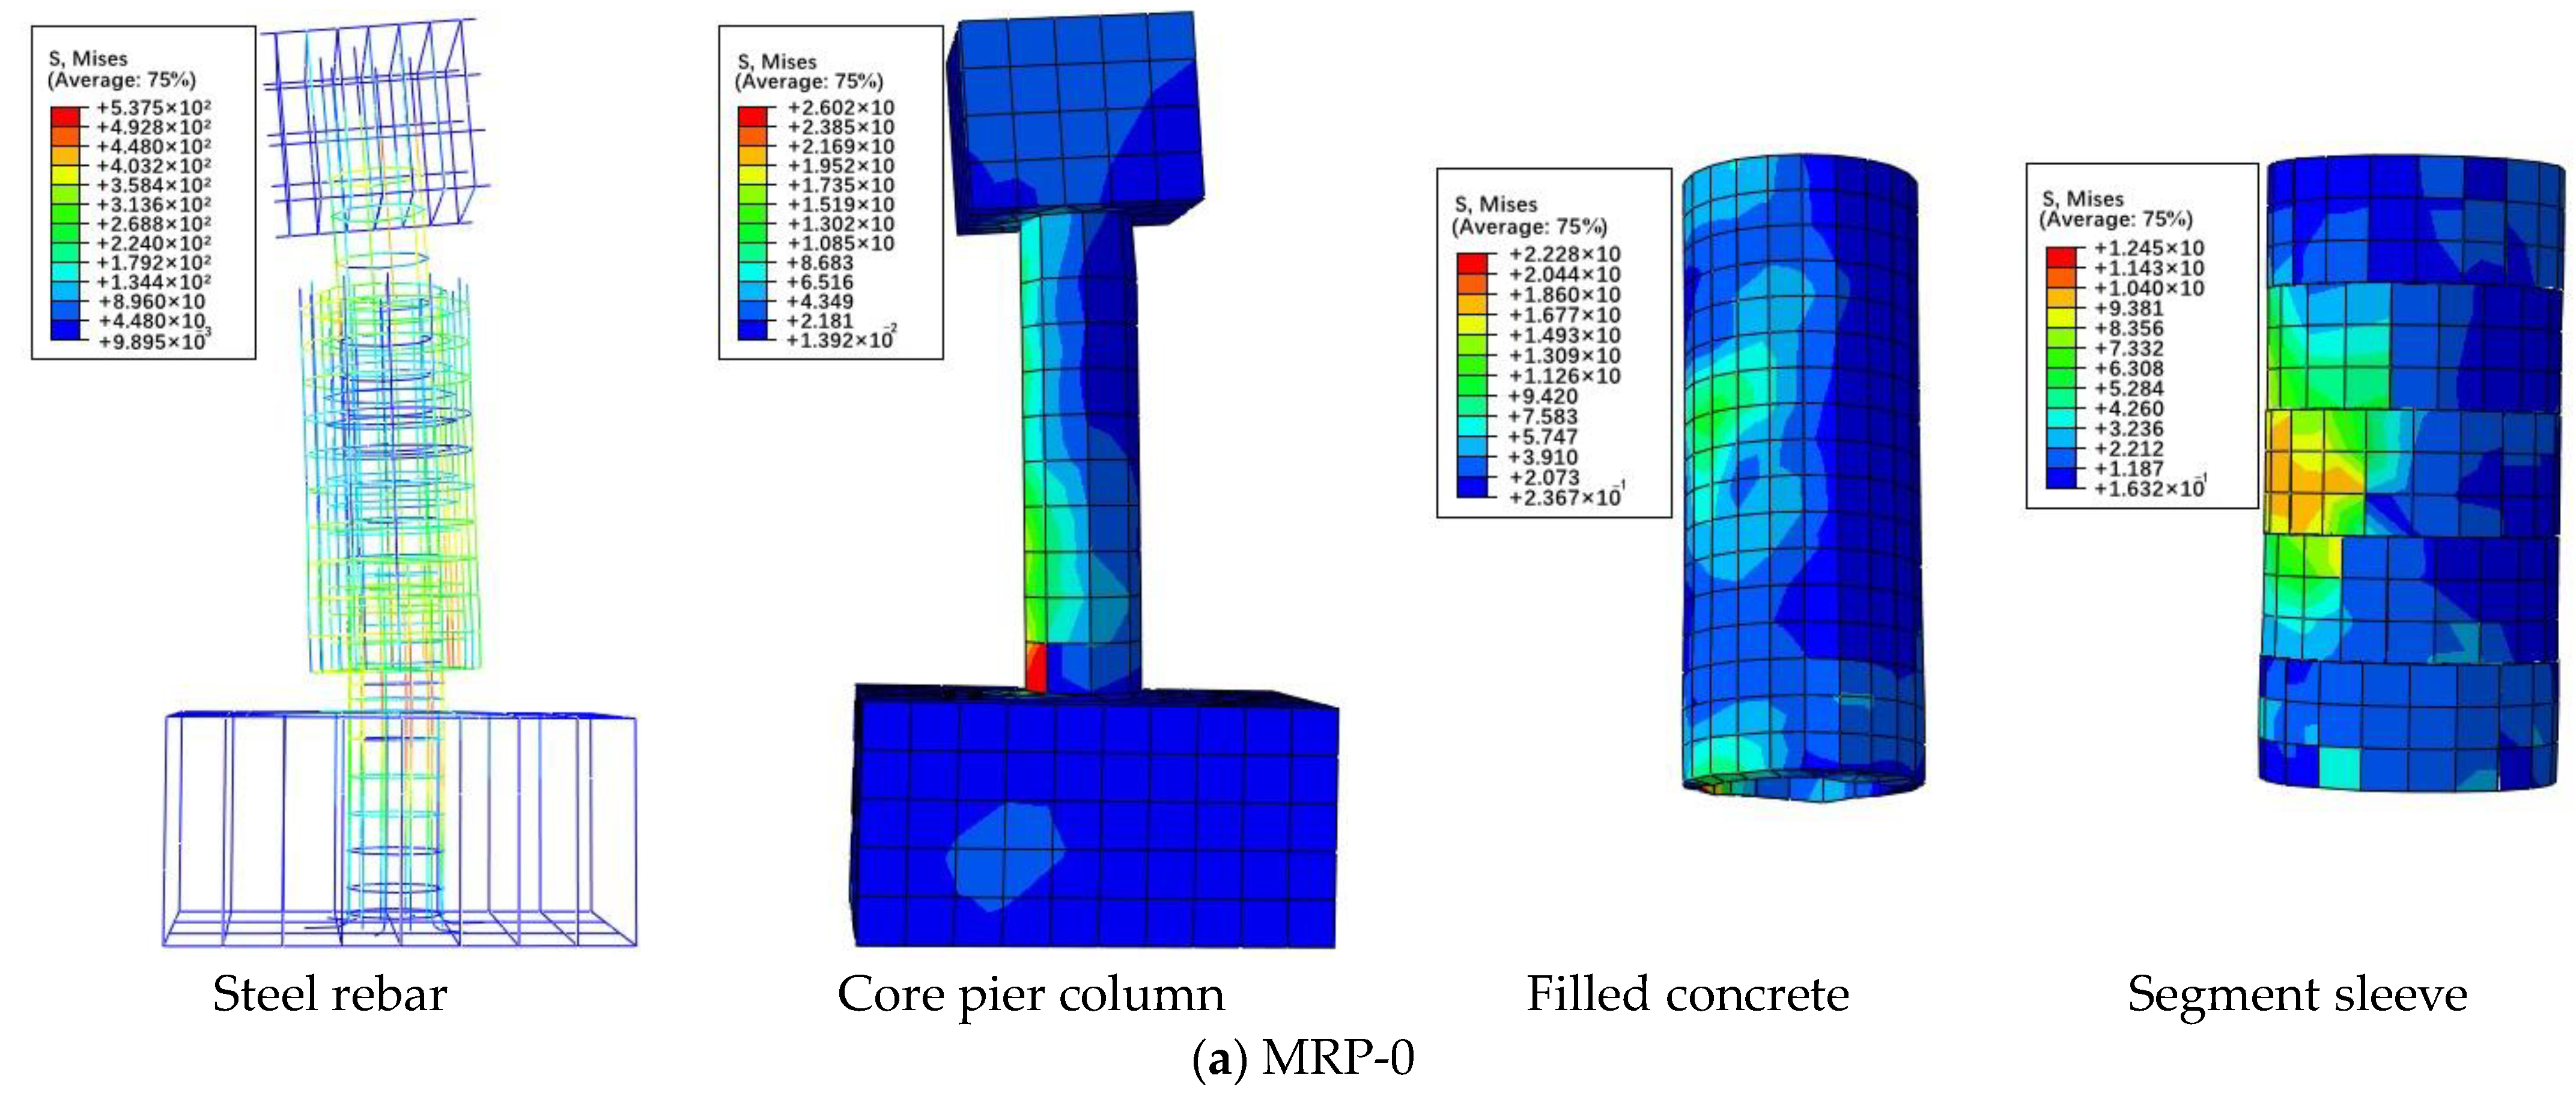
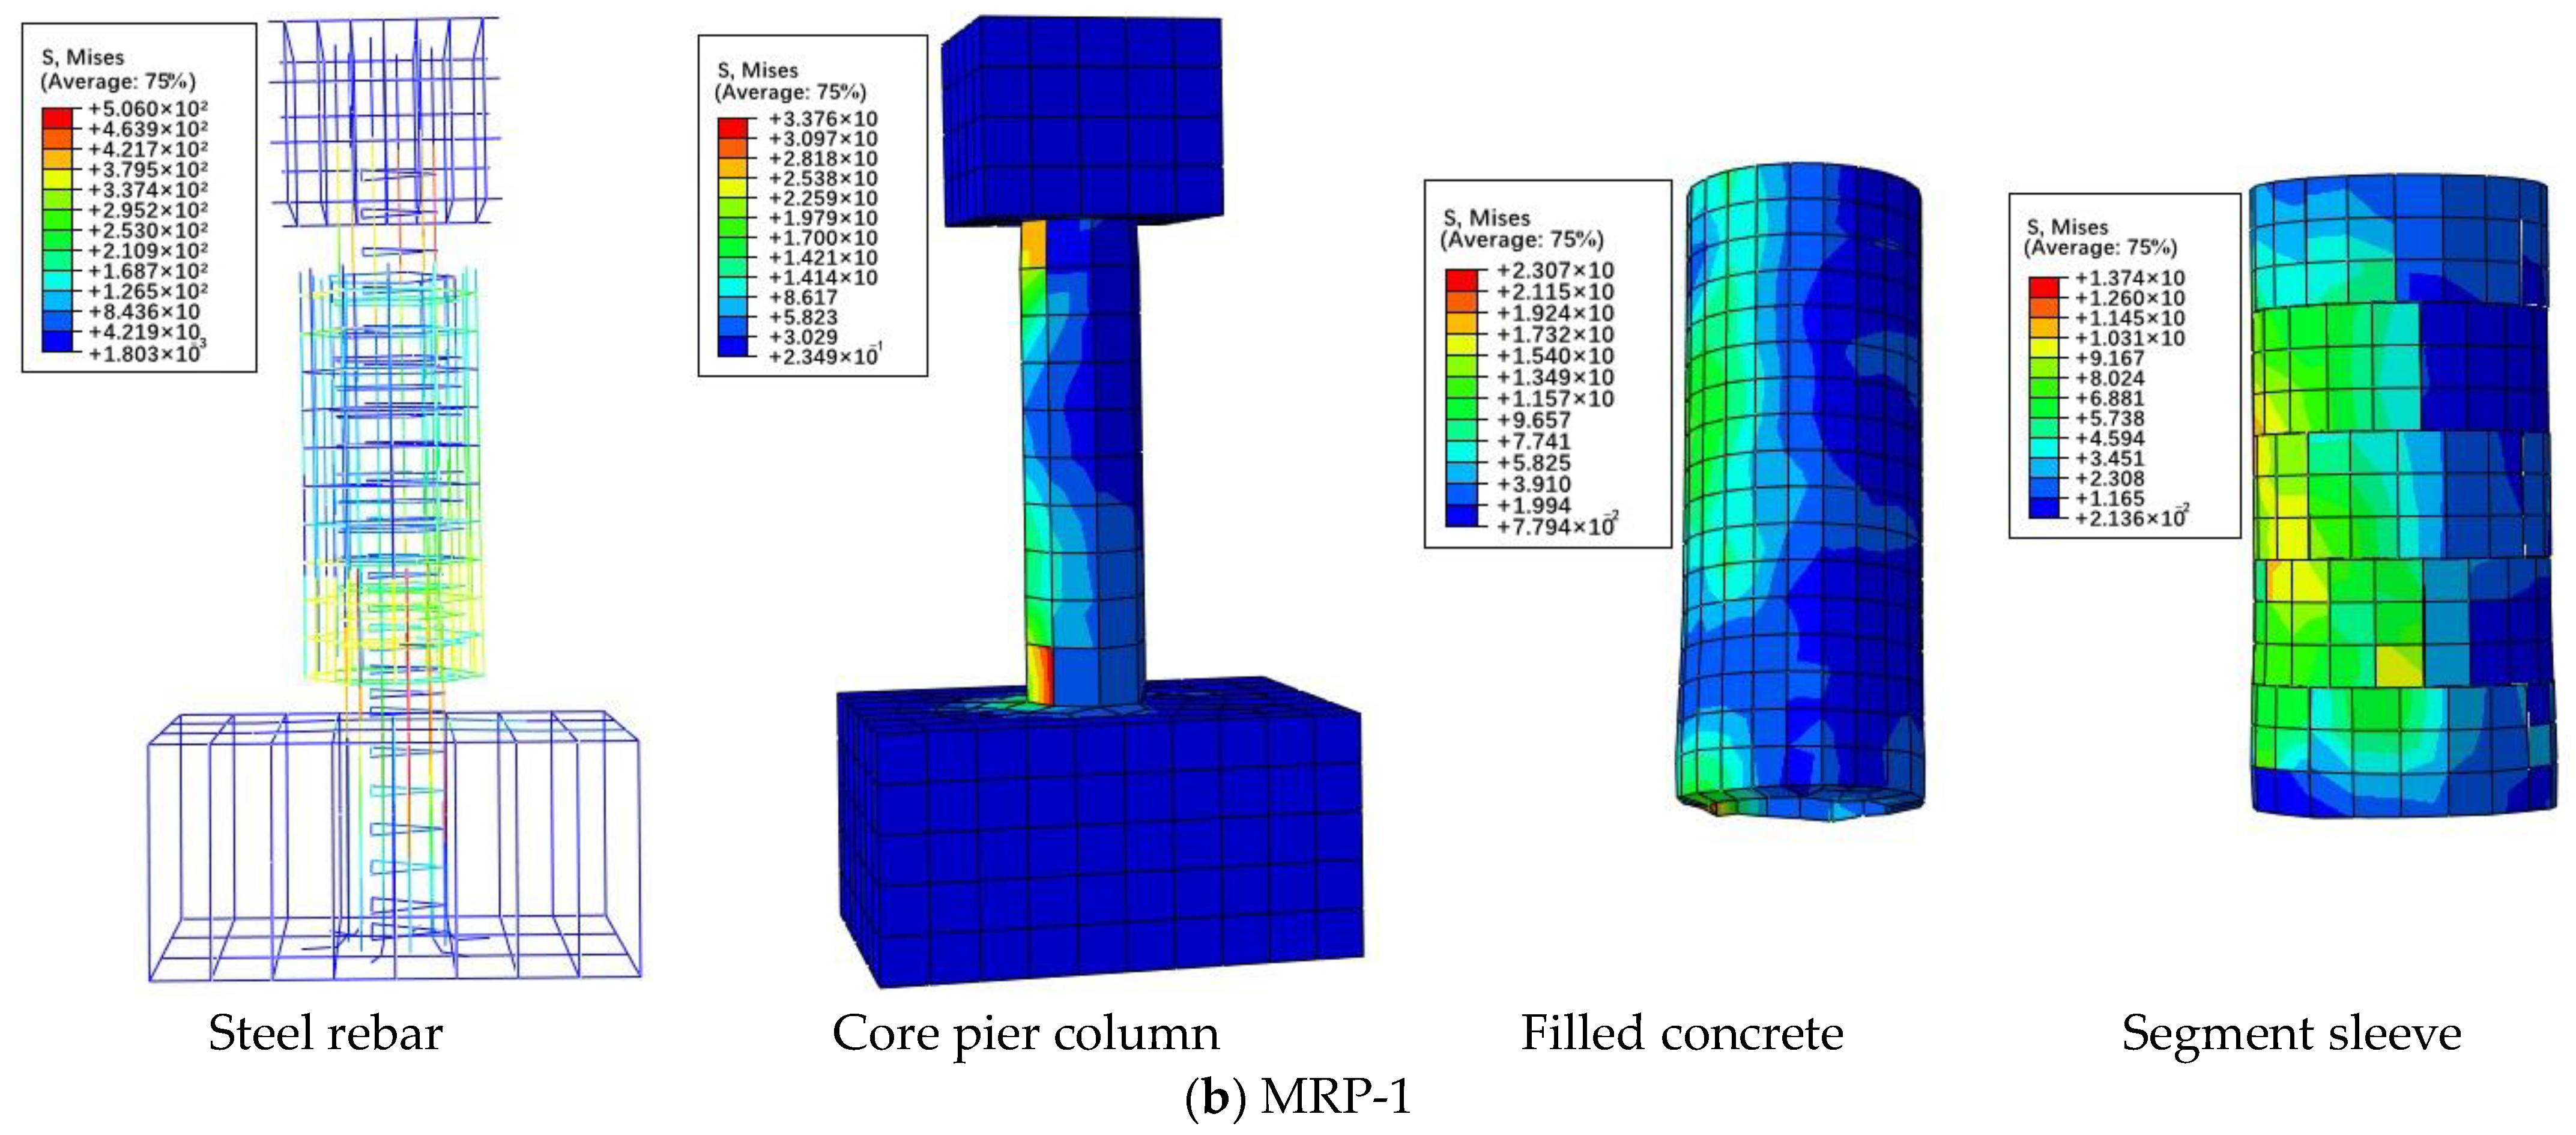
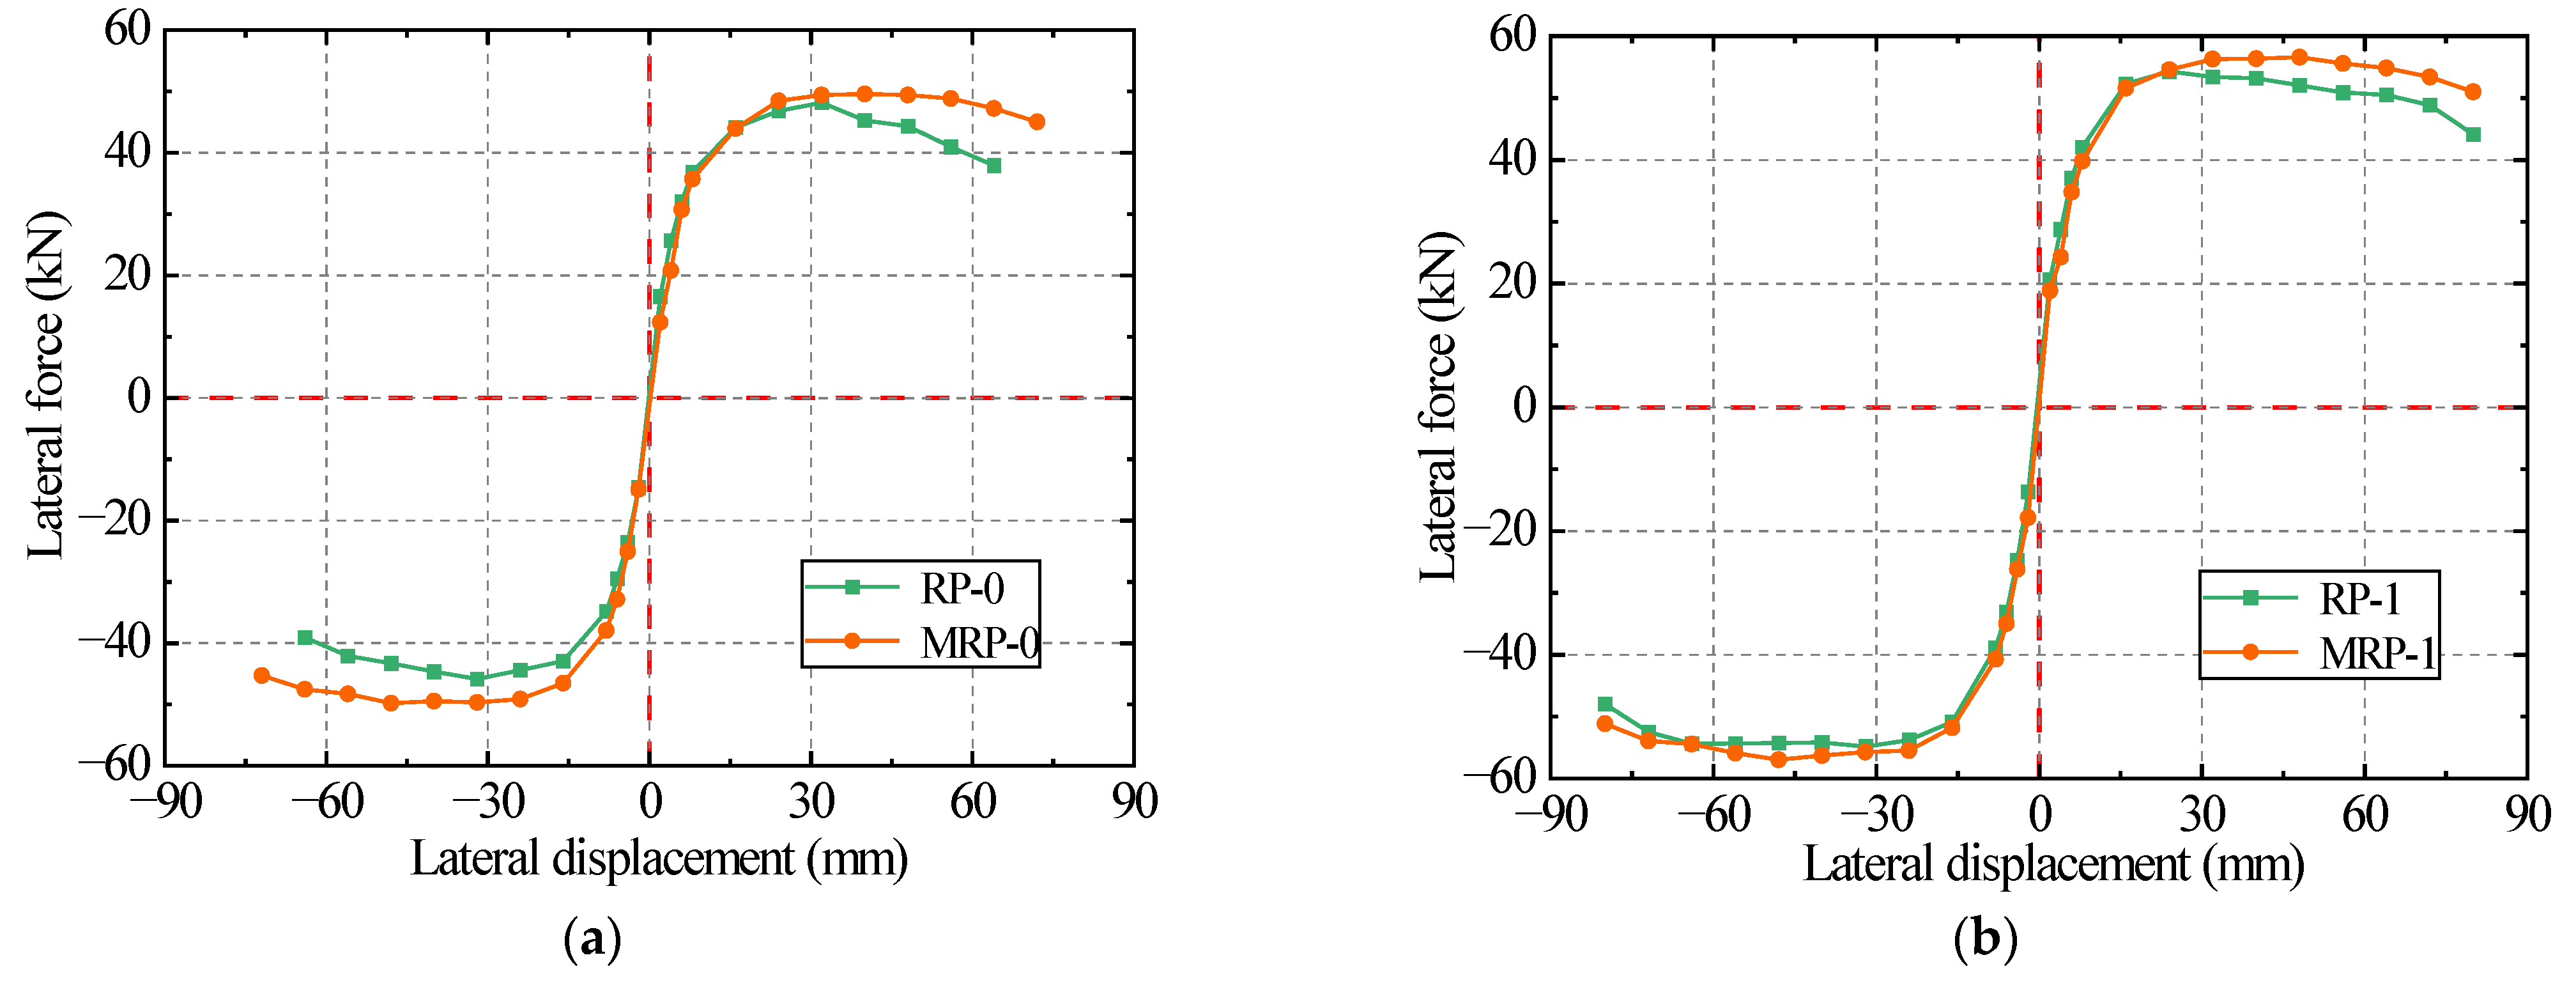
4.1.3. Numerical Model Verification
4.2. Results of Extended Parameter Analysis
- (1)
- Influence of LCSS thickness on the strengthening effect
- (2)
- Influence of the SSAWC reinforcement ratio on the strengthening effect
- (3)
- Influence of SSAWC strength on the strengthening effect
- (4)
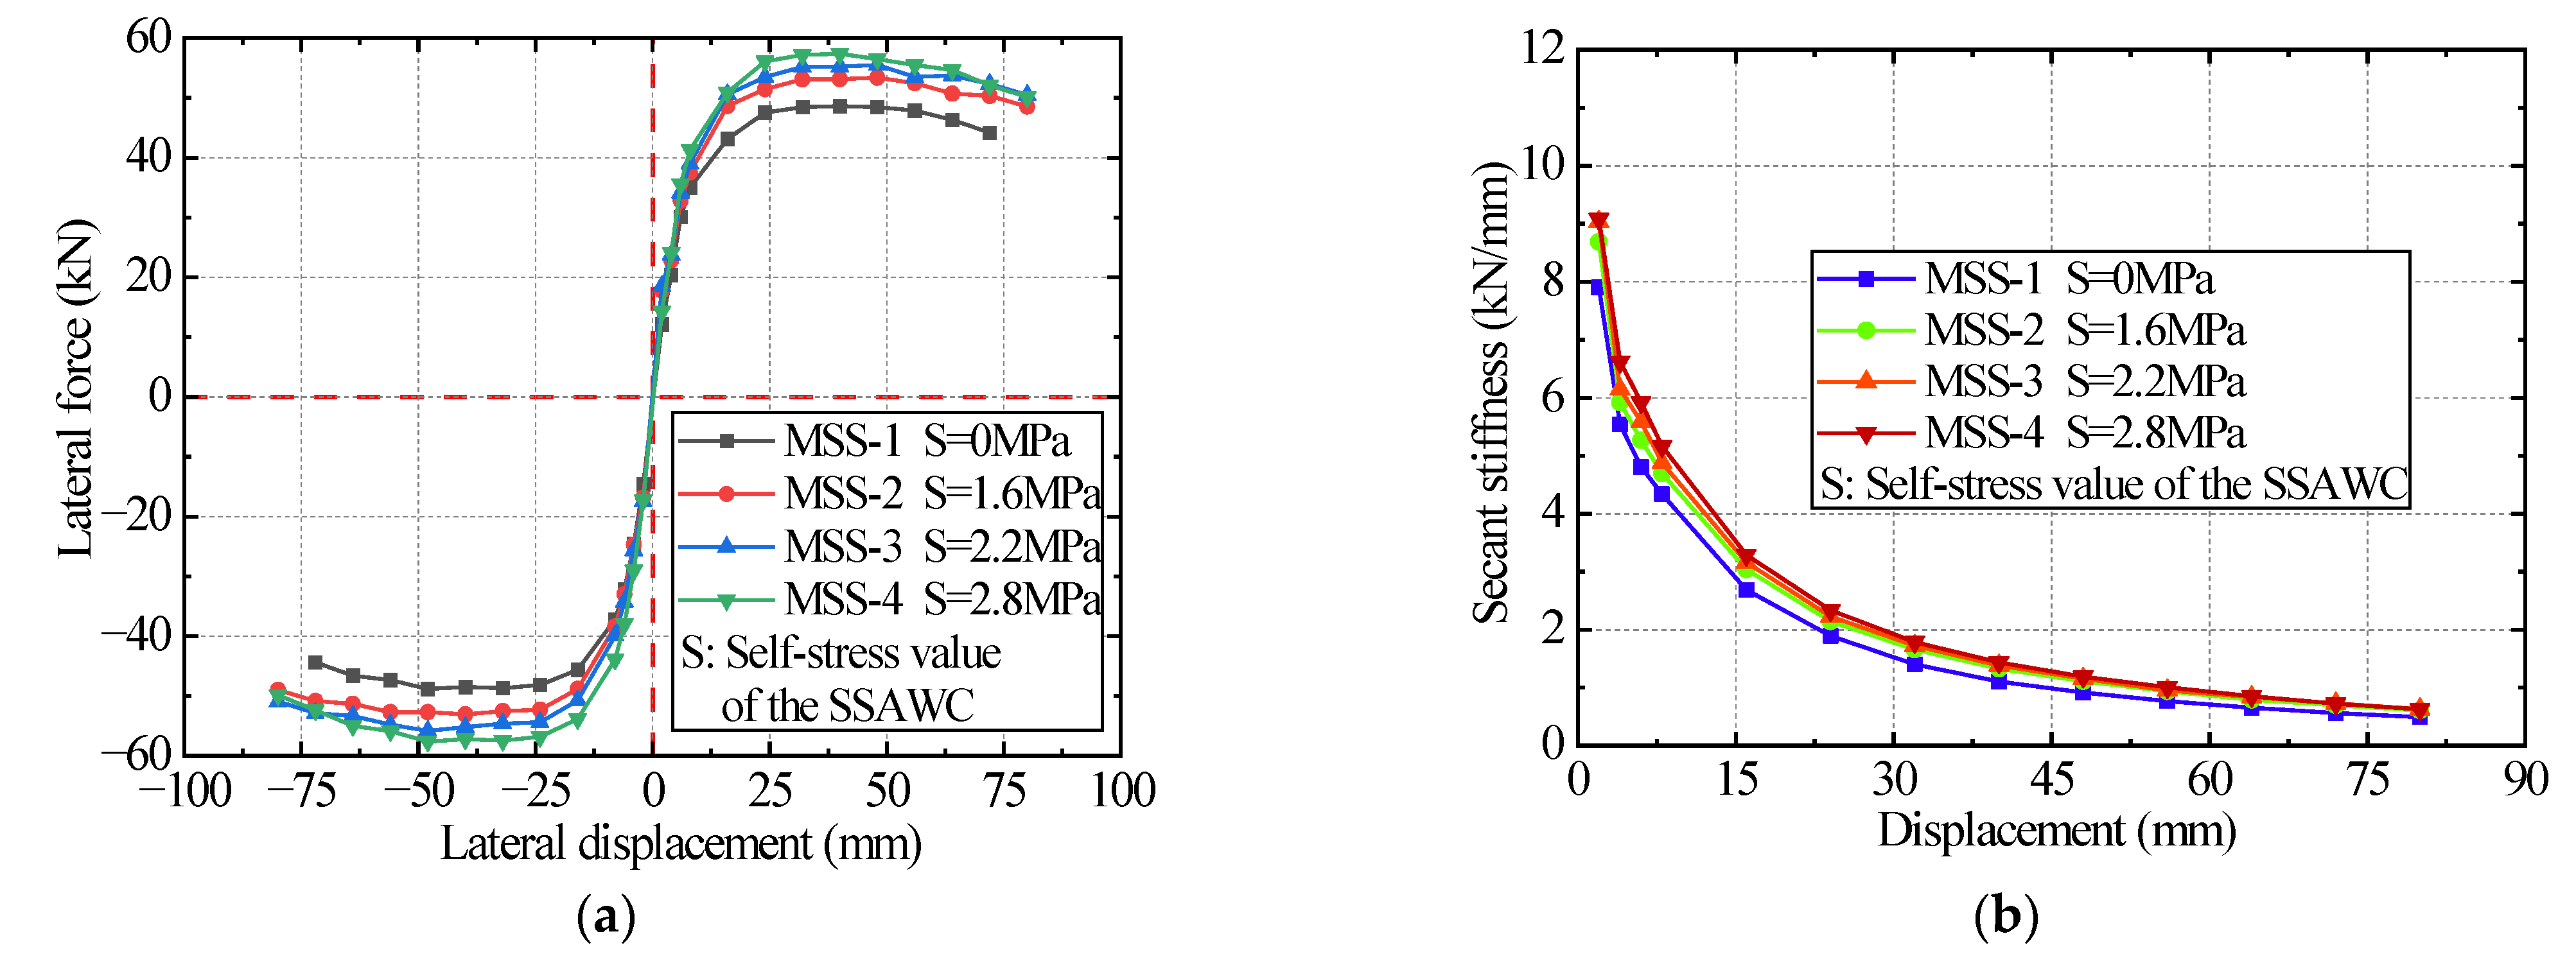
- Influence of SSAWC self-stress on the strengthening effect
- (5)
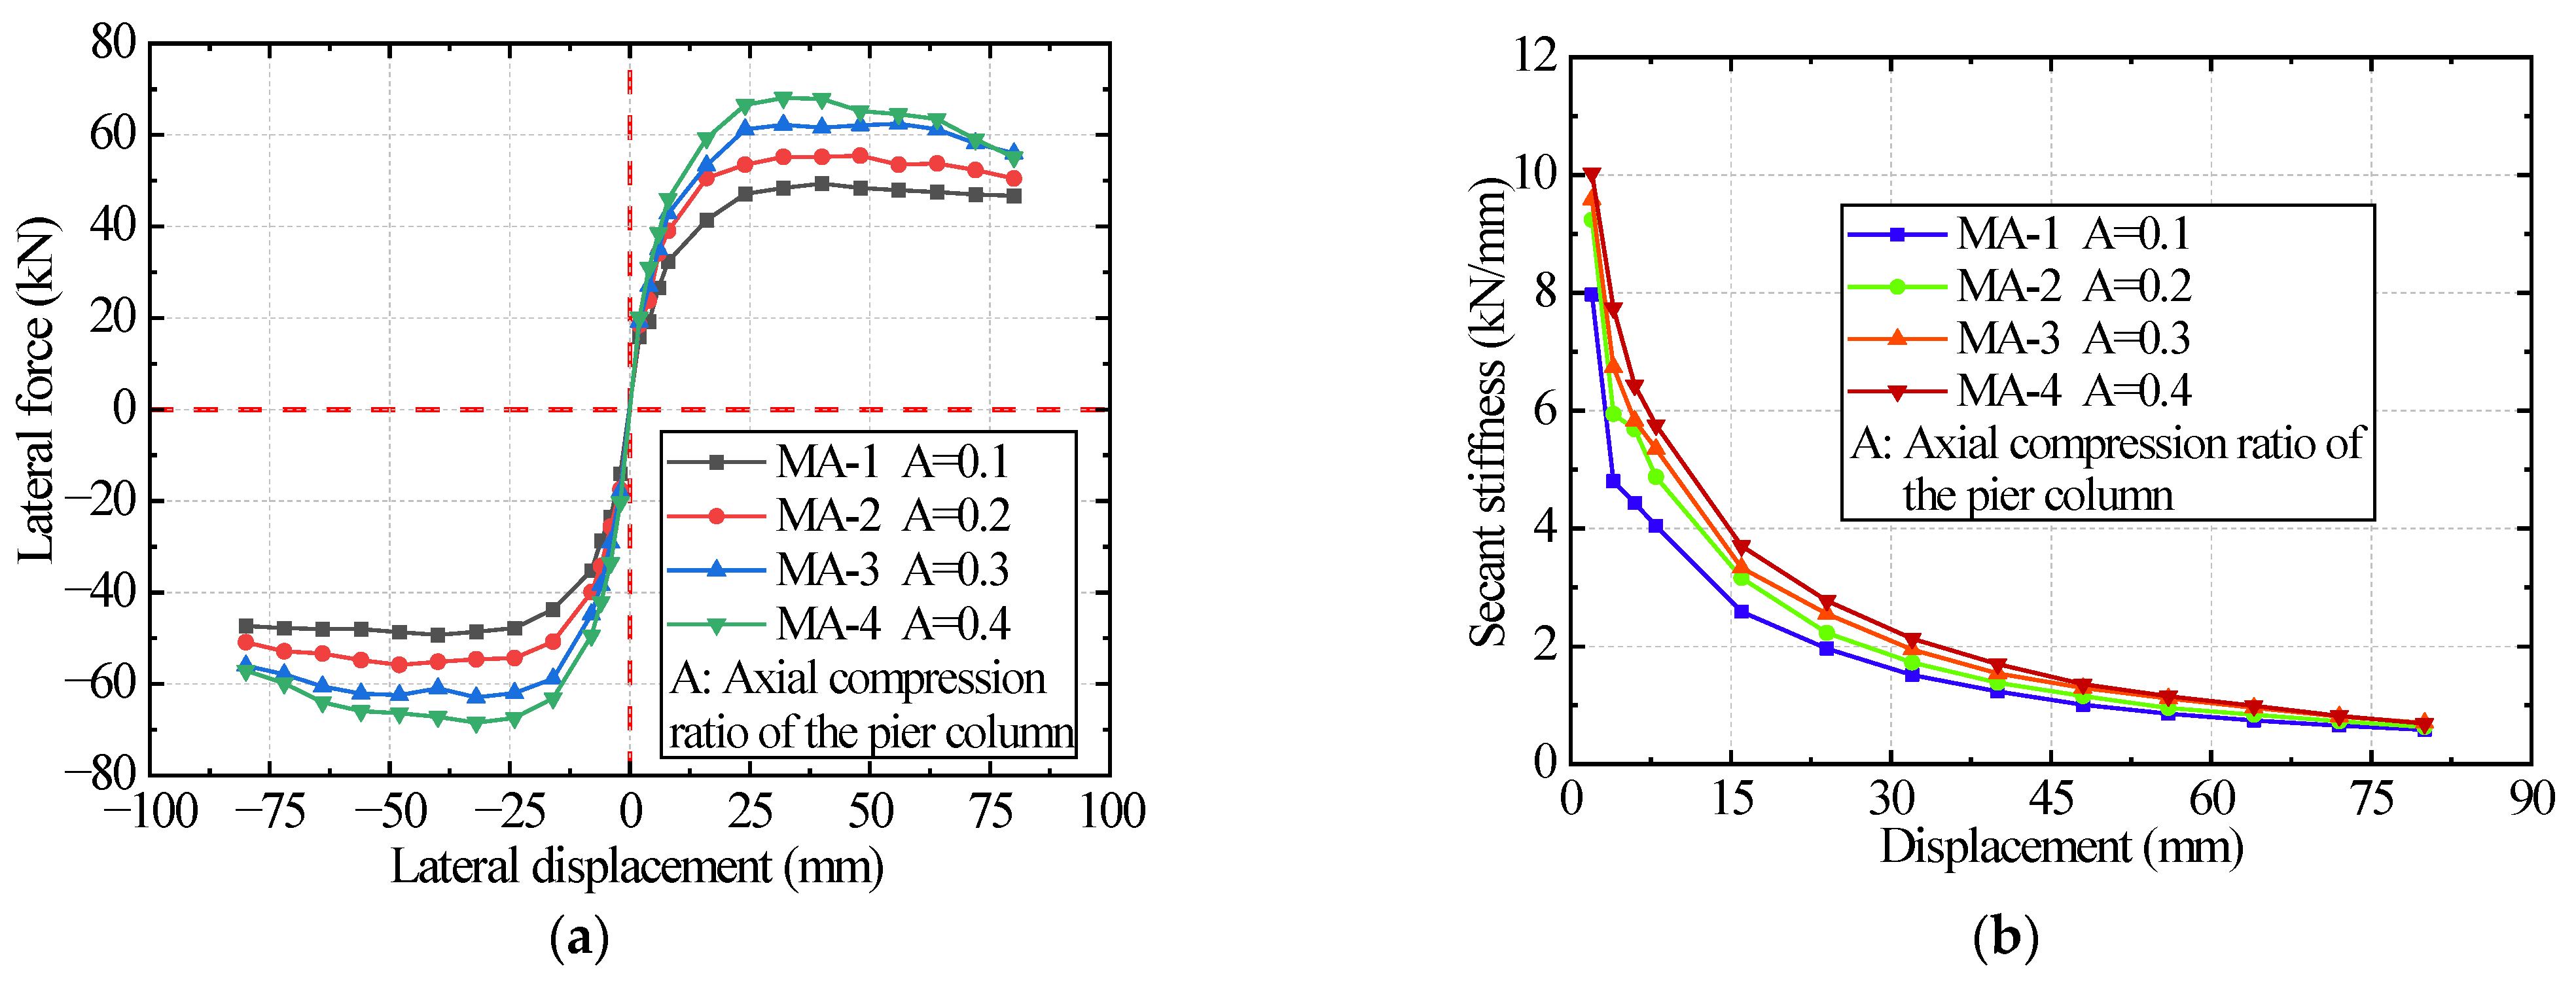
- Influence of axial compression ratio on the strengthening effect
5. Restoring Force Model
5.1. Skeleton Curve Model
5.1.1. Skeleton Curve Model Establishment
Calculation of Yield Point
- (1)
- Yield Load
- (2)
- Yield Displacement
- (3)
- Yield Stiffness
Calculation of Peak Point
- (1)
- Peak Load
- (2)
- Peak Displacement
- (3)
- Peak Stiffness
Calculation of Ultimate Point
- (1)
- Ultimate Load
- (2)
- Ultimate Displacement
- (3)
- Ultimate Stiffness
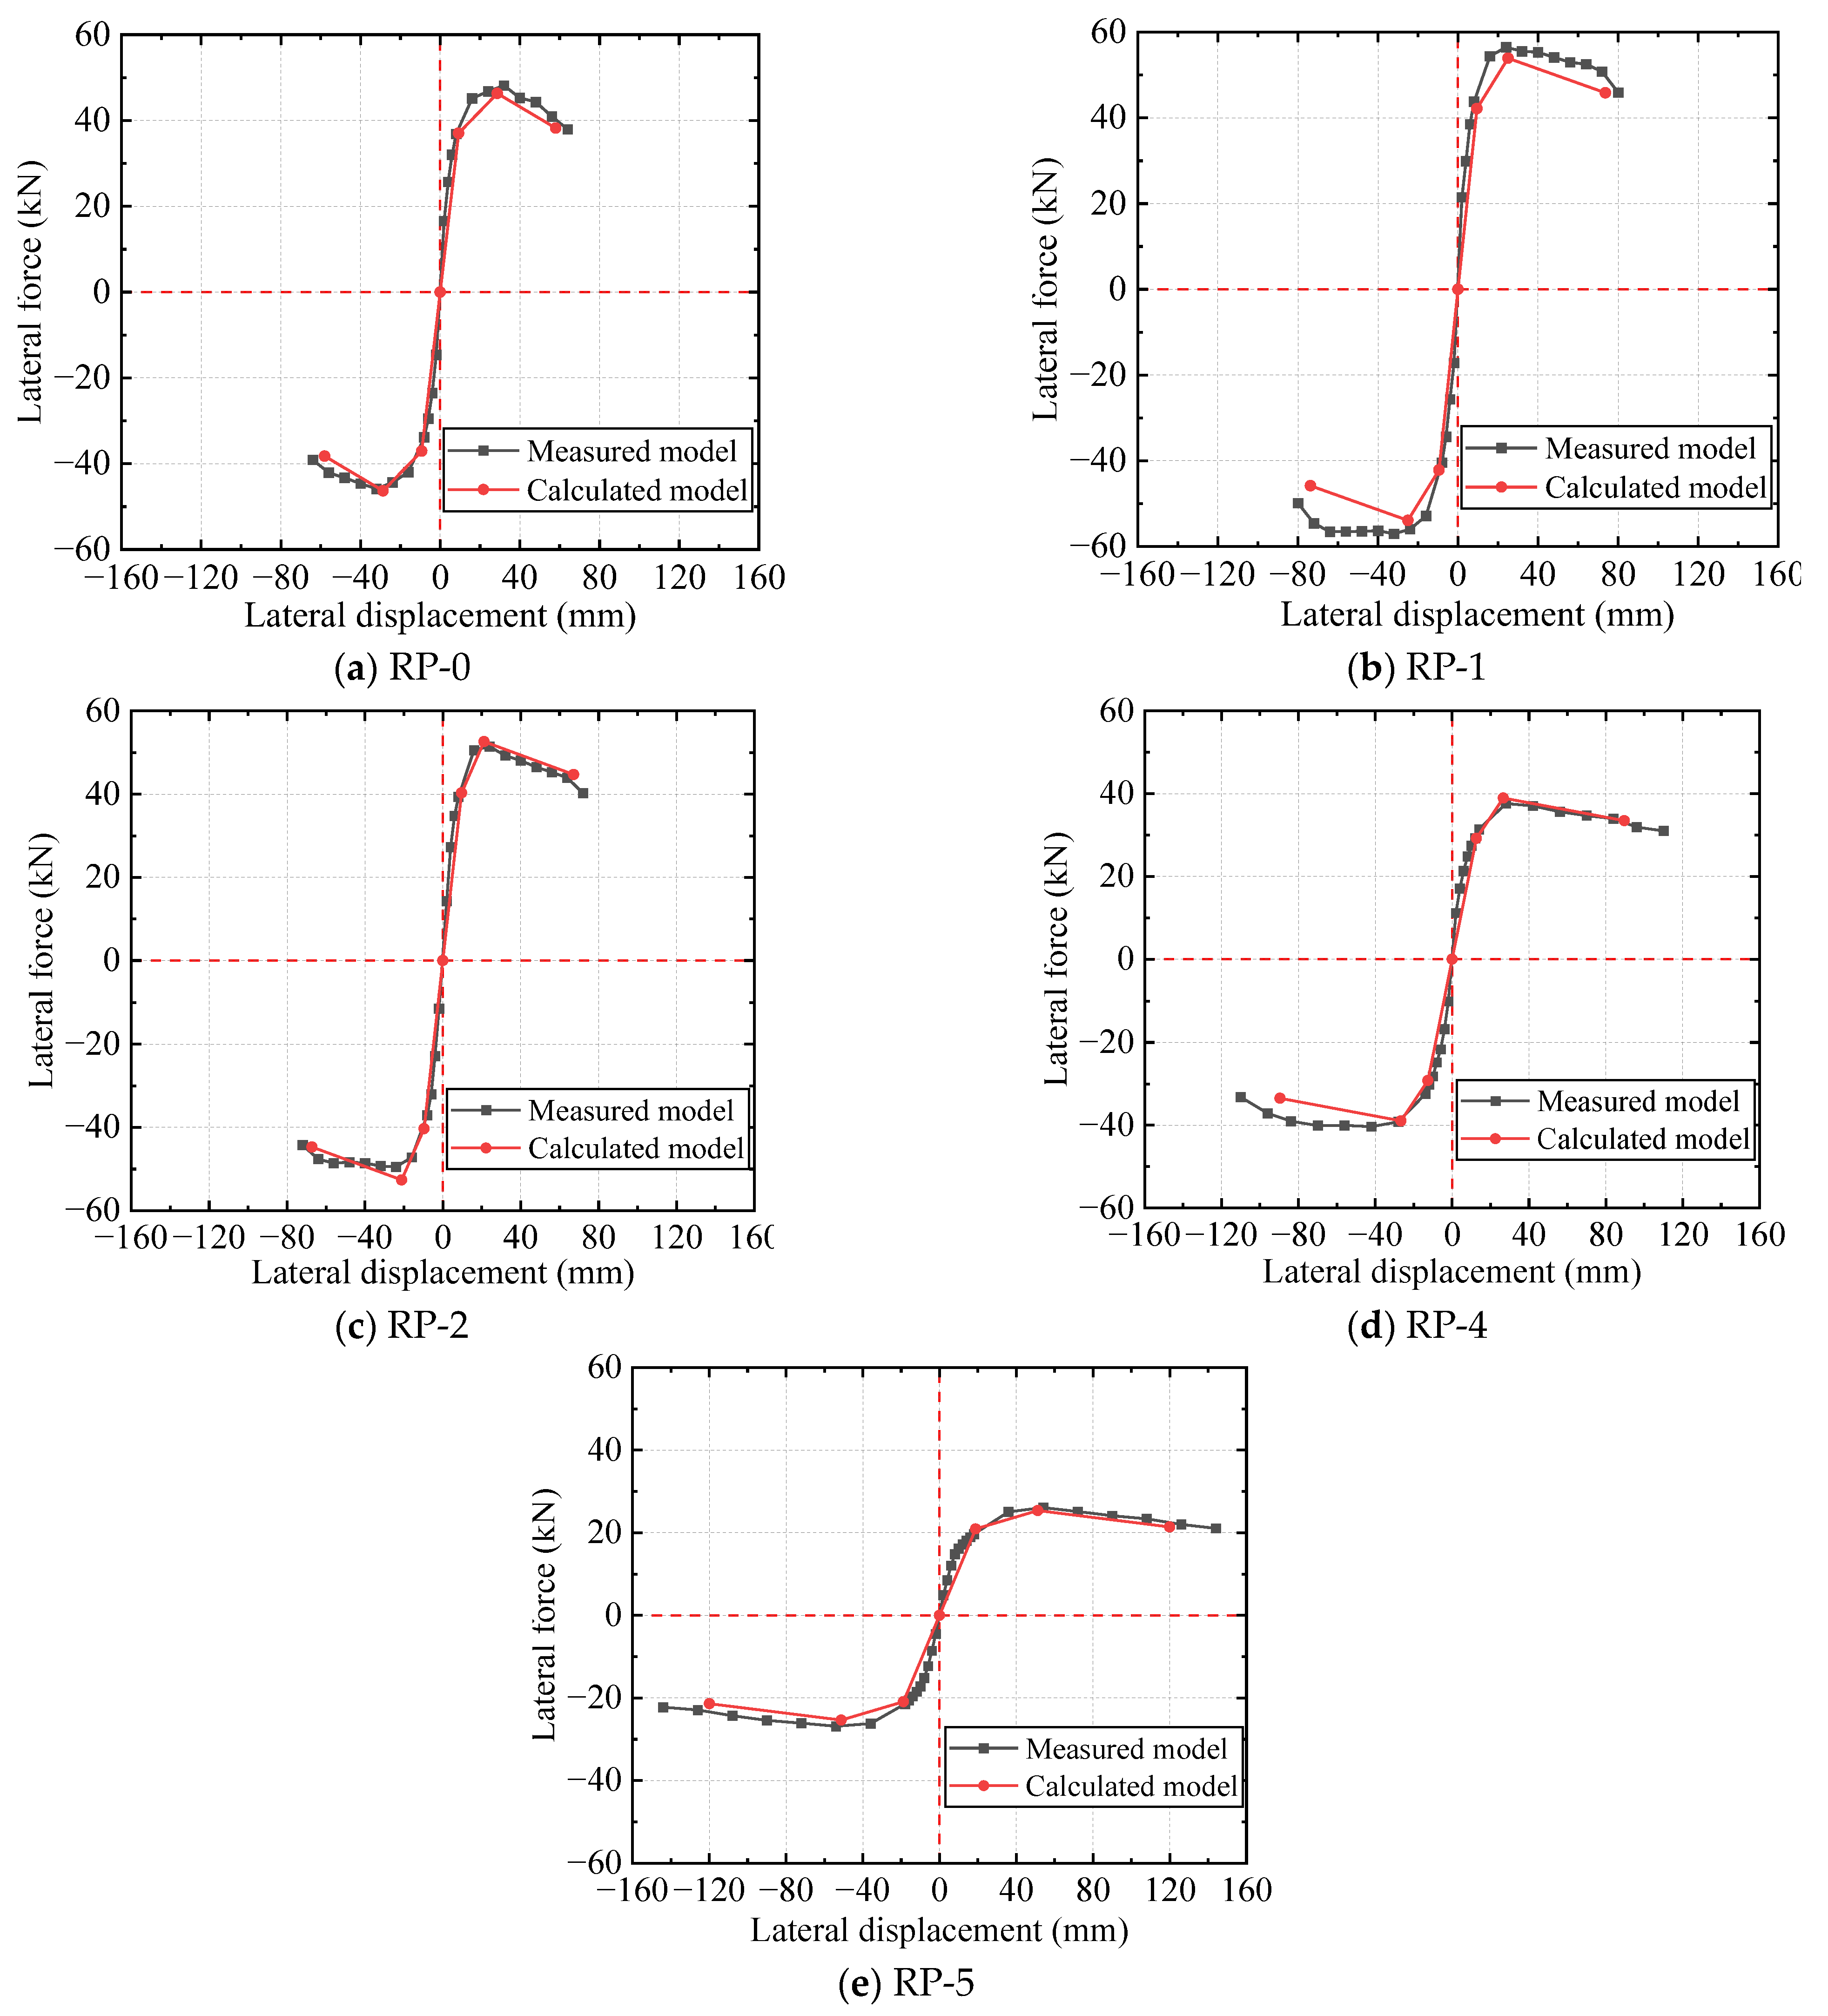
5.1.2. Skeleton Curve Model Verification
5.2. Hysteresis Curve Model
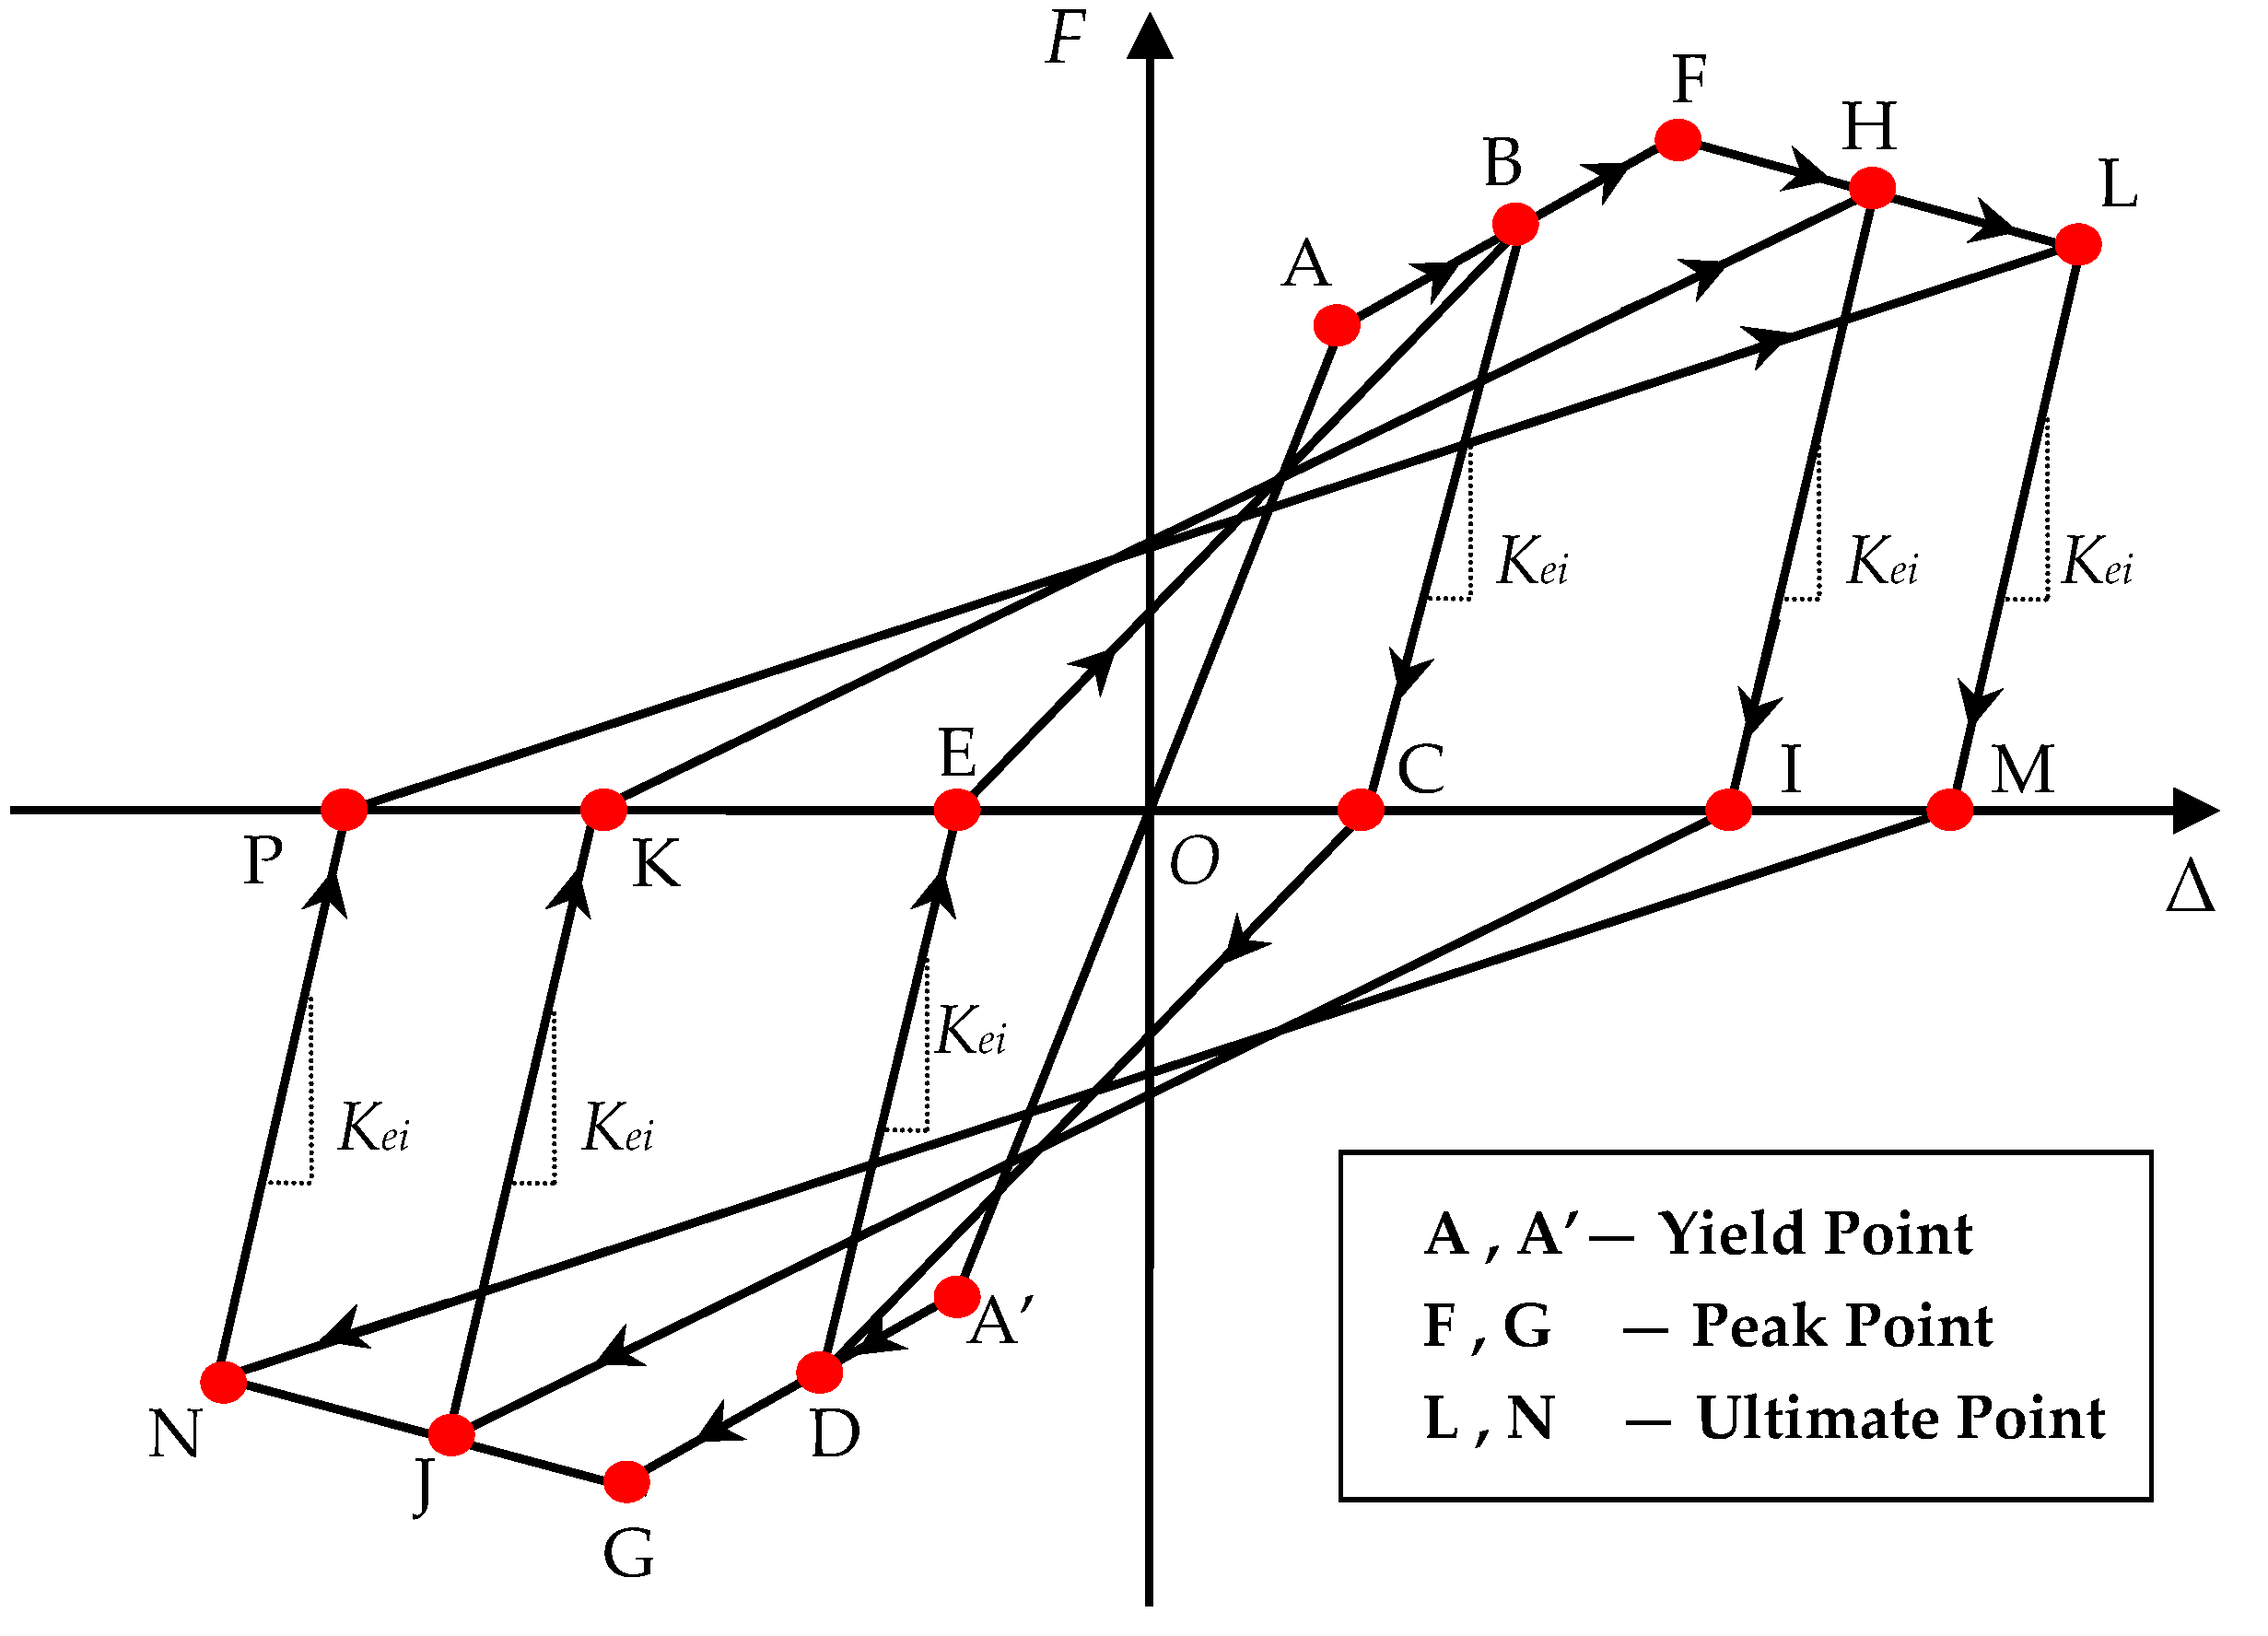
5.2.1. Hysteresis Rule and Model
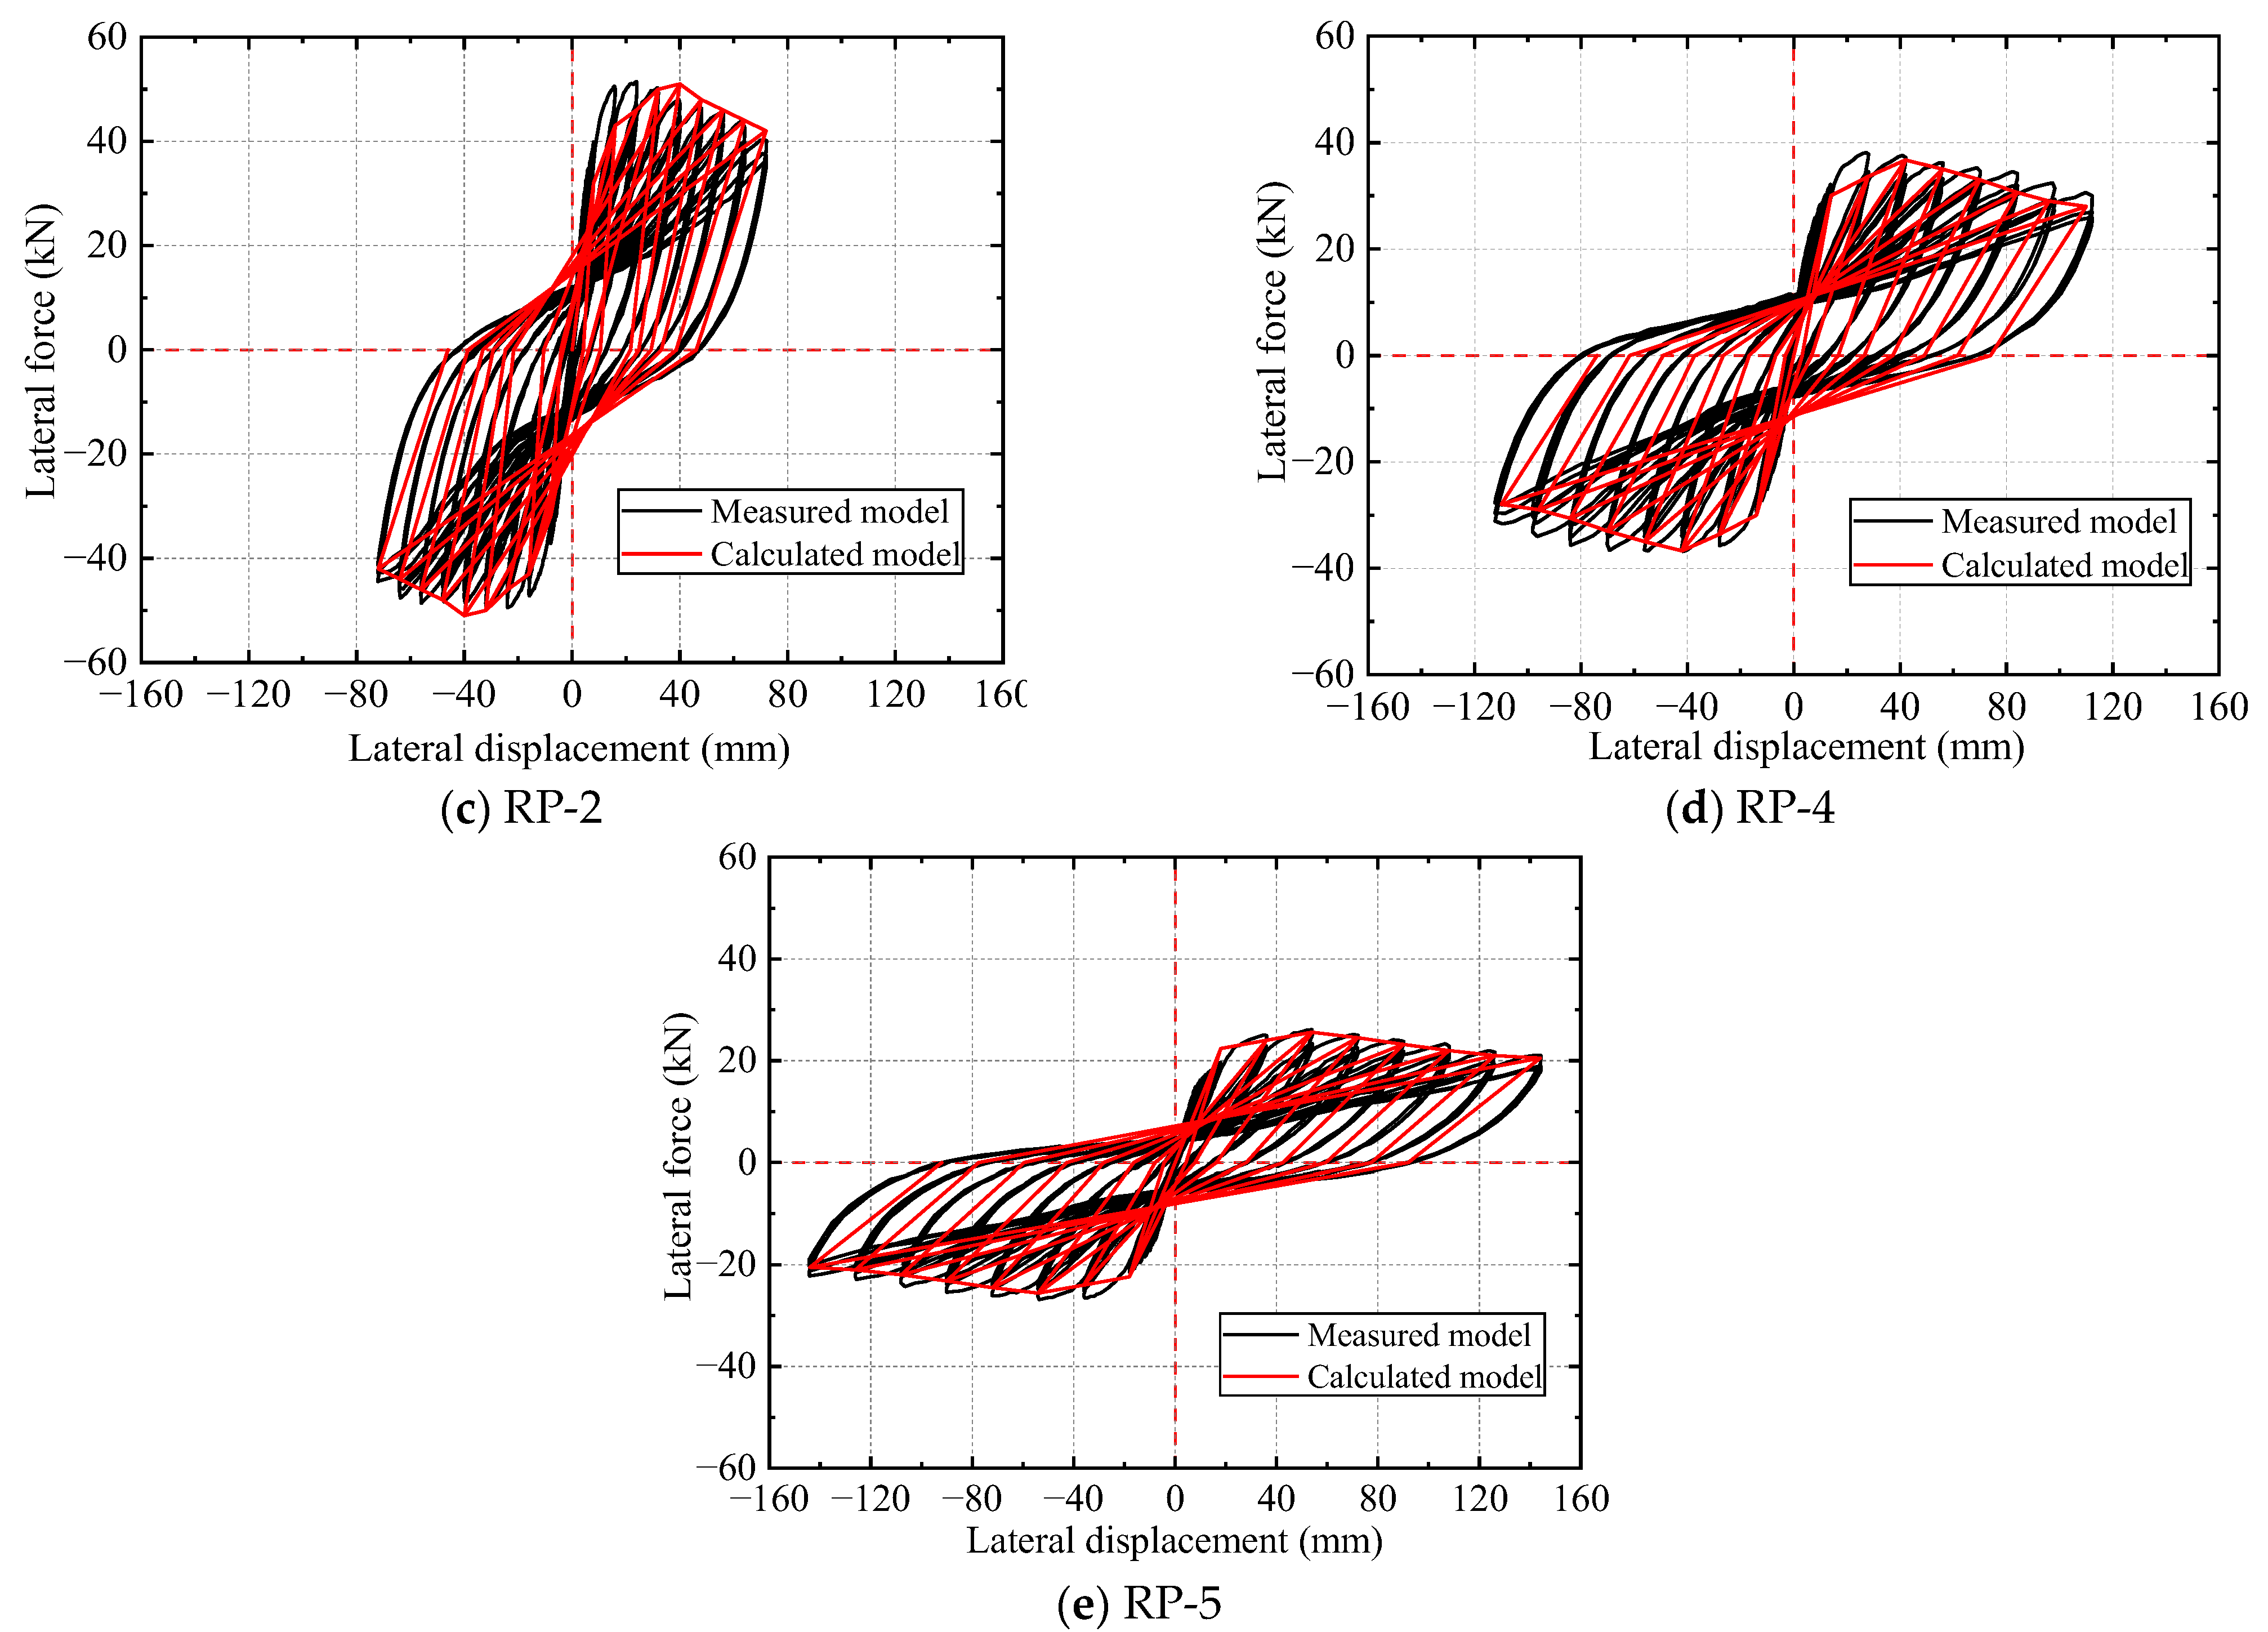
5.2.2. Hysteresis Curve Model Verification
6. Conclusions
- (1)
- As an undrained strengthening technique, the proposed IPCSAM exhibits good seismic strengthening effects on underwater concrete piers. Compared with the unreinforced pier columns, the peak load, ductility coefficient, and initial stiffness of the specimens strengthened using the IPCSAM increased by approximately 83.5–106.4%, 16.3–50.2%, and 83.9–177.3%, respectively, while significantly improving the secant stiffness, energy dissipation per cycle, and equivalent viscous damping. In addition, the bearing capacity, stiffness, and energy dissipation capacity of the strengthened specimen with initial damage could be improved to a near-undamaged state, excluding the ductility.
- (2)
- As a filling material, SSAWC can improve the seismic performance of strengthened specimens. The initial self-stress produced by the SSAWC can provide a circumferential preloading effect on the core pier column to improve its bearing, stiffness, energy dissipation, and deformation capacities. Compared with the specimen using AWC, the peak load, ductility coefficient, and initial stiffness of the specimen with a self-stress value of 1.6 MPa increased by 17.3%, 43.5%, and 8.3%, respectively. Moreover, the secant stiffness, energy dissipation per cycle, and equivalent viscous damping were improved. In addition, under the premise of satisfying the bearing capacity design requirements, the self-stress value of the SSAWC should not exceed 2.2 MPa, the strength grade of the SSAWC should be 1–2 grades higher than the concrete strength grade of the core pier column, and the SSAWC should adopt the constructional reinforcement ratio.
- (3)
- The LCSS exhibited reliable connection performance and strength in the quasi-static test and remained intact and confined when the specimen was damaged. An increase in the reinforcement ratio of the LCSS from 0.25% to 0.5% increased the peak load, initial stiffness, and ductility coefficient of the strengthened specimen by 9.76%, 16.18%, and 22.24%, respectively. The secant stiffness, energy dissipation per cycle, and equivalent viscous damping were also improved. An appropriate LCSS thickness can effectively improve the seismic performance of strengthened specimens, and the recommended thickness-diameter ratio is 1/10.
- (4)
- An increase in the length–diameter ratio of a strengthened pier column can significantly reduce its seismic performance. An appropriate axial compression ratio can improve the bearing capacity, stiffness, ductility, and energy dissipation capacity of strengthened pier columns, and the axial compression ratio should not exceed 0.3.
- (5)
- The proposed restoring force model of pier columns strengthened using the IPCSAM has good applicability and can accurately reflect the hysteresis characteristics of the strengthened specimens. For the skeleton curve model, the relative errors between the measured and calculated values of the characteristic points for each strengthened specimen were within 10%, and only 5 of 30 groups of contrast data had an error exceeding 5%. A certain error existed in the initial stiffness between the measured and calculated hysteresis curve models, and the deviation after the yield stage was small.
Author Contributions
Funding
Institutional Review Board Statement
Informed Consent Statement
Data Availability Statement
Acknowledgments
Conflicts of Interest
References
- Wu, S.F.; Jiang, S.F.; Shen, S.; Wu, Z.Q. The Mix Ratio Study of Self-Stressed Anti-Washout Underwater Concrete Used in Nondrainage Strengthening. Materials 2019, 12, 324. [Google Scholar] [CrossRef]
- Wu, S.F.; Ge, Y.J.; Jiang, S.F.; Shen, S.; Zhang, H. Experimental Study on the Axial Compression Performance of an Underwater Concrete Pier Strengthened by Self-Stressed Anti-Washout Concrete and Segments. Materials 2021, 14, 6567. [Google Scholar] [CrossRef] [PubMed]
- Su, J.S.; Wu, D.Q.; Wang, X.W. Influence of ground motion duration on seismic behavior of RC bridge piers: The role of low-cycle fatigue damage of reinforcing bars. Eng. Struct. 2023, 279, 115587. [Google Scholar] [CrossRef]
- Dawn, E.L.; Sharon, E.G.; Adrian, M.N.; Jack, P.M. Repair of Earthquake-Damaged Bridge Columns. Struct. J. 2001, 98, 233–242. [Google Scholar]
- Zheng, S.K. RC Columns Increased Section Method Based on the Concept of Confined Concrete. Master’s Thesis, Chongqing University, Chongqing, China, 2010. (In Chinese). [Google Scholar]
- Ren, W.; Lesley, H.S.; Gai, Y.T.; Kang, X. Test Results and Nonlinear Analysis of RC T-beams Strengthening by Bonded Steel Plates. Int. J. Concr. Struct. Mater. 2015, 9, 133–143. [Google Scholar] [CrossRef]
- Yang, S.Y. Experimental Research on Seismic Behavior of RC Bridge Piers Combination Strengthened by FRP Bars and FRP Sheets. Master’s Thesis, Southeast University, Nanjing, China, 2012. (In Chinese). [Google Scholar]
- Tomii, M.; Sakino, K.; Xiao, Y.; Watanabe, K. Earthquake Resisting Hysteretic Behavior of Reinforced Concrete Short Columns Confined by Steel Tube. In Proceedings of the International Speciality Conference on Concrete Filled Steel Tubular Structures, Harbin, China, 12–15 August 1985; pp. 119–125. (In Chinese). [Google Scholar]
- Youm, K.S.; Lee, H.E.; Choi, S. Seismic performance of repaired RC columns. Mag. Concr. Res. 2006, 58, 267–276. [Google Scholar] [CrossRef]
- Parghi, A.; Alam, M.S. Seismic behavior of deficient reinforced concrete bridge piers confined with FRP-A fractional factorial analysis. Eng. Struct. 2016, 126, 531–546. [Google Scholar] [CrossRef]
- Mohamed, H.M.; Afifi, M.Z.; Benmokrane, B. Performance Evaluation of Concrete Columns Reinforced Longitudinally with FRP Bars and Confined with FRP Hoops and Spirals under Axial Load. J. Bridge Eng. 2014, 19, 04014020. [Google Scholar] [CrossRef]
- Saeed, H.Z.; Khan, Q.U.Z.; Ahmed, A.; Ali, S.M.; Lqbal, M. Experimental and finite element investigation of strengthened LSC bridge piers under Quasi-Static Cyclic Load Test. Compos. Struct. 2015, 131, 556–564. [Google Scholar] [CrossRef]
- Chang, S.Y.; Li, Y.F.; Loh, C.H. Experimental Study of Seismic Behaviors of As-Built and Carbon Fiber Reinforced Plastics Repaired Reinforced Concrete Bridge Columns. J. Bridge Eng. 2004, 9, 391–402. [Google Scholar] [CrossRef]
- Wang, Y.S. Experimental Research on Concrete Short Columns Confined by Wire Rope under Axial Compression. Master’s Thesis, Harbin Institute of Technology, Harbin, China, 2006. (In Chinese). [Google Scholar]
- Saatcioglu, M.; Yalcin, C. External Prestressing Concrete Columns for Improved Seismic Shear Resistance. J. Struct. Eng. 2003, 129, 1057–1070. [Google Scholar] [CrossRef]
- Li, H. Experiment Study on the Seismic Behavior of RC Short Columns Strengthened with Prestressed Steel Wires. Master’s Thesis, Beijing University of Technology, Beijing, China, 2011. (In Chinese). [Google Scholar]
- Wu, E.; Jiang, W.; Wang, X.Z.; Zhou, Y. Experimental investigation on reinforced RC column with prestressed double helix FRP strip. Eur. J. Environ. Civ. Eng. 2013, 17, 53–64. [Google Scholar] [CrossRef]
- Fakharifar, M.; Chen, G.; Wu, C.L.; Shamsabadi, A. Rapid Repair of Earthquake-Damaged RC Columns with Prestressed Steel Jackets. J. Bridge Eng. 2016, 21, 04015075. [Google Scholar] [CrossRef]
- Fatmir, M.; Hadi, B. Rehabilitation of Deteriorated Timber Piles with Fiber Reinforced Polymer Composites—IABSE Symposium Report; International Association for Bridge and Structural Engineering: Vancouver, BC, Canada, 2017; pp. 381–388. [Google Scholar]
- Hafizah, N.A.K.; Bhutta, M.A.R.; Jamaludin, M.Y.; Warid, M.H.; Iamail, M.; Rahman, M.S.; Yunus, I.; Azman, M. Kenaf Fiber Reinforced Polymer Composites for Strengthening RC Beams. J. Adv. Concr. Technol. 2014, 12, 167–177. [Google Scholar] [CrossRef]
- Yi, N.H.; Nam, J.W. Evaluation of material and structural performances of developed Aqua-Advanced-FRP for retrofitting of underwater concrete structural members. Constr. Build. Mater. 2010, 24, 566–576. [Google Scholar] [CrossRef]
- Sen, R.; Mullins, G. Application of FRP composites for underwater piles repair. Compos. Part B Eng. 2007, 38, 751–758. [Google Scholar] [CrossRef]
- Tang, Y.; Wu, G.; Sun, Z.Y.; Zhang, Y.F. Seismic Performance of Underwater Bridge Columns Strengthened with Prestressed-Concrete Panels and FRP Reinforcement. J. Compos. Constr. 2019, 23, 04019019. [Google Scholar] [CrossRef]
- Xia, Z.H.; Lin, L.M.; Zhang, J.H.; Jiang, S.F. Seismic performance of underwater RC bridge piers strengthened with self-compacting concrete-filled BFRP jacket. Structures 2022, 39, 637–652. [Google Scholar] [CrossRef]
- Zhao, B. The Study on Underwater Pier Reinforcement Technology by Precast Concrete Segment Assembled Quickly. Master’s Thesis, Southeast University, Nanjing, China, 2015. (In Chinese). [Google Scholar]
- Huang, J.C. The Study on Prefabrication Technology of Reinforced Concrete Shield Segment. Master’s Thesis, Tongji University, Shanghai, China, 2007. (In Chinese). [Google Scholar]
- Liu, X.; Bai, Y.; Yuan, Y.; Mang, H.A. Experimental investigation of the ultimate bearing capacity of continuously jointed segmental tunnel linings. Struct. Infrastruct. Eng. 2016, 12, 1364–1379. [Google Scholar] [CrossRef]
- Meng, G.; Gao, B.; Zhou, J.; Cao, G.; Zhang, Q. Experimental investigation of the mechanical behavior of the steel fiber reinforced concrete tunnel segment. Constr. Build. Mater. 2016, 126, 98–107. [Google Scholar] [CrossRef]
- Qu, X.S.; Liu, Q. Bond strength between steel and self-compacting lower expansion concrete in composite columns. J. Constr. Steel Res. 2017, 139, 176–187. [Google Scholar] [CrossRef]
- Lu, Y.; Liu, Z.; Li, S.; Li, N. Bond behavior of steel fibers reinforced self-stressing and self-compacting concrete filled steel tube columns. Constr. Build. Mater. 2018, 158, 894–909. [Google Scholar] [CrossRef]
- Huang, C.K.; Shang, Z.Q.; Zhang, P. Experimental research on self-stressing and self-compacting concrete filled steel tube subjected to eccentric compression load. J. Dalian Univ. Technol. 2008, 48, 564–569. (In Chinese) [Google Scholar]
- Zhao, Z.T. Experimental Research on Self-Compacting and Self-Stressing Concrete-Filled Rectangular Steel Tubular Stub Columns under Axial Compression. Master’s Thesis, Inner Mongolia University of Science & Technology, Inner Mongolia, China, 2019. (In Chinese). [Google Scholar]
- Wang, H.L.; Guo, F.; Wang, B. Experimental research on the axial compression mechanical performance of BFRP tube expansion concrete short columns. Build. Struct. 2016, 46, 32–36. (In Chinese) [Google Scholar]
- Jia, H.Y.; Li, A.W.; Li, F.G.; Han, C.G. Seismic Performance of Self-compacting Self-stressing Concrete-filled Rectangular Steel Tubular Column. Bull. Chin. Ceram. Soc. 2018, 37, 1338–1343+1354. (In Chinese) [Google Scholar]
- Tang, Y.; Wu, G.; Sun, Z.Y. Numerical Study on Seismic Behavior of Underwater Bridge Columns Strengthened with Prestressed Precast Concrete Panels and Fiber-Reinforced Polymer Reinforcements. Int. J. Polym. Sci. 2018, 2018, 7438694. [Google Scholar] [CrossRef]
- Deng, Z.C.; Li, H. Seismic Behavior of RC Columns Strengthened with Prestressed Steel Wires. J. Basic Sci. Eng. 2014, 22, 941–951. (In Chinese) [Google Scholar]
- Guo, Z.X.; Zhang, J.; Li, C.L. Seismic strengthening of rectangular RC columns using prestressing steel jackets. China Civ. Eng. J. 2009, 42, 112–117. (In Chinese) [Google Scholar]
- Zhao, M. Study on Strengthened Concrete Column’s Bearing Performance by the Method of Enlarging Section. Master’s Thesis, Xi’an University of Science and Technology, Xi’an, China, 2009. (In Chinese). [Google Scholar]
- Lu, Y.Y.; Yi, S.; Li, B.; Zhang, X.P. Experimental research on seismic performance of circular RC column strengthened with self-compacting concrete filled circular steel tube. J. Build. Struct. 2018, 39, 65–74. (In Chinese) [Google Scholar]
- Quan, S.H.; Zhao, H.L.; Wang, T.C.; Lin, H. Analysis of parameter influence on seismic behavior of reinforced RC columns. Build. Struct. 2019, 49, 49–53+63. (In Chinese) [Google Scholar]
- Memon, M.S.; Sheikh, S.A. Seismic Resistance of Square Concrete Columns Retrofitted with Glass Fiber-Reinforced Polymer. ACI Struct. J. 2005, 102, 774. [Google Scholar]
- Wang, X. Experimental Investigation on the Seismic Behaviors of Severe Earthquake Damaged GFRP Tubed RC Bridge Piers with Wrapped CFRP Sheets. Master’s Thesis, Dalian University of Technology, Dalian, China, 2011. (In Chinese). [Google Scholar]
- Li, J.B.; Gong, J.X.; Wang, L.C. Seismic behavior of corrosion-damaged reinforced concrete columns strengthened using combined carbon fiber-reinforced polymer and steel jacket. Constr. Build. Mater. 2009, 23, 2653–2663. [Google Scholar] [CrossRef]
- Zhong, C.Z. Seismic Performance of Concrete Filled Steel Tubular Piers Numerical Simulation and Analysis. Master’s Thesis, Guangdong University of Technology, Guangdong, China, 2022. (In Chinese). [Google Scholar]
- Wang, C. Seismic Behaviors Analysis of Concrete-Filled Thin-Walled Square Steel Box Piers Based on OpenSees. Master’s Thesis, Chang’an University, Xi’an, China, 2014. (In Chinese). [Google Scholar]
- Priestley, M.J.N.; Seible, F.; Calvi, G.M. Seismic Design and Retrofit; John Wiley & Sons: New York, NY, USA, 1996. [Google Scholar]
- Lei, T.; Qian, J.; Liu, C.Q. Application of Damaged Plasticity Model for Concrete. Struct. Eng. 2008, 24, 22–27. (In Chinese) [Google Scholar]
- GB 50010-2010; Code for Design of Concrete Structures. China Architecture & Building Press: Beijing, China, 2010. (In Chinese)
- Zhang, J.; Wang, Q.Y.; Hu, S.Y.; Wang, C.J. Parameters Verification of Concrete Damaged Plastic Model of ABAQUS. Build. Struct. 2008, 38, 127–130. (In Chinese) [Google Scholar]
- Supartono, F.; Sidoroff, F. Anisotropic damage modelling for brittle elastic materials. Symp. Fr. Pol. 1984, 37, 521–534. [Google Scholar]
- Wang, Y.X. Experimental Research on Seismic Behavior of Self-Centering Precast Segmental CFST Bridges Piers with Replaceable Composite Panels. Master’s Thesis, Tianjin University, Tianjin, China, 2021. (In Chinese). [Google Scholar]
- Chen, L.Y. Study on the Seismic Behavior of Prefabricated ECC Encased CFST Piers. Master’s Thesis, Chongqing University, Chongqing, China, 2021. (In Chinese). [Google Scholar]
- He, K. Study on the Mechanical Properties of Round-Ended Steel Tube-MPC Composite Structure. Master’s Thesis, Harbin Institute of Technology, Harbin, China, 2020. (In Chinese). [Google Scholar]
- Nakanishi, K.; Kitada, T.; Nakai, H. Experimental study on ultimate strength and ductility of concrete filled steel columns under strong earthquake. J. Constr. Steel Res. 1999, 51, 297–319. [Google Scholar] [CrossRef]
- GB 50367-2013; Code for Design of Strengthening Concrete Structure. China Architecture & Building Press: Beijing, China, 2013. (In Chinese)
- ACI 318-19; Building Code Requirements for Structural Concrete. American Concrete Institute: Farmington Hills, MI, USA, 2019.
- DL/T 5117-2021; Test Code on Anti-Washout Underwater Concrete. China Electric Power Press: Beijing, China, 2021. (In Chinese)
- GB 50936-2014; Technical Code for Concrete Filled Steel Tubular Structures. China Architecture & Building Press: Beijing, China, 2014. (In Chinese)
- AISC/ASCI 360-16; Specification for Structural Steel Buildings. American Institute of Steel Construction: Chicago, IL, USA, 2016.
- European Committee for Standardization. Eurocode 4: Design of Composite Steel and Concrete Structures-Part 1-1: General Rules and Rules for Buildings; British Standards Institution: London, UK, 2004. [Google Scholar]
- Shang, Z.Q. Research on Mechanical Behavior of Self-Stressing and Self-Compacting Concrete Filled Steel Tube Columns. Ph.D. Thesis, Dalian University of Technology, Dalian, China, 2008. (In Chinese). [Google Scholar]
- JGJ/T 101-2015; Specification for Seismic Test of Buildings. China Architecture & Building Press: Beijing, China, 2015. (In Chinese)
- AISC/ASCI 341-10; Seismic Provisions for Structural Steel Buildings. American Institute of Steel Construction: Chicago, IL, USA, 2010.
- IBC-2015; International Building Code. International Code Council, Inc.: Falls Church, VA, USA, 2015.
- ASCE/SEI 7-10; Minimum Design Loads for Building and Other Structures. American Society of Civil Engineers: Reston, VA, USA, 2010.
- Feng, P.; Qiang, H.L.; Ye, L.P. Discussion and definition on yield points of materials, members and structures. Eng. Mech. 2017, 34, 36–46. (In Chinese) [Google Scholar]
- Feng, P.; Cheng, S.; Bai, Y.; Ye, L.P. Mechanical behavior of concrete-filled square steel tube with FRP-confined concrete core subjected to axial compression. Compos. Struct. 2015, 123, 312–324. [Google Scholar] [CrossRef]
- Tazarv, M.; Saiidi, M.S. UHPC-filled duct connections for accelerating bridge construction of RC columns in high seismic zones. Eng. Struct. 2015, 99, 413–422. [Google Scholar] [CrossRef]
- Deng, Z.C.; Li, J.H. Study on restoring force model of RC corroded columns strengthened with hybrid FRP. Eng. Mech. 2011, 28, 151–159. [Google Scholar]
- Ma, K.Z.; Liang, X.W.; Li, B. Research on the restoring force model of high strength concrete-filled rectangular steel tubular columns. World Earthq. Eng. 2011, 27, 54–59. (In Chinese) [Google Scholar]
- Zhang, W.A. Dynamic Behaviors of Concrete Filled Thin-Walled Steel Tubular Composite Columns. Master’s Thesis, Fuzhou University, Fuzhou, China, 2017. (In Chinese). [Google Scholar]
- Zhou, X.H.; Yan, B.; Liu, J.P. Axial load behavior of circular tube reinforced concrete columns with different length-diameter ratios. J. Build. Struct. 2018, 39, 11–21. (In Chinese) [Google Scholar]
- Han, L.H.; Tao, Z. Ductility coefficient of concrete filled steel tubular columns with square sections. Earthq. Eng. Eng. Dyn. 2000, 20, 56–65. (In Chinese) [Google Scholar]
- Zhang, S.M.; Liu, J.P.; Wang, Y.Y.; Guo, H.L. Hysteretic behavior of biaxially loaded high strength concrete-filled square hollow section beam-columns. J. Build. Struct. 2005, 26, 9–18. (In Chinese) [Google Scholar]
- Priestley, M.J.N.; Kowalsky, M.J. Aspects of drift and ductility capacity of rectangular cantilever structural walls. Bull. N. Z. Soc. Earthq. Eng. 1998, 31, 73–85. [Google Scholar] [CrossRef]
- Lu, Z.T.; Shi, P.F.; Zhou, Y.Q. Experimental study on shear bearing capacity of circular and annular reinforced concrete members. J. Build. Struct. 1995, 16, 13–20. (In Chinese) [Google Scholar]
- Liu, T.Y. Calculation of the Shearing Resistance of Concrete Structures with Circular Cross Section. Anhui Archit. 2007, 5, 70–71. (In Chinese) [Google Scholar]


| Group | Specimen | Core Pier Column | SSAWC | LCSS | |||||
|---|---|---|---|---|---|---|---|---|---|
| D × H (mm) | LDR | Initial Damage | Thickness (mm) | Self-Stress (MPa) | Reinforcement Ratio (%) | Thickness (mm) | Reinforcement Ratio (%) | ||
| G0 | UP-1 | 250 × 1000 | 4 | Intact | |||||
| UP-2 | 250 × 1500 | 6 | Intact | ||||||
| UP-3 | 250 × 2000 | 8 | Intact | ||||||
| G1 | RP-0 | 250 × 1000 | 4 | Intact | 40 | 0 | 0.28 | 40 | 0.5 |
| G2 | RP-1 | 250 × 1000 | 4 | Intact | 40 | 1.6 | 0.28 | 40 | 0.5 |
| RP-2 | 250 × 1000 | 4 | Intact | 40 | 1.6 | 0.28 | 40 | 0.25 | |
| RP-3 | 250 × 1000 | 4 | Damaged | 40 | 1.6 | 0.28 | 40 | 0.5 | |
| RP-4 | 250 × 1500 | 6 | Intact | 40 | 1.6 | 0.28 | 40 | 0.5 | |
| RP-5 | 250 × 2000 | 8 | Intact | 40 | 1.6 | 0.28 | 40 | 0.5 | |
| Specimen | K0 (kN/mm) | Fy (kN) | Δy (mm) | Fp (kN) | Δp(mm) | Fu (kN) | Δu (mm) | μ |
|---|---|---|---|---|---|---|---|---|
| UP-1 | 4.53 | 22.07 | 11.93 | 27.37 | 23.85 | 23.26 | 67.22 | 5.63 |
| UP-2 | 1.54 | 13.86 | 21.71 | 18.94 | 53.94 | 16.09 | 105.94 | 4.88 |
| UP-3 | 0.88 | 11.63 | 36.33 | 14.22 | 78.73 | 12.08 | 186.74 | 5.14 |
| RP-0 | 7.69 | 38.46 | 9.56 | 48.16 | 31.59 | 40.93 | 56.02 | 5.86 |
| RP-1 | 8.33 | 45.25 | 9.11 | 56.48 | 23.53 | 48.01 | 76.58 | 8.41 |
| RP-2 | 7.17 | 41.28 | 9.36 | 51.46 | 22.82 | 43.74 | 64.37 | 6.88 |
| RP-3 | 7.95 | 44.91 | 10.73 | 56.19 | 31.46 | 47.76 | 61.04 | 5.69 |
| RP-4 | 4.26 | 30.38 | 13.06 | 37.62 | 27.37 | 31.97 | 95.70 | 7.33 |
| RP-5 | 2.44 | 20.48 | 20.67 | 26.09 | 53.66 | 22.18 | 123.61 | 5.98 |
| ψ | ε | σb0/σc0 | Kc | ν |
|---|---|---|---|---|
| 30 | 0.1 | 1.16 | 0.6667 | 0.005 |
| Specimen | Fp (kN) | RE of Fp (%) | Δy (mm) | Δu (mm) | μ | RE of μ (%) |
|---|---|---|---|---|---|---|
| RP-0 | 48.16 | 4.69 | 9.56 | 56.02 | 5.86 | 3.41 |
| MRP-0 | 50.42 | 12.17 | 73.75 | 6.06 | ||
| RP-1 | 56.48 | 3.79 | 9.11 | 76.58 | 8.41 | 9.16 |
| MRP-1 | 58.62 | 10.83 | 82.77 | 7.64 |
| Model | Pier Column | SSAWC | LCSS | ||
|---|---|---|---|---|---|
| ACR | Reinforcement Ratio (%) | Strength Grade | Self-Stress (MPa) | Thickness (mm) | |
| MT-1 | 0.2 | 0.28 | C40 | 1.6 | 20 |
| MT-2 | 0.2 | 0.28 | C40 | 1.6 | 30 |
| MT-3 | 0.2 | 0.28 | C40 | 1.6 | 40 |
| MT-4 | 0.2 | 0.28 | C40 | 1.6 | 50 |
| MR-1 | 0.2 | 0.56 | C40 | 1.6 | 40 |
| MR-2 | 0.2 | 0.84 | C40 | 1.6 | 40 |
| MR-3 | 0.2 | 1.12 | C40 | 1.6 | 40 |
| MR-4 | 0.2 | 1.40 | C40 | 1.6 | 40 |
| MS-1 | 0.2 | 0.28 | C30 | 1.6 | 40 |
| MS-2 | 0.2 | 0.28 | C35 | 1.6 | 40 |
| MS-3 | 0.2 | 0.28 | C40 | 1.6 | 40 |
| MS-4 | 0.2 | 0.28 | C45 | 1.6 | 40 |
| MSS-1 | 0.2 | 0.28 | C40 | 0 | 40 |
| MSS-2 | 0.2 | 0.28 | C40 | 1.6 | 40 |
| MSS-3 | 0.2 | 0.28 | C40 | 2.2 | 40 |
| MSS-4 | 0.2 | 0.28 | C40 | 2.8 | 40 |
| MA-1 | 0.1 | 0.28 | C40 | 1.6 | 40 |
| MA-2 | 0.2 | 0.28 | C40 | 1.6 | 40 |
| MA-3 | 0.3 | 0.28 | C40 | 1.6 | 40 |
| MA-4 | 0.4 | 0.28 | C40 | 1.6 | 40 |
| Model | K0 (kN/mm) | Fy (kN) | Δy (mm) | Fp (kN) | Δp (mm) | Fu (kN) | Δu (mm) | μ |
|---|---|---|---|---|---|---|---|---|
| MT-1 | 15.07 | 32.05 | 10.91 | 45.36 | 56 | 42.87 | 80 | 7.33 |
| MT-2 | 17.05 | 36.04 | 10.40 | 50.44 | 56 | 45.96 | 80 | 7.69 |
| MT-3 | 17.98 | 43.70 | 11.24 | 55.47 | 48 | 50.48 | 80 | 7.12 |
| MT-4 | 20.07 | 41.32 | 12.68 | 54.33 | 48 | 48.82 | 80 | 6.31 |
| MR-1 | 15.47 | 40.53 | 11.32 | 49.77 | 40 | 46.33 | 80 | 7.07 |
| MR-2 | 15.96 | 42.82 | 12.14 | 51.35 | 40 | 48.95 | 80 | 6.59 |
| MR-3 | 17.86 | 43.68 | 13.49 | 54.03 | 48 | 50.19 | 80 | 5.93 |
| MR-4 | 18.02 | 44.65 | 14.16 | 55.27 | 56 | 52.14 | 80 | 5.65 |
| MS-1 | 14.73 | 34.13 | 10.99 | 47.33 | 56 | 43.02 | 80 | 7.28 |
| MS-2 | 16.77 | 38.09 | 11.10 | 52.15 | 48 | 47.04 | 80 | 7.21 |
| MS-3 | 17.98 | 44.05 | 11.48 | 55.47 | 48 | 50.48 | 80 | 6.97 |
| MS-4 | 18.43 | 42.37 | 11.51 | 57.31 | 48 | 51.69 | 80 | 6.95 |
| MSS-1 | 15.00 | 39.84 | 14.63 | 49.37 | 40 | 46.72 | 80 | 5.47 |
| MSS-2 | 17.98 | 44.90 | 12.07 | 55.47 | 48 | 50.48 | 80 | 6.63 |
| MSS-3 | 18.59 | 47.29 | 11.40 | 62.44 | 56 | 55.97 | 80 | 7.02 |
| MSS-4 | 20.17 | 51.36 | 11.22 | 68.11 | 32 | 55.12 | 80 | 7.13 |
| MA-1 | 13.35 | 38.22 | 11.17 | 48.62 | 40 | 44.14 | 80 | 7.16 |
| MA-2 | 17.30 | 41.74 | 11.03 | 53.11 | 40 | 48.56 | 80 | 7.25 |
| MA-3 | 17.98 | 44.78 | 11.99 | 55.47 | 48 | 50.48 | 80 | 6.67 |
| MA-4 | 15.76 | 48.69 | 14.18 | 57.37 | 40 | 50.13 | 80 | 5.64 |
| Specimen | Yield Load | Yield Displacement | ||||
|---|---|---|---|---|---|---|
| Fy,m (kN) | Fy,c (kN) | RE (%) | Δy,m (mm) | Δy,c (mm) | RE (%) | |
| RP-0 | 38.46 | 37.05 | 3.67 | 9.56 | 9.28 | 2.93 |
| RP-1 | 45.25 | 42.18 | 6.78 | 9.11 | 9.47 | 3.95 |
| RP-2 | 41.28 | 40.32 | 2.33 | 9.36 | 9.65 | 3.10 |
| RP-4 | 30.38 | 29.20 | 3.88 | 13.06 | 12.59 | 3.60 |
| RP-5 | 20.48 | 20.91 | 2.10 | 20.67 | 19.75 | 4.45 |
| Specimen | Peak Load | Peak Displacement | ||||
|---|---|---|---|---|---|---|
| Fp,m (kN) | Fp,c (kN) | RE (%) | Δp,m (mm) | Δp,c (mm) | RE (%) | |
| RP-0 | 48.16 | 46.32 | 3.82 | 31.59 | 29.70 | 5.98 |
| RP-1 | 56.48 | 53.92 | 4.53 | 23.53 | 25.00 | 6.25 |
| RP-2 | 51.46 | 52.62 | 2.25 | 22.82 | 21.15 | 7.32 |
| RP-4 | 37.62 | 38.96 | 3.56 | 27.37 | 26.66 | 2.59 |
| RP-5 | 26.09 | 25.38 | 2.72 | 53.66 | 51.19 | 4.60 |
| Specimen | Ultimate Load | Ultimate Displacement | ||||
|---|---|---|---|---|---|---|
| Fu,m (kN) | Fu,c (kN) | RE (%) | Δu,m (mm) | Δu,c (mm) | RE (%) | |
| RP-0 | 40.93 | 39.37 | 3.81 | 56.02 | 57.98 | 3.50 |
| RP-1 | 48.01 | 45.83 | 4.54 | 76.58 | 73.70 | 3.76 |
| RP-2 | 43.74 | 44.73 | 2.26 | 64.37 | 67.19 | 4.38 |
| RP-4 | 31.97 | 33.12 | 3.60 | 95.70 | 89.57 | 6.41 |
| RP-5 | 22.18 | 21.57 | 2.75 | 123.61 | 119.92 | 2.99 |
Disclaimer/Publisher’s Note: The statements, opinions and data contained in all publications are solely those of the individual author(s) and contributor(s) and not of MDPI and/or the editor(s). MDPI and/or the editor(s) disclaim responsibility for any injury to people or property resulting from any ideas, methods, instructions or products referred to in the content. |
© 2023 by the authors. Licensee MDPI, Basel, Switzerland. This article is an open access article distributed under the terms and conditions of the Creative Commons Attribution (CC BY) license (https://creativecommons.org/licenses/by/4.0/).
Share and Cite
Sun, Y.; Xu, W.; Shen, S. Experimental Studies on the Seismic Performance of Underwater Concrete Piers Strengthened by Self-Stressed Anti-Washout Concrete and Segments. Appl. Sci. 2023, 13, 12034. https://doi.org/10.3390/app132112034
Sun Y, Xu W, Shen S. Experimental Studies on the Seismic Performance of Underwater Concrete Piers Strengthened by Self-Stressed Anti-Washout Concrete and Segments. Applied Sciences. 2023; 13(21):12034. https://doi.org/10.3390/app132112034
Chicago/Turabian StyleSun, Yu, Wansong Xu, and Sheng Shen. 2023. "Experimental Studies on the Seismic Performance of Underwater Concrete Piers Strengthened by Self-Stressed Anti-Washout Concrete and Segments" Applied Sciences 13, no. 21: 12034. https://doi.org/10.3390/app132112034
APA StyleSun, Y., Xu, W., & Shen, S. (2023). Experimental Studies on the Seismic Performance of Underwater Concrete Piers Strengthened by Self-Stressed Anti-Washout Concrete and Segments. Applied Sciences, 13(21), 12034. https://doi.org/10.3390/app132112034