1. Introduction
In recent years, we have been witnessing an era of digitization in dental medicine. With the entry into daily practice of methods such as intraoral scanning, digital imaging diagnostics, and the planning and manufacturing of structures and orthodontic appliances through CAD/CAM (Computer Aided Design/Computer-Aided Manufacturing) methods, the classic working protocol is being replaced by a digital one. Today, CAD/CAM methods are routinely used in almost all areas of dentistry for the fabrication of prosthetic structures [
1,
2], orthodontic appliances [
3], and in implantology for the production of surgical guides and individual abutments [
4,
5].
CAD/CAM methods are related to the planning of constructions using specialized software, after which they are made by machines with digital program control through methods of subtractive production (milling or additive production) and 3D printing. Each one of these methods has its own technological advantages and disadvantages. Milling is the removal of material from a monolithic block using a specialized multi-axis milling machine. The accuracy and quality of the workpiece in this method are determined by the number of milling axes [
6], the smallest cutter size [
7], adequate cooling, and the absence of vibration during milling, which depends on the correct planning of the supports [
8].
One serious disadvantage of this method is the large amount of waste material that is milled. This increases the cost of the final product. Additive manufacturing is a method in which an object is built by fusing material, which is accomplished by sequentially bonding layer after layer [
9]. The main advantages of this production method are that it allows the production of objects with a very complex shape, there is no need to change depreciable consumables such as cutters [
10], and it is economical in terms of the material used, which is essential when it comes to expensive raw materials such as Ti. The main disadvantage of additive methods is the repeated large number of cycles of heating and cooling of the material during its layer-by-layer application. The reason for this is that with each new layer, the laser also heats the previous layer, which has already partially cooled down. This could affect the mechanical properties of the final product [
11].
Another disadvantage of this method is the expensive equipment and sensitive technology, which, if not properly performed, can spoil the final result. In modern dentistry, more and more attention is paid to the biocompatibility of the materials used. Another important point to consider when choosing a material is its mechanical properties. The alloy Ti-6Al-4V, 6-4 for short, or frequently referred to as Grade 5, accounts for more than half the world’s usage of titanium and is the most common of all titanium alloys. It is widely used in aerospace, marine, and chemical treatments [
12]. Ti-6Al-4V or Ti G5 is an alloy widely used in dentistry too. The content of aluminum and vanadium in the titanium alloy designated as Ti-6Al-4V is Al-5.5–6.75%, V-3.5–4.5% [
13,
14]. It has excellent biocompatibility [
15,
16] and good mechanical properties [
17]. The mechanical properties of the Ti-6Al-4V alloy can be further improved by secondary heat treatment, and the surface characteristics can be improved by additional mechanical treatments [
18]. Unlike milling where the mechanical properties are much more constant,, in additive technologies they can vary depending on many factors. Sangali et al. [
19] indicate that the set values of scanning speeds and energy density values (VED) are directly related to the porosity and corrosion resistance of the alloy. Luo [
20] points out that when the laser energy density is too low, holes from unglued particles appear, and when the density is too high, pores appear due to the evaporation of part of the dust particles. Repnin et al. [
21] take into account the fact that with additive technologies the fracture resistance depends on the orientation of the structure relative to the build plane (build orientation). There are a lot of works in the literature devoted to both the processing of Ti-6Al-4V alloys and 3D printing with them; however, the use of different manufacturing parameters and annealing heat treatments during the production process of the samples leads to obtaining material with a different microstructure, which leads to different mechanical properties.
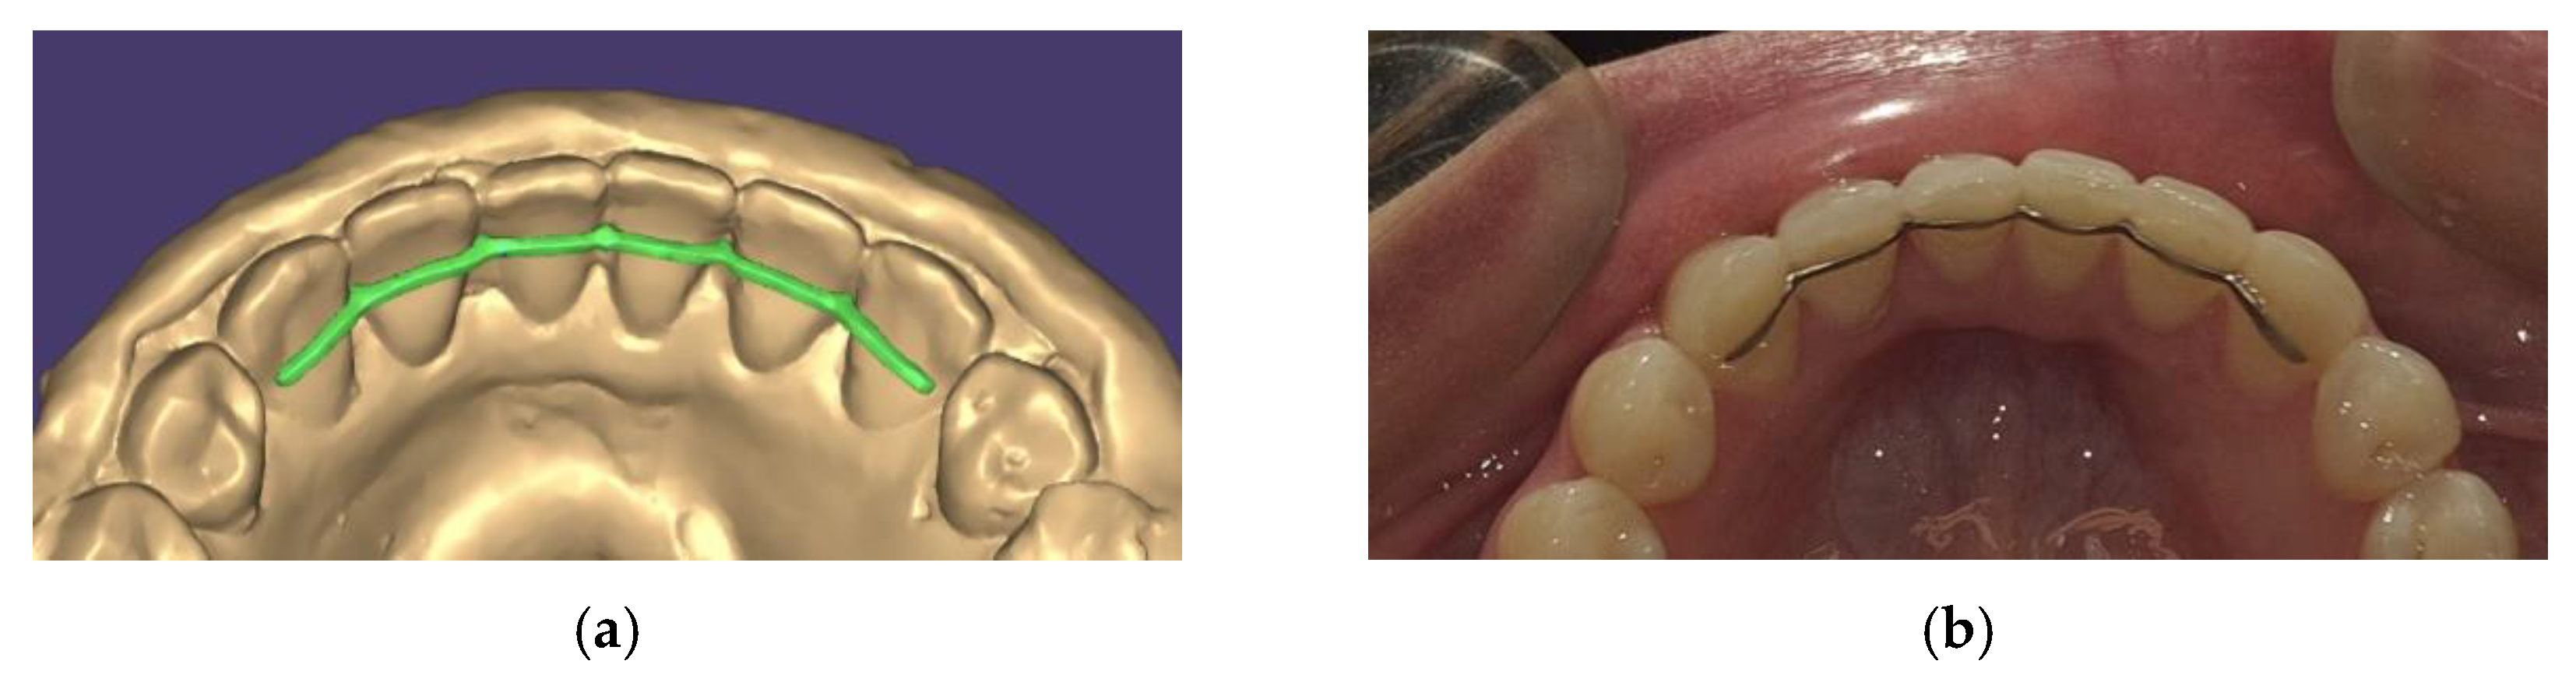
In our practice, we use Ti-6Al-4V to fabricate long-term or lifelong orthodontic retainers (
Figure 1) made by CAD/CAM methods. The requirements for the ideal retainers are to have sufficient hardness to hold the healing results and, at the same time, to have some elasticity to not completely limit physiological tooth movements. For this reason, we focused on using Ti as Co-Cr alloys do not meet these requirements [
22].
The aim of the present study was to compare the mechanical properties and surface characteristics of two titanium alloys for subtractive and additive CAD/CAM manufacturing in dental medicine. Our hypothesis was that despite the similar composition of Ti-6Al-4V used for subtractive and additive manufacturing in dentistry, there is a difference in the mechanical properties of the samples obtained by these two methods because of the difference in the technological processes.
2. Experimental Investigation
2.1. Preparation of the Samples
A 3D-printed titanium alloy was produced from metal powder, PowderRange Ti64 (Carpenter Technology Corp., Philadelphia, PA, USA), on a selective laser fusion apparatus, MYSINT100 (SISMA S.p.A., Vicenza, Italia) (
Figure 2a), using a fiber laser source.
According to the certificate provided by the manufacturer Carpenter Technology [
23], of the powder used for production of the 3D-printed sample, the chemical composition of the metal powder PowderRange Ti64 is as follows: ~89% Ti, Aluminum 5.50–6.50%, Vanadium 3.50–4.50%, Iron 0.25%, Oxygen 0.13%, Carbon 0.08%, Nitrogen 0.03%, Hydrogen 0.0125%, Yttrium 0.005%, Other, each < 0.10%, Other, total < 0.40%. The manufacturing parameters of the 3D-printed titanium alloy are given in
Table 1.
For the milled Ti, Ti G5 discs (SILADENT Dr. Böhme & Schöps GmbH, Goslar, Germany) were used, and it was milled on a CORiTEC 650i 5-axis milling machine (Imes-icore GmbH, Hessen, Germany) (
Figure 2b). According to the certificate provided by the manufacturer Siladent [
24], the chemical composition of the titanium discs used for production of the milled sample is as follows: 88% Ti, 6.75% Al, 4.5% V, <1% others (N; C; H; Fe; O).
2.2. Structural Characterization
The surface morphology and the elemental composition were studied by a scanning electron microscope (SEM) “HIROX SH-5500P” (Jyfel Corporation—Hirox Europe, Limonest, France) (
Figure 2c) with an integrated Energy-Dispersive X-Ray Spectroscopy (EDS) system “QUANTAX 100 Advanced”—Bruker. The SEM has an accelerating voltage range of 1–30 kV. The investigation was conducted at 20 kV.
The microstructure of the samples was analyzed using a “MIT500” (Chongqing Optec Instrument Co., Chongqing, China) microscope at magnifications up to 1000× and photographed with a DV500 digital camera. Metallographic samples were prepared according to a standard procedure. The microstructure of titanium samples was revealed by immersing them in the following solution: 1 mL HNO3 + 1ml HF + 48mL H2O.
An X-ray structural analysis of the investigated alloys was made using the powder X-ray diffraction method. The investigations were performed with a Bruker D8 Advance powder X-ray diffractometer (Bruker AXS, Karlsruhe, Germany) with a copper anode (
Figure 2d). The Bruker DIFFRAC.EVA v4 program and ICDD PDF-2 (2021) comparison database with reference measurements of inorganic compounds were used to determine the qualitative and quantitative phases of analysis. The crystallite size was calculated along a single line using the Scherrer equation and a Bruker Topas v4.2 diffraction profile analysis program.
The surface topography was studied by means of atomic force microscopy (AFM). AFM imaging was performed on the NanoScope V system (Bruker Ltd., Bremen, Germany) operating in tapping mode in air at room temperature. Silicon cantilevers (Tap 300 Al-G, Budget Sensors, Innovative Solutions Ltd., Sofia, Bulgaria) with a 10-nm-thick aluminum reflex coating were used. The scanning rate was set at 0.5 Hz, and a scanning size of 10 μm × 10 μm and 5 μm × 5 μm was applied. The images were taken in the highest possible resolution mode of the AFM, which is 512 × 512 pixels in JPEG format, using the NanoScope software v1.40r1.
2.3. Mechanical Characterization
The mechanical properties of both alloys were investigated by means of a tensile test, a three-point bending test, and nanoindentation experiments.
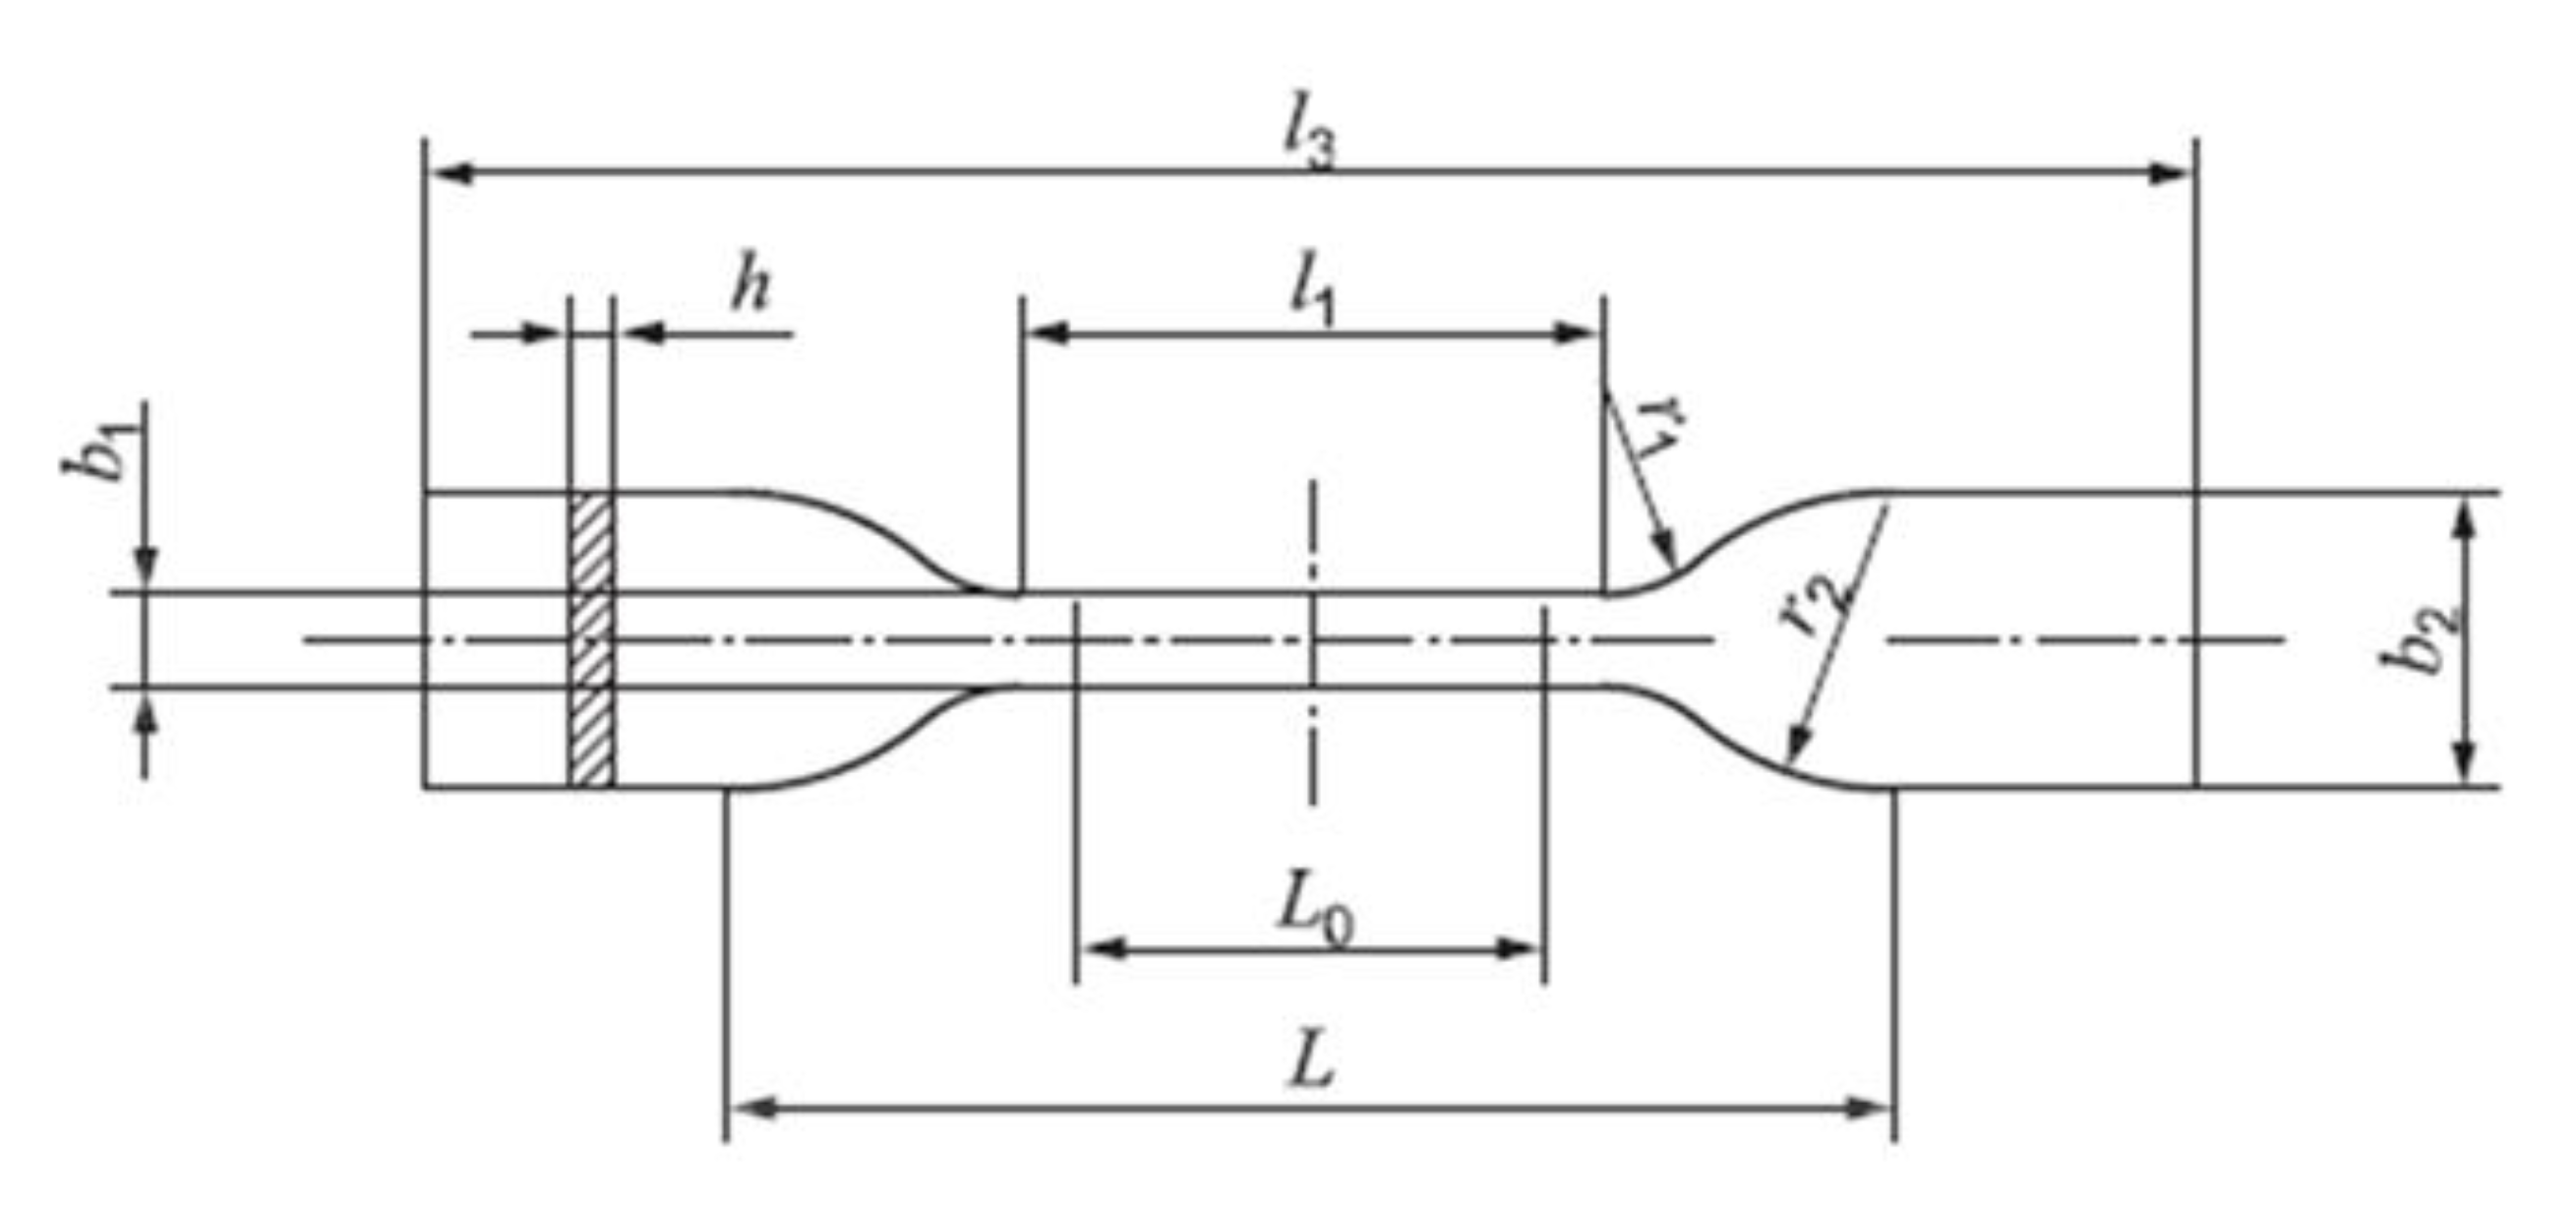
Figure 3 and
Table 2 show the geometry and dimensions of the specimens used for the bending test and tensile test. For the nanoindentation, we used samples in the form of disks with a thickness of 1 mm and a diameter of 10 mm (
Figure 4). Milling of the specimens was performed initially with a T26-3.0 I 6.0 mm milling cutter (Art. No. 526030 3006) and finished with a T64-1.5 I 6.0 mm milling cutter (Art. No. 52028 1506) (Imes-icore
® GmbH).
The tensile test was made according to the ISO 6892-1:2019 [
27] standard, using the electromechanical machine Instron 1185 (High Wycombe, Buckinghamshire, UK) at an absolute deformation rate of 0.2 mm/min. The three-point bending test was made according to the ISO 7438:2020 [
28] standard using the electromechanical machine Mecmesin 2, 5-i (Slinfold, West Sussex, UK) (
Figure 2e) at a speed of absolute deformation of 1 mm/min.
The nanoindentation experiments were made according to the ISO 14577 standard [
29] using a Nanoindenter G200 (KLA Corporation, Milpitas, CA, USA) (
Figure 2f) with a Berkovich tip. The indentation method with five loading–unloading cycles and load control was used in order to check if there were changes in the properties of the samples in depth. The maximum load was 30 gf (~294 mN), the peak hold time at the maximum load was 10s, and the time to load was 15s. Twenty-five indentations of each sample were made at a distance of 50 m between them.
2.4. Statistical Analyses
SPSS version 27.0 was used for the statistical analyses (SPSS Inc., Chicago, IL, USA). The Shapiro–Wilk test was performed to check the normality of the continuously measured variables. Since normality was present (p > 0.10 for all tests), the results were described with the means and standard deviations (SDs), and the independent samples t-test was used for between-group comparisons. The statistical tests were two-tailed at a Type-I error alpha of 0.05, with p-values < 0.05 being considered significant.
3. Results
3.1. SEM Results
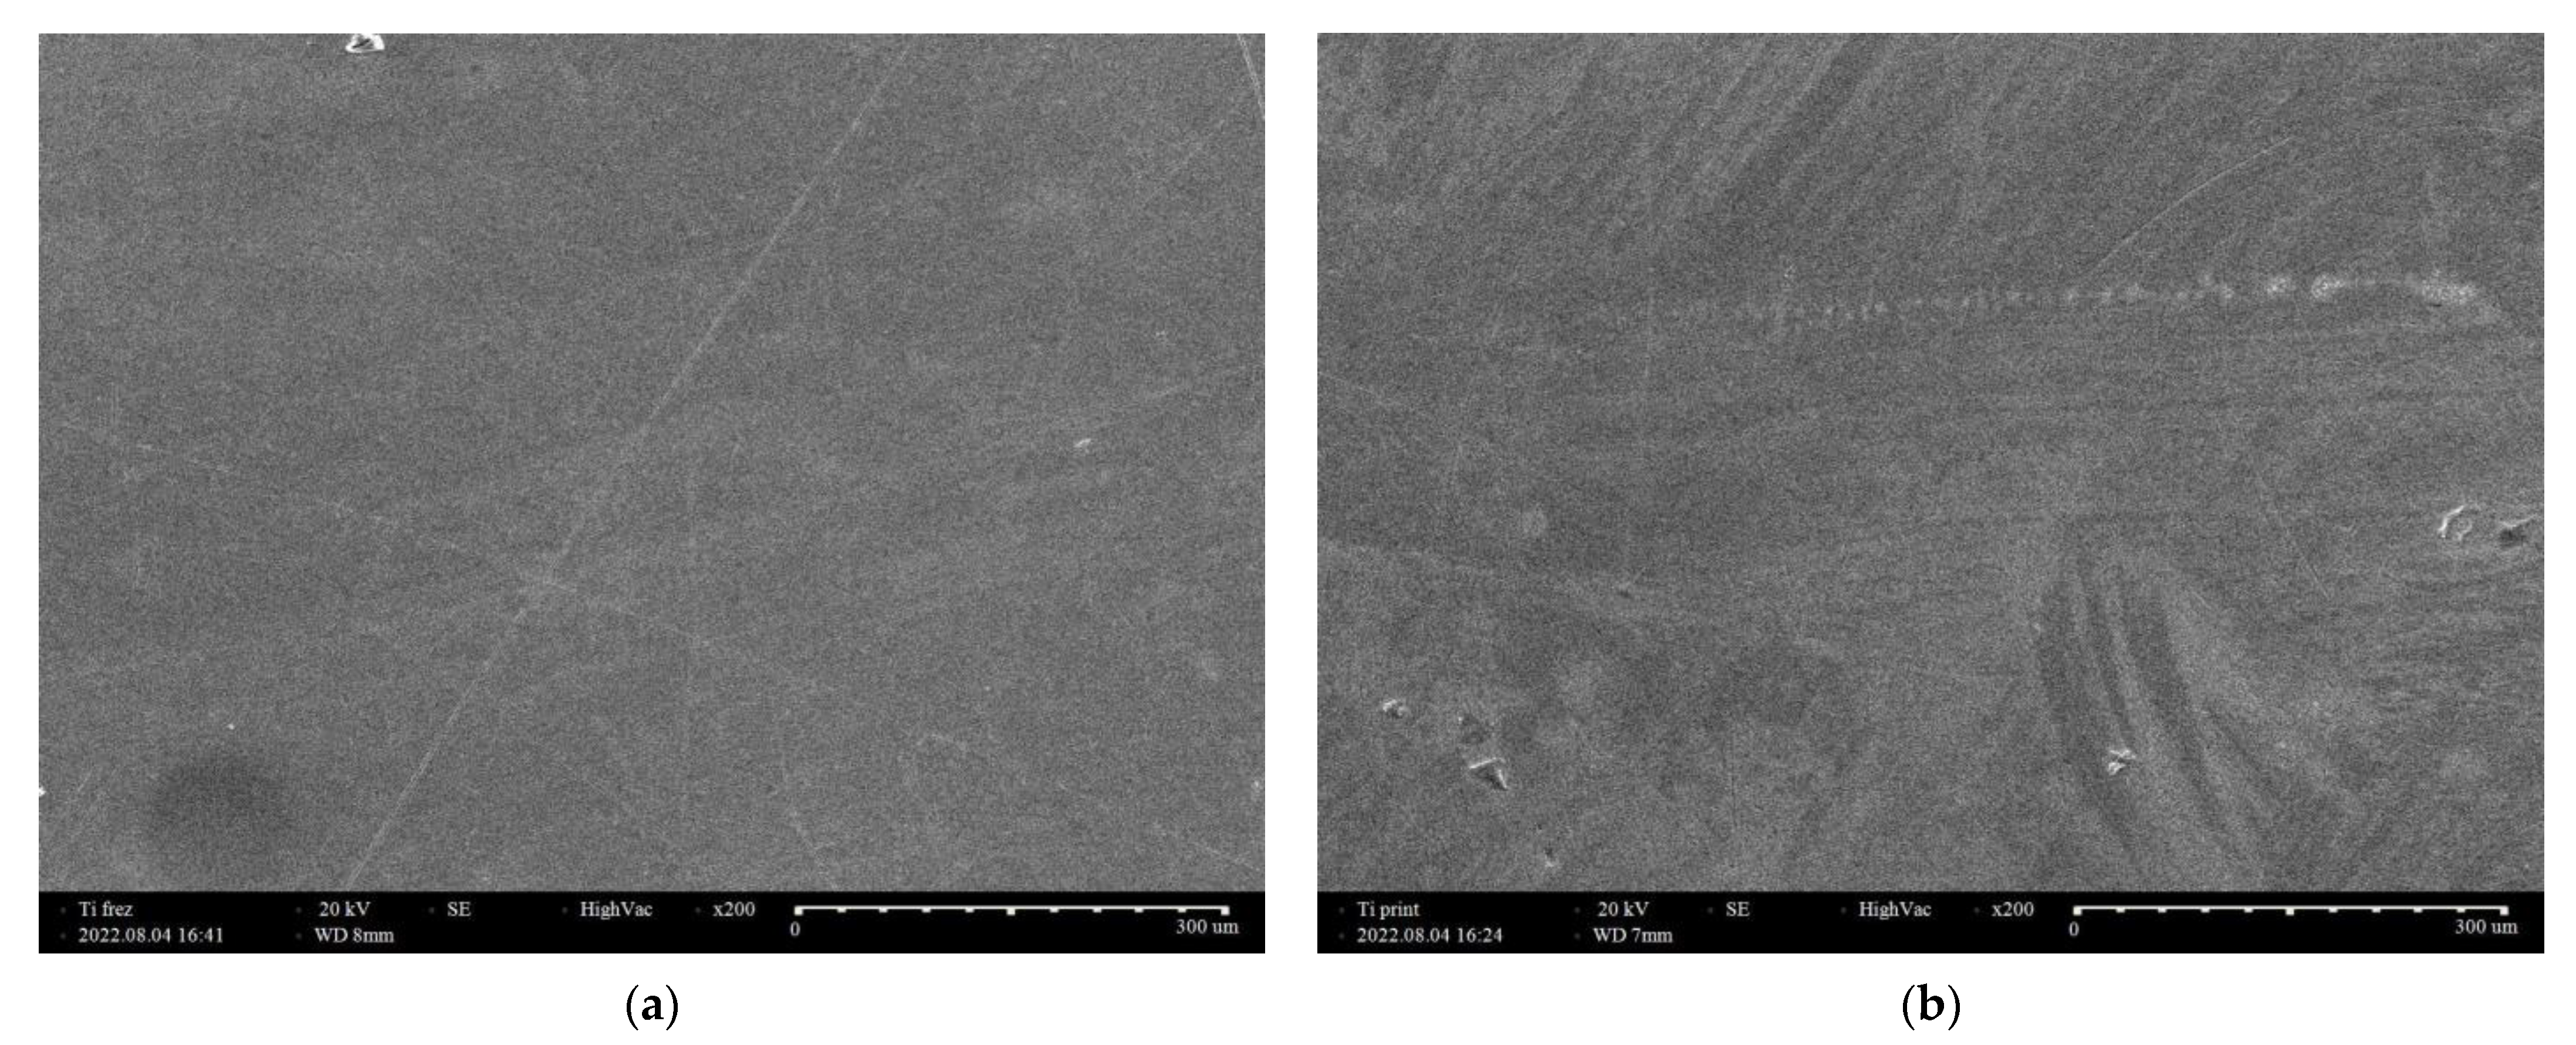
SEM studies were performed directly on the surfaces of the titanium disk samples with no mechanical or chemical treatment. The surface structure was photographed at a magnification of ×200 on milled titanium (
Figure 5a) and on 3D-printed titanium (
Figure 5b). From
Figure 5, it is evident that the surface of the 3D-printed titanium sample is smoother compared to the milled one.
3.2. XRD Results
Investigations were conducted with a Bruker D8 Advance powder X-ray diffractometer. The Bruker DIFFRAC.EVA program was used to determine the qualitative and quantitative phases of the analysis.
Figure 6 shows the diffractogram of the 3D-printed titanium sample. Two phases were found, namely aluminum titanate (Al
0.15Ti
0.85) and less aluminum titanate vanadate (Ti
2VAl). The established hexagonal phase of Al
0.15Ti
0.85 has a crystallite size of 77 nm, and the cubic phase of Ti
2VAl has a crystallite size of 18.5 nm.
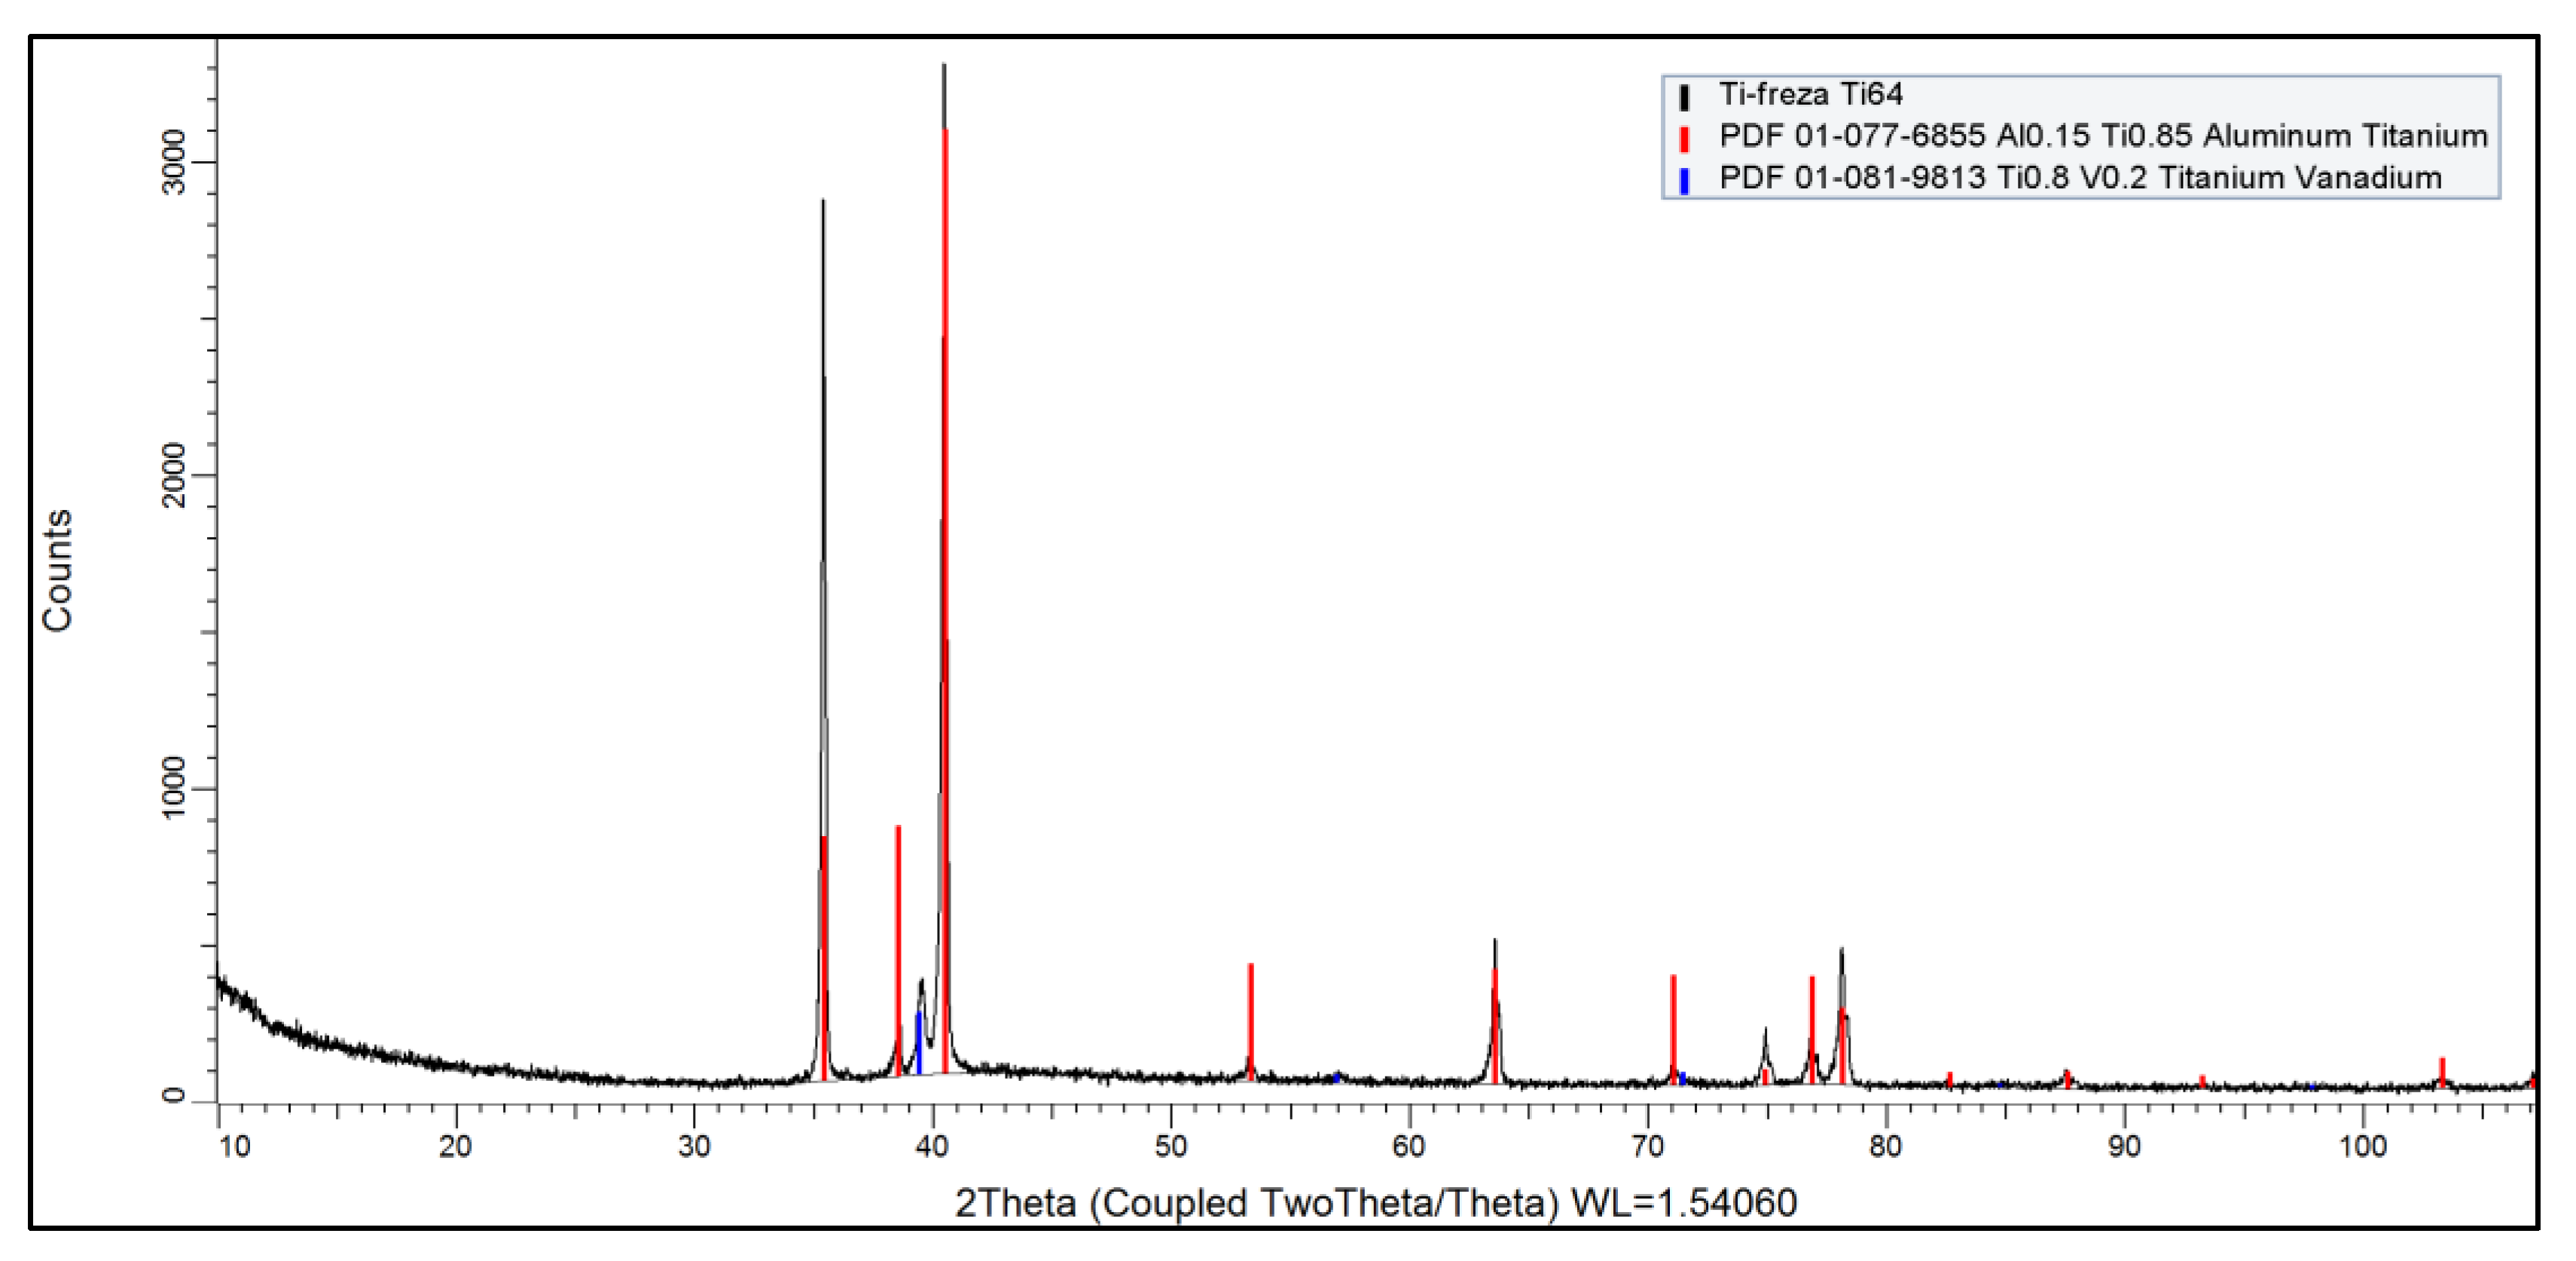
Figure 7 shows the diffractogram of a milled titanium sample. Two phases were found: mainly aluminum titanate (Al
0.15Ti
0.85) and less titanium vanadate (Ti
0.8V
0.2). A hexagonal phase of Al
0.15Ti
0.85 with crystallite sizes of 106 nm and a cubic phase of Ti
0.8V
0.2 with crystallite sizes of 22.8 nm were found.
The aluminum titanate phase is predominant in both samples, with the differences being a small amount of aluminum titanate vanadate in the printed titanium sample and a small amount of titanium vanadate in the milled titanium sample. With small quantities of chemical elements and compounds in the studied samples and insufficiently manifested peaks, the software detects phases as close to the characteristic peaks from the diffractograms as possible. There was a significant difference in the size of the crystallites of the Al0.15Ti0.85 main phase, with the crystallites (106 nm) in the milled titanium sample being 37% larger than the crystallites in the printed titanium sample (77 nm). For the secondary phases, the milled titanium sample had approximately 20% larger crystallites.
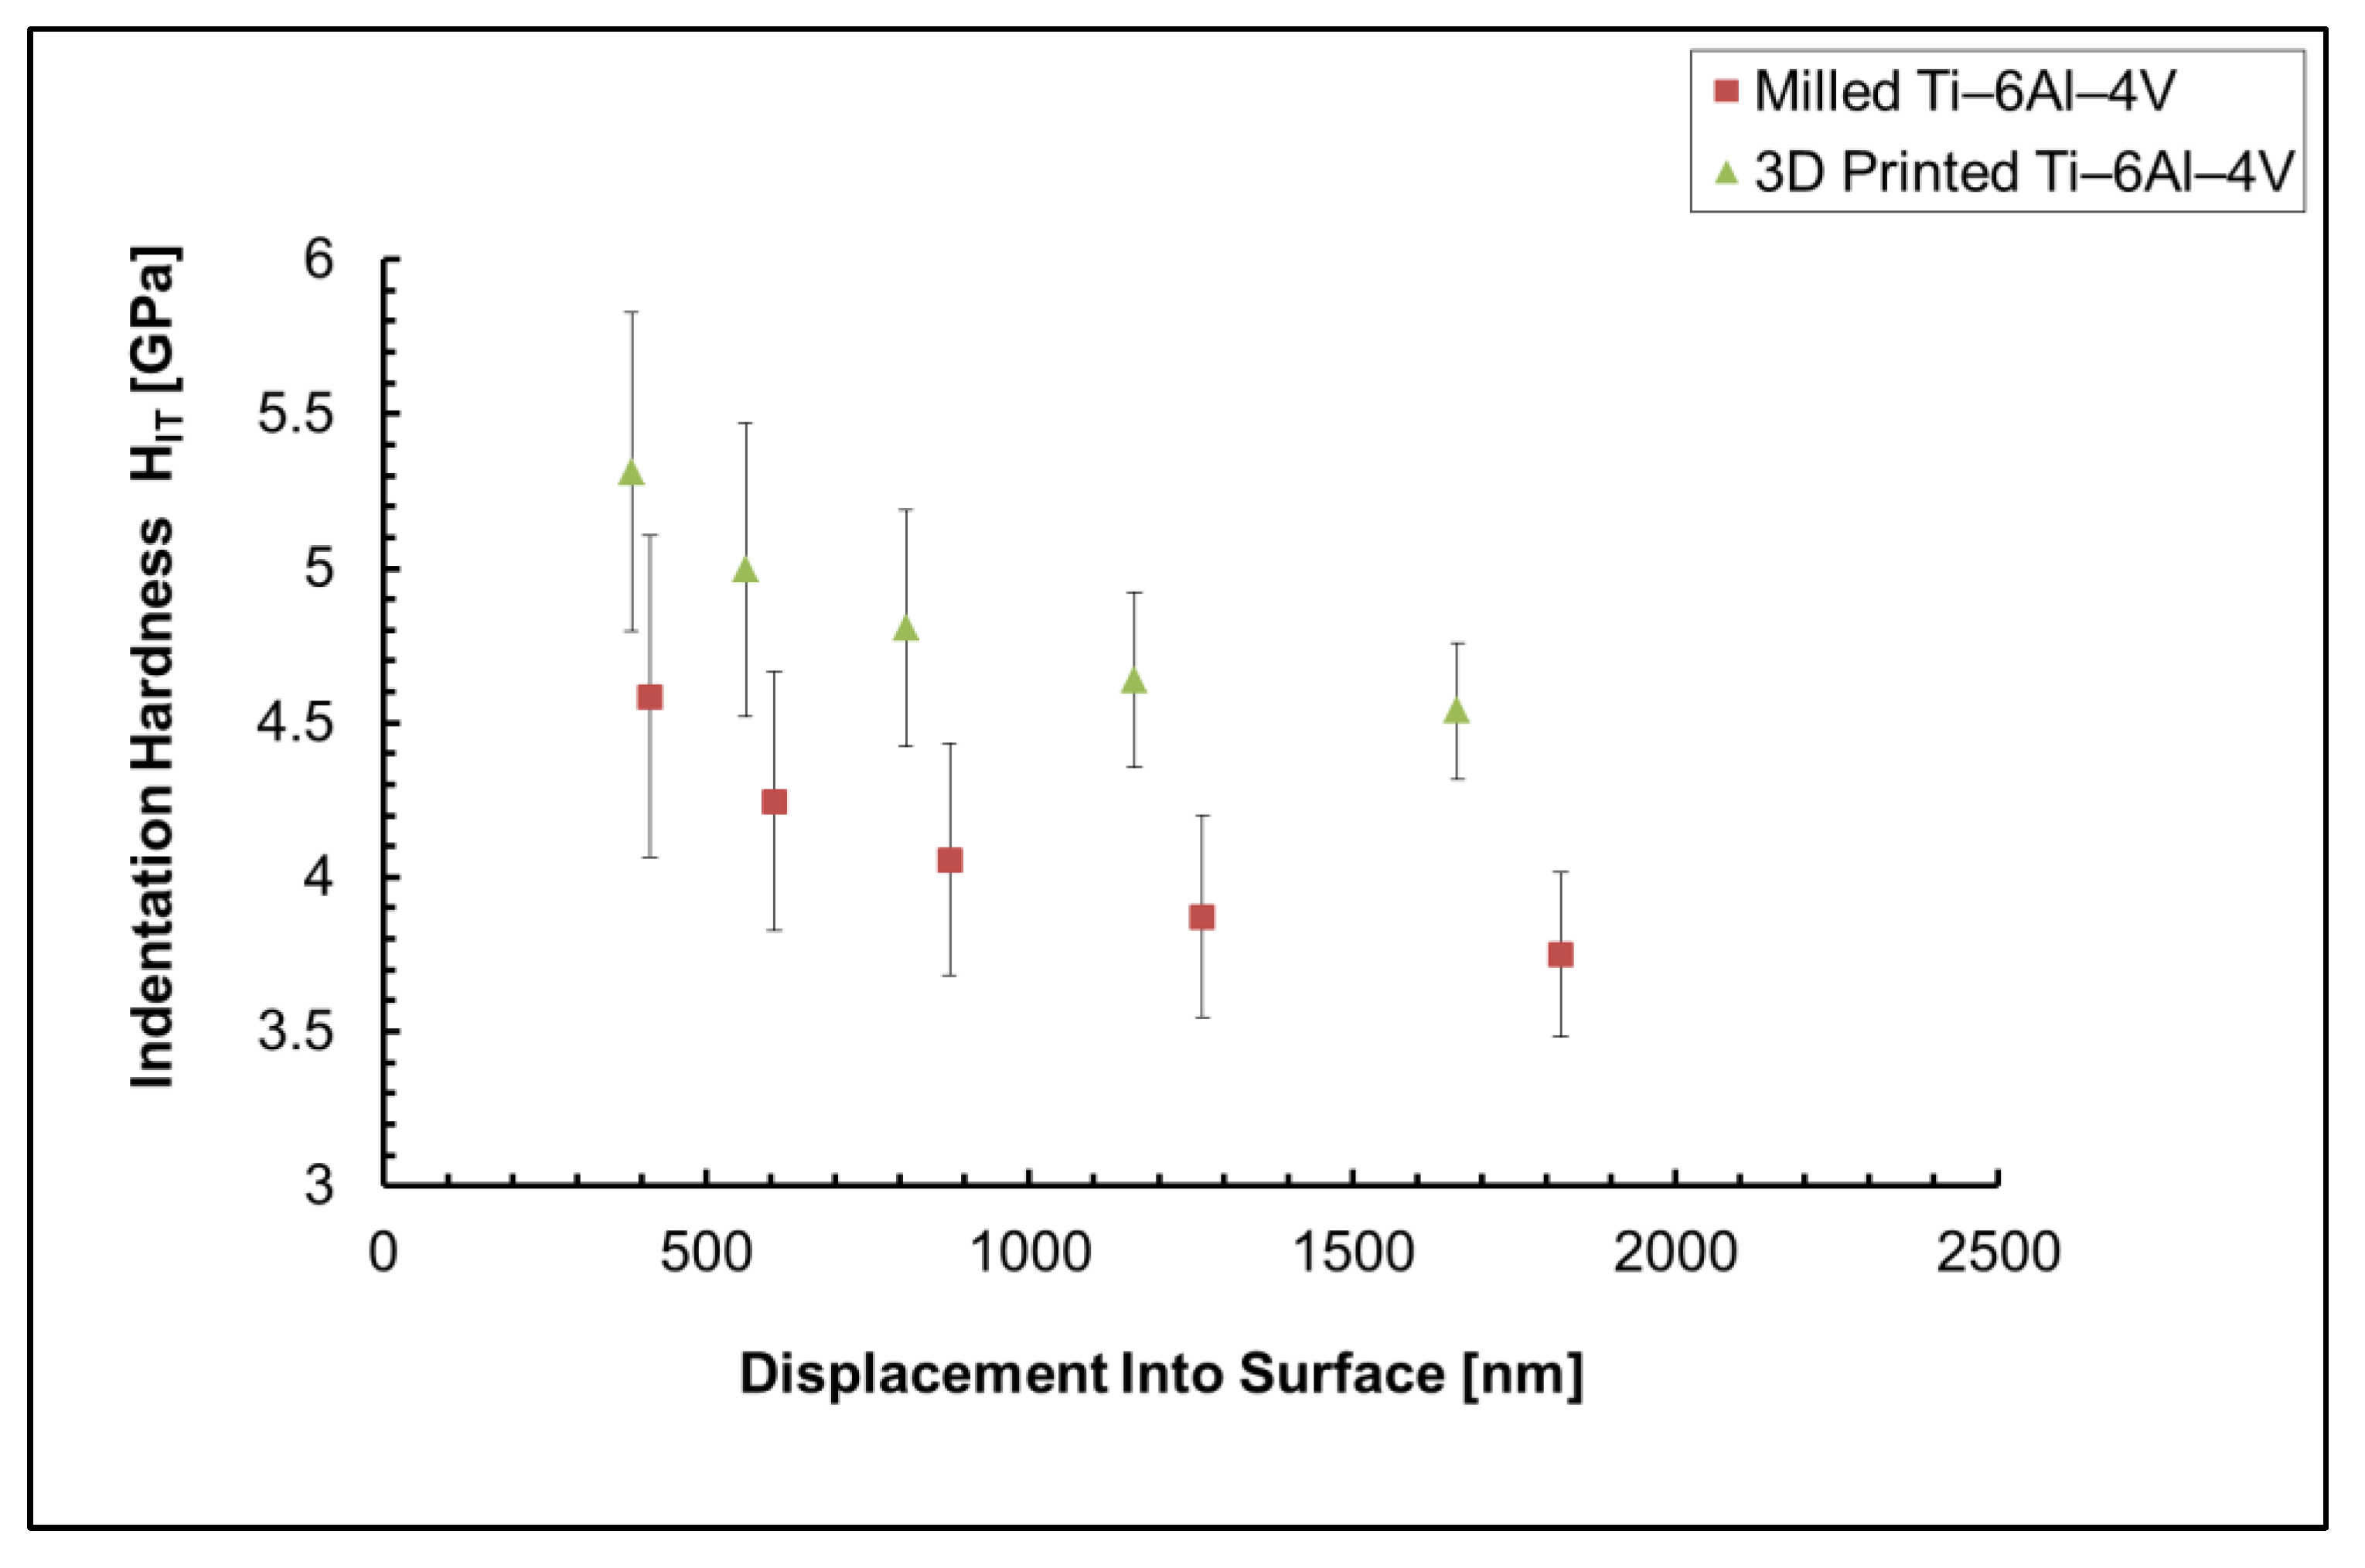
3.3. Nanoindentation Results
Load–displacement curves (
Figure 8) were obtained as a result of nanoindentation experiments, and the mechanical properties of milled and 3D-printed Ti-6Al-4V samples were calculated using the Oliver & Pharr approximation method [
30]. The comparison of indentation hardness H
IT and indentation modulus E
IT obtained by two production methods of titanium alloys is shown on
Figure 9 and
Figure 10. The changes in indentation hardness and indentation modulus with depth of indentation were investigated as well using the cycling indentation method with five loading–unloading cycles.
3.4. Tensile Test Results
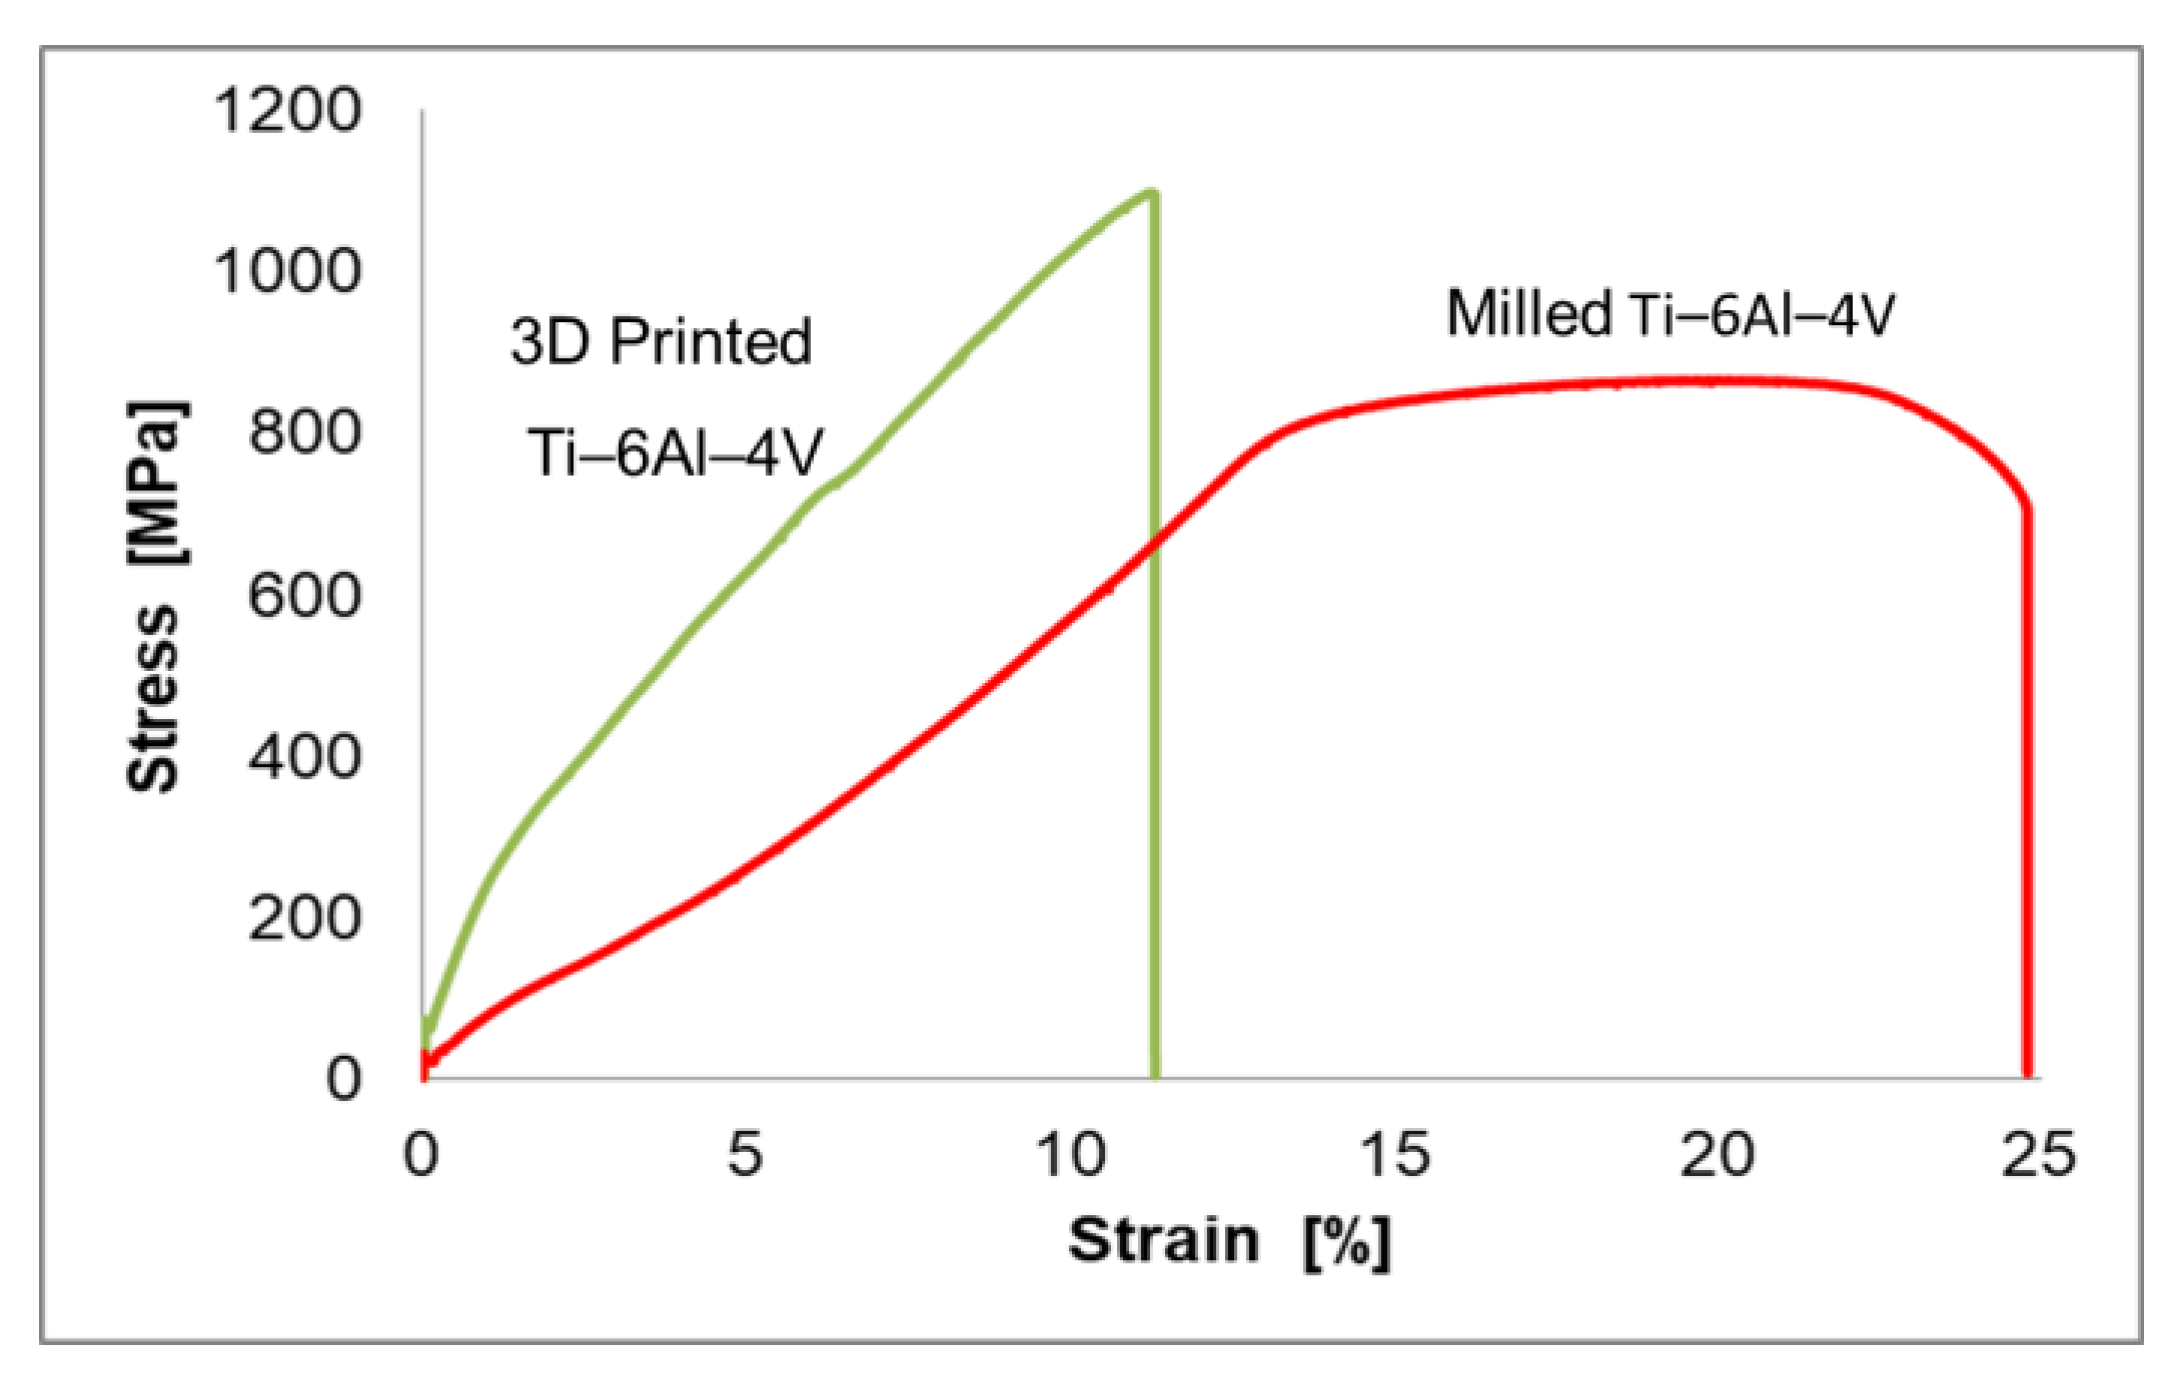
The stress–strain curves from the tensile test in
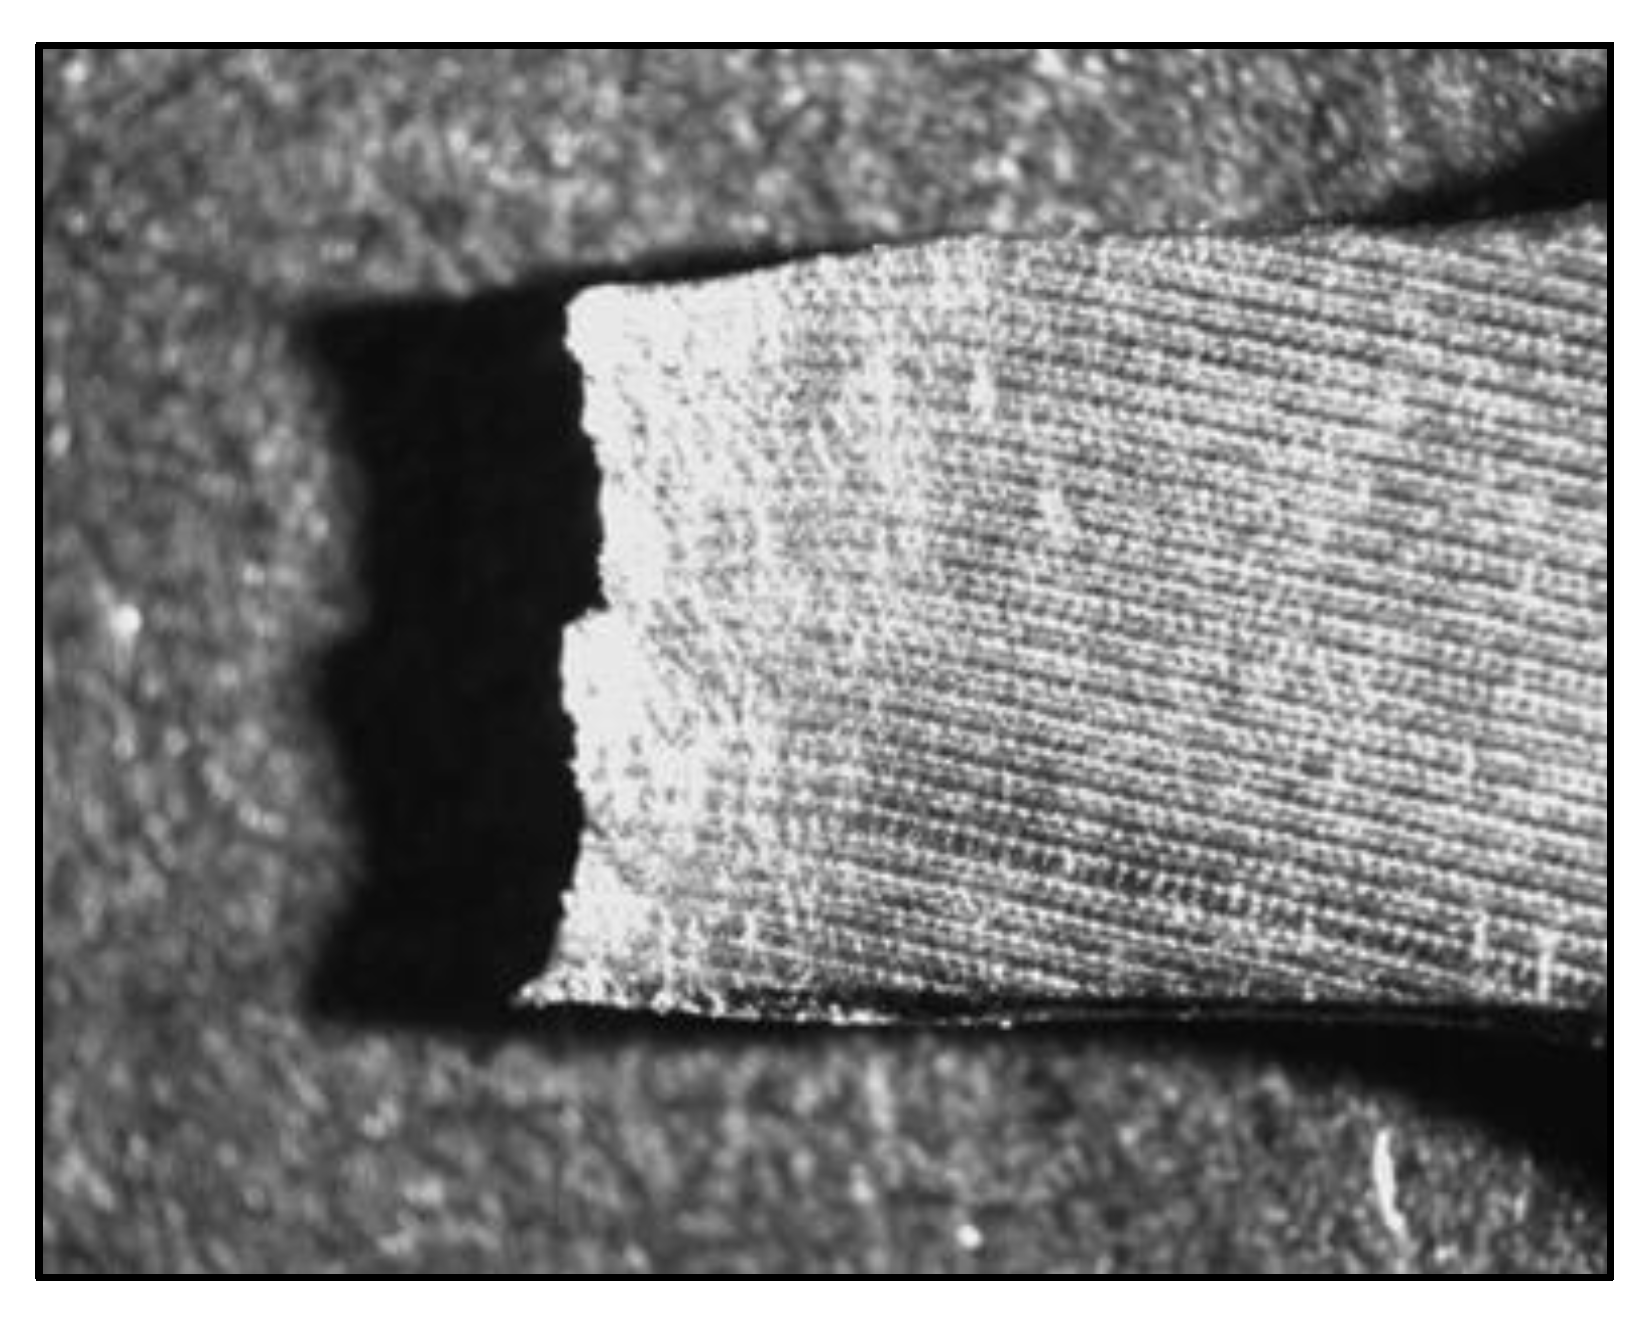
Figure 11 show significant differences in the behavior of the studied materials. The curves were calculated and constructed from the immediate data of the machine strain gauge cell. A series of microscopic photographs was taken with a Leica S-6 optical microscope (Leica Mikrosysteme Vertrieb GmbH, Wetzlar, Germany) of the areas with maximum tensile stresses or the fracture profiles (
Figure 12 and
Figure 13) of the specimens in order to see their destruction in more detail. A close look at an area close to the fracture site (
Figure 12) clearly highlights the disruption of the characteristic surface pattern by machining. This is an unequivocal sign of the plastic deformation of the material. It is expressed in a visible loss of surface flatness and a reduction in cross-sectional area due to the necking process. From a mechanical point of view, this is the occurrence of significant deformation with negligible stress variation, as confirmed by the curve for milled Ti-6Al-4V in
Figure 8 in the interval 13–22% of relative deformation.
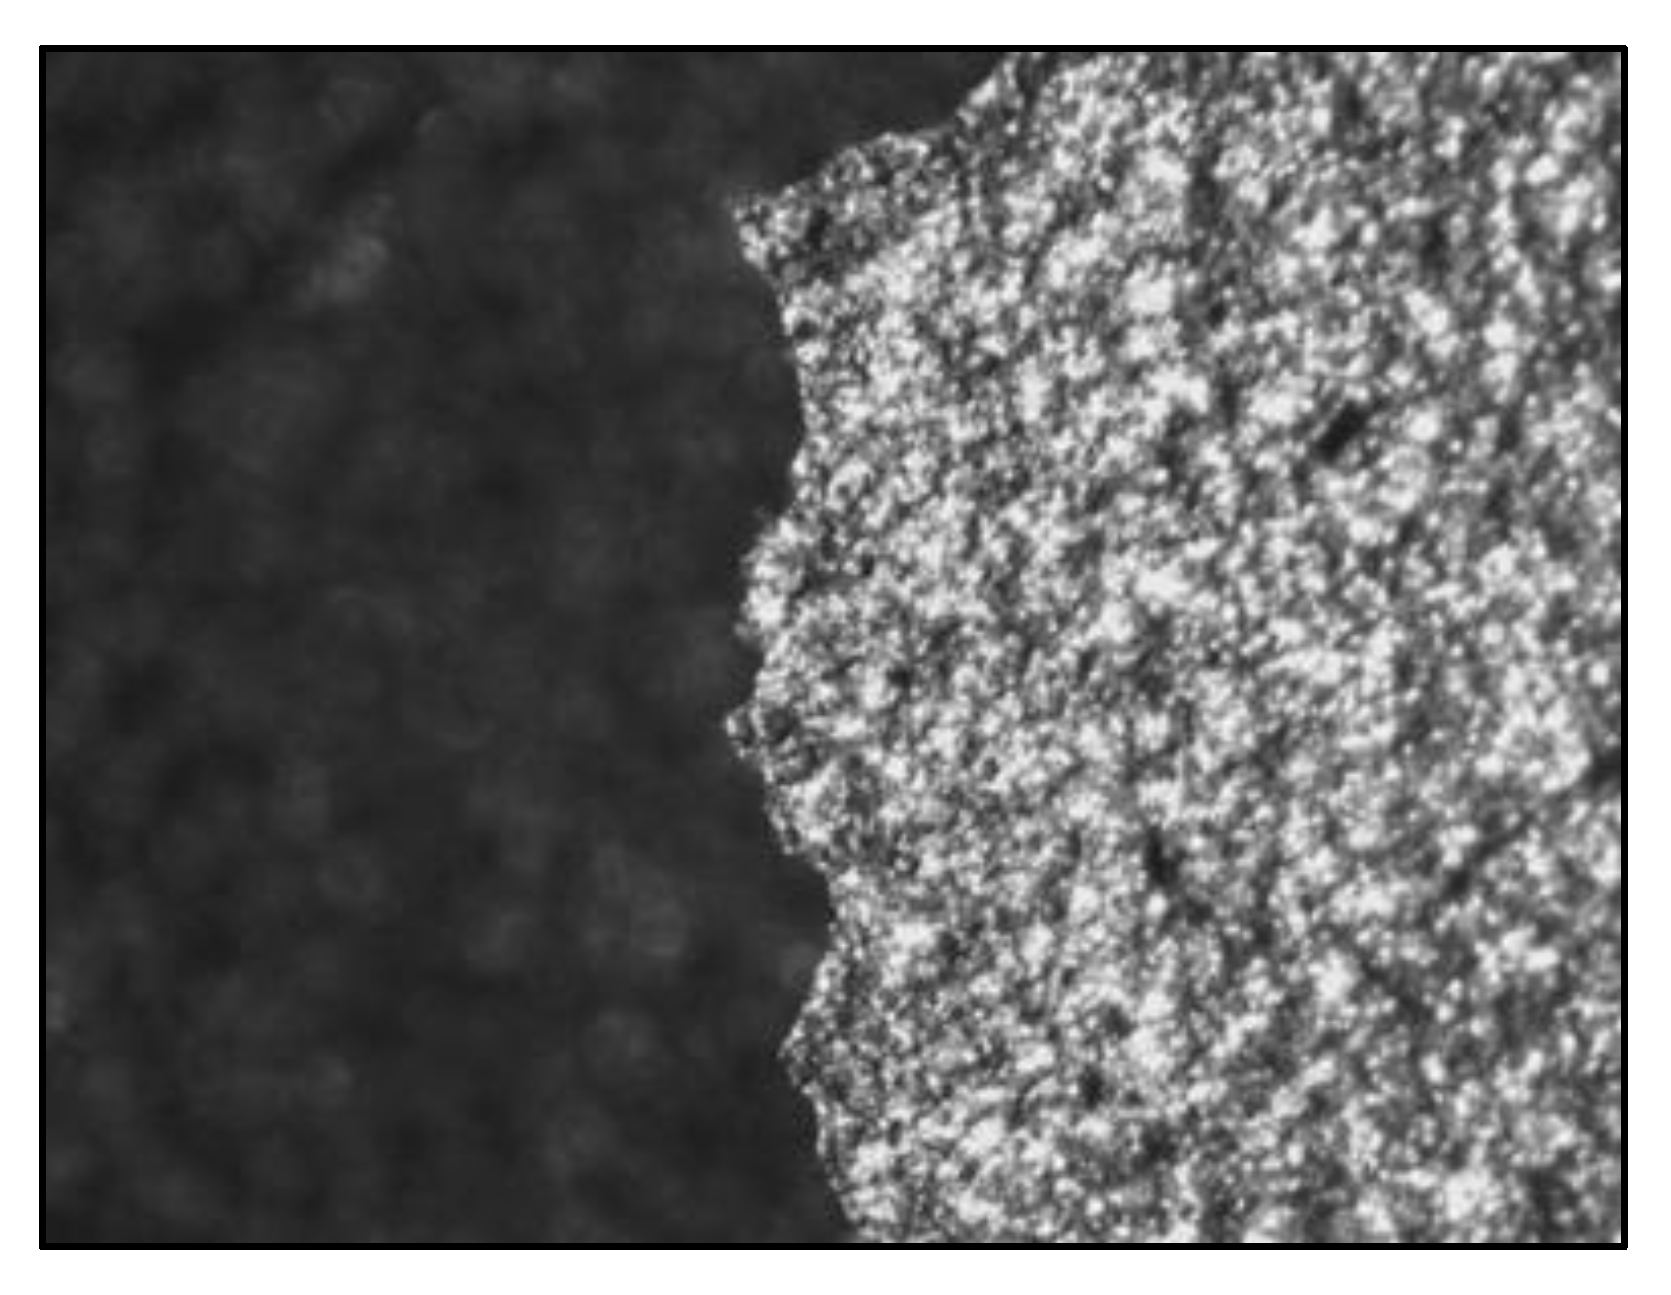
The fracture profile of the material processed by the SLM technology looks completely different (
Figure 13). It can be seen from
Figure 10 that the 3D-printed titanium sample does not have such a large flow of plastic deformation. This can explain the characteristic profile of the fracture shown in
Figure 13. The comparison of the fracture profile in
Figure 13 with that in
Figure 12 shows a transitivity of effects from ductile to brittle failure. This trend in the qualities of the materials is also confirmed by the types of curves in
Figure 12. An additional feature of the observed areas in
Figure 3 compared to the object in
Figure 12 is also the lack of undulation of the surface, which is characteristic in cases of significant creep of the metal polycrystalline grains.
The obtained, by means of a tensile test, mechanical properties of the investigated titanium alloys are summarized in
Table 3. The color marking of the types of material is for the sake of an easier comparison with the curves in
Figure 11. The relative elongation (%) indicated in the table refers to the moment of the maximum strength value reached and not to the moment of failure of the test specimen.
3.5. Bending Test Results
A bending test by its physical nature involves both tensile and compressive loading. This is a common case in dental medical practice, which justifies the research of materials and constructions based on this method. The outcomes of such tests on the aforementioned materials are summarized in
Figure 14.
Figure 14 shows that the load–displacement curves for 3D-printed and milled samples have different slopes up to about 0.5 mm of displacement. However, in the initial section, the angular dependence coefficient is analogous to that observed after about 0.5 mm sag of the specimen, which is taken as the region of linear development of the force–displacement curve. From the curves in
Figure 14, it is also seen that the milled Ti specimens have a larger plastic strain region than the 3D printed ones. After the load was stopped (at a sag of ~4.9 mm), the 3D-printed Ti specimens showed cracks in the region of maximum tensile stresses.
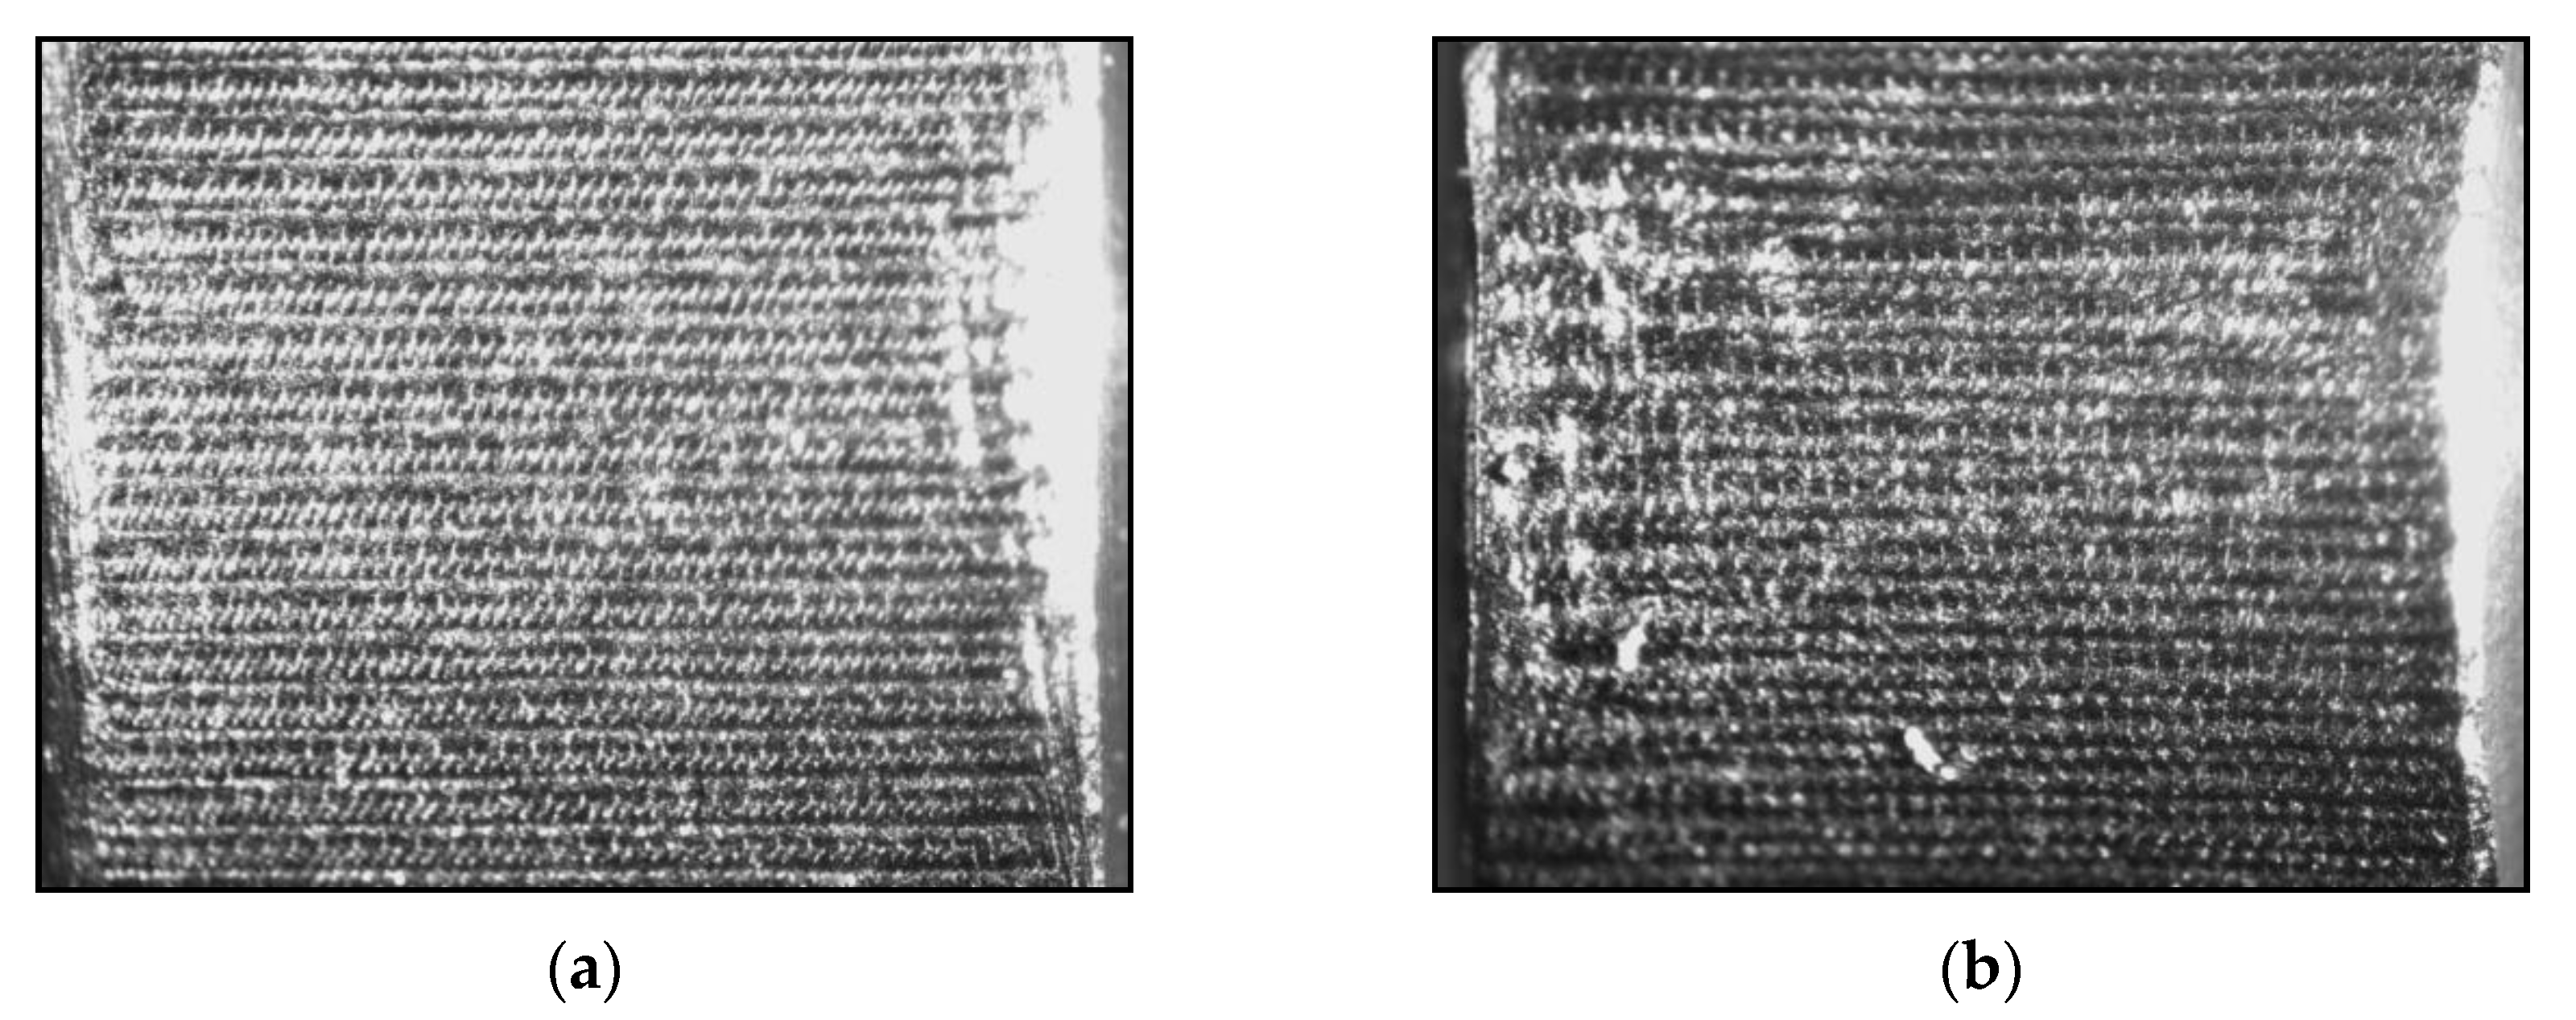
Confirmation of the assumption about the different ability of the studied materials to develop plastic deformation can be seen in the pictures from the optical microscope in
Figure 15 and
Figure 16. Those areas of the test specimens that have sustained the greatest tensile stress are shown there. An additional possibility was to check for the existence of a possible influence of the different strain rates. Upon careful comparison of the two pictures (a,b) in
Figure 15, a violation of the specific texture of the surface of the object in
Figure 15b can be noticed. This is due to the creep effect of the material, the analogue of which was observed in
Figure 12. It is important to note that the strain rate did not lead to the appearance of visible cracks.
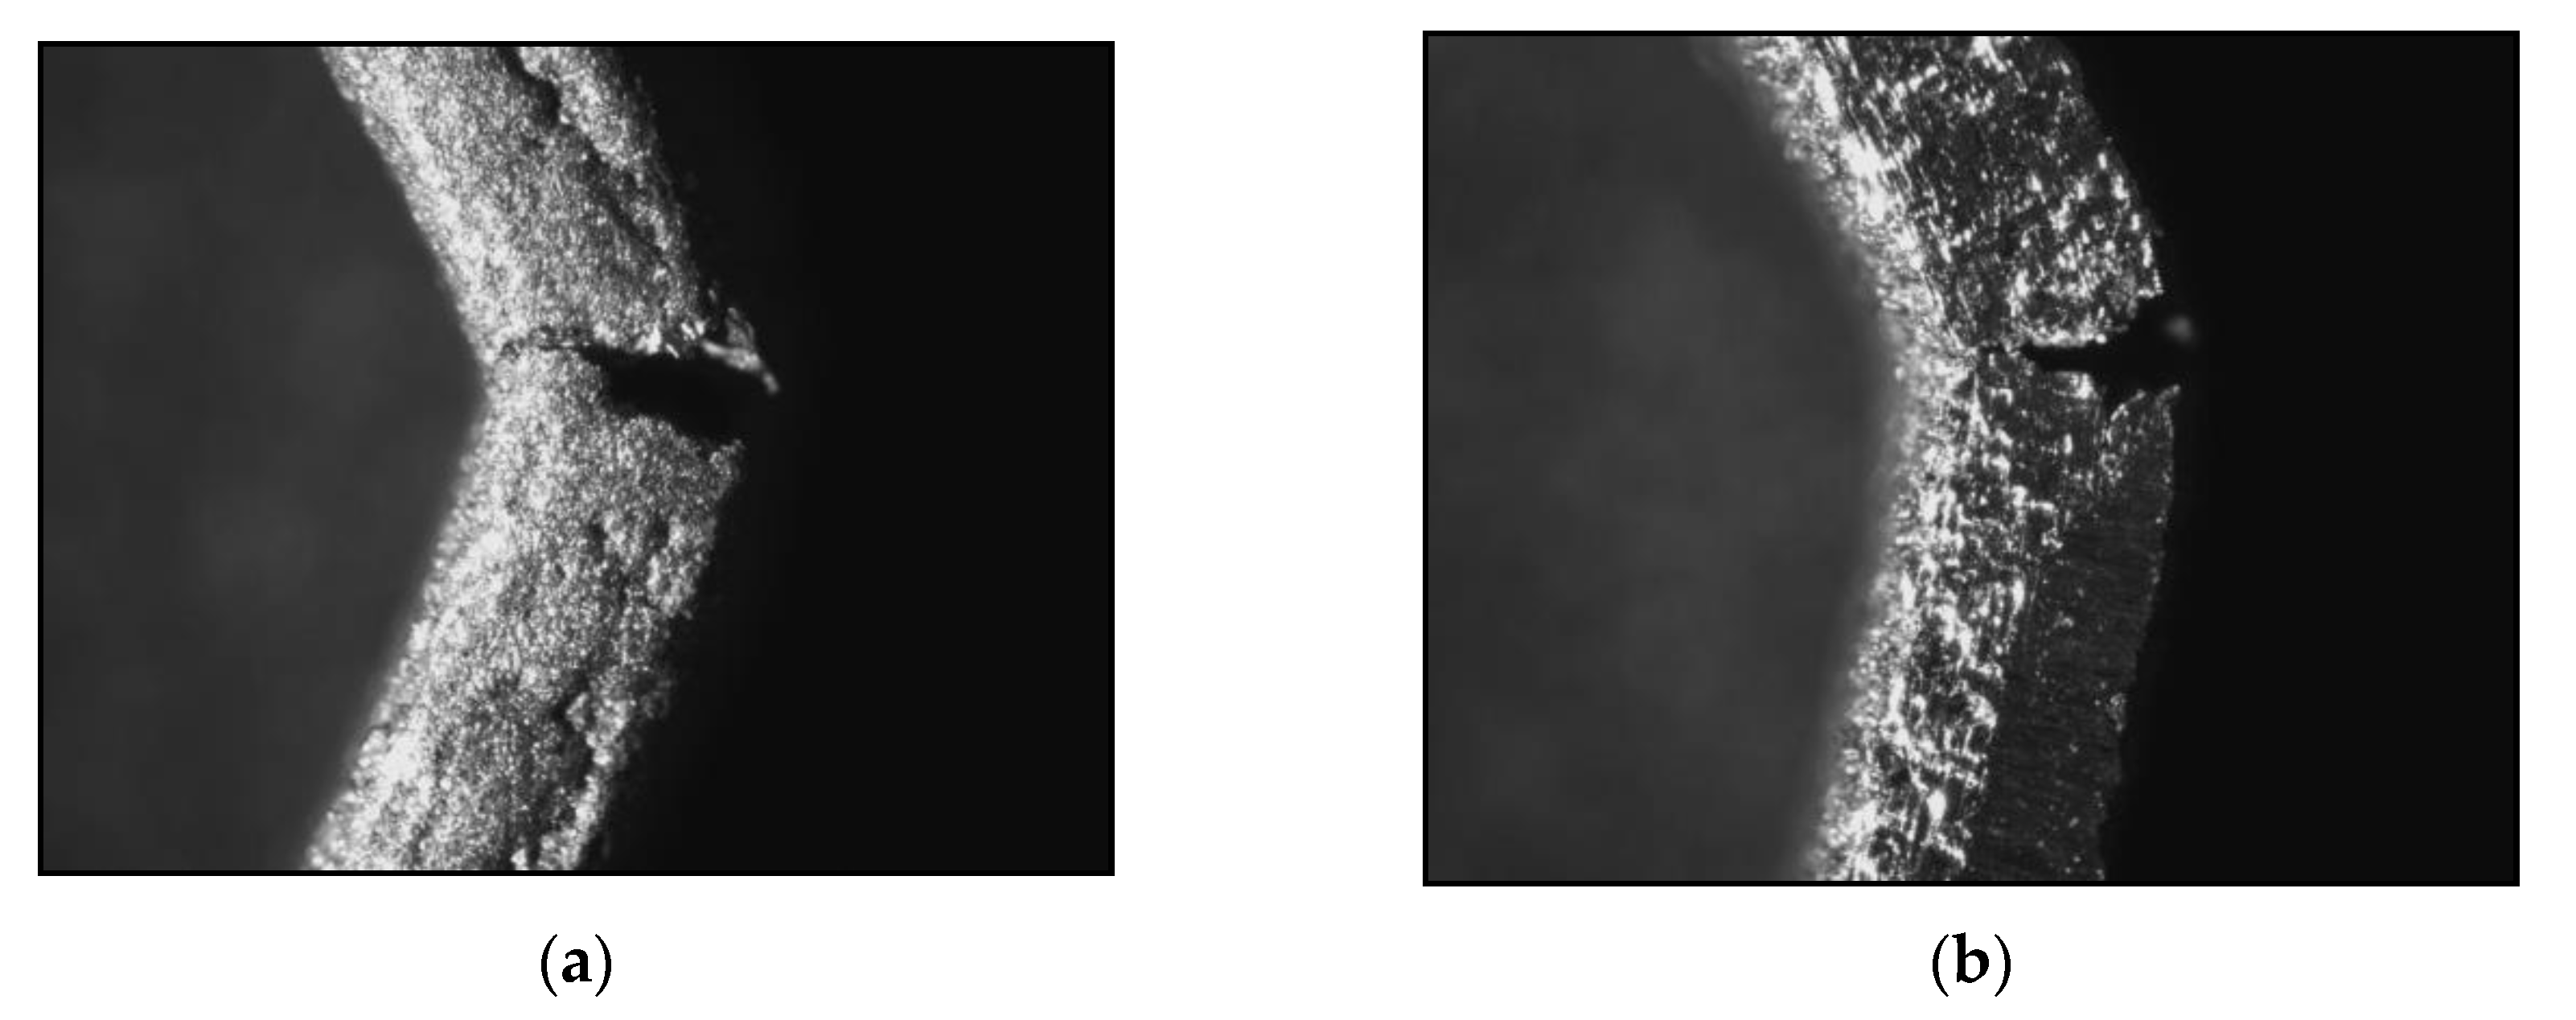
The result of the same deformation impact on the 3D-printed Ti-6Al-4V test specimens is significantly different. In order to better highlight the difference caused by the loading speed, the side view of the test specimens was chosen (
Figure 16).
In contrast to the mechanical processing of the surfaces, with the “SLM” technology, surfaces with a granular structure are obtained. In this sense, the natural lack of sufficient smoothness of the walls of the test specimens does not allow the sharp distinction of the edge from the adjacent walls of the specimen. This is the reason for the questionable accuracy when measuring the depth of the formed crack. A consequence of this is the impossibility of assessing the degree of influence of the loading rate. It is important to note that at the same degree of deformation, we observe consecutive plastic deformation processes and, subsequently, the appearance of a crack. Because of the degree of deformation realized, no moment of final separation of the specimen into two parts was reached, regardless of the bending speed. The results of the three-point bending test are summarized in
Table 4. The sample with second indices “2” was tested at an indenter displacement speed of 60 mm/min.
3.6. AFM Results
The topography and surface roughness of the samples were investigated using an atomic force microscope. AFM’s high-resolution imaging capability enables the precise location of indentation positions and their depth measurement [
31]. The applied roughness analysis of each AFM image uses R
a, R
q, and R
max values calculated according to the relative heights of each pixel of the topography of the studied sample [
32].
The roughness analysis gives the value R
a which is the arithmetic mean of the absolute values Z
j of the surface height deviations measured from the mean plane
while R
q is the root-mean-square value of the height deviations taken from the plane of the average image data [
28].
The AFM images of milled and 3D-printed Ti-6Al-4V samples were compared and presented in
Figure 17. The morphology of the milled Ti-6Al-4V sample with a scanning area of 10 × 10 μm
2 (
Figure 17a) reveals a rougher surface in comparison with the morphology of the 3D-printed Ti-6Al-4V sample with the same scan area (
Figure 17b), which is smoother with a homogeneous structure. The measured roughness of the milled Ti-6Al-4V sample for R
q is 15.2 nm, and for the value of R
a it is 12.0 nm. On the other hand, the roughness of the 3D-printed Ti-6Al-4V sample for R
q is 10.9 nm, and for the value of R
a it is 8.65 nm, respectively.
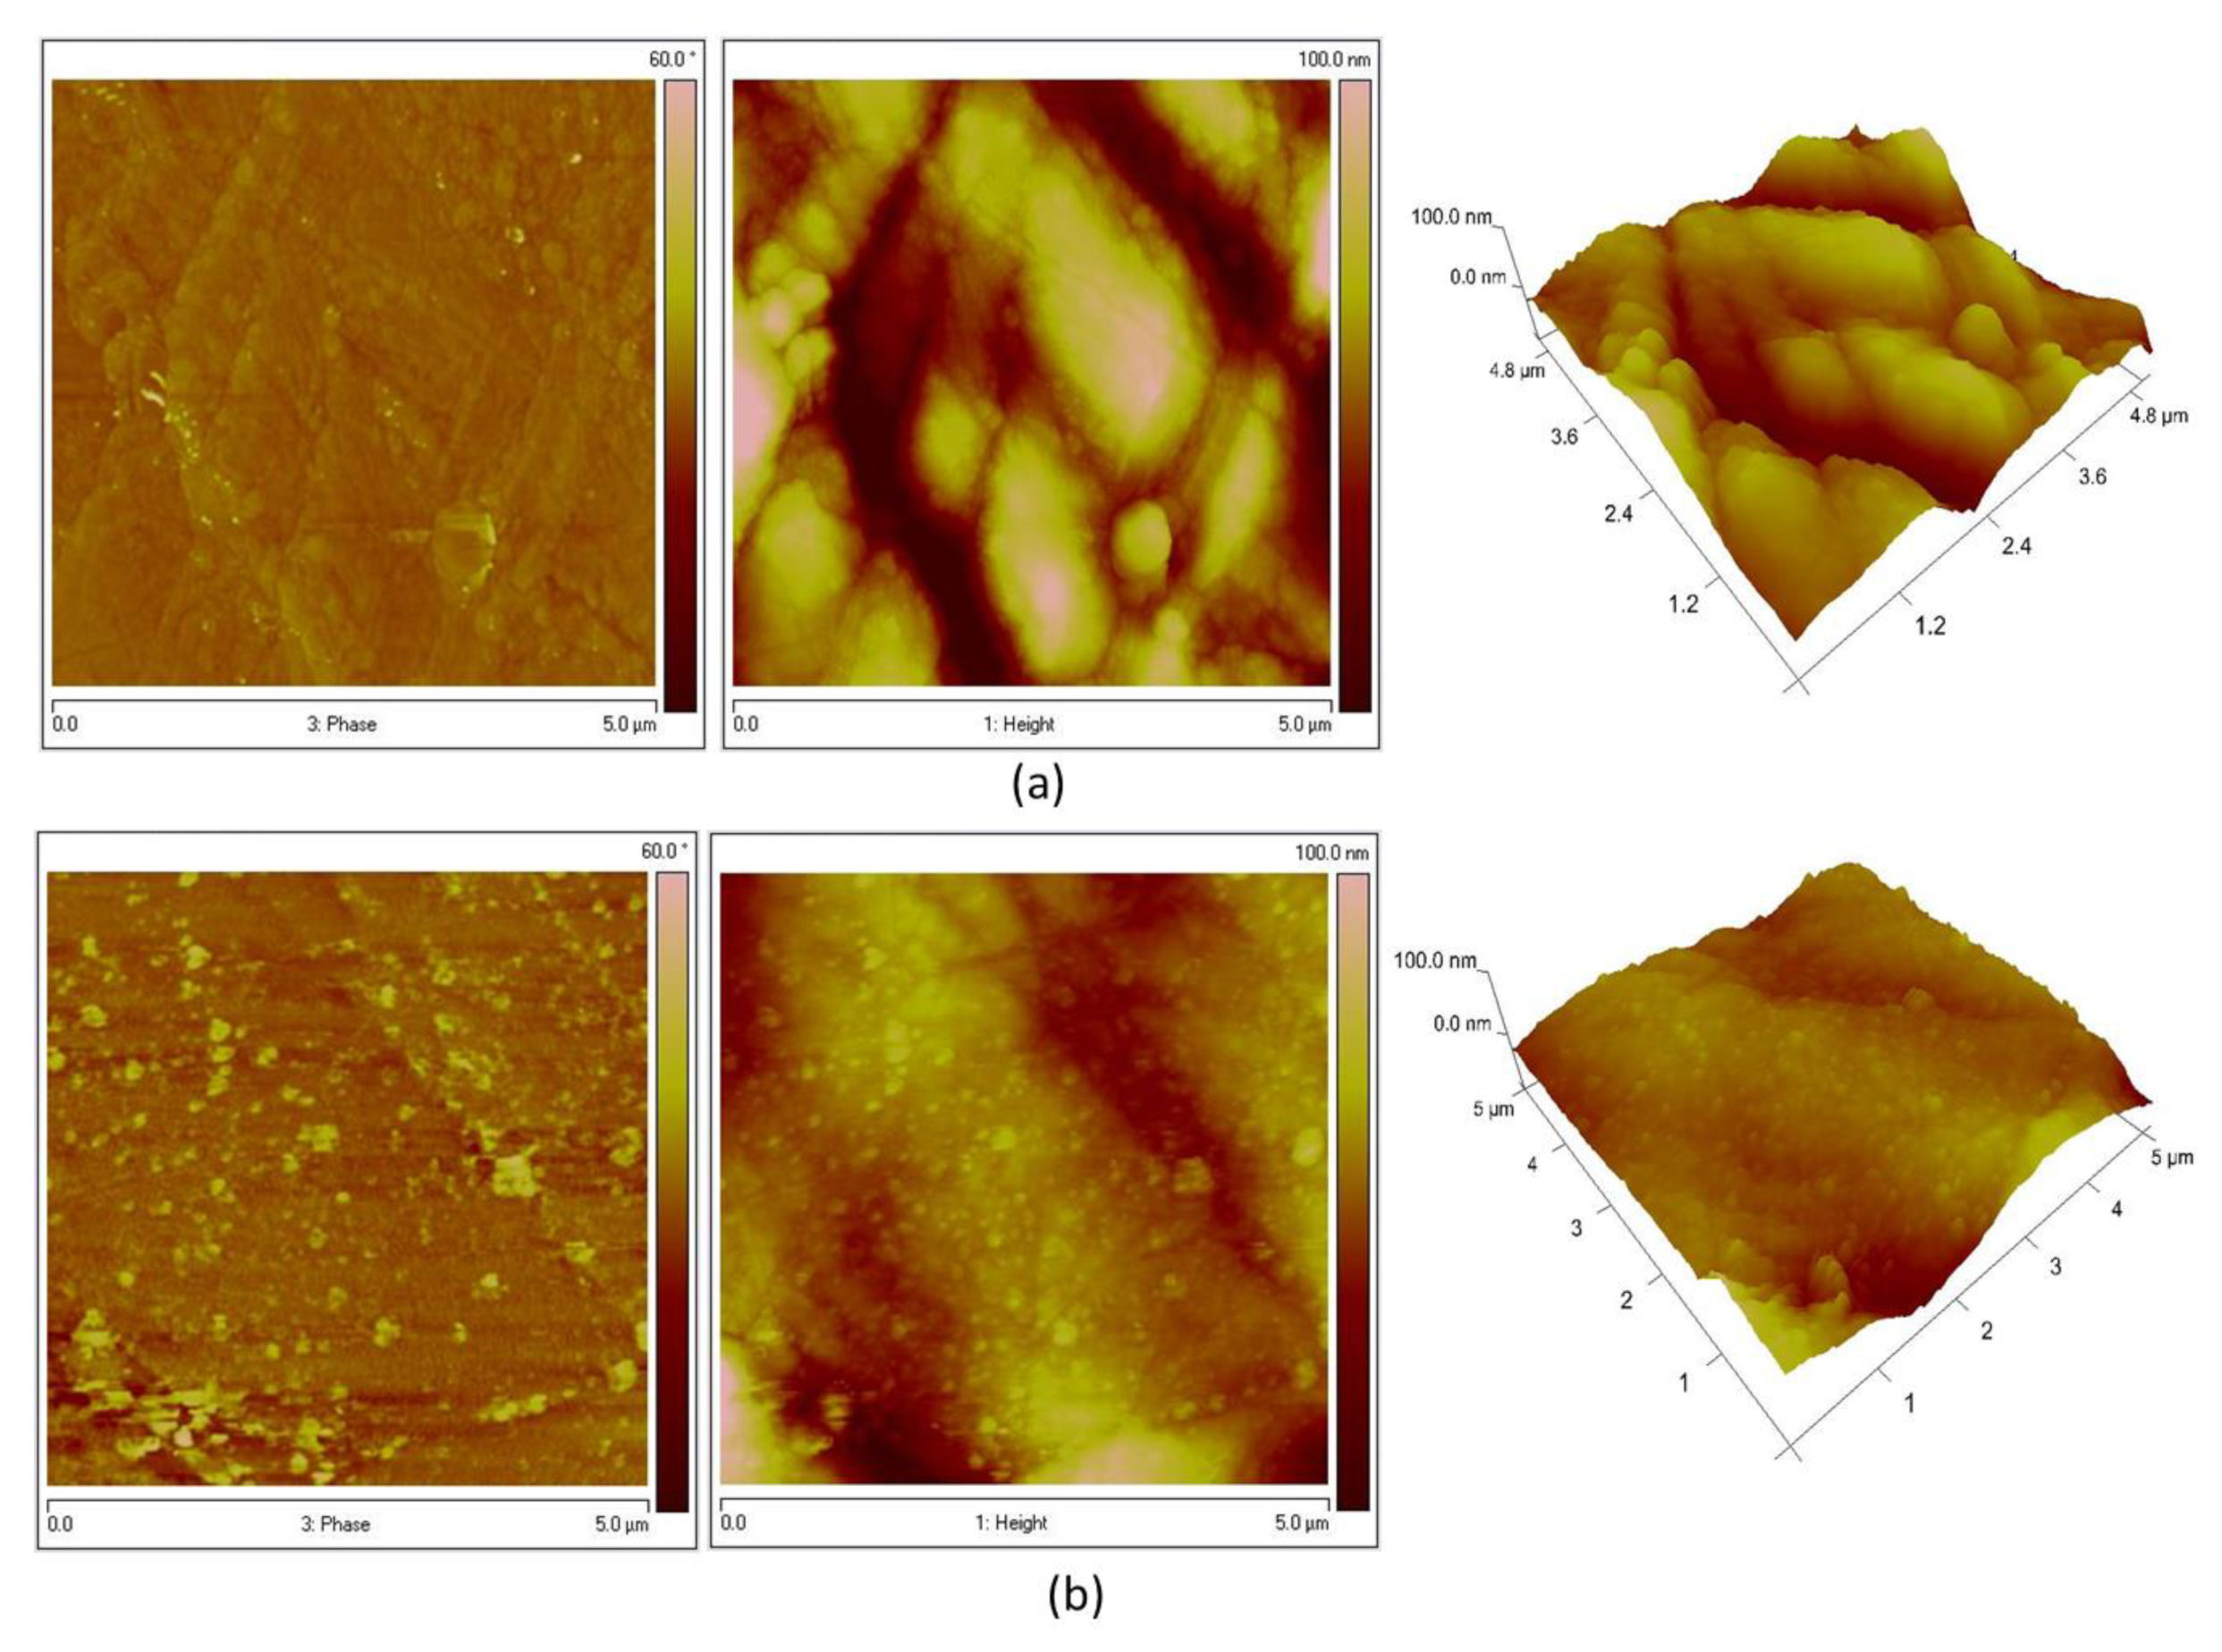
For a better evaluation of the morphology of the two samples, 2D and 3D images of milled Ti-6Al-4V and 3D-printed Ti-6Al-4V samples were compared with a scanning area of 5 × 5 μm
2 (
Figure 18). The images show that the 3D-printed Ti-6Al-4V sample has a smooth surface with the presence of small nanometric spheres. The diameter of these spheres is from 10 nm to 25 nm. The milled Ti-6Al-4V sample, on the other hand, has a rough surface with larger and smaller clusters.
3.7. Statistical Comparisons
In the 3D-printed Ti-6Al-4V sample, the indentation modulus individual values ranged from 138.69 GPa to 153.87 GPa, and in the milled Ti-6Al-4V sample, the range spanned from 128.02 GPa to 155.22 GPa. The mean value was 3.97 GPa higher in the 3D-printed Ti-6Al-4V sample than in the milled Ti-6Al-4V sample, with a statistically significant difference (p = 0.009).
The individual indentation hardness varied from 4.12 GPa to 4.85 GPa in the 3D-printed Ti-6Al-4V specimens and from 3.21 GPa to 4.42 GPa in the milled Ti-6Al-4V specimens. The mean indentation hardness was 0.79 GPa higher in the 3D-printed Ti-6Al-4V sample as compared to the milled Ti-6Al-4V sample,
p < 0.001 (
Table 5).
4. Discussion
The XRD investigation showed that in the 3D-printed titanium sample, two phases were found, namely aluminum titanate (Al0.15Ti0.85) and less aluminum titanate vanadate (Ti2VAl). The established hexagonal phase of Al0.15Ti0.85 has a crystallite size of 77 nm, and the cubic phase of Ti2VAl has a crystallite size of 18.5 nm. The diffractogram of a milled titanium sample showed two phases: mainly aluminum titanate (Al0.15Ti0.85) and less titanium vanadate (Ti0.8V0.2). A hexagonal phase of Al0.15Ti0.85 with crystallite sizes of 106 nm and a cubic phase of Ti0.8V0.2 with crystallite sizes of 22.8 nm were found.
The nanoindentation experiments revealed significant differences in the indentation modulus and indentation hardness between the 3D-printed Ti-6Al-4V specimens and the milled Ti-6Al-4V specimens. Both parameters had higher values in the 3D-printed Ti-6Al-4V sample. One reason for this result is that the 3D-printed Ti-6Al-4V sample had smaller crystallite sizes than the milled one. The same tendency was obtained for the Young’s modulus of both samples, obtained by means of the tensile test (
Table 3), but the values were smaller than those of the indentation modulus. This is because the indentation modulus is calculated in some sample volume, while the Young’s modulus is calculated in some direction [
33]. The obtained results for the indentation hardness are in agreement with those obtained by Peng [
34]. The obtained from us mechanical properties are in good agreement also with these obtained from Liovic [
35], Song [
36], and Ding [
37]. We obtained higher mechanical properties than Dikova [
38], but probably the reason is that we used different processing parameters. Moreover, she used a higher temperature of annealing heating and a different indentation method.
We found that as indentation depth increased, the indentation hardness and modulus of both titanium alloys decreased slightly. The reason for different properties in the depth could be the layer-by-layer production method with several cycles of heating and cooling, which leads to structure changes in the depth, respectively, and changes in the mechanical properties.
The slightly higher concentration of titanium in the composition of the 3D-printed sample, as well as the slightly lower concentration of aluminum, could be another reason for the higher indentation hardness obtained with the 3D-printed titanium sample. Nanoindentation is a method which determines the local mechanical properties at a point on the surface of the material, but the investigated samples have non-uniform surfaces, which can lead to higher experimental error when measuring the indentation hardness and indentation modulus.
The results from the tensile test showed that the 3D-printed sample made by means of selective laser melting (SLM) technology had about 26% higher tensile strength and smaller elongation than the milled one. The same tendency for yield strength and elongation was obtained by Karolewska and Ligaj [
39].
The results from the three-point bending test showed that the 3D-printed Ti-6Al-4V sample had higher flexural strength than the milled one. Two different strain rates (1 mm/min and 60 mm/min) were used, and their influence on the obtained flexural strength was investigated as well. The strength achieved at different loading rates may be a function of the manufacturing method of the test specimens. For the milled Ti-6Al-4V specimens, increasing speed causes a proportional increase in the recorded strength of ~4.9%.
As the roughness of the sample surface can have an influence on the nanoindentation results, AFM was used to study the surface topography and roughness of both titanium alloys. The AFM observation of the surface topography of the investigated samples showed that the milled Ti-6Al-4V sample was characterized by a higher roughness than the 3D printed one.
Based on the specifics of the production process, additive methods have some advantages over subtractive methods. They are mainly related to increase the possibilities of making constructions with complex and irregular geometric shapes, such as most of those used in dentistry. The other main advantage is that with this method there is significantly less material consumption, which is essential when dealing with expensive raw materials. But, when it comes to making medical products, the leading factor in material and technology selection is the qualities of the final product. From this point of view, based on our research, we believe that for the purposes of making orthodontic retainers, the more appropriate method is subtractive manufacturing. The main reason for this is that the samples made by this method have a lower indentation hardness, which correlates with the biological requirements for the retainer. The better surface characteristics of 3D-printed Ti are not essential since after the additive manufacturing process of the retainer it is subjected to secondary machining.
5. Conclusions
The structure, morphology, and mechanical properties of two titanium alloys, produced by two different methods (milled and 3D printed by means of selective laser melting), were investigated and compared. A tensile test, a three-point bending test, nanoindentation, and atomic force microscopy were used for determination of the mechanical properties and surface roughness of the investigated titanium alloys. The results showed that the 3D-printed Ti-6Al-4V sample has a higher indentation hardness, indentation modulus, tensile strength, flexural strength, and smaller roughness than the milled one.
The structure and morphology of the samples were investigated by means of SEM and XRD. A significant difference in the size of the crystallites of the Al
0.15Ti
0.85 main phase was observed; in the milled titanium sample, the crystallites were 37% larger than the crystallites of the printed titanium sample. For the secondary phases, approximately 20% larger crystallites were observed in the milled titanium sample. According to the Hall–Petch relationship [
40], the smaller crystallite size of the 3D-printed sample could be one of the reasons for its higher indentation hardness.
From a clinical perspective, the higher modulus of elasticity as well as tensile and flexural strengths of printed titanium make it suitable for the fabrication of larger prosthetic structures, especially implant-supported ones. Its smoother surface is an advantage when polishing, especially on areas in contact with soft tissues.
When the Ti-6Al-4V alloy is used to make orthodontic retainers, milled titanium is more suitable. It has a lower indentation hardness and indentation modulus, which would allow, with the same parameters as printed Ti, greater individual tooth mobility in the retention period of teeth fixed with a retainer. Its rougher surface is a disadvantage that can be removed with subsequent processing of the metal.
Although extensive research was conducted using six types of experiments and statistical analyses, bearing in mind that some authors observed large residual stresses in the SLM-induced samples, we plan to conduct numerical simulations using the finite element method of the nanoindentation process in the future. Furthermore, in the future it would be useful to investigate the relaxation curve and strain relaxation of these materials, which were not the subject of the present study.
Author Contributions
Conceptualization, V.P. (Vladimir Petrunov); methodology, S.C. and V.P. (Vladimir Petrunov); formal analysis, S.C. and V.P. (Vladimir Petrunov); investigation, S.C., V.P. (Vladimir Petkov), V.B. and S.S.; resources, V.P. (Vladimir Petrunov); data curation, V.B.; writing—original draft preparation, S.C.; writing—review and editing, V.P. (Vladimir Petrunov); visualization, S.S., V.B. and V.P. (Vladimir Petkov); supervision, S.C. and V.P. (Vladimir Petrunov); project administration, S.C.; funding acquisition, S.C. All authors have read and agreed to the published version of the manuscript.
Funding
This work was supported by the European Regional Development Fund within the OP “Science and Education for Smart Growth 2014–2020”, Project CoE “National Center of Mechatronics and Clean Technologies“, № BG05M2OP001-1.001-0008-C01.
Institutional Review Board Statement
Not applicable.
Informed Consent Statement
Not applicable.
Data Availability Statement
The data presented in this study are available on request from the corresponding author.
Conflicts of Interest
The authors declare no conflict of interest.
References
- Alghazzawi, T.F. Advancements in CAD/CAM technology: Options for practical implementation. J. Prosthodont. Res. 2016, 60, 72–84. [Google Scholar] [CrossRef]
- Arnold, C.; Hey, J.; Schweyen, R.; Setz, J.M. Accuracy of CAD/CAM fabricated removable partial dentures. J. Prosthet. Dent. 2018, 119, 586–590. [Google Scholar] [CrossRef]
- Shannon, T.; Groth, C. Be your own manufacturer: 3D printing intraoral appliances. Semin. Orthod. 2021, 27, 184–188. [Google Scholar] [CrossRef]
- Alshhrani, W.; Al Amri, M. Customized CAD/CAM healing abutment for delayed loaded implants. J. Prosthet. Dent. 2016, 116, 176–179. [Google Scholar] [CrossRef]
- Skjerven, H.; Riis, U.; Herlofsson, B.; Ellingsen, J. In vivo accuracy of implant placement using a full digital planning modality and stereolithographic guides. Int. J. Oral Maxillofac. Implant. 2019, 34, 124–132. [Google Scholar] [CrossRef]
- Sriram, S.; Shankari, V.; Chacko, Y. Computer Aided Designing/Computer Aided Manufacturing in Dentistry (CAD/CAM)—A Review. Int. J. Curr. Res. Rev. 2018, 10, 21–24. [Google Scholar]
- Ortorp, A.; Jonsson, D.; Mouhsen, A.; Vult von Steyern, P. The fit of cobalt-chromium three-unit fixed dental prostheses fabricated with four different techniques: A comparative in vitro study. Dent. Mat. 2011, 27, 356–363. [Google Scholar] [CrossRef]
- Abele, E.; Frohlich, B. High speed milling of titanium alloys. Adv. Prod. Eng. Manag. 2008, 3, 131–140. [Google Scholar]
- ISO/ASTM 52900:2015 (ASTM F2792); Additive Manufacturing—General Principles and Terminology. ISO: Geneva, Switzerland, 2015.
- Atzeni, E.; Salmi, A. Economics of additive manufacturing for end-usable metal parts. Int. J. Adv. Manuf. Technol. 2012, 62, 1147–1155. [Google Scholar] [CrossRef]
- Martyushev, N.V.; Kozlov, V.N.; Qi, M.; Tynchenko, V.S.; Kononenko, R.V.; Konyukhov, V.Y.; Valuev, D.V. Production of Workpieces from Martensitic Stainless Steel Using Electron-Beam Surfacing and Investigation of Cutting Forces When Milling Workpieces. Materials 2023, 16, 4529. [Google Scholar] [CrossRef] [PubMed]
- Titanium Grades and Relative Properties. Titanium and Titanium Alloy Materials. Available online: https://www.rolledalloys.com/titanium-grades-and-relative-properties/ (accessed on 24 October 2023).
- Ti-6Al-4V Titanium alloy pipe. Available online: https://www.tiscoalloy.com/products/titanium/titanium_alloy_pipe/ti_6ai_av_titanium_alloy_pipe.html (accessed on 24 October 2023).
- Bartolomeu, F.; Gasik, M.; Silva, F.S.; Miranda, G. Mechanical Properties of Ti6Al4V Fabricated by Laser Powder Bed Fusion: A Review Focused on the Processing and Microstructural Parameters Influence on the Final Properties. Metals 2022, 12, 986. [Google Scholar] [CrossRef]
- Zheng, Q.; Mao, L.; Shi, Y.; Fu, W.; Hu, Y. Biocompatibility of Ti-6Al-4V titanium alloy implants with laser microgrooved surfaces. Mater. Technol. 2022, 37, 2039–2048. [Google Scholar] [CrossRef]
- Sidambe, A. Biocompatibility of Advanced Manufactured Titanium Implants—A Review. Materials 2014, 7, 8168–8188. [Google Scholar] [CrossRef] [PubMed]
- Elias, C.; Fernandes, D.; de Souza, F.; Monteiro, E.; de Biasi, R. Mechanical and clinical properties of titanium and titanium-based alloys (Ti G2, Ti G4 cold worked nanostructured and Ti G5) for biomedical applications. J. Mater. Res. Technol. 2019, 8, 1060–1069. [Google Scholar] [CrossRef]
- Nguyen, H.; Pramanik, A.; Basak, A.; Dong, Y.; Prakash, C.; Debnath, S.; Shankar, S.; Jawahir, I.; Dixit, S.; Buddhi, D. A critical review on additive manufacturing of Ti-6Al-4V alloy: Microstructure and mechanical properties. J. Mater. Res. Technol. 2022, 18, 4641–4661. [Google Scholar]
- Sangali, M.; Cremasco, A.; Soyama, J.; Caram, R.; Contieri, R. Selective Laser Melting of Ti-6Al-4V Alloy: Correlation Between Processing Parameters, Microstructure and Corrosion Properties. Mater. Res. 2023, 26, e20230055. [Google Scholar] [CrossRef]
- Luo, Y.; Wang, M.; Zhu, J.; Tu, J.; Jiao, S. Microstructure and Corrosion Resistance of Ti6Al4V Manufactured by Laser Powder Bed Fusion. Metals 2023, 13, 496. [Google Scholar] [CrossRef]
- Repnin, A.; Borisov, E.; Emelianov, A.; Popovich, A. Fracture Toughness of Ti6Al4V/Cp-Ti Multi-Material Produced via Selective Laser Melting. Metals 2023, 13, 1738. [Google Scholar] [CrossRef]
- Zhekov, Y.; Firkova, E.; Kissov, H.; Aleksandrov, S. CAD/CAM fiber-reinforced composite splint for immobilization of periodontally compromised teet. J. IMAB 2022, 28, 4335–4337. [Google Scholar] [CrossRef]
- Powder Range Ti64 datasheet (Carpenter Additive). Available online: https://www.carpenteradditive.com/hubfs/resources/data%20sheets/powderrange_ti64_datasheet.pdf (accessed on 6 October 2023).
- Titan BioStar Grade 5 (Siladent). Available online: https://www.siladent-shop.de/sicherheitsdb_en/128260_titan_biostar.pdf (accessed on 6 October 2023).
- ISO 527-3:2018; Plastics. Determination of Tensile Properties. Part 3: Test Conditions for Films and Sheets. ISO: Geneva, Switzerland, 2018.
- ISO 37:2017; Rubber, Vulcanized or Thermoplastic. Determination of Tensile Stress-Strain Properties. ISO: Geneva, Switzerland, 2017.
- ISO 6892-1:2019; Metallic Materials—Tensile Testing—Part 1: Method of Test at Room Temperature. ISO: Geneva, Switzerland, 2019.
- ISO 7438:2020; Metallic Materials. Bend Test. ISO: Geneva, Switzerland, 2020.
- ISO 14577-1:2015; Metallic Materials—Instrumented Indentation Test for Hardness and Materials Parameters—Part 1: Test Method. ISO: Geneva, Switzerland, 2015.
- Oliver, W.C.; Pharr, G.M. An improved technique for determining hardness and elastic modulus using load and displacement sensing indentation experiments. J. Mater. Res. 1992, 7, 1564–1583. [Google Scholar] [CrossRef]
- Jalili, H.; Laxminarayana, K.A. Review of atomic force microscopy imaging systems: Application to molecular metrology and biological sciences. Mechatronics 2004, 14, 907–945. [Google Scholar] [CrossRef]
- Eaton, P.; West, P. Atomic Force Microscopy, 1st ed.; OXFORD University Press Inc.: New York, NY, USA, 2010. [Google Scholar]
- Chudoba, T. Measurement of Hardness and Young’s Modulus by Nanoindentation. In Nanostructured Coatings. Nanostructure Science and Technology, 1st ed.; Cavaleiro, A., De Hosson, J.T.M., Eds.; Springer: New York, NY, USA, 2006; pp. 216–260. [Google Scholar]
- Peng, H.; Fang, W.; Dong, C.; Yi, Y.; Wei, X.; Luo, B.; Huang, S. Nano-Mechanical Properties and Creep Behavior of Ti6Al4V Fabricated by Powder Bed Fusion Electron Beam Additive Manufacturing. Materials 2021, 14, 3004. [Google Scholar] [CrossRef] [PubMed]
- Liović, D.; Franulović, M.; Kamenar, E.; Kozak, D. Nano-Mechanical Behavior of Ti6Al4V Alloy Manufactured Using Laser Powder Bed Fusion. Materials 2023, 16, 4341. [Google Scholar] [CrossRef]
- Song, B.; Dong, S.; Zhang, B.; Liao, H.; Coddet, C. Effects of processing parameters on microstructure and mechanical property of selective laser melted Ti6Al4V. Mater. Des. 2012, 35, 120–125. [Google Scholar] [CrossRef]
- Ding, H.; Zhang, J.; Liu, J.; Wang, J.; Niu, L.; Chen, Y. Effect of volume energy density on microstructure and mechanical properties of TC4 alloy by selective laser melting. J. Alloy Compd. 2023, 968, 171769. [Google Scholar] [CrossRef]
- Dikova, T.; Dunchev, V.; Gagov, Y. Investigation of hardness and elastic modulus of milled and SLM Ti6Al4V alloy. J. Tech. Univ. Gabrovo 2022, 65, 1–6. [Google Scholar]
- Karolewska, K.; Ligaj, B. Comparison Analysis of Titanium Alloy Ti6Al4V Produced by Metallurgical and 3D Printing Method. AIP Conf. Proc. 2019, 2077, 20025. [Google Scholar]
- Smith, W.F.; Hashemi, J. Foundations of Materials Science and Engineering, 4th ed.; McGraw-Hill: New York, NY, USA, 2006. [Google Scholar]
Figure 1.
(a) CAD/CAM planned orthodontic retainer; (b) intraoral view of the retainer.
Figure 1.
(a) CAD/CAM planned orthodontic retainer; (b) intraoral view of the retainer.
Figure 2.
Experimental equipment: (a) selective laser fusion apparatus, MYSINT100 (SISMA S.p.A., Vicenza, Italia); (b) CORiTEC 650i 5-axis milling machine (Imes-icore GmbH, Hessen, Germany); (c) scanning electron microscope (SEM) “HIROX SH-5500P” (Jyfel Corporation—Hirox Europe, Limonest, France) with an integrated Energy-Dispersive X-ray Spectroscopy (EDS) system “QUANTAX 100 Advanced”—Bruker; (d) Bruker D8 Advance powder X-ray diffractometer (Bruker AXS, Karlsruhe, Germany); (e) electromechanical machine for physico-mechanical tests—“Multitest 2.5-i”/MECMESIN (Slinfold, West Sussex, UK); (f) nanoindenter G200 (KLA, Milpitas, CA, USA).
Figure 3.
The geometry of the specimens used for bending and tensile test.
Figure 3.
The geometry of the specimens used for bending and tensile test.
Figure 4.
The specimens prepared for nanoindentation experiments.
Figure 4.
The specimens prepared for nanoindentation experiments.
Figure 5.
SEM image of the surface of (a) milled Ti disc specimen (×200); (b) disk sample of 3D-printed Ti (×200).
Figure 5.
SEM image of the surface of (a) milled Ti disc specimen (×200); (b) disk sample of 3D-printed Ti (×200).
Figure 6.
Diffraction pattern of the 3D-printed titanium specimen.
Figure 6.
Diffraction pattern of the 3D-printed titanium specimen.
Figure 7.
Diffraction pattern of the milled titanium sample.
Figure 7.
Diffraction pattern of the milled titanium sample.
Figure 8.
Experimental load–displacement curves.
Figure 8.
Experimental load–displacement curves.
Figure 9.
Comparison of indentation hardness of investigated samples from milled and 3D-printed titanium alloys.
Figure 9.
Comparison of indentation hardness of investigated samples from milled and 3D-printed titanium alloys.
Figure 10.
Comparison of indentation modulus of investigated samples from milled and 3D-printed titanium alloys.
Figure 10.
Comparison of indentation modulus of investigated samples from milled and 3D-printed titanium alloys.
Figure 11.
Comparison of the experimental stress–strain curves for 3D-printed and milled Ti-6Al-4V samples, obtained by means of tensile test.
Figure 11.
Comparison of the experimental stress–strain curves for 3D-printed and milled Ti-6Al-4V samples, obtained by means of tensile test.
Figure 12.
Part of the working area of a milled Ti-6Al-4V specimen (×20) at the point of failure after tensile test.
Figure 12.
Part of the working area of a milled Ti-6Al-4V specimen (×20) at the point of failure after tensile test.
Figure 13.
Fracture profile of 3D-printed Ti-6Al-4V specimens (×40) after tensile test.
Figure 13.
Fracture profile of 3D-printed Ti-6Al-4V specimens (×40) after tensile test.
Figure 14.
Load–displacement curves, obtained by means of three-point bending test (1 mm/min).
Figure 14.
Load–displacement curves, obtained by means of three-point bending test (1 mm/min).
Figure 15.
Frontal view in the region of the realized maximum tensile stress of milled Ti specimens at different indenter movement speeds: (a) 1 mm/min/×40/; (b) 60 mm/min/×40/.
Figure 15.
Frontal view in the region of the realized maximum tensile stress of milled Ti specimens at different indenter movement speeds: (a) 1 mm/min/×40/; (b) 60 mm/min/×40/.
Figure 16.
Side view in the area of the realized maximum tensile–compressive stress of 3D-printed Ti-6Al-4V specimens at different indenter movement speeds: (a) 1 mm/min/×35/; (b) 60 mm/min/×35/.
Figure 16.
Side view in the area of the realized maximum tensile–compressive stress of 3D-printed Ti-6Al-4V specimens at different indenter movement speeds: (a) 1 mm/min/×35/; (b) 60 mm/min/×35/.
Figure 17.
AFM topography of the samples: milled Ti-6Al-4V (a) and 3D-printed Ti-6Al-4V (b): 2D images and section analysis.
Figure 17.
AFM topography of the samples: milled Ti-6Al-4V (a) and 3D-printed Ti-6Al-4V (b): 2D images and section analysis.
Figure 18.
Phase images, 2D and 3D AFM images of the samples: milled Ti-6Al-4V (a) and 3D-printed Ti-6Al-4V (b).
Figure 18.
Phase images, 2D and 3D AFM images of the samples: milled Ti-6Al-4V (a) and 3D-printed Ti-6Al-4V (b).
Table 1.
Manufacturing parameters of the 3D-printed Ti-6Al-4V sample.
Table 1.
Manufacturing parameters of the 3D-printed Ti-6Al-4V sample.
| Manufacturing Parameter | Value | Unit |
|---|
| Laser power | 140 | W |
| Layer thickness | 30 | µm |
| Laser spot | 50 | µm |
| Scan speed | 125 | mm/s |
| Hatch spacing | 80 | µm |
| Oxygen level | <0.3 | % |
| Build platform heating | 200 | °C |
Table 2.
Dimensions of the specimens used for bending test and tensile test.
Table 2.
Dimensions of the specimens used for bending test and tensile test.
| Specimen Type—5B | | Dimension in mm |
|---|
| l3 | Overall length | ≥35 |
| b2 | Width at ends | 6 ± 0.5 |
| l1 | Length of narrow parallel—sided portion | 12 ± 0.5 |
| b1 | Width at narrow portion | 2 ± 0.1 |
| r1 | Small radius | 3 ± 0.1 |
| r2 | Large radius | 3 ± 0.1 |
| L | Initial distance between grips | 20 ± 2 |
| L0 | Gauge length | 10 ± 0.2 |
| h | Thickness | 1 ± 0.1 |
Table 3.
The mechanical properties of the alloys established by a tensile test.
Table 3.
The mechanical properties of the alloys established by a tensile test.
| No | Material |
[MPa] |
[%] |
[MPa] |
[GPa] |
|---|
| 1 | Milled Ti-6Al-4V | 866 | 19.5 | 803.3 | 7.6 |
| 2 | 3D printed Ti-6Al-4V | 1098 | 11.3 | 591.8 | 32.8 |
Table 4.
Flexural strength (classical method) of the tested materials.
Table 4.
Flexural strength (classical method) of the tested materials.
| No | Material |
[GPa] |
[GPa] |
|---|
| 1.1 | Milled Ti | 1639 | 97 |
| 1.2 | Milled Ti | 1719 | 99 |
| 2.1 | 3D-printed Ti-6Al-4V | 1997 | 78 |
Table 5.
Results from the t-test comparison of the 3D-printed Ti-6Al-4V sample with the milled Ti-6Al-4V sample.
Table 5.
Results from the t-test comparison of the 3D-printed Ti-6Al-4V sample with the milled Ti-6Al-4V sample.
| Parameters | Mean | SD | Mean Difference | 95% CI
Difference
Lower Upper | p-Value |
|---|
| Indentation modulus |
- ○
3D printed Ti-6Al-4V
| 144.12 | 3.89 | 3.97 | 1.03 to 6.90 | 0.009 |
- ○
Milled Ti-6Al-4V
| 140.15 | 5.98 |
| Indentation hardness |
- ○
3D printed Ti-6Al-4V
| 4.53 | 0.22 | 0.79 | 0.64 to 0.93 | <0.001 |
- ○
Milled Ti-6Al-4V
| 3.74 | 0.26 |
| Disclaimer/Publisher’s Note: The statements, opinions and data contained in all publications are solely those of the individual author(s) and contributor(s) and not of MDPI and/or the editor(s). MDPI and/or the editor(s) disclaim responsibility for any injury to people or property resulting from any ideas, methods, instructions or products referred to in the content. |
© 2023 by the authors. Licensee MDPI, Basel, Switzerland. This article is an open access article distributed under the terms and conditions of the Creative Commons Attribution (CC BY) license (https://creativecommons.org/licenses/by/4.0/).


 ,
, 


