Article

A Study on H-Fuzzy Controller for a Non-Linear Wind Turbine with Uncertainty

1
Department of Integrated Energy and Infra System, Kangwon National University, Chuncheon 24341, Gangwon, Republic of Korea
2
Department of Mechatronics Engineering, Kangwon National University, Chuncheon 24341, Gangwon, Republic of Korea
*
Author to whom correspondence should be addressed.
Appl. Sci. 2023, 13(21), 11930; https://doi.org/10.3390/app132111930
Submission received: 19 September 2023 / Revised: 18 October 2023 / Accepted: 27 October 2023 / Published: 31 October 2023
(This article belongs to the Topic Advances in Wind Energy Technology)

Abstract

:
In this study, an H -fuzzy controller is proposed for application in wind turbines with uncertainties and nonlinearities. The performance of the proposed controller was validated via dynamic simulations using a commercial aero-elastic code and wind tunnel experiments employing a scaled wind turbine. The simulation and the experimental results were then compared with those of the conventional PI and LQR control algorithms presented in our previous study. In the simulation, the perturbation and the sensor noise were applied to reflect uncertainty and nonlinearity effects. In addition, in the wind tunnel experiment, a control system using a commercial Bachmann PLC was established with an accelerometer to estimate the fatigue load exerted by the rotor thrust. It was confirmed through experiments that the robustness and adaptation of the control system improved in the situation of pitch system failure. As a result of the experiment, the proposed H controller was able to reduce the rotor speed fluctuation by 39.9%, the power fluctuation by 32.0%, and the fatigue load by 2.4% compared with the LQR fuzzy controller, which had better performance than the conventional PI controller. In addition, it was confirmed through experiments that the robustness and adaptation of the control system were well maintained. This was even true in the situation of one-blade pitch system failure.

1. Introduction

The globally installed capacity of new wind turbines reached 93.6 GW in 2021, an increase of 53% from 2020 [1]. However, as the number of installed wind turbines increases, fewer potential sites remain available for the development of onshore wind farms. This requires wind turbines to increasingly operate on more complex terrain and in harsher environments, or otherwise be installed at sites with less favorable resources [2,3]. With the view of pursuing the efficient utilization of wind resources and ensuring the energy productivity of wind turbines, there is a need to develop wind turbine systems with higher capacities, larger rotor diameters, and higher hub heights [4]. Recently, wind turbine prototypes with capacities of 14 MW or larger have been developed by the world’s leading wind turbine manufacturers and installed at onshore test sites for type certification [5].
Larger wind turbines are desirable for their ability to generate electricity more efficiently within limited spaces for wind farms. However, they inevitably require longer blades to extract more power from the wind, with the result of wind turbines experiencing larger wind speed variations vertically (known as wind shear), producing larger fatigue loads with more fluctuations [6,7]. Therefore, the design of the wind turbine controller becomes increasingly critical for larger wind turbines. The control algorithm must not only ensure good power performance in normal operation conditions, but also maintain reasonable operating performances with disturbances under unexpected conditions.
The goal of wind turbine control is to enable wind turbines to operate automatically while responding appropriately to changes in wind speed. In regions where the wind speed falls below the rated value, the generator torque is controlled for the purpose of producing maximum power. Producing maximum power can be achieved by controlling the generator speed so that the tip speed ratio (ratio of wind speed and blade tip speed) remains constant when the power coefficient (i.e., aerodynamic efficiency) of the wind turbine is at its maximum [8]. This method is known as maximum power point tracking (MPPT), and the generator torque is controlled to be proportional to the square of the generator speed [9]. The blade pitch angle is maintained at a fine-pitch angle. In regions where the wind speed exceeds the rated value, the generator torque is either kept constant at the rated torque or controlled to be inversely proportional to the generator speed for the purpose of maintaining the rated power. The blade pitch angle is controlled to keep the generator speed at its rated value [8]. In addition to the general control goal, the wind turbine, which is a plant of the control system, is always exposed to an environment where various disturbances, including turbulence, gusts, sensor noise, and failure, exist. Therefore, the application of robust control techniques for wind turbines has been investigated with the aim of improving the stability of these turbines [10] by reducing the impacts of the disturbances.
Considering the feasibility of a robust controller, a robust proportional–integral (PI) control algorithm was designed based on the conventional PI control algorithm to reduce power fluctuations and improve system stability by adjusting the cross-frequency and stability margin using frequency responses. However, this did not significantly improve the load reduction performance [10,11]. To reduce the effects of sensor noise interference and model uncertainty on the control algorithm, a sliding mode robust control was suggested for use to improve the stability performance and power performance of the controller in regions characterized by low wind speed [12]. Although the sliding mode control was found to contribute to the robustness of the torque control algorithm, the role of the pitch control algorithm was not studied sufficiently to make any determinations.
To improve the stability of the controller in regions with high wind speed, a multiple-input, single-output (MISO) H controller was designed for load reduction. This controlled simulated normal and extreme wind conditions, and the results showed that the proposed MISO H control algorithm was able to reduce the load on the tower [13]. In one study, the iterative μ synthesis-based H control algorithm was designed and simulated in MATLAB. The simulation results showed the ability of the proposed H controller to reduce the pitch angle oscillations caused by the model uncertainty and thus maintain robustness [14]. In another study, an H robust control algorithm was designed by increasing the blade mass simulation model, and the results showed that, with model uncertainty, the H controller was more stable compared to conventional PI control [15]. Additionally, in the simulation study of a pitch H controller designed exclusively for the rated power region, the authors showed that the pitch H control algorithm reduced the standard deviation in the rotor speed of a wind turbine in the rated power region compared to the conventional control algorithm, especially in environments with sensor noise and extreme wind conditions [16].
The aforementioned studies in the literature validated the stability and load reduction performance of the controller for a specific wind speed range. However, they had limitations in terms of a failure to provide complete control strategies capable of covering the entire operating regions of wind turbines, including below-rated, rated, and above-rated wind speed regions, including the nonlinearity and uncertainty associated with wind turbines.
Recent studies have started to adapt fuzzy logic, an adaptive control technique, to wind turbine control. A wind turbine controller with fuzzy logic combines linear systems according to the operating region of the wind turbine in order to apply gains and weights with consideration of nonlinearity [17]. One study found that using the conventional maximum power point tracking (MPPT) control led to the development of a fuzzy-maximum power point tracking control algorithm, which was proposed to improve the power and stability of the controller in regions with low wind speed [18]. The results showed that, in these regions, the use of the fuzzy MPPT control algorithm can improve the stability and power performance of the wind turbine compared with the use of the conventional MPPT control algorithm. In another study, the proposed fuzzy PI-scheduling control algorithm was able to reduce the load of the tower base by up to 21.5% compared with the conventional PI control algorithm [19]. The optimal control algorithm using fuzzy control was also previously investigated. A linear–quadratic regulator control algorithm based on fuzzy control was proposed. Researchers found that its use to improved stability and load reduction performance compared with the conventional PI control algorithm [20,21]. In previous studies on wind turbine control, the uncertainty of the model was considered using H control and the nonlinearity of the wind turbine was addressed via fuzzy logic. However, there were few attempts to simultaneously address both model uncertainty and nonlinearity simultaneously.
Therefore, in this study, we revisited our previous study on the pitch H control algorithm and designed a fuzzy logic-based H control algorithm to improve controller performance in operational wind turbine situations with nonlinearity and uncertainty effects. Additionally, in order to compare the performance of the proposed controller, we designed PI control algorithms using the baseline control structure presented by the National Renewable Energy Laboratory (NREL) and a linear–quadratic regulator based on the fuzzy logic (LQRF) control algorithm from our previous work [22,23]. The performance validation of the proposed controller was conducted not only through dynamic simulations, but also through wind tunnel experiments in turbulent wind conditions with sensor noise and blade fault situations using a scaled wind turbine with a capacity of 40 W.
The contribution of this study can be summarized as follows:
1. To consider the nonlinearity of wind turbines caused by wind disturbances such as turbulence and gusts, membership functions and fuzzy rules were designed for wind speed information and integrated into H control;
2. To cope with the model uncertainty of wind turbines, such as sensor noise and the perturbation that causes control performance degradation, we designed a H control algorithm based on a mixed-sensitivity method was designed;
3. To validate the proposed algorithm more clearly, the control performances have been compared with those of previously proposed algorithms, including the fuzzy logic-based LQR and pitch- H control, as well as the baseline PI control algorithm;
4. To show the feasibility of the proposed control algorithm in close-to-real situations, the proposed control algorithm was experimentally validated using a 40 W capacity-scaled wind turbine and turbulent winds in a wind tunnel. Also, the failure situation of a blade-pitch actuator was tested and analyzed.

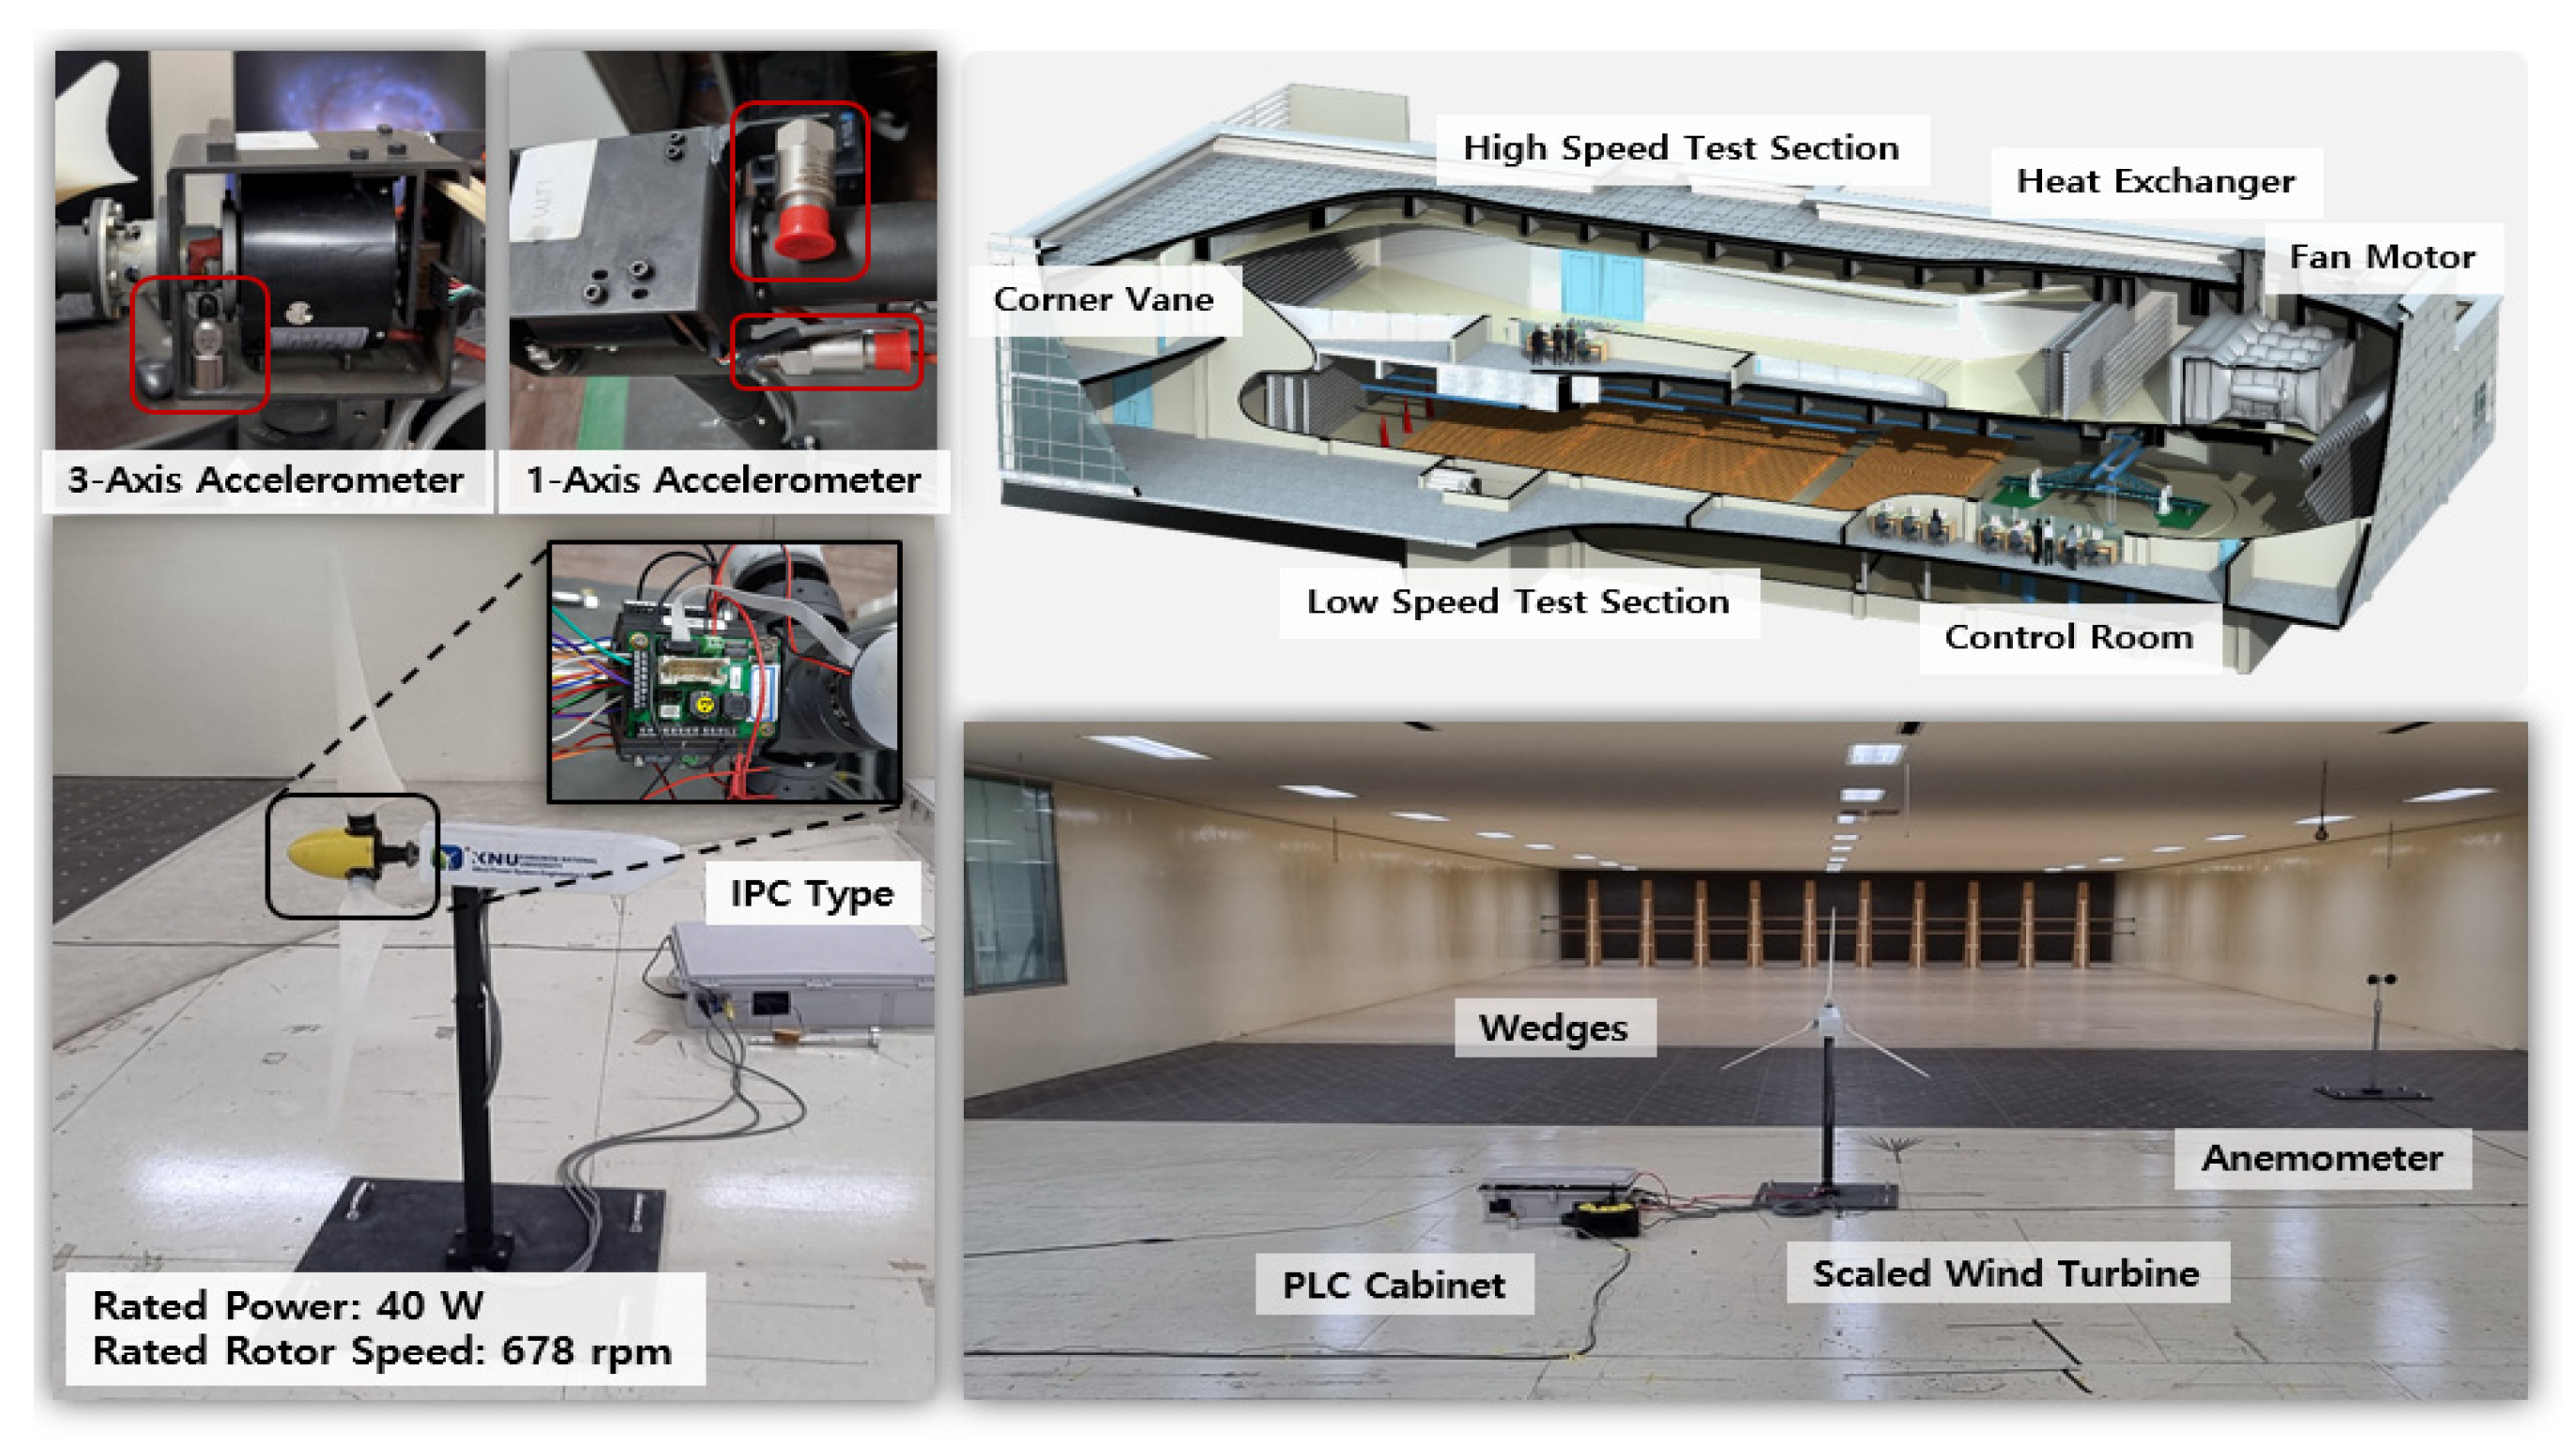
2. Wind Turbine Specification

We used order a 40 W capacity wind turbine to validate the performance of the proposed controller for wind turbines in this study. The scaled wind turbine had a rotor diameter of 1.1 m and a tower height of 0.9 m. Its rotor speed at the rated condition was 678 rpm, possessing a rated generator torque of 0.04 Nm. Additional turbine specifications are presented in Table 1. The target wind turbine was originally designed and developed by researchers at the Technical University of Munich (TUM) [24]. However, modifications were made to the turbine encourage the development of new three-dimensional (3D)-printed blades, accelerometers in the nacelle, and various control algorithms for experimental validation in this study. Additionally, despite having a low-rated power of 40 W, this wind turbine was designed to have the optimal tip speed ratio, defined as the ratio of blade tip speed to wind speed required to improve the aerodynamic efficiency of the rotor to be approximately 7.3, granting an operating range similar to that of large wind turbines. These scaled wind turbines have been widely adopted as a method for validating the control performance of new control algorithms [25].

3. Control Algorithms

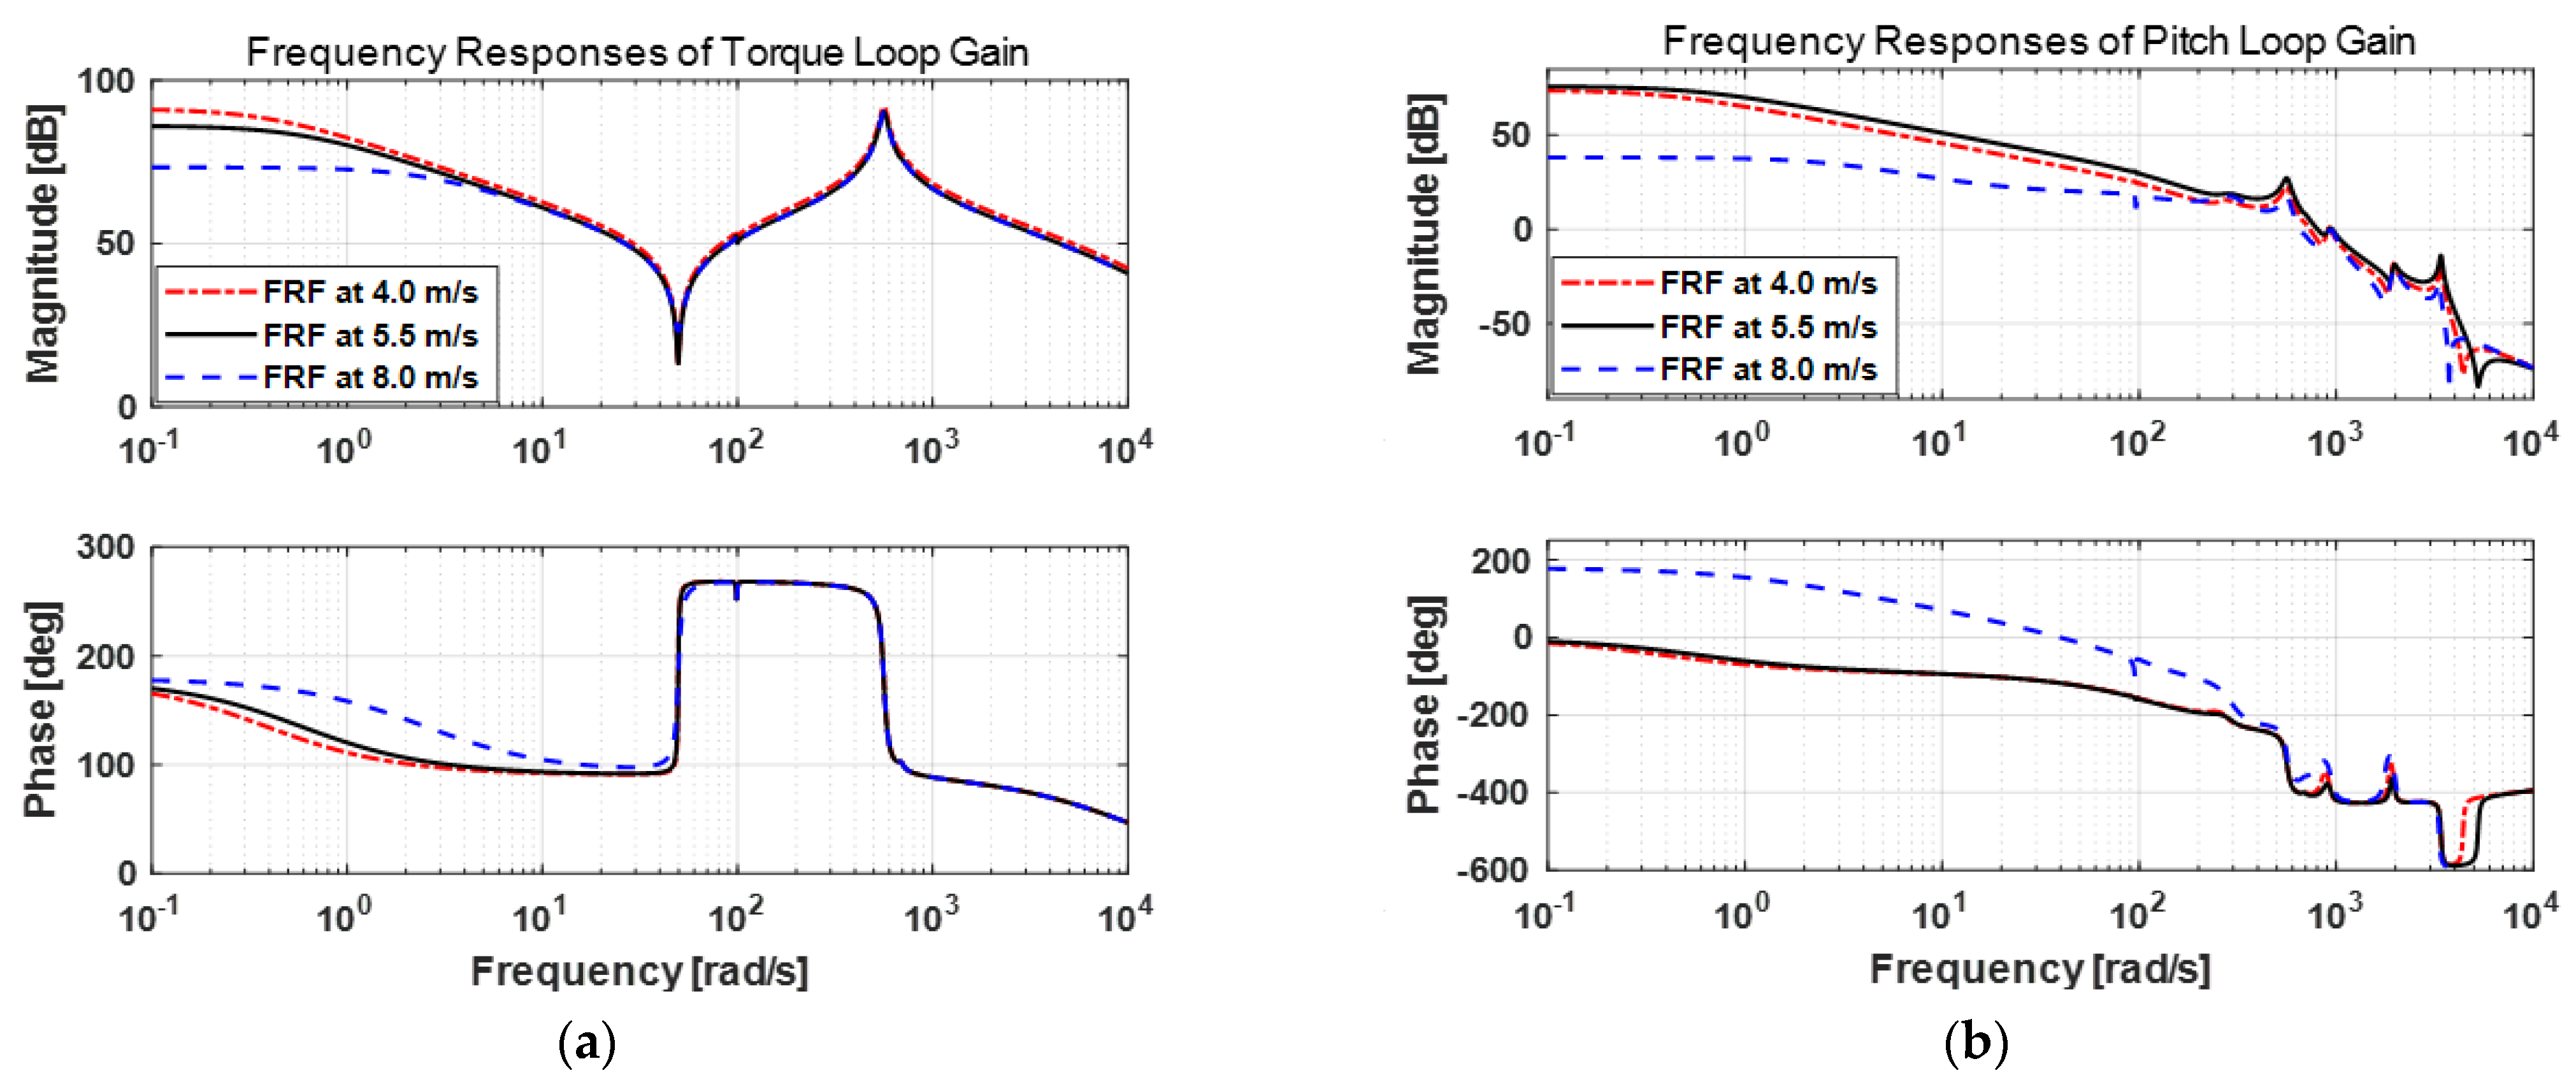
3.1. Model Linearization

To design the H controller, the target wind turbine model was modeled and linearized using Bladed (Ver. 4.11, DNV, Oslo, Norway), a wind turbine commercial aero-elastic code for dynamic simulations with a controller in turbulent wind conditions. In addition, to implement the uncertainty to the model, a wind speed perturbation of 0.1 m/s, a blade pitch of 0.5 deg, and a generator torque perturbation of 0.01 Nm were applied.
The state vectors x included each state variable of the tower with six eigenmodes, each blade variable with four eigenmodes, and state variables of the blade pitch actuator, generator, and drivetrain. The output vectors y included generator speed, generator torque, rotor azimuth angle, blade pitch angle, nacelle acceleration, blade load, and tower load, each of which can be used to confirm the operation characteristics of the wind turbine. The input vectors u included blade pitch angle, generator torque, and wind speed (the linearization model information is summarized in Table A1 of Appendix A). Therefore, the state equation of the target wind turbine was expressed as:
x ˙ = A 47 × 47 x + B 47 × 3 u
The state matrix A had 47 state vectors, resulting in dimensions of 47 by 47. The input matrix B , on the other hand, had a dimension of 47 by 3 due to its three input variables. The output matrix C consisted of 14 output vectors, making its dimension 14 by 47. Finally, the direct transmission matrix D had a dimension of 14 by 3. The output equation of the target wind turbine was expressed as:
y = C 14 × 47 x + D 14 × 3 u
Linearization models were constructed in the wind speed region rate lower than (4.0 m/s), the rated wind speed region (5.5 m/s), and wind speed region higher than (8.0 m/s), respectively, in order to respond to the non-linear effect of wind turbines. Figure 1 shows the frequency response functions of the torque and pitch loop gain with respect to generator speed in each wind speed region. As can be seen in Figure 1, the fuzzy inference-based H -fuzzy control algorithm must be designed to combine linearization models corresponding to different wind speed regions. This will enable us to consider the nonlinearity effects of wind turbines with respect to wind speed.

3.2. Desired Set Points
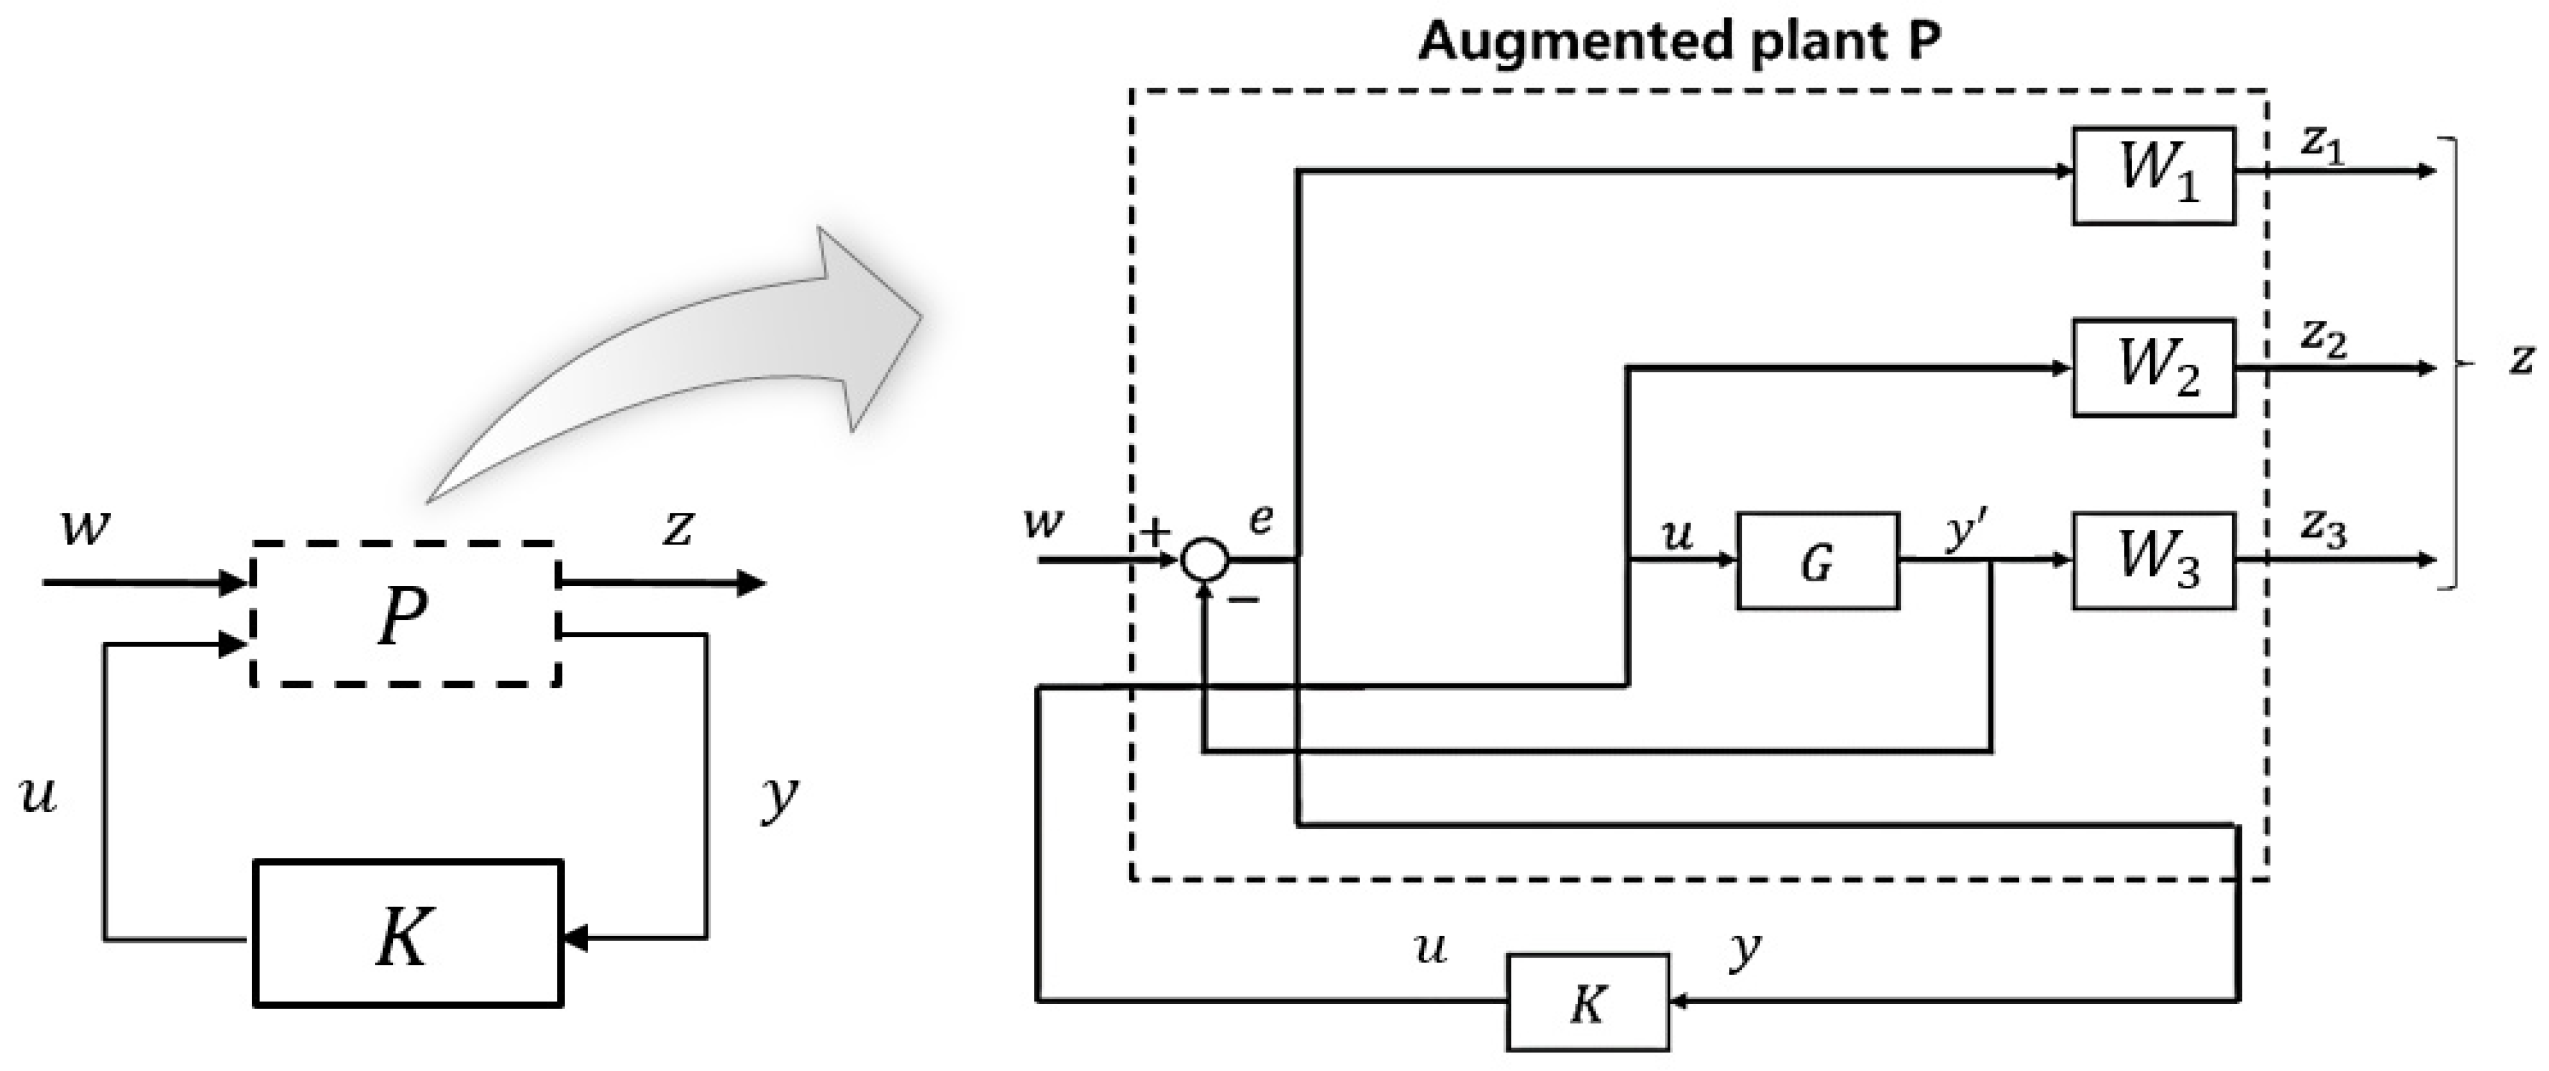
The proposed multiple-input H controller had previously been applied to determine the desired set points of each feedback signal. We used set points of a generator torque schedule compared to the generator speed of the wind turbine in order to track the maximum power point, and employed set points of the generator speed using a reference bias control technique to reduce transience in the rated wind speed region [23]. In addition, a peak shaving schedule was used in comparison to the estimated wind speed to obtain set points of the blade pitch by employing a wind speed estimator, and ‘0’ was used as the desired value related to the load.
The wind speed estimator estimates wind speed through two procedures [26]. First, the aerodynamic torque is estimated using Newton’s laws of motion for the driving heat model, and it can be assessed by measuring the rotor speed and the generator torque. The estimated aerodynamic torque T ^ a can be expressed as:
T ^ a = J t o t a l Ω ˙ r + N T g + T L o s s
where J t o t a l is the total moment of inertia of the rotor, generator, hub, and shaft,   Ω r is the low-pass-filtered rotor speed, N is the gear ratio, and T g and T L o s s are the generator torque and mechanical loss torque, respectively. Second, a function minimization method was used to inversely obtain wind speed from power coefficient data. The function minimization algorithm was calculated using the MATLAB (R2023a, The MathWorks, Inc., Natick, MA, USA)’s fminsearch function, and a non-linear wind speed function was implemented in the form of a 3D look-up table in advance. The 3D look-up table determines the current wind speed from the estimated aerodynamic torque, measured rotor speed, and measured blade pitch angle. The aerodynamic torque T a for determining the estimated wind speed can be expressed as:
T a = 1 2 ρ π R 3 C P λ ^ , β λ ^ v ^ 2
where ρ represents air density, R indicates rotor radius, C P represents the power coefficient, β represents the blade pitch angle, λ ^ ( = R Ω r / v ^ ) represents the tip speed ratio by the estimated wind speed, and v ^ represents the estimated wind speed.

3.3. Mixed-Sensitivity H Control Algorithm

H -based loop-shaping techniques were used to improve the uncertainty effect in the control system of wind turbines. In the control system, the plant is given as:
x ˙ = A x + B   u y = C   x + D   u
That is, plant (5) is a generalized representation of Equations (1) and (2). However, when the uncertainty effect of the plant is expressed through perturbation in H control theory, plant (5) can be expressed as an augmented plant (6) using linear fractional transformation (LFT) [27]. Due to the intervention of the disturbance input w , the input matrix B of the plant (5) was augmented to B 1 and B 2 . In addition, due to the intervention of the performance signal z, the output matrix C of the plant (5) was augmented to C 1 and C 2 , and the direct transmission matrix D was augmented to D 11 , D 12 , D 21 , and D 22 . In this study, the augmented plant (6) was implemented using the mixed-sensitivity method. The mixed-sensitivity method represents the performance signal z by representing input sensitivity S, control sensitivity KS, output sensitivity T, and each weight function, i.e., W 1 , W 2 , and W 3 .
x ˙ = A x + B 1 w + B 2 u z = C 1 x + D 11 w + D 12 u y = C 2 x + D 21 w + D 22 u
Figure 2 shows a closed-loop transfer function representing the H control system. K is the searched controller that minimizes the H norm of the augmented plant P, i.e., plant (6), and G is the nominal form of the augmented plant P. The H control uses a state feedback gain that minimizes the H norm of the mixed-sensitivity functions W 1 S , W 2 K S , and W 3 T .
In addition, the value when the H norm of the mixed-sensitivity functions W 1 S , W 2 K S , and W 3 T is at a minimum can be expressed as the optimal performance level γ 0 :
γ 0 = min K stabilizing W 1 S W 2 K S W 3 T
However, since complex systems such as uncertain non-linear wind turbines do not guarantee a unique solution to the optimal control problem (7), non-negative scalar performance level γ , i.e., tolerance, is selected through iteration. Accordingly, the optimization problem (7) can be represented as a suboptimal control problem (8) using arbitrary performance level γ . In addition, through Figure 2, the sensitivity functions S , K S , and T can be represented by ( I + G K ) 1 , K ( I + G K ) 1 , and G K ( I + G K ) 1 respectively.
W 1 ( I + G K ) 1 W 2 K ( I + G K ) 1 W 3 G K ( I + G K ) 1 < γ , ( γ > γ 0 )
It is known that a given suboptimal control problem (8) can be solved using two algebraic Riccati equations (ARE) [27]. With the selection of performance level γ , this suboptimal control problem was solved using MATLAB’s hinfsyn function. The weight functions were applied using low-pass and high-pass filters [28].

3.4. Fuzzy Inference Algorithm

The T-S fuzzy model can approximate the entire fuzzy model using a combination of linear sub-fuzzy models [29]. Therefore, the control sub-command u ( t )   of the augmented linear plant (6) by wind speed region, i.e., the region mentioned in Figure 1, is interpolated using fuzzy logic, which can lead to an approximation of the control command u t of the non-linear entire plant. The control sub-command u ( t )   is calculated from the membership function μ of the wind speed nonlinearity, i.e., the sub-optimized H   control command u s u b o p t ( t ) . The subscript below i indicates the number of sub-systems. The control sub-command u ( t ) can be expressed as:
u ( t ) = μ i z t · u s u b o p t , i ( t )   μ i z t
The final control command u t is calculated from the membership function κ of the uncertainty of the estimated wind speed, the control sub-command u ( t ) , and the control command of the previous step u 0 t . The calculation formula is given in Equation (10). Equation (11) describes the system decision variable z t given by the estimated wind speed information.
u t = κ ( z t ) u 0 ( t ) + 1 κ ( z t ) u t
z t =               v ^ t               f o r     μ ,     ( 0 μ < 1 )         v ^ ˙ t               f o r     κ ,     ( 0 κ < 1 )
Figure 3 shows the block diagram of the T-S fuzzy controller. As shown in the figure, the wind speed and wind speed rate are used as inputs for the T-S fuzzy model. As shown in the figure, wind speed and wind speed rate are used as inputs to induce fuzzification in the T-S fuzzy model. In the T-S fuzzy model, interpolation calculations are performed using membership functions and fuzzy rules. In addition, defuzzification is performed to calculate the weight values μ 1 , μ 2 , and μ 3 of the control sub-commands for each wind speed region and the weight value κ of the control command for the uncertainty of the estimated wind speed.
The fuzzy rules and membership functions for the fuzzy inference algorithm were designed with MATLAB’s Fuzzy Logic Toolbox [30]. The non-linear membership functions (trapmf, trimf, and trapmf) were applied to the wind speed and wind speed rate corresponding to the input of the T-S fuzzy model. The constant-type membership functions (0, 0.3333, 0.5, 0.6667, and 1) were applied to each wind speed region (below-rated region (4.0 m/s), rated region (5.5 m/s), and above-rated region (8.0 m/s)) of the T-S fuzzy model. The constant-type membership functions (0, 0.5, 1) were applied to determine the uncertainty of the estimated wind speed.
Since the uncertainty of estimated wind speed can be easily categorized using the degree to which the wind speed changes rapidly, the membership function for the wind speed were simply divided into three points between 0 and 1. In the case of the membership function for the wind speed, three points were divided between 0 and 1, and two points were added near the middle value to prevent transience caused by pitch and torque control conversion in the rated wind speed region during the interpolation process of the control command values of each sub-system. The membership functions and fuzzy rules are shown in detail in Figure A1 and Table A2 of Appendix B.

3.5. Controller Implementation

The proposed controller was implemented in MATLAB/Simulink to generate a C code. The controller code was uploaded to the PLC in order to conduct wind tunnel experiments. Then, data were compiled in a dynamic link library (DLL) for simulation in the commercial aero-elastic program known as ‘DNV-Bladed’.
Figure 4 shows the overall block diagram of the fuzzy inference-based H -fuzzy control algorithm. The proposed H -fuzzy control algorithm was implemented with the fuzzy inference algorithm, the wind speed estimator, and the H controllers for three different wind speed regions. In addition, we applied the selection of set points, the state scaling required for state feedback control, and the reference bias control (RBC) algorithm to respond to transient responses in terms of the impact of pitch and torque control in the rated wind speed region [23]. The reduced nominal plant used to control the target wind turbine consisted of four state vectors x   (blade pitch β , generator torque   T g , generator speed Ω g , and nacelle acceleration x ¨ ), two control commands u (a pitch command β   c and torque command T   g c ), and an output vector y (generator speed Ω g ).

4. Controller Validation

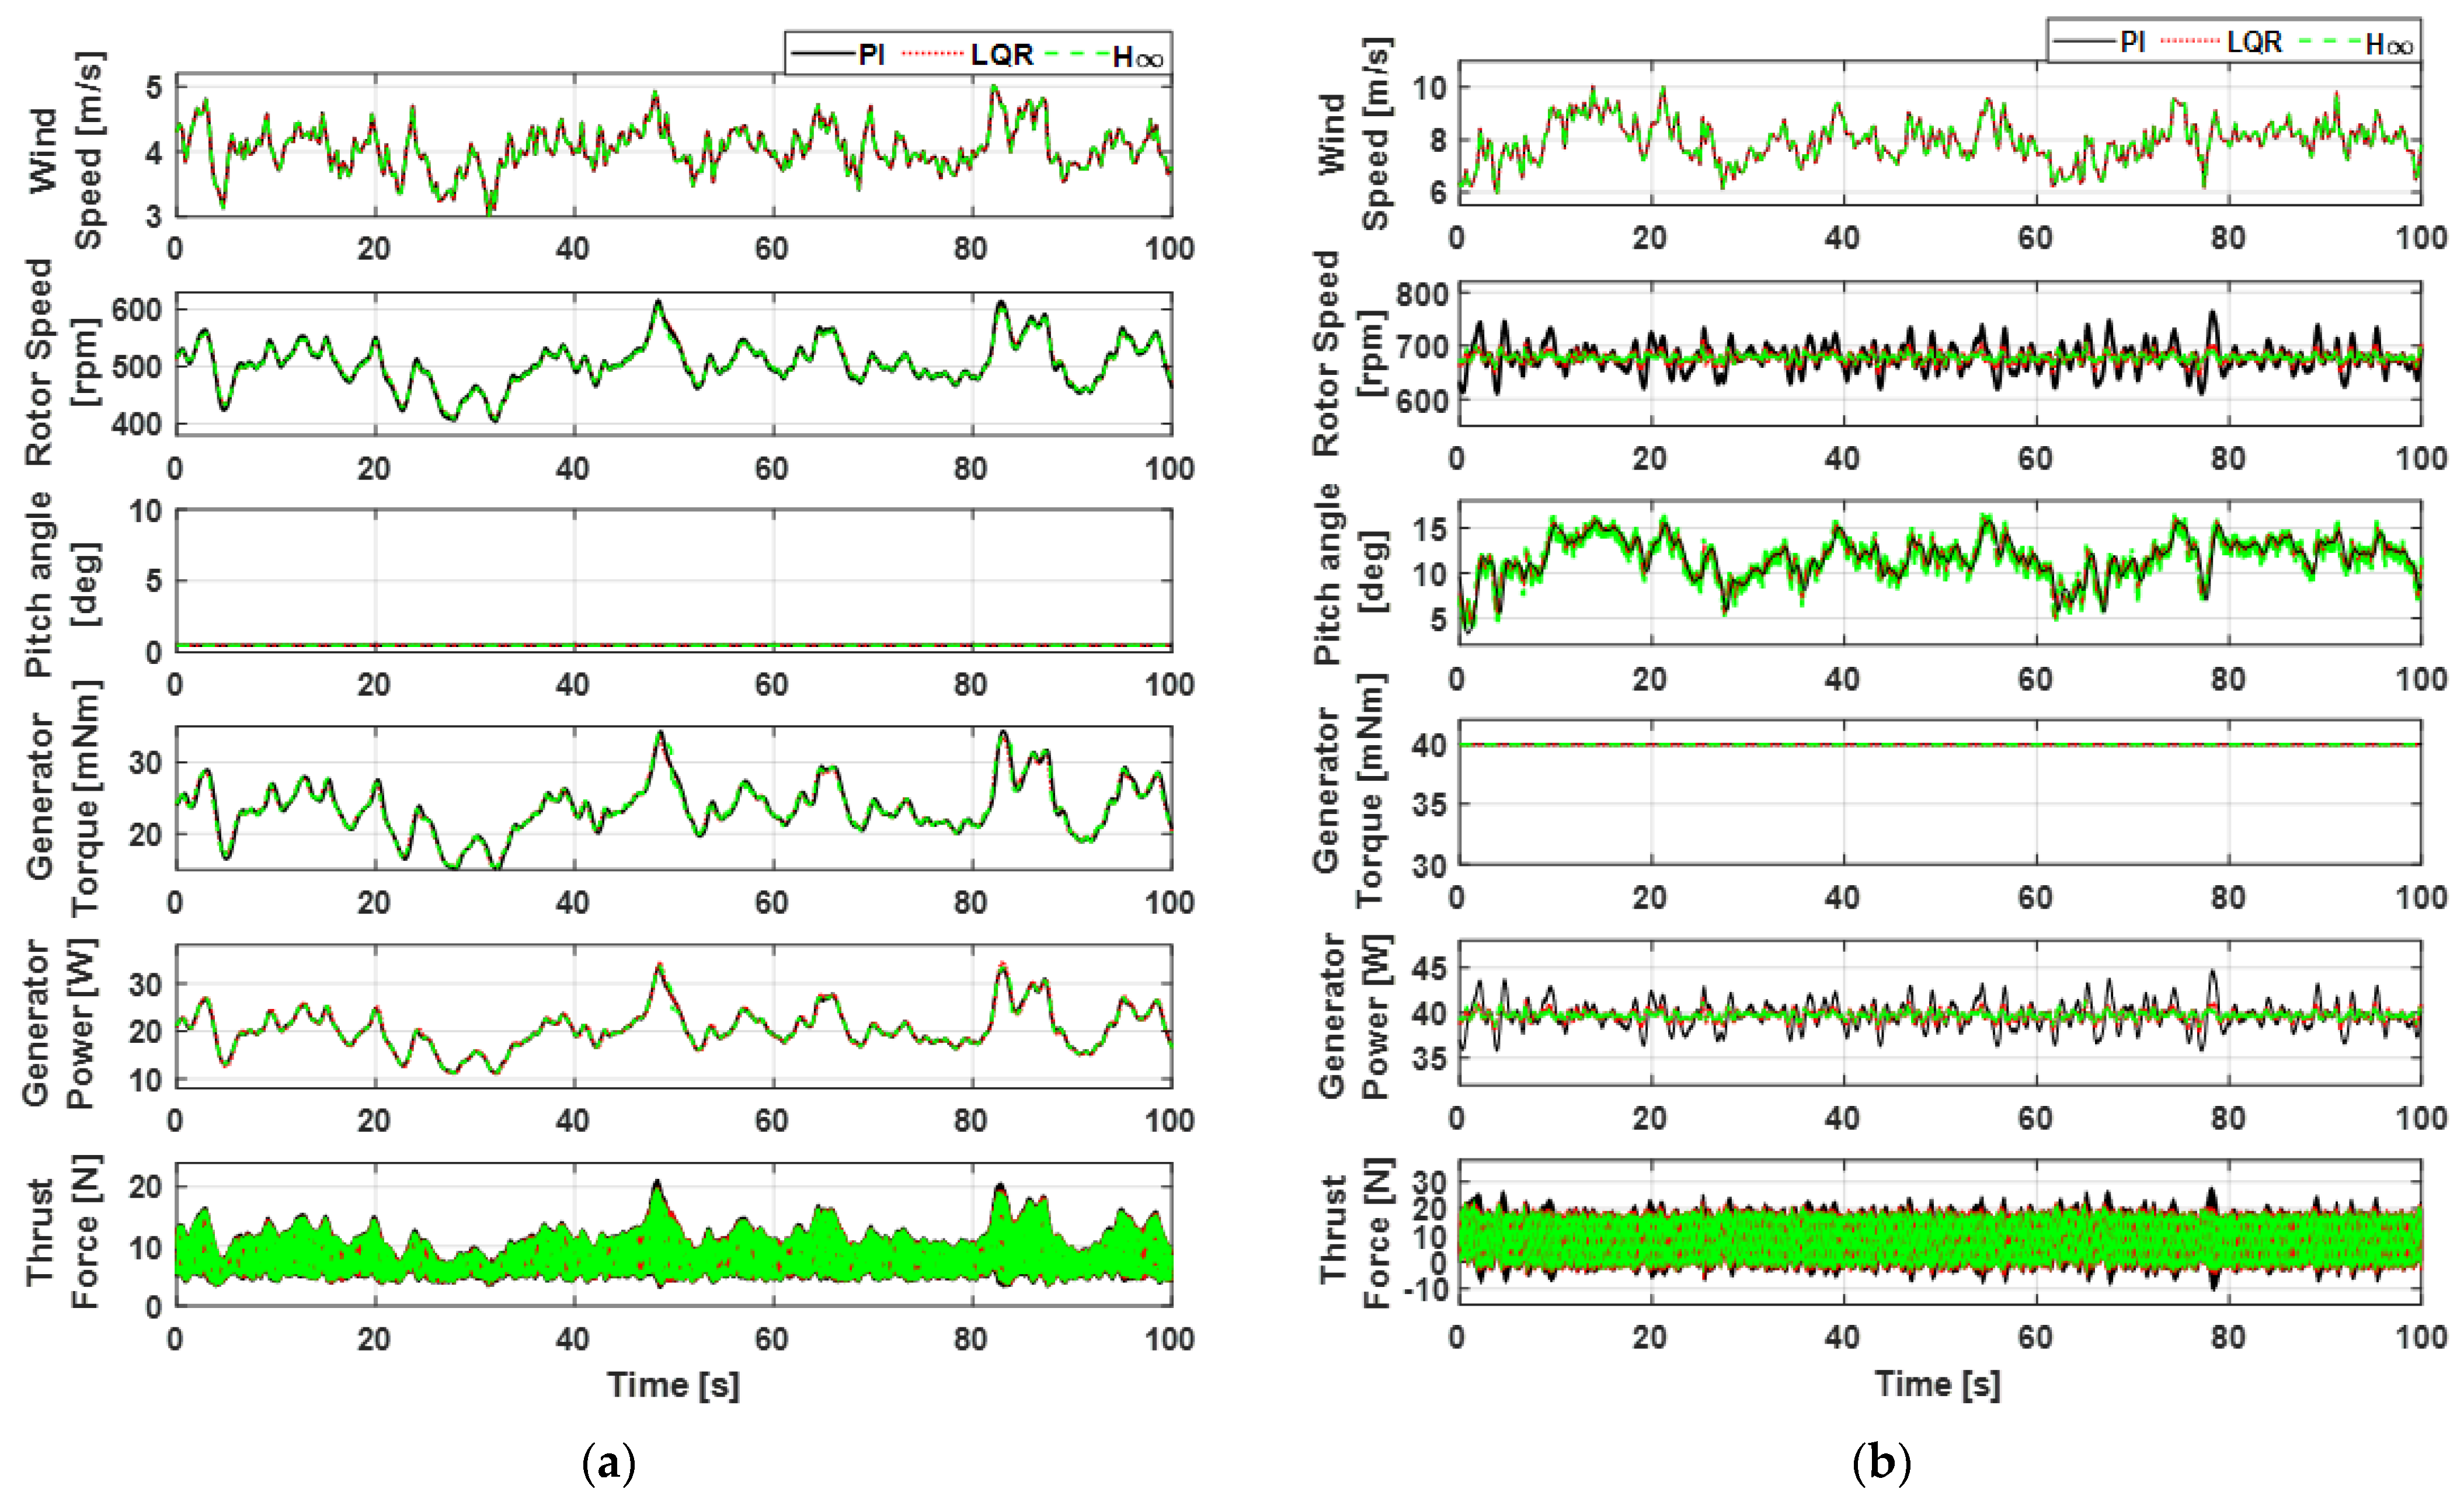
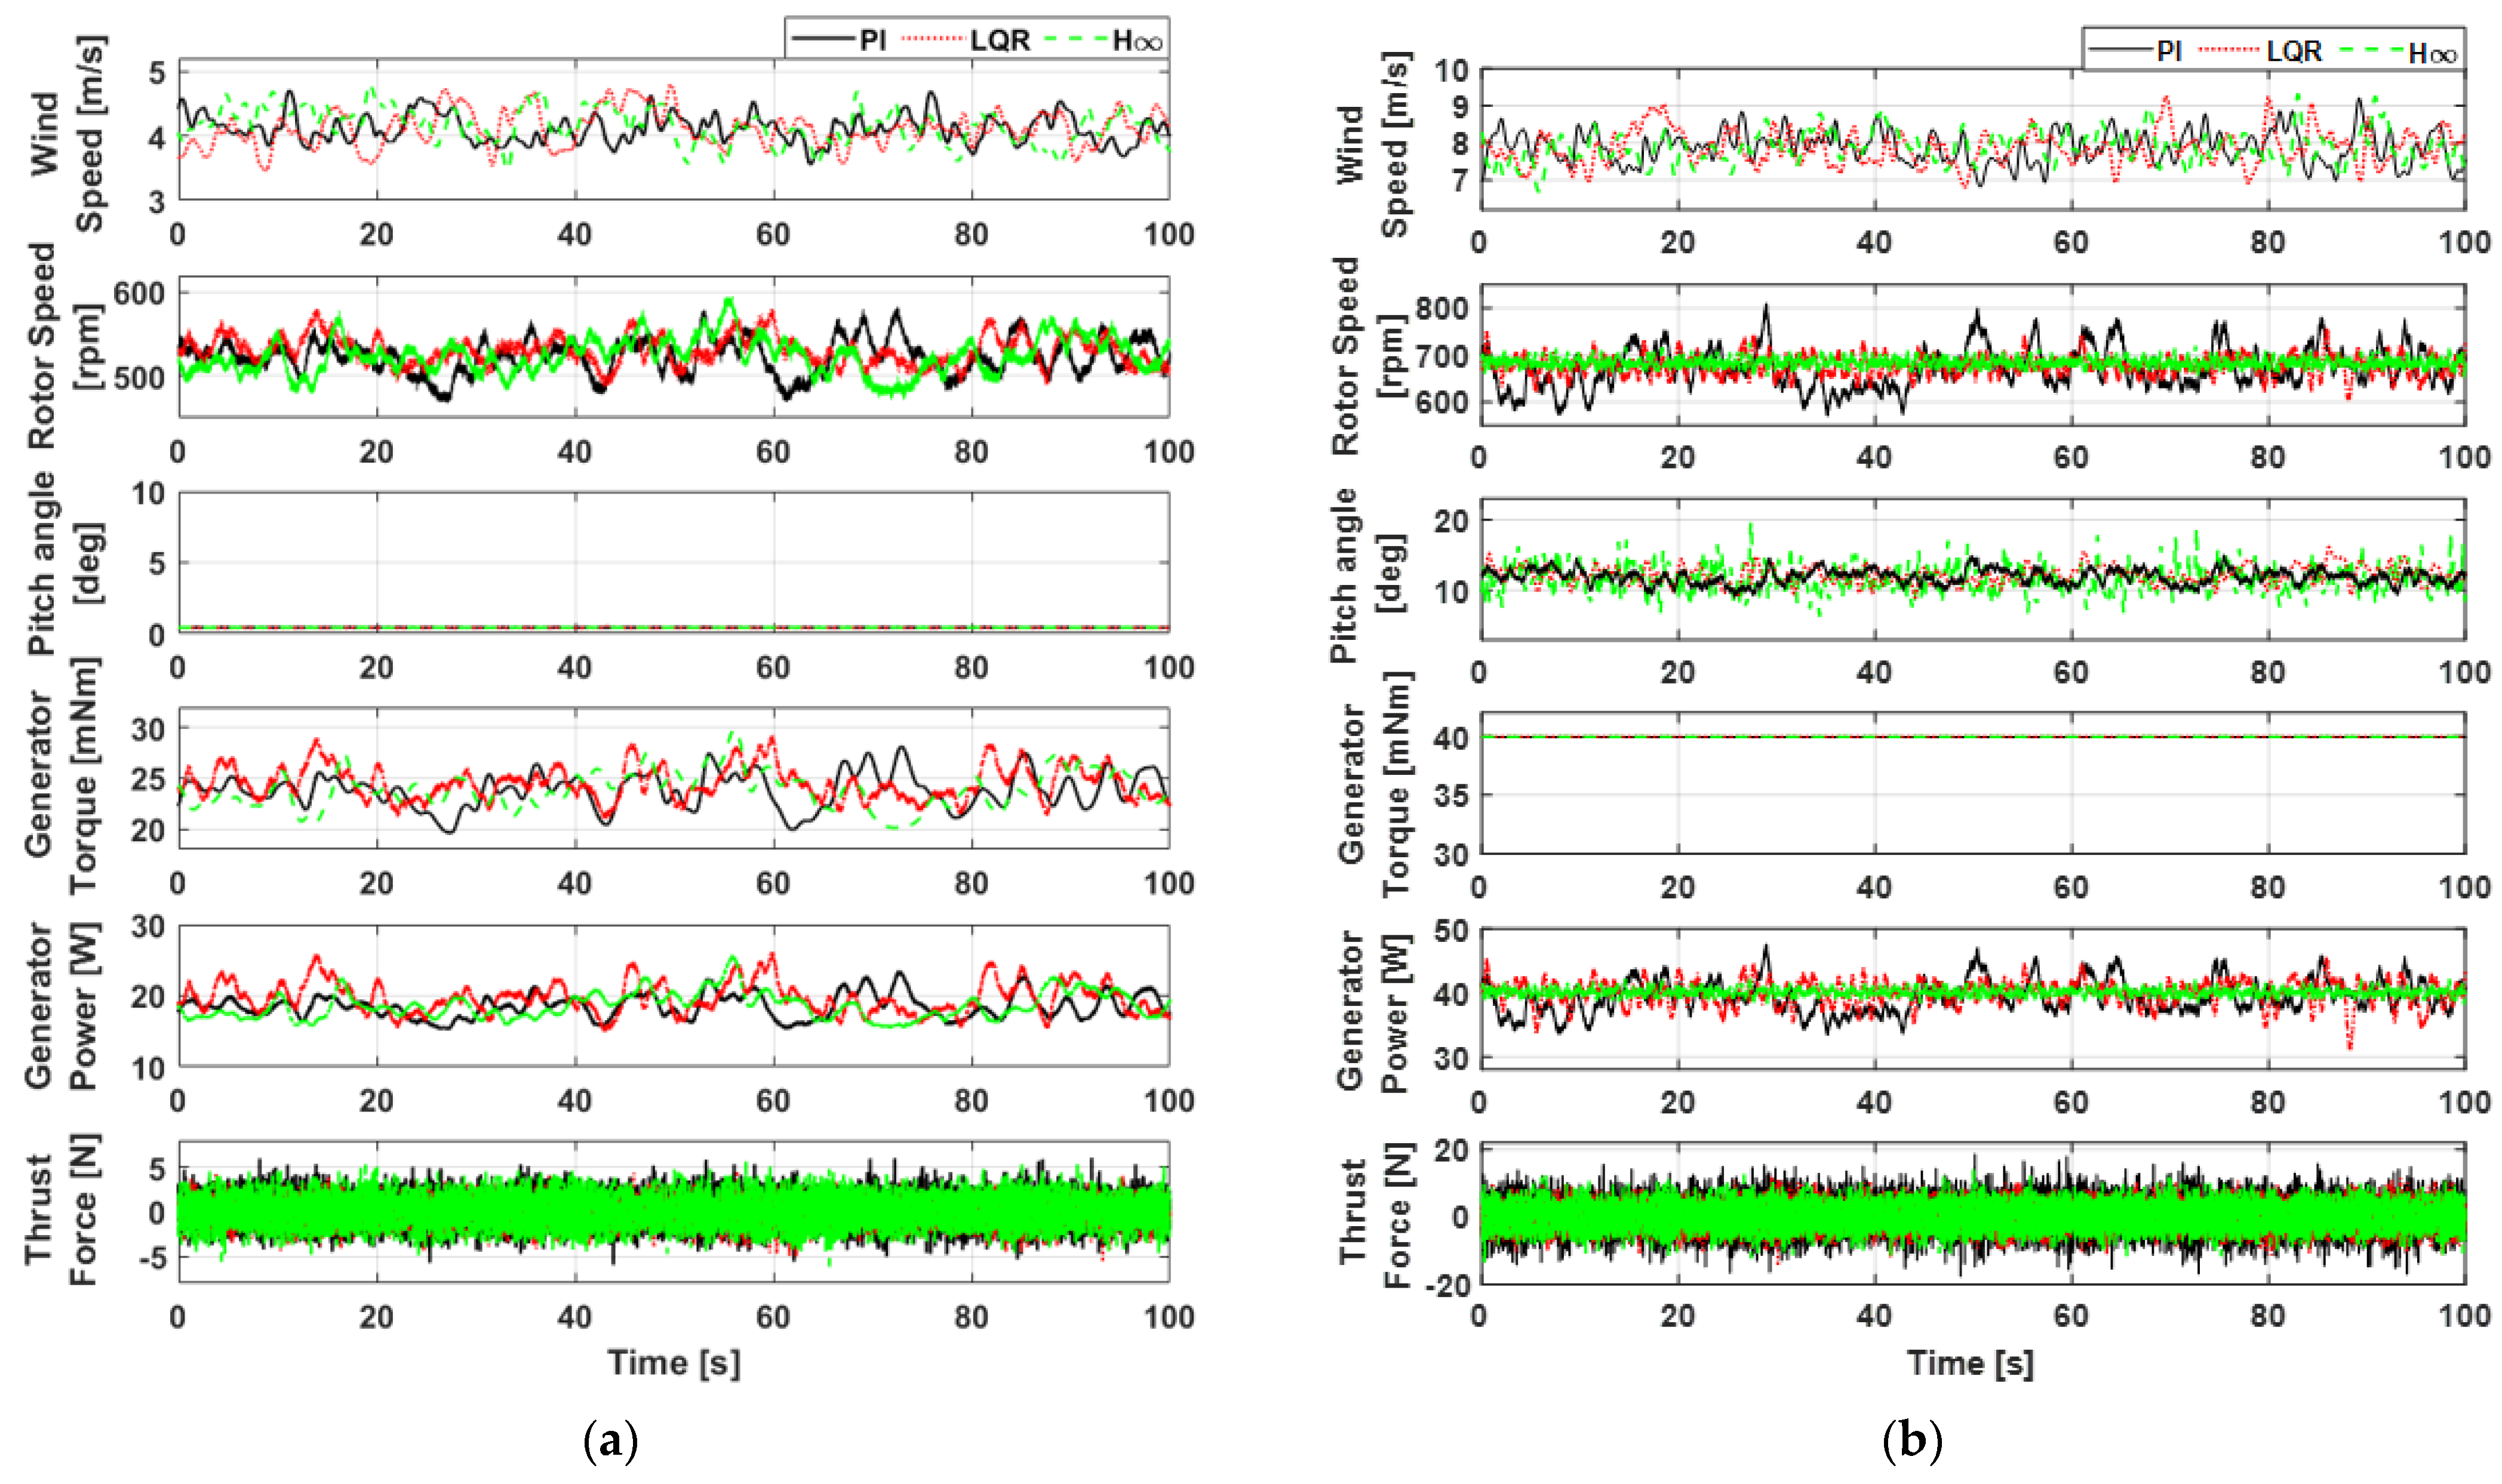
4.1. Dynamic Simulations

In order to validate results, the proposed H -fuzzy controller was implemented for the target 40 W wind turbine, and dynamic simulations were performed using Bladed. Also, the results were compared with the results of two different control algorithms, including the PI controller using reference bias control and the LQR based on fuzzy logic controller [20,23]. To account for uncertainty and nonlinearity effects, Gaussian sensor noise was applied to generator speed, generator torque, generator power, and blade pitch angle, respectively.
Figure 5 shows time series data for the dynamic simulation results to which Gaussian sensor noise is applied. In order to consider the non-linear effect of a control system on wind speed over a wide range, dynamic simulation was performed for 100 s under wind conditions with turbulence intensity of about 10% and mean wind speeds of 4 m/s and 8 m/s.
As shown in Figure 5a, the three controllers showed almost the same control operation impact. This is because the control gains and weights were tuned in such a way that all three controllers commonly prioritized maximum power point tracking (MPPT) control in regions where the wind speed is lower than the rated wind speed (i.e., in this region, all the kinetic energy of the wind turbine should be used for power production.). In addition, a thrust transient occurred during significant wind speed changes at approximately 48 s and 82 s, revealing differences in the responses of the three controllers. While both the LQR controller and the H controller assigned a high weight to the torque state variable to prioritize MPPT torque control, it was observed that they still utilized nacelle acceleration state variables and fuzzy control to stabilize the rotor thrust force. Consequently, this led to a reduction in the thrust transient. Also, in the case of pitch control, all three controllers maintained a fine-pitch angle capable of producing maximum power. In contrast, the difference in motion between the three controllers is more pronounced, as shown in Figure 5b. Since this operating region is one where the wind speed is higher than the rated wind speed, the generator torque is controlled to be maintained at the rated torque via reference bias control. In addition, the pitch angle maintains the rotor speed and power at a rated value, even when the wind speed changes (i.e., it is free from the MPPT set point), and the remaining kinetic energy can be used to reduce the fluctuation of the rotor speed or the fatigue load. As a result, compared to PI controllers that simply control rotor speed, the LQR and H controllers that modulate multiple state variables was able to reduce the fluctuation of the rotor speed, power, and thrust load. In addition, it was found that the H controller with loop shaping applied in the frequency domain could further improve the control performance compared to the LQR controller by utilizing pitch control to a greater extent.
In this study, the performance indicators for confirming control performance were selected as the mean and standard deviation of the rotor speed, power, a rain flow cycle counting-based damage equivalent load (DEL) of thrust load. The reason for these choices is that each controller’s set-point follow-up performance, toughness performance, and load reduction performance can be directly checked. Table 2 shows quantitative data for the comparison of control performance in Figure 5. In regions where the wind speed is lower than the rated wind speed, the performance of the three controllers was similar because they frequently applied the strategy of maximizing power production (i.e., MPPT control). When compared to PI controllers, the mean power differences for the LQR and H controllers were 0.09% and −0.01%, respectively, while the fatigue load reductions were −2.93% and −3.23%, respectively. In regions with a wind speed higher than the rated wind speed compared to the PI controller, the rotor speed deviations of the LQR and H controllers were reduced by 45.34% and 62.31%, respectively. Similarly, the power deviations were reduced by −52.81% and −60.32%, respectively. Additionally, the fatigue loads were reduced by −13.22% and −14.04%.

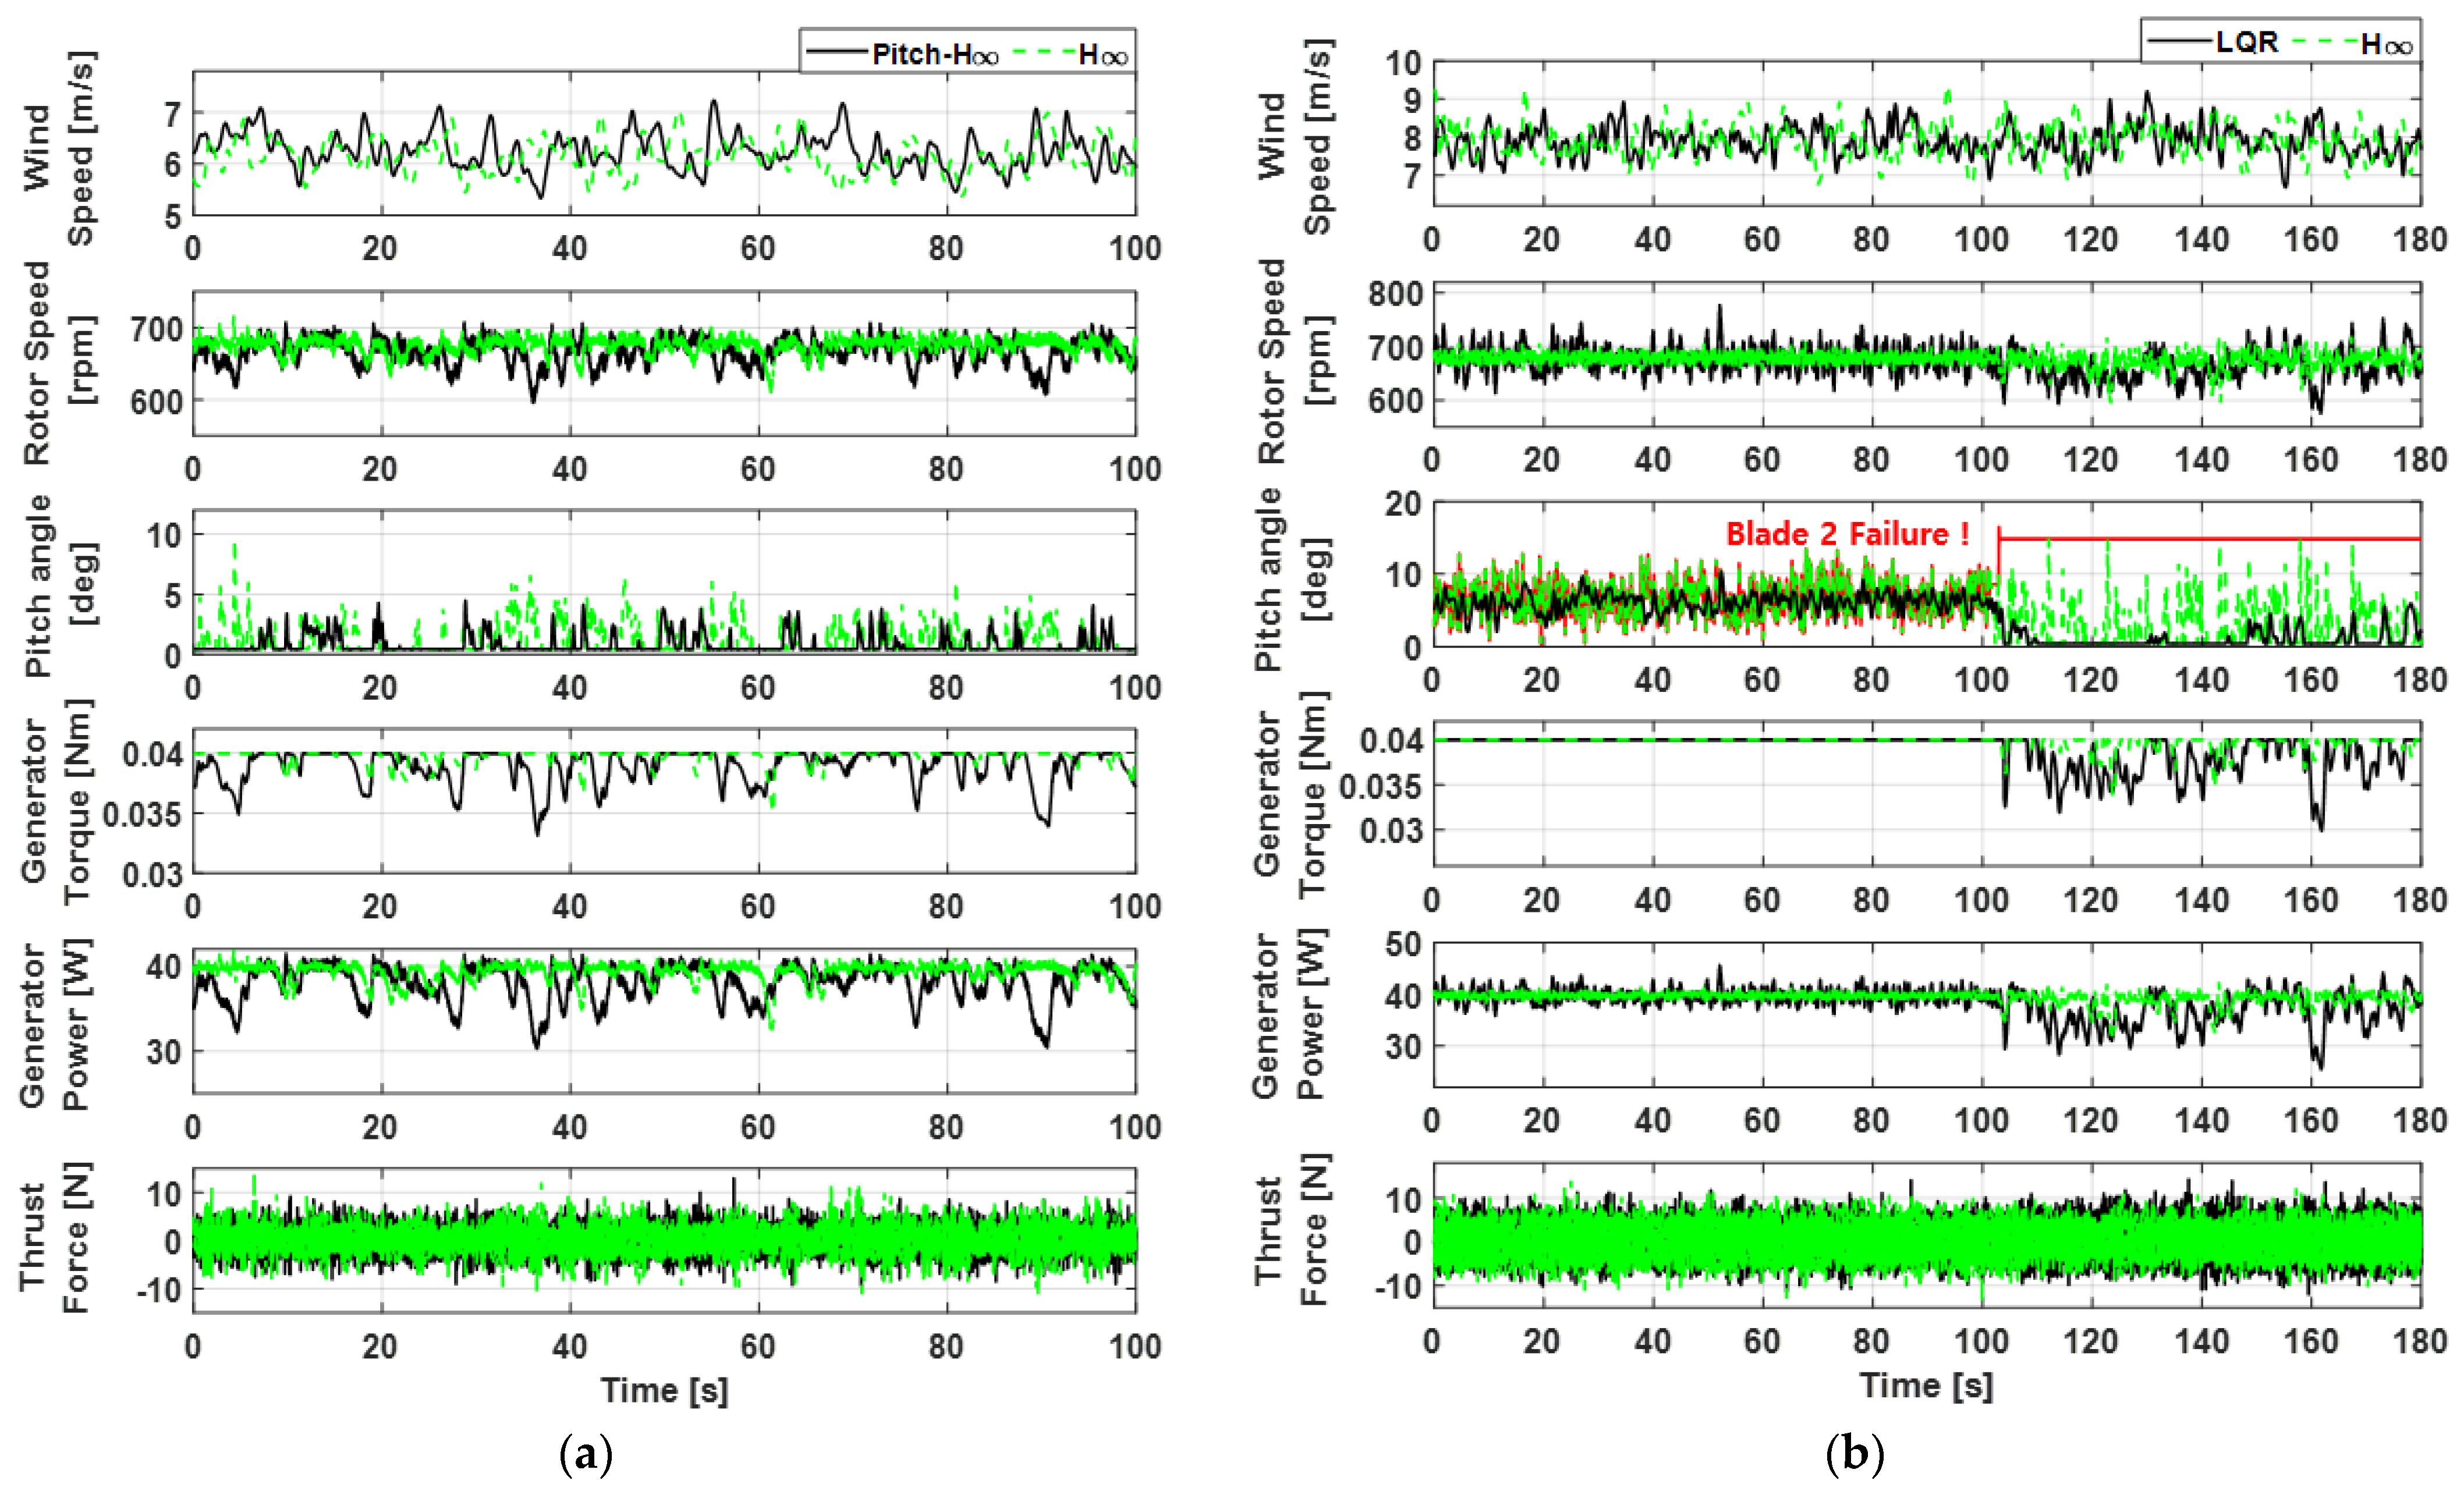
4.2. Wind Tunnel Experiments
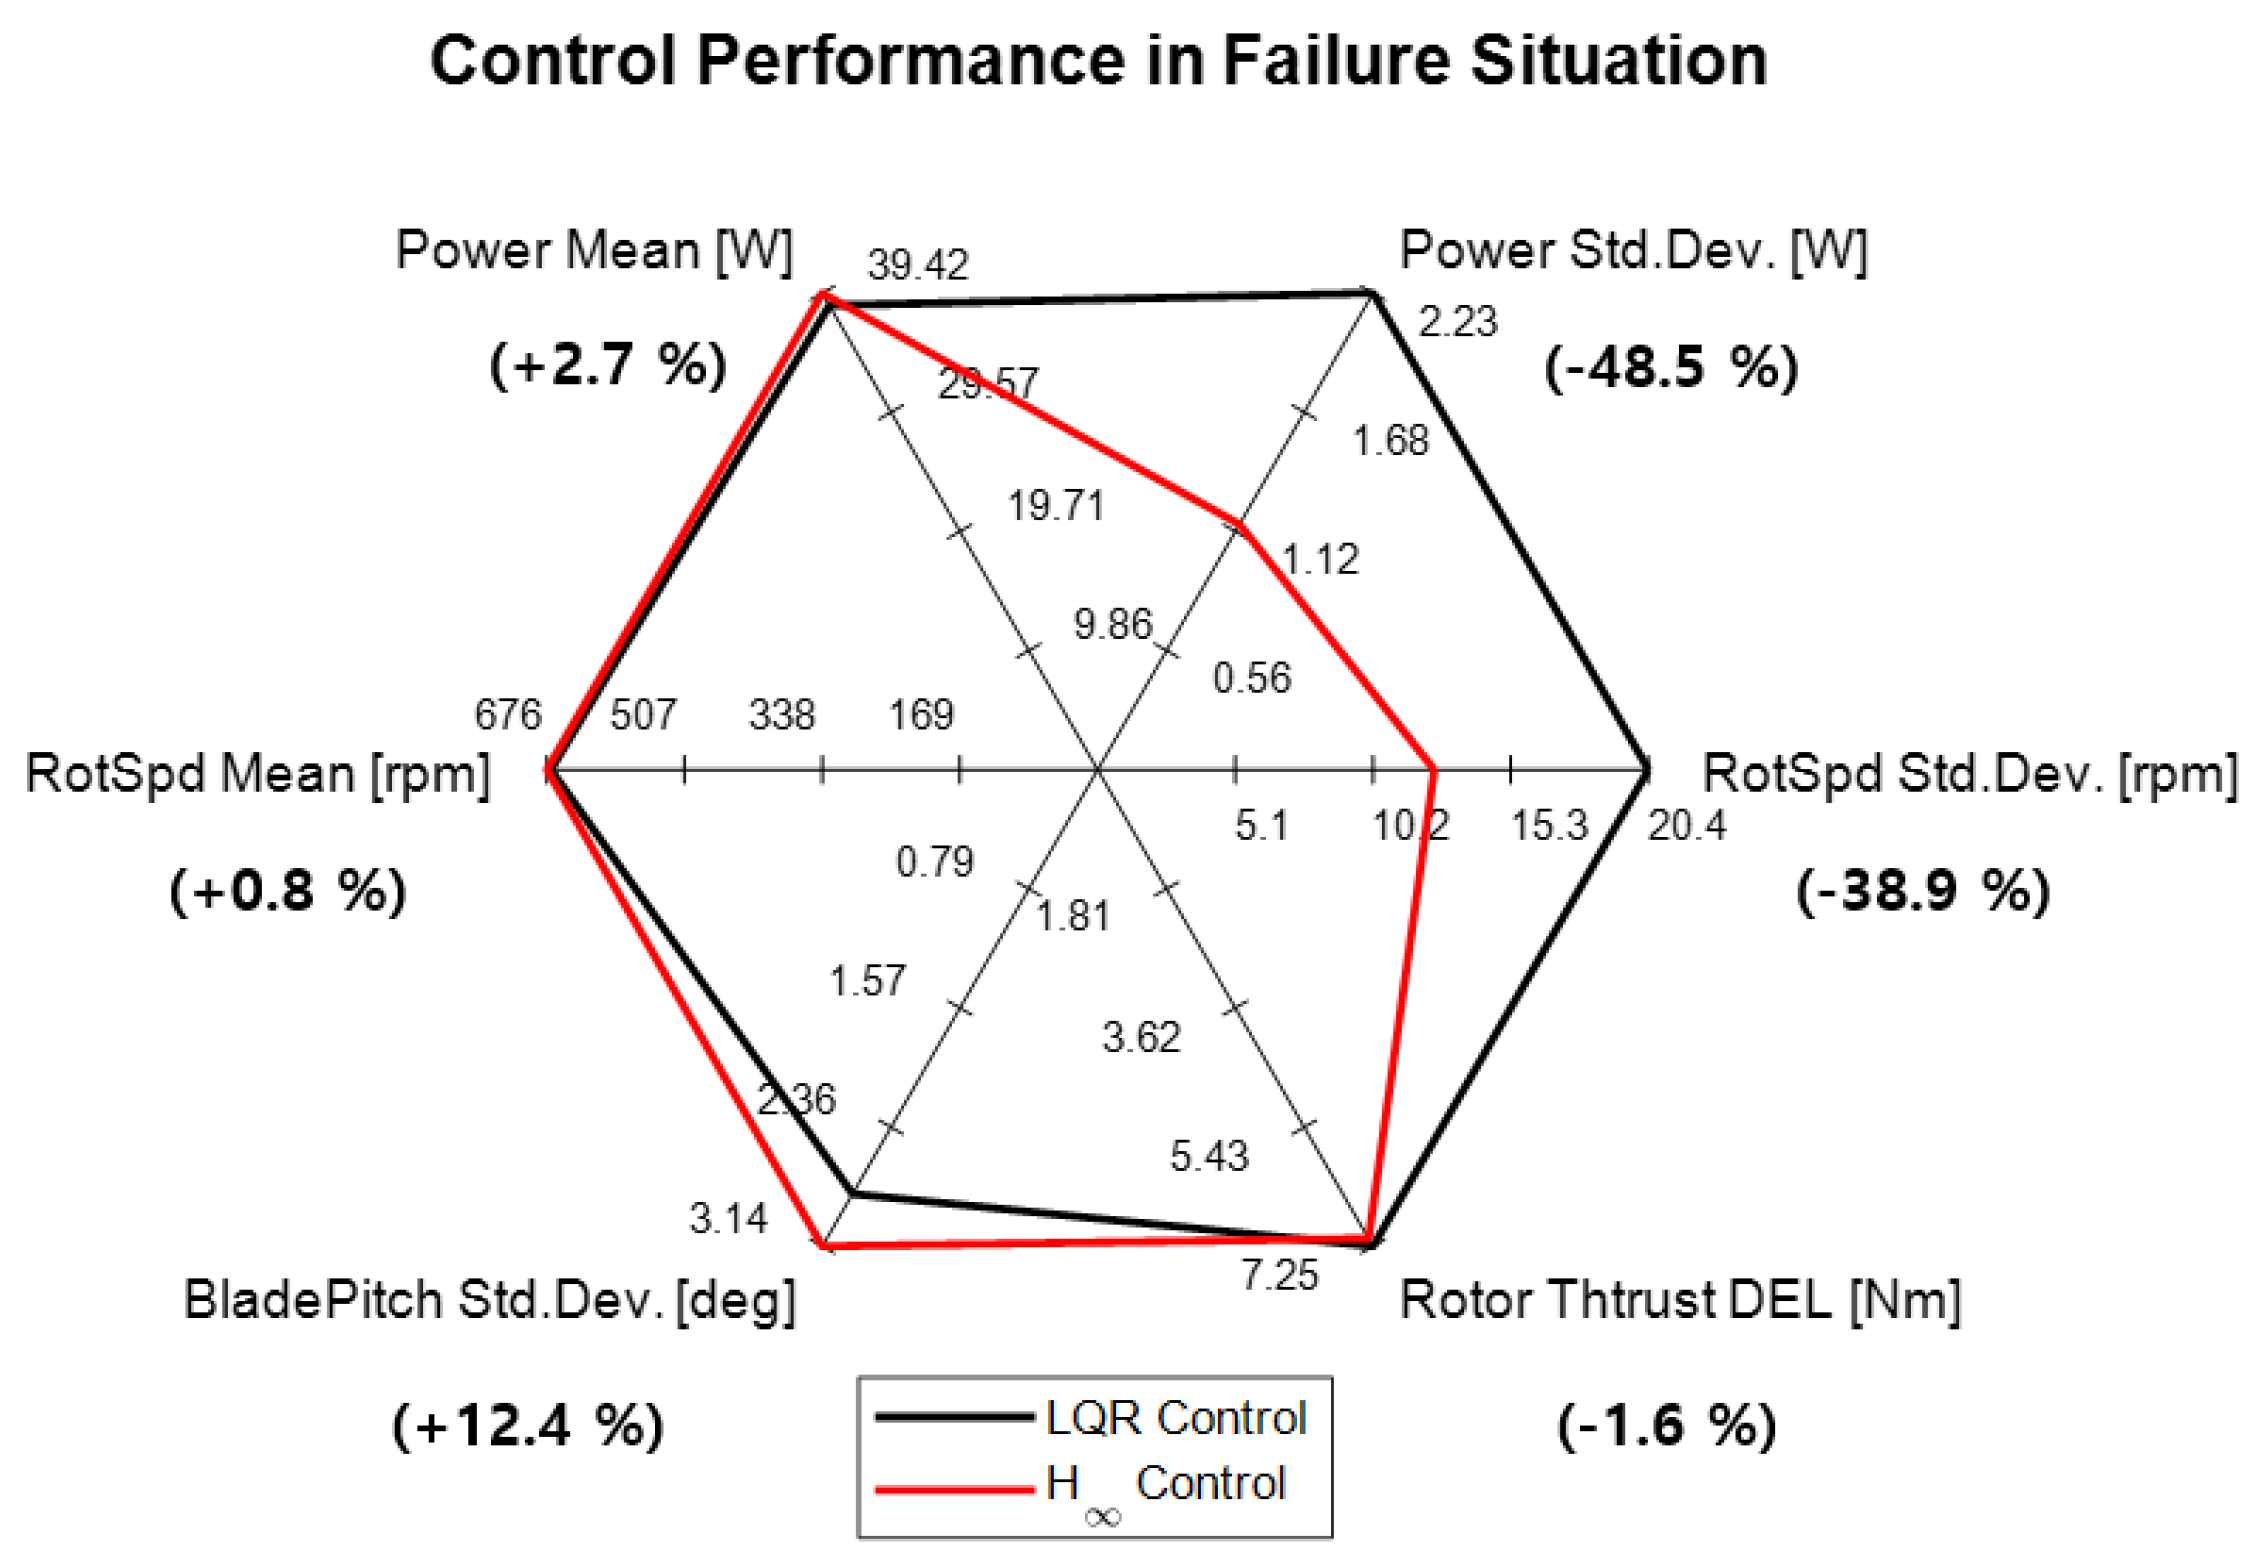
To validate the performance of the proposed H controller, a wind tunnel test was performed at a large wind tunnel test center in Jeollanam-do, Republic of Korea (length × width × height: 40 × 12 × 2.5 m). Figure 6 shows the view of the target wind turbine and the overall configuration of the wind tunnel facility. The turbulence intensity in the wind tunnel test was about 10%, which is the maximum achievable in the wind tunnels using wedges and bar structures. The PI, LQR, and H controllers were tested under the same wind conditions as those used in dynamic simulation (i.e., mean 4.0 m/s and mean 8.0 m/s). The target-scaled wind turbine was controlled using Bachmann’s programmable logic controller (PLC), where the proposed control algorithms were implemented. In addition, a nacelle accelerometer was installed to measure acceleration at the nacelle and estimate the thrust force. The signal from the accelerometer was sampled and acquired using a data-acquisition board. The pitch system of the target wind turbine was designed to enable individual pitch control (IPC) using three pitch motors individually whenever needed.
Figure 7 shows time series data from wind tunnel experiment results performed for 100 s. Like the dynamic simulation results, the PI, LQR, and H controllers were applied to the controller, and each performance was compared. Unlike the simulation, electrical noise transmitted from the sensor was observed in the wind tunnel experiment data, and the turbulent wind for each experiment could not be the same. As such, there was a slight difference in the time series of wind data.
Figure 7a shows that the results of MPPT control by three different controllers in the below-rated wind speed region are similar to dynamic simulation results in overall operation. In addition, the blade pitch angles were maintained to be a fine-pitch angle with all three controllers, and the thrust force was slightly improved using LQR and H controllers. Similar to the results confirmed in the simulation results, Figure 7b clearly shows the performance differences between the three controllers in the above-rated wind speed region. The results showed that, when using LQR and H controllers on the data of the rotor speed, power, and thrust, both regulating and load reduction performance were improved compared with those of PI controllers. Additionally, the proposed H controllers showed the best-regulating performance while reducing the load. The generator torque was well maintained at the fixed rated value for all three controllers.
Table 3 shows the quantitative values of control performances obtained in the wind tunnel experiments shown in Figure 7. Like the simulation results shown in Table 1, the performances of the three controllers obtained in the wind tunnel experiments were also similar in the region where the wind speed was lower than the rated wind speed (below-rated region). Compared with the PI controllers, the mean power differences of LQR and H controllers were 0.90% and −1.03%, respectively, while fatigue load reductions were −5.25% and −5.46%, respectively. In regions with a higher wind speed than the rated wind speed, the rotor speed deviation of the LQR and H controllers was decreased by 29.39% and 57.58%, respectively, compared with the result obtained using the PI controller. Similarly, the power deviation was reduced by −31.60% and −53.49%, respectively, and the fatigue loads were decreased by −19.58% and −21.48%.

5. Discussion

In order to further validate the performance of the proposed controllers, two additional experiments were performed. One compared the performances of the proposed H -fuzzy controller and the pitch H controller in the previous study [17]. The sought to demonstrate the performance of the proposed controller under special conditions, such as during the pitch actuator failure of one blade. The difference between the proposed H -fuzzy controller and the pitch H controller discussed in the previous study lies in the scope of application of the H controller. The pitch- H   o n l y contributes pitch control. Conversely, the proposed H -fuzzy H control theory is applied to both blade pitch and torque control, but also helps to improve both uncertainty and non-linear characteristics using fuzzy logic. Therefore, in order to assess the operation of pitch control and torque control together, an additional wind tunnel experiment was conducted to compare the two controller operations in the rated wind speed region. Also, wind tunnel experiments were conducted on the failure condition of the blade pitch actuator of one-blade failure situations in order to assess the expectation that the proposed H   controller would have excellent regulating and robustness performances compared to previously studied fuzzy logic-based LQR controllers [20].
Figure 8 shows the results of wind tunnel experiments for further validation of the performance of the proposed H   control algorithm. As shown in Figure 8a, these procedures involve pitch and torque control being alternately turned on in the rated wind speed region, resulting in a transient response occurring frequently. This can be seen through frequent intersections of pitch and torque control strategies and a partial increase in vibration peaks of thrust. These features were observed in both controllers. However, it was confirmed that the proposed control algorithm showed better regulating performance compared with the pitch- H   control algorithm. The power output increased due to the decrease in transient response in torque control, and this robust performance had the potential lead to an increase in the annual energy production (AEP) of a turbine in the rated wind speed region. As shown in Figure 8b, a failure situation in which the pitch actuator of one blade (named the second blade) becomes out of control at about 105 s was applied to both controllers, and this scenario is represented by a straight red line. As a case requiring the use of pitch control, the experiment was conducted in the region where the wind speed was higher than the rated wind speed. Prior to the pitch actuator failure, the H   controller had superior regulating performance compared to the LQR controller, but the load reduction performances were similar for the two controllers. After the pitch actuator failure of one blade, however, the power-regulating performance of the LQR controller dropped, while the regulating performance of the H   controller was maintained as if no failure happened. As a result, the thrust force was also reduced.
To quantitatively compare the control performance of the proposed controller with the LQR controller for the blade failure situation in Figure 8b, the performances of both controllers are presented in Figure 9 as a spider plot. While LQR control did not reduce the standard deviation of the power and rotor speed in the blade failure situation, the proposed H control reduced the standard deviation of those by 48.5% and 38.9%, respectively. Also, the thrust load of the rotor was reduced by 1.6% using the H controller. However, the standard deviation of the blade pitch angle was increased by about 12.4% as a trade-off with the H controller, resulting in blade pitching with larger angles. As a result, the average power with the H controller was higher than that with the LQR controller by 2.7%. This clearly shows that the proposed H controller can cope with unexpected failure situations, such as blade failure, more effectively than the LQR controller (i.e., in terms of robustness).

6. Conclusions

In this study, an H -fuzzy control algorithm was proposed in order to control wind turbines for the purpose of considering their uncertainties and nonlinearities. In order to validate the performance of the proposed controller via simulation and experimentation, a 40 W wind turbine capable of wind tunnel testing was used as a control target.
Using a commercial aero-elastic code known as Bladed, the performances of the conventional PI, LQR controllers and the proposed H   controllers were compared in two turbulent wind conditions in an environment reflective of perturbation and sensor noise effects. The simulation showed that the rotor speed deviation was reduced by 31.0%. Additionally, the power deviation was reduced by 15.9%, compared with the LQR-fuzzy control algorithm, which had better performance than the conventional PI. To validate the performance of the control algorithm in more real situations, the target wind turbine was applied to wind tunnel experiments. As a result, the rotor speed deviation and power deviation were reduced by 39.9% and 32.0%, respectively, and the fatigue load based on the thrust force was reduced by 2.4% compared with the LQR fuzzy control algorithm.
Through additional control performance validation, it was confirmed that the proposed H -fuzzy control algorithm reduced the transient response in the rated wind speed region compared with the previously studied pitch- H control algorithm. In addition, through experiments on the blade pitch actuator failure situation of one blade, the proposed H -fuzzy control algorithm showed its improved robustness and adaptation compared with the LQR fuzzy control algorithm, and the regulating performance and load reduction performance were well maintained. In conclusion, H -fuzzy study can be used to improve the robustness and adaptation of the control systems of wind turbines having uncertainties and nonlinearities.
In this study, a wind tunnel test using a wind turbine scaled model was conducted to experimentally validate the performance of the proposed control algorithm. Future research should subject the proposed control algorithm to additional field tests in order to validate the control performance in the actual wind turbine operation situation. In addition, the study will be conducted on the application of the proposed control algorithms in floating wind turbines with higher potential nonlinearity and uncertainty effects, e.g., assessing hydrodynamics in terms of waves and currents effects.

Author Contributions

Conceptualization, T.J. and Y.S.; methodology, T.J.; software, T.J.; supervision, I.P.; validation, T.J. and Y.S.; writing—original draft preparation, T.J. and Y.S.; writing—review and editing, I.P. All authors have read and agreed to the published version of the manuscript.

Funding

This work was supported by the Korea Institute of Energy Technology Evaluation and Planning (KETEP) and the Ministry of Trade, Industry and Energy (MOTIE) of the Republic of Korea (No. 20203030020270).

Institutional Review Board Statement

Not applicable.

Informed Consent Statement

Not applicable.

Data Availability Statement

Not applicable.

Conflicts of Interest

The authors declare no conflict of interest.

Nomenclature

x State vector
y Output vector
u Input vector
A System matrix
B   Input matrix
C   Output matrix
D   Direct transmission matrix
T a Aerodynamic torque
J t o t a l Total moment of inertia
Ω r Rotor speed
N Gear ratio
T g Generator torque
T L o s s Mechanical loss torque
R Rotor radius
C P Power coefficient
λ Tip speed ratio
β Pitch angle
v Wind speed
w Disturbance input
z Performance signal
γ Performance level
W Weight function
P Augmented plant
G Nominal form of augmented plant
S Sensitivity function
K Controller
T Complementary sensitivity function
μ Membership function for nonlinearity
u s u b o p t Sub-optimized H   control command
κ Membership function for uncertainty
Ζ System decision variable
Ω g Generator speed
β   c Pitch angle command
T   g c Generator torque command

Appendix A. Linearization Model

In Section 3, information about state vectors, output vectors, and input vectors presented at the subscripts of Equations (1) and (2) is shown in Table A1.
The settings for performing the Bladed simulation were applied as follows.
To calculate the aerodynamics, ‘Glauert Momentum theory’ and ‘Pitt and Peters dynamic wake’ models were used, but the ‘Skew wake correction model’ and ‘Dynamic stand model’ were ignored to prevent the state vector from becoming larger than necessary in the linearization model. To calculate structural modes, four structural modes of the blade and six structural modes of the tower were applied. Since the rated rotor speed of the target wind turbine model was at a high speed of 678 rpm, the blade was applied as a single part, not as a multi-part component, for flexibility. The control sampling time was applied at 250 Hz (0.004 s step) in order to match the operating conditions of the Bachmann PLC used to control the target wind turbine model in the wind tunnel experiment. For reference, the results of the frequency response function in Figure 1 show the linearization model through the ‘Bode’ function of MATLAB/Simulink and demonstrate the results of applying all polar data (i.e., eigenvalue information of 47 by 47 state matrix).
Table A1. Linearization model information in the form of state space.
State   Vector   x Output   Vector   y
1. Tower mode 1 displacement25. Blade 2 mode 1 displacement1. Rotor speed
2. Tower mode 1 velocity26. Blade 2 mode 1 velocity2. Blade 1 pitch angle
3. Tower mode 2 displacement27. Blade 2 mode 2 displacement3. Blade 2 pitch angle
4. Tower mode 2 velocity28. Blade 2 mode 2 velocity4. Blade 3 pitch angle
5. Tower mode 3 displacement29. Blade 2 mode 3 displacement5. Generator speed
6. Tower mode 3 velocity30. Blade 2 mode 3 velocity6. Generator torque
7. Tower mode 4 displacement31. Blade 2 mode 4 displacement7. Nacelle fore-aft acceleration
8. Tower mode 4 velocity32. Blade 2 mode 4 velocity8. Nacelle nod acceleration
9. Tower mode 5 displacement33. Blade 3 mode 1 displacement9. Rotor azimuth angle
10. Tower mode 5 velocity34. Blade 3 mode 1 velocity10. Blade 1 Mx
11. Tower mode 6 displacement35. Blade 3 mode 2 displacement11. Blade 1 My
12. Tower mode 6 velocity36. Blade 3 mode 2 velocity12. Blade 1 Mz
13. Rotor rigid body displacement37. Blade 3 mode 3 displacement13. Tower Mx
14. Rotor rigid body velocity38. Blade 3 mode 3 velocity14. Tower My
15. Low-speed Shaft displacement39. Blade 3 mode 4 displacement
16. Low-speed Shaft velocity40. Blade 3 mode 4 velocity
17. Blade 1 mode 1 displacement41. Generator electrical torque
18. Blade 1 mode 1 velocity42. Blade 1 actuator Position response 1Input Vector  u
19. Blade 1 mode 2 displacement43. Blade 1 actuator Position response 21. wind speed
20. Blade 1 mode 2 velocity44. Blade 2 actuator Position response 12. pitch angle demand
21. Blade 1 mode 3 displacement45. Blade 2 actuator Position response 23. generator torque demand
22. Blade 1 mode 3 velocity46. Blade 3 actuator Position response 1
23. Blade 1 mode 4 displacement47. Blade 3 actuator Position response 2
24. Blade 1 mode 4 velocity

Appendix B. Membership Functions and Fuzzy Rules
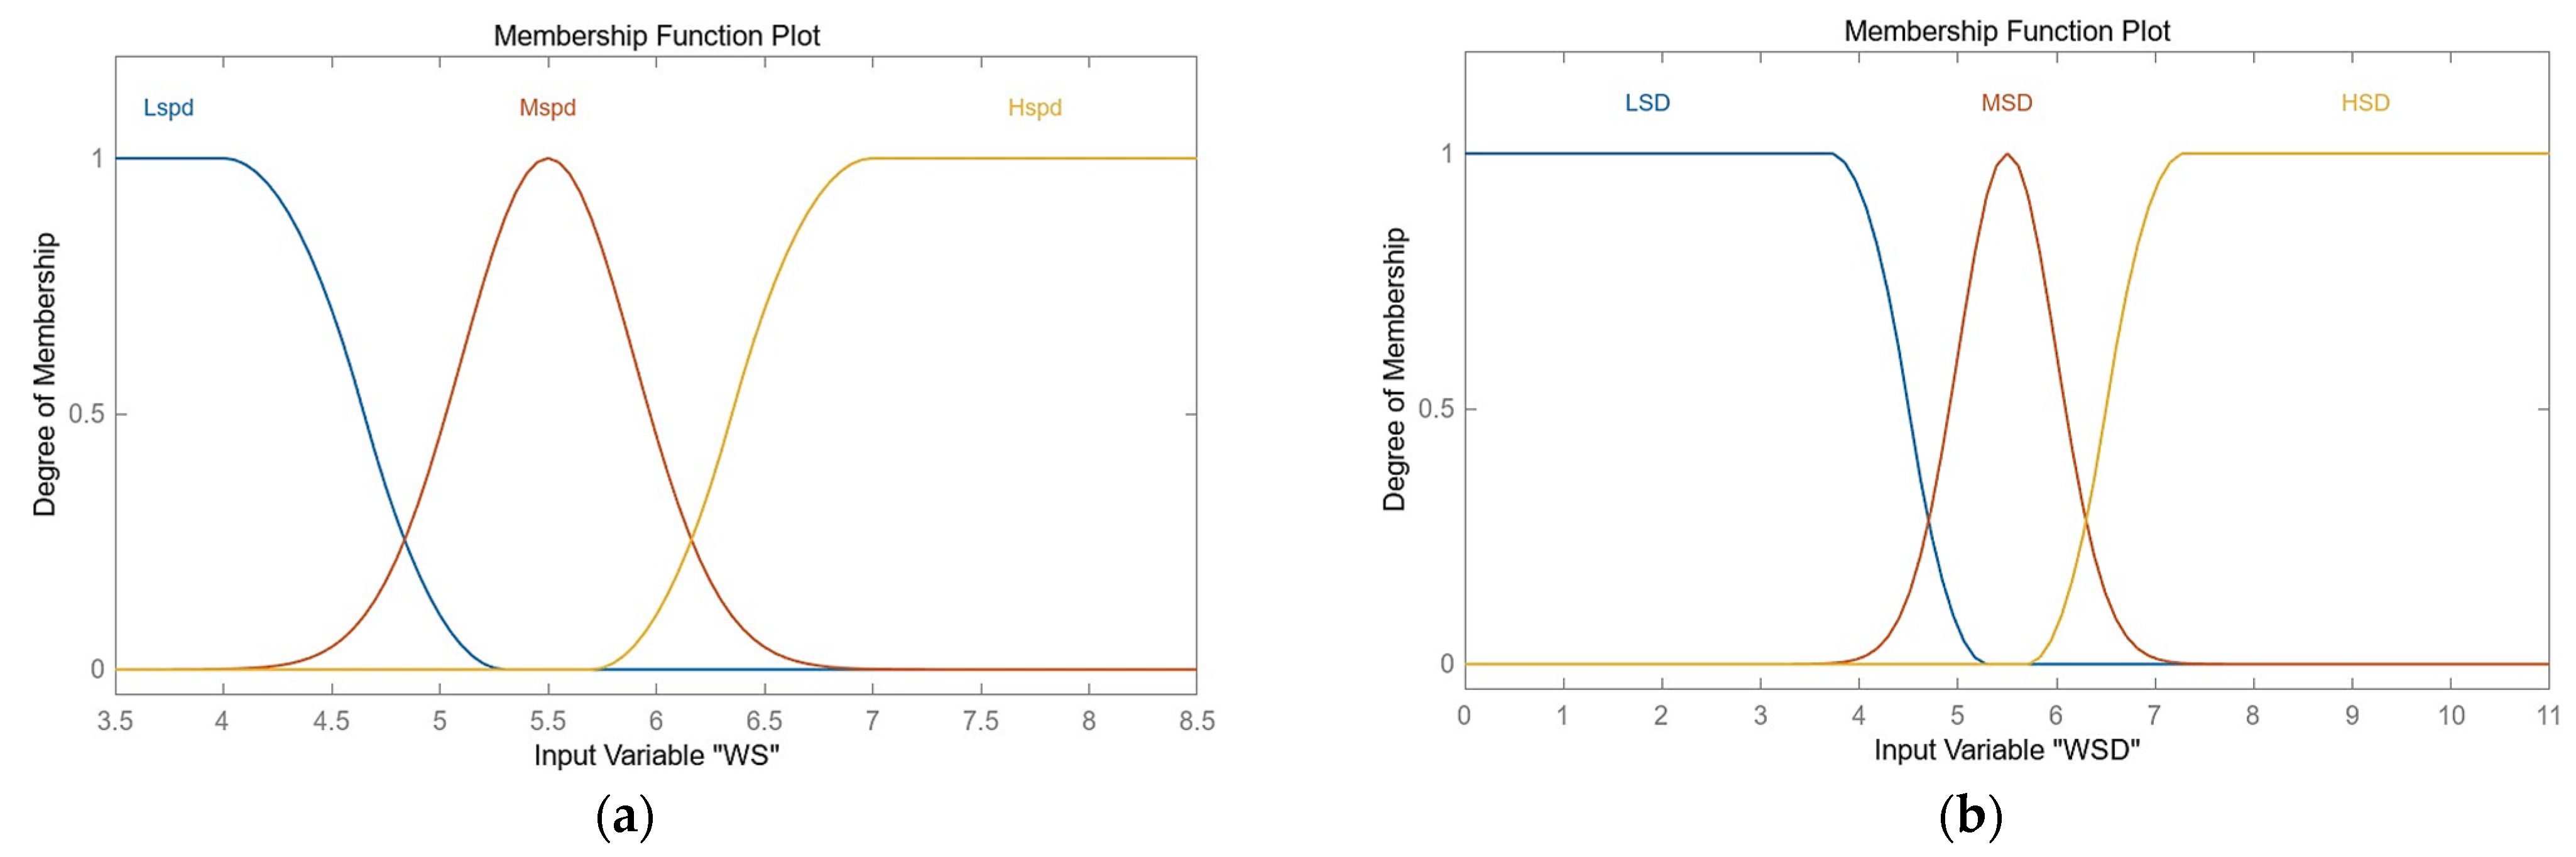
In Section 3, the membership functions designed using MATLAB’s fuzzy logic toolbox are shown in Figure A1. Figure A1 represents a membership function for wind speed (WS). In the proposed control algorithm, there were three membership functions (Lspd, Mspd, and Hsp) because the non-linear system was represented by three sub-systems for the wind speeds lower than the rated wind speed (WS < 5.5 m/s), the rated wind speed (WS = 5.5 m/s), and wind speeds higher than the rated wind speed (WS > 5.5 m/s). As can be seen from Table 1, the interpolation range of the input wind speed of the membership function was selected as a range between the cut-in speed (3 m/s) and the cut-out speed (9 m/s), which are the operating regions of the target wind turbine. Figure A1b represents the membership function for wind speed derivative (WSD). The values (LSD, MSD, and HSD) of this membership function were selected as trial errors through simulation based on the change (about 0~12%) in turbulence intensity. Since the turbulence strength that could be implemented in the wind tunnel experiment was around 10%, the interpolation range of the input wind speed rate was selected within the corresponding range of about 12   m / s 2 . The fuzzy rules for the three sub-systems for each wind speed region and the fuzzy rules for the wind speed derivative are shown in Table A2.
Figure A1. Membership functions of H -fuzzy controller (a) for wind speed; (b) for wind speed derivatives.
Applsci 13 11930 g0a1
Table A2. Fuzzy rules of H -fuzzy controller. μ i : (H, MH, M, LM, L = 1, 0.6667, 0.5, 0.3333, 0), κ : (H, M, L = 1, 0.5, 0).
v μ 1 μ 2 μ 3 κ
v ˙ LspdMspdHspdLspdMspdHspdLspdMspdHspdLspdMspdHspd
LSDHLMLLMHLMLLMHLLL
MSDHMLMHMLMHMMM
HSDHMHLMHHMHLMHHHHH

References

  1. Global Wind Energy Council. GWEC Global Wind Report 2019; Global Wind Energy Council: Bonn, Germany, 2017. [Google Scholar]
  2. Hurtado, J.P.; Fernández, J.; Parrondo, J.L.; Blanco, E. Spanish method of visual impact evaluation in wind farms. Renew. Sustain. Energy Rev. 2004, 8, 483–491. [Google Scholar] [CrossRef]
  3. Guo, J.; Lu, S.; Zhai, C.; He, Q. Automatic bearing fault diagnosis of permanent magnet synchronous generators in wind turbines subjected to noise interference. Meas. Sci. Technol. 2018, 29, 025002. [Google Scholar] [CrossRef]
  4. Elia, A.; Taylor, M.; Gallachóir, B.Ó.; Rogan, F. Wind turbine cost reduction: A detailed bottom-up analysis of innovation drivers. Energy Policy 2020, 147, 111912. [Google Scholar] [CrossRef]
  5. Rajgor, G. Vestas targets German wind market with ‘world’s tallest onshore tower’. Wind. Mon. 2022. [Google Scholar]
  6. Dolan, D.S.; Lehn, P.W. Simulation model of wind turbine 3p torque oscillations due to wind shear and tower shadow. IEEE Trans. Energy Convers. 2006, 21, 717–724. [Google Scholar] [CrossRef]
  7. Shen, X.; Zhu, X.; Du, Z. Wind turbine aerodynamics and loads control in wind shear flow. Energy 2011, 36, 1424–1434. [Google Scholar] [CrossRef]
  8. Bossanyi, E.A. The design of closed loop controllers for wind turbines. Wind Energy 2000, 3, 149–163. [Google Scholar] [CrossRef]
  9. Nam, Y. Wind Turbine System Control, 1st ed.; GS Intervision: Seoul, Republic of Korea, 2013. [Google Scholar]
  10. Do, M.H.; Söffker, D. Wind turbine robust disturbance accommodating control using non-smooth H∞ optimization. Wind Energy 2022, 25, 107–124. [Google Scholar] [CrossRef]
  11. Turksoy, O.; Ayasun, S.; Hames, Y.; Sönmez, Ş. Computation of robust PI-based pitch controller parameters for large wind turbines. Can. J. Electr. Comput. Eng. 2019, 43, 57–63. [Google Scholar] [CrossRef]
  12. Hawari, Q.; Kim, T.; Ward, C.; Fleming, J. A robust gain scheduling method for a PI collective pitch controller of multi-MW onshore wind turbines. Renew. Energy 2022, 192, 443–455. [Google Scholar] [CrossRef]
  13. Beltran, B.; Ahmed-Ali, T.; Benbouzid, M.E.H. High-order sliding-mode control of variable-speed wind turbines. IEEE Trans. Ind. Electron. 2008, 56, 3314–3321. [Google Scholar] [CrossRef]
  14. De Corcuera, A.D.; Pujana-Arrese, A.; Ezquerra, J.M.; Segurola, E.; Landaluze, J. H∞ based control for load mitigation in wind turbines. Energies 2012, 5, 938–967. [Google Scholar] [CrossRef]
  15. Moradi, H.; Vossoughi, G. Robust control of the variable speed wind turbines in the presence of uncertainties: A comparison between H∞ and PID controllers. Energy 2015, 90, 1508–1521. [Google Scholar] [CrossRef]
  16. Pourseif, T.; Atuwwo, T.; Doniqi, S.A.; Andani, M.T.; Yousefpour, K.; Pourgharibshahi, H.; Ramezani, Z. Design of H-infinity controller for wind turbine in the cold weather conditions. In Proceedings of the 2018 Clemson University Power Systems Conference (PSC), Charleston, SC, USA, 4–7 September 2018; pp. 1–6. [Google Scholar]
  17. Song, Y.; Jeon, T.; Paek, I.; Dugarjav, B. Design and Validation of Pitch H-Infinity Controller for a Large Wind Turbine. Energies 2022, 15, 8763. [Google Scholar] [CrossRef]
  18. Kharrat, M.; Abderrahim, S.; Allouche, M. Robust H2-Optimal TS Fuzzy Controller Design for a Wind Energy Conversion System. Adv. Mater. Sci. Eng. 2022, 2022, 5428109. [Google Scholar] [CrossRef]
  19. Xu, B.; Yuan, Y.; Liu, H.; Jiang, P.; Gao, Z.; Shen, X.; Cai, X. A pitch angle controller based on novel fuzzy-PI control for wind turbine load reduction. Energies 2020, 13, 6086. [Google Scholar] [CrossRef]
  20. Jeon, T.; Paek, I. Design and verification of the LQR controller based on fuzzy logic for large wind turbine. Energies 2021, 14, 230. [Google Scholar] [CrossRef]
  21. Jeon, T.; Kim, D.; Song, Y.; Paek, I. Design and Validation of Demanded Power Point Tracking Control Algorithm for MIMO Controllers in Wind Turbines. Energies 2021, 14, 5818. [Google Scholar] [CrossRef]
  22. Jonkman, J.; Butterfield, S.; Musial, W.; Scott, G. Definition of a 5-MW Reference Wind Turbine for Offshore System Development; National Renewable Energy Lab. (NREL): Golden, CO, USA, 2009. [Google Scholar]
  23. Jeon, T.; Kim, D.; Paek, I. Improvements to and Experimental Validation of PI Controllers Using a Reference Bias Control Algorithm for Wind Turbines. Energies 2022, 15, 8298. [Google Scholar] [CrossRef]
  24. Bottasso, C.L.; Campagnolo, F.; Petrović, V. Wind tunnel testing of scaled wind turbine models: Beyond aerodynamics. J. Wind. Eng. Ind. Aerodyn. 2014, 127, 11–28. [Google Scholar] [CrossRef]
  25. Campagnolo, F.; Petrovic, V.; Nanos, E.M.; Tan, C.W.; Bottasso, C.L.; Paek, I.; Kim, H.; Kim, K. Wind tunnel testing of power maximization control strategies applied to a multi-turbine floating wind power platform. In Proceedings of the 26th International Ocean and Polar Engineering Conference, ISOPE-I-16-307, Rhodes, Greece, 26 June–1 July 2016. [Google Scholar]
  26. Van der Hooft, E.L.; van Engelen, T.G. Feed Forward Control of Estimated Wind Speed; ECN-C-03-137; Energy Research Contre of The Netherlands (ECN): Petten, The Netherlands, 2003.
  27. Gu, D.-W.; Petkov, P.; Konstantinov, M.M. Robust Control Design with MATLAB; Springer Science & Business Media: London, UK, 2005; ISBN 978-1-4471-4681-0. [Google Scholar]
  28. Skogestad, S.; Postlethwaite, I. Multivariable Feedback Control—Analysis and Design; Wiley: Hoboken, NJ, USA, 2005. [Google Scholar]
  29. Shahravanmehr, S.; Fakharian, A. LQG controller based on fuzzy logic to control the power of wind turbine. In Proceedings of the 2015 IEEE 10th Conference on Industrial Electronics and Applications (ICIEA), Auckland, New Zealand, 15–17 June 2015; IEEE: Auckland, New Zealand, 2015; pp. 1548–1553. [Google Scholar]
  30. Mathworks Incorporated; Wang, W. Fuzzy Logic Toolbox: For Use with MATLAB: User’s Guide; Mathworks Incorporated: The Natick Mall, MA, USA, 1998. [Google Scholar]
Figure 1. Frequency response function of torque and pitch loop gain at different wind speeds. The left-hand plot (a) shows the results in generator speed output for blade pitch angle control input. The right-hand plot (b) shows the results in generator speed output for generator torque control input.
Applsci 13 11930 g001
Figure 2. Block diagram of the closed-loop transfer function with an augmented plant using the mixed-sensitivity method.
Applsci 13 11930 g002
Figure 3. Block diagram of fuzzy inference algorithm for proposed H controller.
Applsci 13 11930 g003
Figure 4. Block diagram of the fuzzy inference-based H control algorithm.
Applsci 13 11930 g004
Figure 5. Results from simulations of the target wind turbine for the PI controller (black solid lines), the LQR controller (red dotted lines), and the H controller (green dashed lines). The left-hand plot (a) shows the results below the rated wind speed region (mean 4.0 m/s). The right-hand plot (b) shows the results for the above-rated wind speed region (mean 8.0 m/s).
Applsci 13 11930 g005
Figure 6. View of the target wind turbine and configuration of the wind tunnel environments.
Applsci 13 11930 g006
Figure 7. Results from wind tunnel experiments of the target wind turbine for the PI controller (black solid lines), the LQR controller (red dotted lines), and the H controller (green dashed lines). The left-hand plot (a) shows the results below the rated wind speed region (mean 4.0 m/s). The right-hand plot (b) shows the results for the above-rated wind speed region (mean 8.0 m/s).
Applsci 13 11930 g007
Figure 8. Results from wind tunnel experiments of the target wind turbine. The left-hand plot (a) shows the results near the rated wind speed region (mean 6.2 m/s) for the Pitch- H controller (black solid lines) and the H controller (green dashed lines). The right-hand plot (b) shows the results in the blade failure situation above the rated wind speed region (mean 8.0 m/s) for the LQR controller (black solid lines) and the H controller (green dashed lines).
Applsci 13 11930 g008
Figure 9. Control performance in blade failure situations for the LQR controller (black solid lines) and the H controller (red solid lines).
Applsci 13 11930 g009
Table 1. General specifications of a target wind turbine.
SpecificationsValues
Rated Power40 W
Rated Rotor Speed678 rpm
Rated Generator Torque0.04 Nm
Gear Ratio14
Rotor Diameter1.1 m
Hub Height0.9 m
Cut-in/Rated/Cut-out Wind Speed3, 5.5, 9 m/s
Table 2. Quantitative results from simulations of the target wind turbine for the PI, LQR, and H controllers.
Operating
Region
Wind Turbine
Controller
Control Performance in Dynamic Simulation
MeanStd. Dev.DEL
Ω r   ( r p m ) P   ( W ) Ω r   ( r p m ) P   ( W ) F t   ( N )
Below-Rated
Region
PI (A)541.02420.47638.7724.2948.496
LQR (B)540.94720.49438.4574.3538.247
H (C)540.37620.47437.9444.3068.222
(B − A)/A (%)−0.0140.088−0.8121.374−2.931
(C − A)/A (%)−0.120−0.010−2.1360.279−3.225
Above-Rated
Region
PI (D)677.71939.69617.8750.99822.852
LQR (E)677.94139.7099.7700.47119.832
H (F)678.50339.7426.7380.39619.644
(E − D)/D (%)0.0330.033−45.343−52.806−13.215
(F − D)/D (%)0.1160.116−62.305−60.321−14.038
Table 3. Quantitative results from wind tunnel experiments of the target wind turbine for the PI, LQR, and H controllers.
Operating
Region
Wind Turbine
Controller
Control Performance in Wind Tunnel Experiments
MeanStd. Dev.DEL
Ω r   ( r p m ) P   ( W ) Ω r   ( r p m ) P   ( W ) F t   ( N )
Below-Rated
Region
PI (A)524.24018.59520.2891.7603.464
LQR (B)528.13218.42820.1311.8123.282
H (C)527.75918.40419.9401.7943.275
(B − A)/A (%)0.742−0.898−0.7792.955−5.254
(C − A)/A (%)0.671−1.027−1.7201.932−5.456
Above-Rated
Region
PI (D)678.08739.74929.9002.49411.330
LQR (E)677.83939.94721.1131.7069.112
H (F)678.85639.71412.6831.1608.896
(E − D)/D (%)−0.0370.498−29.388−31.596−19.576
(F − D)/D (%)0.113−0.088−57.582−53.488−21.483
Disclaimer/Publisher’s Note: The statements, opinions and data contained in all publications are solely those of the individual author(s) and contributor(s) and not of MDPI and/or the editor(s). MDPI and/or the editor(s) disclaim responsibility for any injury to people or property resulting from any ideas, methods, instructions or products referred to in the content.

