Abstract
Breast cancer is the most common and deadly cancer in women, where early detection is of the utmost importance as survival rates decrease with the advancement of the disease. Most available methods of breast cancer screening and evaluation lack the ability to effectively differentiate between benign and malignant lesions without a biopsy. Ultrasound elastography (USE) is a cost-effective method that can potentially provide an initial malignancy assessment at the bedside. One of the challenges, however, is the uncertainty of tissue displacement data when performing USE due to out-of-plane movement of the tissue during mechanical stimulation, in addition to the computational efficiency necessary for real-time image reconstruction. This work presents a comparison of four different theoretically sound displacement estimators for their ability in tissue Young’s modulus reconstruction level with an emphasis on quality-to-runtime ratio to determine which estimators are most suitable for real-time USE systems. The methods are known in literature as AM2D, GLUE, OVERWIND, and SOUL methods. The effectiveness of each method was assessed as a stand-alone method or in combination with a strain field enhancement technique known as STREAL, which was recently developed using tissue mechanics-based regularization. The study was performed using radiofrequency US data pertaining to in silico and tissue mimicking phantoms in addition to clinical data. This data was used to generate tissue displacement fields employed to generate axial and lateral strain images before Young’s modulus images were reconstructed. The study indicates that the AM2D displacement estimator, which is an older and computationally less involved method, along with a tissue-mechanics-based image processing algorithm, performs very well, with high CNR, SNR, and preservation of tumor heterogeneity obtained at both strain and stiffness image levels, while its computation run-time is much lower compared to other estimation methods. As such, it can be recommended for incorporation in real-time USE systems.
1. Introduction
Breast cancer is one of the most common cancers, representing 25% of all new cancers and leading to 13% of all cancer-related deaths in Canadian women [1]. It has been well established that early detection of this disease before treatment is of the utmost importance, as five-year survival rates decrease significantly over time from ~100% in stage 1 down to 22% in stage 4 because of the spreading of the disease to other vital organs [1]. Some of the most common diagnostic and screening procedures include manual examination, X-ray mammography, and breast magnetic resonance imaging (MRI). Unfortunately, some of these methods are too costly or insufficiently effective in detecting abnormalities or differentiating malignant tumors from benign lesions without follow-up biopsy. Taking advantage of the fact that malignant tumors tend to be stiffer than normal tissue and benign lesions, ultrasound elastography (USE) techniques have been developed as a cost-effective imaging technique to visualize tissue stiffness. While cost-effective, this technique can be used for preliminary assessment of malignancy [2,3,4,5], hence potentially minimizing the number of follow-up biopsies. Typically, USE is performed through tissue mechanical stimulation, measuring the generated displacement field, and finally using this field to compute the tissue stiffness image. The quality of the stiffness image is highly dependent on the accuracy of the measured displacement field. Many methods have been developed for tissue motion tracking where tissue displacements are estimated by processing US radio-frequency (RF) data of the tissue as acquired at two states of before and after mechanical stimulation [6,7,8,9,10,11,12,13,14,15,16,17]. In this case, the mechanical stimulation is applied manually with the ultrasound probe, also known as quasi-static elastography. The comparative study presented here aims at assessing the qualifications of each major tissue motion tracking technique. Unlike other comparative studies where the qualifications are assessed based on signal-to-noise ratio (SNR) and CNR of the estimated displacement and strain fields, this study uses measures pertaining to Young’s modulus images reconstructed using respective tissue motion tracking methods for the assessment.
One of the most significant issues plaguing quasi-static USE is the lack of high-quality data due to out-of-plane tissue motion, imperfect application of force, and other operator inconsistencies. PCA-GLUE was recently proposed for data quality assessment [18]. This is a machine-learning-based method developed using data pertaining to tissue mimicking phantoms and only 3 patients; thus, it may not be rigorous for clinical applications. Another potential avenue to address the data imperfection issue is to develop image processing techniques that are resistant to this imperfection. Such development, however, may involve unjustifiably extensive computational processing. One exception to this is the strain refinement algorithm (STREAL), which follows tissue-mechanics-based regularization to improve the estimate of tissue lateral displacements with very high performance and low computational cost [19,20]. This method requires a rough initial estimate of the displacement field that can be obtained using previously developed techniques [7,13,21,22].
This investigation aims at identifying the best rough displacement estimator method that can be used in conjunction with STREAL. The criterion for selection is the ability to provide a good balance of run-time and quality during the elastic modulus reconstruction. This is contrary to the commonly used criteria for displacement and strain image quality measured by their SNR and CNR. The candidate algorithms of initial displacement estimation include analytic minimization in 2D (AM2D) [7], Global Ultrasound Elastography (GLUE) [13], OVERWIND [21], and SOUL [22]. These were chosen as candidates because they are well-motivated direct calculation methods that vary in complexity and quality, while their codes are publicly available for use in research. They represent a wide range of methods, including first-order derivatives, second-order derivatives, window-based approaches, etc. This study provides unique insight into the performance of these displacement estimators considering computational time restrictions (real-time rates) and at a wholly new full reconstruction level. Full elasticity reconstruction leading to tissue Young’s modulus images is a much more direct method to interpret the results of elastography, which may vastly improve the readability of these images.
Table 1 provides a reference table for the abbreviations used in this paper.

Table 1.
An overview of abbreviations used in this paper and their definitions.
2. Related Work
In general, there are many ways to perform elastography, each with their own strengths, weaknesses, and applications. One of the highest quality methods of elastography is magnetic resonance elastography (MRE) [23,24,25,26,27]. While this method offers high quality elastography images measured by its contrast-to-noise ratio (CNR), unfortunately, it suffers from pitfalls including low spatial resolution and low specificity. Moreover, broad application of MRI for breast cancer screening or assessment is not clinically feasible due to its high cost. USE on the other hand is cost-effective and easy to use, while it relatively has high spatial resolution. However, it does not have desirable overall quality compared to MRE. To enhance the quality of tissue displacement estimates which is necessary to ramp up the quality of USE images, 3D USE has been performed with reasonable success [28,29,30]. While high quality, 3D USE is far less accessible than 2D USE. Unfortunately, 2D USE introduces complications due to the simplification of a 3D problem into a 2D counterpart, leading to compromise in generated USE image quality. Recently, a 2D tissue motion tracking method was developed which has been shown to produce high quality displacement field [19]. This method starts with an initial rough estimate of the displacement field and applies regularization derived from an approximate 3D tissue mechanical model, leading to accurate estimation of both axial and lateral tissue displacement fields.
In 2D USE, there are major methods, including quasi-static elastography and shear wave elastography. Quasi-static elastography includes two methodologies: strain imaging and elastic modulus imaging. Both methodologies follow the same fundamental approach, where the tissue is mechanically stimulated through external application of compression by ultrasound probe or intrinsically through blood pulsation [31,32] before generated tissue displacement data are employed to create a strain or elastic modulus image. Unlike strain imaging, which estimates the tissue strain as a measure of stiffness, elastic modulus elastography utilizes an inversion framework to process the estimated displacement field before elastic modulus reconstruction [33,34,35,36]. The advantage of this methodology is that the hardware required is relatively simple, while the image reconstruction involves only a few assumptions. Shear wave elastography generates shear waves propagating through the tissue by producing an acoustic force or push impulse before the tissue shear modulus is reconstructed based on the estimated shear wave velocity [37,38]. One very important advantage of elastic modulus imaging techniques is that they provide a quantitative measurement of the underlying tissue stiffness, whereas strain imaging can only provide a qualitative image of stiffness at best. This makes these methods attractive to the diagnosis of diseases like breast cancer, liver cancer, fatty liver disease, and cirrhosis where an objective measurement is required [26,39,40]. This investigation focuses on quasi-static ultrasound elastography (QUSE), where the tissue is mechanically stimulated via very low-frequency tissue compression by the operator.
3. Methods
3.1. Strain Refinement Algorithm (STREAL)
The method presented in [19] has three major steps: Laplacian filtering, incompressibility enforcement, and compatibility enforcement. The first is the simplest: a Laplacian operator is applied to reduce the noise in the displacement image. Then the incompressibility of the tissues is enforced via an iterative optimization to further enhance the quality of the displacement field. Then the compatibility of tissues, which is interpreted as tissue displacement continuity enforcement, is enforced with an iterative optimization scheme to compute high-quality axial and lateral strain images. Tissue incompressibility enforcement relies on an assumption of the underlying tissue behavior. Sometimes this follows the plane strain behavior assumption, where out-of-plane strains are assumed to be negligible. In most cases, including clinical applications, the plain strain assumption is insufficient; hence, the Boussinesq model is used to approximate the 3D tissue deformation based on a semi-infinite medium mechanics [41].
3.2. Data Generation
Three kinds of data were used for this investigation: fully in-silico ultrasound data, a tissue-mimicking phantom, and clinical data.
Full synthetic in-silico ultrasound data was generated by first running a simulation of tissue compression in ABAQUS (ABAQUS 2019, Dassault Systèmes Simulia Corp., Johnston, RI, USA) with a strain level of 1% and then using the FIELD II toolbox [42,43,44] using a central frequency of 5 Mhz. To generate this data, scatterers were simulated and then displaced using the nodal displacements generated from the ABAQUS simulation. 23 different phantom models, including uni-focal and multi-focal phantoms with inclusion stiffnesses ranging from 40 to 60 kPa and background stiffnesses from 18 to 23 kPa, were simulated. The full method of generating in-silico ultrasound data is described in [17]. These phantoms reflect a “perfect” data acquisition scenario without any contamination with out-of-plane displacement or other irregularities. The synthetic data also allow for a large enough data sample to conduct statistical analyses on the performance of these displacement estimators, which is normally not possible with the handful of tissue mimicking phantoms usually presented in similar investigations.
For another level of validation on non-synthetic data, a tissue mimicking phantom manufactured by the Computerized Imaging Reference Systems (CIRS; Norfolk, VA, USA) was used as a second level of control. The ultrasound probe was controlled with a mechanical device to apply displacement in 2.54 mm (0.1 inch) increments. Finally, radiofrequency frame pairs of 3 patients were used from [11] to compare the differences in performance on clinical data. The tissue mimicking phantom was used to bridge the gap between entirely idealized data and clinical data in order to assess the performance of the estimators on high-quality but nonetheless “real” data.
3.3. Displacement Estimation
For each of the 23 models, the radiofrequency images were processed with the following displacement estimators:
Analytic Minimization in 2D [7]
Global Ultrasound Elastography [13]
OVERWIND [21]
Second-Order Ultrasound Elastography [22].
The resulting displacement and strain images were collected, and an estimate of run-time on an Intel i7 8700-based workstation was measured. The same was repeated on the tissues, mimicking phantoms and clinical data. Once these data were acquired, the displacements and strains were further improved using the STREAL algorithm in conjunction with the analytical Boussinesq model to estimate the out-of-plane strain [19,41].
3.4. Young’s Modulus Reconstruction Algorithm and Data Processing
An iterative reconstruction algorithm was used to recover the Young’s modulus of all the data [33,42]. In this algorithm, an initial guess of the Young’s modulus is made before a finite element (FE) model of the US field of view is generated, where the loading is provided as prescribed displacement boundary conditions obtained from the measured displacement field. The FE method is run, and based on the stresses from the model and the strain calculated from the US motion tracking, the Young’s modulus is recalculated. This is repeated until the Young’s modulus values converge. Figure 1 demonstrates the process with a flow chart. For the synthetic dataset, all generated data, including both pre- and post-STREAL, were used to reconstruct the Young’s modulus € images, while this image reconstruction method was also carried out using the ground truth displacements obtained through the FE simulation. The synthetic reconstructed data was processed as follows:
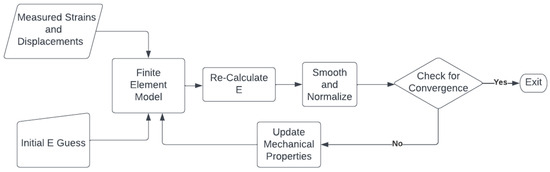
Figure 1.
A flow chart demonstrating the iterative reconstruction process described in [33,42]. The Young’s modul€(E) is iteratively re-calculated using measured strains until convergence is achieved, where convergence is defined as the mean absolute difference obtained from two consecutive iterations and is less than a specified tolerance (0.01).
- The inclusion-to-background Young’s modulus ratio was calculated, and a percent difference was calculated between the measured ratio using displacement estimators and the reconstruction performed with the ground-truth displacement. This can provide an idea of the diagnostic power of each estimator, as the ratio is what determines potential malignancy.
- The Hausdorff distance was calculated between the border of the segmented inclusions of the synthetic data reconstruction and the ground truth reconstruction. This metric was chosen to measure the change in shape of the inclusion.
- The mean squared error (MSE) between the resultant Young’s modulus images and the ground truth was calculated.
- The Young’s modulus ratios, Hausdorff distance, and MSE were then statistically compared using an ANOVA test with Bonferroni corrections.
- Using the same thresholding procedure as in step 2, the specificity, sensitivity, and kappa statistic were calculated for agreement with the ground truth for each displacement estimator.
For the tissue mimicking phantom and clinical examples, strain images for the axial and lateral images were also generated, along with CNR, SNR, and inclusion to the background Young’s modulus ratios. The CNR and SNR were calculated using two ROIs, one on the inclusion and one in the background.
4. Results
For each displacement estimator, with and without refinement using the STREAL method, Figure 2 illustrates errors in the reconstructed inclusion-to-background Young’s modulus ratios, Hausdorff distances between the truth and reconstructed outlines of the inclusion, and MSE between ground truth and reconstructed Young’s modulus images obtained for the phantoms’ datasets. Statistical significance (p < 0.05) between results generated by pairs of displacement estimators, both with and without refinement using the STREAL method, is also indicated in this figure. As seen in this figure, the AM2D displacement estimator with STREAL enhancement provides the most accurate inclusion-to-background Young’s modulus reconstruction ratio, while, on average, the STREAL enhancement reduces this error to less than one third compared to its pre-enhancement counterpart. The AM2D estimator with enhancement also leads to improved MSE, while its Hausdorff distance is not significantly different from other estimators. The latter implies that, compared to other estimators, while AM2D improves the quantitative distribution of the Young’s modulus ratio significantly, it does not improve the estimated shape of the inclusion significantly.
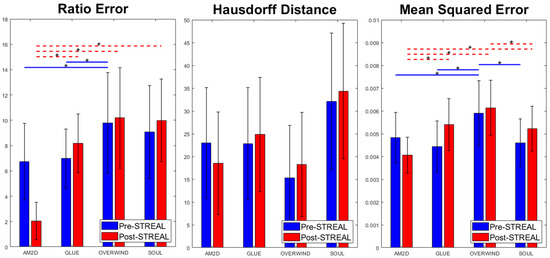
Figure 2.
Errors in reconstructed inclusion-to-background Young’s modulus ratios, Hausdorff distances between truth and reconstructed outlines of the inclusion, and MSE between ground truth and reconstructed Young’s modulus images obtained using the four displacement estimation methods of AM2D, GLUE, OVERWIND, and SOUL with and without STREAL enhancement. The red and blue lines with stars indicate statistical significance (p < 0.05) between results generated by pairs of estimators. In this comparison, pre- and post-STREAL were separate groups; hence, the statistical comparisons are between estimators, not pre- and post-STREAL.
When applied to synthetic data, the AM2D estimator provides accurate inclusion to background Young’s modulus ratio error estimation while preserving the quality of inclusion shape (Hausdorff distance). It generally compares well with the ground truth Young’s modulus distribution according to the small MSE values and very high specificity, sensitivity, and Kappa statistics, as can be seen in Table 2. In terms of runtime, however, AM2D ranges around 0.1 s, whereas GLUE, OVERWIND, and SOUL are approximately 8 s, 20 s, and 40 s, respectively. To demonstrate/compare the quality of the reconstructed Young’s modulus, Figure 3 illustrates an example obtained through processing a synthetic data sample. As can be seen, the AM2D estimator provides a high-quality reconstruction of the Young’s modulus when combined with STREAL enhancement. The “ground truth” reconstruction image was obtained by processing the ground truth displacement field, which was used to find the displacements of scatterers, using the iterative Young’s modulus reconstruction algorithm described earlier.
Table 2.
Specificity, sensitivity, and kappa statistics for the agreement of thresholded inclusions of each displacement estimator compared to the ground truth.
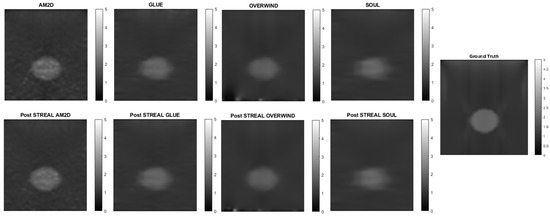
Figure 3.
An example of Young’s modulus image reconstruction obtained with synthetic displacement data generated by each displacement field estimator with and without STREAL enhancement. The “ground truth” reconstruction image was obtained by processing the ground truth displacement field using the iterative Young’s modulus reconstruction algorithm.
To further demonstrate/compare the quality of Young’s modulus reconstruction in conjunction with each of the displacement field estimators, Figure 4 shows images of reconstructed Young’s modulus in tissue mimicking phantoms. Reconstructed images are shown for each displacement estimator with and without STREAL enhancement. This figure also demonstrates that the AM2D estimator provides a high-quality reconstructed image as compared to the “ground truth” image, but at a very low computational cost.
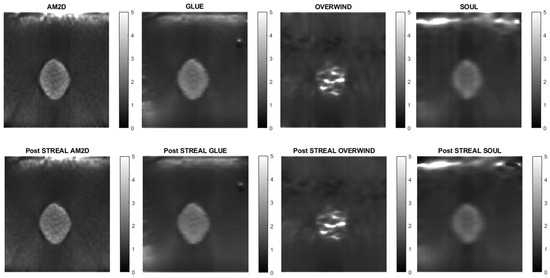
Figure 4.
Reconstructed Young’s modulus images of a tissue mimicking phantom obtained with each displacement estimator with and without STREAL enhancement.
To evaluate the performance and effectiveness of the four displacement estimators in the context of quality of reconstructed Young’s modulus images, contrast-to-noise ratio (CNR), signal-to-noise ratio (SNR), and inclusion to background Young’s modulus ratios for each reconstructed image were computed, and results pertaining to the tissue mimicking phantom are summarized in Table 3. This table indicates that all estimators lead to high CNR and SNR for reconstructed Young’s modulus images, while using STREAL enhancement with the AM2D and GLUE estimators leads to little change in the respective image CNR and SNR. The table shows that, among the estimators, OVERWIND consistently led to a substantial increase in the CNR and SNR of the reconstructed Young’s modulus images. The ground truth inclusion to background Young’s modulus ratio is 1.86. This indicates that the AM2D, GLUE, and SOUL displacement estimators lead to reasonably high accuracy, while the OVERWIND estimator shows poor performance in Young’s modulus reconstruction.
Table 3.
CNR, SNR, and inclusion in the background Young’s modulus ratio values obtained for reconstructed Young’s modulus images of phantoms computed using each displacement estimator with and without STREAL enhancement.
Strain imaging is common for obtaining an approximate distribution of tissue stiffness. To evaluate the performance and effectiveness of the four displacement estimators in the context of strain image quality, axial and lateral strain fields pertaining to the phantoms’ dataset were analyzed. Figure 5 illustrates axial strain images of the tissue mimicking phantom obtained with each displacement estimator, with and without STREAL enhancement. Table 4 presents results summary of corresponding CNR, SNR, and Young’s modulus ratio values obtained for the phantom dataset using each displacement estimator with and without STREAL enhancement. The figure and table indicate that the AM2D estimator provides a reasonably good-quality axial strain image but at a very low computational cost compared to other estimators. The table also indicates that the CNR and SNR values of axial strain images were slightly improved through the application of STREAL enhancement. Furthermore, while there is further deviation from the true value, the Young’s ratio values obtained from these images once again show that AM2D leads to the most accurate estimates.
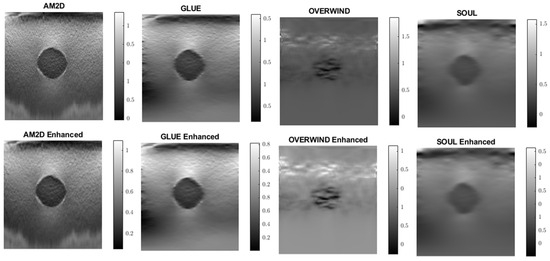
Figure 5.
Axial strain images of the tissue mimicking phantom obtained using each displacement field estimator applied with and without STREAL enhancement. Differences between each image and its STREAL enhanced version is subtle.
Table 4.
CNR and SNR values obtained for axial strain images of tissue mimicking phantom computed using each displacement estimator with and without STREAL enhancement.
A similar analysis was performed to evaluate the quality of lateral strain images using each of the displacement estimators with and without STREAL enhancement. As an example, Figure 6 illustrates lateral strain images of the tissue mimicking phantom obtained with each displacement estimator, with and without STREAL enhancement. Table 5 presents a summary of the pertinent CNR and SNR values obtained for the phantom dataset using each displacement estimator with and without STREAL enhancement. The figure and table indicate that the CNR and SNR improvements in lateral strain achieved through STREAL enhancement are highly remarkable. More particularly, Figure 6 shows that, through STREAL enhancement, the lateral strain image obtained with the AM2D estimator transforms from almost an entirely noisy image to a relatively high-quality image where the inclusion is highly distinguishable. This is confirmed by the data given in Table 5, which shows that the CNR and SNR were increased by factors of over 20 and 1.6 times, respectively. It is noteworthy that the Young’s modulus ratios are not reported in the table, as lateral strains do not provide a good estimate of this ratio due to the high spatial variability of the stresses in the lateral direction.
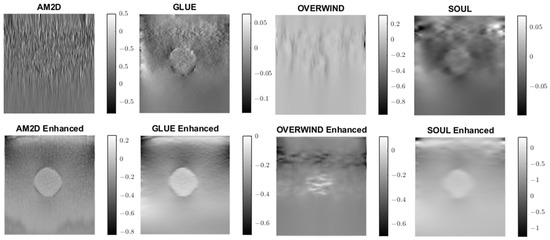
Figure 6.
Lateral strain images of the tissue mimicking phantom obtained using each displacement field estimator applied with and without STREAL enhancement. Lateral strain images obtained with STREAL enhanced show remarkable improvement over their pre-enhancement counterparts.
Table 5.
CNR and SNR values obtained for lateral strain image of the tissue mimicking phantom computed using each displacement estimator with and without STREAL enhancement.
For evaluating the performance of the displacement estimators with and without STREAL enhancement on clinical data, constructed Young’s modulus, axial strain, and lateral strain images pertaining to 3 patients in the dataset are presented. Figure 7, Figure 8 and Figure 9 show images of the reconstructed Young’s modulus, axial strain, and lateral strain, respectively, for Patient 1. Similarly, Figure 10, Figure 11 and Figure 12 show images of the reconstructed Young’s modulus, axial strain, and lateral strain, respectively, for Patient 2, while Figure 13, Figure 14 and Figure 15 show images of the reconstructed Young’s modulus, axial strain, and lateral strain, respectively, for Patient 3. Each reconstruction is associated with a table of CNR, SNR, and ratio (Table 6, Table 7 and Table 8). Generally, the quality of all images generated using the OVERWIND estimator is poor compared to images generated using other estimators. Except for the OVERWIND estimator, other estimators led to reasonably high-quality images. Among AM2D, GLUE, and SOUL estimators, AM2D led to noisier images, while preserving necessary information, including stiffness values and tumor shape. This once again indicates the advantage of the AM2D estimator, which has much higher computational efficiency at the cost of losing little image quality. Like the phantom case, it is also observed that STREAL enhancement has the highest influence on lateral strain images with all estimators. Again, this enhancement transforms almost entirely noisy lateral strain images into high-quality images where both tumor shape and its stiffness can be estimated. For lateral strain images, the STREAL enhancement in conjunction with AM2D, GLUE, and SOUL estimators demonstrates remarkable improvement, as this enhancement transforms very low-quality images into images where the tumors are quite distinguishable.
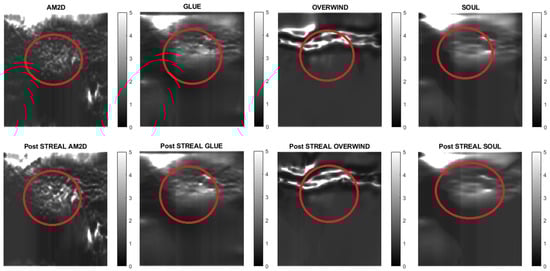
Figure 7.
Reconstructed Young’s modulus images of Patient 1 computed from displacement fields obtained by each displacement estimator with and without STREAL enhancement. Approximate tumor ROI is highlighted in red based on outlines provided in [11]. AM2D provides reasonably high-quality images at a very low computational cost.
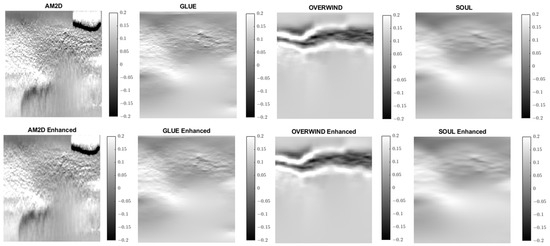
Figure 8.
Axial strain images of Patient 1 computed from displacement fields obtained by each displacement estimator with and without STREAL enhancement. AM2D provides reasonably high-quality images at a very low computational cost.
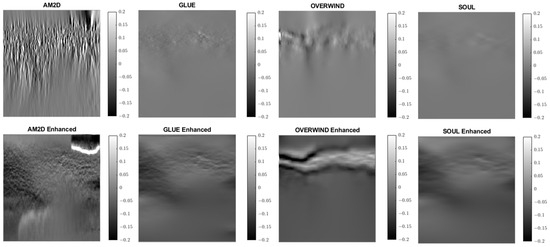
Figure 9.
Lateral strain images of Patient 1 computed from displacement fields obtained by each displacement estimator with and without STREAL enhancement. AM2D with STREAL enhancement provides reasonably high-quality images at a very low computational cost.
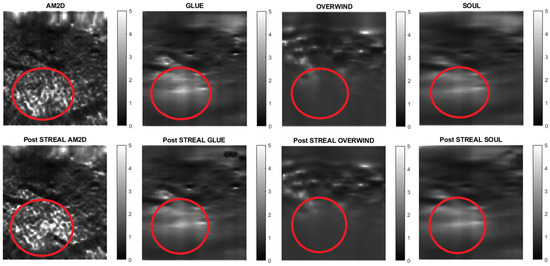
Figure 10.
Reconstructed Young’s modulus images of Patient 2 computed from displacement fields obtained by each displacement estimator with and without STREAL enhancement. Approximate tumor ROI is highlighted in red [11]. AM2D provides a reasonably high-quality image at a very low computational cost.
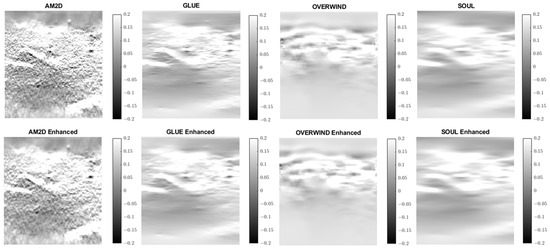
Figure 11.
Axial strain images of Patient 2 computed from displacement fields obtained by each displacement estimator with and without STREAL enhancement. AM2D provides reasonably high-quality images at a very low computational cost.
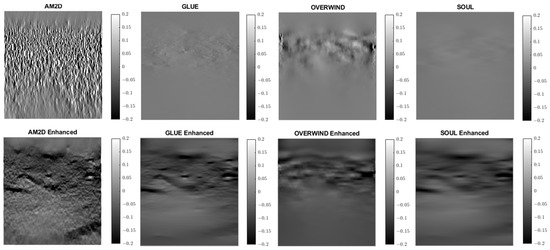
Figure 12.
Lateral strain images of Patient 2 computed from displacement fields obtained by each displacement estimator with and without STREAL enhancement. AM2D with STREAL enhancement provides reasonably high-quality images at a very low computational cost.
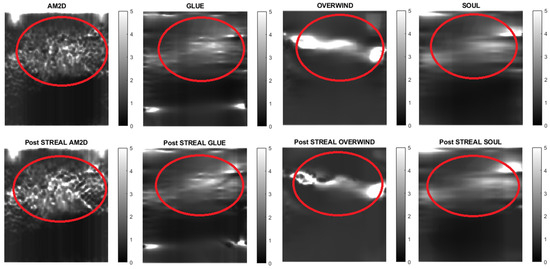
Figure 13.
Reconstructed Young’s modulus images of Patient 3 computed from displacement fields obtained by each displacement estimator with and without STREAL enhancement. Approximate tumor ROI is highlighted in red [11]. AM2D provides a reasonably high-quality image at a very low computational cost.
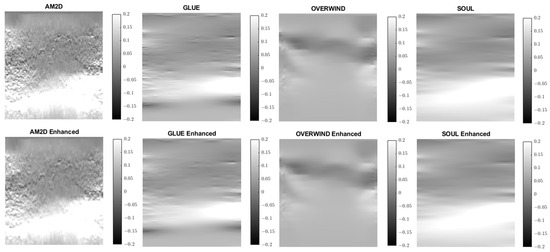
Figure 14.
Axial strain images of Patient 3 computed from displacement fields obtained by each displacement estimator with and without STREAL enhancement. AM2D provides reasonably high-quality images at a very low computational cost.
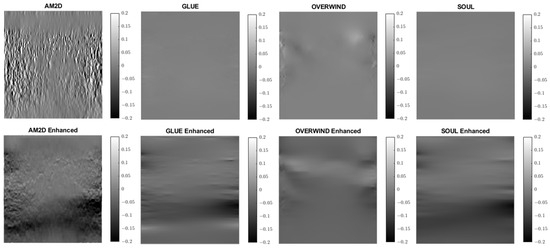
Figure 15.
Lateral strain images of Patient 3 computed from displacement fields obtained by each displacement estimator with and without STREAL enhancement. AM2D with STREAL enhancement provides reasonably high-quality images at a very low computational cost.
Table 6.
CNR, SNR, and Inclusion to background Young’s modulus ratios obtained for axial strain images of Patient 1 computed using each displacement estimator with and without STREAL enhancement.
Table 7.
CNR, SNR, and inclusion to background Young’s modulus ratios obtained for axial strain images of Patient 2 computed using each displacement estimator with and without STREAL enhancement.
Table 8.
CNR, SNR, and inclusion to background Young’s modulus ratios obtained for axial strain images of Patient 3 computed using each displacement estimator with and without STREAL enhancement.
Overall, in all images, the AM2D estimator shows a good ability to clearly show increased stiffness with clear heterogeneity within the tumor. GLUE and SOUL show much smoother versions of the same image in AM2D, while OVERWIND provides only some increase in the stiffness of the ROI. Figure 16 shows a hypothetical image fusion of B-mode and Young’s modulus generated for Patients 1, 2, and 3 that can be provided in the clinic. The Young’s modulus images are obtained through the data inversion of displacements computed by the AM2D estimator with STREAL enhancement.
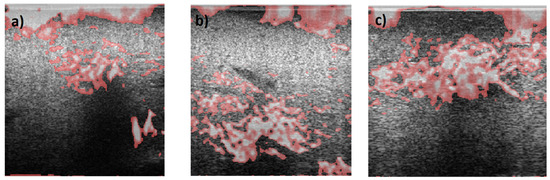
Figure 16.
Segmented Young’s modulus images computed from displacements estimated through the AM2D estimator with STREAL enhancement overlayed on top of B-mode images of (a) Patient 1, (b) Patient 2, and (c) Patient 3. Highlighted regions have Young’s modulus values larger than 1.5 times the median of Young’s modulus of respective background tissue. Apart from artifacts at the top of the images, the stiffness elevation in the tumor area is consistent with their respective ROIs.
5. Discussion
This investigation evaluates the performance of four commonly used tissue displacement estimation methods developed for US elastography. The methods are, namely, AM2D, GLUE, OVERWIND, and SOUL. They were evaluated both as stand-alone methods and in combination with the STREAL method, which was recently developed to enhance tissue displacement fields aimed at US elastography applications. The assessment was performed using datasets consisting of data pertaining to in silico and tissue mimicking phantoms undergoing US imaging in addition to clinical data. When applied to synthetic data, compared with the other measures, the AM2D displacement estimator, by far, provides the best quality of Young’s modulus reconstruction with much higher computational efficiency compared to other estimators. This estimator has the added benefit of substantially improving the inclusion-to-background Young’s modulus ratio when combined with the STREAL enhancement method founded on tissue mechanics regularization. The other displacement estimators tend to blur the edges of the inclusion, which may be the source of the ratio error as it leads to the underestimation of the inclusion’s Young’s modulus. The in-silico phantoms results indicate that both OVERWIND and SOUL estimators provide minimal improvements over GLUE but take much longer to compute compared to AM2D. This makes them difficult to recommend in a real-time scenario where run-time is of the utmost importance. Tissue mechanics-based regularization applied through the STREAL enhancement method provides the most improvement when applied to the AM2D estimator. This may be partially due to the displacement field over-smoothing effect applied in other methods, which can lead to excessive loss of actual displacement information. Furthermore, the more advanced and complicated displacement estimators have increasingly many parameters, which makes it more difficult to accurately tune the algorithm for maximum performance. Moreover, the sophisticated window-based approach in OVERWIND was designed to handle large changes in displacement and preserve value; however, it is possible that this same mechanism can sometimes allow artifacts and issues in the displacement field to pass through where they otherwise should be smoothed. SOUL, on the other hand, provides a much smoother image than GLUE; however, the former risks excessive smoothing, while the potential benefit is not worth the increased runtime and should be reconsidered if its algorithm implementation is optimized.
When applied to the tissue mimicking phantom, the AM2D estimator performed very well relative to the other estimator as it produces high-quality images for a very low runtime requirement. The quality of the reconstructed images measured by CNR and SNR is comparable, while the STREAL enhancement led to little change in these measures except for OVERWIND, where the enhancement led to substantial improvement. For strain images, the STREAL enhancement led to only a little improvement of axial strain with all four displacement estimators, whereas the improvement achieved with the lateral strain was highly remarkable, especially with the AM2D estimator. This observation is consistent with [19]. Overall, the difference in reconstruction quality with and without STREAL is quite subtle and, in some cases, seems to decrease CNR and SNR. The decrease in metrics is of relatively trivial magnitude compared to the overall CNR and SNR and could be attributed to subtle changes in the noise content. Nonetheless, the idealistic nature of the tissue mimicking phantoms and indeed the in silico phantoms means that the quality of the axial displacement alone is enough to reconstruct the Young’s modulus with high quality. While this indicates that STREAL has left little room for improvement in the studied phantoms, the impacts of STREAL are best exemplified in the clinical cases where the prominence of the inclusion was increased since the noise in these cases is substantial in both axial and lateral directions.
In the clinical cases presented in this investigation, the AM2D estimator provides Young’s modulus images with remarkable heterogeneity. While this is consistent with a heterogeneous stiffness distribution expected in tumor tissue, a lack of underlying ground truth makes this difficult to ascertain. The GLUE estimator provides a more homogenous-appearing mass, which may be more appealing to clinicians. Moreover, the OVERWIND and SOUL estimators do not appear to provide a significant benefit as compared to the GLUE estimator, which has a significantly higher runtime. It must be noted that the CNR/SNR and ratios of the clinical reconstruction should be interpreted cautiously as the underlying stiffness distribution and, more importantly, its heterogeneity are unknown; hence naïve comparisons of SNR and CNR are not appropriate as the true variance in the background is not known.
One important aspect of the AM2D estimator is its ability to create high quality strain images at high speed for real-time image assessment. This study indicates that the AM2D estimator with STREAL enhancement is vastly superior in its quality to runtime ratio, as can be seen in both the tissue mimicking phantom and clinical examples, where the inclusion or tumor is clearly visible.
It is noteworthy that with all of the tissue motion tracking techniques using US, the quality of the estimated displacement field is highly dependent on the consistency of the selected pair of RF frames corresponding to the pre- and post-compression states of the tissue. In other words, the two frames must represent the same tissue plane as much as possible. The greater the deviation from this situation, the lower the quality of the estimated displacement field. The recently developed method known as PCA-GLUE [18], which is a variant of the GLUE method optimized with machine learning, can be used for assessing RF frame pair quality. Given the high speed of the AM2D displacement estimator, it should also be possible to consider it a good candidate for real-time frame pair quality assessment before near imaging at near real-time rates. This concept is demonstrated in the flowchart shown in Figure 17.
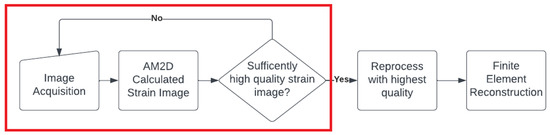
Figure 17.
A hypothetical flow chart for a real-time US elastography system that could be deployed in the clinical setting. The red box indicates a real-time loop that the clinician can use to assess the quality of images in real time, where once a sufficiently high-quality strain image is found, it can be processed to reconstruct reliable Young’s modulus image.
This investigation clearly demonstrates the image quality superiority of full-reconstruction imaging, where it is observed that SNR and CNR values are substantially higher for the tissue mimicking phantom at the reconstructed Young’s modulus level compared to their strain image counterparts. Moreover, Young’s modulus images are much easier to interpret, as can be seen in Figure 7, Figure 10 and Figure 13, with an overlay indicating substantially stiffer tissue.
Some limitations of this study include the small number of tissue mimicking and clinical examples and the lack of underlying validation for the stiffness field of the clinical examples. Some future suggestions for this work would be to develop better tissue-mimicking samples that include heterogeneity, whether synthetic or physical, to evaluate the preservation of heterogeneity in the sample. Another obvious future direction is including a large clinical study to achieve more concrete conclusions. Moreover, a prototype imaging system should be developed and taken to clinical trials to determine which displacement estimator results in improved decision-making ability. Alternatively, data could be collected along with biopsy-confirmed results to attempt to create a diagnostic criterion for this new generation elastography system.
Some notable non-inclusions in this study are normalized correlation coefficient methods and their variants, and deep-learning-based methods. NCC methods were not included in this investigation because the quality of the strain images; they produce low-quality displacement fields compared to the selected four estimators. The lack of sufficient quality associated with these methods is expected to impact reconstructed Young’s modulus images [45,46]. Moreover, NCC-based methods are not as computationally efficient as dynamic programming methods. Deep-learning-based methods were also not included in this investigation, as the performance of the network is highly dependent on the training data and the very specific architecture used [43,44,45,46,47], and deep learning methods should be evaluated on a case-by-case basis. Moreover, this investigation is primarily a CPU-based comparison; hence, including deep learning would lead to largely invalid conclusions about computation efficiency, as either they would be unfairly hampered by running on CPU or unfairly advantaged by running on GPU.
The diagnosis of breast cancer is an inherently multi-faceted and non-binary process where clinicians must consider many different sources of evidence and come to a probability of malignancy or benign findings, which will inform the clinical course of action. Mathematical tools have been developed for this precise situation, including Dempster-Shafer Theory (DS Theory) and Fuzzy Logic, which are meant to provide a mathematical framework for integrating multiple sources of evidence and to deal with “continuous” logic, where probabilities are used rather than Boolean values.
DS Theory is based upon Bayesian theories of subjective probability. It deals with mathematical constructs called “belief functions,” which integrate the answers to one question to influence the confidence or “belief” in a related question. In the domain of breast cancer diagnosis, it has been used to create new neural network methodologies that integrate multiple measures of breast lesion texture and pharmacokinetic parameters [48] to achieve superior results compared to traditional classifiers.
Fuzzy logic was developed specifically to handle situations in which the truth value of some statement is not a Boolean value and is in fact a continuum between 0 and 1. In the case of breast cancer, it is not simply enough to assign it malignant or benign, as it cannot be known whether all benign lesions will remain that way or whether a malignant lesion will necessarily become life-threatening (overdiagnosis). Fuzzy logic was developed to tackle such an issue and has been used in diagnostic methods specifically to diagnose breast cancers [49].
The potential future direction of this work is to integrate the elastography technique identified as highly effective into such classification methodologies to improve the accuracy of breast cancer detection systems.
6. Conclusions
Full-inversion-based Young’s modulus reconstruction is data-quality dependent. If reasonably high-quality data are available, simpler displacement estimators like AM2D with STREAL enhancement may be used to great effect, as they can produce accurate Young’s modulus images with a small runtime compared to other estimators. For axial strain imaging, STREAL enhancement offers little improvement when used in conjunction with every displacement estimator. For lateral strain imaging, which can be used for better conditioning of the elastography inverse problem, STREAL enhancement, especially when used along with AM2D, offers a great improvement. As it currently stands, compared to AM2D, OVERWIND, SOUL, and somewhat GLUE are too computationally intensive to be considered in a real-time system, while there is little evidence that they may lead to higher-quality stiffness image reconstruction.
Author Contributions
Conceptualization, A.S. and M.C.; methodology, A.S. and M.C.; software, M.C.; validation, A.S. and M.C.; formal analysis, M.C.; investigation, A.S. and M.C.; resources, A.S.; data curation, A.S. and M.C.; writing—original draft preparation, M.C.; writing—review and editing, A.S.; visualization, M.C.; supervision, A.S.; project administration, A.S.; funding acquisition, A.S. All authors have read and agreed to the published version of the manuscript.
Funding
This research has been supported by the Natural Sciences and Engineering Research Council of Canada (NSERC) (RGPIN-2019-06619). Matthew Caius is financially supported by NSERC CGSM scholarship. NSERC had no role in the study design, in the collection, analysis and interpretation of data; in the writing of the manuscript and in the decision to submit the manuscript for publication.
Institutional Review Board Statement
Not applicable.
Informed Consent Statement
Not applicable.
Data Availability Statement
Radio-frequency data of the 3 patients investigated in this article was made available through Dr. H. Rivaz research laboratory.
Conflicts of Interest
The authors have no conflict to disclose.
References
- Breast Cancer Statistics, Canadian Cancer Society. Available online: https://cancer.ca/en/cancer-information/cancer-types/breast/statistics (accessed on 19 January 2022).
- Dempsey, S.C.H.; O’Hagan, J.J.; Samani, A. Measurement of the hyperelastic properties of 72 normal homogeneous and heterogeneous ex vivo breast tissue samples. J. Mech. Behav. Biomed. Mater. 2021, 124, 104794. [Google Scholar] [CrossRef] [PubMed]
- Samani, A.; Zubovits, J.; Plewes, D. Elastic moduli of normal and pathological human breast tissues: An inversion-technique-based investigation of 169 samples. Phys. Med. Biol. 2007, 52, 1565–1576. [Google Scholar] [CrossRef] [PubMed]
- Krouskop, T.A.; Wheeler, T.M.; Kallel, F.; Garra, B.S.; Hall, T. Elastic moduli of breast and prostate tissues under compression. Ultrason. Imaging 1998, 20, 260–274. [Google Scholar] [CrossRef] [PubMed]
- Masuzaki, R.; Tateishi, R.; Yoshida, H.; Sato, T.; Ohki, T.; Goto, T.; Yoshida, H.; Sato, S.; Sugioka, Y.; Ikeda, H.; et al. Assessing liver tumor stiffness by transient elastography. Hepatol. Int. 2007, 1, 394–397. [Google Scholar] [CrossRef]
- Gennisson, J.L.; Deffieux, T.; Fink, M.; Tanter, M. Ultrasound elastography: Principles and techniques. Diagn. Interv. Imaging 2013, 94, 487–495. [Google Scholar] [CrossRef]
- Rivaz, H.; Boctor, E.; Foroughi, P.; Zellars, R.; Fichtinger, G.; Hager, G. Ultrasound Elastography: A Dynamic Programming Approach. IEEE Trans. Med. Imaging 2008, 27, 1373–1377. [Google Scholar] [CrossRef]
- Sigrist, R.M.S.; Liau, J.; El Kaffas, A.; Chammas, M.C.; Willmann, J.K. Ultrasound elastography: Review of techniques and clinical applications. Theranostics 2017, 7, 1303–1329. [Google Scholar] [CrossRef]
- Varghese, T. Quasi-Static Ultrasound Elastography. Ultrasound Clin. 2009, 4, 323–338. [Google Scholar] [CrossRef]
- Rivaz, H.; Boctor, E.M.; Choti, M.A.; Hager, G.D. Ultrasound elastography using multiple images. Med. Image Anal. 2013, 18, 314–329. [Google Scholar] [CrossRef]
- Rivaz, H.; Boctor, E.M.; Choti, M.A.; Hager, G.D. Real-Time Regularized Ultrasound Elastography. IEEE Trans. Med. Imaging 2011, 30, 928–945. [Google Scholar] [CrossRef]
- Ashikuzzaman, M.; Gauthier, C.J.; Rivaz, H. Global Ultrasound Elastography in Spatial and Temporal Domains. IEEE Trans. Ultrason. Ferroelectr. Freq. Control 2019, 66, 876–887. [Google Scholar] [CrossRef] [PubMed]
- Hashemi, H.S.; Rivaz, H. Global Time-Delay Estimation in Ultrasound Elastography. IEEE Trans. Ultrason. Ferroelectr. Freq. Control 2017, 64, 1625–1636. [Google Scholar] [CrossRef] [PubMed]
- Mirzaei, M.; Asif, A.; Rivaz, H. Ultrasound Elastography Utilizing Pre-Beam-Formed Data. In Proceedings of the 2019 IEEE 16th International Symposium on Biomedical Imaging (ISBI 2019), Venice, Italy, 8–11 April 2019; IEEE: Piscataway, NJ, USA, 2019. Available online: https://ieeexplore.ieee.org/document/8759302/ (accessed on 23 August 2022).
- Li, H.A.; Zhang, M.; Yu, K.; Qi, X.; Tong, J. A Displacement Estimated Method for Real Time Tissue Ultrasound Elastography. Mob. Netw. Appl. 2021, 26, 2014–2023. [Google Scholar] [CrossRef]
- Wei, X.; Wang, Y.; Ge, L.; Peng, B.; He, Q.; Wang, R.; Huang, L.; Xu, Y.; Luo, J. Unsupervised Convolutional Neural Network for Motion Estimation in Ultrasound Elastography. IEEE Trans. Ultrason. Ferroelectr. Freq. Control 2022, 69, 2236–2247. [Google Scholar] [CrossRef]
- Tehrani, A.K.Z.; Rivaz, H. Displacement Estimation in Ultrasound Elastography Using Pyramidal Convolutional Neural Network. IEEE Trans. Ultrason. Ferroelectr. Freq. Control 2020, 67. Available online: https://ieeexplore.ieee.org/document/8990076/ (accessed on 23 August 2022). [CrossRef]
- Zayed, A.; Member, S.; Rivaz, H.; Member, S. Fast Strain Estimation and Frame Selection in Ultrasound Elastography Using Machine Learning. IEEE Trans. Ultrason. Ferroelectr. Freq. Control 2021, 68, 406–415. [Google Scholar] [CrossRef]
- Kheirkhah, N.; Dempsey, S.; Sadeghi-Naini, A.; Samani, A. A novel tissue mechanics-based method for improved motion tracking in quasi-static ultrasound elastography. Med. Phys. 2023, 50, 2176–2194. [Google Scholar] [CrossRef]
- Kheirkhah, N.; Dempsey, S.C.H.; Rivaz, H.; Samani, A.; Sadeghi-Naini, A. A Tissue Mechanics Based Method to Improve Tissue Displacement Estimation in Ultrasound Elastography. In Proceedings of the Annual International Conference of the IEEE Engineering in Medicine and Biology Society, EMBS, Montreal, QC, Canada, 20–24 July 2020; pp. 2051–2054. [Google Scholar] [CrossRef]
- Mirzaei, M.; Asif, A.; Rivaz, H. Combining Total Variation Regularization with Window-Based Time Delay Estimation in Ultrasound Elastography. IEEE Trans. Med. Imaging 2019, 38, 2744–2754. [Google Scholar] [CrossRef]
- Ashikuzzaman, M.; Rivaz, H. Second-Order Ultrasound Elastography with L1-Norm Spatial Regularization. IEEE Trans Ultrason. Ferroelectr Freq Control 2022, 69. Available online: https://ieeexplore.ieee.org/document/9674909/ (accessed on 23 August 2022). [CrossRef]
- Manduca, A.; Oliphant, T.E.; Dresner, M.A.; Mahowald, J.L.; Kruse, S.A.; Amromin, E.; Felmlee, J.P.; Greenleaf, J.F.; Ehman, R.L. Magnetic resonance elastography: Non-invasive mapping of tissue elasticity. Med. Image Anal. 2001, 5, 237–254. [Google Scholar] [CrossRef]
- Kruse, S.A.; Rose, G.H.; Glaser, K.J.; Manduca, A.; Felmlee, J.P.; Clifford, R.J., Jr.; Ehman, R.L. Magnetic resonance elastography of the brain. NeuroImage 2007, 39, 231–237. [Google Scholar] [CrossRef] [PubMed]
- Low, G.; Kruse, S.A.; Lomas, D.J. General review of magnetic resonance elastography. World J. Radiol. 2016, 8, 59–72. [Google Scholar] [CrossRef] [PubMed]
- Venkatesh, S.K.; Yin, M.; Ehman, R.L. Magnetic resonance elastography of liver: Technique, analysis, and clinical applications. J. Magn. Reson. Imaging 2013, 37, 544–555. [Google Scholar] [CrossRef] [PubMed]
- Mariappan, Y.K.; Glaser, K.J.; Ehman, R.L. Magnetic Resonance Elastography: A Review. Clin. Anat. 2010, 23, 497–511. [Google Scholar] [CrossRef] [PubMed]
- Righetti, R.; Righetti, M.; Ophir, J.; Krouskop, T.A. The feasibility of estimating and imaging the mechanical behavior of poroelastic materials using axial strain elastography. Phys. Med. Biol. 2007, 52, 3241. [Google Scholar] [CrossRef]
- Papadacci, C.; Bunting, E.A.; Konofagou, E.E. 3D Quasi-Static Ultrasound Elastography with Plane Wave In Vivo. IEEE Trans. Med. Imaging 2017, 36, 357. [Google Scholar] [CrossRef]
- Jiang, J.; Peng, B. A Comparative Study of Displacement De-Noising Strategies: An in Vivo Feasibility Study Using 3D Whole Breast Ultrasound Data. In Proceedings of the 2018 IEEE International Ultrasonics Symposium (IUS), Kobe, Japan, 22–25 October 2018; IEEE: Piscataway, NJ, USA, 2018. Available online: https://ieeexplore.ieee.org/document/8579998/ (accessed on 23 August 2022).
- Ophir, J.; Céspedes, I.; Ponnekanti, H.; Yazdi, Y.; Li, X. Elastography: A quantitative method for imaging the elasticity of biological tissues. Ultrason. Imaging 1991, 13, 111–134. [Google Scholar] [CrossRef]
- Maurice, R.L.; Ohayon, J.; Fretigny, Y.; Bertrand, M.; Soulez, G.; Cloutier, G. Noninvasive Vascular Elastography: Theoretical Framework. IEEE Trans. Med. Imaging 2004, 23, 164–180. [Google Scholar] [CrossRef]
- Samani, A.; Bishop, J.; Plewes, D.B. A constrained modulus reconstruction technique for breast cancer assessment. IEEE Trans. Med. Imaging 2001, 20, 877–885. [Google Scholar] [CrossRef]
- Doyley, M.M.; Meaney, P.M.; Bamber, J.C. Evaluation of an iterative reconstruction method for quantitative elastography. Phys. Med. Biol. 2000, 45, 1521–1540. [Google Scholar] [CrossRef]
- Ophir, J.; Alam, S.K.; Garra, B.; Kallel, F.; Konofagou, E.; Krouskop, T.; Varghese, T. Elastography: Ultrasonic estimation and imaging of the elastic properties of tissues. Sage J. 1999, 213, 203–233. [Google Scholar] [CrossRef] [PubMed]
- Skovoroda, A.R.; Emelianov, S.Y.; O’donnell, M. Tissue Elasticity Reconstruction Based on Ultrasonic Displacement and Strain Images. IEEE Trans. Ultrason. Ferroelectr. Freq. Control 1995, 42, 747. [Google Scholar] [CrossRef]
- Bercoff, J.; Tanter, M.; Fink, M. Supersonic shear imaging: A new technique for soft tissue elasticity mapping. IEEE Trans. Ultrason. Ferroelectr. Freq. Control 2004, 51, 396–409. [Google Scholar] [CrossRef] [PubMed]
- Sarvazyan, A.P.; Rudenko, O.V.; Swanson, S.D.; Fowlkes, J.B.; Emelianov, S.Y. Shear wave elasticity imaging: A new ultrasonic technology of medical diagnostics. Ultrasound Med. Biol. 1998, 24, 1419–1435. [Google Scholar] [CrossRef] [PubMed]
- Afdhal, N.H. Fibroscan (Transient Elastography) for the Measurement of Liver Fibrosis. Gastroenterol. Hepatol. 2012, 8, 605. Available online: https://www.ncbi.nlm.nih.gov/pmc/articles/PMC3594956/ (accessed on 2 August 2023).
- Osman, A.M.; El Shimy, A.; Abd, M.M.; Aziz, E. 2D shear wave elastography (SWE) performance versus vibration-controlled transient elastography (VCTE/fibroscan) in the assessment of liver stiffness in chronic hepatitis. Insights Imaging 2020, 11, 38. [Google Scholar] [CrossRef]
- Boussinesq, J. Application des Potentiels à L’étude de L’équilibre et du Mouvement des Solides Elastiques, Principalement au Calcul des Deformations et des Pressions que Produisent, dans ces Solides, des Efforts Quelconques Exercés sur und Petite Partie de leur Surface ou de leur Intérieur; Memoire Suivi de Notes Etendues sur Divers Points de Physique Mathématique et D’analyse; par m. J. Boussinesq 1842–1929; Gauthier-Villars: Paris, France, 1885. [Google Scholar]
- Mousavi, S.R.; Sadeghi-Naini, A.; Czarnota, G.J.; Samani, A. Towards clinical prostate ultrasound elastography using full inversion approach. Med. Phys. 2014, 41, 033501. [Google Scholar] [CrossRef]
- Perdios, D.; Vonlanthen, M.; Martinez, F.; Arditi, M.; Thiran, J. CNN-Based Ultrasound Image Reconstruction for Ultrafast Displacement Tracking. IEEE Trans. Med. Imaging 2021, 40, 1078–1089. [Google Scholar] [CrossRef]
- Tehrani, A.K.Z.; Sharifzadeh, M.; Boctor, E.; Rivaz, H. Bi-Directional Semi-Supervised Training of Convolutional Neural Networks for Ultrasound Elastography Displacement Estimation. IEEE Trans. Ultrason. Ferroelectr. Freq. Control 2022, 69. Available online: https://ieeexplore.ieee.org/document/9694663/ (accessed on 23 August 2022). [CrossRef]
- Mallampati, A.; Almekkawy, M. Measuring Tissue Elastic Properties Using Physics Based Neural Networks. In Proceedings of the LAUS 2021—2021 IEEE UFFC Latin America Ultrasonics Symposium, Proceedings, Gainesville, FL, USA, 4–5 October 2021; IEEE: Piscataway, NJ, USA, 2021. [Google Scholar] [CrossRef]
- Hoerig, C.; Ghaboussi, J.; Insana, M.F. Data-Driven Elasticity Imaging Using Cartesian Neural Network Constitutive Models and the Autoprogressive Method. IEEE Trans. Med. Imaging 2019, 38, 1150–1160. [Google Scholar] [CrossRef]
- Tehrani, A.K.Z.; Amiri, M.; Rivaz, H. Real-time and High Quality Ultrasound Elastography Using Convolutional Neural Network by Incorporating Analytic Signal. In Proceedings of the 2020 42nd Annual International Conference of the IEEE Engineering in Medicine & Biology Society (EMBC), Montreal, QC, Canada, 20–24 July 2020; IEEE: Piscataway, NJ, USA, 2020. Available online: https://ieeexplore.ieee.org/document/9176025/ (accessed on 23 August 2022).
- Liu, Z.; Lin, F.; Huang, J.; Wu, X.; Wen, J.; Wang, M.; Ren, Y.; Wei, X.; Song, X.; Qin, J.; et al. A classifier-combined method for grading breast cancer based on Dempster-Shafer evidence theory. Quant. Imaging Med. Surg. 2023, 13, 3288. [Google Scholar] [CrossRef] [PubMed]
- Idris, N.; Ismail, M. Breast cancer disease classification using fuzzy-ID3 algorithm with FUZZYDBD method: Automatic fuzzy database definition. PeerJ Comput. Sci. 2021, 7, e427. [Google Scholar] [CrossRef] [PubMed]


Disclaimer/Publisher’s Note: The statements, opinions and data contained in all publications are solely those of the individual author(s) and contributor(s) and not of MDPI and/or the editor(s). MDPI and/or the editor(s) disclaim responsibility for any injury to people or property resulting from any ideas, methods, instructions or products referred to in the content. |
© 2023 by the authors. Licensee MDPI, Basel, Switzerland. This article is an open access article distributed under the terms and conditions of the Creative Commons Attribution (CC BY) license (https://creativecommons.org/licenses/by/4.0/).