Abstract
Granular materials are widely prevalent in nature and industry, and the discrete element method (DEM) is the most effective method for the mechanical analysis of granular materials. Because of the difficulty inherent in friction coefficient determination, the friction behavior of granular geomaterials has always been a difficult problem in DEM. In order to study the variation rules of the sliding friction coefficients in DEM, an experiment designed to determine the sliding friction coefficient between particles with different shapes and different contact forms and an experiment designed to determine the sliding friction coefficient between particles and different boundaries were proposed, and the experimental results were fitted. In order to verify the reliability of the experiments, the fitting results were embedded into DEM software, and several packing experiments and simulation experiments were carried out and compared. The simulated results are detailed and discussed with reference to the experimental results as part of this paper. The results indicate that the simulation results are highly consistent with the experimental results, and the sliding friction coefficient obtained by the proposed experiment is in accordance with that determined theoretically. The sliding friction coefficient determined by fitting according to the experimental results can determine the sliding friction coefficient in DEM simulation and improve the accuracy of simulation results.
1. Introduction
Granular materials are widely prevalent in nature and industry, being found in weathered slopes, rockfill materials, railway slag, etc. The discrete element method (DEM) is the most effective method for the mechanical analysis of granular materials. DEM is a numerical approach proposed by Cundall and Strack [1,2,3] based on Newton’s second law. As a numerical method, DEM can be used for discontinuous media; therefore, this method is widely used in particle breakage [4,5,6], stress distribution [7,8,9], avalanching [10], stratification [11], and self-organization [12]. Because of the difficulty inherent in friction coefficient determination, the friction behavior of granular geomaterials has always been a problem in DEM. Present research methods of friction coefficient calibration in DEM mainly include the theoretical method, experimental method, and numerical simulation method.
The linear model [3] is one of the most widely used theoretical models. Many scholars [13,14,15,16] have conducted studies on the key parameters utilized in the linear model. The contact bond model is an optimized model based on the linear model. Several scholars [17,18,19] have used the model for simulation and applied different values of the friction coefficients according to uncoded values. Based on the theory of Mindlin and Deresiewicz [20], the Hertz contact model [21,22,23] is another widely used model. In order to study the mechanical behavior of soft particles interacting via frictional contacts, Nezamabadi [24] combined the Hertz contact model and the contact dynamics method. Ai [25] found, by comparing a variety of rolling resistance models, that the rolling friction coefficient is closely related to energy dissipation. Because of some assumptions made in DEM theory and the simplification of theoretical models, it is difficult to ensure the accuracy of associated research results.
Compared with the theoretical method, the experimental method is more intuitive and can provide a basis for theoretical research and numerical simulation research. Therefore, the experimental method is more widely used to study the friction coefficient in DEM. The uniaxial compression test and shear test are methods used to effectively determine the friction coefficient in DEM through laboratory testing [26,27,28,29]. Coetzee and Els [30] obtained stiffness coefficient and friction coefficient groups by combining uniaxial compression tests and direct shear simulation tests and obtained relevant parameters through simulation. On the other hand, the sandpile experiment is the most commonly used method for the DEM parameter calibration [31,32,33,34]. Frankowski [35] studied the influence of particle diameter and particle material on the friction coefficient by using 1.5 mm and 3 mm glass balls and 3 mm nylon balls in sandpile formation and rotating drum experiments and carried out numerical simulations simultaneously. Zhou [36] found, through experiments with glass spheres, that the sliding friction and the rolling friction between particles and between particles and boundaries both affect the stability of the sandpile. Some scholars [37,38] have also determined the friction coefficient with newer experimental methods. Boikov [39], through their experiment, determined the static friction coefficient and the dynamic friction coefficient.
Because the experimental method has inevitable defects, and subsequent research usually adopts the method of numerical simulation, numerical simulation is a research method that has developed rapidly in recent years. With the development of DEM-related theory and computing technology, more and more scholars have begun to implement numerical simulation methods to study the friction coefficient in DEM. In order to study the influence of the friction coefficient between particles in a ball mill, Rosenkranz [40] simulated the mechanical behavior of particles in a three-dimensional ball mill under different values of the sliding friction coefficients and found that the number of collisions decreased with an increase in the rolling friction coefficient. Liu [41] established a three-dimensional DEM particle sandpile simulation under different gradations based on experiments and studied the influence of rolling friction tangential force on particle contact. As part of a study investing the influence of the rolling friction coefficient on particle motion, Zhou [42], through the numerical simulation of sandpile formation and rolling drum experiments, found that the angle of repose increases with an increase in the rolling friction coefficient and decreases with an increase in particle size.
In addition, Horabik [43], Markauskas [44], and Iwashita [45] conducted a variety of simulations by using DEM, indicating the advancement of numerical simulation methods in the study of the friction coefficient in DEM.
Although the parameter calibration of the friction coefficient in DEM has been studied extensively, most research focuses on the rolling friction coefficient. There are still many underrecognized areas in the study of the sliding friction coefficient between particles and the friction coefficient between boundaries and particles. The purpose of this paper is to study the influence of particles with different shapes and sizes on the sliding friction coefficient between particles and the sliding friction coefficient between boundaries and particles in DEM by experiment. In the following content, experiments designed to determine the sliding friction coefficient between particles and the sliding friction coefficient between particles and different boundaries are first introduced. Then, numerical simulations parallel to the experiments were carried out by using particles with different shapes and sizes. The simulated results are detailed and discussed with reference to the experimental results. Finally, the influence of the boundaries on the sliding friction coefficient of particles was also studied.
2. Experimental Methods
In order to study the variation rules of the sliding friction coefficients in DEM, an improved method for measuring the sliding friction coefficient is proposed according to the methods of Liu [41]. This method can not only measure the sliding friction coefficient between particles and boundaries but can also measure the sliding friction coefficient between particles of different shapes and sizes.
2.1. Particles and Pad Materials
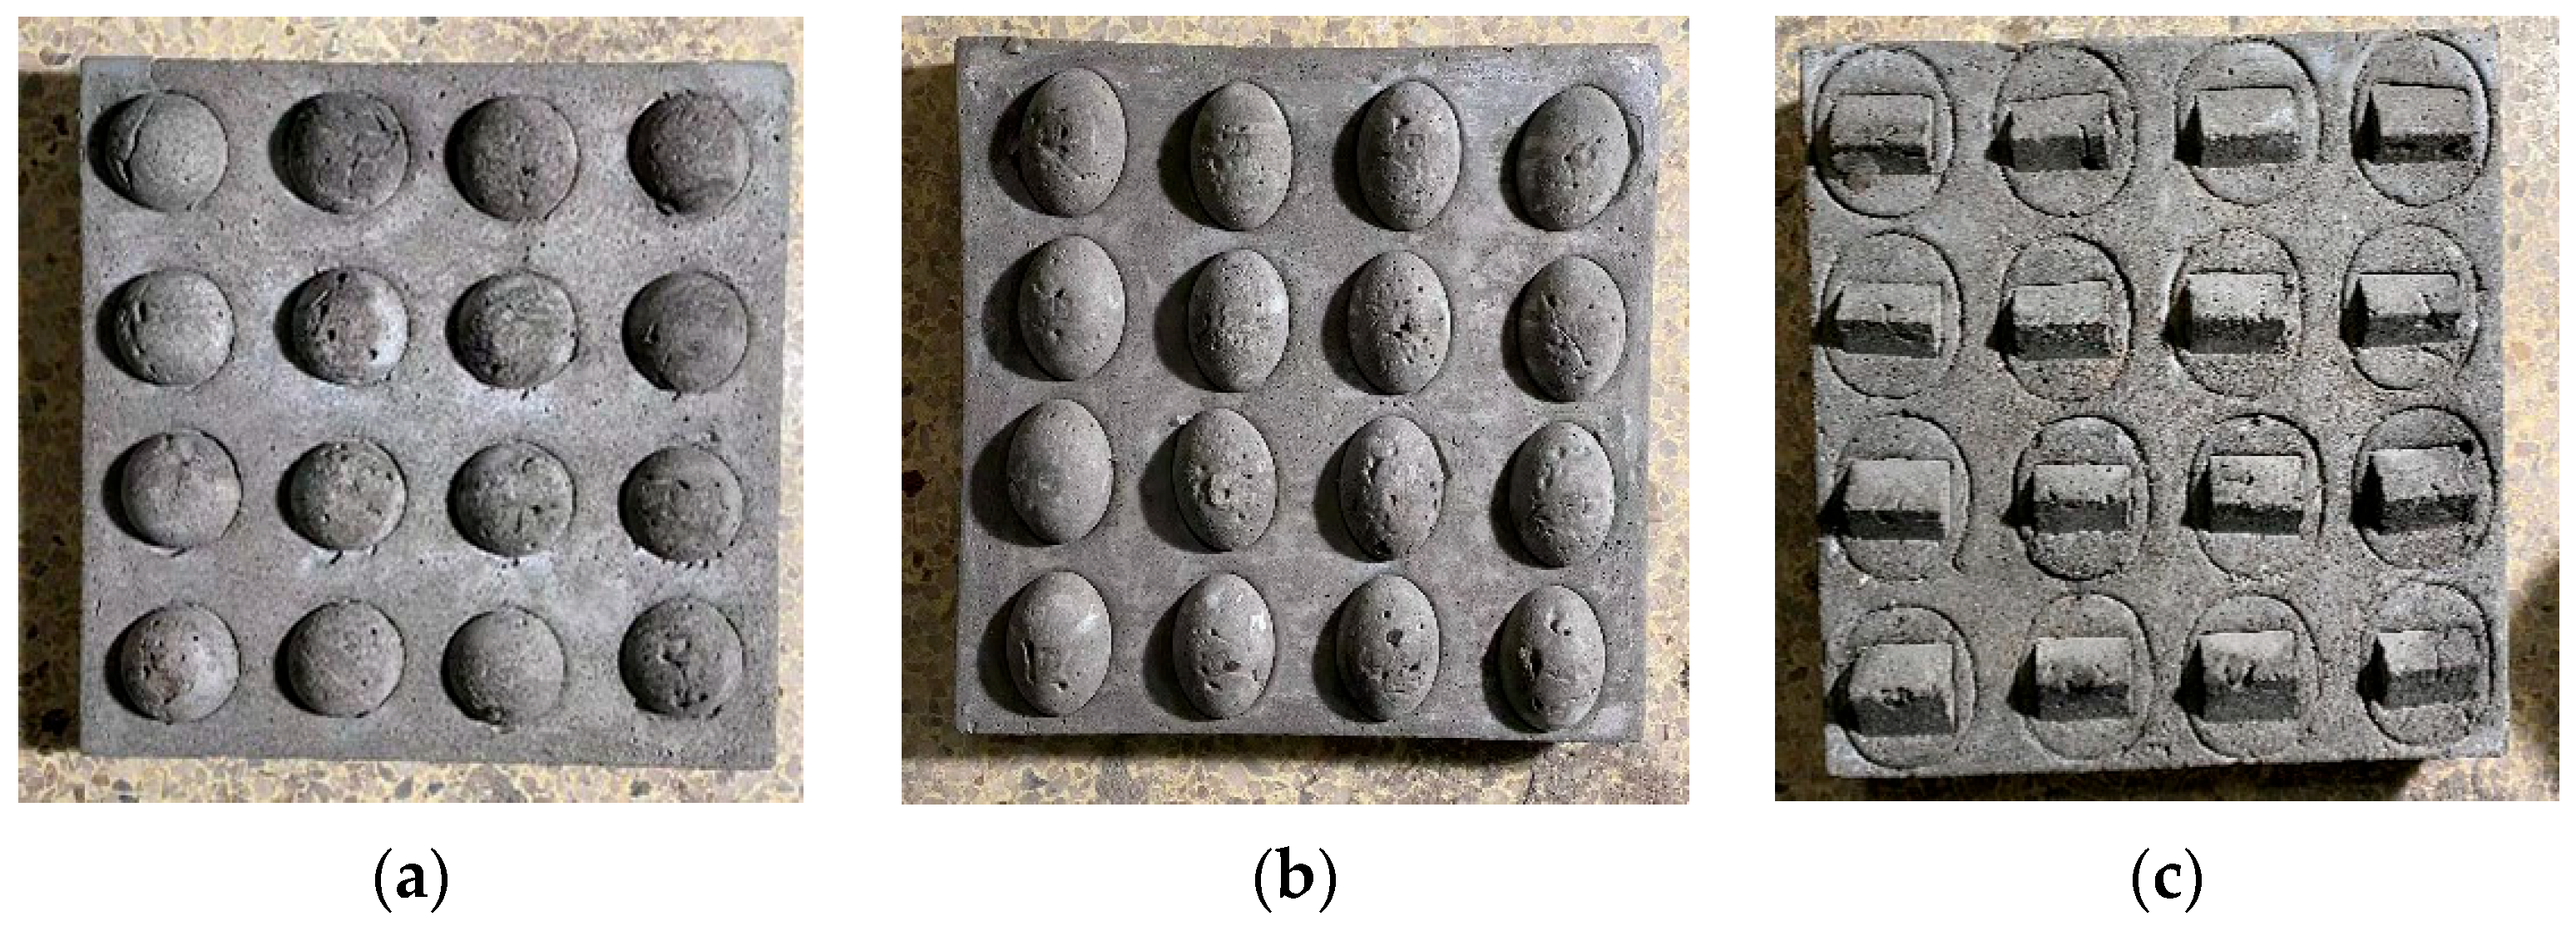
In this study, spheres, ellipsoids, and polyhedron particles were made in cement, and embedded into cement plates as samples [46,47]. The cement mortar samples were made according to a mass ratio of cement:water:lime paste:sand = 1:0.68:0.29:3.3. All particles were divided into nine groups according to different sizes and shapes. The group name, average size, and number of particles of each group are listed in Table 1. Under Table 1’s group label heading, S, E, and P represent sphere, ellipsoid, and polyhedron, respectively; subscripts indicate the diameter of the spheres; maj and min subscripts indicate ellipsoid contacts with the major axis, and the ellipsoid contacts with the minor axis, respectively; the subscripts p, e, and f represent the point contact, edge contact, and face contact of polyhedron, respectively. The same naming method is used henceforth. Individual groups of particles were divided into two parts on average, the parts were then embedded into two cement plates, and the peaks of the outside part were kept horizontal, as shown in Figure 1.

Table 1.
Average sizes, and number of particles for twelve particle groups.

Figure 1.
(a) Photograph of a block with embedded sphere particles; (b) Photograph of a block with embedded ellipsoid particles; (c) Photograph of a block with embedded cube particles.
In order to measure the sliding friction coefficient between the particles and boundaries, four kinds of pad materials were applied, including wood board, glass board, crocus paper, and flint paper.
2.2. Determination of the Sliding Friction Coefficient
Based on the methodology of Liu [41], an improved experimental method for measuring the sliding friction coefficient is proposed. This method can reduce the deviation that may be caused during the experiment and is more convenient than the original method and can determine the sliding friction coefficient between particles and the sliding friction coefficient between particles and boundaries.
The main steps in determining the sliding friction coefficient between particles were carried out as follows: (1) After the test bench was leveled, the peaks of the two plates were placed on the test bench so that they were in contact with each other, and a lifting platform was placed on the rear side of the test bench. The height of the lifting platform was measured at the point of minimal contact with the test bench, recorded as h1, as shown in Figure 2a; (2) The distance from the front of the test bench to the rear of it was measured, recorded as s. The height of the rear side of the lifting platform was slowly raised, so that the test bench was gradually tilted, as shown in Figure 2b; (3) When the sliding phenomenon occurred in the upper sample, the rising of the lifting platform rising stopped, as shown in Figure 2c. The rising height h2 of the lifting platform was measured at this time, and the sliding friction coefficient under different contact forms was calculated. The sliding friction coefficient can be calculated as follows:

Figure 2.
Measurement method of the sliding friction coefficient between particles. (a) Initial state. (b) Lifting state. (c) Final state.
The test was repeated five times, each value of experimental data was recorded, and the average value of the sliding friction coefficient was calculated. The experimental results are shown in Table 2.

Table 2.
Sliding friction coefficients between particles.
The test process for determining the sliding friction coefficient between particles and the pads was the same as the experimental method described above. The only difference was the replacement of the sample plate placed on the test bench with a pad. The test was repeated five times under the same contact condition, each value of experimental data was recorded, and the average value of the sliding friction coefficient was calculated. The experimental results are shown in Table 3.

Table 3.
Sliding friction coefficients between particles and pads.
2.3. Method of Packing
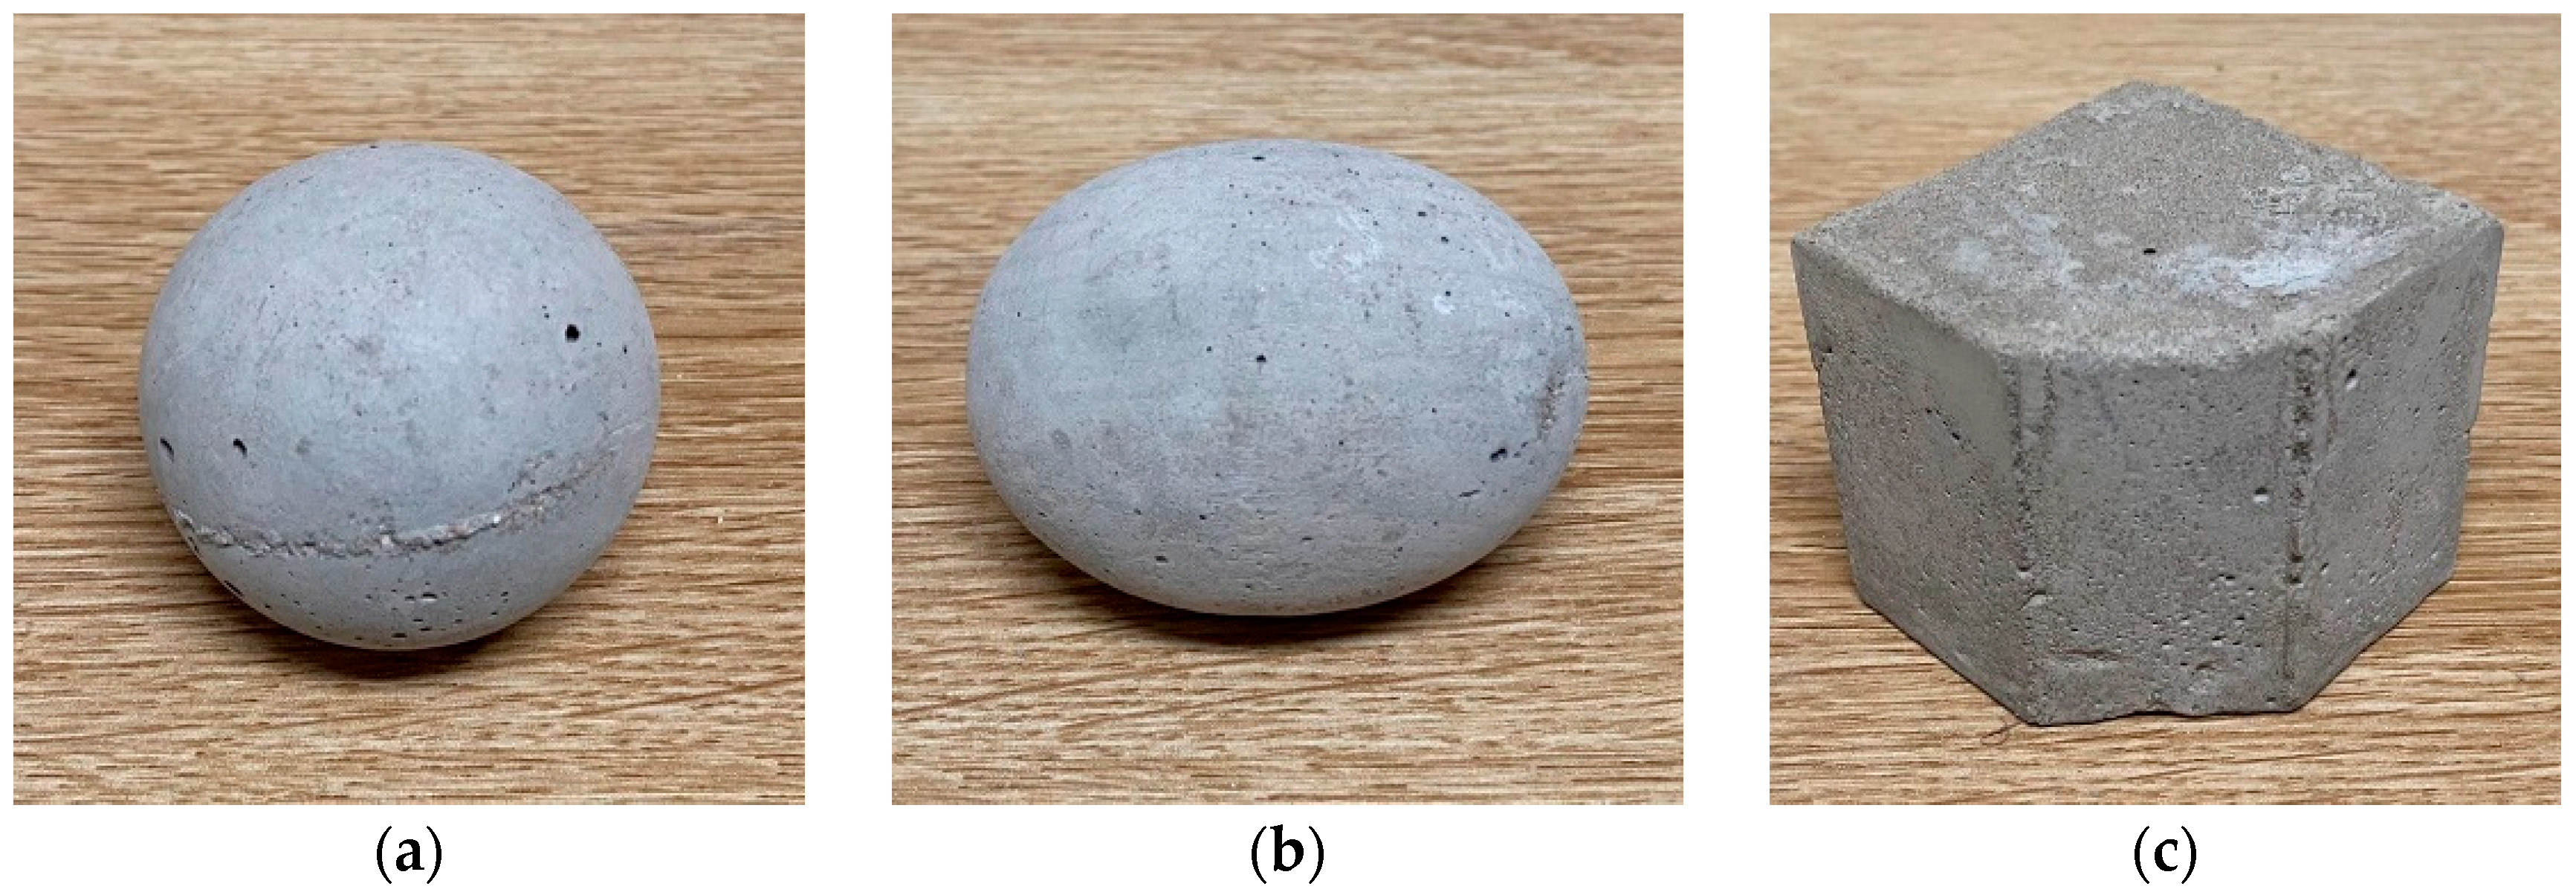
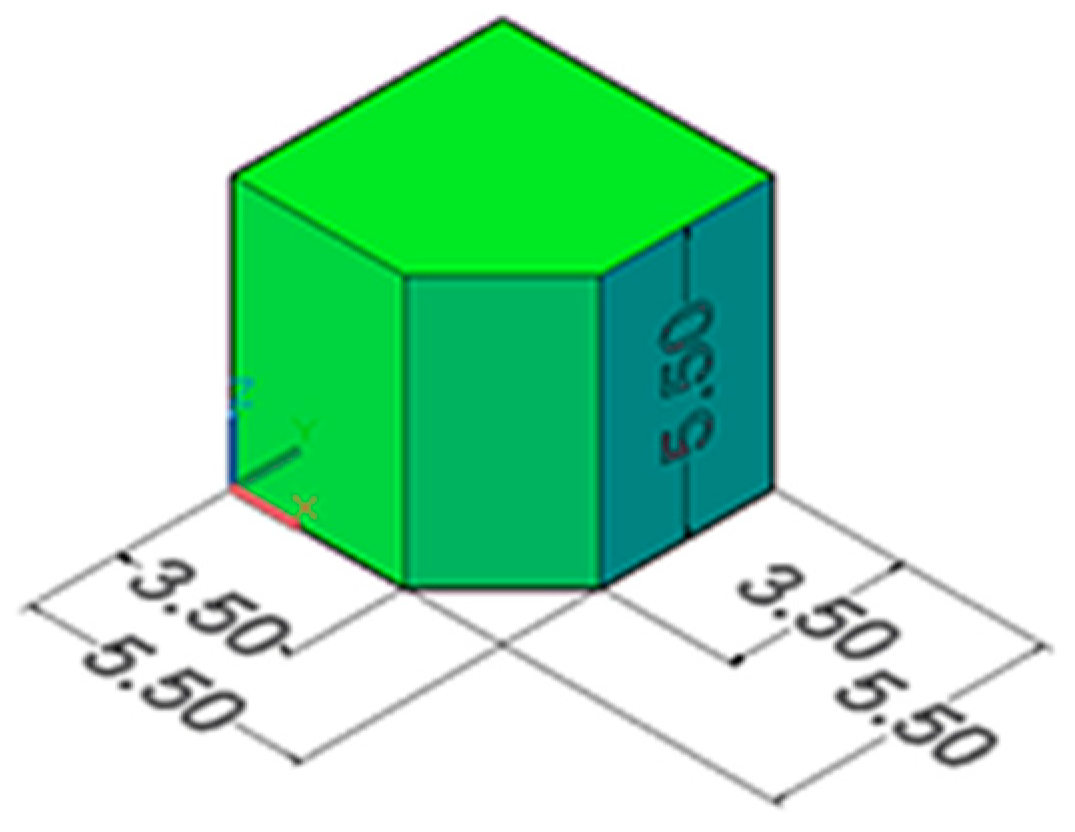
In order to verify the reliability of the sliding friction coefficient determined by the above experiment, packing experiment was carried out. Three different particle shapes are shown in Figure 3. The name, average size, and number of particles of three groups of differently shaped particles are shown in Table 4. According to the different sizes and shapes of particles, the number of particles contained in each group is different. The particle shape and number of particles contained in each group are shown in Table 5.

Figure 3.
Particle shapes: (a) Sphere particle; (b) Ellipsoid particle; (c) Polyhedron particle.

Table 4.
Average size and number of particles of packing samples.

Figure 4.
Average size of polyhedron.
Table 4.
Average size and number of particles of packing samples.
| Particle Name | Average Size (cm) | Number of Particles |
|---|---|---|
| Sphere | D = 4.97 | 66 |
| Ellipsoid | 6.03 × 4.33 × 4.33 | 66 |
| Polyhedron | As is shown in Figure 4 | 29 |

Table 5.
Constituent particles and number of particles of packing samples.
Table 5.
Constituent particles and number of particles of packing samples.
| Group Name | Contain Particles | Amount |
|---|---|---|
| S–S | Sphere | 66 |
| E–E | Ellipsoid | 66 |
| P–P | Polyhedron | 29 |
| S–E | Sphere and ellipsoid | 33 for each |
| S–P | Sphere and polyhedron | 28 for each |
| E–P | Ellipsoid and polyhedron | 28 for each |
A rectangular container with an upper opening was placed on the platform, and the particles were poured into the center of the container one by one. After the samples were stable, a pile was formed.
3. Simulated Method
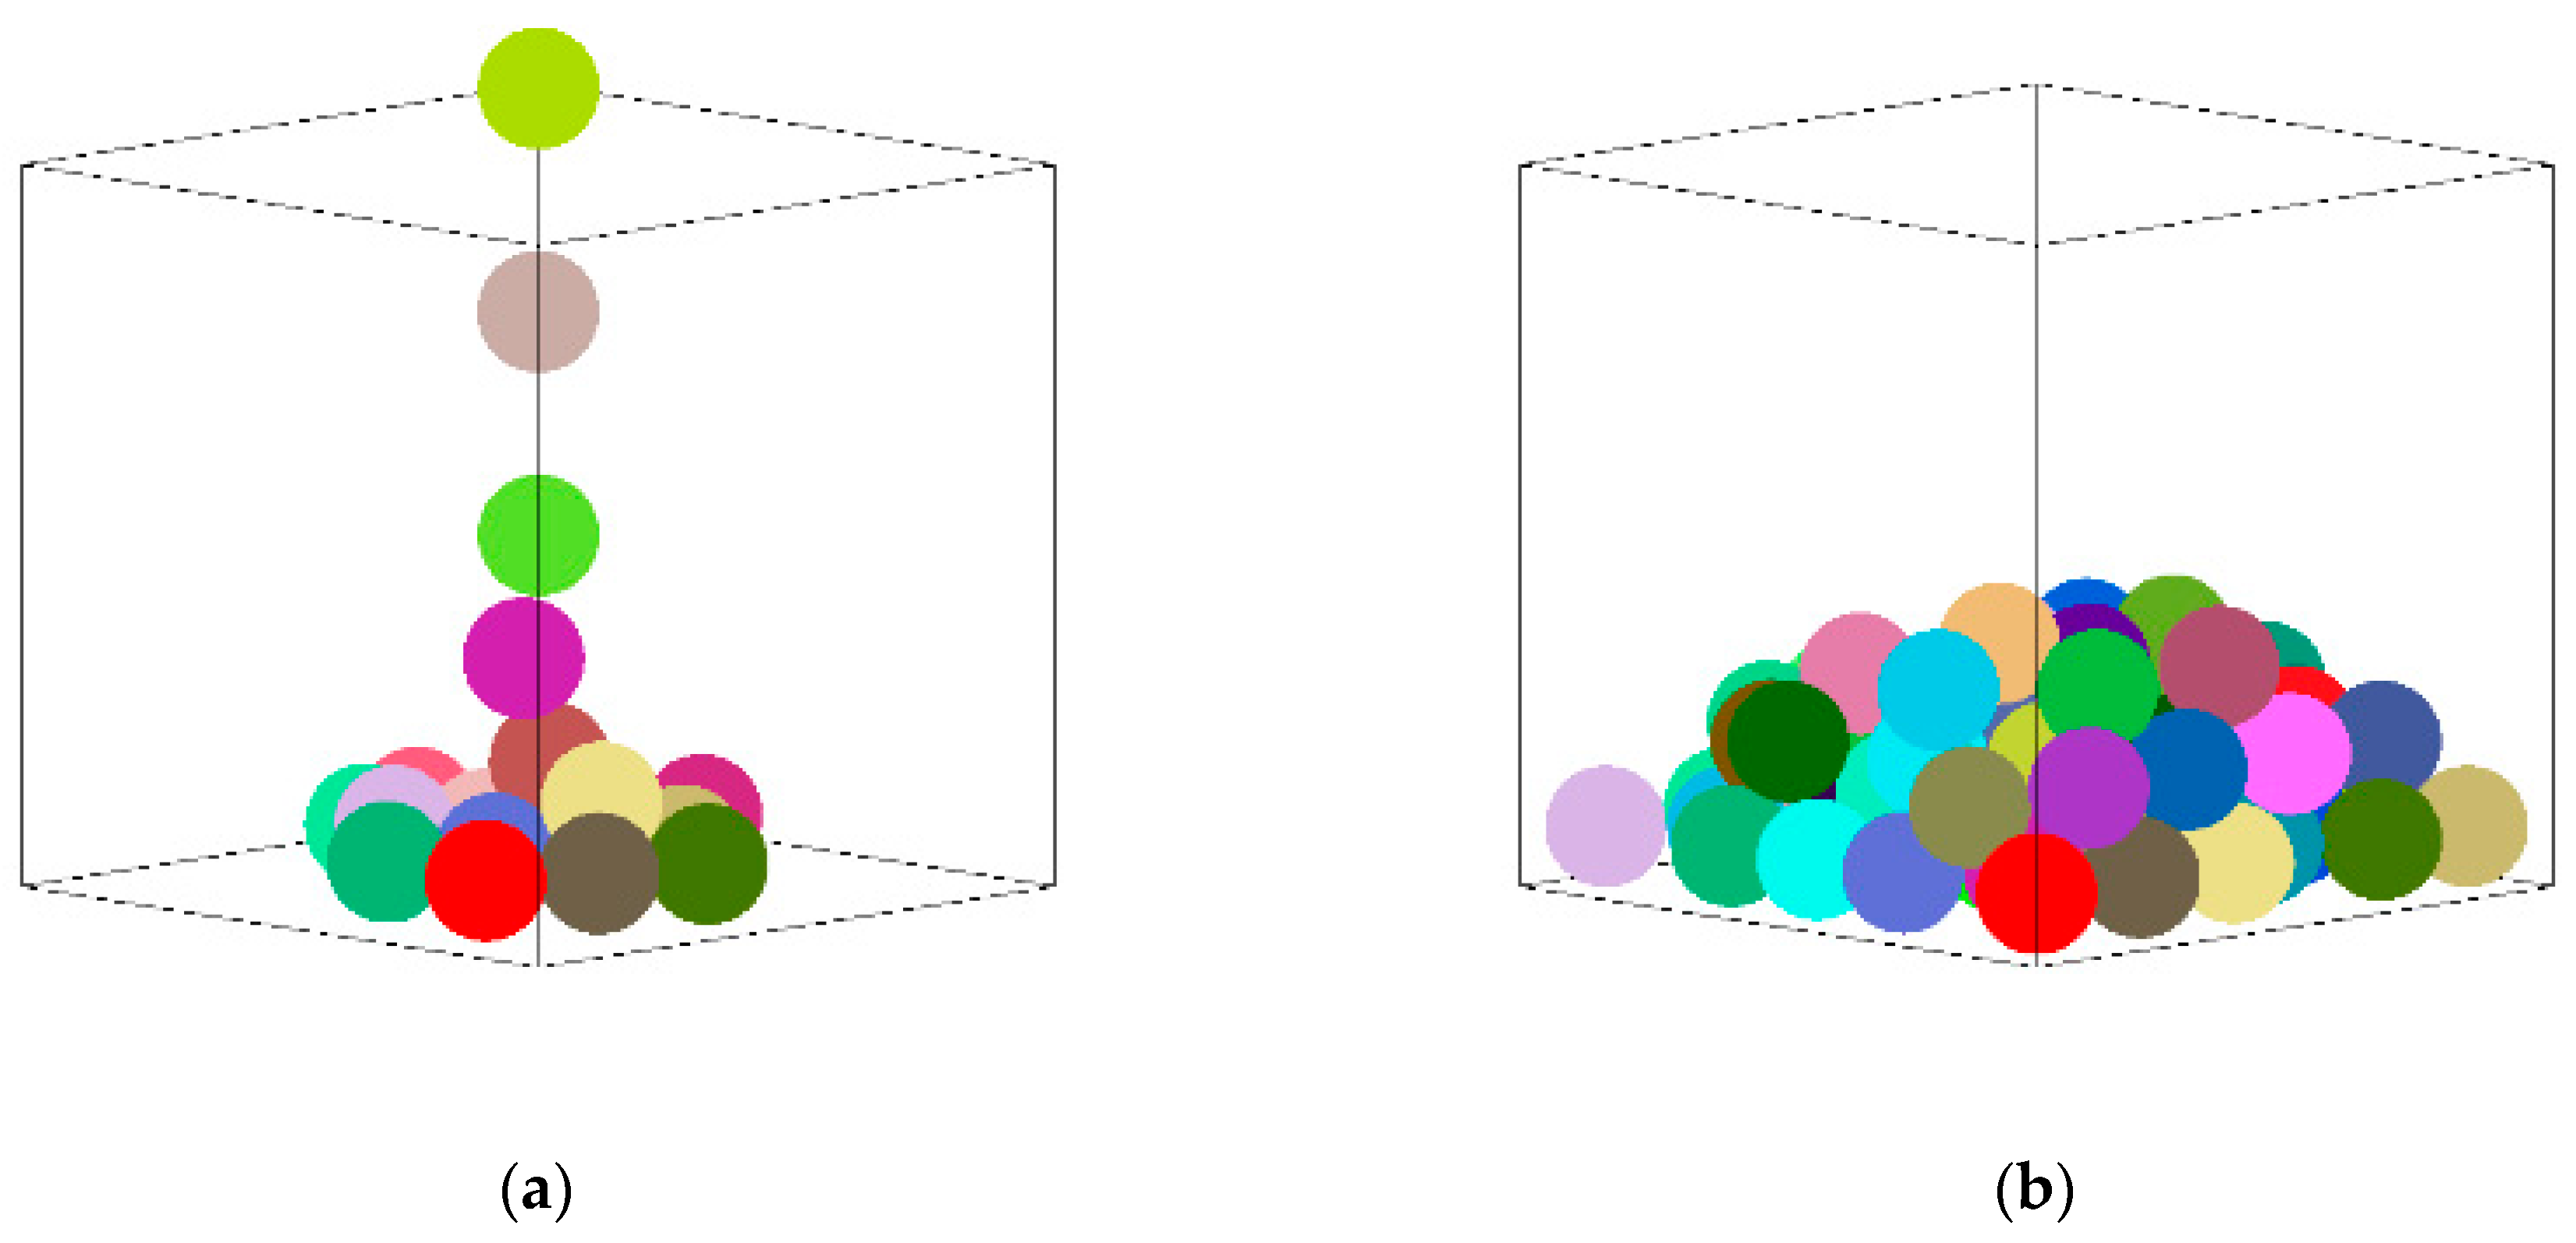
Based on the M-D theory [20], a container with an upper opening was generated first. According to the group division as shown in Table 5, fixed-size particles were generated one by one above the center of the top of the container, as shown in Figure 5a. After, all the particles were stabilized by gravity, as is shown in Figure 5b.

Figure 5.
Two configurations during the process of sandpile formation for group S–S. (a) Initial state. (b) Final state.
4. Results and Discussion
The discrete element method (DEM) is the most effective method for the mechanical analysis of granular geomaterials. Because of the difficulty inherent in friction coefficient determination, the friction behavior of granular materials has always been a problem in DEM. The friction coefficient includes the rolling friction coefficient and sliding friction coefficient [34]. There are many influencing factors that are not only related to the characteristics of the material itself but also to the environment in which the material is located [48]. In this study, packing experiments and numerical simulation were carried out simultaneously, and the simulation results of each group were compared with the corresponding packing experiments.
4.1. Analysis of Sliding Friction Coefficient
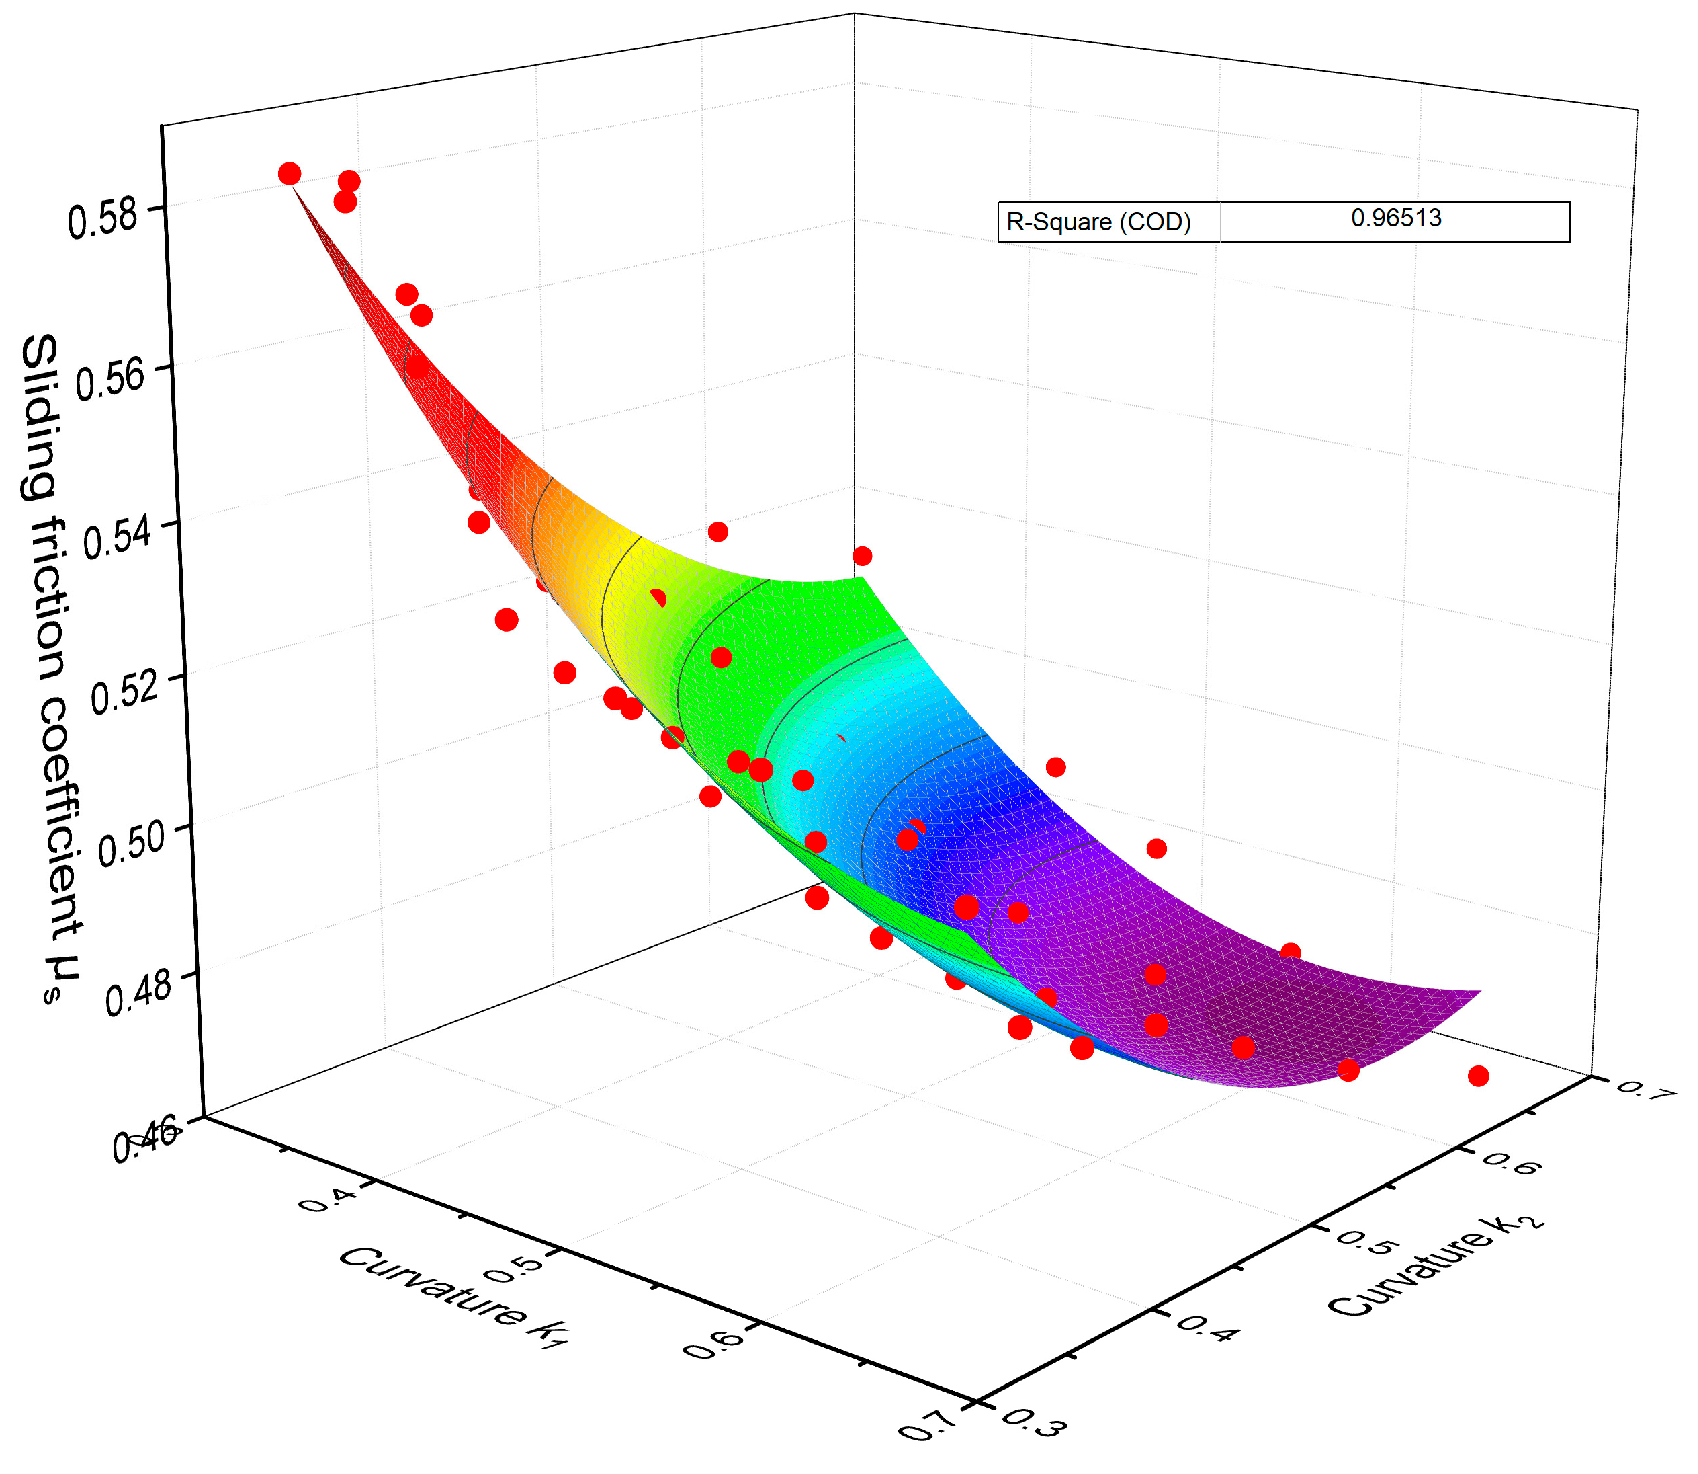
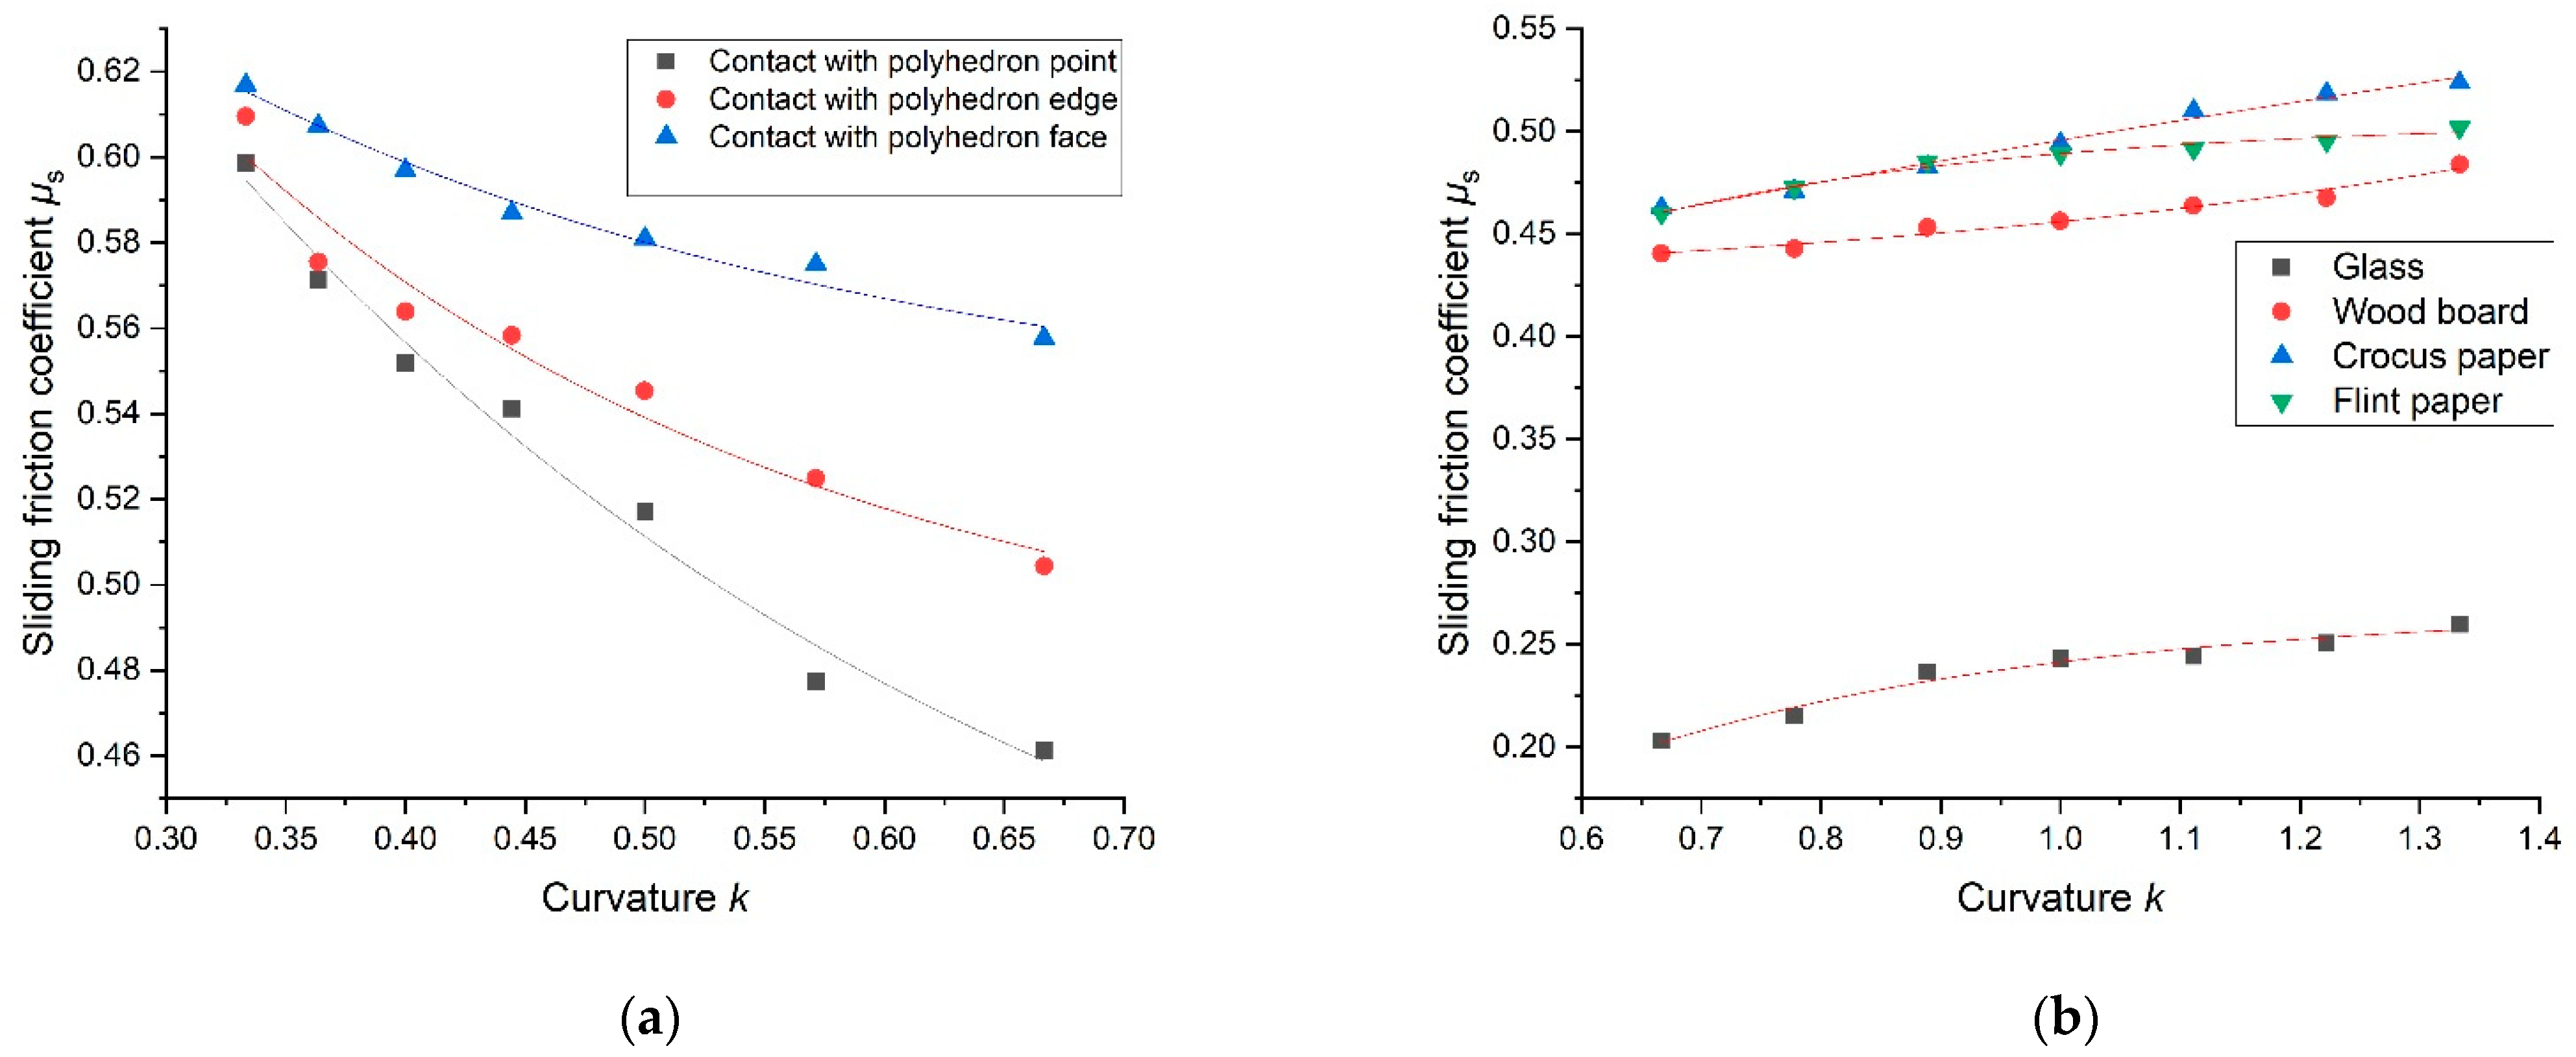
The samples had slight defects on the surface due to insufficient vibration, but these defects had minimal impact on the results. According to the sliding friction coefficient obtained from Table 2 and Table 3, the results were fitted. The fitting result of the sliding friction coefficient between sphere particles is shown in Figure 6. Because the variation range of the sliding friction coefficient of the sphere–ellipsoid group was very small, bilinear interpolation was used to calculate the sliding friction coefficient of the sphere–ellipsoid. The sliding friction coefficient of the ellipsoid–ellipsoid group was fitted by plane fitting, and the sliding friction coefficient of the ellipsoid–polyhedron group was fitted by linear fitting. The fitting result of the sliding friction coefficient of the sphere–polyhedron group is shown in Figure 7a. The fitting result of the sliding friction coefficient between the sphere particles and the four different pads is shown in Figure 7b.

Figure 6.
Relationship between the sliding friction coefficient and the curvature of sphere particles in the contact of sphere particles with sphere particles.

Figure 7.
(a) Relationship between the sliding friction coefficient and the curvature of sphere particles during the contact of sphere particles with polyhedron particles; (b) Relationship between the sliding friction coefficient and the curvature of sphere particles during the contact of sphere particles with different boundaries.
It can be seen from Figure 6 that when two sphere particles are in contact, the sliding friction coefficient changes obviously with the curvature of the particles. The sliding friction coefficient decreases with an increase in the curvature of the two spheres. When the two contact spheres differ in size, the sliding friction coefficient cannot be determined from the curvature of the single sphere. Comparing the fitting results of sphere–sphere, ellipsoid–ellipsoid, and sphere–ellipsoid groups, it is shown that the fitting result shown in Figure 6 is not applicable when ellipsoid particles are involved in contact. The main reason is that the ellipsoid particles have different curvatures at different positions.
It can be seen from Figure 7a that when the sphere particles and the polyhedron particles are in contact, the sliding friction coefficient of the point–face contact is the largest, the sliding friction coefficient of the point–point contact is the smallest, and the sliding friction coefficient of the point–edge contact lies between the two. The sliding friction coefficient decreases with an increase in the curvature of the sphere. The sliding friction coefficient of the point–face and point–edge contacts change slowly with an increase in curvature, however, the sliding friction coefficient of the point–point contact changes sharply with an increase in curvature. The same conclusion can be obtained by the fitting result of the sliding friction coefficient of the ellipsoid–polyhedron contact.
It can be clearly seen from Figure 7b that the sliding friction coefficient of the glass in contact with the sphere particles is the smallest, and it is the largest when the flint paper is in contact with the particles; the sliding friction coefficient during contact between the crocus paper and the sphere particles is the second largest, and the sliding friction coefficient during contact between the sphere particles and the wood board is slightly lower than that during contact between the flint paper and the wood board.
4.2. Analysis of Sandpile Formation
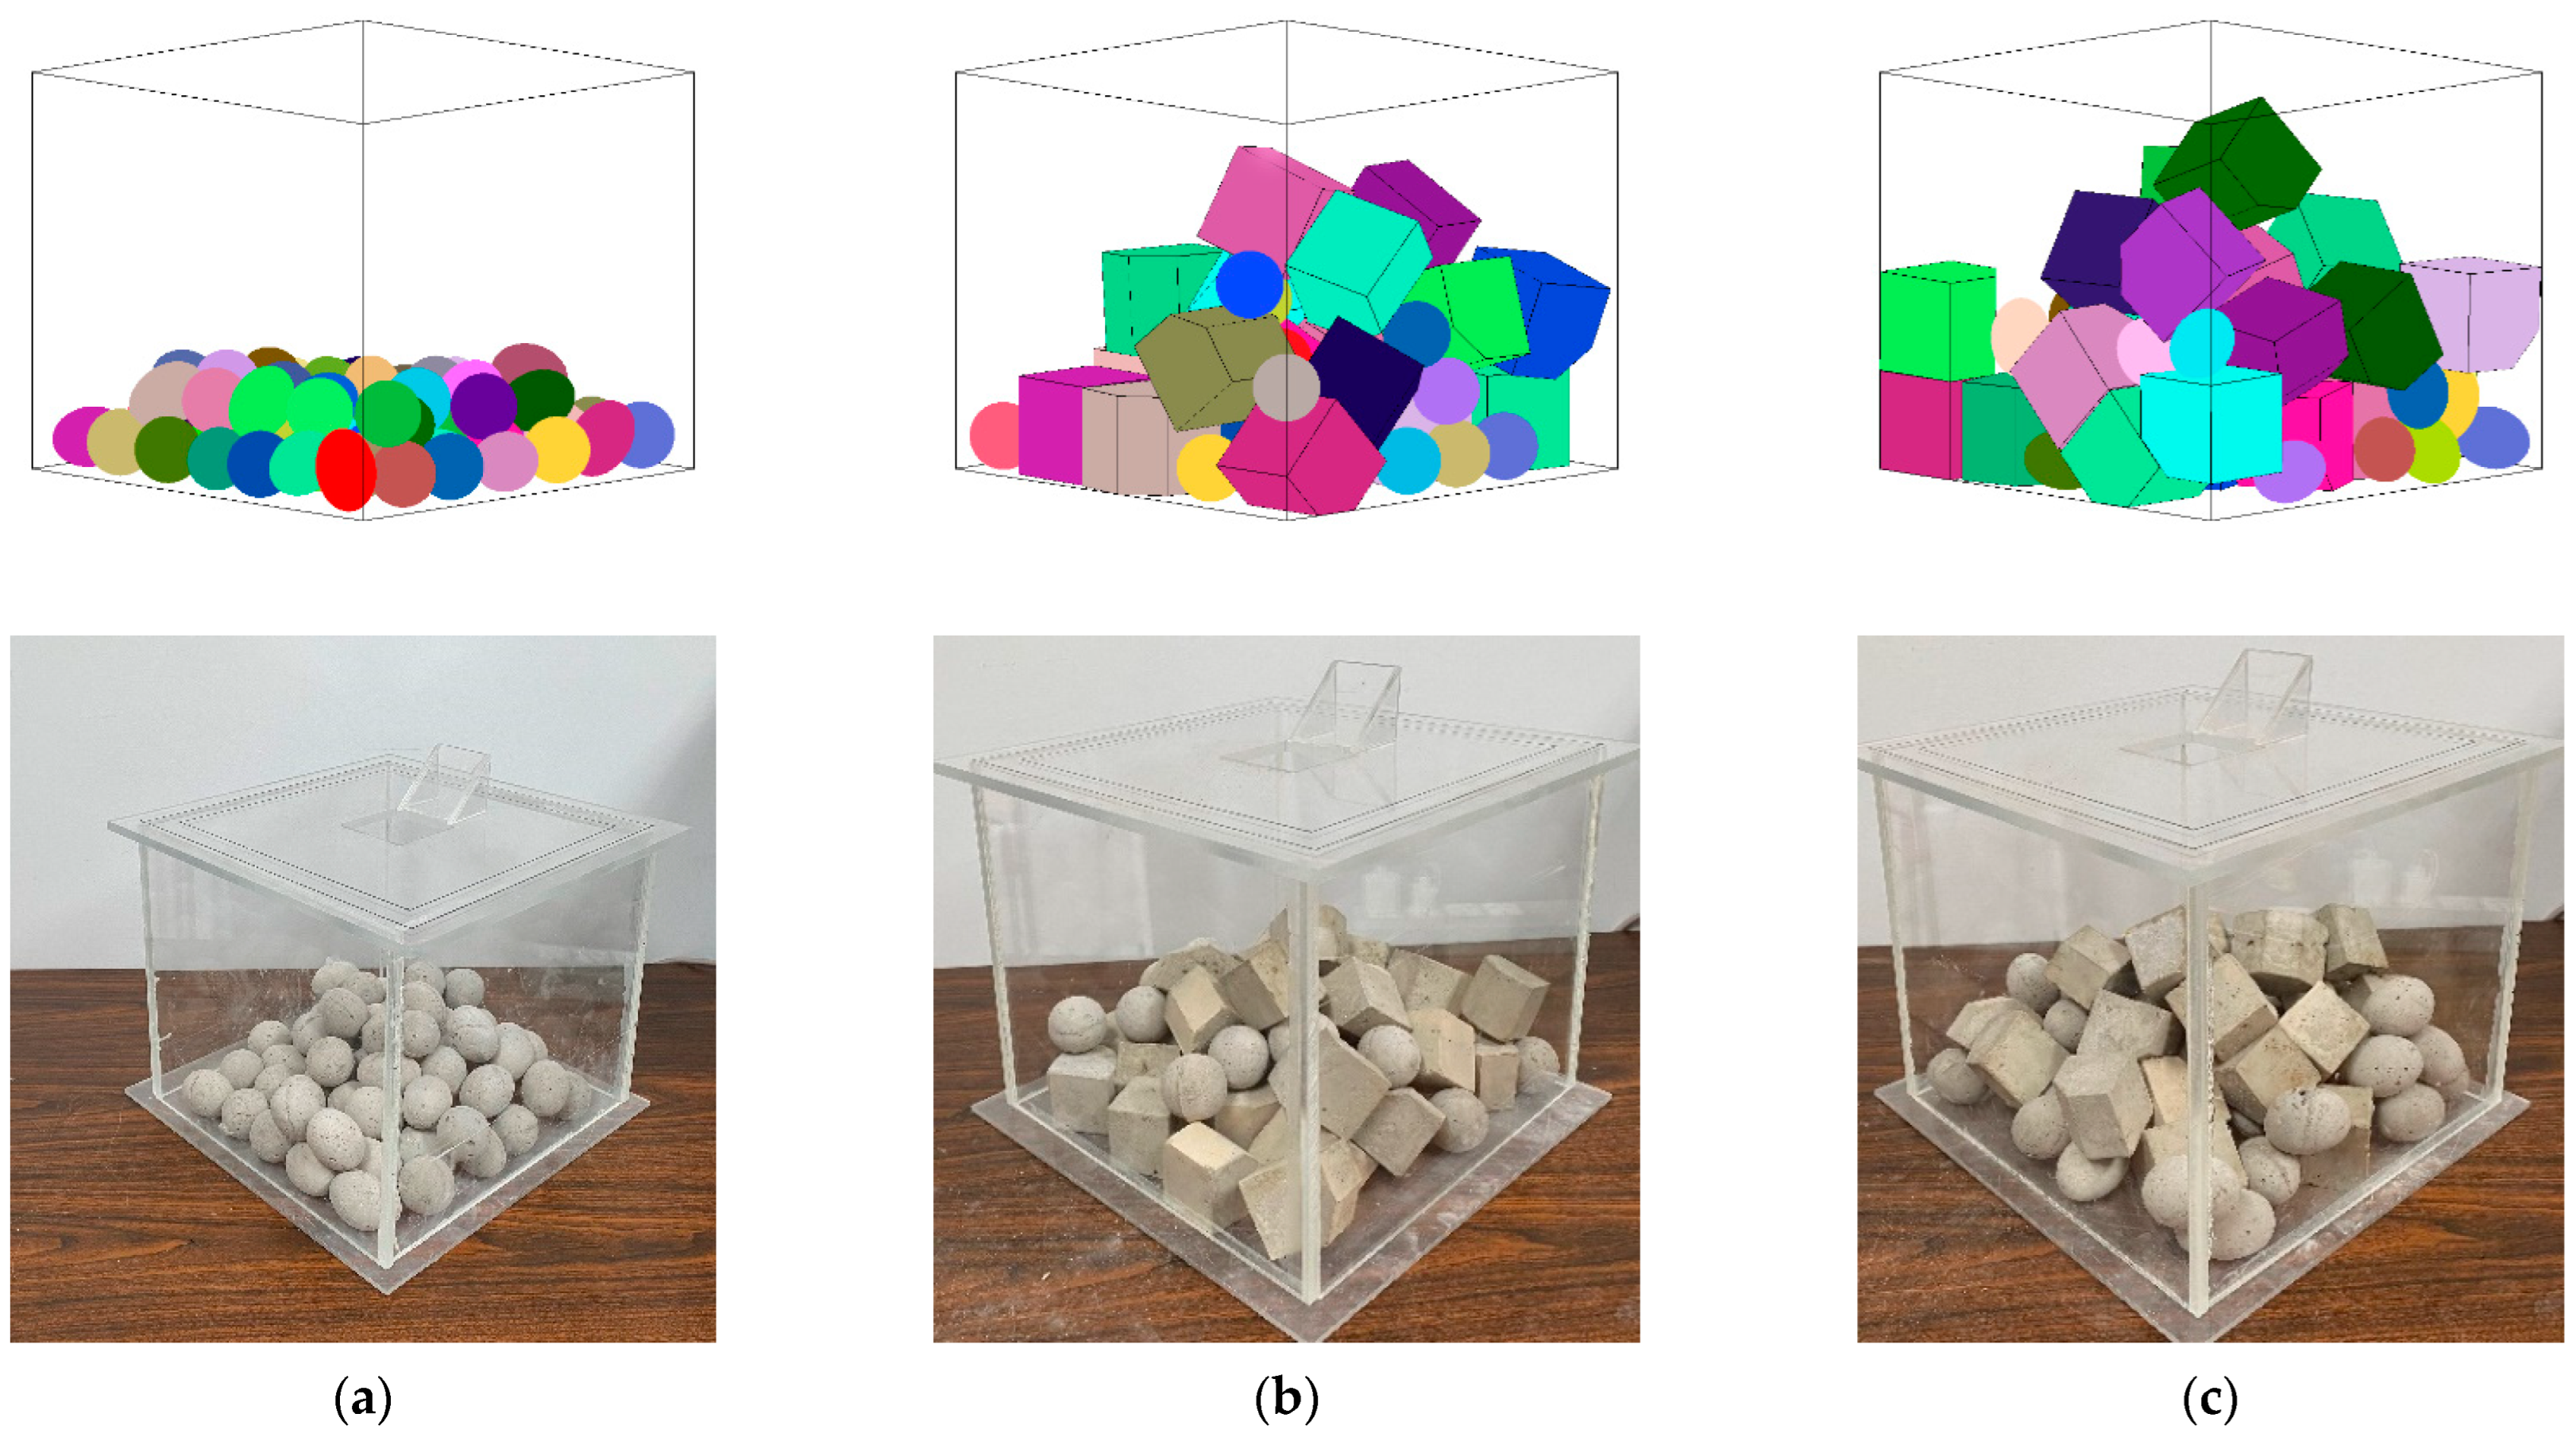
According to the grouping described in Table 5, a packing experiment was carried out in a container with dimensions of 35 cm × 35 cm × 35 cm, and the chosen pad was glass. Numerical simulation was carried out simultaneously, and the friction between particles and the vertical boundary was ignored. The parameters used in the simulation are shown in Table 4 and Table 6. In Table 6, ρ, E, and ν were selected by referring to Liu [41].

Table 6.
Parameters for the simulations.
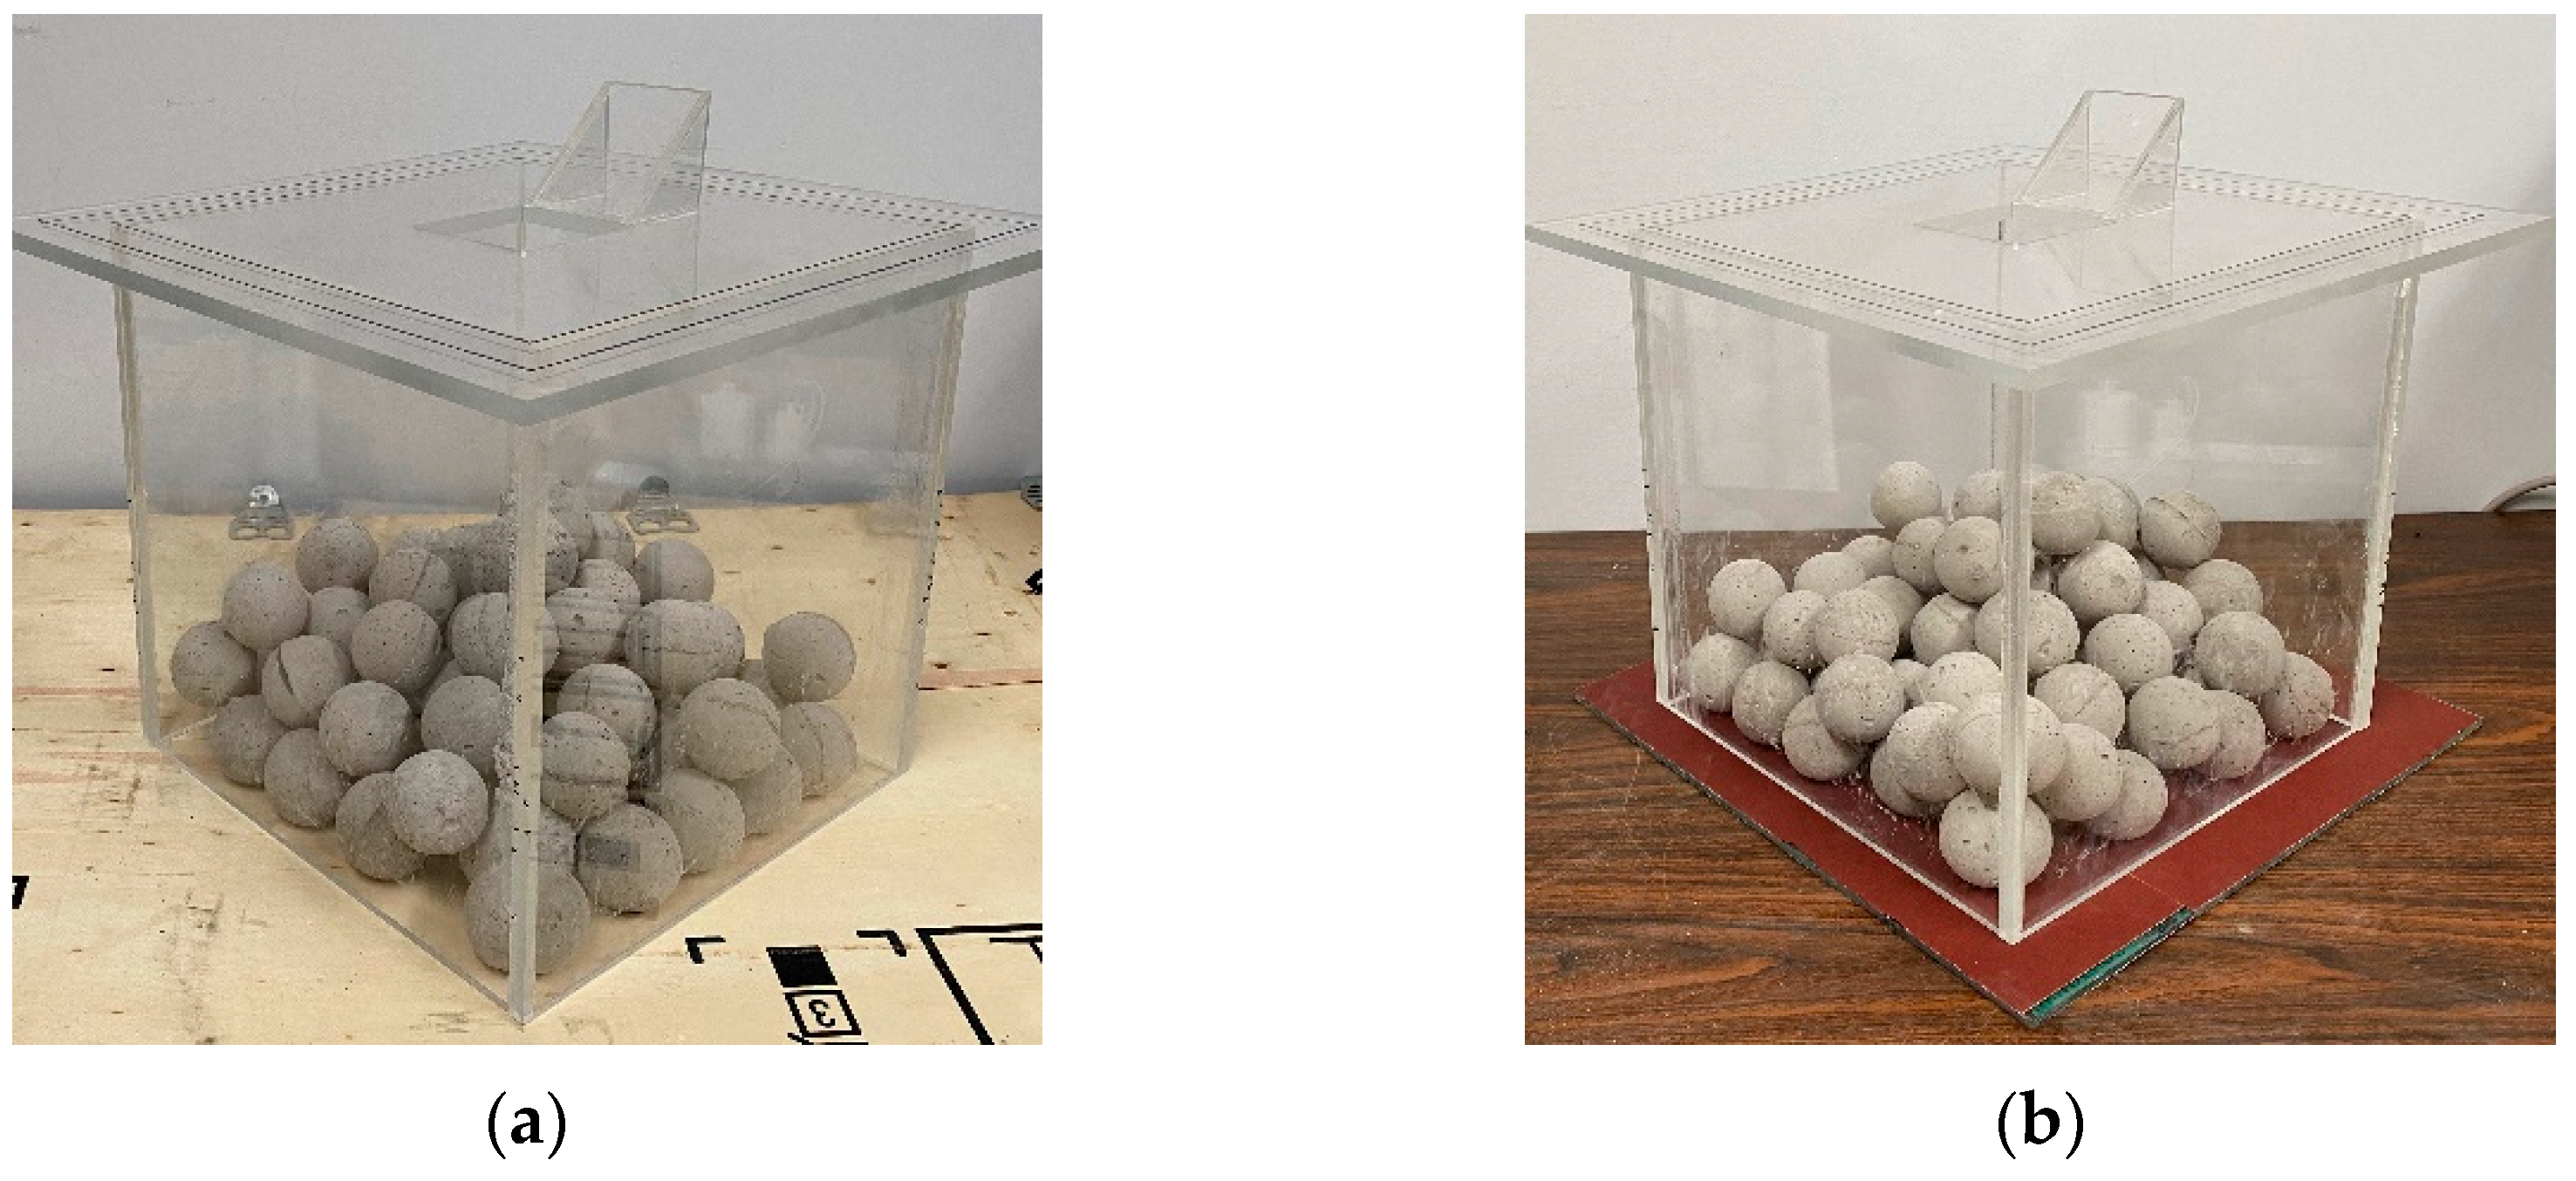
The results of the packing experiment and numerical simulation are shown In Figure 8 and Figure 9. It can be seen from the figure that the packing morphologies obtained by the experiment and by the numerical simulation are basically the same, and the packing heights of the particles are very close between the methods. The above analysis results indicate the correctness of the experimental method proposed in this study.


Figure 8.
(a) Simulated and experimental sandpile configurations of S–S group (glass pad); (b) Simulated and experimental sandpile configurations of E–E group (glass pad); (c) Simulated and experimental sandpile configurations of P–P group (glass pad).

Figure 9.
(a) Simulated and experimental sandpile configurations of S–E group (glass pad); (b) Simulated and experimental sandpile configurations of S–P group (glass pad); (c) Simulated and experimental sandpile configurations of E–P group (glass pad).
Table 7 displays the average ordinate value and the deviation of each group of specific particles after the simulation and experiment, and 10 particles in each group were selected as specific particles. As is shown in Table 7, the deviation between simulated and experimental results is nearly 1%. The deviation in the S–E group is slightly bigger than other deviations, but the difference in average ordinate values between the simulation and experiment of the S–E group is only 0.22 cm. Comparing this difference with the dimensions of the sphere particles and ellipsoid particles (about 5 cm–6 cm) used in the study, it is acceptable. The results indicate that the simulation and the experiment are basically the same. The experimental method proposed in this study can effectively determine the sliding friction coefficient between particles in DEM, and the sliding friction coefficient determined by fitting according to the experimental results can be applied to the numerical simulation of DEM, which improves the accuracy of the simulation results.

Table 7.
The repose angle and the deviation of several groups under the condition of glass pads from simulated and experiment results.
4.3. Sliding Friction Coefficient between Particles and Boundaries
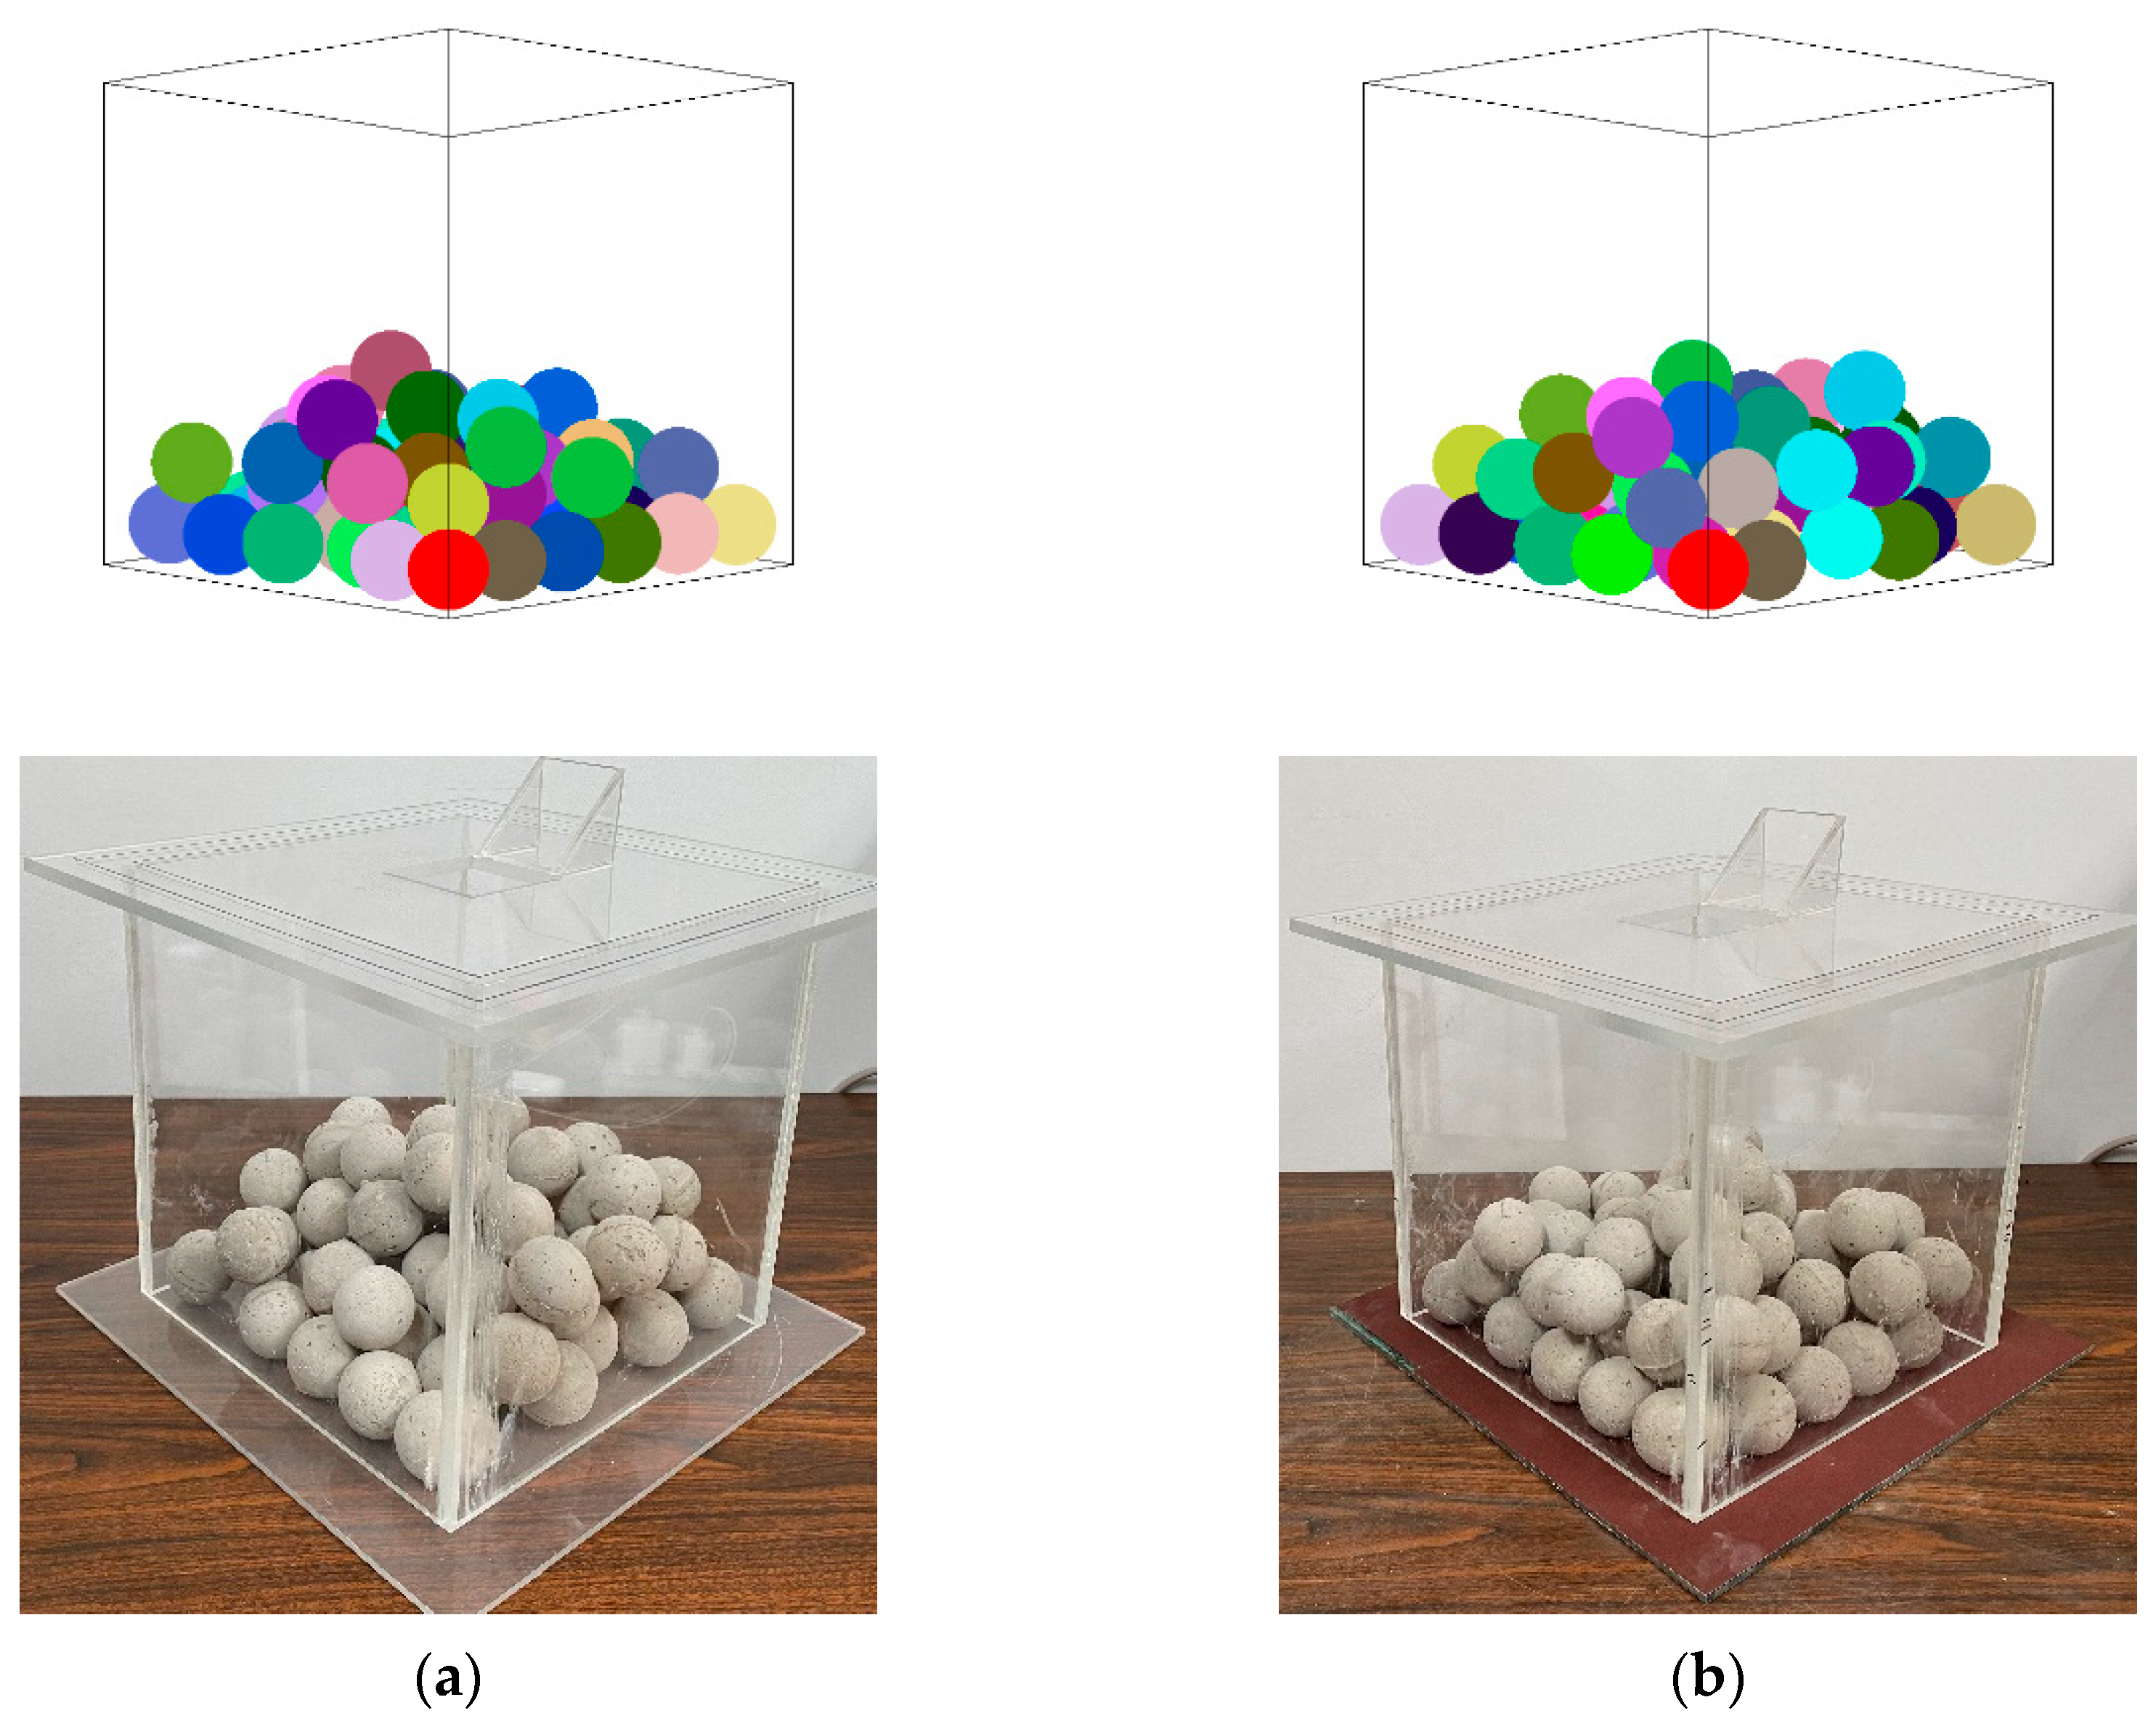
The S–S group as defined in Table 5 was used for a packing experiment in a 30 cm × 30 cm × 30 cm container, and the pads used were made of glass, wood board, flint paper, or crocus paper. Numerical simulation was carried out simultaneously, and the friction between particles and the vertical boundary was ignored. The parameters used in the simulation are shown in Table 6. According to Figure 7b, the sliding friction coefficient of the sphere particles in contact with different boundaries was applied.
The results of the packing experiment and numerical simulation are shown in Figure 10 and Figure 11. It can be seen from the figure that the packing morphologies obtained by the experiment and the numerical simulation are basically the same, and the packing height of the particles is very close between the methods. The above analysis results indicate the correctness of the experimental method proposed in this study.

Figure 10.
(a) Simulated and experimental sandpile configurations of S–S group (glass pad); (b) Simulated and experimental sandpile configurations of S–S group (crocus paper pad).


Figure 11.
(a) Simulated and experimental sandpile configurations of S–S group (wooden board pad); (b) Simulated and experimental sandpile configurations of S–S group (flint paper pad).
Table 8 displays the average ordinate value and deviation of each group of specific particles after the simulation and experiment, and 10 particles in each group were selected as specific particles. As is shown in Table 8, the deviation between the simulated and experimental results is very small, between 1% and 3%. It is proven that the simulated height is basically consistent with the experimental height, indicating that the experimental method proposed in this study can effectively determine the sliding friction coefficient of particles and boundaries in DEM, and the sliding friction coefficient determined by fitting according to the experimental results can be applied to the numerical simulation of DEM to improve the accuracy of simulation results.

Table 8.
The repose angle and the deviation of S–S group under several conditions of pads from simulated and experiment results.
5. Conclusions
In this paper, an experiment designed to determine the sliding friction coefficient between particles with different shapes and different contact forms and an experiment designed to determine the sliding friction coefficient between particles and different boundaries were proposed, and the experimental results were fitted. In order to verify the reliability of the experiments, several packing experiments and simulation experiments were carried out and compared. The following conclusions are derived:
- The sliding friction coefficient between two sphere particles varies with curvature and cannot be calculated based solely on the curvature of a single sphere. However, due to the variations in curvature at different points, this fitting result is not valid when the ellipsoid is involved in contact.
- Based on the sliding coefficient acquired using the suggested experiment approach, the packing experiment and the numerical simulation of the particles in the container are essentially the same. The experiment approach presented in this work can be used to efficiently determine the sliding friction coefficient between particles and between particles and boundaries in DEM.
- The sliding friction coefficient found by fitting the experimental data can be used to increase the accuracy of the numerical simulation of the DEM.
Author Contributions
P.L. contributed to the conceptualization, resources, and formal analysis. J.L. contributed to the software and methodology. S.G. contributed to data curation. Y.W., H.Z., M.Z., F.Z., Z.L., C.O. and R.Z. contributed to writing—review and editing. All authors have read and agreed to the published version of the manuscript.
Funding
This work was supported by the National Natural Science Foundation of China (NO. 51874118; NO. 51778211).
Institutional Review Board Statement
Not applicable.
Informed Consent Statement
Not applicable.
Data Availability Statement
Some or all data, models, or codes that support the findings of this study are available from the corresponding author upon reasonable request.
Conflicts of Interest
The authors declare no conflict of interest.
References
- Cundall, P.A. A computer model for simulating progressive, large-scale movement in blocky rock system. In Proceedings of the International Symposium on Rock Mechanics, Nancy, France, 4–6 October 1971; pp. 129–136. [Google Scholar]
- Cundall, P.; Strack, O. The Distinct Element Method as a Tool for Research in Granular Media; University of Minnesota: Minneapolis, MN, USA, 1978. [Google Scholar]
- Cundall, P.A.; Strack, O.D.L. A discrete numerical model for granular assemblies. Géotechnique 1979, 29, 47–65. [Google Scholar] [CrossRef]
- Mao, W.; Yang, Y.; Lin, W.; Aoyama, S.; Towhata, I. High frequency acoustic emissions observed during model pile penetration in sand and implications for particle breakage behavior. Int. J. Geomech. 2018, 18, 04018143. [Google Scholar] [CrossRef]
- Yu, F. Influence of particle breakage on behavior of coral sands in triaxial tests. Int. J. Geomech. 2019, 19, 04019131. [Google Scholar] [CrossRef]
- Li, M.; Li, A.; Zhang, J.; Huang, Y.; Li, J. Effects of particle sizes on compressive deformation and particle breakage of gangue used for coal mine goaf backfill. Powder Technol. 2020, 360, 493–502. [Google Scholar] [CrossRef]
- O’Sullivan, C. Particle-Based Discrete Element Modeling: Geomechanics Perspective. Int. J. Geomech. 2011, 11, 449–464. [Google Scholar] [CrossRef]
- Lehane, B.; Liu, Q. Measurement of shearing characteristics of granular materials at low stress levels in a shear box. Geotech. Geol. Eng. 2013, 31, 329–336. [Google Scholar] [CrossRef]
- Li, L.; Wu, W.; Liu, H.; Lehane, B. DEM analysis of the plugging effect of open-ended pile during the installation process. Ocean Eng. 2021, 220, 108375. [Google Scholar] [CrossRef]
- Mead, S.R.; Cleary, P.W. Validation of DEM prediction for granular avalanches on irregular terrain. J. Geophys. Res. Earth Surf. 2015, 120, 1724–1742. [Google Scholar] [CrossRef]
- Yin, Z.; Zhang, H.; Han, T. Simulation of particle flow on an elliptical vibrating screen using the discrete element method. Powder Technol. 2016, 302, 443–454. [Google Scholar] [CrossRef]
- Hadda, N.; Nicot, F.; Wan, R.; Darve, F. Microstructural self-organization in granular materials during failure. Comptes Rendus Mécanique 2015, 343, 143–154. [Google Scholar] [CrossRef]
- Guo, Y.G.; Morgan, J.K. Influence of normal stress and grain shape on granular friction: Results of discrete element simulations. J. Geophys. Res.-Solid Earth 2004, 109. [Google Scholar] [CrossRef]
- Kogut, L.; Etsion, I. Elastic-Plastic Contact Analysis of a Sphere and a Rigid Flat. J. Appl. Mech. 2002, 69, 657–662. [Google Scholar] [CrossRef]
- Mishra, B.K.; Murty, C.V.R. On the determination of contact parameters for realistic DEM simulations of ball mills. Powder Technol. 2001, 115, 290–297. [Google Scholar] [CrossRef]
- Natsui, S.; Ueda, S.; Oikawa, M.; Fan, Z.; Kano, J.; Inoue, R.; Ariyama, T. Optimization of Physical Parameters of Discrete Element Method for Blast Furnace and Its Application to the Analysis on Solid Motion around Raceway. Isij Int. 2009, 49, 1308–1315. [Google Scholar] [CrossRef][Green Version]
- Yoon, J. Application of experimental design and optimization to PFC model calibration in uniaxial compression simulation. Int. J. Rock Mech. Min. Sci. 2007, 44, 871–889. [Google Scholar] [CrossRef]
- Starzec, P.; Andersson, J. Application of two-level factorial design to sensitivity analysis of keyblock statistics from fracture geometry. Int. J. Rock Mech. Min. Sci. 2002, 39, 243–255. [Google Scholar] [CrossRef]
- Ahuja, S.; Ferreira, G.; Moreira, A. Application of Plackett-Burman design and response surface methodology to achieve exponential growth for aggregated shipworm bacterium. Biotechnol. Bioeng. 2004, 85, 666–675. [Google Scholar] [CrossRef]
- Mindlin, R.D.; Deresiewicz, H. Elastic spheres in contact under varying oblique forces. J. Appl. Mech. 1953, 20, 327–344. [Google Scholar] [CrossRef]
- Cundall, P. Computer simulations of dense sphere assemblies. In Studies in Applied Mechanics; Elsevier: Amsterdam, The Netherlands, 1988; Volume 20, pp. 113–123. [Google Scholar]
- Hunt, K.H.; Crossley, F.R.E. Coefficient of restitution interpreted as damping in vibroimpact. J. Appl. Mech. 1975, 42, 440–445. [Google Scholar] [CrossRef]
- Elata, D.; Berryman, J.G. Contact force-displacement laws and the mechanical behavior of random packs of identical spheres. Mech. Mater. 1996, 24, 229–240. [Google Scholar] [CrossRef]
- Nezamabadi, S.; Radjai, F.; Averseng, J.; Delenne, J.-Y. Implicit frictional-contact model for soft particle systems. J. Mech. Phys. Solids 2015, 83, 72–87. [Google Scholar] [CrossRef][Green Version]
- Ai, J.; Chen, J.F.; Rotter, J.M.; Ooi, J.Y. Assessment of rolling resistance models in discrete element simulations. Powder Technol. 2011, 206, 269–282. [Google Scholar] [CrossRef]
- Karkala, S.; Davis, N.; Wassgren, C.; Shi, Y.X.; Liu, X.; Riemann, C.; Yacobian, G.; Ramachandran, R. Calibration of Discrete-Element-Method Parameters for Cohesive Materials Using Dynamic-Yield-Strength and Shear-Cell Experiments. Processes 2019, 7, 278. [Google Scholar] [CrossRef]
- Angus, A.; Yahia, L.A.A.; Maione, R.; Khala, M.; Hare, C.; Ozel, A.; Ocone, R. Calibrating friction coefficients in discrete element method simulations with shear-cell experiments. Powder Technol. 2020, 372, 290–304. [Google Scholar] [CrossRef]
- Hartl, J.; Ooi, J.Y. Experiments and simulations of direct shear tests: Porosity, contact friction and bulk friction. Granul. Matter 2008, 10, 263–271. [Google Scholar] [CrossRef]
- Suhr, B.; Six, K. On the effect of stress dependent interparticle friction in direct shear tests. Powder Technol. 2016, 294, 211–220. [Google Scholar] [CrossRef]
- Coetzee, C.J.; Els, D.N.J. Calibration of granular material parameters for DEM modelling and numerical verification by blade-granular material interaction. J. Terramechanics 2009, 46, 15–26. [Google Scholar] [CrossRef]
- Roessler, T.; Katterfeld, A. DEM parameter calibration of cohesive bulk materials using a simple angle of repose test. Particuology 2019, 45, 105–115. [Google Scholar] [CrossRef]
- Elskamp, F.; Kruggel-Emden, H.; Hennig, M.; Teipel, U. A strategy to determine DEM parameters for spherical and non-spherical particles. Granul. Matter 2017, 19, 46. [Google Scholar] [CrossRef]
- Li, Y.J.; Xu, Y.; Thornton, C. A comparison of discrete element simulations and experiments for ‘sandpiles’ composed of spherical particles. Powder Technol. 2005, 160, 219–228. [Google Scholar] [CrossRef]
- Thao, D.; Indraratna, B.; Nguyen, T.T.; Rujikiatkamjorn, C. Interactive Role of Rolling Friction and Cohesion on the Angle of Repose through a Microscale Assessment. Int. J. Geomech. 2023, 23, 04022250. [Google Scholar] [CrossRef]
- Frankowski, P.; Morgeneyer, M. Calibration and Validation of DEM Rolling and Sliding Friction Coefficients in Angle of Repose and Shear Measurements. In Proceedings of the 7th International Conference on Micromechanics of Granular Media (Powders and Grains), Sydney, Australia, 8–12 July 2013; pp. 851–854. [Google Scholar]
- Zhou, Y.C.; Xu, B.H.; Yu, A.B.; Zulli, P. An experimental and numerical study of the angle of repose of coarse spheres. Powder Technol. 2002, 125, 45–54. [Google Scholar] [CrossRef]
- Barrios, G.K.P.; de Carvalho, R.M.; Kwade, A.; Tavares, L.M. Contact parameter estimation for DEM simulation of iron ore pellet handling. Powder Technol. 2013, 248, 84–93. [Google Scholar] [CrossRef]
- Jayasundara, C.T.; Yang, R.Y.; Yu, A.B.; Rubenstein, J. Effects of disc rotation speed and media loading on particle flow and grinding performance in a horizontal stirred mill. Int. J. Miner. Process. 2010, 96, 27–35. [Google Scholar] [CrossRef]
- Boikov, A.; Savelev, R.; Payor, V.; Potapov, A. Universal Approach for DEM Parameters Calibration of Bulk Materials. Symmetry 2021, 13, 1088. [Google Scholar] [CrossRef]
- Rosenkranz, S.; Breitung-Faes, S.; Kwade, A. Experimental investigations and modelling of the ball motion in planetary ball mills. Powder Technol. 2011, 212, 224–230. [Google Scholar] [CrossRef]
- Liu, J.; Yun, B.; Zhao, C.B. Identification and Validation of Rolling Friction Models by Dynamic Simulation of Sandpile Formation. Int. J. Geomech. 2012, 12, 484–493. [Google Scholar] [CrossRef]
- Zhou, Y.C.; Wright, B.D.; Yang, R.Y.; Xu, B.H.; Yu, A.B. Rolling friction in the dynamic simulation of sandpile formation. Phys. A—Stat. Mech. Its Appl. 1999, 269, 536–553. [Google Scholar] [CrossRef]
- Horabik, J.; Molenda, M. Parameters and contact models for DEM simulations of agricultural granular materials: A review. Biosyst. Eng. 2016, 147, 206–225. [Google Scholar] [CrossRef]
- Markauskas, D.; Kacianauskas, R.; Dziugys, A.; Navakas, R. Investigation of adequacy of multi-sphere approximation of elliptical particles for DEM simulations. Granul. Matter 2010, 12, 107–123. [Google Scholar] [CrossRef]
- Iwashita, K.; Oda, M. Micro-deformation mechanism of shear banding process based on modified distinct element method. Powder Technol. 2000, 109, 192–205. [Google Scholar] [CrossRef]
- Zarastvand, M.; Ghassabi, M.; Talebitooti, R. Prediction of acoustic wave transmission features of the multilayered plate constructions: A review. J. Sandw. Struct. Mater. 2022, 24, 218–293. [Google Scholar]
- Zarastvand, M.; Asadijafari, M.; Talebitooti, R. Acoustic wave transmission characteristics of stiffened composite shell systems with double curvature. Compos. Struct. 2022, 292, 115688. [Google Scholar]
- Procter, D.C.; Barton, R.R. Measurements of the angle of interparticle friction. Géotechnique 1974, 24, 581–604. [Google Scholar] [CrossRef]
Disclaimer/Publisher’s Note: The statements, opinions and data contained in all publications are solely those of the individual author(s) and contributor(s) and not of MDPI and/or the editor(s). MDPI and/or the editor(s) disclaim responsibility for any injury to people or property resulting from any ideas, methods, instructions or products referred to in the content. |
© 2023 by the authors. Licensee MDPI, Basel, Switzerland. This article is an open access article distributed under the terms and conditions of the Creative Commons Attribution (CC BY) license (https://creativecommons.org/licenses/by/4.0/).

