Article

Numerical and Analytical Determination of Rockburst Characteristics: Case Study from Polish Deep Copper Mine

by
Witold Pytel
1,
Krzysztof Fuławka
1,*,
Bogumiła Pałac-Walko
2 and
Piotr Mertuszka
1
1
KGHM CUPRUM Ltd., Research & Development Centre, 53-659 Wrocław, Poland
2
Faculty of Geoengineering, Mining and Geology, Wrocław University of Science and Technology, 50-421 Wrocław, Poland
*
Author to whom correspondence should be addressed.
Appl. Sci. 2023, 13(21), 11881; https://doi.org/10.3390/app132111881
Submission received: 6 September 2023 / Revised: 27 October 2023 / Accepted: 27 October 2023 / Published: 30 October 2023

Abstract

:
A simplified analytical method useful for ductile ground support design in underground mine workings is presented. This approach allows for maintaining the stability of sidewalls in rectangular openings extracted in competent and homogeneous rocks, especially in high-pressure conditions, favoring rockburst event occurrence. The proposed design procedure involves the typical assumptions governing the limit equilibrium method (LEM) with respect to a triangular rock block expelled from a sidewall of a long mine excavation subjected to normal stresses of the values determined based on the Maugis’s analytical solution concerned with stress distribution around the elliptical opening extracted within the homogeneous infinite elastic space. This stage of the local assessment of rock susceptibility to ejection from the walls of the excavation allowed for determining the geometry of the block whose ejection is most likely in a given geological and mining situation. Having extensive information about the geometry of the excavations and the properties of the surrounding rocks, it was possible to make an exemplary map of the risk from rockburst hazard, developed as the 2D contours of safety indexes’ values, for special-purpose excavations such as heavy machinery chambers, main excavations, etc. in conditions of selected mining panel of the deep copper mine at Legnica-Głogów Copper Basin, Poland. Another important element of the obtained results is the calculated values of the horizontal forces potentially pushing out the predetermined rock blocks. These forces are the surplus over the potential of frictional resistance and cohesion on the surfaces of previously identified discontinuities or on new cracks appearing as a result of overloading of the sidewalls. Finally, the presented algorithm allows us to perform quantitative tracking of rockburst phenomena as a function of time by determination of acceleration, velocity, and displacement of expelled rocks. Such information may be useful at the stage of designing the support for underground workings.

1. Introduction

Ensuring the stability of mine workings located at a great depth is one of the most challenging issues facing the mining industry [1]. High stresses within the rock mass have a negative effect on the productivity and safety of mining operations, and in some cases may jeopardize the entire mining project [2,3]. One of the most serious hazards associated with mining at great depths is a rockburst phenomenon, which may be described as an uncontrolled violent event associated with a sudden release of strain energy, resulting frequently in deformation or even destruction of mine workings [4,5,6,7]. After such an event, the excavation walls usually take the form of a curvilinear cavity, which substitutes the original flat surfaces [8,9]. As it was pointed out by Wang et al. [10] as well as Małkowski and Niedbalski [11], the problem of rockburst occurrence is present on a global scale and has been recently noticed in deep mines over the world. However, the knowledge of a rock mass’s potential for dynamic and destructive behavior, such as rock and pillar bursts in underground excavations, still has not yet been sufficiently explained, formulated, or consistently applied in practice [12,13]. Therefore, rockburst hazard has been increasingly common in the mining sector worldwide, often leading to huge social and economic losses [14,15]. In order to minimize this risk, it is necessary to develop and implement new methods of monitoring and estimating the rockburst risk, especially at great depths, where the stress level is higher and higher. Locating places with an increased probability of instability may be the basis for taking appropriate preventive measures in advance.
Within this paper, the complex evaluation of rockburst risk in the conditions of Polish underground copper mines has been proposed. Based on the analytical as well as numerical formulations, the characteristics of rockbursts occurring in underground galleries of a selected copper mine have been described and verified. The developed approach is particularly useful for structurally controlled instability events where the rock mass surrounding the opening fails by sliding on the discontinuities and crushing of rock pieces. For estimation of the rockburst potential, a “rockburst factor of safety” has been formulated. Generally, it is a ratio of so-called “critical depth” to the depth at which the mining operation is currently carried out. The value of the critical depth depends on geological and mining conditions at which a rockburst may develop if the driving forces are equal to the rock mass resistance. For the purposes of local rockburst characteristic determination, a parameter called “safety index” has also been introduced. In general, this parameter describes the ratio of resisting forces to driving forces which affects the movement of the wedge. The results of the analysis have been compared with historical cases of rockbursts observed in one of the Polish underground copper mines.

2. Recent Advances in the Evaluation of Rockburst Characteristics

One of the significant parameters that allows for the sufficient description of the rockburst mechanism as a function of time is the motion’s velocity (ve), which may be assessed from the following relationship based on the empirical back-calculation approach [16]:
v e = d g 2 h c o s 2 θ + d s i n 2 θ
where θ—initial ejection angle measured upwards from the horizontal; h—½ height of excavation; d—observed horizontal range of the motion; g—gravity. This equation will be later used for validation of the usefulness of the below-proposed approach for the rockburst hazard estimation.
Appropriate calculations proved that the value of the above velocity reaches about 5 m/s in the case of serious events. For the cases in which the ejected rock mass is smaller, this velocity is greater and reaches a value of about 10 m/s [17,18]. As pointed out by Barton [19], in the case of good-quality rocks, one may assume that under high-stress conditions, multiple joints may develop, and their spatial orientations should fulfill the condition of the minimum value of a safety index. The issue mentioned herein is a typical problem occurring during underground excavation and should be taken into consideration during the planning of mining works. Thus, it is recommended to develop small-scale models at the first stage for a better understanding of the considered processes rather than large models that are theoretically able to give an absolutely accurate answer, but at the same time, they use a lot of parameters whose values are characterized by unknown reliability levels [20]. Therefore, the implementation of an analytical approach that permits the evaluation of rockburst safety indexes around the excavation is highly recommended at the preliminary risk evaluation stage. Such an analytical approach may be based on the modified limit equilibrium method (LEM), which has been used for years, particularly for obtaining approximate solutions for different stability problems in rock mechanics and geotechnical engineering [21,22,23].
It should be kept in mind that LEM also requires some assumptions in terms of the stress distribution along the failure/wedge surface, which allows for providing a general equation of mechanical equilibrium addressed to different structures. If more complicated mechanisms of failure need to be considered, such as translation integrated with rotation, the literature proposes different more complex algorithms, e.g., Discontinuous Deformation Analysis (DDA) [24,25,26] or Block Stability 3D (BS3D) [27,28], which also permits considering the dynamic events. However, these numerical methods require reliable knowledge of joint systems, which unfortunately is not always available, especially near the mining fronts. Therefore, in most cases, these methods are simplified and limited just to translation mechanisms [29] without any severe losses in accuracy [30,31] and may be utilized in typical geologic conditions in underground mines.
In turn, as highlighted by Wang et al. [10], from numerical approaches and codes in rock mechanics applied for rockburst prediction in the last 20 years, continuous methods such as the finite element method (FEM) and finite difference method (FDM) are still the most common. These methods involved over 77% of the published works, whereas the discontinuous methods (e.g., DEM—discrete element method) were utilized in more than 20% of publications. The first successful attempts at numerical rockburst predictions were presented in 1972 when Blake determined possible locations of rockburst occurrence [32]. Then rapid development of rockburst analyses with dynamic FEM was observed which resulted in the improvement of reliable constitutive models for underground mining conditions [33,34,35]. Today, FEM, FDM, and DEM seem to be the most suitable methods for determining the shape and characteristics of rockburst formation under high-stress levels. However, in a situation where a general view of the risk of rock outbursts over a very large area of mine workings is needed, as well as data on the geometry of excavations and current fracture systems are very limited, the advantages of the abovementioned methods may be offset by inconveniences such as the necessary huge amount of labor-intensive and time-consuming research work carried out underground and at the computer. A similar situation is related to the quantity and quality of geotechnical data, which are routinely limited to four parameters describing the deformation and strength properties of the rocks surrounding the excavations. Taking into account the abovementioned limitations, the authors finally decided to implement a simplified method based on LEM as a main rockburst prediction approach and validate its reliability with FEM-based simulations. The calculations were performed for a 2-dimensional case relating to the tunnels and gallery point located far enough from the intersections and other underground workings, utilizing both an LEM and FEM approach and a 3-dimensional case representing conditions observed within the pillars at the intersections (FEM).

3. Material and Methods

The stability analyses were performed for specific mining-geologic conditions adequate for one of the Polish underground copper mines. These conditions comprise typical geometries of the openings (depth, height, width), typical surrounding rock types with their deformation/strength parameters, and the mining technology which is the most often applied, i.e., a single-level room-and-pillar-mining method with roof deflection at the depth of 1000–1200 m below the ground surface. The generalized scheme of the utilized mining system is presented in Figure 1, where one may also find the epicenters of strong seismic events as well as the location of massive rockbursts that occurred after them.
The geometry of the numerical model and geologic profile has been prepared based on 12 boreholes which were drilled from the surface to the level of excavation. In turn, the strength parameters of rocks have been obtained with laboratory tests.
In the direct roof of the analyzed mine, stiff layers of dolomite and limestone are located, whereas, above them, strong strata of dolomite and anhydrite are present. Uniaxial compressive strength in both cases reaches the value of 220 MPa. At the same time, floor layers consist of strata of red sandstone with medium strength and UCS up to 80 MPa. Strong roof layers with the simultaneous presence of medium-strength layers in the floor generate conditions that favor the softening and yielding of the floor and pillars and result in the accumulation of elastic energy above the mining area.
Figure 2 shows the mining situation in the analyzed area and indicates the places where high-energy tremors and rockbursts occur.
The general flowchart diagram presenting the used methodology for rockburst hazard estimation is shown in Figure 3.

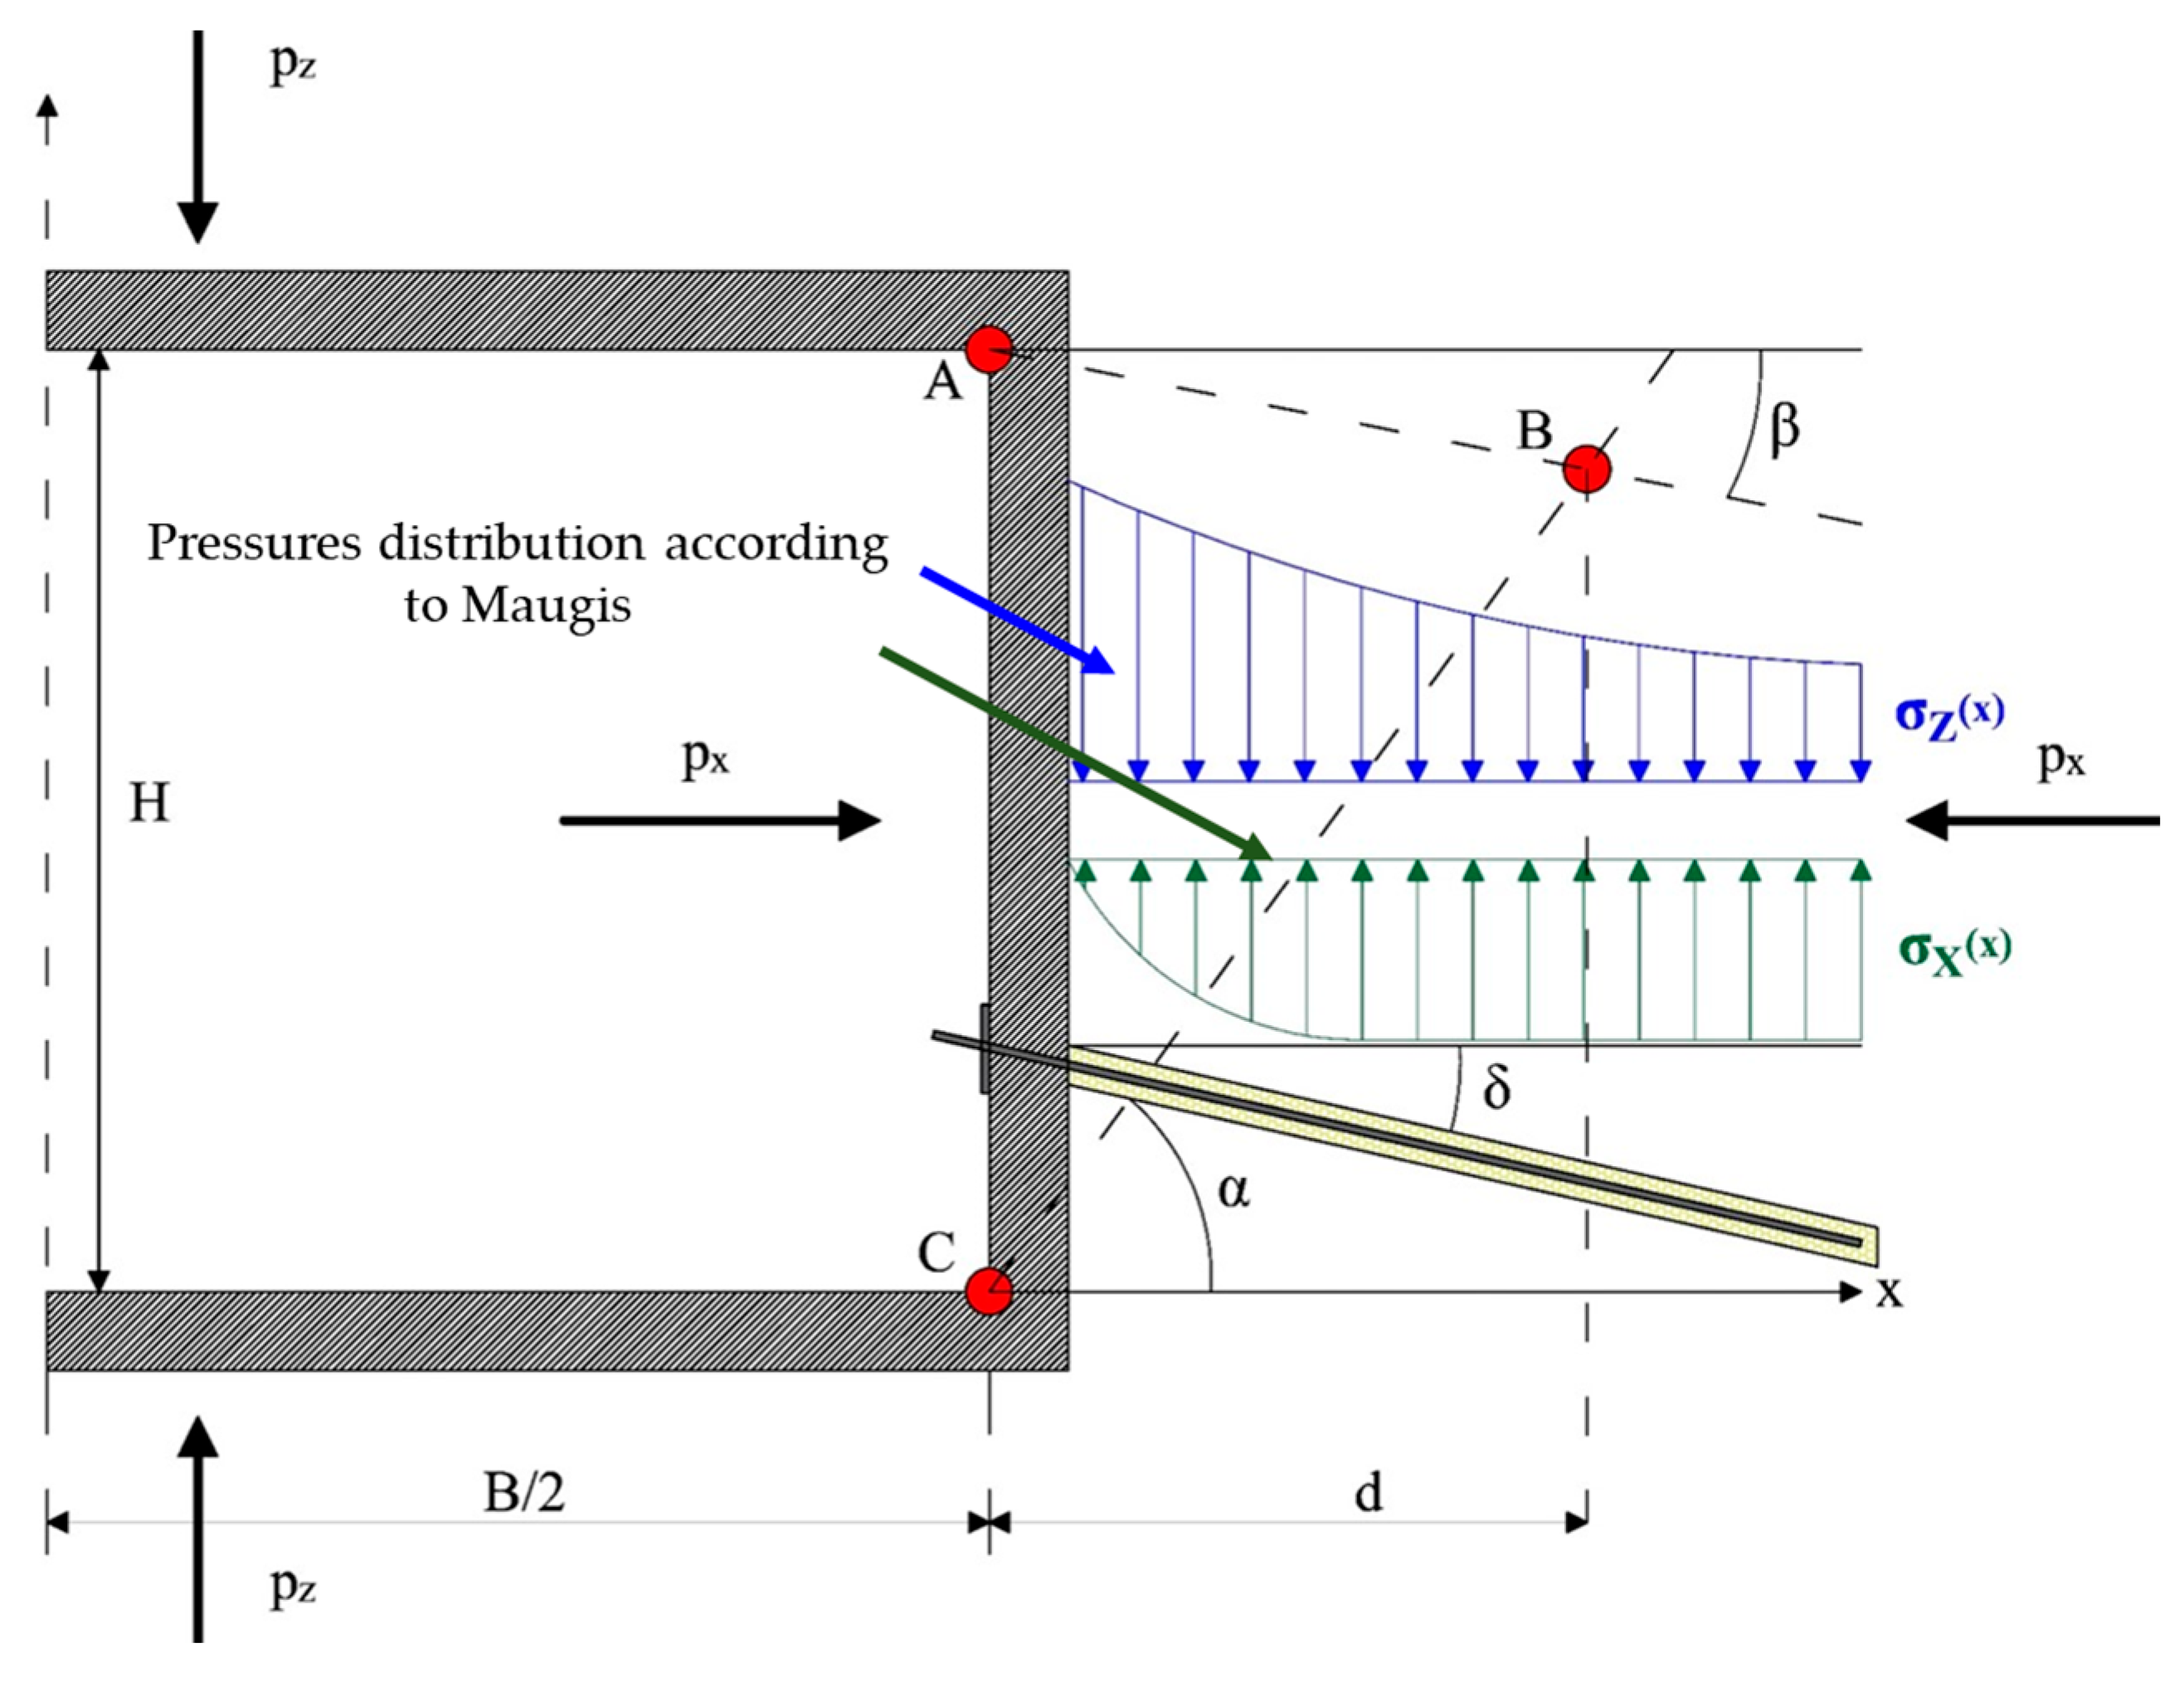
3.1. Analytical Solution

The general closed-form solution of Maugis [36] concerning stress distribution around the elliptical excavation within the homogeneous and infinite elastic space was the base for the analytical LEM formulation developed with respect to mine opening safety. This solution has several undisputable advantages such as conciseness, simplicity, and ease of coding in computer programs, which led it to be used willingly in many technical applications until today. Newer studies in this field (e.g., [37,38,39]), based mainly on complex potential functions and conformal mapping representation, are characterized by considerable complexity, which means that they so far are rarely used in practical applications.
Using the Maugis formulation, the relationships describing normal stress σ z and σ x distributed at the plane z = b = 0.5 × H , which are the result of the presence of the uniformly distributed horizontal pressure px and the vertical pressure p z = γ a v H 0 , have been obtained. For the normal stresses acting in the z = b = 0.5 × H , the following relationships were obtained:
σ z = 1 2 × A ¯ + B ¯ + C ¯ + D ¯
σ x = 1 2 × A ¯ + B ¯ C ¯ D ¯
where A ¯ ,   B ¯ ,   C , ¯   and   D ¯ , the algebraic types of functions of the elliptical opening size (half-axis a and b), coordinate x and the external load, px and pz.
A formulated stability condition for the sidewalls of rectangular excavations that are prone to rockburst occurrence introduces the assumptions that normal stress σ x and σ z distribution at height z = 0.5 × H in the sidewalls of the excavation of width B and height H are approximately equal to the corresponding values of the principal stresses obtained for the excavation of the elliptical cross-section with the half-axes equal to a and b (a > b). Also, the ejected rock wedge is of the shape of a triangle defined by the angles of α and β that identify the lines AB and CB, i.e., the envelope of the area where the stability index value is less than 1 (Figure 4):
The stability index for the rock wedge ABC (Figure 3) and unbalanced ejecting force may be determined using the relationship presented below, based on the limit equilibrium principles:
stability   index : F ¯ = F p F a = A f + A c + A b
or   unbalanced   force : P k = F a F p
where Af—relative resistance of internal friction forces; Ac—relative resistance of cohesion forces; and Ab—relative resistance of the forces mobilized within n rods of rock bolts, each of the capacity N i and inclination angle δi. The safety index requires maintaining the following limit conditions: F ¯ 1.0 or P k 0.0   M N . The resistance and the driving potentials are described as follows:
F p = t g ϕ + d i l [ c o s β + c o s α 1 1 + d a σ z t d t + s i n β + s i n α 1 1 + d a σ x t d t ] + c d 1 c o s α + 1 c o s β + i = 1 n N i c o s δ i    
F a = s i n β + s i n α 1 1 + d a σ z t d t c o s β + c o s α 1 1 + d a σ x t d t
where t = x / a , dil—dilation angle on the joint’s surface; c—cohesion at the discontinuity surface, i.e., cohesion of the continuous (intact) rock mass; ϕ —average angle of friction at the discontinuity surface; n—number of rock bolts installed within 1 m of the excavation length; Ni—rock bolt capacity (MN); and δi—inclination angle from the horizontal plane.
The triangular-shaped wedge of the ejected volume of rock seems to be more adequate for brittle rocks, revealing higher values of the angle of internal friction. Weaker and heavily jointed rocks may behave in different ways (Figure 5—right), for which the expelled rock block’s edge can be described by a curvilinear (elliptic, parabolic) envelope z = f(x).
In the case of intact rock, the critical value of the stability index should be determined directly based on Equation (4a,b), with the use of iterative computations for different values of angle α and the rock wedge’s height d. Analyses conducted on the model presented in Figure 4 reveal that for the case of homogeneous rock mass, the critical rock wedge ABC has the shape of an isosceles triangle (α = β). Moreover, the shape of the rock wedge expelled from the sidewall may be defined as regular wedge ABC, or a group of triangle elements, such as stiff wedge ADC and plastic wedge ABCD, within which the value of the stability index α2 < π is always less than 1, independently of the slip planes’ direction (for a case where the rocks reveal a finite cohesion value); see Figure 6.
In order to better match the considered rectangular excavation to the stress field around an elliptical model, equivalent dimensions of the first excavation are determined as follows:
H = 3 b , B = π a 3
Therefore, Equations (3)–(7) may be conditionally utilized for rating the stability of the excavation’s sidewall after substituting the ellipse’s half-axes by the following dimensions of the equivalent rectangular excavation:
a = 0.55 B , t = x 0.55 B , b a = 1.05 H B

3.2. Numerical Calculations

Numerical calculations, in general, provide more detailed and reliable results in comparison to the analytical solution, but at the same time are more complex and time consuming. As a result, it is challenging to implement such solutions to the regular evaluation of rockburst risk and its characteristics in terms of the continuously progressing exploitation front. Still, knowing the strengths of FEM analyses, the authors proposed to use them for the validation of results obtained with simplified analytical solutions.
Calculations were performed for 2-dimensional cases relating to the points in tunnels and galleries located far enough from the intersections and other underground workings, with the use of RS2 software by Rocscience Inc., Toronto, Canada. The geometry of the numerical model and geologic profile were obtained based on 12 boreholes that were drilled from the surface to the level of the excavations. The strength parameters of modeled rocks have been determined in the laboratory. The dimensions of workings are consistent with the geometries of workings in the analyzed area. The models have been solved using the following input data:
  • the galleries’ rectangular cross-section size: B × H = 6 m × 3 m;
  • overburden vertical pressure pz = 20 MPa;
  • strength parameters of the rock mass: cohesion c = 8 MPa, angle of internal friction ϕ = 35°;
  • deformation parameters of the rock mass: modulus of deformation: E = 40 GPa, Poisson’s ratio ν = 0.2 (px = 5 MPa).
For 2D FEM analysis, the areas prone to rockburst occurrence were identified on the basis of the maximum shear strain distribution.

4. Results

4.1. Calculation of Ejecting Force Pk and Angles α 1 , α 2

The analysis was performed based on 625 unique input datasets composed of values of four basic parameters: px, pz, B, and φ. Each parameter had been represented by a set of five different values. The results of calculations have been visualized as diagrams which allow immediately evaluating the values of angles α1 and α2 and values of unbalanced forces as well (Figure 7). In order to assess the sensitivity to the variations of base parameters, a sensitivity analysis has been carried out. As a basic model for such an analysis, the solution with the model characterized by the following parameters was adopted: B = 6 m, px = 5 MPa, pz = 20 Mpa, Φ = 45 deg., H = 4 m, and c = 4 MPa. This solution is treated as a reference and its result values are Pk = 4.64 MN, α1 = 64.1 deg., and α2 = 86.1 deg. The obtained changes describing the basic model sensitivity are shown in Table 1.
As one may notice, the value of the force expelling the detached wedge is positively correlated with the value of the excavation height. For small values of cohesion, it is almost a linear relationship. For large values of cohesion, this correlation will become negative until the Pk value reaches zero. Moreover, in the LGCB region, the values of the base parameters remain approximately in the range B = 6 ÷ 10 m, px = 5 ÷ 35 MPa, pz = 15 ÷ 30 MPa, and ϕ = 31.5 ÷ 62.7 deg. Therefore, using the data presented in Table 1, the results are as follows: 0 P k 16.7 MN, 50.4 α 1 90 deg. and 80.5 α 2 90 deg.
The presented procedure for assessing the stability of mining excavations turned out to be effective because the determined shape of an ejected wedge matches the real case studies observed in Polish copper mines. The information provided by the proposed approach in terms of ejecting forces as a function of geological and mining conditions is extremely valuable in terms of the possibility of assessing the rockburst risk. Moreover, knowing the dynamic forces of wedge ejection, an attempt at rockburst risk mitigation may be utilized by the rock mass reinforcement; for example, by using a ductile rock bolt support system.
In the top of Figure 6, a selected set of diagrams corresponding to the unique combination of parameters pz, px, B, and φ, are presented. The first diagram shows values of the unbalanced by friction and cohesion, forces Pk which may be ejected from the rock wedges ABCD and ACD. The next two diagrams deal with the values of the angles describing the possible geometry of the ejected rock wedge (Figure 7—center and Figure 7—bottom). Analyzing Figure 7, it can be seen that the value of the stability index increases with increasing cohesion and decreases with increasing the excavation height. For a fixed cohesion value, the stability index reaches a value equal to 1.0 when the angles α1 and α2 reach the same value, which means that the area where a limit state could have developed disappears (see Figure 7, curve c = 8 MPa, H = 3.44 m, α1 = α2 = 76.8 deg)

4.2. FEM Validation Resuts and Identification of Rockburst-Prone Areas

Because the developed approach is very promising, the FEM-based validation of the LEM-based stability analyses was performed to ensure the reliability of the proposed solution. The 2D FEM-based calculation was performed with the use of RS2 software developed by RocScience [40]. Simulations were conducted for the four scenarios differing in the values of cohesion and angles of internal friction that characterize the rock mass surrounding the considered underground excavation. These models were presented in Table 2.
To increase the reliability of the numerical calculations modulus of intact rocks deformation, Eo = 40 GPa was reduced to rock mass modulus acc. to as follows: Em = 36.0 ÷ 40.0 GPa, depending on the nodes’ distance from the opening walls envelope (Figure 8). The Poisson’s ratio value was equal to υ = 0.2 (px = 5 MPa). Then, based on [41], it was assumed that the zone of disturbance around the excavation ranges to the depth of 1.25 × H from the sidewall and therefore the rock mass surrounding the opening was divided into several zones of different values of Geological Strength Index (GSI), as shown in Figure 7. At the same time, it was assumed that:
G S I = 100   1 D 2
where D—the disturbance factor [41], the value for which the analyzed case changes from zero (intact rocks) to 0.8 (rocks slightly damaged by the effect of the production blasting), 100—GSI for intact rocks.
Finally, the rock mass modulus of deformation Em, appropriate for the distinguished zones, was assessed based on the following relationship:
E m = E 0 0.025672 + 1 D 2 1 + e x p 6 15 D G S I 11
It was assumed that the most appropriate criteria for the comparison of the developed LEM-based solution and FEM numerical model are the degree of matching of the expected shape of the critical wedges identified by angles α1 and α2, and the bands of the maximum shear strain’s values distributed within the excavation sidewalls. The shear strain is treated here as a fundamental factor that induces the rockburst phenomena. It is also assumed that the shape of the shear stress envelope does not change itself significantly with the stress increment. The qualitative representation of results obtained with the use of FEM-based numerical simulations for Model 1 and Model 4 are presented in Figure 9, whereas the compliance of the results obtained with the numerical and analytical solutions are presented in Table 3.
The presented results, obtained using both independent approaches, indicate their high correlation, particularly in terms of the shapes of the ejected rock wedge and the envelope of maximum shear strain in a function of the angle of internal friction and cohesion of the rock mass. Also, the presence of “locally” stable triangular areas within the sidewall as the cohesion effect is visible. It should be highlighted that when analyzing the results presented in Table 3, one may notice that the correlation between the proposed approach and numerical solutions is relatively high and reach values of 0.86 in the case of α 1 and 0.97 in the case of α 2. The abovementioned results permit accepting the LEM as an appropriate and sufficiently accurate approach in preliminary modeling rockbursts in deep mines.
Areas of potential rockburst were identified [42] based on the calculated 3D distribution of the safety margin, formulated based on the Mohr–Coulomb theory of shearing failure, the mathematical notation of which has the following form:
S m = σ 3 1 + s i n ϕ 1 s i n ϕ + 2 c   c o s ϕ 1 s i n ϕ + σ 1
where σ3 and σ1—minor and major principal stresses.
The calculation results refer to two alternative cases:
  • a 2D case relating to the gallery point, far enough from the intersections (cross-cuts, ramps, etc. of the cavities excavated from the galleries)—(Figure 10 left);
  • a 3D case, relating exclusively to intersections (Figure 10 right).
The obtained distribution of the value of the safety margin for the 2D case allows us to conclude that the shape of rock volume ejected from the sidewalls (Sm < 0) is a longitudinal segment of an elliptic cylinder (Figure 10 left) supported at the corners of the excavation. The straight line tangent to the surface of this solid drawn from these corners is inclined in relation to the horizontal plane at the angle of α1 ≅ 57.deg, so in a similar way to that calculated for Scenario 1 (Table 3), but with the use of the FEM numerical model formulated strictly for a plane deformation state. The geometry of the ejected three-dimensional solid at the intersection corner (Figure 10 right) is more complex, since it may be approximately described as a kind of hexahedron—a geometric solid with six faces (slip planes), which are formed by the interpenetration of two mutually perpendicular triangular prisms (2D LEM solutions). This statement is valid only if the local geomechanical conditions permit rockburst development in the galleries sufficiently far away from the intersection. Otherwise, only 3D FEM or similar computer codes can be utilized, since 3D analytical extension of Maugis’s solution (Equation (4)) to three dimensions is not available so far. Despite the mentioned differences in the problem formulation, the similarities and compatibility proved between the two approaches, FEM and LEM, permit accepting the LEM as an appropriate and sufficiently accurate approach in modeling rockbursts in deep mines.

4.3. Simulation of the Rockburst Process

It is assumed that during the detachment process, the rock wedge is subjected to acceleration with the initial value a(0) = ao which linearly attenuates (in time) up to zero after t = to. One of the simplest preliminary relations describing such a transformation process is the following equation:
a t = a 0 1 t t 0   f o r   t t 0     a t = 0   f o r   t > t 0
Knowing the value of the ejection force Pk, one may also estimate the initial acceleration associated with the rockbursts as well as the velocity of the rock movement. Using the fundamental principle of dynamics, the acceleration that may potentially eject the rock wedge, unsecured by any support (free movement), may be calculated from the following relationship:
a 0 = P k m s
where ms—mass of the moving rock wedge and Pk—unbalanced force assessed from the limit equilibrium condition formulated for the detached rock block (see Figure 6, top). In turn, the rock wedge’s velocity and its kinetic energy (without retardation) may be determined from the following expressions:
v t = a 0 t t 2 2 t 0 = P k m s t t 2 2 t 0   f o r   0 t t 0 v t = a 0 t o 2 = P k t 0 2 m s   f o r   t > t 0
E ¯ k = m s v ¯ 2 2 = P k 2 2 m s ( t t 2 2 t o ) 2   f o r   0 t t 0 E ¯ k = m s v ¯ 2 2 = P k t 0 2 8 m s   f o r   t > t 0
Since the amount of available information on the detailed characteristics of the burst processes, particularly at their the very beginning phase, is relatively scarce, one may determine roughly the value of to based on the velocity value observed in situ. Therefore:
t 0 = 2 v m s P k
where vo—6 m/s averaged approximation acc. to [41,43,44]. Compliance with Equation (1) can be obtained for the value of the range of horizontal movement D = 3.82 m.
Acceleration and velocity values of detached wedge movement over time are presented in Figure 11.

4.4. Identification of Rockburst-Prone Mine Areas

Knowing the characteristics of the rockburst mechanism, the location of areas prone to instability was determined. Therefore, the general equation relating the rock’s strength parameters (c ≠ 0 and Φ ≠ 0) to the load that is acting in conditions where the limit equilibrium may be obtained only in one location is presented below:
s i n α [ c o s α t a n ϕ + s i n α B 2 B 2 + d σ z x d x + s i n α t a n ϕ c o s α B 2 B 2 + d σ x x d x ] + c H 2 = 0
where ϕ —the angle of internal friction; α —the angle of inclination of the external plane of the block of solid rock ejection; B—opening width; H—opening height; d = h 2 t a n ; and c—cohesion. Gradually increasing the value of p z = H 0 γ 0 , a v (where Ho—overburden thickness, γ 0 , a v = 0.026 M N m 3   )—the average bulk weight of the rock mass), the value of the critical depth Hcr, at which the beginning of the rockburst process may be observed, has been assessed within the parameters’ space and is characterized in Section 3. Simultaneously, searching for the critical value F = 1, the angle α value has been scanned from zero to π 2 .
Based on the available literature concerned with the strain–strength parameters of the rock mass in the area of Polish copper mines [38], the values of critical depths, from the point of view of rockburst hazards, have been determined. The laboratory-obtained values of rock mass parameters have been scaled down to in situ (rock mass) values using the approach given by [45] (Table 4).
These estimates permitted the identification of the critical depths from which a serious rockburst may occur. This knowledge has proved that copper ore exploitation at depths greater than 1100 m will be associated with an increased level of rockburst risk, indicating that at this depth, the extensive use of ductile rock bolts is highly recommended as basic ground support, at least in the long-life workings such as machine chambers, etc. In each case of well-known mining-geology conditions, the development of individual preliminary analyses using data shown in Figure 12 is strongly recommended.
As a result, the rockburst factor of safety over the entire mine may be determined according to the following formula:
F s r b = H c r x , y H o x , y
where Hcr—critical depth; Ho—depth of mining.
This type of map may be associated with the x–y maps of ductile sidewall support distribution with detailed data concerning the unbalanced force Pk as well as the number, length, and capacity of the utilized rock bolts. To illustrate the advantages of the proposed approach, the rockburst factor of safety distribution (Fsrb) over one of the mining panels of the Polish copper mine has been analyzed. The values of angles of internal friction and cohesion that are adequate for different types of rock have been assessed using the method based on tangents to the parabolic envelope of Mohr’s circles [41]. At the same time, the Hcr value has been calculated, which permitted us to find the critical rock wedge that is associated with a stability index F equal to 1. This required minimizing the index F value by scanning all possible shapes of wedges while increasing the depth of mining (Ho = p z / γ 0 ). The resulting map (Figure 13) of the rockburst safety factor proved the usefulness of the proposed approach for burst hazard general recognition.
The orange circles shown in Figure 10 indicate the areas of severe rockbursts associated with the ML = 3.4 seismic events which occurred in November 2016 in one of the mining panels [46]. These areas are strongly correlated with safety factor Fsrb values of about 0.9–1.0, which prove the usefulness of the proposed method for the preliminary rockburst risk analysis. Bearing in mind that sandstone’s share in the thickness of the ore body profile is usually relatively large, serious, and frequent rockbursts from the sidewalls due to the low values of rock strain–strength parameters may be expected. Therefore, one may conclude that in situ stress measurement and validating the proposed hypotheses are necessary.

5. Conclusions

The developed 2-dimensional model of rockbursts from an underground excavation’s sidewalls, based on the LEM, is a relatively simple and sufficiently general analytical approach useful for formulating practical conclusions and recommendations with respect to selecting the best methods of ground support, particularly in the geologic and mining conditions of deep mines. The model presented herein may be applied to continuous types of rocks as well as to rocks characterized by more than one joint/discontinuity system. Also, the rock heterogeneity within sidewalls does not disturb the theoretical background of the developed models but requires additional analytical work.
Furthermore, the developed approach may indicate the appropriate reinforcement of sidewalls or, if this is not achievable, it allows us to determine the trajectory of the motion of a detached rock wedge. This is the main advantage and novelty of the developed approach over the FEM. It is also worth noting that the developed set of charts allowed us to determine if it is effective to use a rigid type of ground reinforcement in a given set of mining/geologic conditions or if the ductile ground reinforcement is able to dissipate the kinetic energy of the ejected rock wedge within the frame of justified economical limits.
The adequate assumptions concerned with the form as a function of time, within which the rock wedge’s debonding process develops with the associated acceleration of the initial value a(0) = αo and the final value α(to) = 0, is one of the most important problems of the considered model. Although the initial and final values of acceleration should not be too controversial, the utilized form of the function a(t) may be disputable. A linear function, as used in this study, may be accepted preliminarily with no additional research work. However, other serious doubts are associated with the time to (in this study to = 0.013 s), which describes the moment when acceleration reaches the value equal to zero. Since this argument is of the highest importance because it significantly influences the movement velocity, it is necessary to compare the obtained velocities with those cited in the literature. Therefore, it is strongly recommended to launch research projects that should permit one to relate the time of acceleration fading out to the most important parameters that characterize the local mining–geologic conditions.
Finally, one may notice that the results of calculation obtained based on numerical modeling (FEM) have proved their sufficient mutual similarity to LEM-based results.

Author Contributions

Conceptualization, W.P. and K.F.; methodology, W.P. and K.F.; software, W.P. and K.F.; validation, B.P.-W. and P.M.; formal analysis, K.F.; investigation, W.P., K.F. and B.P.-W.; resources, W.P., K.F., B.P.-W. and P.M.; data curation, K.F. and B.P.-W.; writing—original draft preparation, W.P. and K.F.; writing—review and editing, K.F., B.P.-W. and P.M.; visualization, K.F. and P.M.; supervision, W.P.; project administration, K.F.; funding acquisition, K.F. All authors have read and agreed to the published version of the manuscript.

Funding

This paper was prepared within the framework of the AGEMERA project “Agile Exploration and Geo-modelling for European Critical Raw materials”. The project received funding from the European Union’s Horizon Europe Research and Innovation Program under grant agreement No. 101058178.

Institutional Review Board Statement

Not applicable.

Informed Consent Statement

Not applicable.

Data Availability Statement

Not applicable.

Conflicts of Interest

The authors declare no conflict of interest.

References

  1. Ghorbani, M.; Shahriar, K.; Sharifzadeh, M.; Masoudi, R. A Critical Review on the Developments of Rock Support Systems in High Stress Ground Conditions. Int. J. Min. Sci. Technol. 2020, 30, 555–572. [Google Scholar] [CrossRef]
  2. Fuławka, K.; Pytel, W.; Mertuszka, P. The Effect of Selected Rockburst Prevention Measures on Seismic Activity—Case Study from the Rudna Copper Mine. J. Sustain. Min. 2021, 17, 1–10. [Google Scholar] [CrossRef]
  3. Ptak, M.; Podolska, P.; Podolski, R. Challenges for Science: The Exploitation of Deep Deposits. E3S Web Conf. 2018, 71, 00008. [Google Scholar] [CrossRef]
  4. Cichy, T.; Prusek, S.; Świątek, J.; Apel, D.B.; Pu, Y. Use of Neural Networks to Forecast Seismic Hazard Expressed by Number of Tremors per Unit of Surface. Pure Appl. Geophys. 2020, 177, 5713–5722. [Google Scholar] [CrossRef]
  5. Pu, Y.; Apel, D.B.; Prusek, S.; Walentek, A.; Cichy, T. Back-Analysis for Initial Ground Stress Field at a Diamond Mine Using Machine Learning Approaches. Nat. Hazards 2021, 105, 191–203. [Google Scholar] [CrossRef]
  6. Blake, W.; Hedley, D.G.F. Rockbursts: Case Studies from North American Hard-Rock Mines; Society for Mining, Metallurgy, and Exploration: Littleton, CO, USA, 2003; ISBN 9780873352321. [Google Scholar]
  7. Mark, C. Coal Bursts in the Deep Longwall Mines of the United States. Int. J. Coal Sci. Technol. 2016, 3, 1–9. [Google Scholar] [CrossRef]
  8. Zhang, W.; Feng, X.-T.; Xiao, Y.-X.; Feng, G.-L.; Yao, Z.-B.; Hu, L.; Niu, W.-J. A Rockburst Intensity Criterion Based on the Geological Strength Index, Experiences Learned from a Deep Tunnel. Bull. Eng. Geol. Environ. 2020, 79, 3585–3603. [Google Scholar] [CrossRef]
  9. Pan, J.; Ren, F.; Cai, M. Effect of Joint Density on Rockburst Proneness of the Elastic-Brittle-Plastic Rock Mass. Shock Vib. 2021, 2021, 5574325. [Google Scholar] [CrossRef]
  10. Wang, J.; Apel, D.B.; Pu, Y.; Hall, R.; Wei, C.; Sepehri, M. Numerical Modeling for Rockbursts: A State-of-the-Art Review. J. Rock Mech. Geotech. Eng. 2021, 13, 457–478. [Google Scholar] [CrossRef]
  11. Małkowski, P.; Niedbalski, Z. A Comprehensive Geomechanical Method for the Assessment of Rockburst Hazards in Underground Mining. Int. J. Min. Sci. Technol. 2020, 30, 345–355. [Google Scholar] [CrossRef]
  12. Zhou, J.; Li, X.; Mitri, H.S. Evaluation Method of Rockburst: State-of-the-Art Literature Review. Tunn. Undergr. Space Technol. 2018, 81, 632–659. [Google Scholar] [CrossRef]
  13. Farhadian, H. A New Empirical Chart for Rockburst Analysis in Tunnelling: Tunnel Rockburst Classification (TRC). Int. J. Min. Sci. Technol. 2021, 31, 603–610. [Google Scholar] [CrossRef]
  14. Wojtecki, Ł.; Mendecki, M.J.; Gołda, I.; Zuberek, W.M. The Seismic Source Parameters of Tremors Provoked by Long-Hole Destress Blasting Executed During the Longwall Mining of a Coal Seam Under Variable Stress Conditions. Pure Appl. Geophys. 2020, 177, 5723–5739. [Google Scholar] [CrossRef]
  15. Wojtecki, Ł.; Konicek, P. Estimation of Active Rockburst Prevention Effectiveness during Longwall Mining under Disadvantageous Geological and Mining Conditions. J. Sustain. Min. 2016, 15, 1–7. [Google Scholar] [CrossRef]
  16. Tannant, D.D.; McDowell, G.M.; Brummer, R.K.; Kaiser, P.K. Ejection velocities measured during a rock burst simulation experiment. In Rockbursts and Seismicity in Mines 93, Proceedings of the 3rd International Symposium, Kingston, ON, Canada, 16–18 August 1993; Balkema: Rotterdam, The Netherlands, 1993; pp. 129–133. [Google Scholar]
  17. He, M.; Cheng, T.; Qiao, Y.; Li, H. A Review of Rockburst: Experiments, Theories, and Simulations. J. Rock Mech. Geotech. Eng. 2023, 15, 1312–1353. [Google Scholar] [CrossRef]
  18. Qiu, S.; Feng, X.; Zhang, C.; Xiang, T. Estimation of Rockburst Wall-Rock Velocity Invoked by Slab Flexure Sources in Deep Tunnels. Can. Geotech. J. 2014, 51, 520–539. [Google Scholar] [CrossRef]
  19. Barton, N. The Shear Strength of Rock and Rock Joints. Int. J. Rock Mech. Min. Sci. Geomech. Abstr. 1976, 13, 255–279. [Google Scholar] [CrossRef]
  20. Esterhuizen, G.S. Extending Empirical Evidence through Numerical Modelling in Rock Engineering Design. J. South. Afr. Inst. Min. Metall. 2014, 114, 755–764. [Google Scholar]
  21. Terzaghi, K. Theoretical Soil Mechanics; John Wiley & Sons, Inc.: Hoboken, NJ, USA, 1943; ISBN 9780470172766/9780471853053. [Google Scholar]
  22. Malan, D.; Napier, J. A Limit Equilibrium Fracture Zone Model to Investigate Seismicity in Coal Mines. Int. J. Min. Sci. Technol. 2018, 28, 745–753. [Google Scholar] [CrossRef]
  23. Sengani, F.; Mulenga, F. Application of Limit Equilibrium Analysis and Numerical Modeling in a Case of Slope Instability. Sustainability 2020, 12, 8870. [Google Scholar] [CrossRef]
  24. Ohnishi, Y.; Nishiyama, S.; Sasaki, T. Development and application of discontinuous deformation analysis. In Rock Mechanics in Underground Construction; World Scientific: Singapore, 2006; pp. 59–70. [Google Scholar]
  25. Zhao, J.; Xiao, M.; Chen, J.; Li, D. Explicit Dynamic DDA Method Considering Dynamic Contact Force. Shock Vib. 2016, 2016, 7431245. [Google Scholar] [CrossRef]
  26. Fan, H.; Huang, D.; Wang, G.; Wang, J. Discontinuous Deformation Analysis for SH-Body. Comput. Geotech. 2020, 117, 103234. [Google Scholar] [CrossRef]
  27. Wu, W.; Zhu, H.; Lin, J.-S.; Zhuang, X.; Ma, G. Tunnel Stability Assessment by 3D DDA-Key Block Analysis. Tunn. Undergr. Space Technol. 2018, 71, 210–214. [Google Scholar] [CrossRef]
  28. Lin, J.; Zuo, Y.; Wang, J.; Zheng, L.; Chen, B.; Sun, W.; Liu, H. Stability Analysis of Underground Surrounding Rock Mass Based on Block Theory. J. Cent. South Univ. 2020, 27, 3040–3052. [Google Scholar] [CrossRef]
  29. Hoek, E. Practical Rock Engineering. RocScience. 2007. Available online: http://www.rocscience.com/hoek/PracticalRockEngineering.asp (accessed on 21 July 2023).
  30. Billaux, D.; Detournay, C.; Hart, R.; Rachez, X. (Eds.) FLAC and Numerical Modeling in Geomechanics 2001; CRC Press: Boca Raton, FL, USA, 2020; ISBN 9781000099607. [Google Scholar]
  31. Khabbaz, H.; Fatahi, B.; Nucifora, C. Finite Element Methods against Limit Equilibrium Approaches for Slope Stability Analysis. In Proceedings of the 11th Australia—New Zealand Conference on Geomechanics—Ground Engineering in a Changing World (ANZ 2012), Melbourne, Australia, 14–18 July 2012; Geomechanical Society: Sydney, Australia; New Zealand Geotechnical Society: Wellington, New Zealand, 2012; ISBN 9780646543017. [Google Scholar]
  32. Blake, W. Rockburst mechanics. Q. Colo. Sch. Mines 1972, 67, 1–64. [Google Scholar]
  33. Tajduś, A.; Cieślik, J.; Tajduś, K. Rockburst Hazard Assessment in Bedded Rock Mass: Laboratory Tests of Rock Samples and Numerical Calculations. Arch. Min. Sci. 2014, 59, 591–608. [Google Scholar] [CrossRef]
  34. Fulawka, K.; Szumny, M.; Pytel, W.; Mertuszka, P. Conceptual Design of Underground Laboratory under Dynamic Load Condition in Deep Copper Mine. In Proceedings of the 22nd EGU General Assembly, Online, 4–8 May 2020. [Google Scholar]
  35. Fulawka, K.; Pytel, W.; Mertuszka, P.; Szumny, M. Finite Element Method-Based Geomechanical Risk Assessment of Underground Laboratory Located in the Deep Copper Mine. In Proceedings of the 23rd EGU General Assembly, Online, 19–30 April 2021. [Google Scholar]
  36. Maugis, D. Stresses and Displacements around Cracks and Elliptical Cavities: Exact Solutions. Eng. Fract. Mech. 1992, 43, 217–255. [Google Scholar] [CrossRef]
  37. Exadaktylos, G.E.; Stavropoulou, M.C. A closed-form elastic solution for stresses and displacements around tunnels. Int. J. Rock Mech. Min. Sci. 2002, 39, 905–916. [Google Scholar] [CrossRef]
  38. Kargar, A.R.; Rahmannejad, R.; Hajabasi, M.A. A semi-analytical elastic solution for stress field of lined non-circular tunnels at great depth using complex variable mrthod. Int. J. Solids Struct. 2014, 51, 1475–1482. [Google Scholar] [CrossRef]
  39. Ye, Z.K.; Ai, Z.Y. A novel complex variable solution for the stress and displacement fields around a shallow non-circular tunnel. Comput. Geotech. 2023, 164, 105797. [Google Scholar] [CrossRef]
  40. RocSciecnce. RS2 Finite Element Analysis for Excavations—Rocscience. 2016. Available online: https://www.rocscience.com/rocscience/products/rs2 (accessed on 21 September 2023).
  41. Hoek, E.; Diederichs, M.S. Empirical Estimation of Rock Mass Modulus. Int. J. Rock Mech. Min. Sci. 2006, 43, 203–215. [Google Scholar] [CrossRef]
  42. NEi Software. NEi Nastran Reference Manual, Version 9.2; Trafford Publishing: Bloomington, IN, USA, 2009.
  43. Ortlepp, W.D. The Design of Support for the Containment of Rockburst Damage in Tunnels—An Engineering Approach. In Proceedings of the International Symposium on Rock Support in Mining and Underground Construction, Sudbury, ON, Canada, 16–19 June 1992. [Google Scholar]
  44. Nussbaumer, M.M. A Comprehensive Review on Rock Burst. Ph.D. Thesis, Massachusetts Institute of Technology, Cambridge, MA, USA, 2000. [Google Scholar]
  45. Pytel, W. Geomechanical Problems of Ground Support Selection for Mine Excavations; KGHM Cuprum: Wrocław, Poland, 2012; 423p. (In Polish) [Google Scholar]
  46. Lasocki, S.; Orlecka-Sikora, B.; Mutke, G.; Pytel, W.; Rudzinski, L.; Markowski, P.; Piasecki, P. A catastrophic event in Rudna copper-ore mine in Poland on 29 November, 2016: What, how and why. In Proceedings of the Ninth International Symposium on Rockbursts and Seismicity in Mines, RaSiM9, Santiago, Chile, 15–17 November 2017. [Google Scholar]
Figure 1. Scheme of utilized room and pillar-mining system.
Applsci 13 11881 g001
Figure 2. Example of room-and-pillar mining with roof deflection in Polish copper mines—the site where the proposed approach was validated.
Applsci 13 11881 g002
Figure 3. General flowchart diagram explaining the proposed methodology.
Applsci 13 11881 g003
Figure 4. Physical model of the sidewall loading for the case of a deep opening excavated within a homogeneous or joined rock mass.
Applsci 13 11881 g004
Figure 5. Views of damaged mine workings with inclined sidewall surfaces: (left)—long pillar at an intersection in Rudna mine, (right)—sidewall of a rectangular gallery with inclusion of competent rocks—Polkowice-Sieroszowice mine after blasting works in the close neighborhood, February 2016.
Applsci 13 11881 g005
Figure 6. Rock mass ejection from the excavation sidewall.
Applsci 13 11881 g006
Figure 7. Values of unbalanced forces Pk which should be compensated by the appropriate ground support system (top), angle α2 (middle), and angle α1 (bottom), assessed for a specific case of excavation geometry, load, and strength characteristics of surrounding rocks.
Applsci 13 11881 g007
Figure 8. Modulus of deformation of surrounding rock mass, scaled down using the Hoek–Diederichs approach [41].
Applsci 13 11881 g008
Figure 9. Maximum shear strain distribution obtained numerically (model 1, top; model 4, bottom).
Applsci 13 11881 g009
Figure 10. Quarter of the entire intersection; contour of the values of safety margin within sidewalls of the gallery (left); contours of slip planes of the failure hexahedron at the underground galleries’ intersection (right).
Applsci 13 11881 g010
Figure 11. Predicted changes in the acceleration (left) and velocity (right) of the detached rock wedge movement (t0 = 0.0131 s).
Applsci 13 11881 g011
Figure 12. Critical depth for different types of rocks within a drift’s sidewall in selected mining-geologic conditions (B = 6 m, H = 3 m, px = 10 MPa).
Applsci 13 11881 g012
Figure 13. Rockburst safety factor distribution over one of the analyzed regions in the Rudna mine.
Applsci 13 11881 g013
Table 1. The unitary increment of values of the model’s basic parameters.
Reference
Result Values
Increment of the Basic Parameters
ΔB = 1 mΔpx = 1 MPaΔpz = 1 MPAΔφ = 1 deg.
Pk = 4.64 MN0.375 MN/m−0.167 MN/MPa1.13 MN/MPa−0.42 MN/deg.
α1 = 64.1 deg.0.45 deg./m0.260 deg./MPa−0.52 deg./MPa0.82 deg./deg.
α2 = 86.1 deg.0.35 deg./m−0.12/deg./MPa0.32 deg./MPa−0.02 deg./deg.
Table 2. Strength parameters for the considered models.
ModelCohesion c (MPa)Angle of Internal Friction ϕ (deg)
1835
2435
3825
4425
Table 3. Validation of the proposed limit equilibrium method with FEM-based numerical simulations.
No.Proposed LEM ApproachFEM SolutionCorrelation
F ¯ m i n F ¯ a v α 1LEM
(deg.)
α 2LEM
(deg.)
α 1FEM
(deg.)
α 2FEM
(deg.)
α 1LEM α 1FEM α LEM α 2FEM
10.840.8956.978.851790.860.97
20.550.6949.385.44784
30.730.8147.879.85079
40.470.6240.985.53886
Table 4. Averaged values of the UCS laboratory test-based data for rocks within the copper ore body.
Type of RockSandstonesAnhydritesGrainy Dolomites and Limestones
UCS (MPa)71–142100–141151–224
GSI45–7060–7575–90
Angle of
internal
friction (°)
Triaxial tests64–6761–6564–69
Reduced using GSI31.5–44.036.4–44.246.2–62.7
Cohesion c (MPa)Triaxial tests17.5–20.515.8–18.818.0–22.5
Reduced using GSI2.8–11.65.5–11.413.2–30.1
Stress ratio0.14–0.600.27–0.800.33–1.39
Horizontal stress px (MPa)4–126–308–40
Disclaimer/Publisher’s Note: The statements, opinions and data contained in all publications are solely those of the individual author(s) and contributor(s) and not of MDPI and/or the editor(s). MDPI and/or the editor(s) disclaim responsibility for any injury to people or property resulting from any ideas, methods, instructions or products referred to in the content.

