Article

The Effects of Toluene Mineralization under Denitrification Conditions on Carbonate Dissolution and Precipitation in Water: Mechanism and Model

1
Institute of Hydrogeology and Environmental Geology, Chinese Academy of Geological Sciences, Shijiazhuang 050061, China
2
School of Resources and Environmental Engineering, Hefei University of Technology, Hefei 230009, China
3
Key Laboratory of Groundwater Remediation of Hebei Province & China Geological Survey, Shijiazhuang 050061, China
4
School of Water Resources and Environment, Hebei GEO University, Shijiazhuang 050031, China
5
SINOPEC Research Institute of Safety Engineering Co., Ltd., Qingdao 266071, China
*
Authors to whom correspondence should be addressed.
Appl. Sci. 2023, 13(21), 11867; https://doi.org/10.3390/app132111867
Submission received: 17 September 2023 / Revised: 27 October 2023 / Accepted: 28 October 2023 / Published: 30 October 2023

Abstract

:
The mineralization of benzene, toluene, ethylbenzene, and xylene (BTEX) into inorganic substances by microorganisms may affect the water–rock interaction. However, few studies have quantitatively analyzed the processes. To quantitatively reveal this mechanism, in this study, nitrate and toluene were taken as the typical electron acceptor and BTEX, respectively. Based on hydro-geochemical theory, the mechanism and mathematical model were established. In addition, the model was verified with a toluene mineralization experiment. The mechanism model demonstrated that H+ was the main factor in the dissolution or precipitation of CaCO3. The mathematical model derived the equations quantitatively between the amount of toluene mineralization, CaCO3, and some biogeochemical indicators, including temperature, microbial consumption, and other major ions in groundwater. According to the model, the amount of dissolved CaCO3 increased with the increasing proportion of completely reduced nitrate. For a complete reaction, the greater the microorganisms’ consumption of toluene was, the smaller the precipitation of CaCO3. CaCO3 dissolution was a nonmonotonic function that varied with temperature and the milligram equivalent of other ions. Furthermore, the validation experiments agreed well with the mathematical model, indicating its practicality. The established model provides a tool for assessing the biodegradation of toluene by monitoring the concentration of groundwater ions.

1. Introduction

Contamination caused by petroleum leakage occurring during oil production, transportation, refinement, and mishandled storage is widespread [1,2,3,4,5]. Benzene, toluene, ethylbenzene, and xylene (BTEX) are volatile organic compounds in petroleum that result in neurotoxicity, genotoxicity, and reproductive toxicity [6,7,8]. Due to its mutagenic and high migration, BTEX leads to the deterioration of aquatic and terrestrial environment quality when released into the environment and causes adverse effects on human health when absorbed by breathing, touching, or swallowing [9,10,11].
Natural attenuation processes, such as biomineralization, adsorption, advection, dispersion, and volatilization, can all decrease the number of contaminants in an aquifer [12,13,14]. Since biomineralization uses microorganisms to convert BTEX into inorganic substances, it is considered an environmentally friendly technology [15,16]. In the 1960s, scientists found that some bacteria could use BTEX as their source of carbon energy, thus decomposing the BTEX into CO2 and water, which confirmed that it could be aerobically degraded [17,18]. However, the underground environment is usually anaerobic, and the anaerobic mineralization of BTEX is more feasible and practical. BTEX can be biodegraded with NO3, Mn4+, Fe3+, and SO42−, and CO2 as terminal electron acceptors [19,20,21,22]. As NO3 dissolves well in water, and denitrification yields the highest energy, NO3 can easily be applied for anaerobic mineralization [23,24,25,26]. The mineralization mechanism of BTEX under denitrification conditions is as follows: BTEX acts as both a carbon source and energy for the growth and reproduction of bacteria, and NO3 acts as an electron acceptor to convert hazardous materials to CO2 and H2O, leading to the mineralization of BTEX [27,28].
The BTEX mineralization equations are as follows:
C6H6 + 6NO3 + 6H+ → 6CO2 + 3N2 + 6H2O
C7H8 + 7.2NO3 + 7.2H+ → 7CO2 + 3.6N2 + 7.6H2O
C8H10 + 8.4NO3 + 8.4H+ → 8CO2 + 4.2N2 + 9.2H2O
It was previously believed that this mineralization could solve the problem of BTEX pollution. However, mineralization impacts the water–rock interaction, especially in the dissolution and precipitation of carbonate rocks. Studies in this area have found that transforming BTEX to inorganic C involves a series of reactions, resulting in a decreased pH and the dissolution of carbonate mineral calcite [29].
Two main aspects influence the dissolution and precipitation of CaCO3 via biomineralization. First, under denitrification conditions, BTEX is converted into neutral or acidic organic compounds, which induce a variety of pH levels [30,31]. Second, BTEX is converted into end-product CO2 (Equations (1)–(3)), which, together with H+ from the water, forms H2CO3 and causes the pH to decrease (Equations (4)–(8)) [27].
CO2 + H2O ⇋ H2CO3
H2CO3 ⇋ H+ + HCO3
HCO3 ⇋ H++ CO32−
H2O ⇋ H+ +OH
CaCO3 ⇋ Ca2+ + CO32−
Currently, most studies show that the degradation of BTEX promotes the dissolution of calcium carbonate, whether this is demonstrated through indoor column experiments or field data collection [32,33]. Moreover, several studies suggest that the pH could rise slightly as CO2 is degassed from water and autotrophic microbial metabolism occurs, resulting in carbonate precipitation and removal [34,35]. Until now, few studies have quantitatively analyzed the effect of BTEX mineralization on the dissolution and precipitation of CaCO3.
Therefore, based on hydrogeochemical and organic biomineralization theory, a mechanism model was revealed. To quantitatively evaluate the effect of BTEX mineralization on the water–rock interaction and to infer the impact of BTEX mineralization on downstream water quality, a quantitative model was established, taking nitrate as a typical electron acceptor and toluene, the most abundant species of BTEX, as a typical BTEX pollutant, respectively [36]. Only the toluene mineralization and carbonate equilibrium reaction occurred in the solution. In this case, the difference between the Ca2+ and HCO3 concentrations in the solution at different periods can be substituted into the mathematical model, and the toluene degradation amount in each period can be roughly determined. Furthermore, a toluene mineralization experiment was conducted to verify the established model.

2. Materials and Methods

2.1. Model Construction

2.1.1. Mechanism Model Construction

This paper integrates relevant hydrogeochemistry and organic matter degradation theories and selects toluene and nitrate as a typical BTEX pollutant and a typical electron acceptor, respectively. According to the theoretical equation of toluene mineralization under denitrification conditions, the changes in H+, Ca2+, and HCO3 concentrations were qualitatively analyzed, and a mechanism model for examining how the mineralization of toluene affected the dissolution and precipitation of calcium carbonate was established.

2.1.2. Mathematical Model Construction

In this study, to quantitatively analyze the effects of toluene mineralization under denitrification conditions on carbonate dissolution and precipitation, based on the above mechanism model and according to mass conservation and charge conservation equations, the relationships between the H+, Ca2+, and HCO3 concentrations and toluene degradation were obtained. To facilitate this analysis, several assumptions were made. Since the main inorganic salt ions in groundwater account for 90–95% of the total inorganic salt ions, the main inorganic salt ions were taken into account by the model [37].
This paper mainly considers the influence of four variables on the model, namely, the influence of the proportion of nitrate consumed by the complete reduction of nitrogen on the total amount consumed; the temperature; the proportion of toluene consumed by microbial growth to total toluene content; and the milligram equivalent of other ions on the dissolution and precipitation of calcium carbonate.

2.2. Model Validation

2.2.1. The Validation Experiment

(1)
Toluene biodegradation enrichment cultures
The enrichment culture microorganisms originated from groundwater in a Chinese coking plant.
Microcosms were set up using 280 mL air-tight bottles. Each microcosm contained 225 mL of sterilized basic culture medium, 25 mL of bacterial solution, and 0.0175 g of CaCO3 to simulate the carbonate environment. The bacterial culture medium was modified from a recipe developed by Zhang [38]. The basic culture medium was prepared according to the following compositions (per liter): KNO3, 80 mg; KH2PO4, 0.50 mg; K2HPO4 3H2O, 1.00 mg; MgSO4, 1.00 mg; mineral solution, 0.10 mL; and vitamin solution, 0.20 mL. The components of the vitamin and mineral solutions are shown in Table 1 and Table 2. Then, the bottles were autoclaved at 121 °C for 30 min to prevent biological activity. The medium was purged with nitrogen to remove oxygen, and the air-tight bottles were sealed with a halogenated butyl rubber stopper to ensure their air tightness. Furthermore, toluene was added to each bottle to form 0.1 mmol/L toluene solution. Three parallel controls were established for the blank and experimental groups. In the sterile controls, the bacterial solution was replaced with purified water. All of the microcosms were stored in a biochemical incubator at 20 °C. On days 1, 2, 4, and 8, water samples were collected from each microcosm for analysis. Sampling procedures were accomplished under strictly anaerobic conditions. As CaCO3 is an insoluble impurity in water, it was difficult to observe, and there were no other calcium inputs in the system, so the concentration of Ca2+ was used to characterize the dissolution and precipitation of calcium carbonate. To evaluate the carbonate dissolution/precipitation via biodegradation, the consumption of Ca2+, HCO3, NO3, and NO2 was continuously measured during the entire experimental period.
(2)
Physical and chemical parameter analyses
The toluene samples were analyzed by headspace-based gas chromatography (Nexis GC-2030, Shimadzu, Japan) carried out on an automated headspace sampler (HS-10, Shimadzu, Japan). Headspace operating conditions were as follows: low shaking of the tested sample solution at 35 °C for 2 min, GC cycle time of 25 min, and vial pressurization time of 0.1 min. The gas chromatograph was equipped with a capillary column (HP-5, Shimadzu, Japan) and a flame ionization detector (FID). The injector, detector, and column temperatures were held at 150, 200, and 100 °C, respectively. Air and hydrogen served as fuel gases for the FID. Nitrogen served as a carrier gas, and the flow rate was 40.1 mL/min.
The pH value was measured with a portable pH meter (portable pH meter pH30, CLEAN, Sherman Oaks, CA, USA), and the Ca2+ and HCO3 concentrations were measured via titration. The NO2 and NO3 concentrations were analyzed according to the International Organization for Standardization ISO 10304-1 [39] with an ultraviolet spectrophotometer (UV-2550, Shimazu, Japan).

2.2.2. The Validation Method

To evaluate the accuracies of the model, residual sum of squares error (SSE), mean square error (MSE), and root mean square (RMS) error were considered as the criteria for the accuracy evaluation and calculated by the following (Equations (9)–(11)).
S S E = i = 1 n ( y i y i ) 2
M S E = S S E n = 1 n i = 1 n ( y i y i ) 2
R M S = M S E = S S E n = 1 n i = 1 n ( y i y i ) 2
where y i is the value calculated by the model, y i is the value of the experimental data, and n is the number of samples. SSE, MSE, and RMS error reflect the reliability and stability of the model. It is commonly accepted that the closer the sum of squares error (SSE) is to 0, the better the model fits the data.

3. Results and Discussion

3.1. Mechanism Model

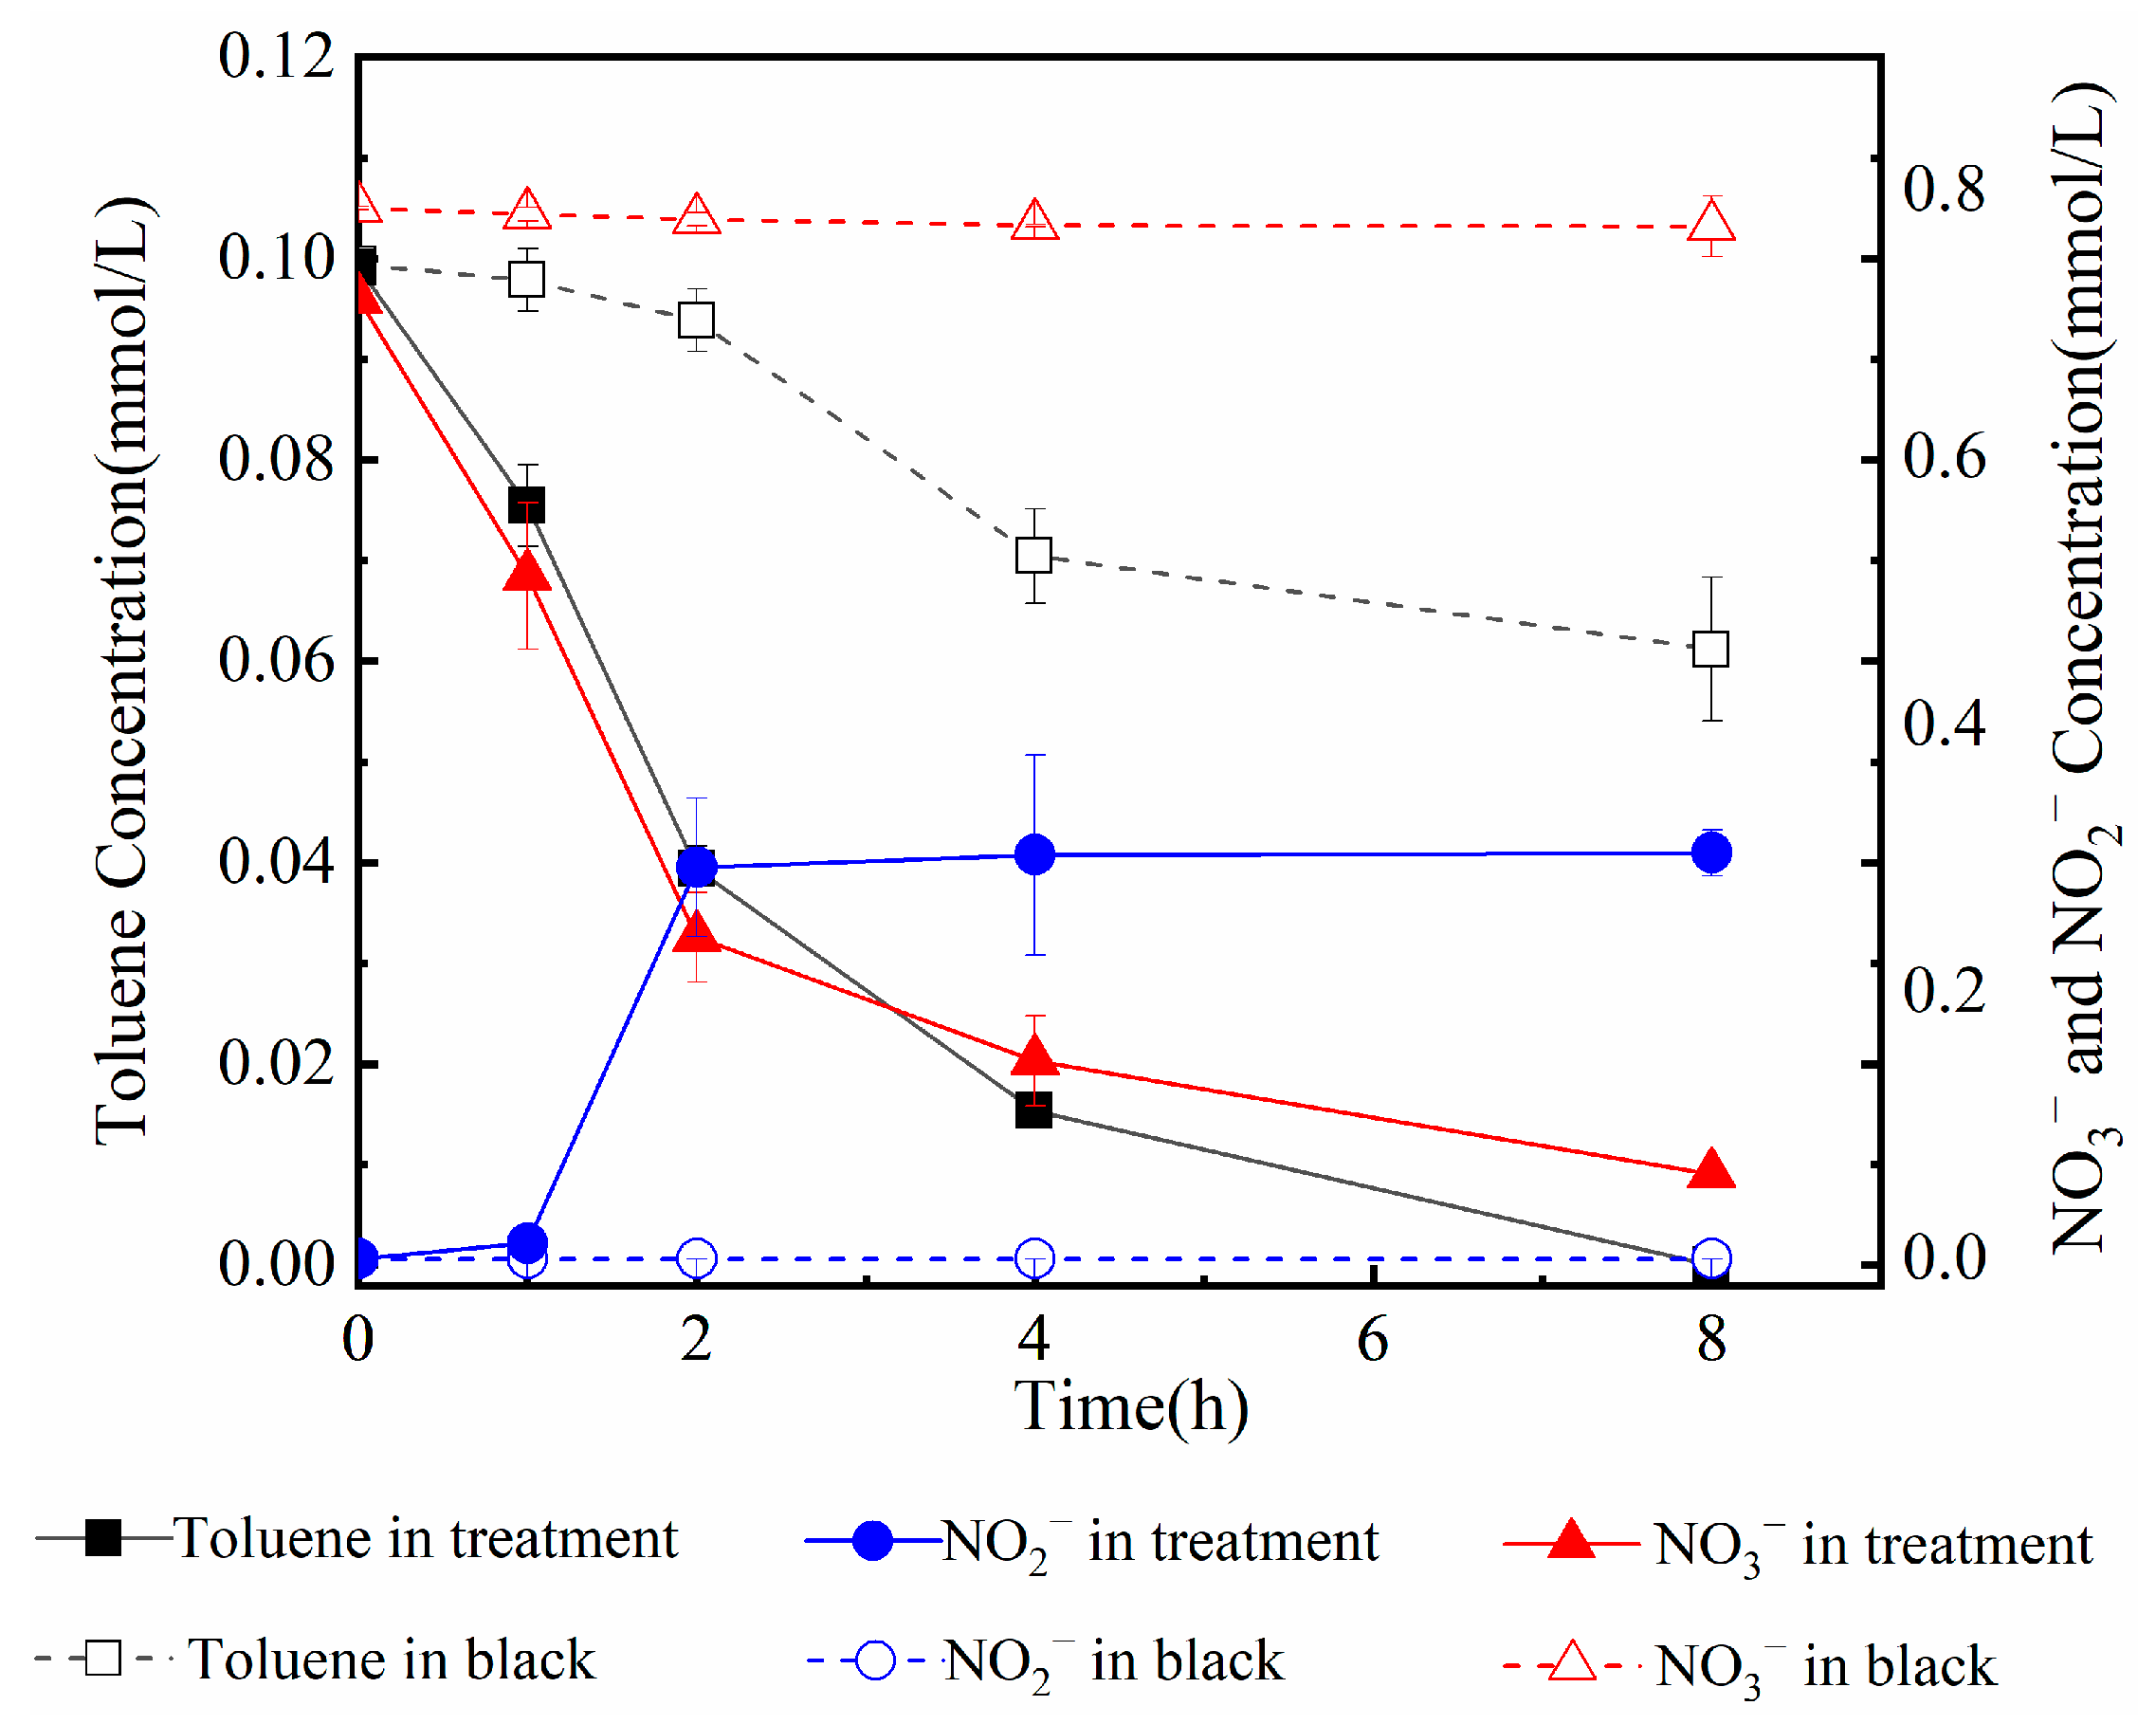
3.1.1. Response of H+ to Toluene Mineralization

According to Siobhan M. et al., the nitrification process comprises a two-step reaction during microbially mediated toluene mineralization. The first product of nitrate reduction is nitrite (NO2). Further reduction of nitrite proceeds to nitrogen gas (N2) [40,41].
Nitrification first step (nitrate reduction):
C7H8 + 18NO3 = 18NO2 + 7CO2 + 4H2O
Nitrification second step (nitrite reduction):
C7H8 + 12NO2 + 12H+ = 6N2 + 7CO2 + 10H2O
According to Song et al., in the two-step nitrification process, nitrite reduction produces hydrogen ions, whereas nitrate reduction does not [42]. During the complete mineralization process of toluene, the generated end products include gaseous carbon dioxide and water [43]. When gaseous carbon dioxide dissolves in water, it reacts and forms carbonic acid. The dissociation of hydrogen ions from the carbonic acid provides bicarbonate, and subsequently, a carbonate ion leads to an increase in H+ (Figure 1).
Under natural practical conditions, nitrate usually degrades directly into nitrogen gas (Equation (2)). Toluene mineralization consumes H+, and the aqueous pH increases during the reduction process. The end products of mineralization are still carbon dioxide and water, which dissolve into the solution and eventually react with water to form stable carbonate compounds. Due to the complexity of the reactions, changes in the concentration of hydrogen ions in the solution are complicated. Based on the ionization fractions, the ratio of the solute components in the aqueous carbonate system will vary with H+. As the pH of the solution increases, the concentration of CO32− also increases, particularly in an alkaline solution. When the saturation index (SI) reaches a certain value, some of the calcium carbonate in the solution precipitates out.

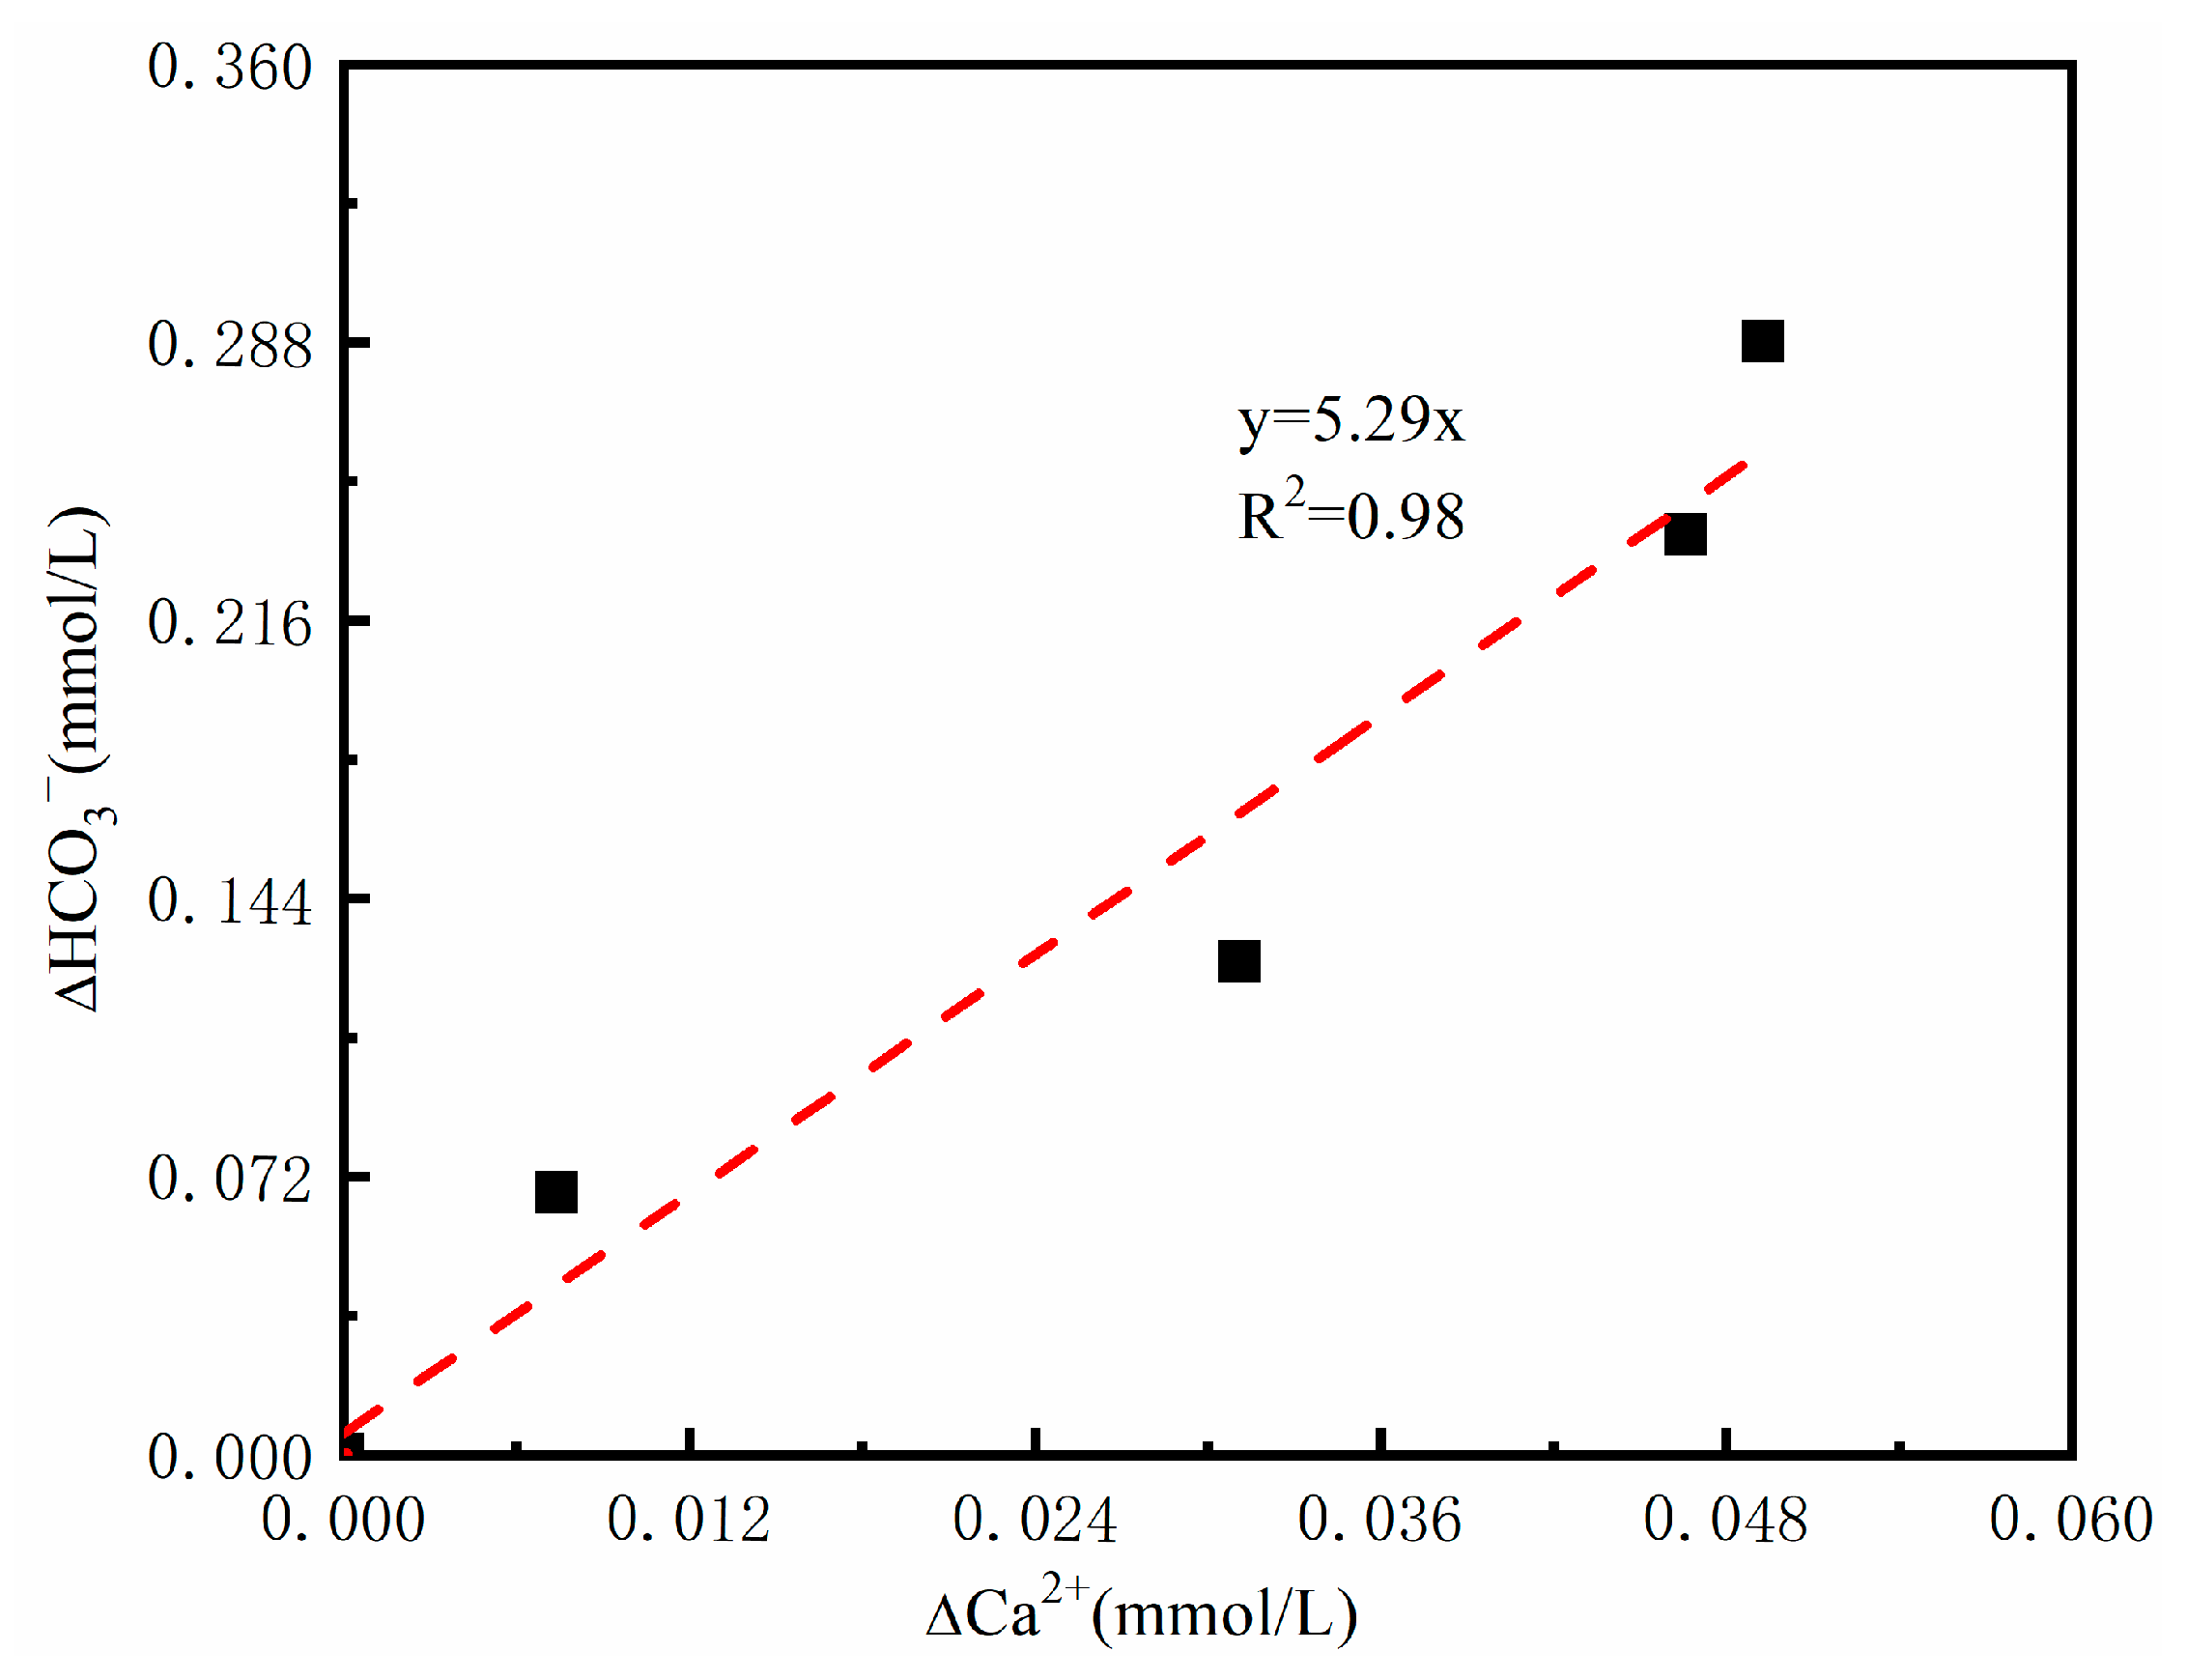
3.1.2. Response of Ca2+ and DIC to Toluene Mineralization

H+ is one of the critical factors affecting carbonate composition. Along with the change in H+, the concentration of other ions in the solution will change accordingly. Dissolution and precipitation are more difficult to observe under field conditions; Ca2+ and dissolved inorganic carbon (DIC) are the most commonly used to detect CaCO3 dissolution. DIC is composed of three dominant species: dissolved CO2 (CO2), bicarbonate (HCO3), and carbonate (CO32−).
If the amount of hydrogen ions produced by carbon dioxide dissolved in water and then electrolyzed is greater than the amount of hydrogen ions consumed by the reaction, the CaCO3 dissolves, which leads to an increase in the concentration of Ca2+ and CO32−, accompanied by a corresponding increase in the concentration of H2CO3 and HCO3. On the other hand, when the solution is saturated with CaCO3, then the CaCO3 precipitates, and the concentrations of Ca2+, CO32−, and HCO3 decrease.
In summary, multiple reactions are involved in toluene mineralization under denitrification conditions, and they are strongly interdependent. Therefore, a mathematical model is required to analyze the impact of toluene mineralization on calcium carbonate in this context.

3.2. Mathematical Model

Groundwater is uniform within an infinite small range. Each ion concentration of groundwater is low, and the temperature of groundwater is generally relatively constant [44]. The aeration zone blocks the exchange of aquifer and atmospheric gas, and the carbonate in an oil-polluted aquifer is often saturated [34].
Therefore, the following assumptions are made to facilitate the establishment of the mathematical model: (1) the components are well mixed, and the pressure, salinity, and ionic strength are uniform, (2) CO2 is the ideal gas, (3) the temperature is constant, (4) the ionic activity of an ion equals the actual concentration at which the reactions take place in a homogeneous environment, and (5) the solution in the system, which is a closed system, is a calcium carbonate saturated solution.
Based on the mechanism model, the mathematical model was derived from the mass conservation and charge conservation equations in Equations (12) and (13).
In case a carbonate component is not introduced into the system, the Ca2+ and dissolved carbonate components come from the degradation of toluene and calcite. As a result, the mass conservation equation can be expressed as follows:
7[C7H8] + [Ca2+] = [H2CO3] + [HCO3] + [CO32−] + [CO2]
where [ C 7 H 8 ] is the concentration of toluene involved in the reaction, mol/L. [] is the ionic activity of the ions, mol/L.
The electric charge conservation equation is as follows:
[H+] + [Na+] + [K+] + 2[Ca2+] + 2[Mg2+] = [Cl] + 2[SO42−] + [HCO3] + 2[CO32−] + [NO3] + [NO2] + [OH]
where [] is the ionic activity of the ions, mol/L.
The equilibrium constant in the system can be expressed as:
K H = [ H 2 C O 3 ] P c o 2
K H 2 C O 3 = [ H + ] × [ H C O 3 ] [ H 2 C O 3 ]
K H C O 3 = [ H + ] × [ C O 3 2 ] [ H C O 3 ]
K w = [ H + ] × [ O H ]
K c a l = [ C a 2 + ] × [ C O 3 2 ]
According to Equations (16)–(20), the relationship equation between the H+ concentration and the toluene degradation is established (Equation (21)).
14 × f × C 7 H 8 = H + K w H + N O 3 N O 2 + E + 2 × A + B + C × 1 C a 2 + A = K c a l × [ H + ] 2 K H 2 C O 3 × K H C O 3 B = K c a l × [ H + ] K H C O 3 C = K c a l × V V a × H + 2 K H 2 C O 3 × K H C O 3 × K H × R × T × V a D = H + K w H + N O 3 N O 2 + C 16 2 K c a l × H + 2 × K H C O 3 + K c a l E = N a + + K + + 2 M g 2 + C l 2 S O 4 2 C a 2 + = H + + K w H + + N O 3 + N O 2 E 4 + D
where [] is the ionic activity of the ions, mol/L. V is the total volume of air and solution, and V a is the volume of solution, L. f is the proportion of toluene consumed by microbial growth to the total toluene content. T is the temperature of the system, °C.
The concentration of H+ in the system can be calculated from the equation.
d is defined as the proportion of nitrate consumed by the complete reduction of nitrogen to the total amount of nitrate consumed at a certain time. The simplified model can be expressed as:
14 × f × C 7 H 8 = H + K w H + ( 1 + d ) N O 3 + E + 2 × A + B + C × 1 C a 2 + A = K c a l × [ H + ] 2 K H 2 C O 3 × K H C O 3 B = K c a l × [ H + ] K H C O 3 C = K c a l × V V a × H + 2 K H 2 C O 3 × K H C O 3 × K H × R × T × V a D = H + K w H + ( 1 + d ) N O 3 + C 16 2 K c a l × H + 2 × K H C O 3 + K c a l E = N a + + K + + 2 M g 2 + C l 2 S O 4 2 C a 2 + = H + + K w H + + ( 1 + d ) N O 3 E 4 + D
Due to the large number of parameters involved in the reaction, the following scenarios are proposed. The system is saturated with calcium carbonate. Based on the data from a contaminated site that we studied, the toluene concentration was 0.1 mmol/L. According to the theoretical stoichiometric relationship, the ratio of the nitrate concentration to the toluene concentration was 7.2:1. The specific discussion is as follows.

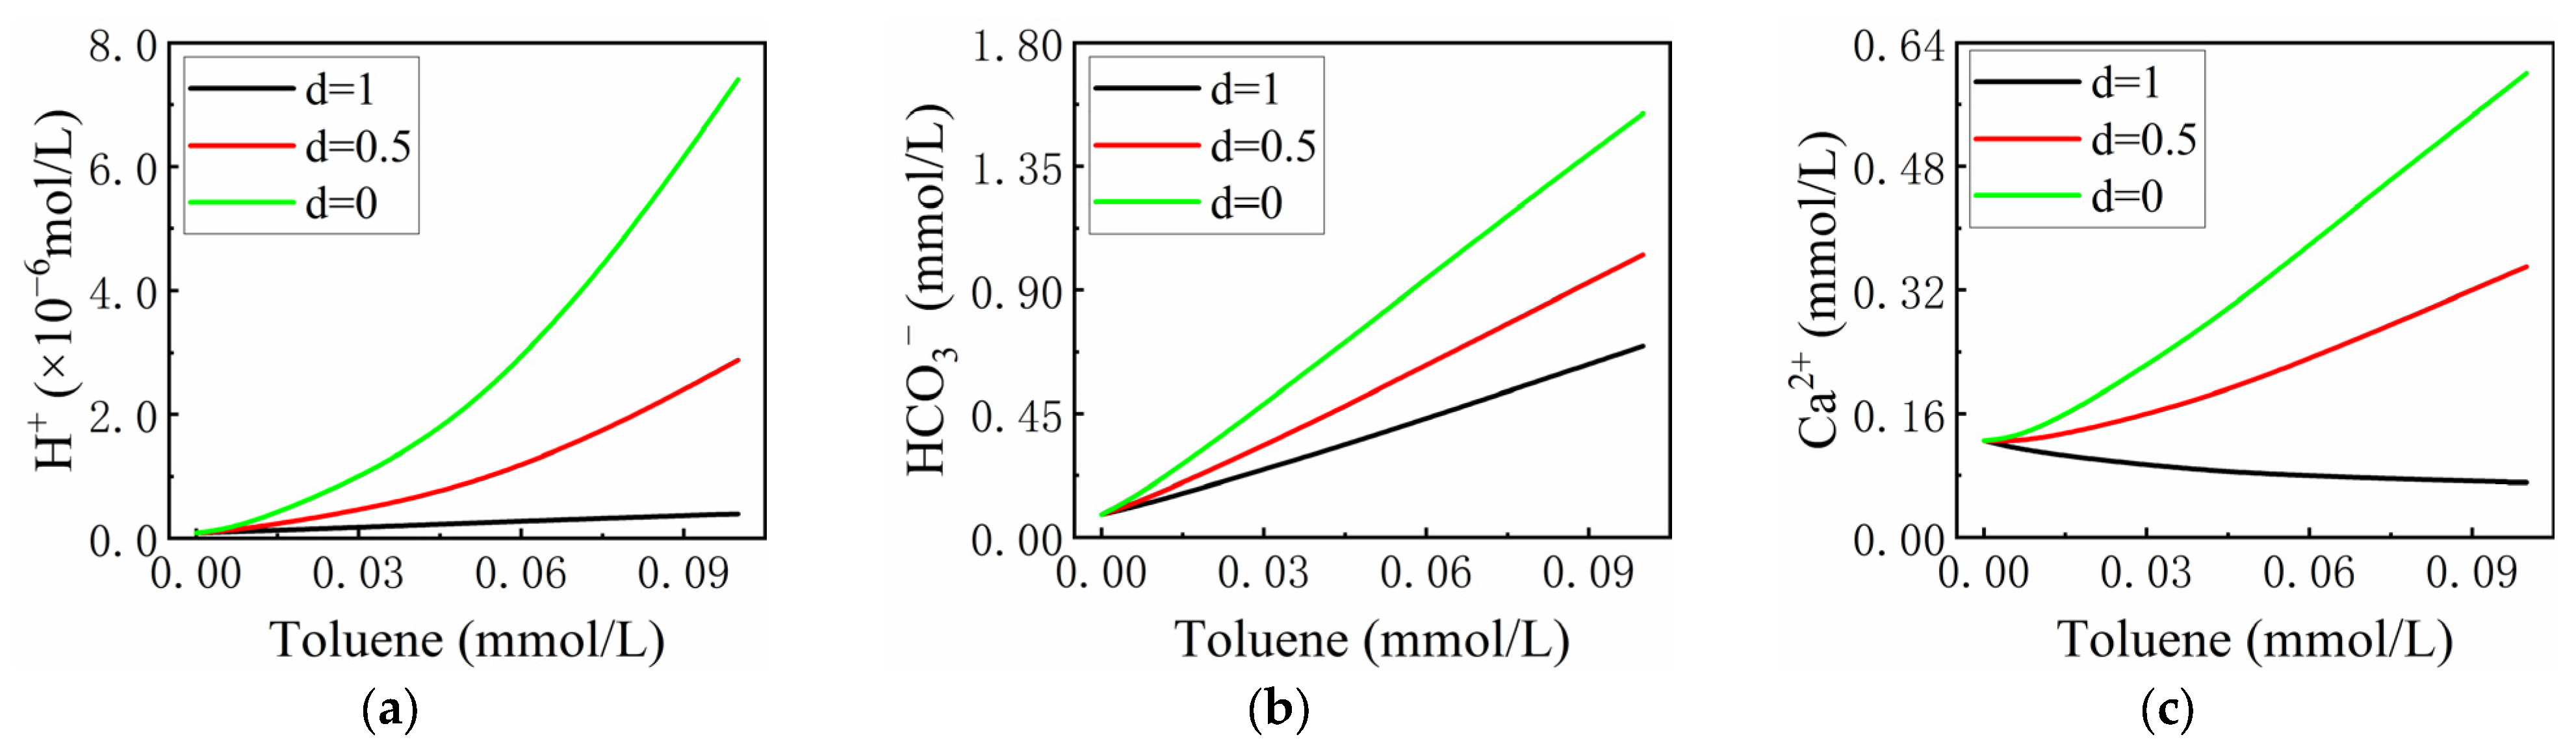
3.2.1. The Effect of the Proportion of Nitrate Consumed by the Complete Reduction of Nitrogen to the Total Amount Consumed (d)

It has been reported that microbial growth can consume from 5% to 8% of toluene, so it is assumed that the consumption of microbial growth is 6.5% in this section [45]. The temperature is assumed to be 20 °C, which combines the average groundwater temperature with the culture temperature of the bacteria used in this paper.
If d is 0, there is no nitrite in the solution, and the nitrate entirely transforms into nitrogen (Equation (2)). As shown in Figure 2, carbon dioxide produced by toluene mineralization reacts with water, increasing the amount of hydrogen ions and producing a large amount of bicarbonate. The precipitation rate of calcium carbonate resulting from reaching the SI value is greater than the dissolution rate of calcium carbonate caused by increased hydrogen ions. This result is consistent with the study of Alenezi et al. [10].
When d equals 0.5, half of the nitrate in the solution is reduced to nitrogen, while the remaining half is reduced to nitrite. The concentration of H+ in the solution increases due to the production of carbon dioxide (Equations (12) and (13)) and the consumption of OH (Equation (13)).
Carbon dioxide produced by toluene mineralization reacts with water to increase the concentration of bicarbonate, which is the same as when d = 0. However, the precipitation rate of calcium carbonate in this state is higher than the formation rate, and the concentration of Ca2+ increases.
When d is 1, all the nitrate in the solution is converted to nitrite. The reduction of nitrate to nitrite neither consumes nor produces hydrogen ions. However, the carbon dioxide produced by the reaction increases the concentration of H+ in the solution. Increased bicarbonate in solution makes the SI always greater than the solubility rate, and the Ca2+ concentration decreases.
It can be seen from the figure that when the reaction does not occur, the amount of each element in the solution is the same in the three cases. The mineralization of toluene increases the concentration of hydrogen ions to varying degrees, and the formation of carbon dioxide increases the concentration of bicarbonate. Depending on the reaction mechanism in the solution, the concentration of Ca2+ varies with the proportion of nitrate consumed in the two-step reaction.
Under natural practical conditions, the nitrite concentration in the solution is small, the reaction is less likely, and d = 0 occurs more often.

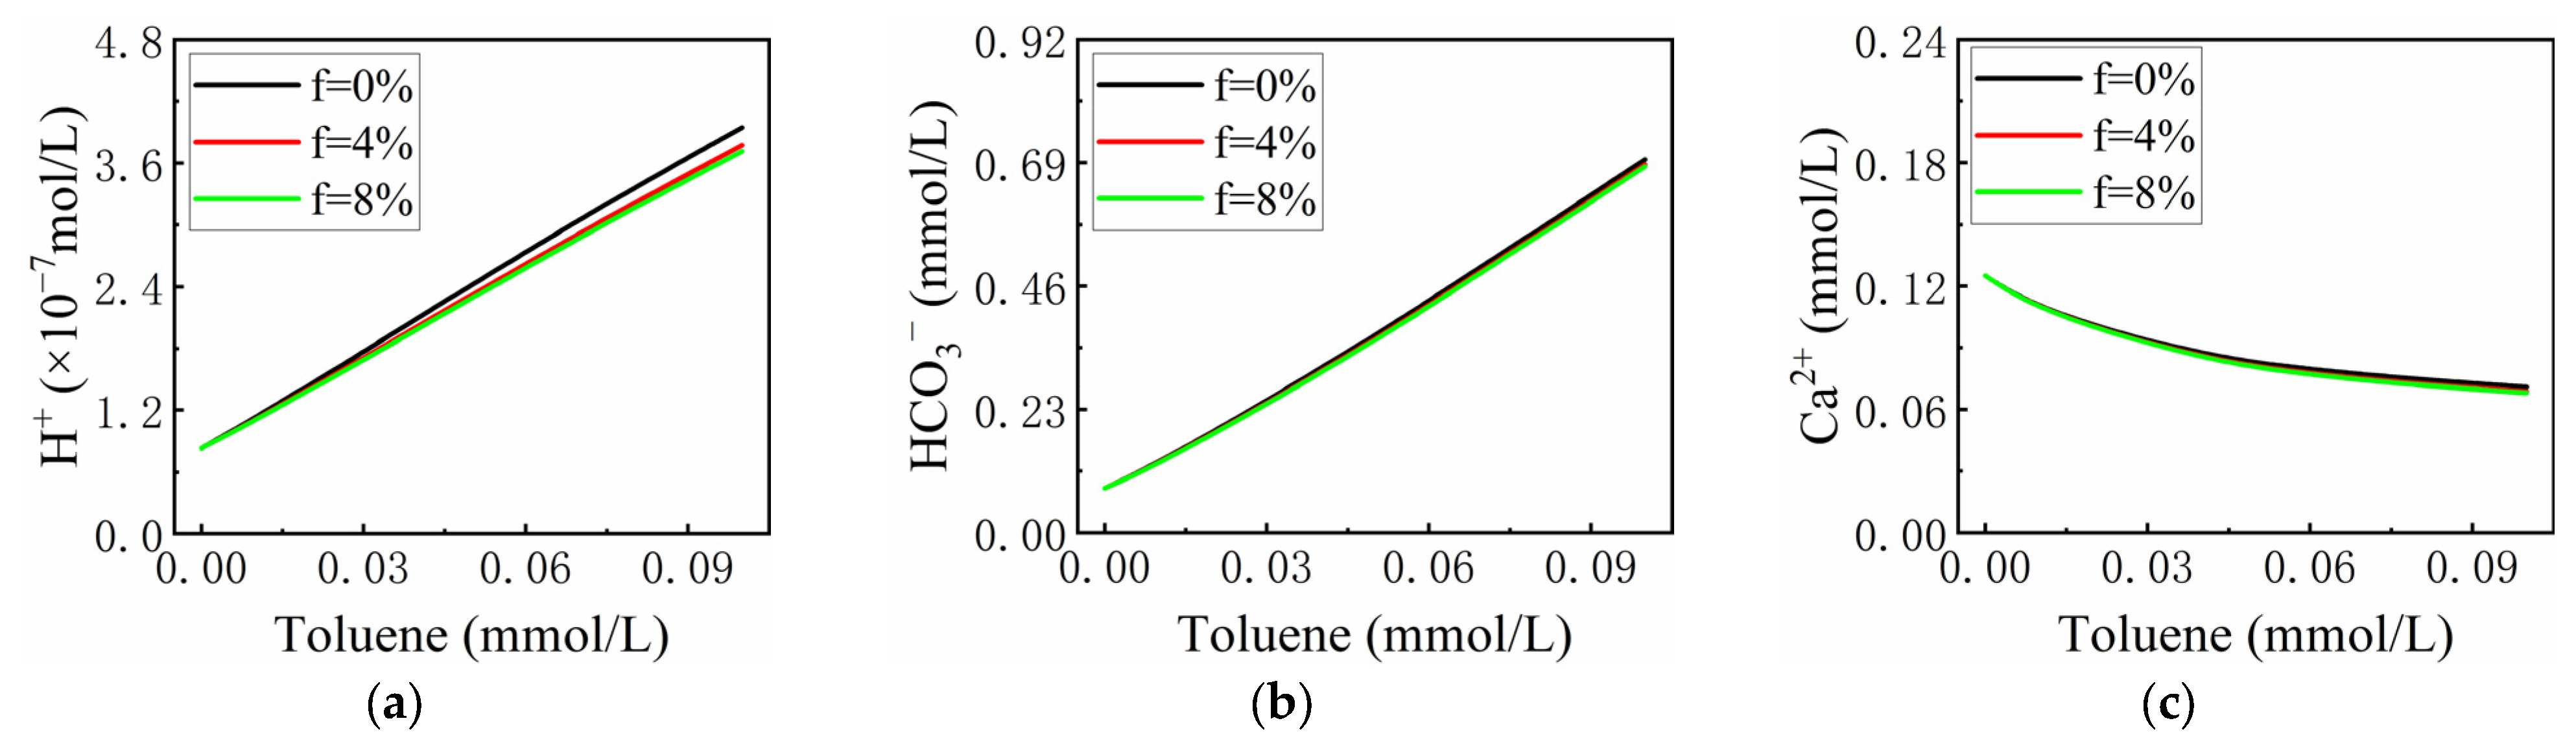
3.2.2. The Effect of the Proportion of Toluene Consumed by Microbial Growth on the Total Toluene Content (f)

Mathematical models were created to illustrate the impact of microbial growth on CaCO3, with diagrams presented in Figure 3 for levels of 0%, 4%, and 8%. Under natural practical conditions, nitrate is completely reduced to nitrogen, and it is assumed that d is 0 and the temperature is 20 °C.
It can be seen that f has little effect on concentration, the consumption of toluene increases, and the concentrations of H+, Ca2+, and HCO3 decrease (Figure 3). The influence of microbial growth on calcium carbonate is mainly reflected in the fact that the more significant the consumption of microorganisms is, the smaller the amount of toluene used for the reaction.

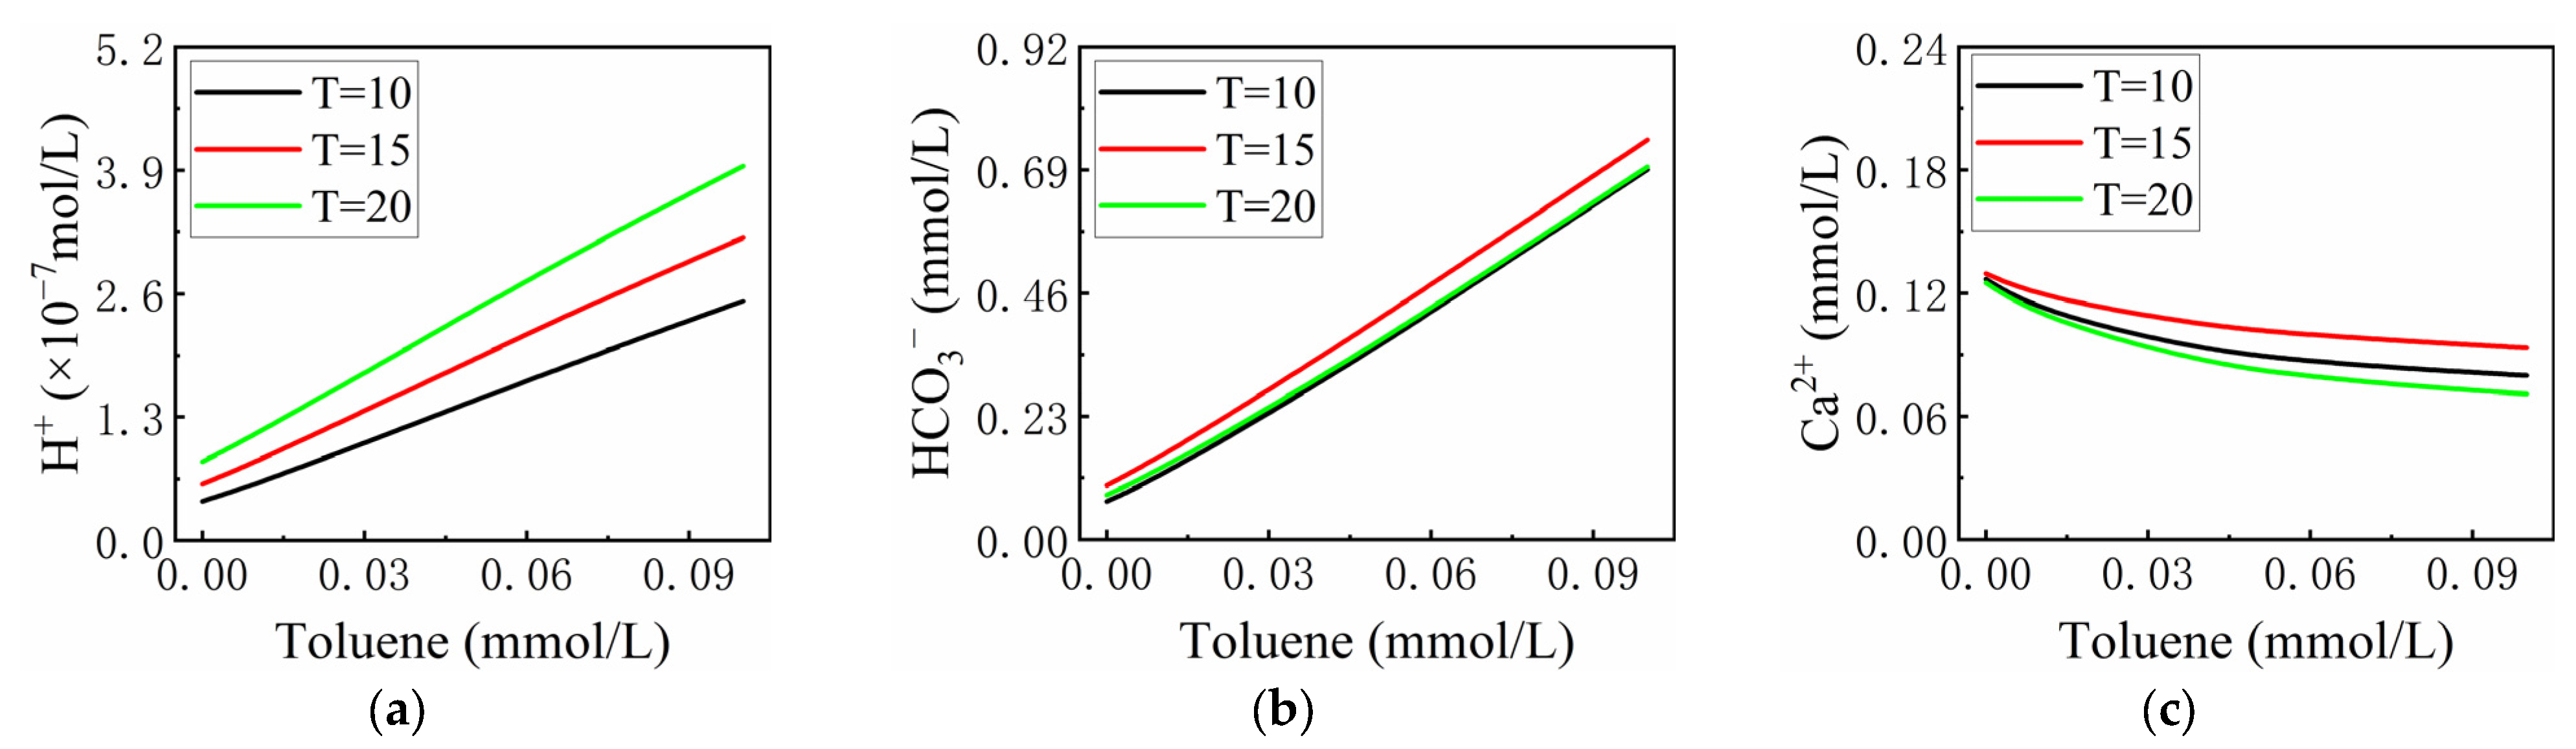
3.2.3. The Effect of Temperature (T)

Since the water temperature of aquifers is mainly in the range of 9–20 °C, in order to simulate the relationship between CaCO3 and toluene at different temperatures, mathematical model diagrams of 10 °C, 15 °C, and 20 °C are presented in Figure 4. This paper assumes that the nitrate is entirely transformed into nitrogen and that the consumption of microbial growth is 6.5%.
As the temperature increases, the activity of ions increases, and the equilibrium constant changes. In addition to directly affecting the temperature assignment in the model, temperature also affects the equilibrium constant of the reaction. As shown in Figure 4, the higher the temperature is, the higher the concentration of H+. The trend of Ca2+ and H+ changes could be more consistent, possibly due to the combination of temperature and the equilibrium constant. Therefore, the influence of temperature on toluene mineralization is complicated. The Ca2+ concentration in the system is not a monotonic function that varies with temperature.

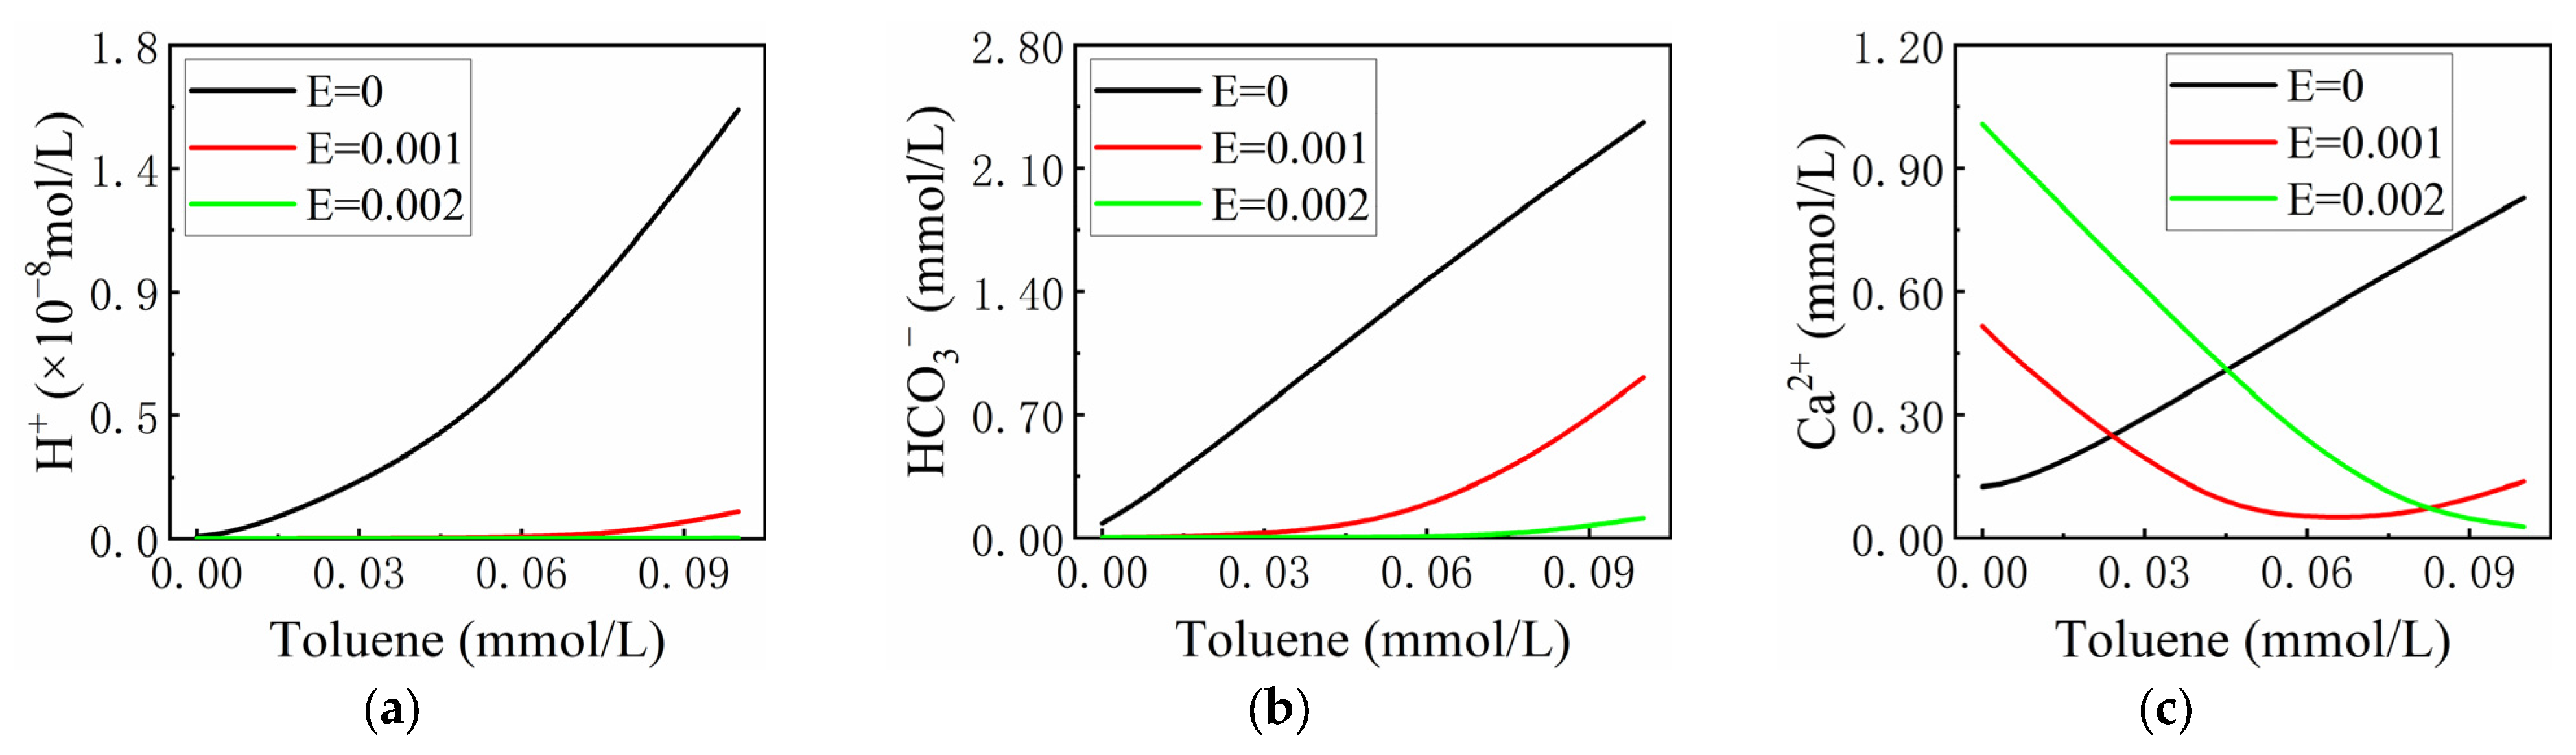
3.2.4. The Effect of the Milligram Equivalent of Other Ions (E)

Figure 5 presents the effects of the milligram equivalent of other ions (E) under toluene mineralization on carbonate dissolution and precipitation. This section assumes that nitrate is entirely transformed into nitrogen, the consumption of microbial growth is 6.5%, and the temperature of the system is 20 °C.
Based on the ion concentration in groundwater, Figure 5 shows the influence of complete mineralization on calcium carbonate when E is 0 mol/L, 0.001 mol/L, and 0.002 mol/L. According to the given information, it appears that the trend of ion concentration change is the same in all three cases, as the reaction mechanism is identical. As can be seen from the figure, the smaller the value of E is, the greater the concentrations of H+ and HCO3 in the corresponding solution at the initial concentrations.
The amplitude of variation in the H+ and HCO3 concentrations increases as the value of E decreases. The change in Ca2+ concentration is slightly different from that of the above two ions. E affects the initial concentration of calcium ion as follows: the larger the value of E is, the smaller the initial concentration. Moreover, E has an impact on the change trend of the Ca2+ concentration. When E is 0, the Ca2+ concentration always increases; when E is 0.002, the Ca2+ concentration always shows a downward trend; when E is 0.001, the Ca2+ concentration shows a trend of first decreasing and then increasing, and there is an inflection point near a toluene concentration of 7 × 10⁻⁵ mol/L. The variation in Ca2+ concentration is complex, possibly due to the complex relationship between Ca2+ and H+ in the model.

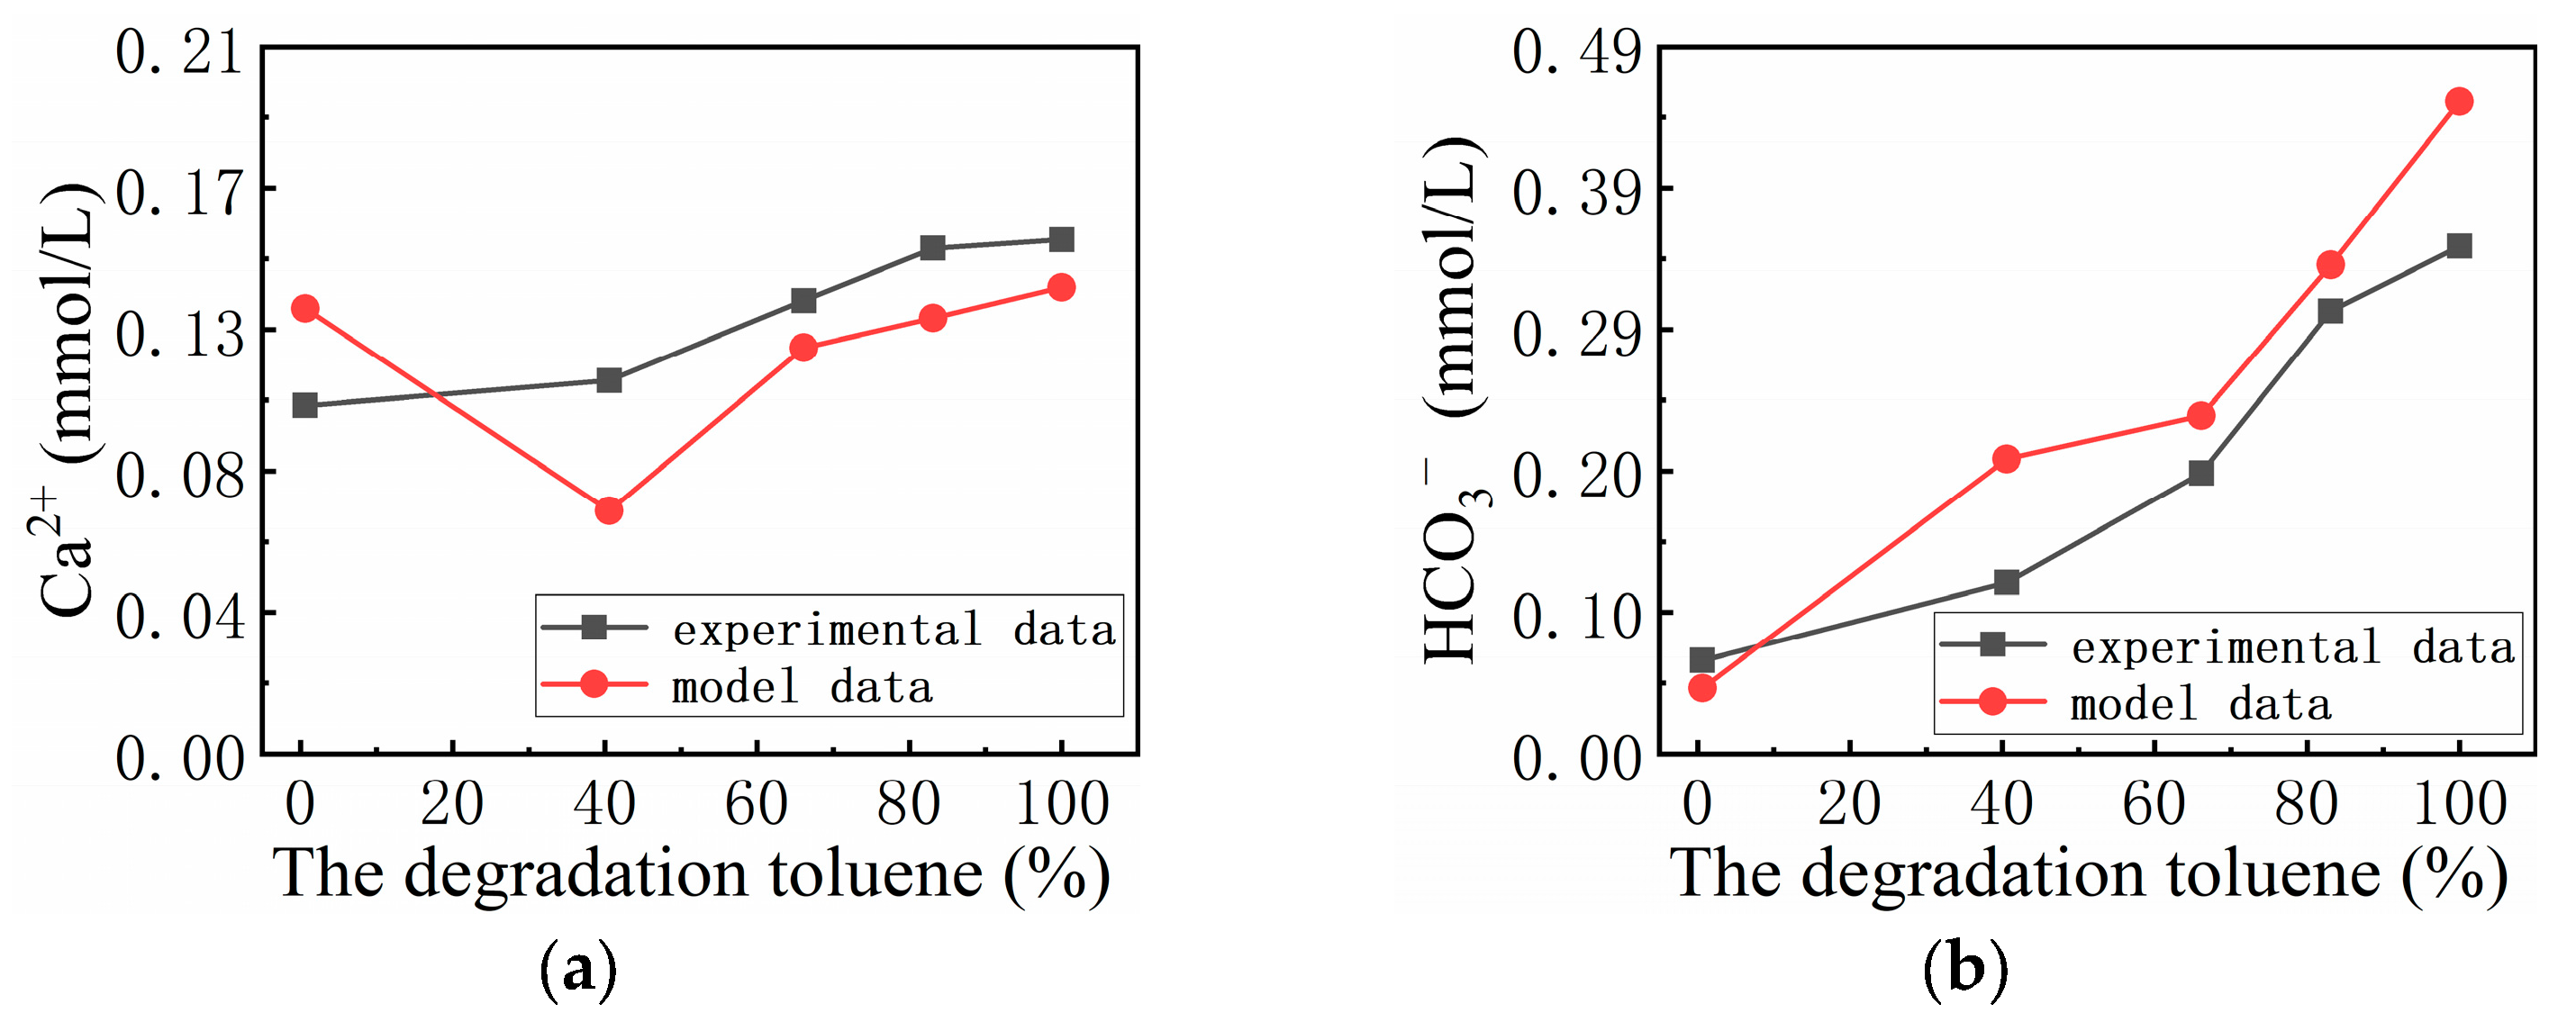
3.3. Fitting Results

The analysis of the experimental results related to toluene mineralization presented in Figure 6 indicates that nitrate concentrations decreased with the increasing amount of toluene degraded. The figure shows that toluene was reduced by 0.02 mmol/L on the first day, suggesting that after domestication, the microorganisms quickly adapted to the experimental environment. The adaptation period of microorganisms in this study was much shorter than that in other studies. Toluene decreased gradually with time. It was degraded by more than 80% on the fourth day of the experiment and was approximately fully degraded within eight days.
The figure shows that the concentration of NO3 decreased gradually with time and was degraded by more than 80% on the fourth day of the experiment. The formation of NO2 was observed as a temporary phenomenon. According to A. PEÑA-CALVA, A. OLMOS-DICHAR, a similar phenomenon was observed and was called a respiratory pattern [46].
The CO2 resulting from the complete degradation of toluene reacts directly with CaCO3 and water in the following reactions:
CaCO3 + CO2 + H2O = Ca(HCO3)2
If the above reaction occurs, the magnitude of the change in HCO3: Ca2+ should be 2:1. A graph of the amount of change in the concentration of HCO3: Ca2+ during the experiment is shown in Figure 7. The slope of the plot is 5.29, and the ratio of the change in the HCO3 concentration to the change in the Ca2+ concentration is much greater than 2:1. This image also shows that mineralization promotes the increase in HCO3 concentration.
To determine the degradation process of toluene and nitrate in the system, the theoretical and practical correspondence between toluene and nitrate was calculated using the following formula. The consumption of NO3 was equal to the concentration of the experimental group NO3 plus the reduction of the experimental group NO3. The consumption of NO3 and the residual amount of NO3 were measured, and the reduction of NO3 was calculated. Actual toluene consumption versus theoretical consumption is shown in Figure 8. The slope between the theoretical and actual consumption of toluene is 0.93, which indicates that the degradation roughly followed Equations (12) and (13), which would satisfy the presupposition of the model.
Based on the results shown in Figure 6, Figure 7 and Figure 8 and the physics models introduced earlier, it is necessary to fit the models’ equations to the experimental data.
The parameters of the model were set as follows:
The ratio for both nitrate and nitrite at each monitoring time was calculated. Because the proportion of toluene consumed by microbial growth compared to total toluene content (f) has little influence, the median of 6.50% was substituted into the model calculation. According to the experimental design, V was 280 mL, Va was 250 mL, and T was 20 °C.
The SSE, MSE, and RMS error of the Ca2+ concentration of the theoretical model and the experimental model were calculated and were 3.15 × 10⁻⁹, 6.31 × 10⁻¹⁰, and 2.51 × 10⁻⁵, respectively. Initially, the Ca2+ concentration was lower than the model-derived value, but it gradually increased and eventually became greater than the model-derived Ca2+ concentration (Figure 9a).
The SSE, MSE, and RMS error of the HCO3 concentration of the theoretical model and the experimental model were calculated to be 2.04 × 10⁻⁸, 4.08 × 10⁻⁸, and 6.38 × 10⁻⁵, respectively. As can be seen from Figure 9b, among the five points, except for the second point, the gap is large, and the other points are well fitted.
After the above rough analysis, the fitting situation of the ions was studied.
Temperature affects the dissolution of calcium carbonate in groundwater. At the first point, the calcium carbonate may not be completely dissolved.
Toluene is converted to metabolic intermediates, such as benzylsuccinate and benzene carboxylic acid, which affect the pH value in the aqueous carbonate system [47,48]. The experimental data of the Ca2+ concentration showed slightly higher values than the model data. This may be because the intermediate product is acidic, which affects the ionization of carbon dioxide and promotes the dissolution of calcium carbonate.
The first two points may have belonged to the stage when microorganisms were adapting to their environment. The second to third points marked the period of rapid conversion of nitrate to nitrite, when the concentration of nitrate and nitrite changed rapidly, so there may have been a great difference in monitoring concentration. In addition, this stage also represented the exponential period of microbial growth and reproduction, and the toluene consumption of microorganisms may have been much higher than 5%, which may be the reason for the significant difference between the third point and the model. In the later period, microorganisms were in the decline period, and microorganisms had almost stopped consuming toluene, so the fitting results of the latter two points were slightly poor.
To ensure the survival of microorganisms, small amounts of Mg2+ and phosphate plasma were added to the experiment as necessary nutrients. The influence of various ions in the system also caused a difference between the model and the experiment.

3.4. Implications

The derivation of the model is based on part of the life cycle, which refers to the whole process of producing nitrogen, carbon dioxide, and water from the reaction of the reactants toluene and nitrate [49]. The effects of toluene degradation on the calcium carbonate system include many qualitatively complex reactions, and the mathematical model still has some limitations. Therefore, numerical simulation can be used to guide and apply the actual practice in the future, and the model can be better generalized [50]. Thus, it can serve to calculate the amount of degradation of petroleum pollutants by calculating the change in inorganic ion concentrations in the field, avoiding a series of problems associated with field organic tests, such as delayed test results, dangerous test drugs, and secondary pollution of the test solution. At the same time, with the help of the model, the degradation of toluene in a fixed period can be quickly determined, which is of great significance for improving the distribution efficiency of regional groundwater organic pollution.
In the model, NO3 is converted to N2 by the action of microorganisms. According to the research, fungi are capable of this reaction. They possess enzymes involved in denitrification, including nitrate reductase (Nar) and nitrite reductase (Nir). Similarly, bacteria such as nitrite-reducing bacteria and facultative denitrifying bacteria also possess these enzymes and can carry out the reaction in the model [42,51].
In general, denitrifying bacteria have diverse living conditions. The pH range for these microorganisms is generally between 6.5 and 9, and they can thrive in environments with temperatures ranging from 10 to 40 degrees Celsius. For bacteria, the reaction occurs under anaerobic conditions. For fungi, a small amount of oxygen can promote the reaction, but excessive oxygen inhibits the reaction [52]. The environment of most groundwater systems is suitable for the growth of microorganisms. At present, the living environment of microorganisms is not considered in the derivation of the model. In the future, the existing research will be expanded by a series of experiments with different initial conditions, including toluene concentration, intermediate organic acids, and initial pH.

4. Conclusions

Based on hydrogeochemical and organic biomineralization theory, this study obtained conceptual and mathematical models of the effect of toluene mineralization on the dissolution and precipitation of CaCO3.
It was found that several factors may influence the dissolution and precipitation of CaCO3. The first is whether the nitrate is thoroughly reduced to N2. When nitrate is thoroughly reduced, CaCO3 will precipitate. On the contrary, calcium carbonate dissolution and precipitation depends on the degree of nitrate reduction. The second influencing factor is the proportion of toluene consumed by microbial growth compared to total toluene content (f). For a complete reaction, the greater the consumption of microorganisms is, the smaller the amount of toluene consumed in the reaction and the smaller the precipitation of calcium carbonate. The third factor is temperature (T). The Ca2+ concentration in the system is not a monotonic function that varies with temperature. The milligram equivalent of other ions (E) may also affect the dissolution and precipitation of CaCO3 in a nonmonotonic function style.
In summary, toluene mineralization impacts the dissolution and precipitation of CaCO3, which changes with the change in relevant parameters in the mathematical model. The established model provides a tool for evaluating biodegraded hydrocarbons by measuring the NO3, NO3, and Ca2+ concentration variations in groundwater.

Author Contributions

Conceptualization, M.Z. and L.S.; methodology, Z.N.; writing—original draft preparation, S.G. and X.W.; writing—review and editing, Y.Z. and S.Y.; validation, Y.X.; formal analysis, C.G. All authors have read and agreed to the published version of the manuscript.

Funding

This research was funded by the CAGS Research Fund, grant number SK202207; the Central Leading Local Science and Technology Development Fund Project, grant number 236Z4204G; the National Natural Science Foundation of China, grant number 42007171; the Sinopec Science Department Project, grant number 322082; the Hebei Natural Science Foundation, grant number D2022504009; and the Collaborative Innovation Center for sustainable utilization of water resources and optimization of industrial structure in Hebei Province, grant number XTZX202102.

Institutional Review Board Statement

Not applicable.

Informed Consent Statement

Not applicable.

Data Availability Statement

The data presented in this study are available on request from the corresponding author.

Conflicts of Interest

Author Shuai Yang, Yan Xie, Xinzhe Wang was employed by the company SINOPEC Research Institute of Safety Engineering Co., Ltd. The remaining authors declare that the research was conducted in the absence of any commercial or financial relationships that could be construed as a potential conflict of interest.

References

  1. Zhao, B.; Huang, F.; Zhang, C.; Huang, G.; Xue, Q.; Liu, F. Pollution characteristics of aromatic hydrocarbons in the groundwater of China. J. Contam. Hydrol. 2020, 233, 103676. [Google Scholar] [CrossRef] [PubMed]
  2. Wang, L.; Wu, W.-M.; Bolan, N.S.; Tsang, D.C.W.; Li, Y.; Qin, M.; Hou, D. Environmental fate, toxicity and risk management strategies of nanoplastics in the environment: Current status and future perspectives. J. Hazard. Mater. 2021, 401, 123415. [Google Scholar] [CrossRef] [PubMed]
  3. Busygina, T.; Rykova, V. Scientometric analysis and mapping of documentary array on the issue “Oil and petroleum products in soil and groundwater”. Environ. Sci. Pollut. Res. 2020, 27, 23490–23502. [Google Scholar] [CrossRef] [PubMed]
  4. Hu, S.; Xiao, C.; Liang, X.; Cao, Y.; Wang, X.; Li, M. The influence of oil shale in situ mining on groundwater environment: A water-rock interaction study. Chemosphere 2019, 228, 384–389. [Google Scholar] [CrossRef] [PubMed]
  5. Singh, S.; Gupta, V.K. Biodegradation and bioremediation of pollutants: Perspectives strategies and applications. Int. J. Pharmacol. Biol. Sci. 2016, 10, 53. [Google Scholar]
  6. Wu, Z.; Liu, G.; Ji, Y.; Li, P.; Yu, X.; Qiao, W.; Wang, B.; Shi, K.; Liu, W.; Liang, B.; et al. Electron acceptors determine the BTEX degradation capacity of anaerobic microbiota via regulating the microbial community. Environ. Res. 2022, 215, 114420. [Google Scholar] [CrossRef] [PubMed]
  7. Huang, H.; Jiang, Y.; Zhao, J.; Li, S.; Schulz, S.; Deng, L. BTEX biodegradation is linked to bacterial community assembly patterns in contaminated groundwater ecosystem. J. Hazard. Mater. 2021, 419, 126205. [Google Scholar] [CrossRef]
  8. Davidson, C.J.; Hannigan, J.H.; Bowen, S.E. Effects of inhaled combined Benzene, Toluene, Ethylbenzene, and Xylenes (BTEX): Toward an environmental exposure model. Environ. Toxicol. Pharmacol. 2021, 81, 103518. [Google Scholar] [CrossRef]
  9. Cheng, L.; Wei, W.; Guo, A.; Zhang, C.; Sha, K.; Wang, R.; Wang, K.; Cheng, S. Health risk assessment of hazardous VOCs and its associations with exposure duration and protection measures for coking industry workers. J. Clean. Prod. 2022, 379, 134919. [Google Scholar] [CrossRef]
  10. Alenezi, R.A. BTEX and nitrogen oxides fume assessments in fuel dispense stations and residential areas. J. Eng. Res. 2022, 10, 50–59. [Google Scholar] [CrossRef]
  11. Alenezi, R.A.; Aldaihan, N. Impact of fuel dispensing stations in the vicinity residential homes on the indoor and outdoor air quality. Int. J. Environ. Sci. Technol. 2019, 16, 2783–2796. [Google Scholar] [CrossRef]
  12. Péquin, B.; Cai, Q.; Lee, K.; Greer, C.W. Natural attenuation of oil in marine environments: A review. Mar. Pollut. Bull. 2022, 176, 113464. [Google Scholar] [CrossRef] [PubMed]
  13. Haider, F.U.; Ejaz, M.; Cheema, S.A.; Khan, M.I.; Zhao, B.; Liqun, C.; Salim, M.A.; Naveed, M.; Khan, N.; Nunez-Delgado, A. Phytotoxicity of petroleum hydrocarbons: Sources, impacts and remediation strategies. Environ. Res. 2021, 197, 111031. [Google Scholar] [CrossRef] [PubMed]
  14. Kharangate-Lad, A.; D’Souza, N.C. Current Approaches in Bioremediation of Toxic Contaminants by Application of Microbial Cells; Biosurfactants and Bioemulsifiers of Microbial Origin. In Rhizobiont in Bioremediation of Hazardous Waste; Springer: Singapore, 2021; pp. 217–263. [Google Scholar] [CrossRef]
  15. Zhang, M.; Guo, C.; Shi, C.; Ning, Z.; Chen, Z. A quantitative redox zonation model for developing natural attenuation-based remediation strategy in hydrocarbon-contaminated aquifers. J. Clean. Prod. 2021, 290, 125743. [Google Scholar] [CrossRef]
  16. Budania, R.; Dangayach, S. A comprehensive review on permeable reactive barrier for the remediation of groundwater contamination. J. Environ. Manag. 2023, 332, 117343. [Google Scholar] [CrossRef] [PubMed]
  17. Weelink, S.A.B.; van Eekert, M.H.A.; Stams, A.J.M. Degradation of BTEX by anaerobic bacteria: Physiology and application. Rev. Environ. Sci. Bio/Technol. 2010, 9, 359–385. [Google Scholar] [CrossRef]
  18. Dordević, D.; Jančíková, S.; Vítězová, M.; Kushkevych, I. Hydrogen sulfide toxicity in the gut environment: Meta-analysis of sulfate-reducing and lactic acid bacteria in inflammatory processes. J. Adv. Res. 2021, 27, 55–69. [Google Scholar] [CrossRef]
  19. Chen, X.; Sheng, Y.; Wang, G.; Guo, L.; Zhang, H.; Zhang, F.; Yang, T.; Huang, D.; Han, X.; Zhou, L. Microbial compositional and functional traits of BTEX and salinity co-contaminated shallow groundwater by produced water. Water Res. 2022, 215, 118277. [Google Scholar] [CrossRef]
  20. Sohrabi, T.; Shakiba, M.; Mirzaei, F.; Pourbabaee, A. BTEX biodegradation using Bacillus sp. in a synthetic hypoxic aquatic environment: Optimization by Taguchi-based design of experiments. Int. J. Environ. Sci. Technol. 2022, 19, 5571–5578. [Google Scholar] [CrossRef]
  21. Han, K.; Hong, U.; Park, S.; Kwon, S.; Kim, Y. In situ field method for evaluating biodegradation potential of BTEX by indigenous heterotrophic denitrifying microorganisms in a BTEX-contaminated fractured-rock aquifer. Environ. Technol. 2021, 42, 1326–1335. [Google Scholar] [CrossRef]
  22. Sra, K.S.; Ponsin, V.; Kolhatkar, R.; Hunkeler, D.; Thomson, N.R.; Madsen, E.L.; Buscheck, T. Sulfate Land Application Enhances Biodegradation in a Petroleum Hydrocarbon Smear Zone. Groundw. Monit. Remediat. 2023, 43, 44–59. [Google Scholar] [CrossRef]
  23. Zhu, H.H.; Chao, J.I.A.; Xu, Y.L.; Yu, Z.M.; Yu, W.J. Study on numerical simulation of organic pollutant transport in groundwater northwest of Laixi. J. Groundw. Sci. Eng. 2018, 6, 293–305. [Google Scholar] [CrossRef]
  24. Yang, L.-Z.; Liu, C.-H. Study on the characteristics and causes of carbon tetrachloride pollution of karst water in eastern suburbs of Jinan. J. Groundw. Sci. Eng. 2015, 3, 331–341. [Google Scholar] [CrossRef]
  25. Jiang, H.; Chen, D.; Zheng, D.; Xiao, Z. Anaerobic mineralization of toluene by enriched soil-free consortia with solid-phase humin as a terminal electron acceptor. Environ. Pollut. 2023, 317, 120794. [Google Scholar] [CrossRef] [PubMed]
  26. He, S.; Li, P.; Su, F.; Wang, D.; Ren, X. Identification and apportionment of shallow groundwater nitrate pollution in Weining Plain, northwest China, using hydrochemical indices, nitrate stable isotopes, and the new Bayesian stable isotope mixing model (MixSIAR). Environ. Pollut. 2022, 298, 118852. [Google Scholar] [CrossRef] [PubMed]
  27. Lahjouj, A.; Hmaidi, A.E.; Bouhafa, K. Spatial and statistical assessment of nitrate contamination in groundwater: Case of Sais Basin, Morocco. J. Groundw. Sci. Eng. 2020, 8, 143–157. [Google Scholar]
  28. Liang, C.; Li, C.; Zhu, Y.; Du, X.; Yao, C.; Ma, Y.; Zhao, J. Recent advances of photocatalytic degradation for BTEX: Materials, operation, and mechanism. Chem. Eng. J. 2023, 455, 140461. [Google Scholar] [CrossRef]
  29. Zainab, R.; Hasnain, M.; Ali, F.; Dias, D.A.; El-Keblawy, A.; Abideen, Z. Exploring the bioremediation capability of petroleum-contaminated soils for enhanced environmental sustainability and minimization of ecotoxicological concerns. Environ. Sci. Pollut. Res. 2023, 30, 104933–104957. [Google Scholar] [CrossRef]
  30. De Muynck, W.; De Belie, N.; Verstraete, W. Microbial carbonate precipitation in construction materials: A review. Ecol. Eng. 2010, 36, 118–136. [Google Scholar] [CrossRef]
  31. Fedorov, K.; Sun, X.; Boczkaj, G. Combination of hydrodynamic cavitation and SR-AOPs for simultaneous degradation of BTEX in water. Chem. Eng. J. 2021, 417, 128081. [Google Scholar] [CrossRef]
  32. Spence, M.J.; Bottrell, S.H.; Thornton, S.F.; Richnow, H.H.; Spence, K.H. Hydrochemical and isotopic effects associated with petroleum fuel biodegradation pathways in a chalk aquifer. J. Contam. Hydrol. 2005, 79, 67–88. [Google Scholar] [CrossRef] [PubMed]
  33. Ferguson, B.; Agrawal, V.; Sharma, S.; Hakala, J.A.; Xiong, W. Effects of Carbonate Minerals on Shale-Hydraulic Fracturing Fluid Interactions in the Marcellus Shale. Front. Earth Sci. 2021, 9, 695978. [Google Scholar] [CrossRef]
  34. Cai, P.; Ning, Z.H.; Zhang, N.; Zhang, M.; Guo, C.; Niu, M.; Shi, J. Insights into Biodegradation Related Metabolism in an Abnormally Low Dissolved Inorganic Carbon (DIC) Petroleum-Contaminated Aquifer by Metagenomics Analysis. Microorganisms 2019, 7, 412. [Google Scholar] [CrossRef] [PubMed]
  35. Laczi, K.; Erdeiné Kis, Á.; Szilágyi, Á.; Bounedjoum, N.; Bodor, A.; Vincze, G.E.; Kovács, T.; Rákhely, G.; Perei, K. New frontiers of anaerobic hydrocarbon biodegradation in the multi-omics era. Front. Microbiol. 2020, 11, 590049. [Google Scholar] [CrossRef] [PubMed]
  36. Yu, B.; Yuan, Z.; Yu, Z.; Xue-song, F. BTEX in the environment: An update on sources, fate, distribution, pretreatment, analysis, and removal techniques. Chem. Eng. J. 2022, 435, 134825. [Google Scholar] [CrossRef]
  37. Jiang, W.; Sheng, Y.; Wang, G.; Shi, Z.; Liu, F.; Zhang, J.; Chen, D. Cl, Br, B, Li, and noble gases isotopes to study the origin and evolution of deep groundwater in sedimentary basins: A review. Environ. Chem. Lett. 2022, 20, 1497–1528. [Google Scholar] [CrossRef]
  38. Min, Z. Mechanism and Simulation of Response on GroundwaterChemical Compositions to Hydrodynamic Conditions. Min. Sci. Technol. 2009, 19, 435–440. [Google Scholar]
  39. ISO 10304-1:2007/Cor 1:2010; Water Quality—Determination Of Dissolved Anions By Liquid Chromatography Of Ions—Part 1: Determination Of Bromide, Chloride, Fluoride, Nitrate, Nitrite, Phosphate And Sulfate. ISO Copyright Office: Geneva, Switzerland, 2010.
  40. Burland, S.M.; Edwards, E.A. Anaerobic benzene biodegradation linked to nitrate reduction. Appl. Environ. Microbiol. 1999, 65, 529–533. [Google Scholar] [CrossRef]
  41. Durand, S.; Guillier, M. Transcriptional and Post-transcriptional control of the nitrate respiration in bacteria. Front. Mol. Biosci. 2021, 8, 667758. [Google Scholar] [CrossRef]
  42. Song, T.; Zhang, X.; Li, J.; Wu, X.; Feng, H.; Dong, W. A review of research progress of heterotrophic nitrification and aerobic denitrification microorganisms (HNADMs). Sci. Total Environ. 2021, 801, 149319. [Google Scholar] [CrossRef]
  43. Mitchell, M.J.; Jensen, O.E.; Cliffe, K.A.; Maroto-Valer, M.M. A model of carbon dioxide dissolution and mineral carbonation kinetics. Proc. R. Soc. A Math. Phys. Eng. Sci. 2009, 466, 1265–1290. [Google Scholar] [CrossRef]
  44. Cordova, C.E. Plows, Plagues, and Petroleum: How Humans Took Control of Climate. Holocene 2010, 20, 653. [Google Scholar] [CrossRef]
  45. Niu, J.; Liu, Q.; Lv, J.; Peng, B. Review on microbial enhanced oil recovery: Mechanisms, modeling and field trials. J. Pet. Sci. Eng. 2020, 192, 107350. [Google Scholar] [CrossRef]
  46. Peña-Calva, A.; Olmos-Dichara, A.; Viniegra-González, G.; Cuervo-López, F.M.; Gómez, J. Denitrification in presence of benzene, toluene, and m-xylene. Appl. Biochem. Biotechnol. 2004, 119, 195–208. [Google Scholar] [CrossRef] [PubMed]
  47. Ahmed, S.; Kumari, K.; Singh, D. Different strategies and bio-removal mechanisms of petroleum hydrocarbons from contaminated sites. Arab. Gulf J. Sci. Res. 2023. ahead of print. [Google Scholar] [CrossRef]
  48. Muccee, F.; Ejaz, S.; Riaz, N. Toluene degradation via a unique metabolic route in indigenous bacterial species. Arch. Microbiol. 2019, 201, 1369–1383. [Google Scholar] [CrossRef] [PubMed]
  49. Tsui, T.-H.; van Loosdrecht, M.C.; Dai, Y.; Tong, Y.W. Machine learning and circular bioeconomy: Building new resource efficiency from diverse waste streams. Bioresour. Technol. 2022, 369, 128445. [Google Scholar] [CrossRef]
  50. Tsui, T.-H.; Zhang, L.; Zhang, J.; Dai, Y.; Tong, Y.W. Engineering interface between bioenergy recovery and biogas desulfurization: Sustainability interplays of biochar application. Renew. Sustain. Energy Rev. 2022, 157, 112053. [Google Scholar] [CrossRef]
  51. Cao, S.; Du, R.; Zhou, Y. Coupling anammox with heterotrophic denitrification for enhanced nitrogen removal: A review. Crit. Rev. Environ. Sci. Technol. 2021, 51, 2260–2293. [Google Scholar] [CrossRef]
  52. Rassamee, V.; Sattayatewa, C.; Pagilla, K.; Chandran, K. Effect of oxic and anoxic conditions on nitrous oxide emissions from nitrification and denitrification processes. Biotechnol. Bioeng. 2011, 108, 2036–2045. [Google Scholar] [CrossRef]
Figure 1. Mechanism modeling of the model.
Applsci 13 11867 g001
Figure 2. Variations in ion concentrations with the proportion of nitrate consumed by the complete reduction of nitrogen to the total amount consumed. (a) Variation in H+ with toluene concentration; (b) variation in HCO3 with toluene concentration; (c) variation in Ca2+ with toluene concentration.
Applsci 13 11867 g002
Figure 3. Variation in ion concentration with the proportion of toluene consumed by microbial growth to the total toluene content. (a) Variation in H+ with toluene concentration; (b) variation in HCO3 with toluene concentration; (c) variation in Ca2+ with toluene concentration.
Applsci 13 11867 g003
Figure 4. Variation in ion concentration with temperature. (a) Variation in H+ with toluene concentration; (b) variation in HCO3 with toluene concentration; (c) variation in Ca2+ with toluene concentration.
Applsci 13 11867 g004
Figure 5. Variation in ion concentration with the milligram equivalent of other ions. (a) Variation in H+ with toluene concentration; (b) variation in HCO3 with toluene concentration; (c) variation in Ca2+ with toluene concentration.
Applsci 13 11867 g005
Figure 6. Variations in toluene, nitrate, and nitrite concentrations with toluene degradation. Values represent mean values and the ± range from three independent samples.
Applsci 13 11867 g006
Figure 7. Ca2+ vs. HCO3 production for experiments in which calcite was the solid phase.
Applsci 13 11867 g007
Figure 8. Actual toluene consumption versus theoretical consumption.
Applsci 13 11867 g008
Figure 9. The fitting diagram of experimental data and model data. (a) The fitting diagram of Ca2+; (b) the fitting diagram of HCO3.
Applsci 13 11867 g009
Table 1. The components of the vitamin solution.
CompoundsConcentration (mg/L)
Biotin2.00
Folic acid2.00
Riboflavin5.00
Nicotinic acid5.00
p-Aminobenzoic acid5.00
Thioctic acid5.00
Calcium D-(+)-pantothenate5.00
Pyridoxine hydrochloride10.00
Table 2. The components of the mineral solution.
CompoundsConcentration (g/L)
FeSO4 4H2O1.80
CoCl2 6H2O0.25
CuCl2 2H2O0.01
NiCl 6H2O0.01
ZnCl20.10
H3BO30.50
EDTA2.50
MnCl2 4H2O0.70
(NH4)6Mo7O24 4H2O0.01
Disclaimer/Publisher’s Note: The statements, opinions and data contained in all publications are solely those of the individual author(s) and contributor(s) and not of MDPI and/or the editor(s). MDPI and/or the editor(s) disclaim responsibility for any injury to people or property resulting from any ideas, methods, instructions or products referred to in the content.

