Article

Biomonitoring of Potentially Toxic Elements in an Abandoned Mining Region Using Taraxacum officinale: A Case Study on the “Tsar Asen” Mine in Bulgaria

by
Veronika Mihaylova
1,
Galina Yotova
1,
Kristina Marinova
1,
Aleksey Benderev
2,
Valentina Lyubomirova
1 and
Stefan Tsakovski
1,*
1
Faculty of Chemistry and Pharmacy, Sofia University “St. Kliment Ohridski”, 1 J. Bourchier Blvd., 1164 Sofia, Bulgaria
2
Geological Institute, Bulgarian Academy of Sciences, Acad. G. Bonchev Str., Bl. 24, 1113 Sofia, Bulgaria
*
Author to whom correspondence should be addressed.
Appl. Sci. 2023, 13(21), 11860; https://doi.org/10.3390/app132111860
Submission received: 15 September 2023 / Revised: 20 October 2023 / Accepted: 27 October 2023 / Published: 30 October 2023
(This article belongs to the Special Issue Validation and Measurement in Analytical Chemistry: Practical Aspects)

Abstract

:
Mining is a significant industrial and economic activity, but it can also result in ore waste that contains several potentially toxic elements (PTEs). Furthermore, the wide range of observed transfer and accumulation factors suggests that not only the soil element concentrations but also the soil characteristics are important for uptake, which is recognized as a serious problem with potential impacts on human health and ecosystems. The aim of this study was to perform a pollution risk assessment of a region near an abandoned mine using suitable biomonitoring followed by multivariate statistical treatment of the obtained results. The content of PTEs in the soil and plant samples was determined to exceed the background concentrations typical for Bulgaria. The observed concentrations of copper in this study’s soil samples exceeded 2 to 16 times the maximum permissible values. The Taraxacum officinale concentrations for PTEs, particularly for Cd (5.13 mg/kg), were higher than the background levels. The obtained results for PTEs show significant TFs for Cd and Sn, while the AFs outline a significant accumulation of Cd and Sb. The applied multivariate statistical approaches revealed differences between the sampling locations and relationships between the elemental transfer/accumulation factors and soil cation exchange capacity. The outcomes from the statistical analysis confirm that the usage of both element factors and soil properties in biomonitoring studies are essential for reliable risk assessment.

1. Introduction

Nowadays, environmental pollution remains a global problem and a focus of scientific research efforts. Potentially toxic elements (PTEs) such as As, Cd, Co, Cr, Cu, Fe, Mn, Ni, Sb, Sn, Zn, etc., otherwise known as heavy metals, are metallic chemicals with densities greater than water. These metals are extremely harmful to humans [1]. The concentration of PTEs on the soil surface resulting from the chemical composition of the parent rock and anthropogenic activity as well as the various properties of the soil including sorption and buffer capacity represent a major threat to the environment [2]. Mining activity is of great industrial and economic importance but can produce a significant amount of metal ore waste rich in PTEs. The mining of metal ores as well as their processing belong to human activities that have a strong negative impact on the environment. They usually release PTEs such as heavy metals and metalloids into the environment. The problem of soil contamination at such sites is related to abandoned historic mines and currently operating facilities. Although modern metallurgy generally uses advanced technologies that can significantly reduce the pollutants released into the environment, potentially toxic metals and metalloids that have accumulated in soils for decades can still pose a significant risk to human health and ecosystems. Assessing the soil quality in areas close to active or non-functioning mining and smelter facilities is essential in this context. There are many scientific publications related to the determination of PTEs in areas with mining activity [3,4,5]. The scientific interest in the field is related to chronic exposure to potentially toxic metals that can be fatal to humans. Potentially toxic metals such as Co, Fe, Ni, and Pb can cause damage to the central nervous system and kidneys and are potential causes of cancer diseases [6,7]. Usually, the determination of the total concentration is insufficient to predict the bioavailability of the chemical elements. For this reason, new techniques such as studying bioaccessibility and bioavailability have been proposed to evaluate the human exposure to PTEs [8,9].
Numerous studies have shown that the bioavailability and soil-to-plant transfer of chemical elements depend not only on their total element concentration, but also on the pH, cation exchange capacity (CEC), soil type, organic matter, and element species [10,11,12,13]. The transfer of chemical elements from polluted soils to plants and their potential impact on human health have been investigated in several studies [14,15,16]. The bioavailability of PTEs from the soil in the edible parts of green leafy plants such as coriander (Coriandrum sativum), parsley (Petroselinum crispum), arugula (Eruca vesicaria), and fennel (Anethum graveolens) [17] and in garden edible vegetables such as beans, carrots, and lettuce [18] has been investigated. Once introduced in the food chain, metals tend to accumulate in various organs over a long period of time. Thus, a deficiency and excess of essential micronutrients (e.g., Cu, Fe, Ni, Zn) can lead to undesirable effects. Serious adverse effects on human health occur due to increased concentrations of toxic metals and their interactions with essential trace elements [19,20].
The “Tsar Asen” mine is located near the town of Pazardzhik, in an area known for its copper deposits. This mine is part of the Radka ore field, together with the Radka and Chervena Mogila ore deposits. The spatial position of copper porphyry ores that have been established in the “Tsar Asen” deposit is controlled by Late Cretaceous hypoabyssal to subvolcanic-hypoabyssal porphyry intrusives or dyke bundles. According to its characteristics, in the copper porphyry deposits in the “Tsar Asen” region, apart from the apical parts of the minor porphyry intrusives, the mineralization is localized to a large extent in the surrounding effusive rocks and volcanic necks [21]. The operation of the mine began in 1979, and for 20 years, copper ore has been mined by the open pit method. Despite the real danger of contamination of the area around the mine, no data on the determination of PTEs can be found in the literature.
Dandelion (Taraxacum officinale) is a common plant species often chosen as a possible chemical pollution biomonitor because it is widely distributed, easy to identify, and inexpensive to sample. This plant is a medical herb and a standardized biomonitoring species for assessing environmental pollution with heavy metals and toxic elements. Several studies have investigated the chemical composition and reactions of Taraxacum officinale to changes in environmental conditions [22,23,24,25,26,27,28,29,30]. Dandelion has been shown to respond quantitatively to air and soil pollution with As, Br, Cd, Cu, Fe, Hg, Mn, Ni, Pb, Pt, Pd, Rh, Zn, and other chemical elements. Pollution response is not always linear [27], which is explained by more complex interactions. Dandelion can survive in polluted areas thanks to its high phenolic content, which effectively suppresses oxidative stress caused by the high content of risk elements in soils [31]. It has been shown that the content of flavonoids and other antioxidants increased, while the chlorophyll content decreased under stress conditions [32]. The increase in the rate of lipid peroxidation with an increasing content of risk elements has also identified Taraxacum officinale as a suitable plant species for the bioindication of risk element-contaminated areas [33]. Moreover, in response to long-term exposure to a risk element, a reduction in genetic diversity among Taraxacum officinale populations [27] and genotoxicity symptoms [34] has been observed. Indeed, Taraxacum officinale clones taken from uncontaminated sites have a much lower survival than clones from contaminated sites when both have been grown in contaminated environments, demonstrating a clonal difference in tolerance to risk elements [35]. When grown in contaminated media, dandelion clones from contaminated sites accumulated a mean of 4.2 times higher total Cu and Zn and 17.8 times higher total Pb in their tissues than dandelion clones taken from samples from uncontaminated sites [36].
The aim of this study was to perform the biomonitoring of PTEs in an abandoned mining region using a proper biomonitor, namely Taraxacum officinale. The obtained elemental transfer and accumulation factor coefficients will be treated by the means of multivariate statistics in order to reveal the essential soil characteristics for the soil-to-plant and accumulation transfer of PTEs.

2. Materials and Methods

2.1. Reagents

Concentrated acids HNO3 (67–69%, Fisher Chemicals, Ultra TraceMetal Grade, Loughborough, UK), HF (47–51%, Fisher Chemicals, Ultra Trace Metal Grade, Loughborough, UK), HCl (37% Fisher Chemicals, Ultra TraceMetal Grade, Loughborough, UK), and H2O2 (30% Fisher Chemicals, Ultra Trace Analysis Grade, Loughborough, UK) were used in the analysis. Double deionized water (Millipore purification system Synergy, Molsheim, France) was used to prepare all solutions. Working standard solutions were prepared from ICP-MS multi-element calibration standard solution IMS-102 (Ultra Scientific, Agilent, Santa Clara, CA, USA) containing 29 analytes (Ag, Al, As, Ba, Be, Bi, Ca, Cd, Co, Cr, Cs, Cu, Ga, In, Fe, K, Li, Mg, Mn, Na, Ni, Pb, Rb, Se, Sr, Tl, U, V, Zn) with an initial concentration of 10 mg/L, to which single element standards of macroelements Na, K, Mg, Ca, P, Ti, Mn, and Fe and microelements La, Mo, Sb, Sn, and Th (all produced by Fluka (Fluka, Steinheim, Switzerland)) with an initial concentration of 1000 mg/L were added after appropriate dilution to maximize the resemblance of the matrix.

2.2. Sampling of Plant and Soil Samples

Twenty-nine plant and soil samples were collected from the region of the “Tsar Asen” copper mine in September 2022, according to the sampling strategy (Figure 1).
Using a plastic spatula, soil samples were taken from 20 cm of the topsoil, where pollutants from anthropogenic activity were retained. Immediately after sampling, the soil samples were collected in paper bags impermeable to moisture and dust and transported to a laboratory.
Plant samples were collected from developed leaves by cutting them with plastic scissors 1 cm above the ground. Immediately after sampling, plant samples were collected in paper bags impermeable to moisture and dust and transported to a laboratory.

2.3. Determination of pH and Cation Exchange Capacity (CEC)

Soil pH was determined according to ISO 10390:2021 [37] and the CEC according to ISO 23470:2018 [38].

2.4. Sample Preparation

The pretreatment and the microwave acid digestion of the samples were performed according to the EPA, ISO methods, and previously published methods [39,40]. The sample preparation was performed as described in Mihaylova et al. (2013) [39] for the plant leaves and in Lyubomirova et al. (2015) [40] for the soil samples. The acid digestion of the soil and plant samples was carried out in a microwave reaction system (Anton Paar, Multiwave 3000, Graz, Austria). Supra pure chemicals and double deionized water were used throughout the analytical procedure. The plant samples were prepared as follows: 0.5 g of the plant samples (six parallels of each sample) were mixed with 8 mL HNO3 and 4 mL H2O2 into PTFE vessels, and microwave digestion was performed for 20 min in four steps of 5 min with the following power: 400, 600, 300, and 0 W (vent, Tmax = 180 °C). For CRM DC 73348 and CRM DC 73349 (trace elements in bush branches and leaves, China National Analysis Center, Beijing, China) - 24 h, soaking in 8 mL HNO3 was necessary before MW digestion to facilitate the dissolution. Afterward, the solutions were transferred into Teflon vessels and evaporated to about 1 mL on a heating plate. The residues were dissolved in 3% HNO3. Finally, the solutions were quantitatively transferred in polypropylene tubes and diluted to 50 mL with double deionized water.
The soil sample preparation was conducted according to the US-EPA 3051a procedure [41]. The microwave aqua regia digestion was performed with 0.5 g of the soil sample to which the acid mixture consisting of 9 mL HNO3 and 3 mL HCl was added. After microwave digestion, the supernatant was decanted and diluted to 50 mL with double deionized water. Before ICP-MS analysis, 1 mL of the samples was taken and diluted to 10 mL with double deionized water.

2.5. Analytical Procedure for PTEs Determination

The analysis of the samples was carried out using a Perkin Elmer SCIEX Elan DRC-e ICP-MS (MDS Inc., Concord, ON, Canada) system. The instrumental parameters and isotopes used for the analysis are presented in Table 1.
The determination of the macroelements (Al, Ca, Fe, Na, Mg, Mn, K, P, and Ti) in mg/kg and wt.% concentrations was conducted after the optimization and introduction of a dynamic bandpass tuning parameter (RPa) for the signal reduction of the isotopes used, as described in Lyubomirova et al. (2020) [42]. The selected individual RPa values are presented in brackets. The concentrations of the micro- and trace elements were determined in standard conditions, except for As and Se. For the correction of the spectral interferences, correction equations were introduced and are listed in Mihaylova et al. (2013) [39]. The potential polyatomic interferences of the selenium isotopes and 75As were eliminated using a dynamic bandpass tuning parameter (RPq) with oxygen as a reaction gas, as described in Lyubomirova and Djingova (2015) [43].
External calibration with multielement standard solutions was performed. In order to resemble the analyzed matrices as much as possible, matrix elements were added to the calibration standards. The calibration standards were in the concentration range of 0.1–10 mg/L for Na, Mg, Al, K, Ca, and Fe; in the range of 0.1–1 mg/L for P, Ti, and Mn; in the range of 0.001–100 µg/L for the microelements and trace elements.
The accuracy of the ICP-MS measurements was checked by analysis of the plant, soil, and sediment reference materials: CRM DC 73348 and CRM DC 73349 (trace elements in bush branches and leaves, China National Analysis Center, Beijing, China), SRM NIST 1547 (peach leaves, National Institute of Standards and Technology, Gaithersburg, WA, USA), IAEA-Soil-5 and IAEA-Soil-7 (trace elements in soil, IAEA, Seibersdorf, Austria), and STSD-3 and STSD-4 (stream sediments, Canada Center for Mineral and Energy Technology, Geological Survey of Canada, ON, Canada).

2.6. Analytical Characteristics of the Method

To assess the accuracy and precision of the analysis, certified plant, soil, and sediment reference materials were used. Since certified values after aqua regia digestion are available only in STSD-3 and STSD-4 for a limited number of elements, total digestion was performed. The complete digestion of the soil/sediment reference materials requires the addition of hydrofluoric acid to dissolve the silica skeleton of the matrix [44]. Table S1 presents the results from the analysis of some of the plant, soil, and sediment reference materials. The mean experimental values (average of six measurements, characterized by the respective standard deviations) were calculated for each element and compared with certified or information values. For the elements for which certified values were not available, the literature values are presented. The comparison of the results showed a good agreement between the experimental and certified or published values [39,45,46,47]. The result’s precision was determined by three independent replicates (each six measurements) within two months. The precision for all 31 elements in the analyzed CRMs was around or below 10%. To assess the instrument drift, a recalibration was performed after every tenth sample. To eliminate a memory effect, a washing step of 60 s with 3% HNO3 was applied, followed by the measurement of a blank sample. Cleaning of the sampler and the skimmer cones was performed before each analysis. The instrumentally determined detection limits (3σ, three times the standard deviation of ten repeated measurements of a blank) are also presented and were below 1 ng/mL, except for the macroelements K, Na, Fe, and Ti, being between 1 and 2 ng/mL.

2.7. Multivariate Data Analysis

Principal component analysis (PCA) is a commonly utilized unsupervised statistical method employed for the multivariate analysis of environmental monitoring data [48,49]. The primary function of PCA is to diminish the complexity of the input data matrix (transfer or accumulate factors of elements in this study) by generating a limited set of new variables termed principal components (PCs) or latent factors. PCs emerge as linear combinations of the initial variables (transfer or accumulate factors of elements in this study). The original autoscaled data matrix is deconstructed into two constituent matrices: the factor loadings matrix, which depicts the contribution of each original variable to the newly formed principal components, and the factor score matrix, which furnishes the updated coordinates of each object (sampling point) within the novel principal component space.
Partial least squares-discriminant analysis (PLS-DA), conversely, is not a widely adopted supervised technique in the realm of environmental assessment studies [50,51]. PLS-DA represents a specific variant of partial least square modeling that encompasses the construction of PLS components followed by discriminant analysis within the extracted PLS component space. In this study, the differentiation of distinct sample categories (sand and clay groups) was accomplished through the utilization of the PLS1 algorithm. This algorithm as employed to model the associations between an independent block of variables (i.e., element concentrations in soil samples) and a dependent categorical dummy variable denoting the membership of each sample in either the sand or clay class. The PLS-DA generates various statistics pertaining to the independent variables (element soil concentrations) and the performance of the model. The variable importance on projection (VIP) serves as a metric for gauging the significance of the independent variables in the predictive model. Variables with VIP scores exceeding 1 hold substantial discriminatory power in the classification model. The obtained regression vectors portray the concentration profiles of known sample classes, while the area under the curve (AUC) stands out as the primary parameter for evaluating the predictive models. An AUC of 1 signifies a flawless predictive model.
All multivariate analysis calculations were performed under MATLAB R2023b using PLS Toolbox 9.2.1 (Eigenvector Research Inc., Manson, WA, USA).

3. Results

3.1. Determination of pH and Cation Exchange Capacity of Soil Samples

The behavior of chemical elements in the soil and their bioavailability largely depends on the soil’s physicochemical characteristics. The ability to adsorb ions is essential for the behavior of chemical elements and their bonding. Soil acidity affects both the solubility of the pollutants and their chemical form. Therefore, determining the pH in water and 1 M KCl is an important soil characteristic. CEC is a quantitative measure of the soil’s ability to adsorb ions and is a characteristic constant for each soil type. Table 2 presents the pH values and CEC of the analyzed soil samples.
The pH determined in the soil samples ranged from 5.95 to 7.61. Despite the limited area of the mine, the sampled CEC ranged from 7.1 to 28.1 meq, which means that the investigated region includes different soil types, from sandy to heavy clay ones.

3.2. Total Element Concentration of Soil and Plant Samples

Table 3 includes the summarized basic statistics of the investigated plant and soil samples represented by the mean value, median, minimum, and maximum concentration of the analyzed elements.
As expected, the concentration of chemical elements in soils was higher than in plants. The exceptions were only a few essential elements such as Ca, K, and P, which accumulate in plants in order to ensure the normal functioning of their life processes. In the soil samples, Cd, Cu, Pb, and Zn were found in concentrations above or close to the maximum permissible limit of 2.5 mg/kg, 80 mg/kg, 130 mg/kg, and 390 mg/kg, respectively [52]. At the same time, Cd, Co, Cr, Cu, Fe, Mn, Sb, Sn, and Zn were found in the dandelion samples in concentrations higher than the referent ones for Bulgaria.

3.3. Partial Least Squares Discriminant Analysis

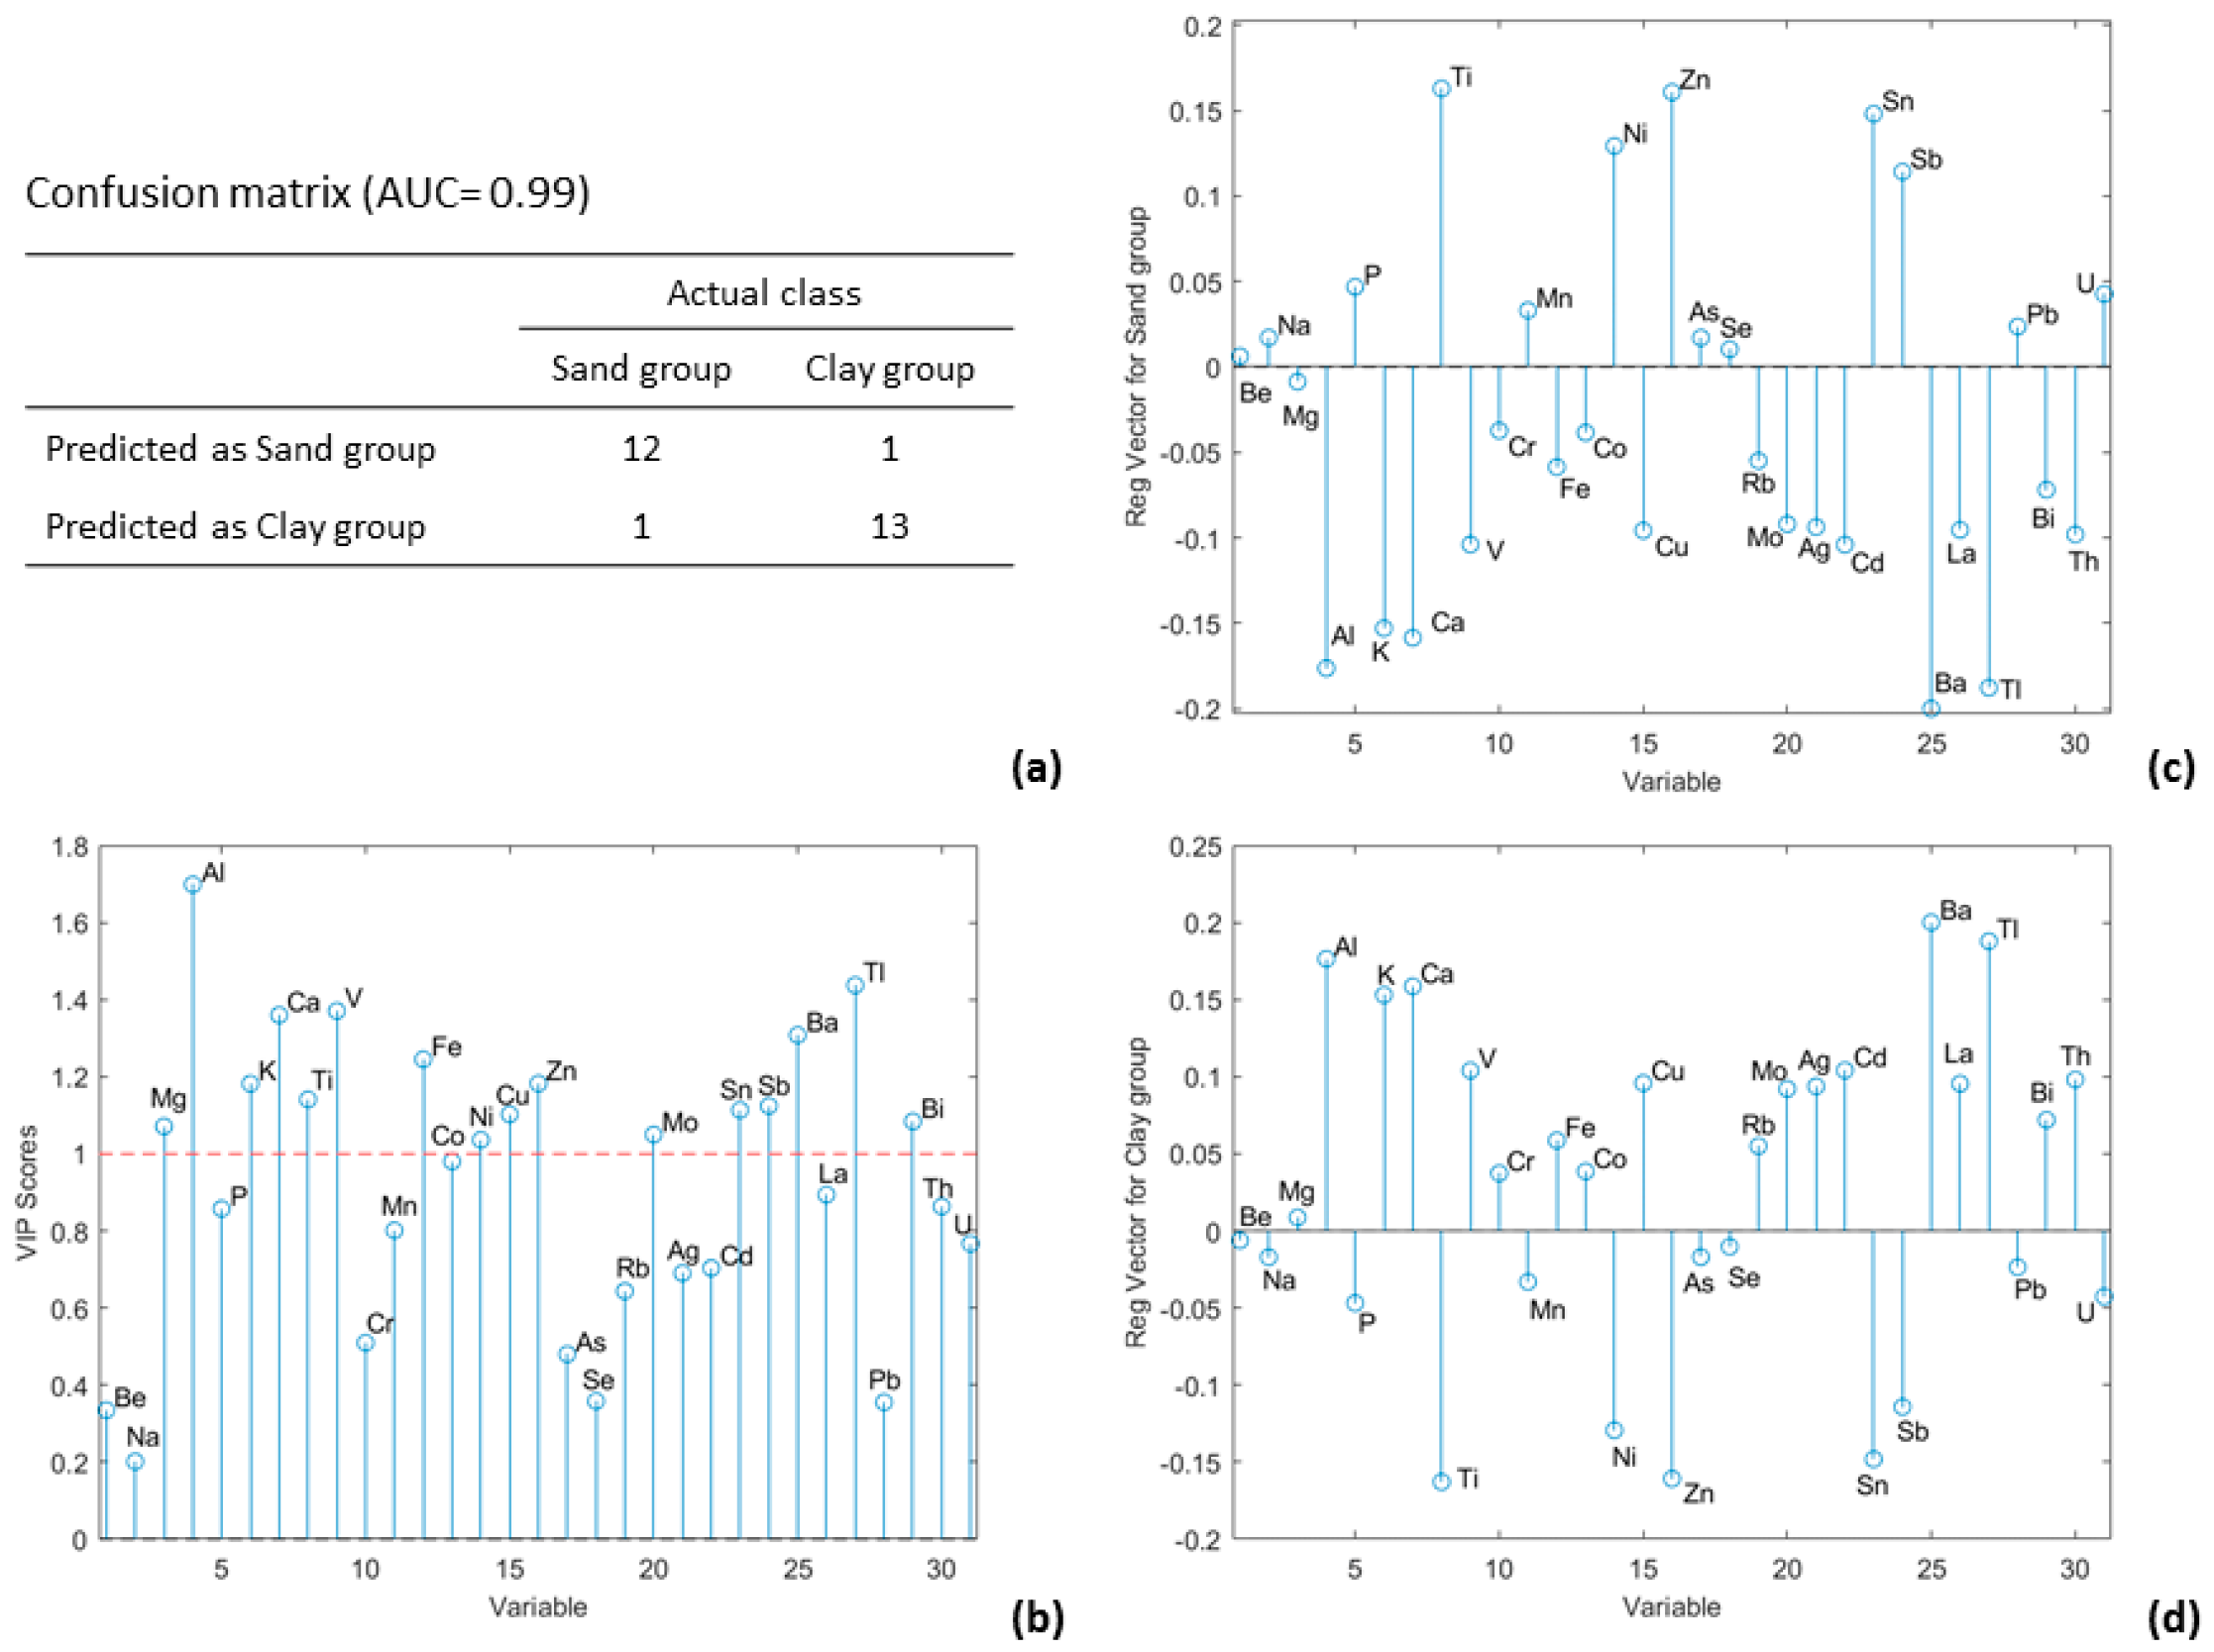
In order to investigate the element profile of samples from different soil types, PLS-DA as an effective feature selection and classifier was applied. The sampling points were divided into two groups: sandy (CEC < 15 meq) and clay (CEC > 15 meq). The obtained classification model had very good performance (Figure 2a) and outlines the elements (VIP > 1) with significant discriminative power (Figure 2b). The regression vectors of both groups (Figure 2c,d) present the element profiles of each group.

3.4. Soil-to-Plant Transfer Factor (TF) of the Elements

The influence of the total element concentrations in the soils on their plant transfer was assessed using element transfer factors (TFs). The TF was determined using Equation (1) [53].
T F = C p l a n t C s o i l
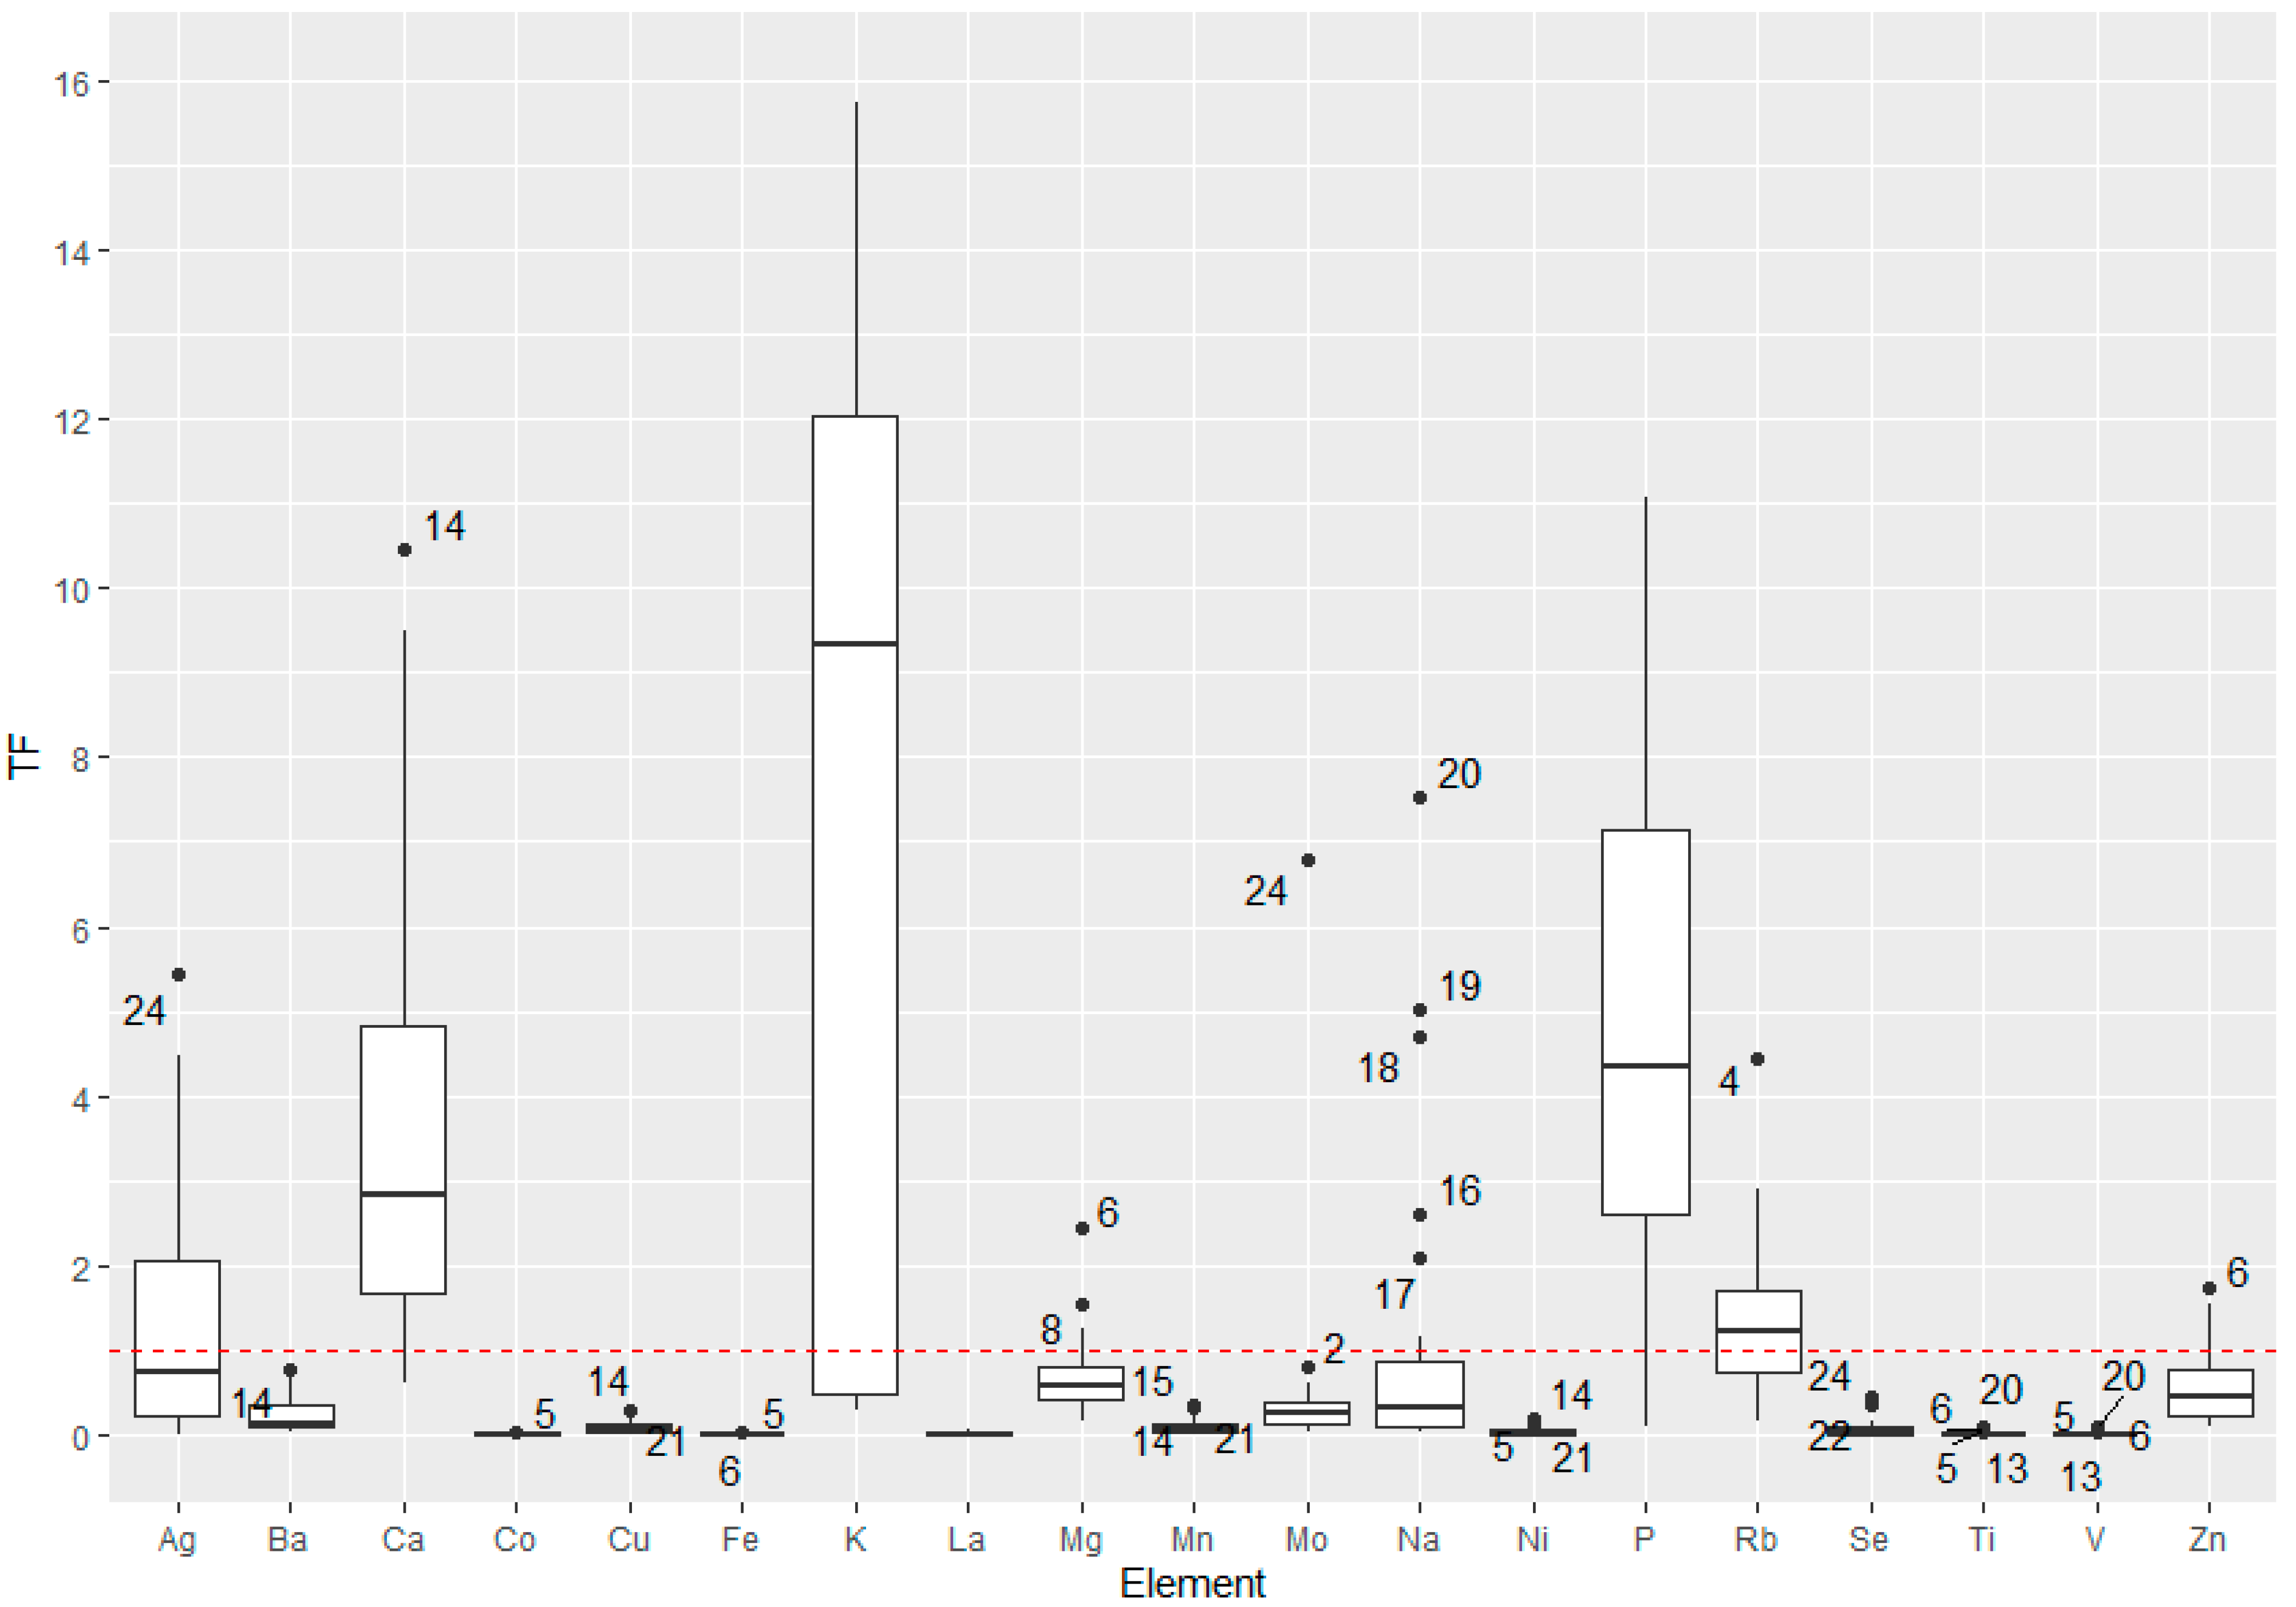
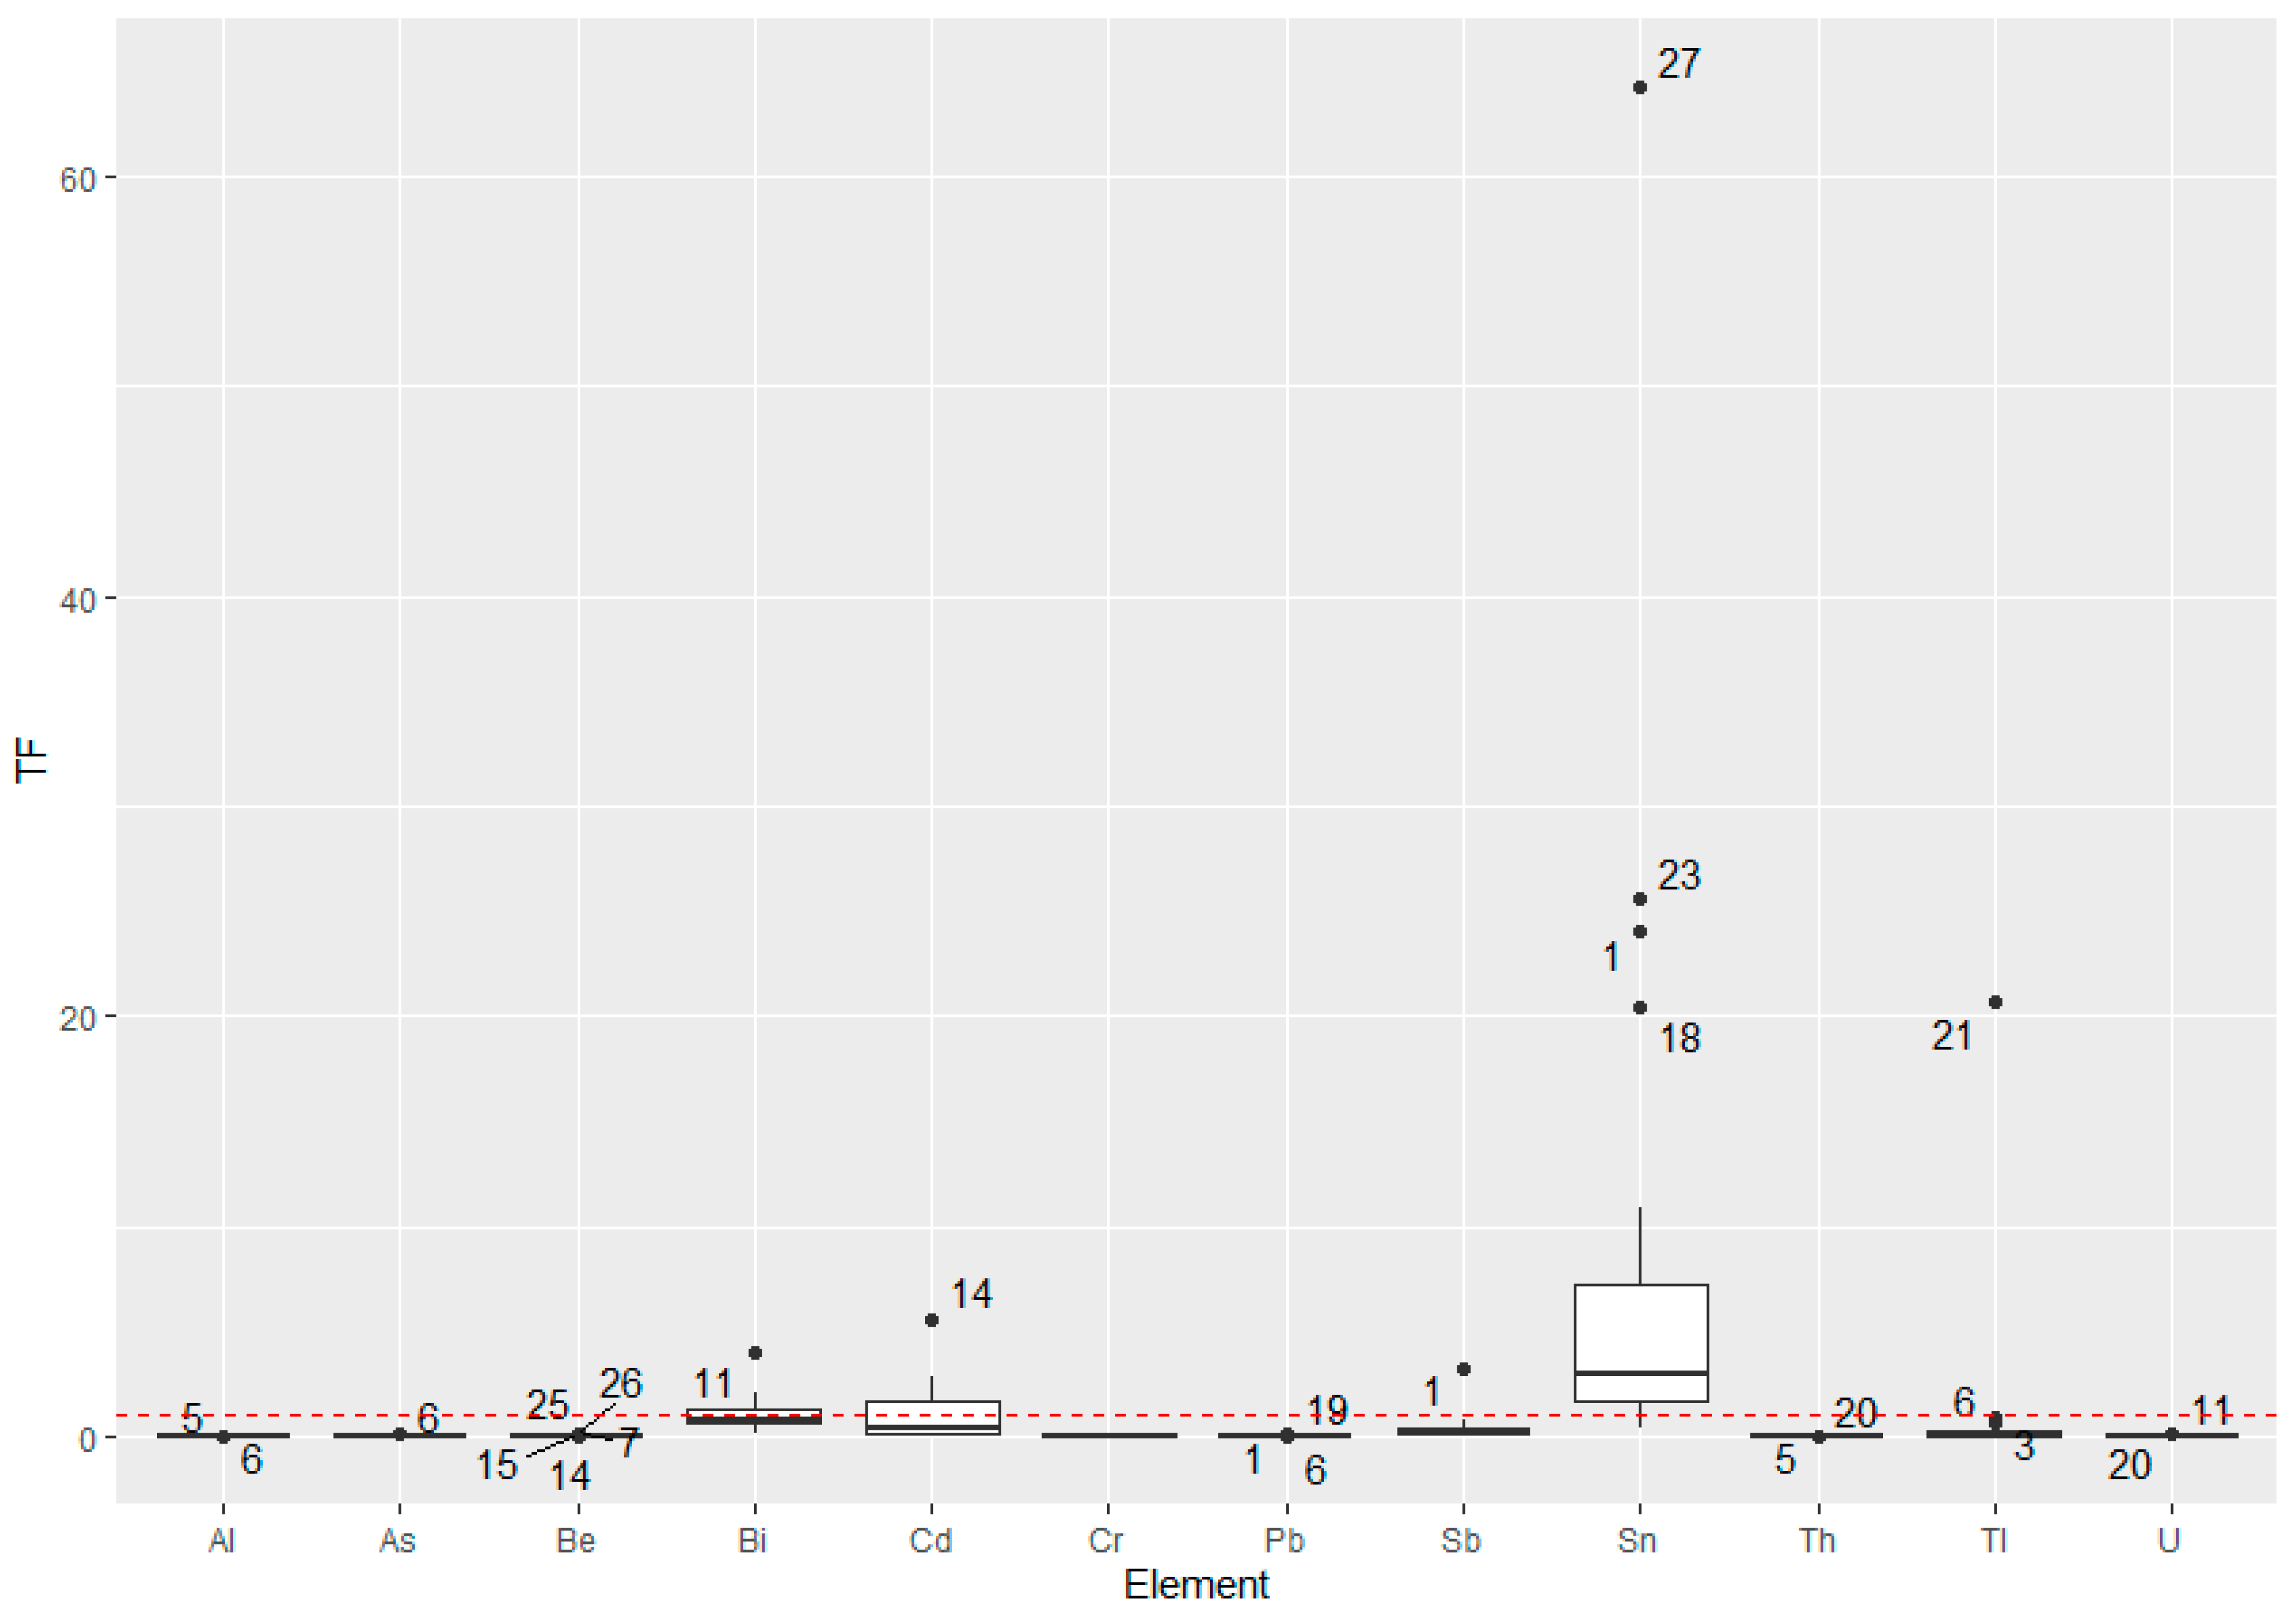
The calculated TFs in the soil–plant system are presented graphically, and the analyzed elements were divided into two groups. The first group contains macro- and microelements, most of which have an essential function for the plant (Figure 3), and the second group contains potentially toxic elements (Figure 4).
As mentioned, the TFs indicate the passage of the given chemical element from the soil to the plant. Significant TFs are considered those greater than 1. TFs higher than one are considered normal for essential elements since they are at the core of all life cycles in a plant. As evident from Figure 4, the TFs of potentially toxic elements such as Sn and Cd were higher than 1, which should be considered in the risk assessment.
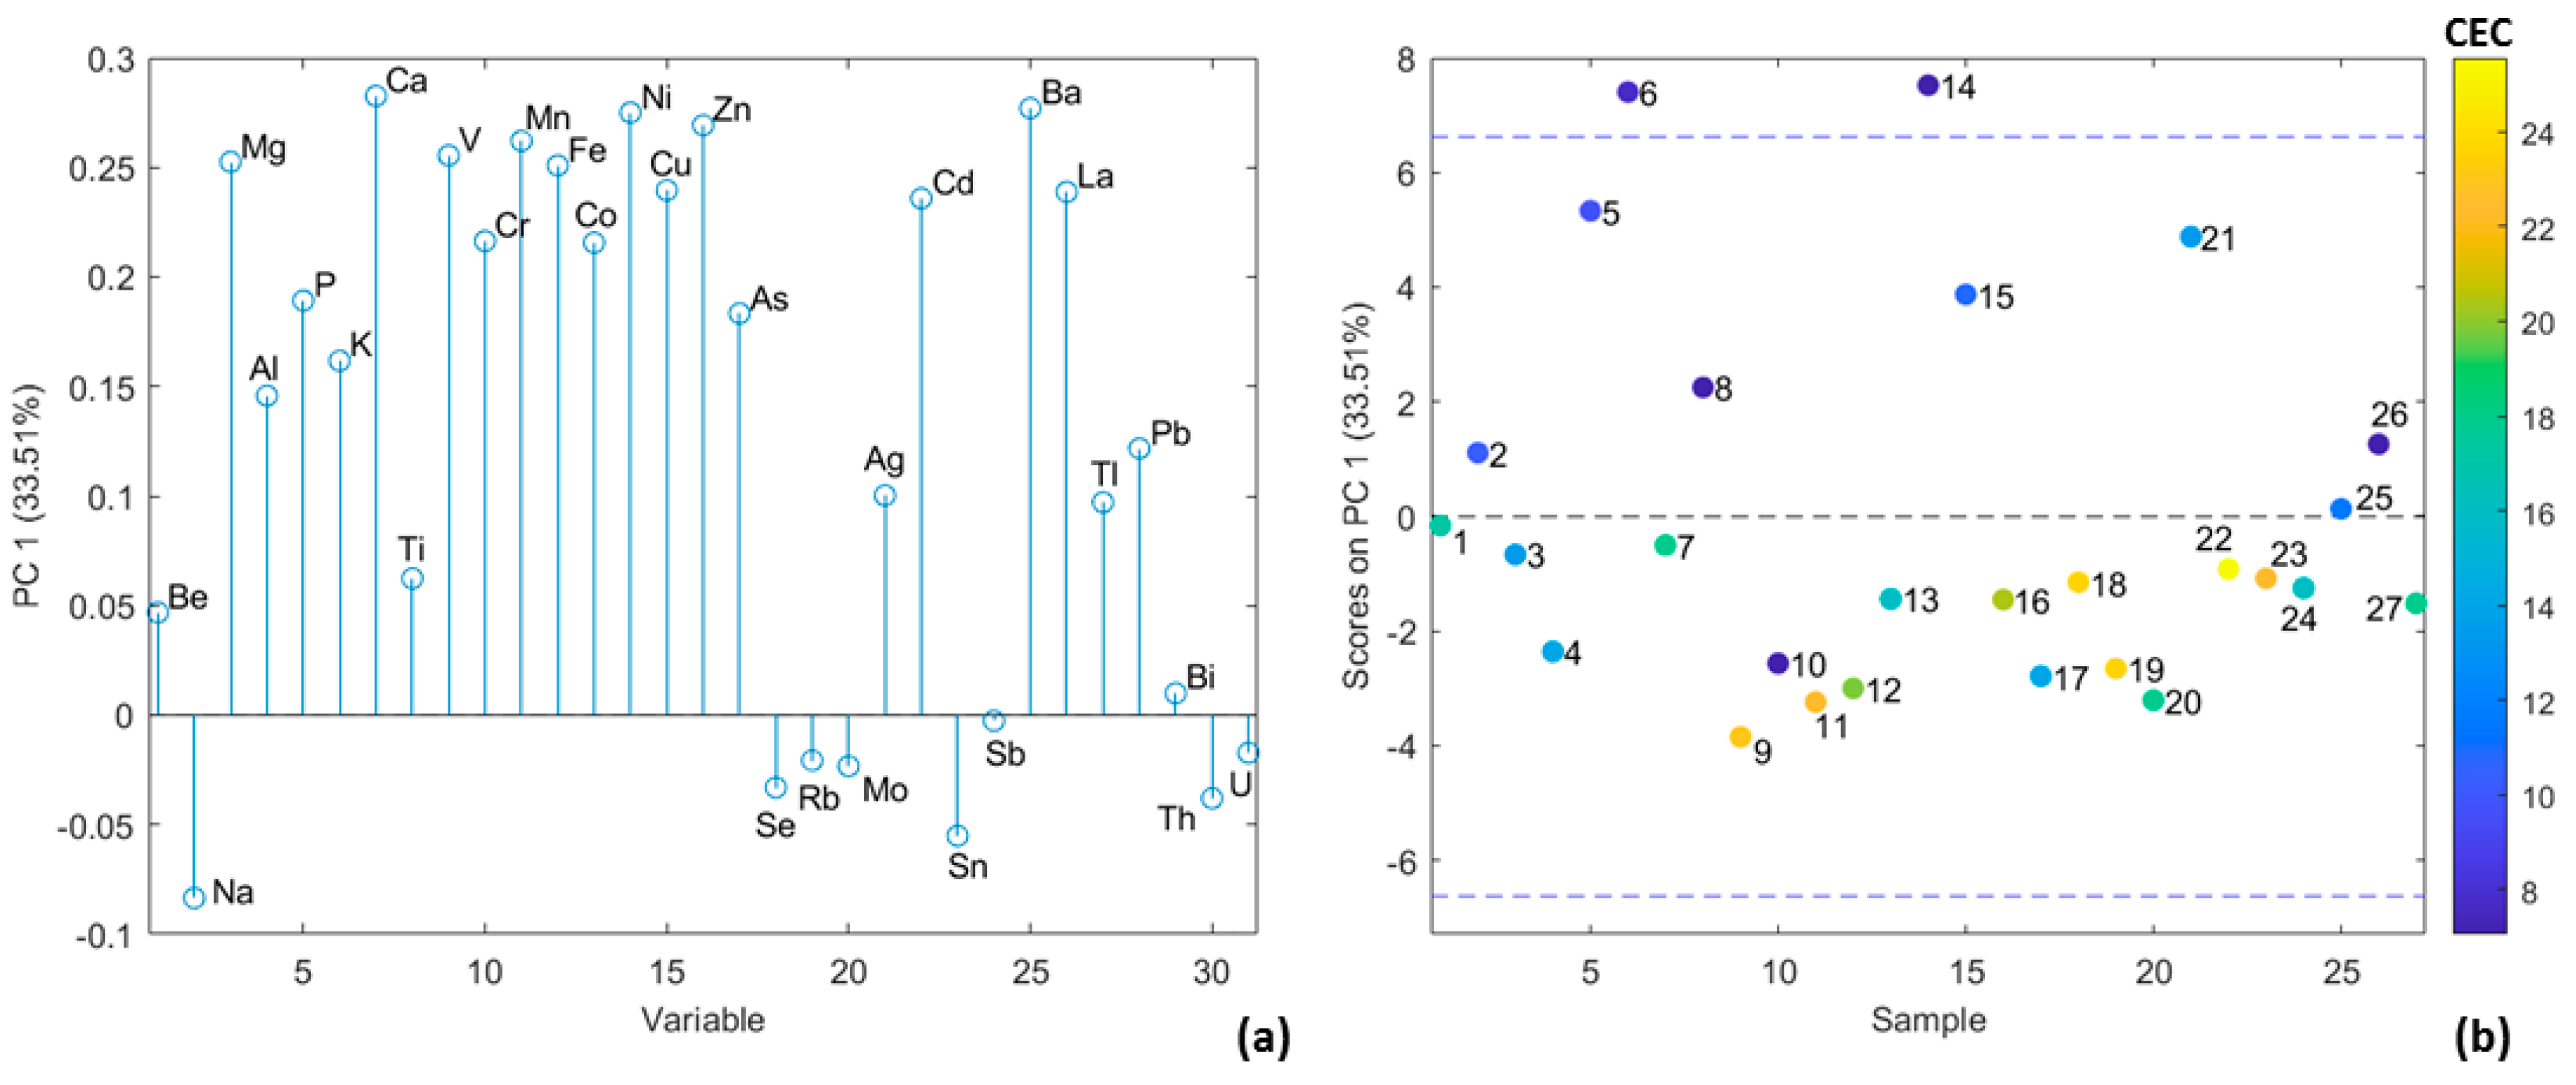
The factor loadings and factor scores obtained by the PCA of the TFs dataset revealed interesting relationships between the element soil-to plant-transfer factors and the type of sampling points (Figure 5). The big group of elements with PC1 factor loadings higher than 0.15 possessed higher TFs (Figure 5a) at sandy sampling locations with positive PC1 factor scores (Figure 5b). The elements with negative factor loadings including Sn had higher TFs at sampling points from the clay class (CEC > 15 meq).

3.5. Accumulation Factor of the Elements

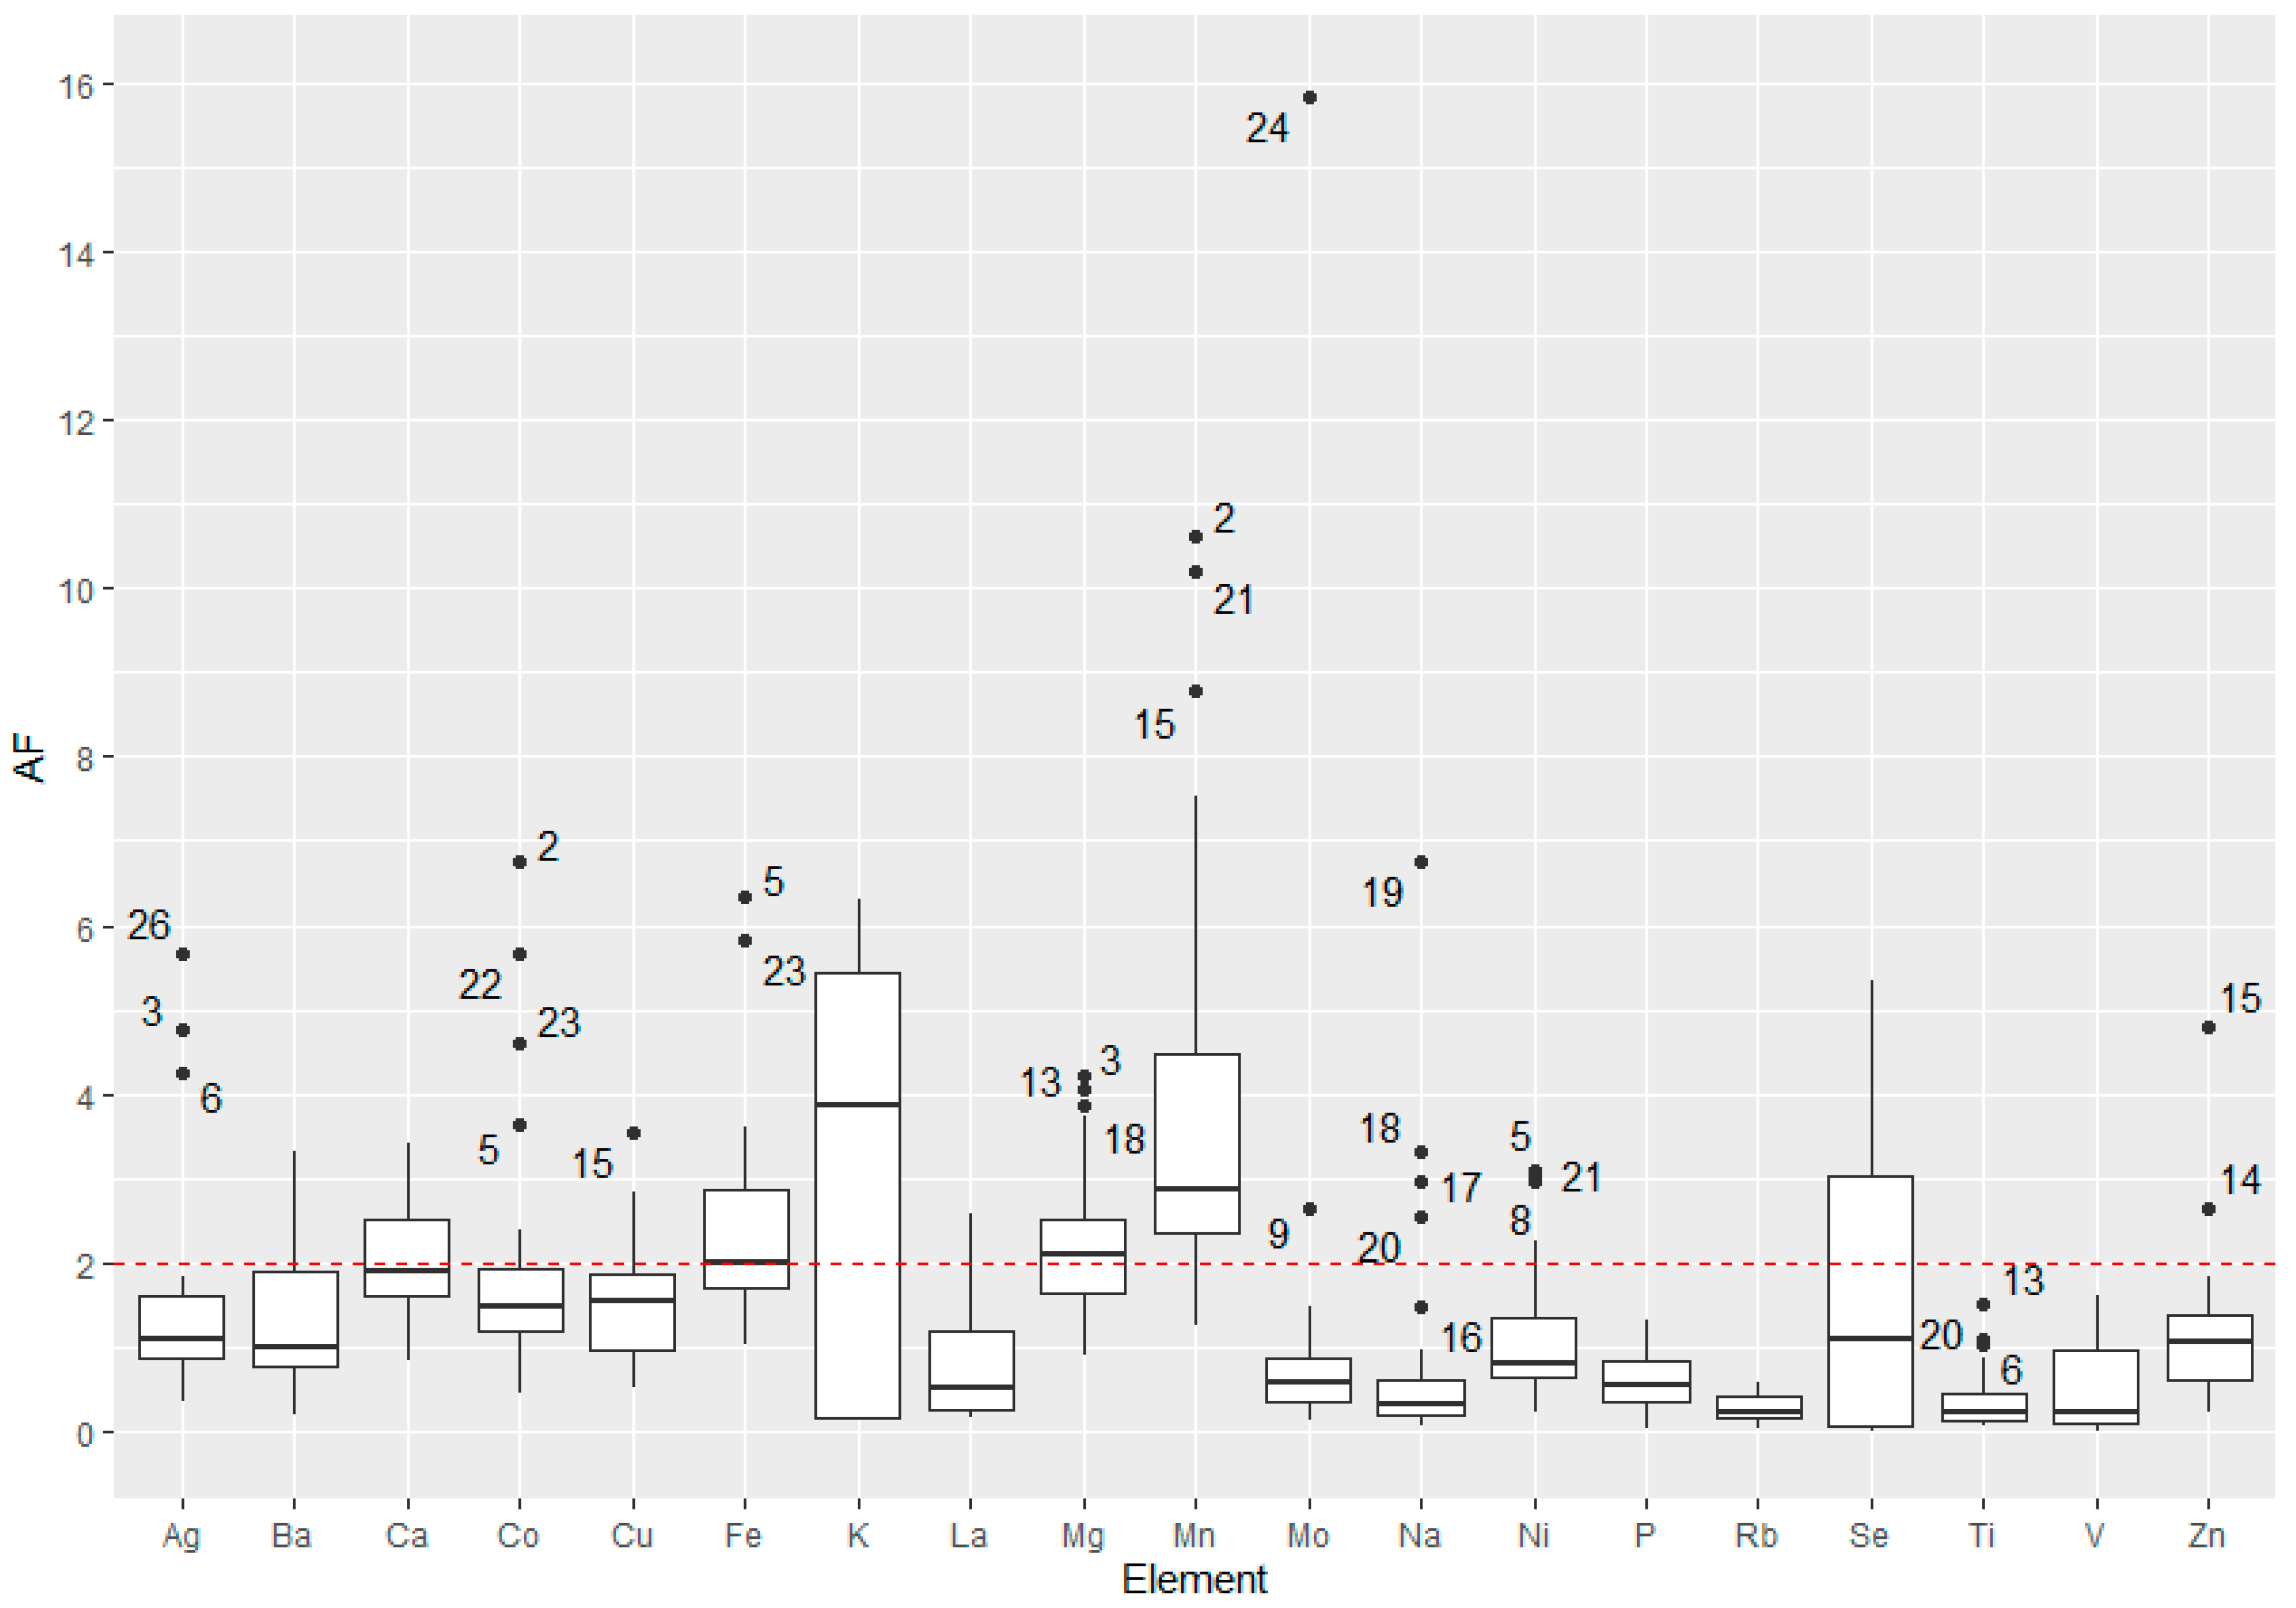
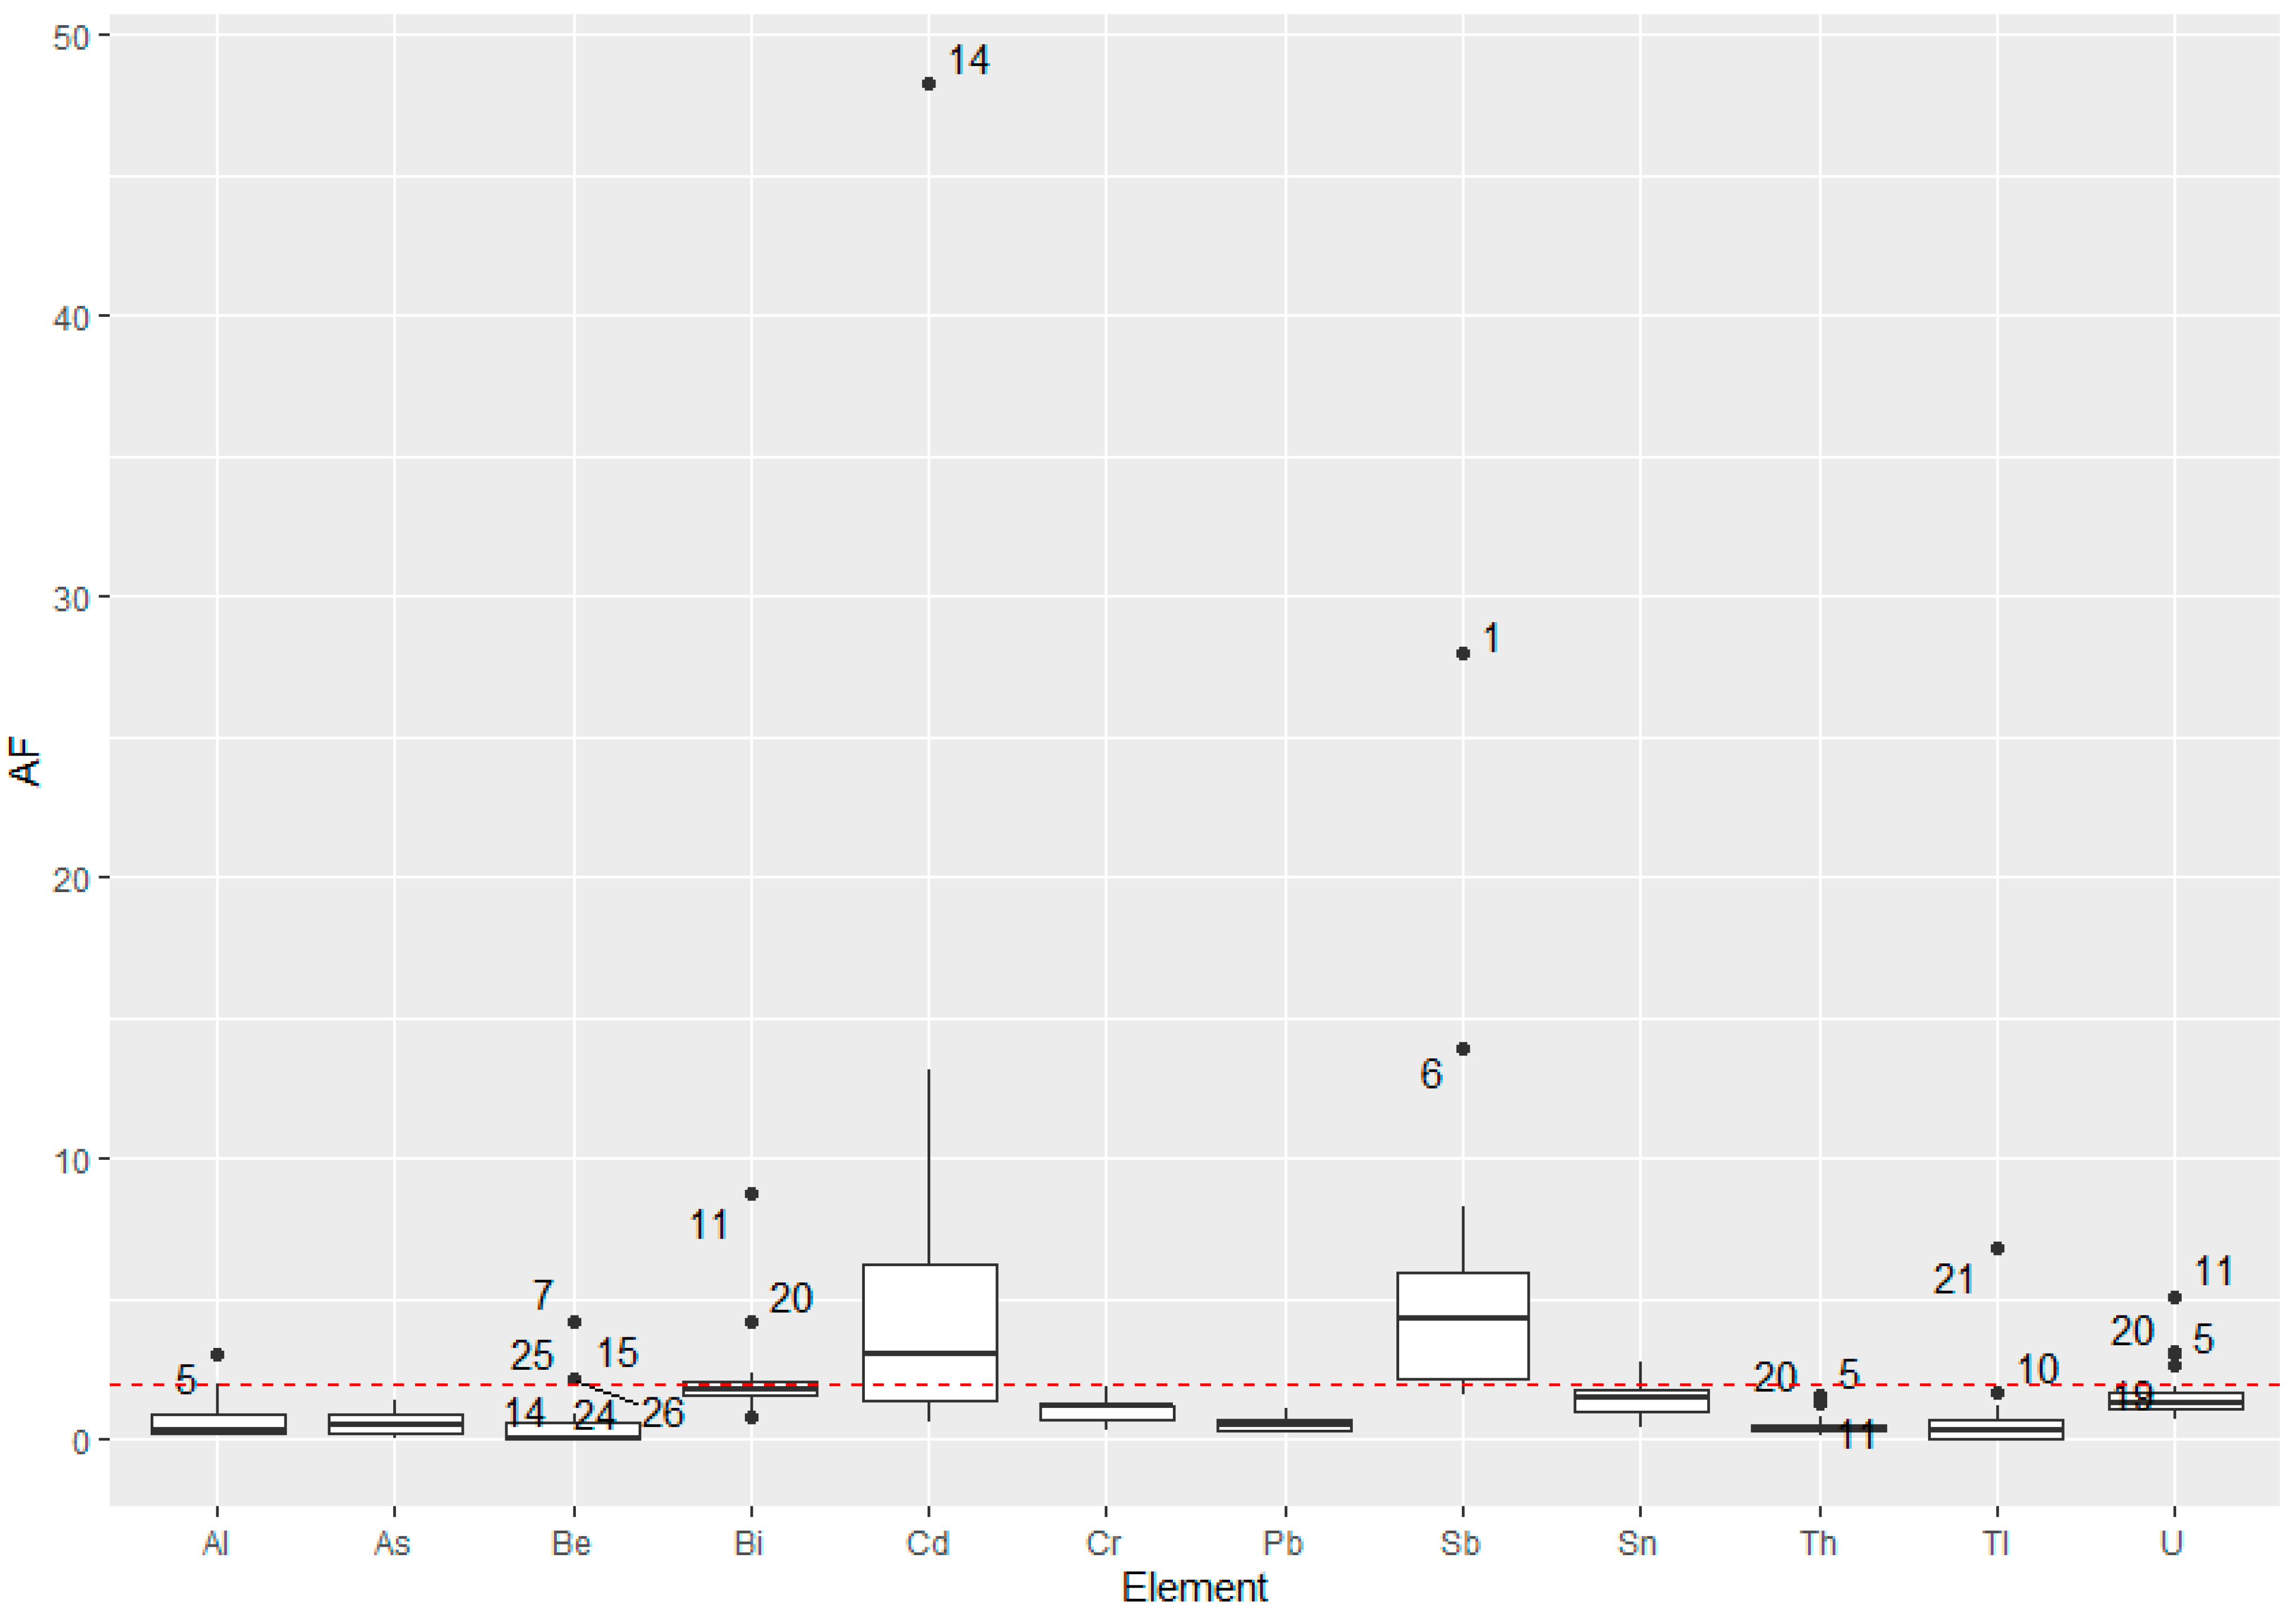
Compiling estimates of the environmental pollution degree is directly related to the determination of the accumulation factor (AF) of the elements. The accumulation factor was determined using Equation (2) [54]. It shows the concentration of the element in a plant species from the polluted area compared to its concentration in the same plant species from the background area. Figure 6 and Figure 7 show the accumulation factors of the analyzed elements.
A F = C p l a n t p o l l u t e d r e g i o n C p l a n t b a c k g r o u n d r e g i o n
The AF is an important indicator because it gives an idea of the dandelion’s response to environmental pollutants. The different accumulation coefficients in polluted areas versus the background indicate that the elemental composition of the plant changes in response to the anthropogenic pollutant. Significant accumulation factors are those greater than 2 [54]. The results showed that AF > 2 was observed for both essential elements and the potentially toxic Cd and Sb.
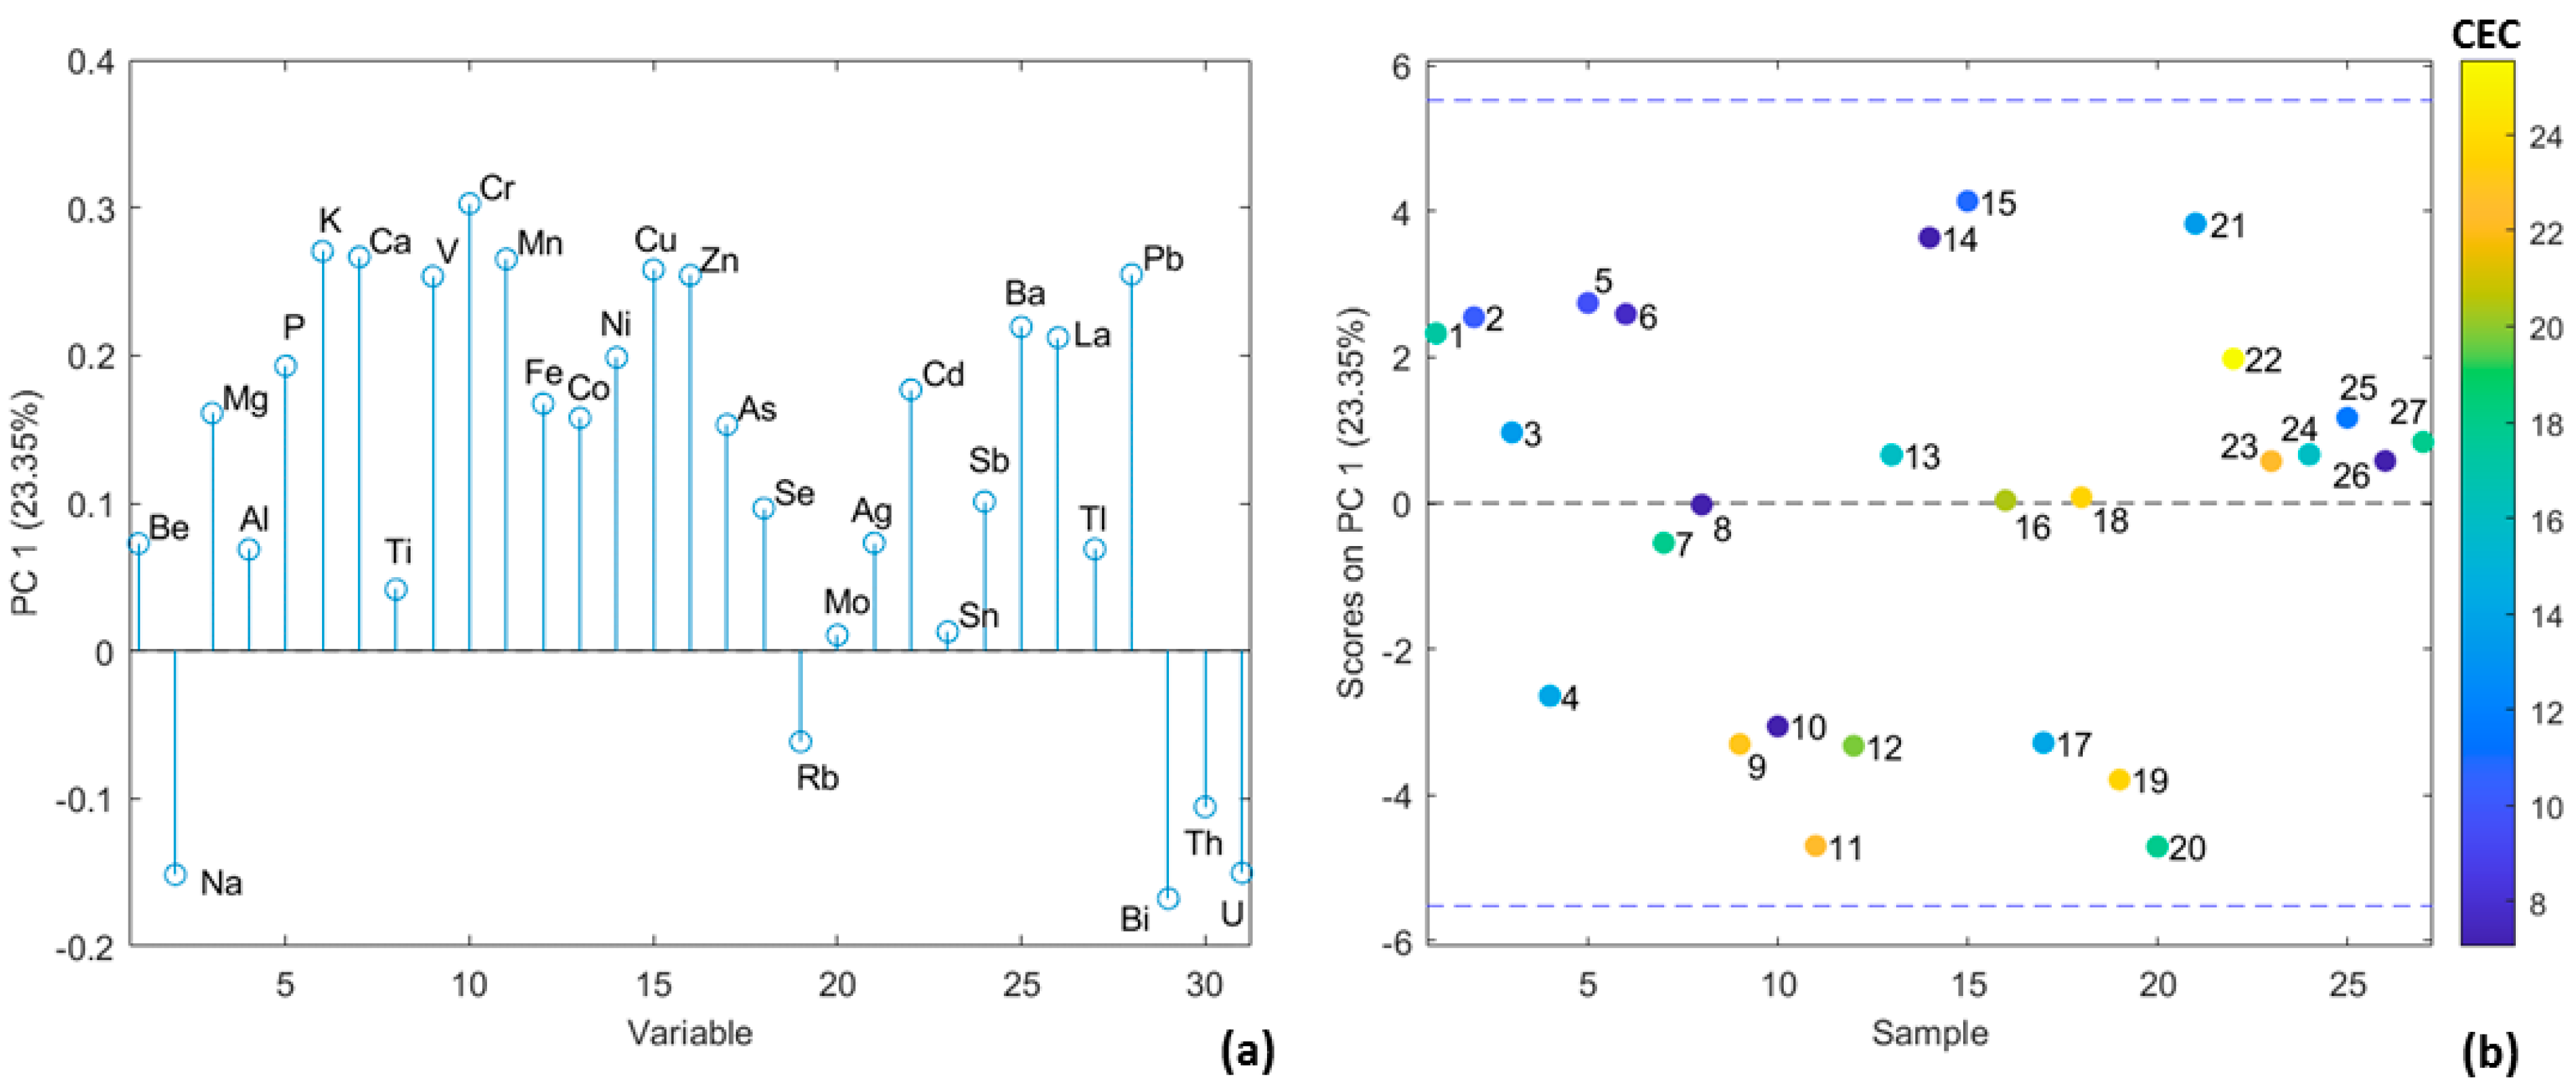
The PCA results for the element accumulation factor dataset are presented in Figure 8. Similarly to the PCA results for the transfer factor dataset, the elements were divided into two groups. The first group with positive factor loadings (Figure 8a) including elements with AF above 2 (Cd and Sb) possessed a higher accumulation factor at sandy sampling locations. In contrast, the second group with negative factor loadings had higher AF in sampling locations belonging dominantly to the clay class.

4. Discussion

The As, Cr, and Ni concentrations in soil samples were below the maximum permissible levels adopted in national legislation [52]. The Cd content in one of the soil samples (sample 27) with pH = 6.6 exceeded almost three times the maximum permissible level of 2.5 mg/kg. In the same soil sample, the concentration of Pb was very close to the maximum permissible one of 130 mg/kg. In several locations with pH levels ranging from 6.0 to 7.4, the Zn content was discovered to be near the maximum permissible limit of 390 mg/kg but remained below the intervention levels. As expected, Cu was identified as the primary cause of soil contamination. The copper levels were below the maximum permissible level (for pH < 6.0) of 80 mg/kg at only two studied sites. At all of the other examined sites, the concentration of Cu was significantly elevated, ranging from 2 to 16 times higher than the maximum permissible level and reaching values as high as 1288 mg/kg. The concentrations of potentially toxic elements in other open-pit copper mines in Bulgaria such as Asarel-Medet, which have the same origin as ‘Tsar Asen”, were analyzed in Yotova et al. (2018) [55]. The observed concentrations of Cu in this study also exceeded 2 to 10 times the maximum permissible concentrations, reaching 2400 mg/kg. In addition, compared with other areas exposed to copper mining and smelting, the determined concentrations of Cu in our study were significantly higher than those reported in Germany—420.9 mg/kg [18], in Spain—642 mg/kg [56] and in China—1990 mg/kg [57].
The obtained concentrations for Cd, Co, Cr, Cu, Fe, Mn, Sb, Sn, and Zn of Taraxacum officinale exceeded the background levels typical for Bulgaria and published in Lyubomirova et al. (2014) [54]. In the area of the “Tsar Asen” mine, the determined concentration for Cr was twice the background level. Co, Cu, Fe, Mn, and Zn were three times higher than the background levels. The Sb and Sn concentration levels were five times higher than in the background regions. The highest value compared to the background concentrations of 0.04 to 0.30 mg/kg was found for Cd, with a value of 5.31 mg/kg.
Bini et al. (2012) [58] analyzed dandelion leaves sampled from a mining area located in the mountain district of Belluno (NE Italy) and found concentrations of Cu, Cr, and Zn close to those determined in this study. Regarding Cd, the concentration found in the plant samples from “Tsar Asen” was five times higher than those found by Bini at al. [58].
The very good discrimination obtained between the sandy and clay sampling locations resembled their different element soil profiles, which should be considered when the transfer and accumulative factors are analyzed (Figure 2). The PLS-DA model results for the sand and clay groups based on the element concentrations of the soil samples showed that the elements responsible for the grouping of the samples (VIP score above 1) were Be, Mg, Al, K, Ca, Ti, V, Fe, Ni, Cu, Zn, Mo, Sn, Sb, Ba, Tl, and Bi. The soils falling into the sand group were characterized by high concentrations of Na, P, Ti, Mn, Ni, Zn, As, Se, Sn, Sb, Pb, and U, in contrast to the other group. The clay group included soils with higher concentrations of the elements Mg, Al, K, Ca, V, Cr, Fe, Co, Cu, Rb, Mo, Ag, Cd, Ba, La, Tl, Bi, and Th.
The wide range of the soil samples’ pH and CEC could be explained by the different soil and rock materials used during the remediation activities in the sampling region. In order to explore the relationships between TFs and AFs with pH in water, pH in KCl, and CEC, correlation analysis was performed (Figures S1 and S2). The TF correlation map showed a larger similarity of CEC with the TFs of the elements, which could be explained by the fact that CEC also reflects the soil texture and content of soil organic matter. The AF correlation map (Figure S2) resembles a well-defined group of similarity between the pH and CEC of the soil samples, indicating a bigger role of pH in the accumulation of PTEs than in their soil-to-plant transfer. In further analysis, CEC is used to discuss transfer and accumulation factor coefficients.
As noted for essential elements, TFs can be higher than 1 because of their vital importance to the plant organism. Figure 3 shows that the calculated median, which takes values above 1, refers to the elements Ca, K, and P, which are essential, and Rb, which has close chemical properties to K [59]. It is striking that although the sodium median was below 1, five of the analyzed samples (samples 16–20) were characterized by TF > 2, which is reasonably expected given its essential function. All of the samples above-mentioned were from the clay group (Figure 5). Potentially toxic elements with higher values of TFs were characterized by the elements Cd and Sn. Notably, Cd had higher TFs in sandy sampling locations while it was Sn in sampling points from the clay group (Figure 5).
The calculated AFs outlined five elements with a median above 2: Ca, K, Fe, Mg, and Mn. All of these elements had higher AFs at the sampling location from the sand group (Figure 8). The result obtained for P is interesting, as it appeared to have a low AF while a high TF was observed. This can be explained by the fact that the high concentration of phosphorus in the dandelion is not due to its ability to accumulate this element, but to the higher concentration of this chemical element in the adjacent soil. Potentially toxic elements with significant AFs were Cd and Sb. These accumulated in the dandelion at predominantly sandy locations with low pH (Figure S2).
The observed differences in the TF and AF for Sn may be due to the different chemical forms in which it is present in the two groups of sampling locations. Most probably in the sandy soil, it is found in the form of insoluble oxide, which explains the low values of TF and AF in contrast to the clay sampling locations.

5. Conclusions

The present study outlined the advantages of biomonitoring for the pollution risk assessment of an abandoned mine region including different soil types. The obtained element TFs and AFs confirm that only soil element concentrations are insufficient for reliable risk assessment. In the present study, the Cu soil concentrations exceeded 2 to 16 times the maximum permissible values, but Cu had no significant TF and AF values. The combination of TFs and AFs provides a reliable assessment for elemental uptake and could reveal some differences in the behavior of PTEs. The obtained results for PTEs show significant TFs for Cd and Sn, while the AFs outlined a significant accumulation of Cd and Sb. The correlation analysis of TFs and AFs pointed out that soil-to-plant transfer is mainly related to the CEC of the soil samples, while for the accumulation of elements in plants, the pH and CEC of the soil samples are equally important. These findings outline the necessity of using both factors in biomonitoring studies. The PCA analysis of the transfer and accumulate factor datasets revealed the relationships between the obtained coefficients and CEC.
The proposed assessment approach including traditional soil analysis, the use of a well-investigated biomonitor for the respective region (Taraxacum officinale in this study), and multivariate statistical analysis could not only be successfully applied for the pollution risk assessment of PTEs in abandoned mining regions, but also in the other anthropogenically influenced areas including different types of soils.

Supplementary Materials

The following supporting information can be downloaded at: https://www.mdpi.com/article/10.3390/app132111860/s1, Table S1: Comparison of the ICP-MS results obtained from the plant, soil, and sediment reference materials with certified/literature values and experimentally determined detection limits, Figure S1: Correlation map of the TF, pH (H2O), pH (KCl), and CEC (variables are reordered by absolute value of correlation coefficients), Figure S2: Correlation map of AF, pH (H2O), pH (KCl), and CEC (variables are reordered by absolute value of correlation coefficients).

Author Contributions

Conceptualization, V.M. and S.T.; Methodology, V.M. and S.T.; Software, S.T.; Validation, V.M., K.M., A.B. and V.L.; Formal analysis, V.M., K.M., A.B. and V.L.; Investigation, V.M., G.Y., K.M., A.B., V.L. and S.T.; Resources, V.M., G.Y., K.M., A.B., V.L. and S.T.; Data curation, V.M., G.Y., K.M., A.B., V.L. and S.T.; Writing—original draft preparation, V.M., G.Y., K.M., A.B., V.L. and S.T.; Writing—review and editing, V.M., G.Y. and S.T.; Visualization, V.M., G.Y. and S.T.; Supervision, A.B., V.L. and S.T.; Project administration, A.B. and S.T.; Funding acquisition, A.B. and S.T. All authors have read and agreed to the published version of the manuscript.

Funding

This research was funded by the National Science Program “Environmental Protection and Reduction of Risks of Adverse Events and Natural Disasters”, approved by the Resolution of the Council of Ministers, No. 577/17 August 2018, and supported by the Ministry of Education and Science (MES) of Bulgaria (agreement no. Д01-271/9 December 2022).

Institutional Review Board Statement

Not applicable.

Informed Consent Statement

Not applicable.

Data Availability Statement

The data presented in this study are available on request from the authors.

Acknowledgments

This work was carried out within the framework of the National Science Program “Environmental Protection and Reduction of Risks of Adverse Events and Natural Disasters”, approved by the Resolution of the Council of Ministers, No. 577/17 August 2018, and supported by the Ministry of Education and Science (MES) of Bulgaria (agreement no. Д01-271/9 December 2022). Research equipment from Distributed Research Infrastructure INFRAMAT, part of the Bulgarian National Roadmap for Research Infrastructures, supported by the Bulgarian Ministry of Education and Science, was used in this investigation.

Conflicts of Interest

The authors declare no conflict of interest.

References

  1. Orosun, M.M.; Tchokossa, P.; Nwankwo, L.I.; Lawal, T.O.; Bello, S.A.; Ige, S.O. Assessment of heavy metal pollution in drinking water due to mining and smelting activities in Ajaokuta. Niger. J. Technol. Dev. 2016, 13, 30–38. [Google Scholar] [CrossRef]
  2. Alamgir, M.; Islam, M.; Hossain, N.; Kibria, M.G.; Rahman, M.M. Assessment of heavy metal contamination in urban soils of Chittagong city, Bangladesh. Int. J. Plant Soil Sci. 2015, 7, 362–372. [Google Scholar] [CrossRef]
  3. De Araújo, S.N.; Ramos, S.J.; Martins, G.C.; Teixeira, R.A.; de Souza, E.S.; Sahoo, P.K.; Fernandes, A.R.; Gastauer, M.; Caldeira, C.F.; Souza-Filho, P.W.M.; et al. Copper mining in the eastern Amazon: An environmental perspective on potentially toxic elements. Environ. Geochem. Health 2022, 44, 1767–1981. [Google Scholar] [CrossRef] [PubMed]
  4. Lin, C.Y.; Ali, B.N.M.; Tair, R.; Musta, B.; Abdullah, M.H.; Cleophas, F.; Isidore, F.; Nadzir, M.S.M.; Roselee, M.H.; Yusoff, I. Distance impacts toxic metals pollution in mining affected river sediments. Environ. Res. 2022, 214 Pt 1, 113757. [Google Scholar] [CrossRef]
  5. Rubinos, D.A.; Jerez, Ó.; Forghani, G.; Edraki, M.; Kelm, U. Geochemical stability of potentially toxic elements in porphyry copper-mine tailings from Chile as linked to ecological and human health risks assessment. Environ. Sci. Pollut. Res. Int. 2021, 28, 57499–57529. [Google Scholar] [CrossRef]
  6. Tchounwou, P.B.; Yedjou, C.G.; Patlolla, A.K.; Sutton, D.J. Heavy Metal Toxicity and the Environment. Exp. Suppl. 2012, 101, 133–164. [Google Scholar]
  7. Kierczak, J.; Pietranik, A.; Pędziwiatr, A. Ultramafic geoecosystems as a natural source of Ni, Cr, and Co to the environment: A review. Sci. Total Environ. 2021, 755 Pt 1, 142620. [Google Scholar] [CrossRef]
  8. Ettler, V.; Stepanek, D.; Mihaljevic, M.; Drahota, P.; Jedlicka, R.; Kribek, B.; Vanek, A.; Penizek, V.; Sracek, O.; Nyambe, I. Slag dusts from Kabwe (Zambia): Contaminant mineralogy and oral bioaccessibility. Chemosphere 2020, 260, 127642. [Google Scholar] [CrossRef]
  9. Eulises, C.S.J.; Gonzalez-Chavez, M.D.C.A.; Carrillo-Gonzalez, R.; Garcıa-Cue, J.L.; Fernandez-Reynoso, D.S.; Noerpeld, M.; Scheckeld, K.G. Bioaccessibility of potentially toxic elements in mine residue particles. Environ. Sci. Process. Impacts 2021, 23, 367–380. [Google Scholar] [CrossRef]
  10. Bačeva, K.; Stafilov, T.; Matevski, V. Bioaccumulation of heavy metals by endemic Viola species from the soil in the vicinity of the As-Sb-Tl mine “allchar” Republic of Macedonia. Int. J. Phytoremediat. 2014, 16, 347–365. [Google Scholar] [CrossRef]
  11. Bešter, P.K.; Lobnik, F.; Eržen, I.; Kastelec, D.; Zupan, M. Prediction of cadmium concentration in selected home-produced vegetables. Ecotoxicol. Environ. Saf. 2013, 96, 182–190. [Google Scholar] [CrossRef]
  12. Pinto, E.; Almeida, A.A.; Aguiar, A.A.R.M.; Ferreira, I.M.P.L.V.O. Changes in macrominerals, trace elements and pigments content during lettuce (Lactuca sativa L.) growth: Influence of soil composition. Food Chem. 2014, 152, 603–611. [Google Scholar] [CrossRef]
  13. Roivainen, P.; Makkonen, S.; Holopainen, T.; Juutilainen, J. Element interactions and soil properties affecting the soil-to-plant transfer of 6 elements relevant to radioactive waste in boreal forest. Radiat. Environ. Biophys. 2012, 51, 69–78. [Google Scholar] [CrossRef] [PubMed]
  14. Adamo, P.; Iavazzo, P.; Albanese, S.; Agrelli, D.; De Vivo, B.; Lima, A. Bioavailability and soil-to-plant transfer factors as indicators of potentially toxic element contamination in agricultural soils. Sci. Total Environ. 2014, 500–501, 11–22. [Google Scholar] [CrossRef] [PubMed]
  15. Lin, L.; Yu, B.; Yan, X.; Liao, X.; Zhang, Y. Accumulation of soil Cd, Cr, Cu, Pb by Panax notoginseng and its associated health risk. Acta Ecol. Sin. 2014, 34, 2868–2875. [Google Scholar]
  16. Wanat, N.; Joussein, E.; Soubrand, M.; Lenain, J.F. Arsenic (As), antimony (Sb), and lead (Pb) availability from Au-mine Technosols: A case study of transfer to natural vegetation cover in temperate climates. Environ. Geochem. Health 2014, 36, 783–795. [Google Scholar] [CrossRef] [PubMed]
  17. Alhogbi, B.G.; Al-Ansari, S.A.; El-Shahawi, M.S. A Comparative Study on the Bioavailability and Soil-to-Plant Transfer Factors of Potentially Toxic Element Contamination in Agricultural Soils and Their Impacts: A Case Study of Dense Farmland in the Western Region of Saudi Arabia. Processes 2023, 11, 2515. [Google Scholar] [CrossRef]
  18. Antoniadis, V.; Shaheen, S.M.; Boersch, J.; Frohne, T.; Du Laing, G.; Rinklebe, J. Bioavailability and risk assessment of potentially toxic elements in garden edible vegetables and soils around a highly contaminated former mining area in Germany. J. Environ. Manag. 2017, 186, 192–200. [Google Scholar] [CrossRef]
  19. Nath, R. Health and Desease: Role of Micronutrients and Trace Elements; A.P.H. Publishing Corporation: New Delhi, India, 2000; p. 639. [Google Scholar]
  20. Takuchev, N. Contribution of air pollutants above the city of Stara Zagora, Bulgaria on non-oncological morbidity of the population in the region of skin and subcutaneous tissue diseases. In Proceedings of the International Scientific Conference, Gabrovo, Bulgaria, 18–19 November 2011. [Google Scholar]
  21. Popov, P.; Strashimirov, S.; Popov, K.; Petrunov, R.; Kanazirski, M.; Tzonev, D. Main features in geology and metallogeny of the Panagyurishte ore region. An. Univ. Min. Geol. 2003, 46, 119–125. [Google Scholar]
  22. Djingova, R.; Kuleff, I. Seasonal variations in the metal concentration in the leaves of Taraxacum officinale, Plantago major and Plantago lanceolata. Chem. Ecol. 1999, 16, 239–253. [Google Scholar] [CrossRef]
  23. Djingova, R.; Ivanova, J.; Wagner, G.; Korhammer, S.; Markert, B. Distribution of lanthanoids, Be, Bi, Ga, Te, Tl, Th and U, on the territory of Bulgaria using Populus nigra ‘Italica’ as an indicator. Sci. Total Environ. 2001, 280, 85–91. [Google Scholar] [CrossRef] [PubMed]
  24. Djingova, R.; Kuleff, I.; Andreev, N. Comparison of the ability of several vascular plants to reflect environmental pollution. Chemosphere 1993, 27, 1385–1396. [Google Scholar] [CrossRef]
  25. Djingova, R.; Kuleff, I.; Markert, B. Chemical fingerprinting of plants. Ecol. Res. 2004, 19, 3–11. [Google Scholar] [CrossRef]
  26. Charnowska, K.; Milewska, A. The content of heavy metals in an indicator plant (Taraxacum officinale) in Warsaw. Polish J. Environ. Stud. 2000, 9, 125–128. [Google Scholar]
  27. Keane, B.; Collier, M.H.; Rogstad, S.H. Pollution and genetic structure of North American populations of the common Dandelion (Taraxacum officinale). Environ. Monit. Assess. 2005, 105, 341–357. [Google Scholar] [CrossRef]
  28. Petrova, S.; Yurukova, L.; Velcheva, I. Taraxacum officinale as a biomonitor of metals and toxic elements (Plovdiv, Bulgaria). Bulg. J. Agric. Sci. 2013, 19, 241–247. [Google Scholar]
  29. Kleckerová, A.; Dočekalová, H. Dandelion Plants as a Biomonitor of Urban Area Contamination by Heavy Metals. Int. J. Environ. Res. 2014, 8, 157–164. [Google Scholar]
  30. Fröhlichová, A.; Száková, J.; Najmanová, J.; Tlustoš, P. An assessment of the risk of element contamination of urban and industrial areas using Taraxacum sect. Ruderalia as a bioindicator. Environ. Monit. Assess. 2018, 190, 150. [Google Scholar]
  31. Vanni, G.; Cardelli, R.; Marchini, F.; Saviozzi, A.; Guidi, L. Are the Physiological and Biochemical Characteristics in Dandelion Plants Growing in an Urban Area (Pisa, Italy) Indicative of Soil Pollution? Water Air Soil Pollut. 2015, 226, 124. [Google Scholar] [CrossRef]
  32. Bretzel, F.; Benvenuti, S.; Pistelli, L. Metal contamination in urban street sediment in Pisa (Italy) can affect the production of antioxidant metabolites in Taraxacum officinale Weber. Environ. Sci. Pollut. Res. Int. 2014, 21, 2325–2333. [Google Scholar] [CrossRef]
  33. Savinov, A.B.; Kurganova, L.N.; Shekunov, Y.I. Lipid peroxidation rates in Taraxacum officinale Wigg. and Vicia cracca L. from biotopes with different levels of soil pollution with heavy metals. Russ. J. Ecol. 2007, 38, 174–180. [Google Scholar] [CrossRef]
  34. Ackova, D.G.; Kadifkova-Panovska, T.; Andonovska, K.B.; Stafilov, T. Evaluation of genotoxic variations in plant model systems in a case of metal stressors. J. Environ. Sci. Health B 2016, 51, 340–349. [Google Scholar] [CrossRef] [PubMed]
  35. Collier, M.H.; Keane, B.; Rogstad, S.H. Productivity differences between dandelion (Taraxacum officinale; Asteraceae) clones from pollution impacted versus nonimpacted soils. Plant Soil 2010, 329, 173–183. [Google Scholar] [CrossRef]
  36. Collier, M.H.; Boughter, S.A.; Dameron, M.P.; Gribbins, K.M.; Keane, B.; Shann, J.R.; Rogstad, S.H. Uptake and distribution of copper, lead, and zinc in dandelions (Taraxacum officinale; Asteraceae) sampled from polluted and nonpolluted soils. J. Torrey Bot. Soc. 2017, 144, 47–57. [Google Scholar] [CrossRef]
  37. ISO 10390:2021; Soil, Treated Biowaste and Sludge-Determination of pH. ISO: Geneva, Switzerland, 2021.
  38. ISO 23470:2018; Soil Quality—Determination of Effective Cation Exchange Capacity (CEC) and Exchangeable Cations Using a Hexamminecobalt(III)chloride Solution. ISO: Geneva, Switzerland, 2018.
  39. Mihaylova, V.; Lyubomirova, V.; Djingova, R. Optimization of sample preparation and ICP-MS analysis for determination of 60 elements for characterization of the plant ionome. Int. J. Environ. Anal. Chem. 2013, 93, 1441–1456. [Google Scholar] [CrossRef]
  40. Lyubomirova, V.; Mihaylova, V.; Djingova, R. Effects of soil properties and anthropogenic activity on the transfer of 52 elements in the system soil/Taraxacum officinale. J. Soils Sediments 2015, 15, 1549–1557. [Google Scholar] [CrossRef]
  41. US EPA 3051a. Method 3051a: Microwave Assisted Acid Digestion of Sediments, Sludges, Soils, and Oils. Available online: https://www.epa.gov/esam/us-epa-method-3051a-microwave-assisted-acid-digestion-sediments-sludges-and-oils (accessed on 1 January 2023).
  42. Lyubomirova, V.; Mihaylova, V.; Djingova, R. Determination of macroelements in potable waters with cell-based inductively-coupled plasma mass spectrometry. Spectrosc. Eur. 2020, 32, 18–21. [Google Scholar]
  43. Lyubomirova, V.; Djingova, R. Determination of Se in Bulgarian commercial flour and bread. Compt. Rend. Acad. Bulg. Sci. 2015, 68, 847–852. [Google Scholar]
  44. Venelinov, T.; Mihaylovam, V.; Peycheva, R.; Todorov, M.; Yotova, G.; Todorov, B.; Lyubomirova, V.; Tsakovski, S. Sediment Assessment of the Pchelina Reservoir, Bulgaria. Molecules 2021, 26, 7517. [Google Scholar] [CrossRef]
  45. Rodushkin, I.; Ruth, T.; Huhtasaari, A. Comparison of two digestion methods for elemental determinations in plant material by ICP techniques. Anal. Chim. Acta 1999, 378, 191–200. [Google Scholar] [CrossRef]
  46. Rodushkin, I.; Engstrom, E.; Sorlin, D.; Baxter, D. Levels of inorganic constituents in raw nuts and seeds on the Swedish market. Sci. Total Environ. 2008, 392, 290–304. [Google Scholar] [CrossRef] [PubMed]
  47. Ivanova, J.; Korhammer, S.; Djingova, R.; Heidenreich, H.; Markert, B. Determination of lanthanoids and some heavy and toxic elements in plant certified reference materials by inductively coupled plasma mass spectrometry. Spectrochim. Acta B 2001, 56, 3–12. [Google Scholar] [CrossRef]
  48. Platikanov, S.; Rodriguez-Mozaz, S.; Huerta, B.; Barceló, D.; Cros, J.; Batle, M.; Poch, G.; Tauler, R. Chemometrics quality assessment of wastewater treatment plant effluents using physicochemical parameters and UV absorption measurements. J. Environ. Manag. 2014, 140, 33–44. [Google Scholar] [CrossRef]
  49. Acquavita, A.; Aleffi, I.F.; Benci, C.; Bettoso, N.; Crevatin, E.; Milani, L.; Tamberlich, F.; Toniatti, L.; Barbieri, P.; Licen, S.; et al. Annual characterization of the nutrients and trophic state in a Mediterranean coastal lagoon: The Marano and Grado Lagoon (northern Adriatic Sea). Reg. Stud. Mar. Sci. 2015, 2, 132–144. [Google Scholar] [CrossRef]
  50. Yotova, G.; Lazarova, S.; Kudłak, B.; Zlateva, B.; Mihaylova, V.; Wieczerzak, M.; Venelinov, T.; Tsakovski, S. Assessment of the Bulgarian Wastewater Treatment Plants’ Impact on the Receiving Water Bodies. Molecules 2019, 24, 2274. [Google Scholar] [CrossRef]
  51. Mihaylova, V.; Yotova, G.; Kudłak, B.; Venelinov, T.; Tsakovski, S. Chemometric Evaluation of WWTPs’ Wastewaters and Receiving Surface Waters in Bulgaria. Water 2022, 14, 521. [Google Scholar] [CrossRef]
  52. Ministry of Health-Care; Ministry of Agriculture and Forestry. Regulation No. 3/2008 of the Ministry of Environment and Water, Ministry of Health-Care, Ministry of Agriculture and Forestry; Ministry of Health-Care: Sofia, Bulgaria; Ministry of Agriculture and Forestry: Sofia, Bulgaria, 2008. [Google Scholar]
  53. Tsukada, H.; Nakamura, Y. Transfer factors of 31 elements in several agricultural plants collected from 150 farm fields in Aomori, Japan. J. Radioanal. Nucl. Chem. 1998, 236, 123–131. [Google Scholar] [CrossRef]
  54. Lyubomirova, V.; Mihaylova, V.; Djingova, R. Changes in the ionome of Taraxacum officinale under different anthropogenic influences. Phytol. Balcan. 2014, 20, 247–255. [Google Scholar]
  55. Yotova, G.; Zlateva, B.; Ganeva, S.; Simeonov, V.; Kudlak, B.; Namiesnik, J.; Tsakovski, S. Phytoavailability of potentially toxic elements from industrially contaminated soils to wild grass. Ecotoxicol. Environ. Saf. 2018, 164, 317–324. [Google Scholar] [CrossRef]
  56. Romero-Baena, A.J.; Barba-Brioso, C.; Ross, A.; Gonzalez, I.; Aparicio, P. Mobility of potentially toxic elements in family garden soils of the Riotinto mining area. Appl. Clay Sci. 2021, 203, 105999. [Google Scholar] [CrossRef]
  57. Leng, Q.; Ren, D.; Wang, Z.; Zhang, S.; Zhang, X.; Chen, W. Assessment of Potentially Toxic Elements Pollution and Human Health Risks in Polluted Farmland Soils around Distinct Mining Areas in China—A Case Study of Chengchao and Tonglushan. Toxics 2023, 11, 574. [Google Scholar] [CrossRef] [PubMed]
  58. Bini, C.; Wahsha, M.; Fontana, S.; Maleci, L. Effects of heavy metals on morphological characteristics of Taraxacum officinale Web growing on mine soils in NE Italy. J. Geochem. Explor. 2012, 123, 101–108. [Google Scholar] [CrossRef]
  59. Kabata-Pendias, A.; Pendias, H. Trace Elements in Soils and Plants; CRC Press: Boca Raton, FL, USA, 1984. [Google Scholar]
Figure 1. Sampling map of the “Tsar Asen” mine.
Applsci 13 11860 g001
Figure 2. The PLS-DA modeling results for the sand and clay groups were based on the element concentrations of the samples: (a) confusion matrix; (b) VIP scores; (c) regression vector for the sand group; (d) regression vector for the clay group.
Applsci 13 11860 g002
Figure 3. Macro- and microelement transfer factors.
Applsci 13 11860 g003
Figure 4. Toxic element transfer factors.
Applsci 13 11860 g004
Figure 5. PC1 factor loadings (a) and factor scores (b) of the element transfer factor dataset.
Applsci 13 11860 g005
Figure 6. Macro- and microelement accumulation factors.
Applsci 13 11860 g006
Figure 7. Toxic element accumulation factors.
Applsci 13 11860 g007
Figure 8. PC1 factor loadings (a) and factor scores (b) of the element accumulation factor dataset.
Applsci 13 11860 g008
Table 1. ICP-MS measurement conditions (Perkin Elmer SCIEX Elan DRC-e).
ICP-MSInstrumental Conditions
Argon plasma gas flow15 L/min
Auxiliary gas flow1.20 L/min
Nebulizer gas flow0.90 L/min
Lens voltage6.00 V
ICP-RF power1100 W
Pulse stage voltage950 V
Dwell time50 ms
Acquisition modePeak hop
Peak patternOne point per mass at maximum peak
Number of runs4
Determined isotopes of major elements (RPa, V)27Al(0.015),42,43,44Ca(42Ca-0.014;43Ca-0.013; 44Ca-0.015),54,56,57Fe(54Fe-0.014;56Fe-0.015; 57Fe-0.013),23Na(0.017),24,25,26Mg(24Mg-0.016,25,26Mg-0.015),55Mn(0.015),39K(0.017),31P(0.013),46,47,48,49Ti (0.012)
Determined isotopes of micro- and trace elements *(Oxygen flow rate [mL/min]/RPq [V])107Ag, 75As (1.0/0.7) *, 136,138Ba, 9Be, 112,114Cd, 59Co, 52Cr, 63,65Cu, 139La, 96,98Mo, 60,62Ni, 207,208Pb, 85,87Rb, 121,123Sb, 77,78Se (1.5/0.3) *, 80,82Se (0.9/0.3) *, 118,120Sn, 232Th, 205Tl, 238U, 51V, 66Zn
Table 2. The CEC and pH values in water and 1 M KCl.
Soil SampleCEC [meq]pH (H2O)pH (KCl)
117.06.355.08
210.56.204.49
313.46.165.30
413.86.715.61
59.66.234.98
67.86.755.72
717.66.725.94
87.16.875.79
922.56.315.80
107.47.296.62
1121.96.766.22
1219.66.866.04
1316.06.965.55
147.26.184.85
1511.06.415.39
1620.37.086.16
1714.46.835.97
1823.76.986.69
1928.17.557.16
2017.96.765.78
2113.76.555.55
2225.67.617.22
2322.37.396.65
2416.35.954.45
2511.87.436.18
267.16.836.03
2718.26.606.28
Table 3. Basic statistics of the soil and plant samples.
Soil SamplesPlant Samples
Element
[mg/kg]
MeanMedian(Min–Max)MeanMedian(Min–Max)
Ag0.620.210.002–8.890.190.140.044–0.71
Al32,12533,67512,491–57,0541968433.8–943
As5.244.931.36–9.870.0830.0670.001–0.21
Ba15914574–30329.320.54.03–68.9
Be1.231.330.36–2.680.0220.0010.001–0.15
Bi0.530.520.24–1.100.500.420.18–2.10
Ca813478821996–26,87421,26119,6418848–35,366
Cd0.970.700.14–6.250.620.330.061–5.31
Co22.721.36.70–58.90.340.250.07–1.15
Cr39.137.415.3–74.02.172.470.60–4.01
Cu38630051.9–128818.217.86.14–40.8
Fe41,06941,38713,989–97,297334267138–854
K334429571081–607633,44439,4171769–64,474
La20.419.111.5–61.80.310.180.062–0.93
Mg11,51611,0662670–25,999614756892438–11,364
Mn13211114561–546110980.135.5–298
Mo3.922.570.99–14.61.580.730.15–19.8
Na880713169–249344716435.2–3382
Ni27.925.511.6–59.61.070.760.22–2.89
P665637157–214823592171198–5294
Pb33.230.212.5–1010.800.830.30–1.61
Rb15.313.77.6–38.418.914.82.47–39.8
Sb0.170.140.024–0.470.0370.0290.011–0.195
Se6.045.080.003–21.60.290.190.001–0.91
Sn0.660.490.020–2.831.431.460.39–2.75
Th4.304.112.45–12.40.0340.0390.008–0.109
Ti75856785.9–21996.964.111.54–28.9
Tl0.080.090.009–0.210.0180.0070.001–0.205
U1.060.860.57–3.400.0310.0260.013–0.100
V11210736.0–1850.400.190.004–1.31
Zn13312736.4–34061.155.512.4–249
Disclaimer/Publisher’s Note: The statements, opinions and data contained in all publications are solely those of the individual author(s) and contributor(s) and not of MDPI and/or the editor(s). MDPI and/or the editor(s) disclaim responsibility for any injury to people or property resulting from any ideas, methods, instructions or products referred to in the content.