
Spatial-Temporal Distribution and the Influencing Factors of Water Conservation Function in Yunnan, China


Abstract
:1. Introduction
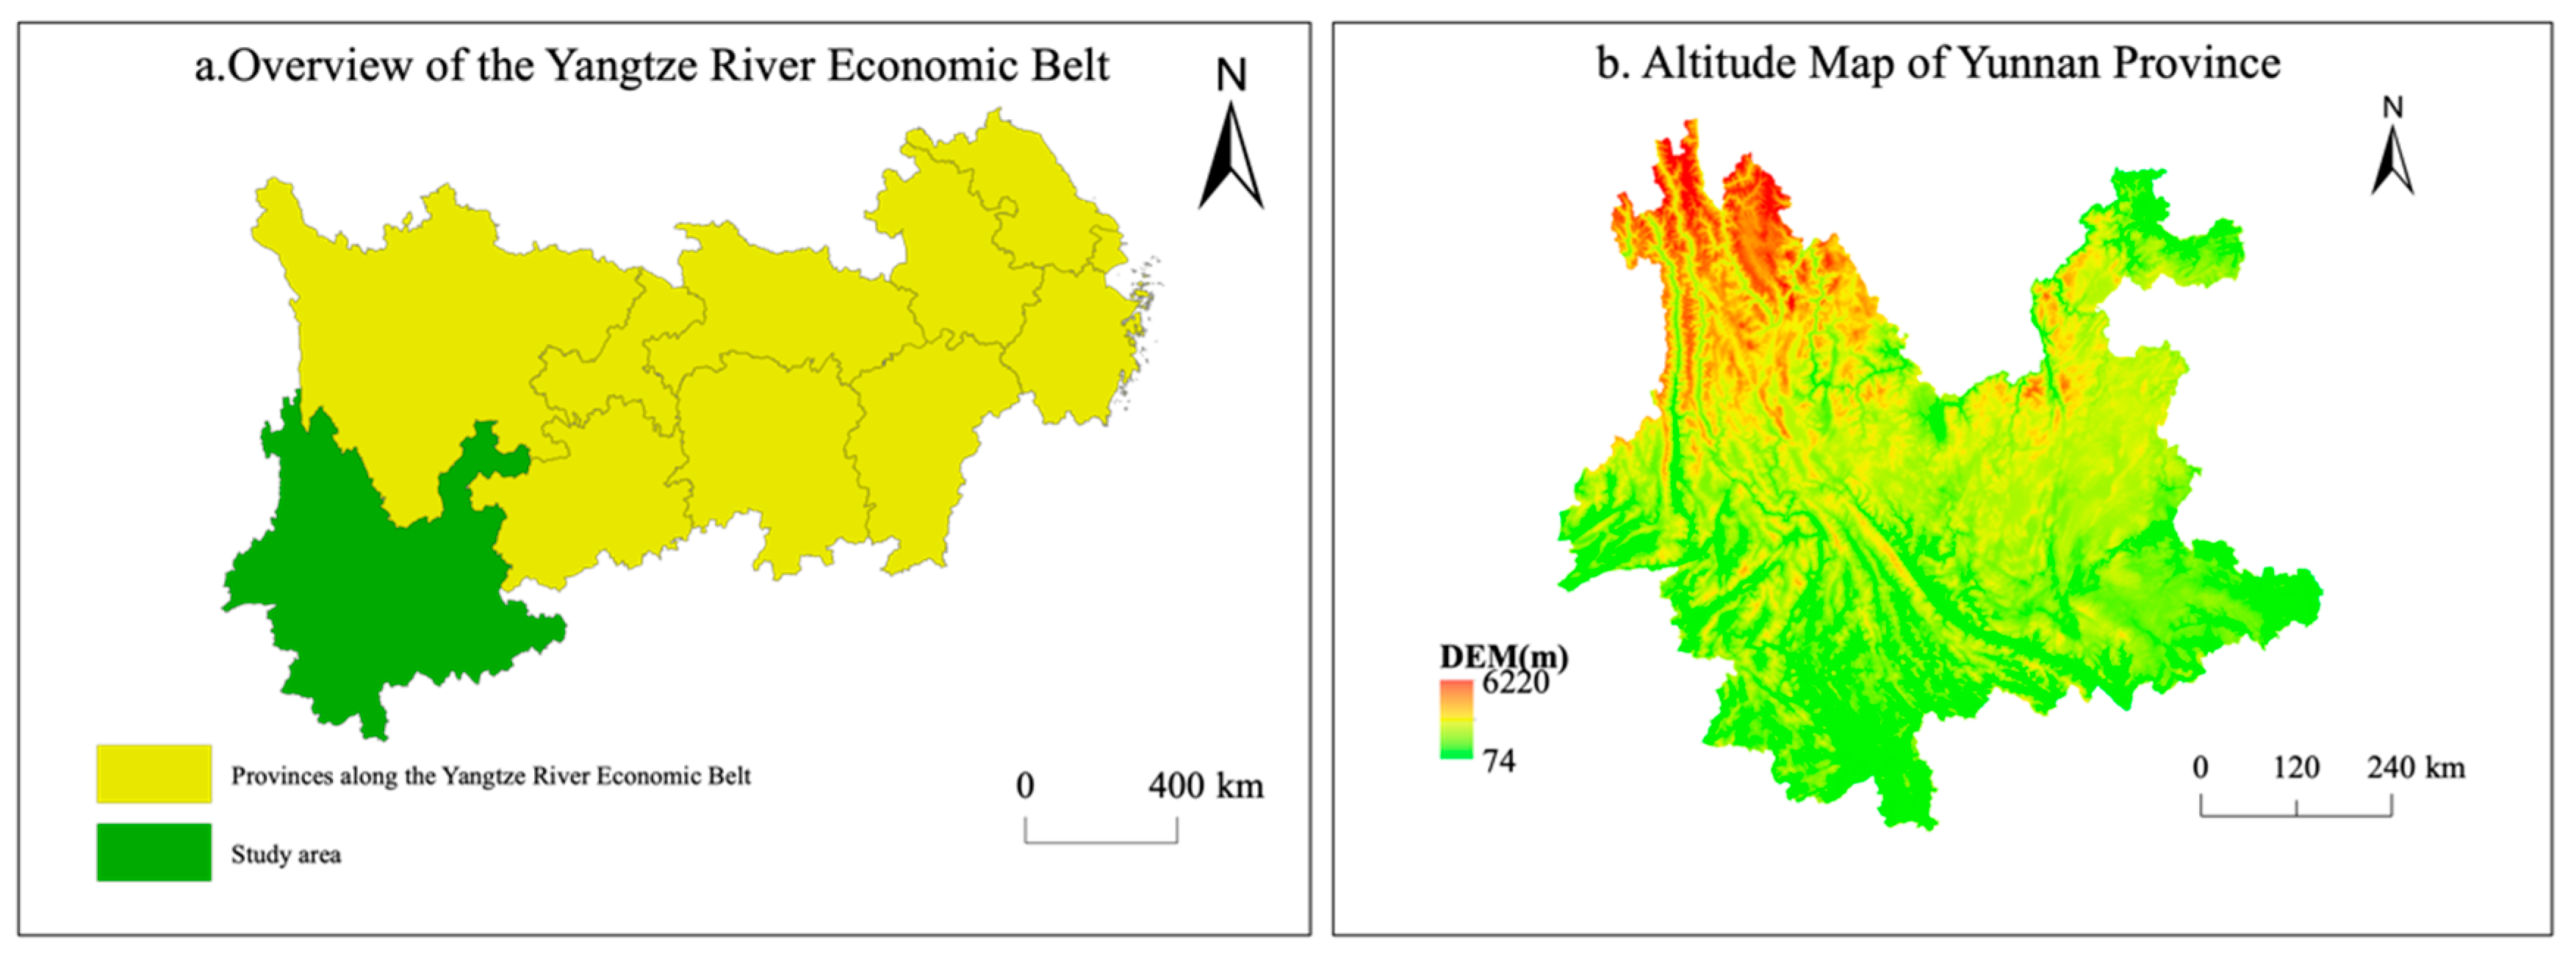
2. The Geographic Area to Be Studied
3. Research Methods and Data
3.1. Assessment of Water Conservation Function Based on InVEST Model
3.2. Spatial Autocorrelation Analysis Based on Moran’I Index
3.3. Analysis of Influencing Factors Based on Geographic Detector
3.4. Data Source and Parameter Processing
4. Results and Discussions
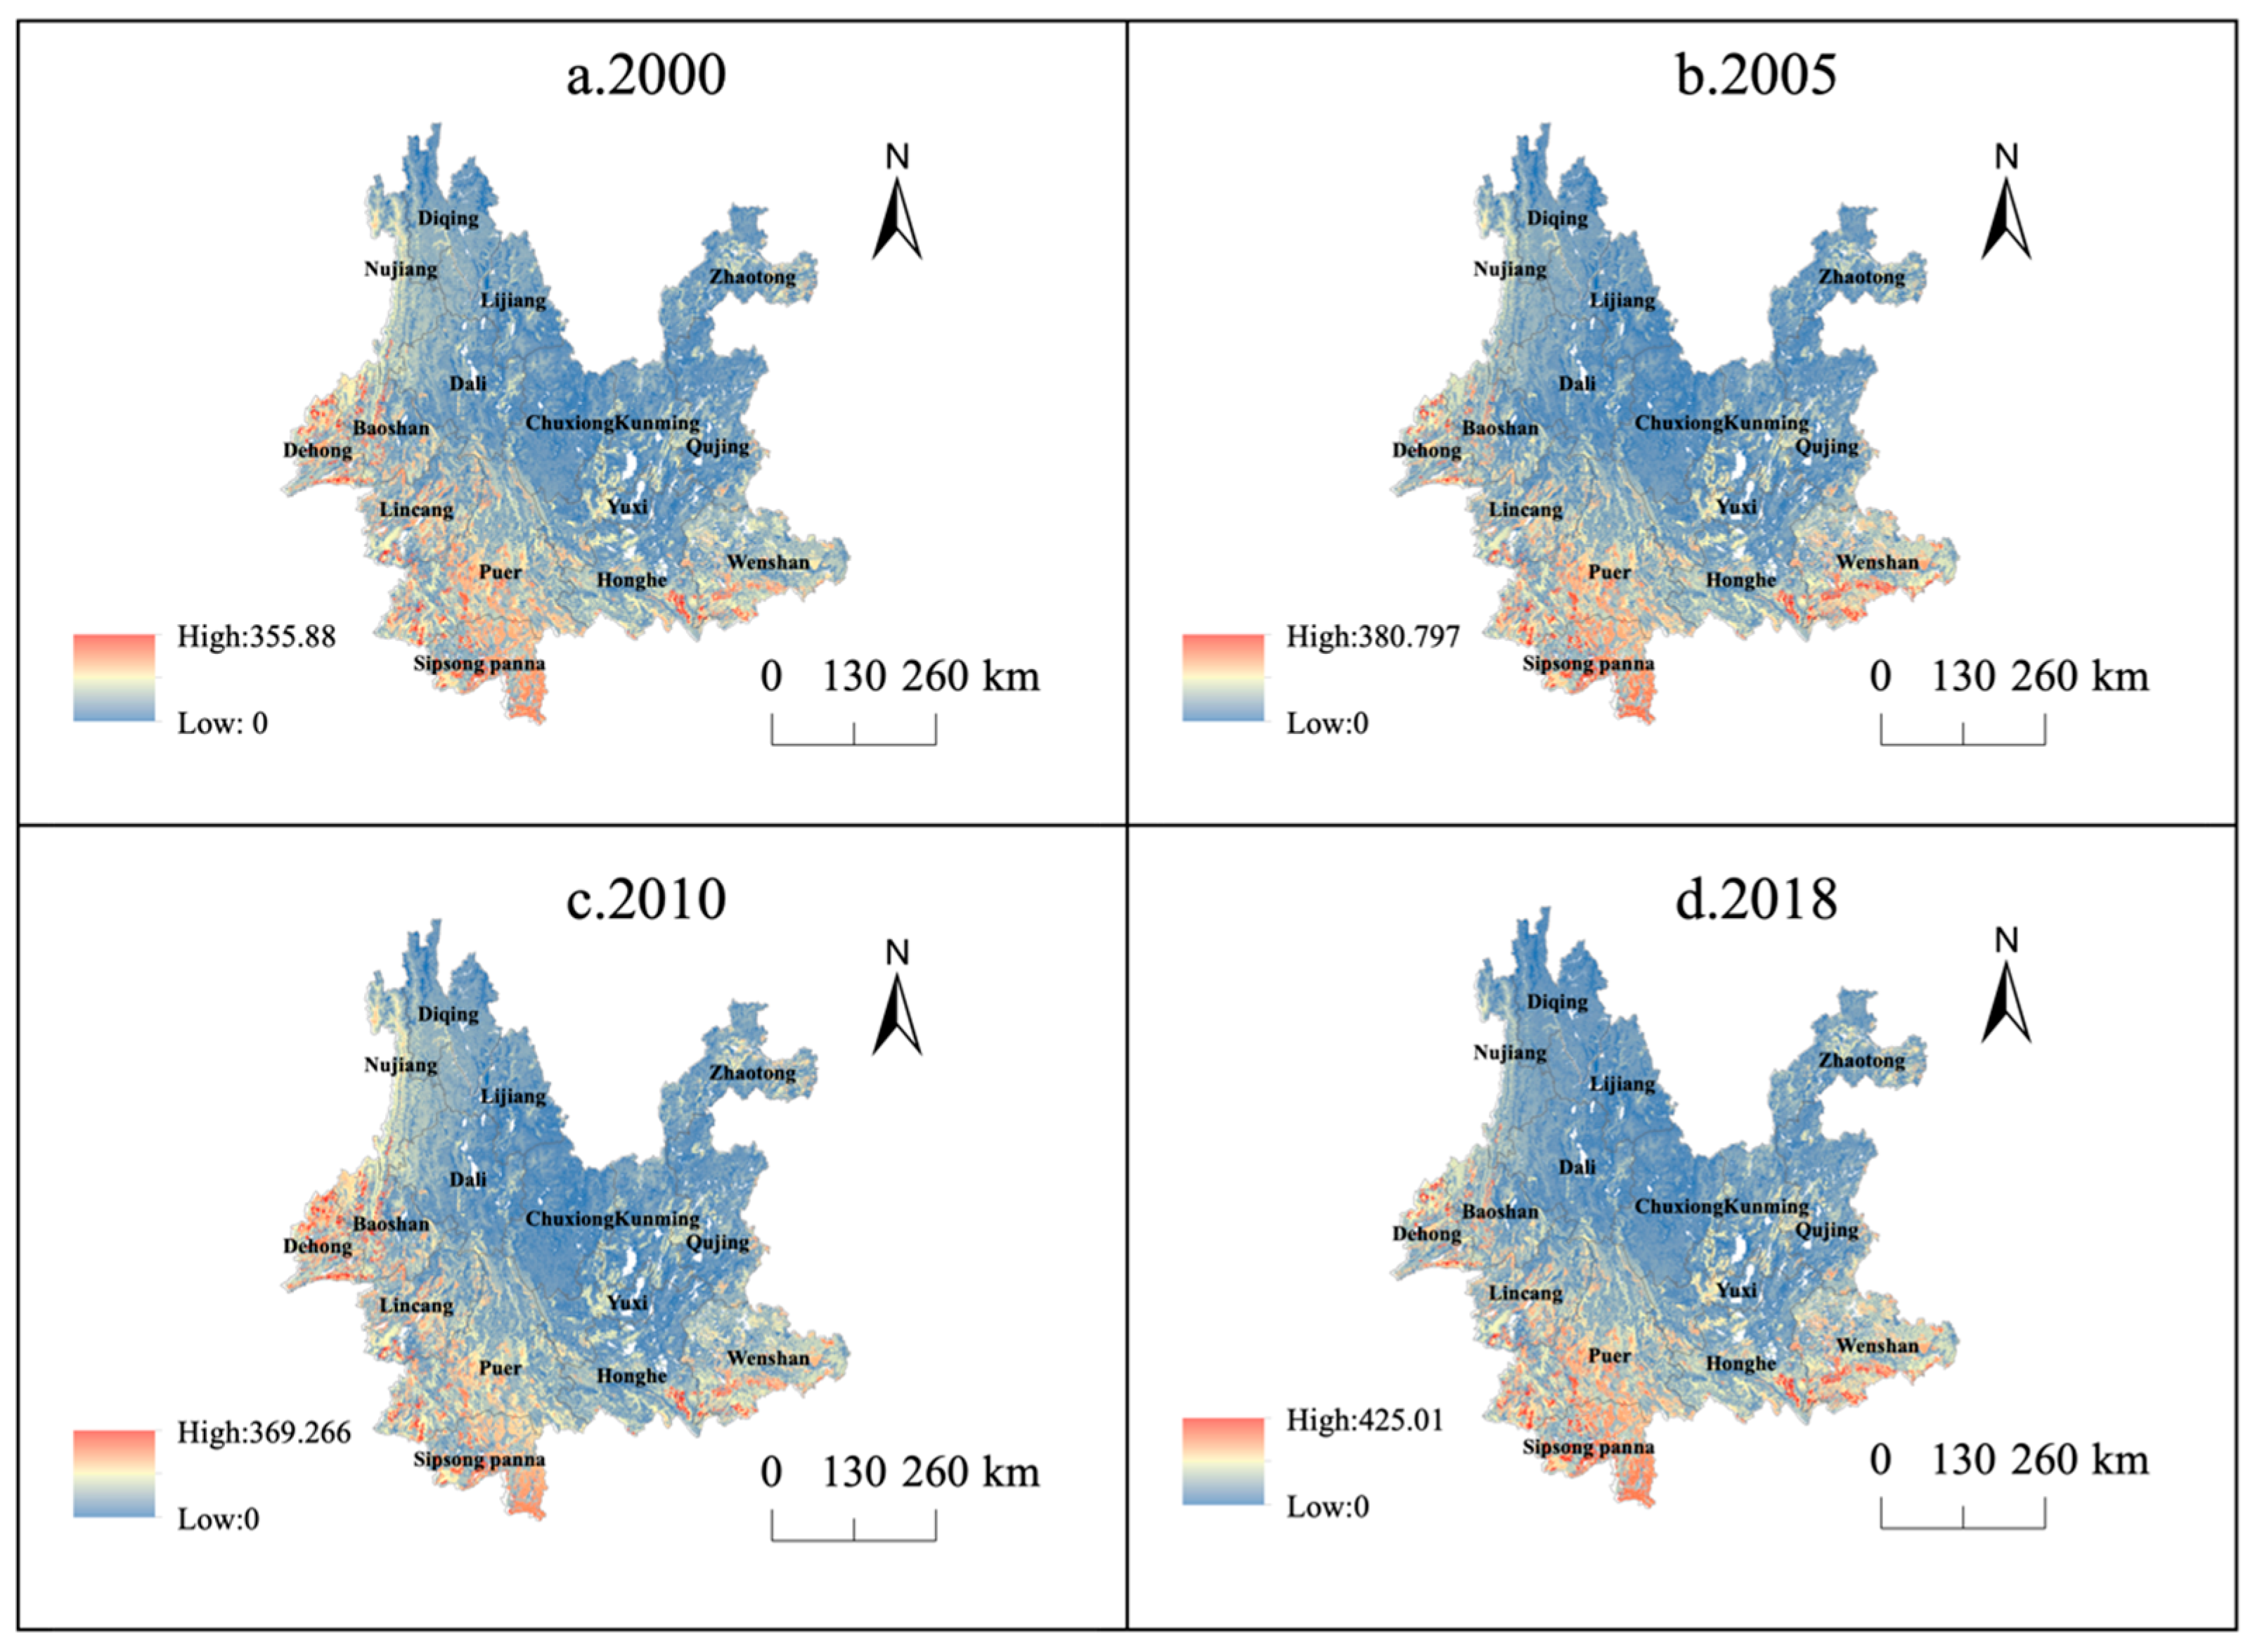
4.1. Spatial and Temporal Distribution Characteristics of Water Conservation Function in Yunnan Province
4.2. Spatial and Temporal Changes in Water Conservation Function at Different Spatial Scales
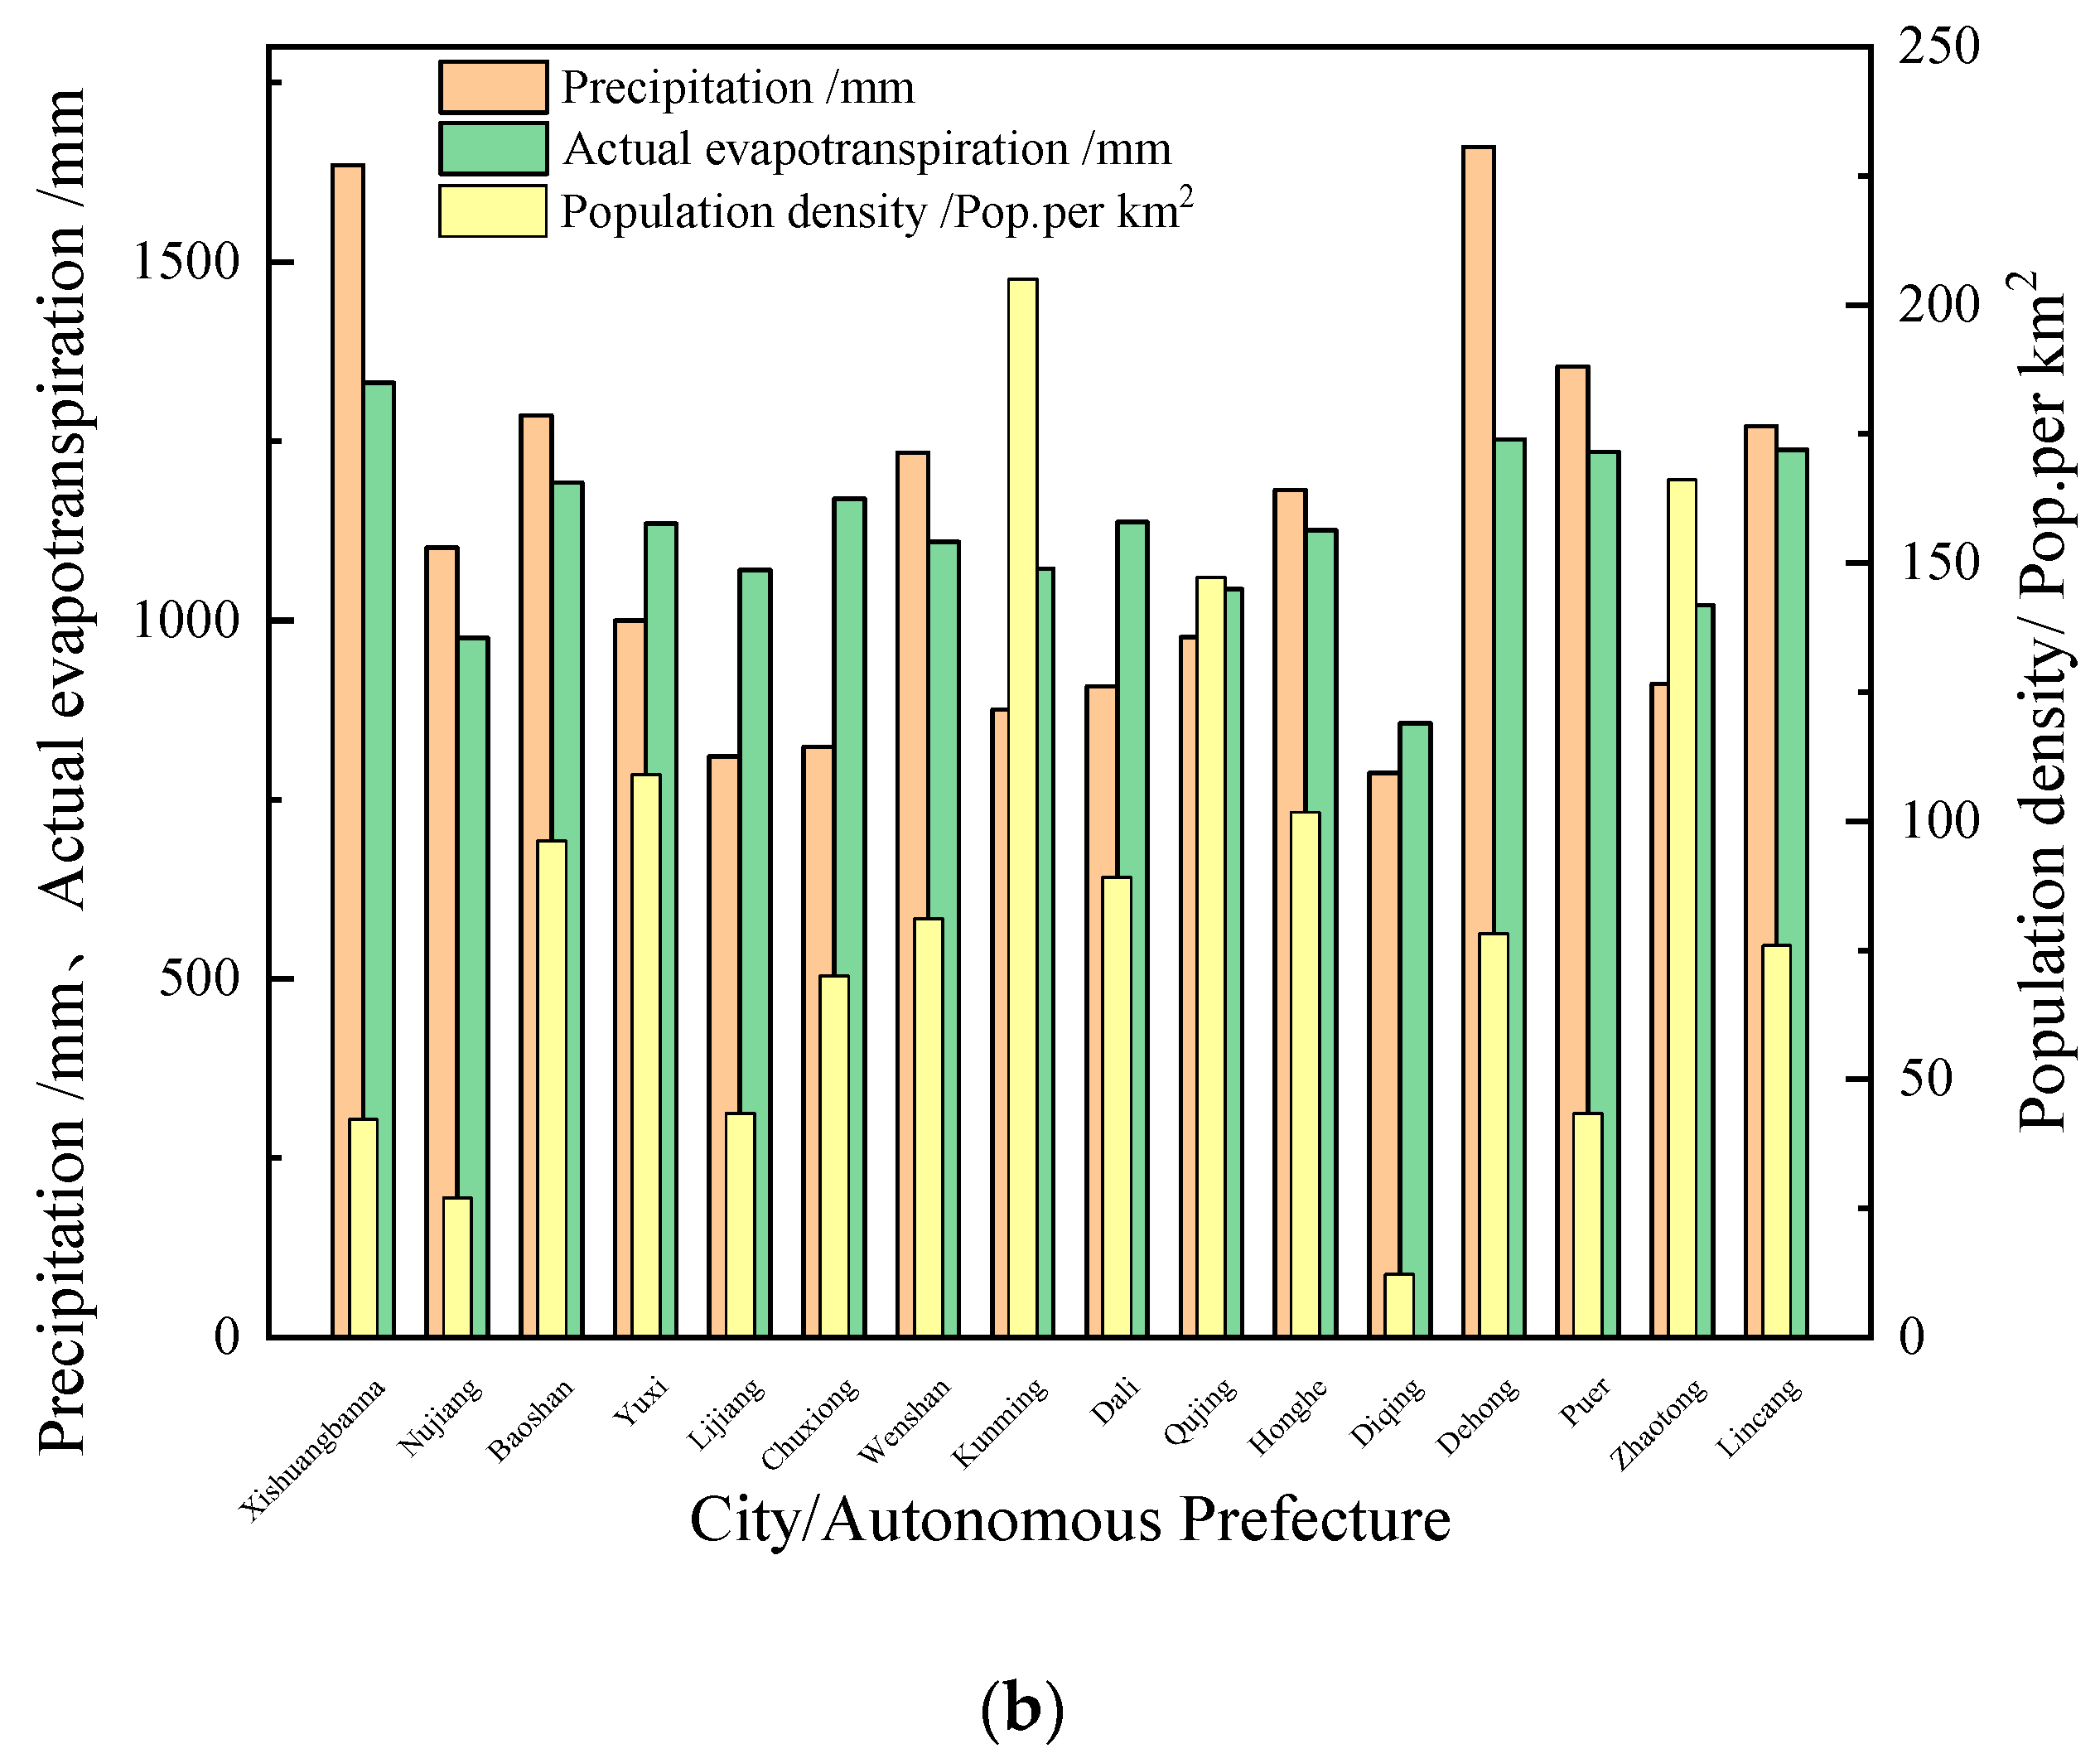
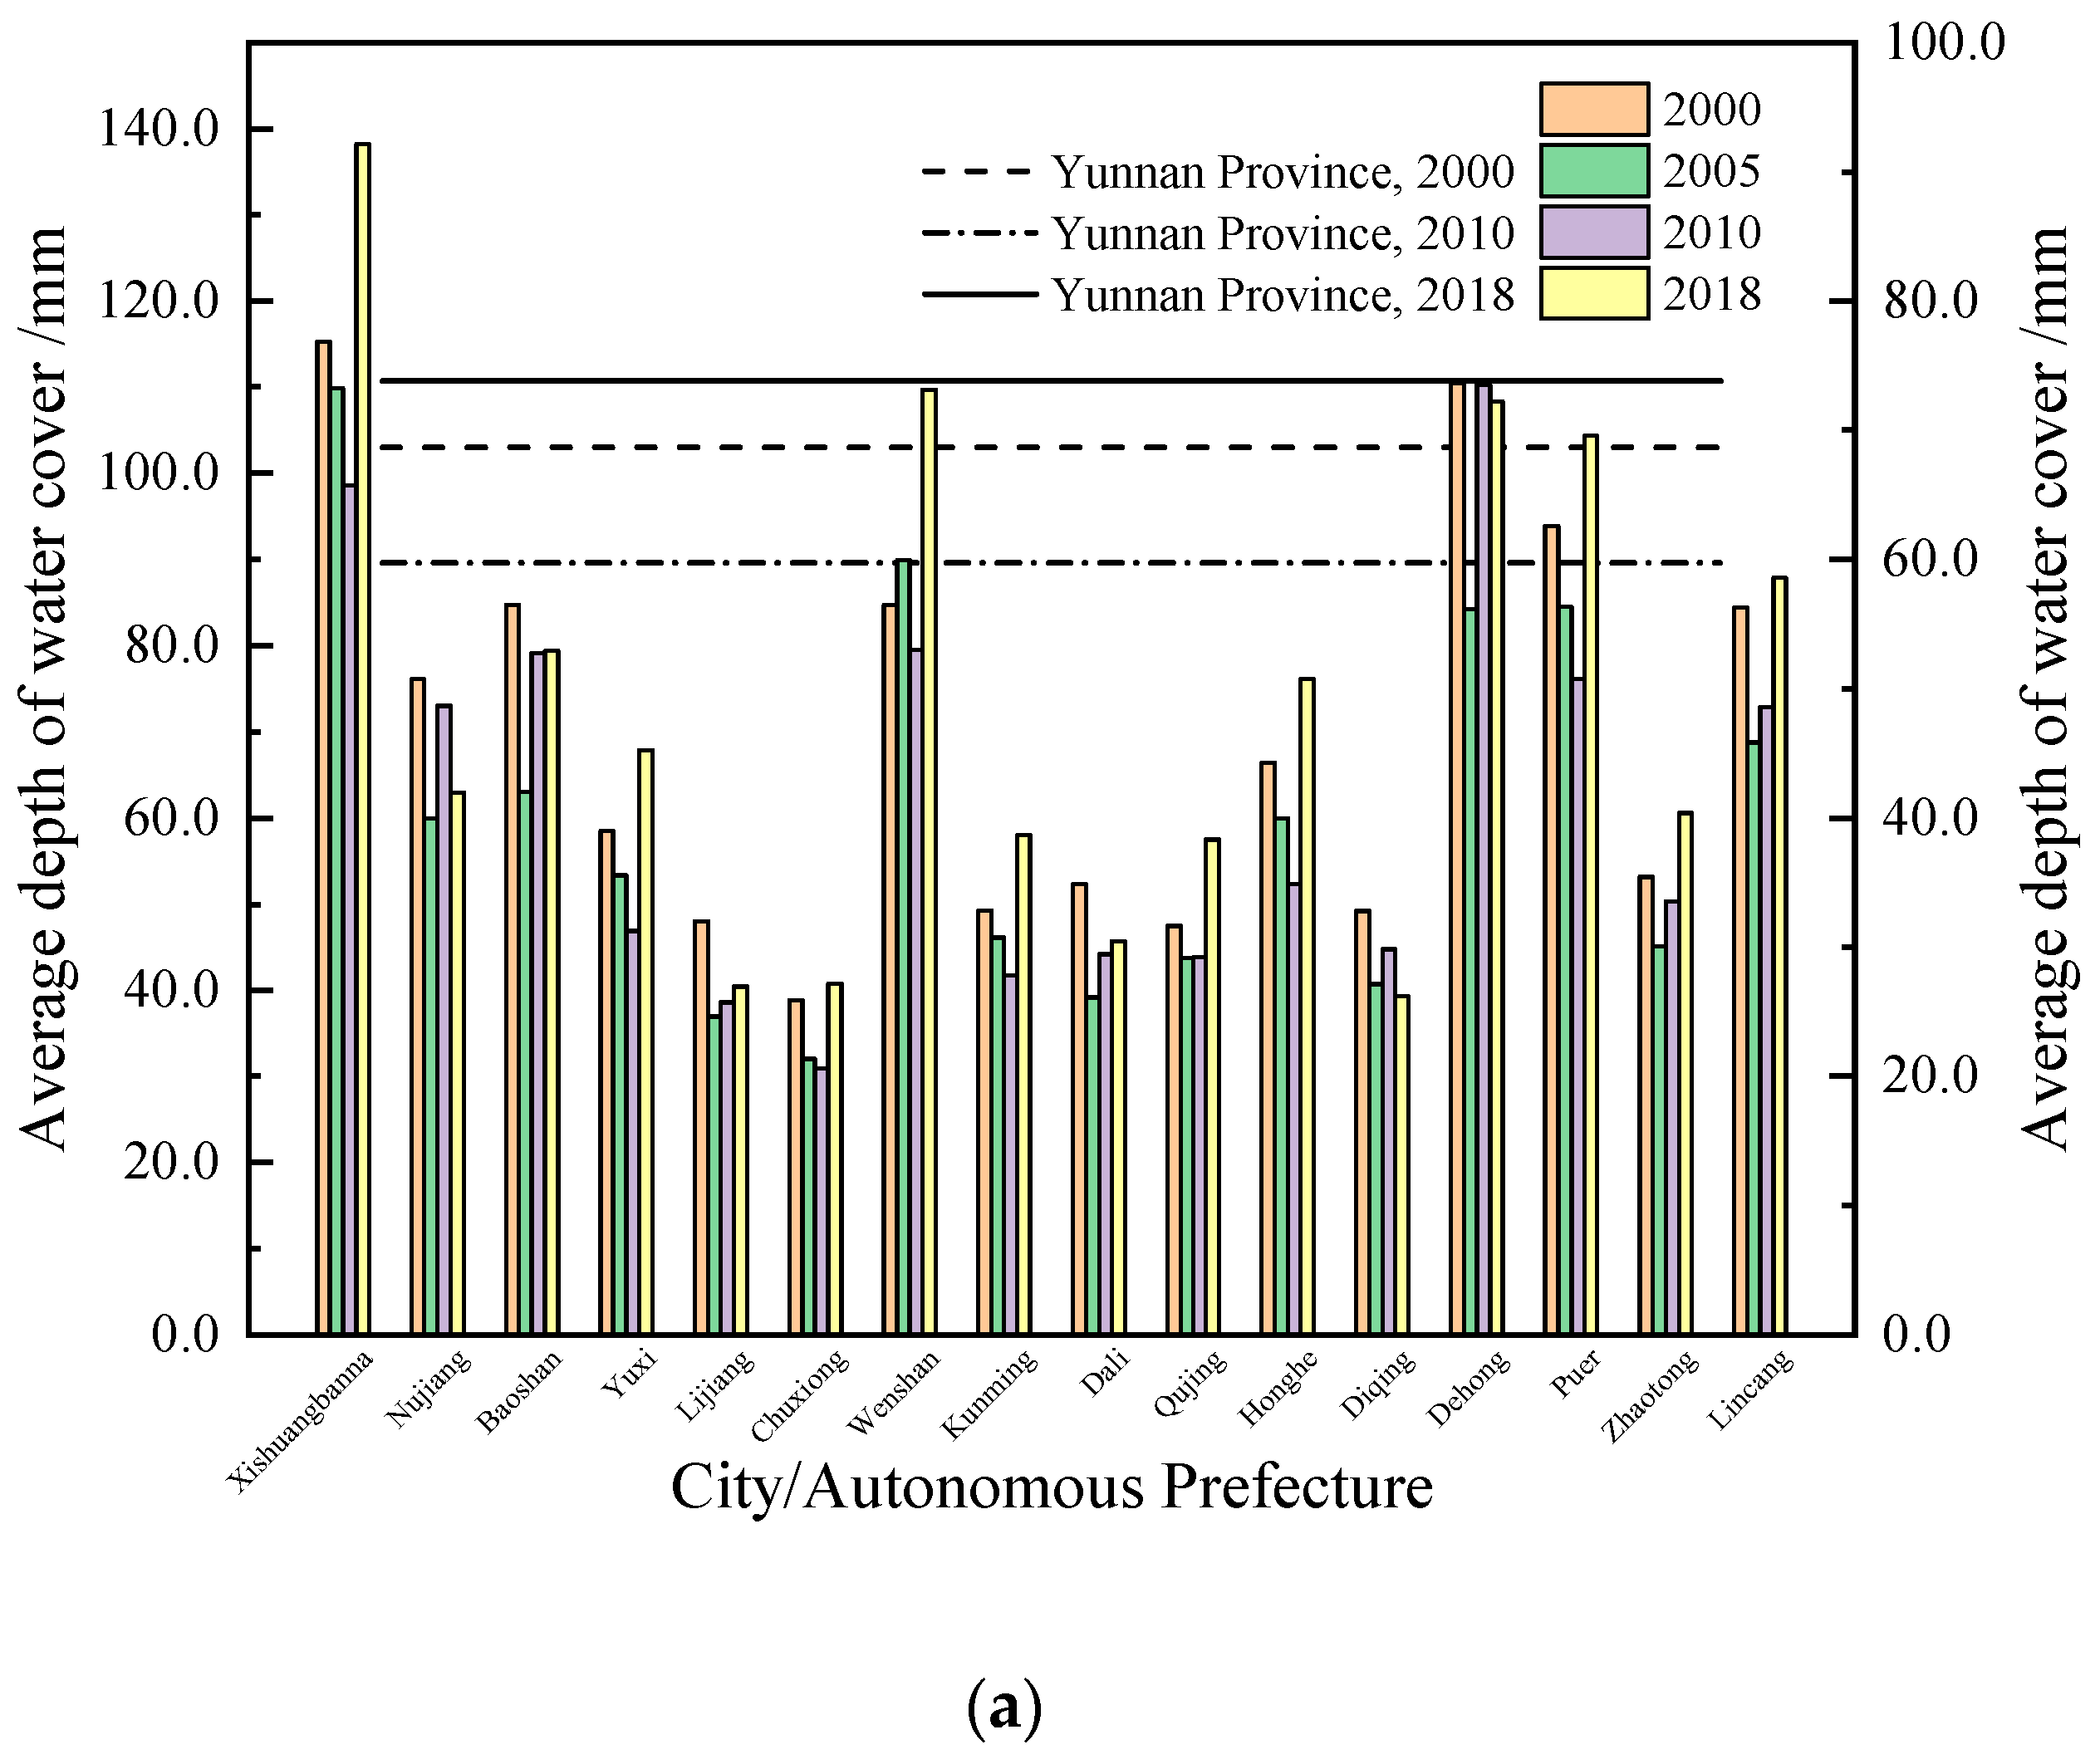
4.2.1. Average Water Conservation Depth of Different Cities and States
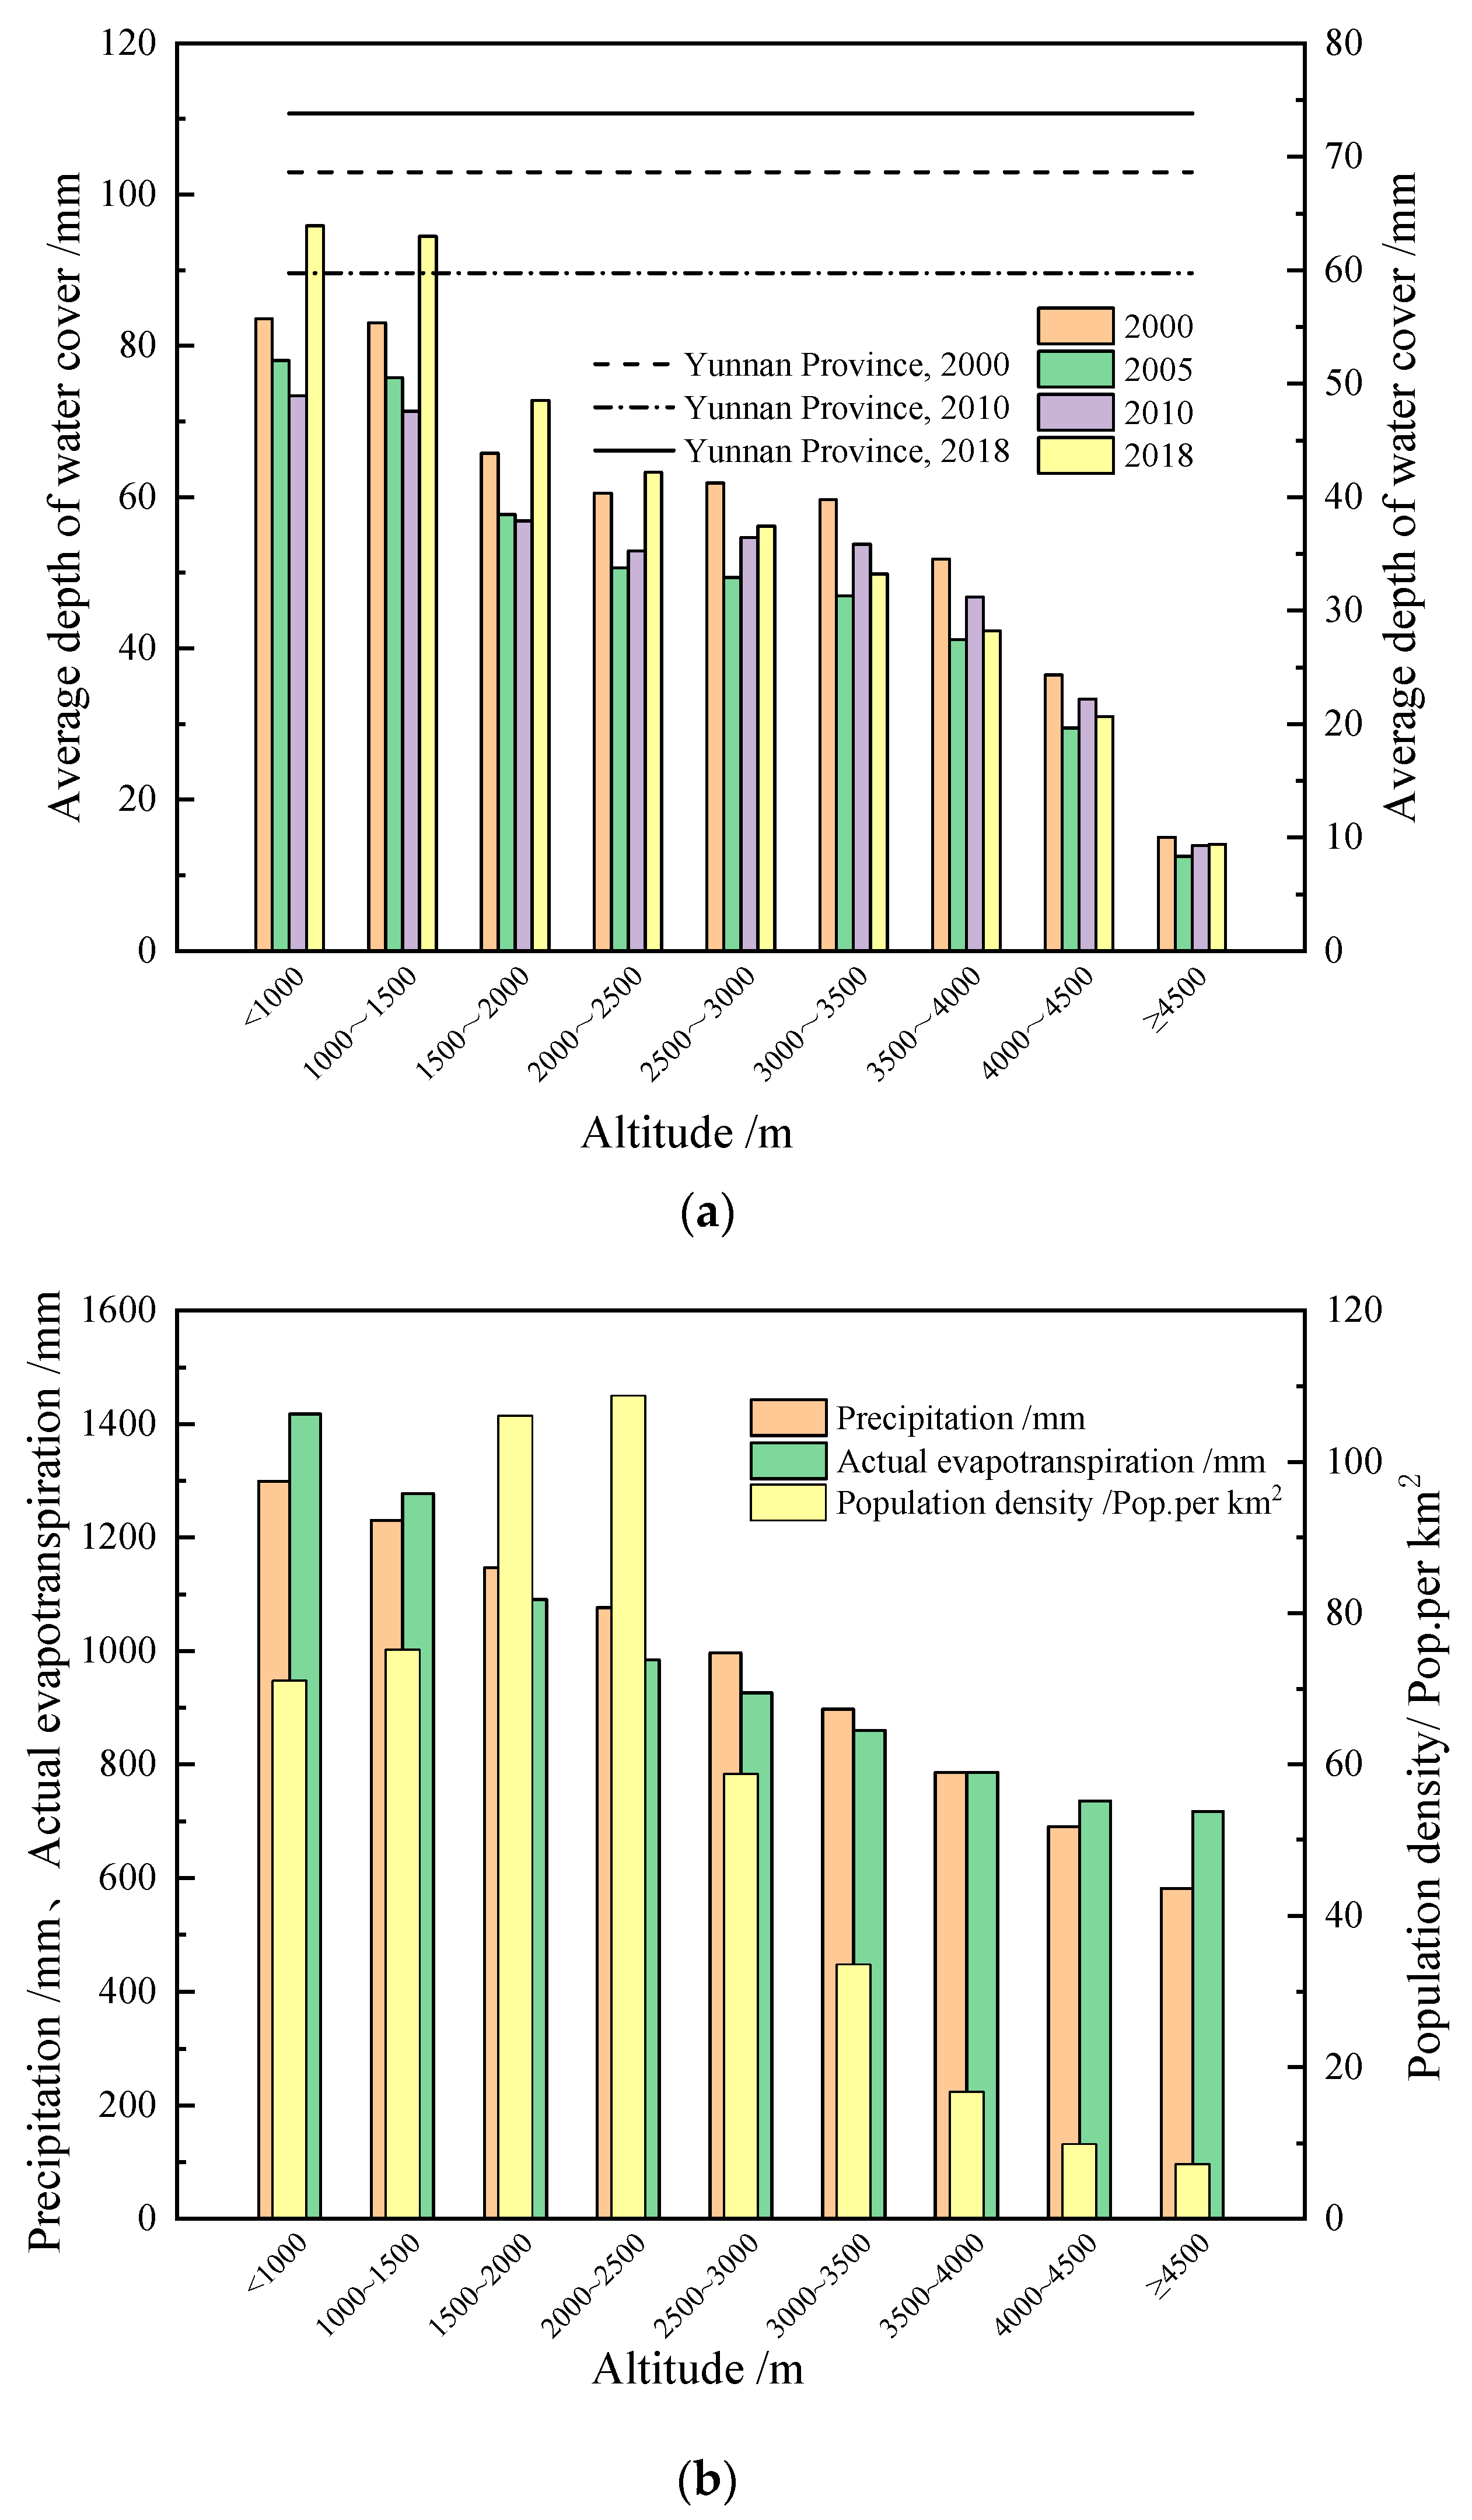
4.2.2. Average Water Conservation Depth at Different Altitudes
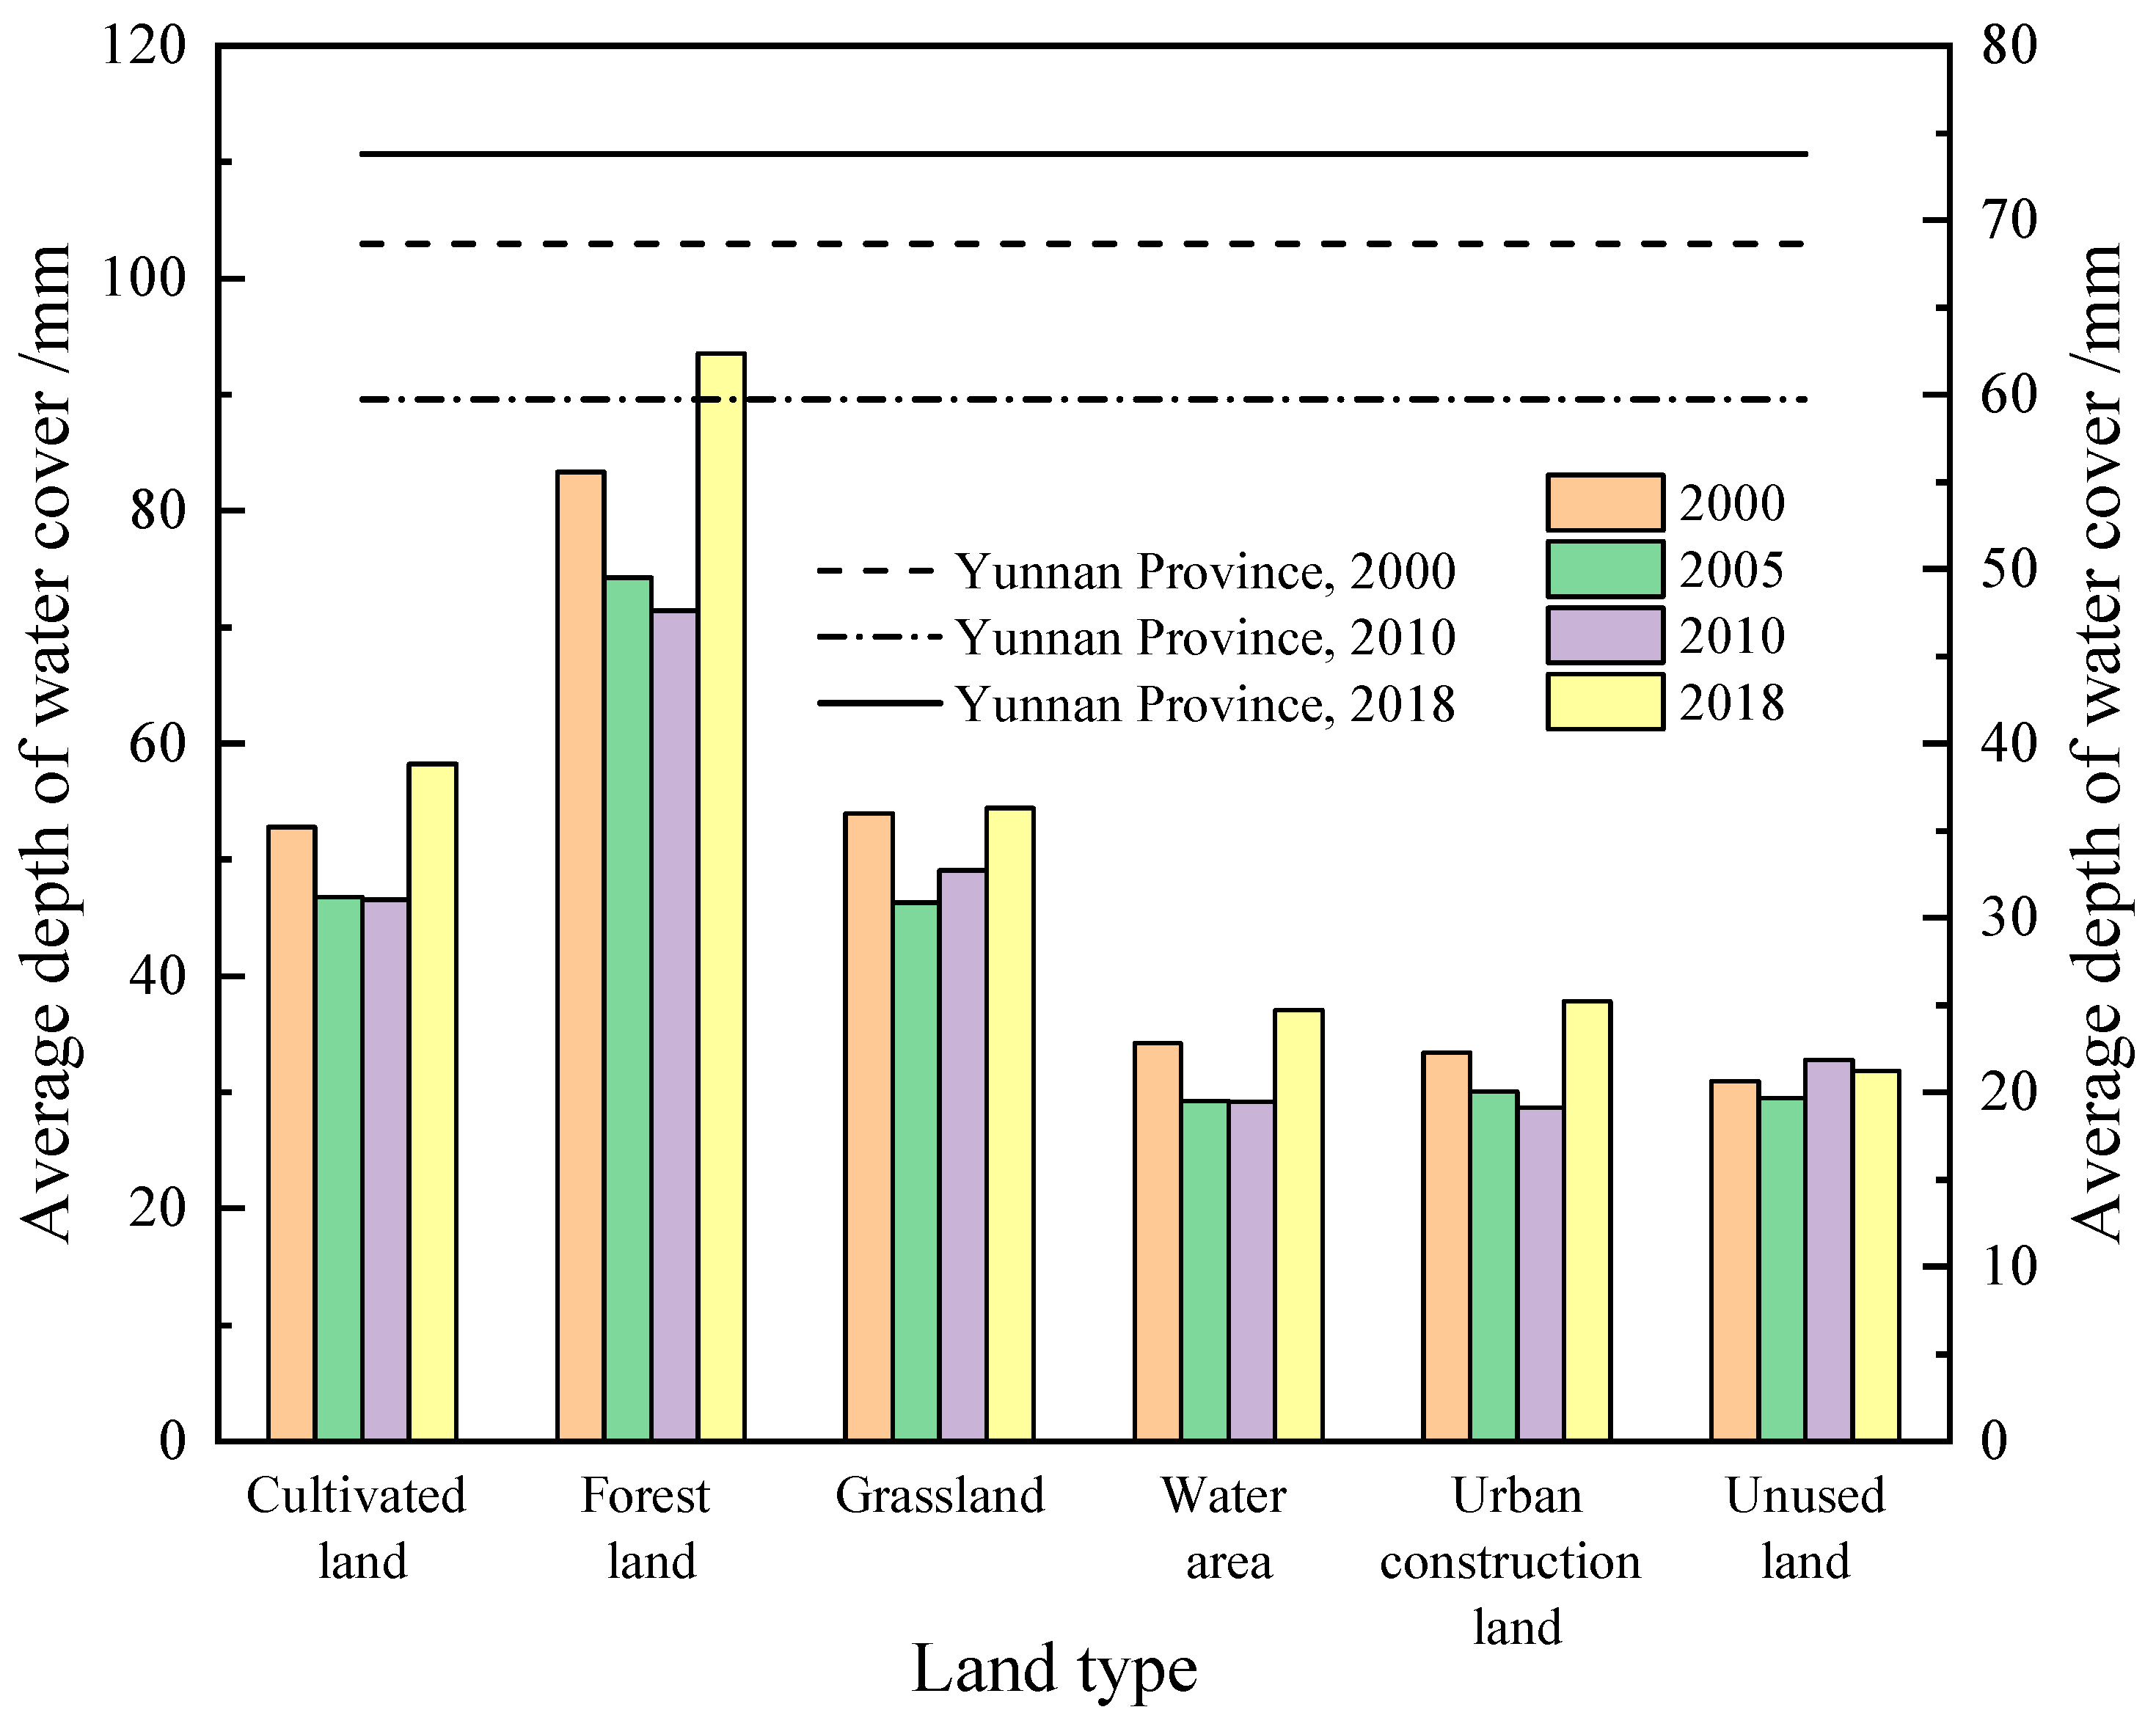
4.2.3. Average Water Conservation Capacity of Different Land Types
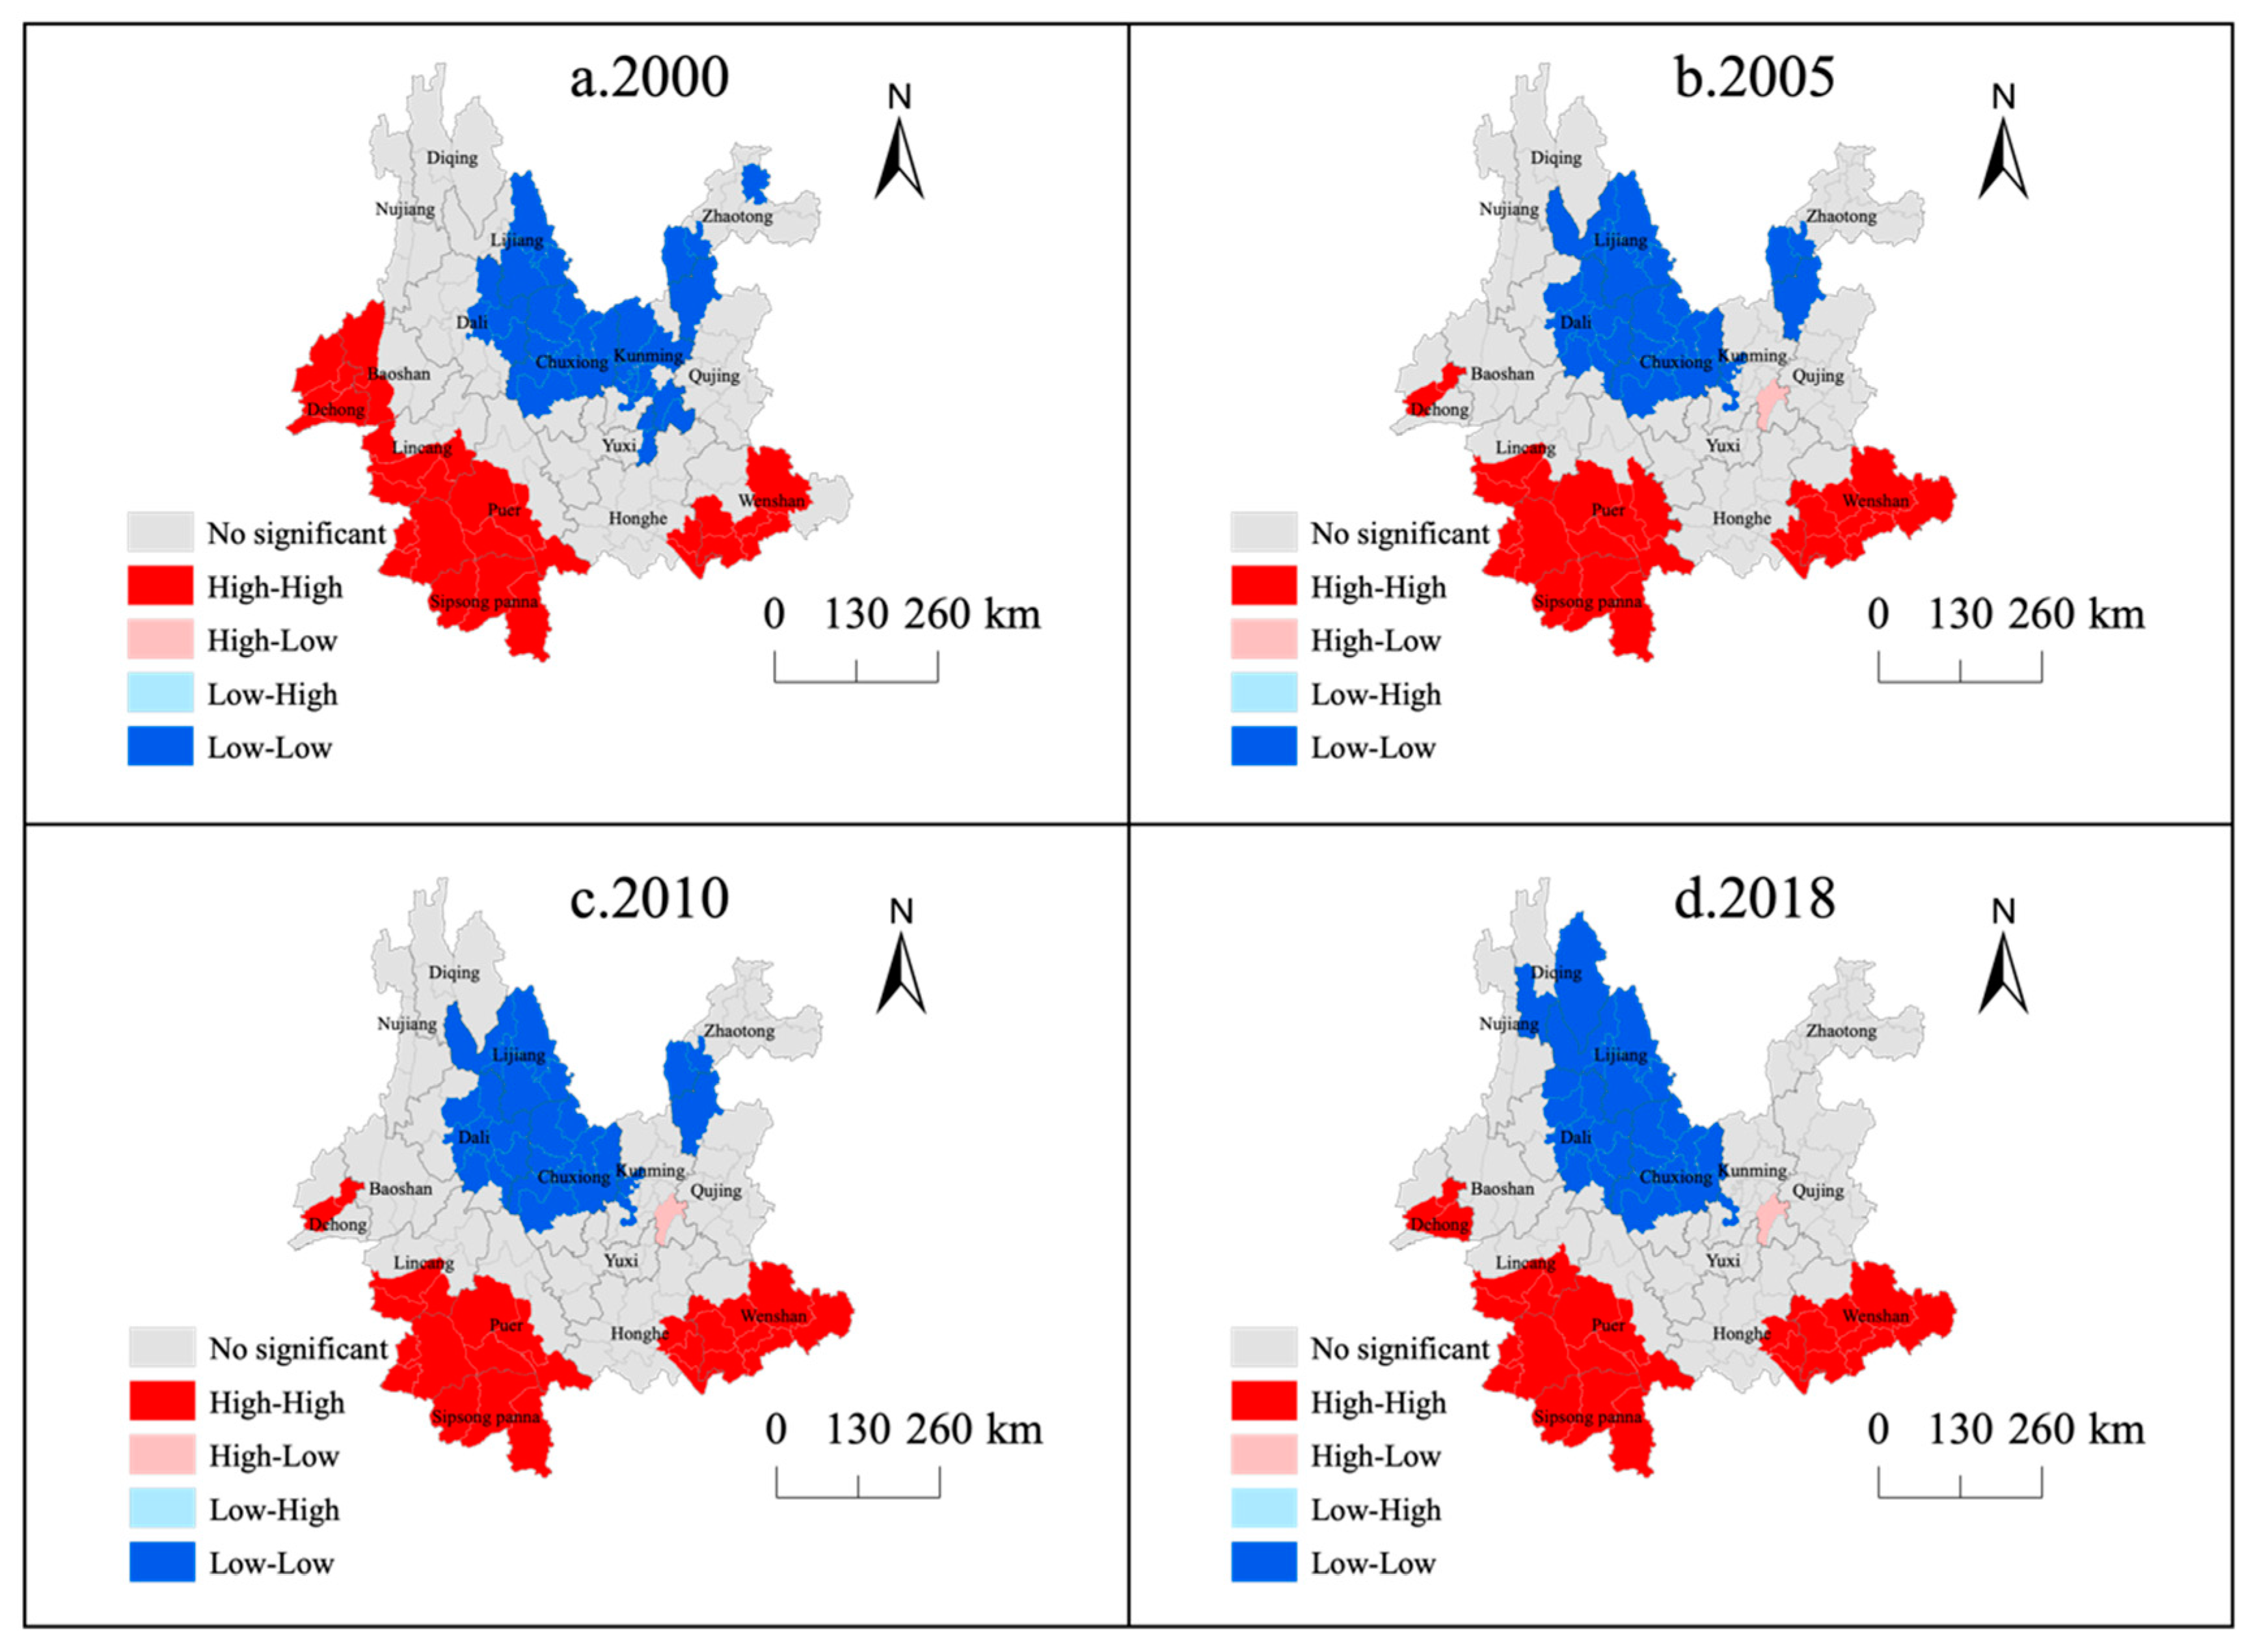
4.3. Evolution Pattern of Spatial Characteristics of Water Conservation in Yunnan Province
4.4. Geographical Exploration of Spatial Differentiation of Water Conservation in Yunnan Province
4.4.1. Construction of an Impact Factor Index System
4.4.2. Detection of Spatial Differentiation Factors of Water Conservation Function in Yunnan Province
4.4.3. Interactive Detection of Spatial Differentiation of Water Conservation in Yunnan Province
5. Discussion
- (1)
- Concerning spatial disparities, the primary efforts to enhance water conservation function in Yunnan Province should be concentrated on low-value areas, with particular emphasis on regions such as Chuxiong and Zhaotong, which have long struggled with lower conservation levels. Within the key ecological functional areas, Wuliangshan Ailaoshan Biodiversity Protection Zone should prioritize bolstering the management of water source conservation functions in the Yuxi and Honghe regions, while the preservation of biodiversity in western Yunnan should place special attention on Baoshan. In the case of the Northwest Yunnan Plateau, with the exception of Dehong, other cities and prefectures exhibit minimal improvements in both biodiversity protection and water conservation. Moreover, it is imperative to intensify the protection of water conservation function in the karst regions of Qujing and Zhaotong on the Yunnan–Guizhou Plateau.
- (2)
- Regarding the primary influencing factors, both single-factor analysis and interactive assessment consistently point to natural factors as the predominant drivers behind the spatial variations in water conservation functions, corroborating with findings from prior research [42]. Nevertheless, it is essential to acknowledge that other factors have also contributed to some extent to the spatial differentiation of water conservation functions. This is especially evident in interactive detection, highlighting that the impact of socio-economic factors on regional water source conservation function typically occurs within interactive contexts. Previous studies have identified two scenarios in Yunnan Province: resource water shortage and engineering water shortage [20]. As a result, in the ongoing trajectory of urban economic development, it is imperative to strike a balance between regional ecological functions and minimize adverse impacts on regional water source conservation as much as possible.
- (3)
- It is important to highlight that Yunnan Province’s climate types and terrain are relatively intricate, and climate data are influenced by factors such as meteorological station selection and interpolation methods. Future research should aim to enhance the precision of results by expanding the dataset and conducting comparisons among various interpolation techniques. In terms of factor analysis, this study does not offer specific explanations for different terrains and climate zones. Subsequent research could employ geographic detectors to identify these zones and delve into the primary influencing factors within each zone, facilitating more accurate water conservation function protection planning. Additionally, considering data availability, this study did not incorporate indicators such as soil type, vegetation type, and landscape fragmentation in the selection of variables. Therefore, the indicator system for assessing the spatial differentiation of water conservation functions in Yunnan Province requires further refinement. Furthermore, the study faces challenges in understanding how land use structure impacts the spatial variations in water source conservation. Although this study assigns values to different water source conservation types based on existing research, these parameters are not localized to a significant extent, which introduces a level of uncertainty into the research results. Subsequent efforts should aim to address this aspect of the research for greater accuracy.
6. Conclusions
Author Contributions
Funding
Data Availability Statement
Acknowledgments
Conflicts of Interest
References
- Dai, E.F.; Wang, Y.H. Spatial heterogeneity and attribution analysis of water production services in hengduan mountains. Acta Geogr. Sin. 2020, 75, 607–619. [Google Scholar]
- Braat, L.C.; de Groot, R. The ecosystem services agenda:bridging the worlds of natural science and economics, conservation and development, and public and private policy. Ecosyst. Serv. 2012, 1, 4–15. [Google Scholar] [CrossRef]
- MA (Millennium Ecosystem Assessment). Ecosystems and Human Well-Being; Island Press: Washington, DC, USA, 2005. [Google Scholar]
- Cademus, R.; Escobedo, F.J.; McLaughlin, D.; Abd-Elrahman, A. Analyzing Trade-Offs, Synergies, and Drivers among Timber Production, Carbon Sequestration, and Water Yield in Pinus elliotii Forests in Southeastern USA. Forests 2014, 5, 1409–1431. [Google Scholar] [CrossRef]
- Peng, J.; Wang, A.; Luo, L.; Liu, Y.; Li, H.; Hu, Y.; Meersmans, J.; Wu, J. Spatial identification of conservation priority areas for urban ecological land: An approach based on water ecosystem services. Land Degrad. Dev. 2019, 30, 683–694. [Google Scholar] [CrossRef]
- Bai, Y.; Ochuodho, T.O.; Yang, J. Impact of land use and climate change on water-related ecosystem services in Kentucky, USA. Ecol. Indic. 2019, 102, 51–64. [Google Scholar] [CrossRef]
- Milly, P.C.D.; Dunne, K.A.; Vecchia, A.V. Global pattern of trends in streamflow and water availability in a changing climate. Nature 2005, 438, 347–350. [Google Scholar] [CrossRef]
- Luo, Y.; Lü, Y.; Fu, B.; Zhang, Q.; Li, T.; Hu, W.; Comber, A. Half century change of interactions among ecosystem services driven by ecological restoration: Quantification and policy implications at a watershed scale in the Chinese Loess Plateau. Sci. Total Environ. 2018, 651, 2546–2557. [Google Scholar] [CrossRef]
- Babbar, D.; Areendran, G.; Sahana, M.; Sarma, K.; Raj, K.; Sivadas, A. Assessment and prediction of carbon sequestration using Markov chain and InVEST model in Sariska Tiger Reserve, India. J. Clean. Prod. 2020, 278, 123333. [Google Scholar] [CrossRef]
- Long, H.; Liu, Y.; Hou, X.; Li, T.; Li, Y. Effects of land use transitions due to rapid urbanization on ecosystem services: Implications for urban planning in the new developing area of China. Habitat Int. 2014, 44, 536–544. [Google Scholar] [CrossRef]
- Su, S.; Wan, C.; Li, J.; Jin, X.; Pi, J.; Zhang, Q.; Weng, M. Economic benefit and ecological cost of enlarging tea cultivation in subtropical China: Characterizing the trade-off for policy implications. Land Use Policy 2017, 66, 183–195. [Google Scholar] [CrossRef]
- Hu, Y.; Peng, J.; Liu, Y.; Tian, L. Integrating ecosystem services trade-offs with paddy land-to-dry land decisions: A scenario approach in Erhai Lake Basin, southwest China. Sci. Total Environ. 2018, 625, 849–860. [Google Scholar] [CrossRef] [PubMed]
- Jin, T.; Yan, L.; Wang, S.; Gong, J. Spatiotemporal Variation in Ecological Risk on Water Yield Service via Land-Use and Climate Change Simulations: A Case Study of the Ziwuling Mountainous Region, China. Front. Environ. Sci. 2022, 10, 908057. [Google Scholar] [CrossRef]
- Liu, D.Q.; Cao, E.J.; Zhang, J.Q.; Gong, J.; Yan, L. Spatial-temporal patterns and influencing factors of water conservation services in Bailong River Basin, Gansu Province. J. Nat. Resour. 2020, 35, 1728–1743. (In Chinese) [Google Scholar] [CrossRef]
- Lyu, R.; Zhao, W.; Pang, J.; Tian, X.; Zhang, J.; Wang, N. Towards a sustainable nature reserve management: Using Bayesian network to quantify the threat of disturbance to ecosystem services. Ecosyst. Serv. 2022, 58, 101483. [Google Scholar] [CrossRef]
- Wang, Y.; Dai, E.; Ma, L.; Yin, L. Spatiotemporal and influencing factors analysis of water yield in the Hengduan mountain region. J. Nat. Resour. 2020, 35, 371–386. (In Chinese) [Google Scholar]
- Lv, Y.; Hu, J.; Sun, F.; Zhang, L. Water conservation and hydrologic regulation: Hydrological services in terrestrial ecosystems. Acta Ecol. Sin. 2015, 35, 5191. [Google Scholar] [CrossRef]
- Zuo, Q.T.; Wang, J.Y.; Yang, F.; Song, Q.X. Analysis of water conservation related concepts and calculation method of water conservation capacity. Adv. Water Conserv. Hydropower Sci. Technol. 2022, 42, 13–19. (In Chinese) [Google Scholar]
- Malinga, R.; Gordon, L.J.; Jewitt, G.; Lindborg, R. Mapping ecosystem services across scales and continents—A review. Ecosyst. Serv. 2015, 13, 57–63. [Google Scholar] [CrossRef]
- Liu, B.; Tao, H.; Kong, B.; He, B. Research on the water resource security and its temporal-spatial distribution of Yunnan Province, China. J. Nat. Resour. 2014, 29, 454–465. (In Chinese) [Google Scholar]
- Francesconi, W.; Srinivasan, R.; Pérez-Miñana, E.; Willcock, S.P.; Quintero, M. Using the Soil and Water Assessment Tool (SWAT) to model ecosystem services: A systematic review. J. Hydrol. 2016, 535, 625–636. [Google Scholar] [CrossRef]
- Hou, W.; Gao, J. Simulating runoff generation and its spatial correlation with environmental factors in Sancha River Basin: The southern source of the Wujiang River. J. Geogr. Sci. 2019, 29, 432–448. [Google Scholar] [CrossRef]
- Zhou, F.; Xu, Y.; Chen, Y.; Xu, C.-Y.; Gao, Y.; Du, J. Hydrological response to urbanization at different spatio-temporal scales simulated by coupling of CLUE-S and the SWAT model in the Yangtze River Delta region. J. Hydrol. 2013, 485, 113–125. [Google Scholar] [CrossRef]
- Bao, Y.B.; Li, T.; Liu, H.; Ma, T.; Wang, H.X.; Liu, K.; Shen, X.; Liu, X.H. Spatial and temporal changes of water conservation of Loess Plateau in northern Shaanxi province by InVEST model. Geogr. Res. 2016, 35, 664–676. (In Chinese) [Google Scholar]
- Wu, J.; Li, Y.H.; Huang, L.Y.; Lu, Z.; Yu, D.; Zhou, L.; Dai, L. Spatial and temporal distribution pattern of water yield and its driving factors in Northeast China. Chin. J. Ecol. 2017, 36, 3216–3223. (In Chinese) [Google Scholar] [CrossRef]
- Marquès, M.; Bangash, R.F.; Kumar, V.; Sharp, R.; Schuhmacher, M. The impact of climate change on water provision under a low flow regime: A case study of the ecosystems services in the Francoli river basin. J. Hazard. Mater. 2013, 263, 224–232. [Google Scholar] [CrossRef] [PubMed]
- Pessacg, N.; Flaherty, S.; Brandizi, L.; Solman, S.; Pascual, M. Getting water right: A case study in water yield modelling based on precipitation data. Sci. Total Environ. 2015, 537, 225–234. [Google Scholar] [CrossRef]
- Bateman, I.J.; Harwood, A.R.; Mace, G.M.; Watson, R.T.; Abson, D.J.; Andrews, B.; Binner, A.; Crowe, A.; Day, B.H.; Dugdale, S.; et al. Bringing Ecosystem Services into Economic Decision-Making: Land Use in the United Kingdom. Science 2013, 341, 45–50. [Google Scholar] [CrossRef]
- Wu, W.Q.; Luo, X.; Huang, W. Research on the Water Resources Carrying Capacity and Its Temporal-Spatial Distribution Characteristics in Yunnan Province, China. Resour. Environ. Yangtze River Basin 2018, 27, 1517–1524. (In Chinese) [Google Scholar] [CrossRef]
- Fang, Z.; Ding, T.; Chen, J.; Xue, S.; Zhou, Q.; Wang, Y.; Wang, Y.; Huang, Z.; Yang, S. Impacts of land use/land cover changes on ecosystem services in ecologically fragile regions. Sci. Total Environ. 2022, 831, 154967. [Google Scholar] [CrossRef]
- Zhang, C.; Li, W.; Zhang, B.; Liu, M. Water yield of Xitiaoxi River Basin based on InVEST modeling. J. Resour. Ecol. 2012, 3, 50–54. [Google Scholar] [CrossRef]
- Bivand, R.S.; Wong, D.W.S. Comparing implementations of global and local indicators of spatial association. TEST 2018, 27, 716–748. [Google Scholar] [CrossRef]
- Shen, J.; Zhang, N.; Gexigeduren; He, B.; Liu, C.-Y.; Li, Y.; Zhang, H.-Y.; Chen, X.-Y.; Lin, H. Construction of a GeogDetector-based model system to indicate the potential occurrence of grasshoppers in Inner Mongolia steppe habitats. Bull. Èntomol. Res. 2015, 105, 335–346. [Google Scholar] [CrossRef] [PubMed]
- Wang, J.; Xu, C. Geodetector: Principle and prospect. Acta Geogr. Sin. 2017, 72, 219–231. (In Chinese) [Google Scholar] [CrossRef]
- Liu, J.Y.; Ning, J.; Kuang, W.H. Spatio-temporal patterns and new characteristics of land use change in China from 2010 to 2015. Acta Geogr. Sin. 2018, 73, 789–802. (In Chinese) [Google Scholar] [CrossRef]
- Xu, X.; Liu, J.; Zhang, S.; Li, R.; Yan, C.; Wu, S. China Multi Period Land Use Cover Remote Sensing Monitoring Data Set (cnlucc). Data Registration and Publishing System of Resource and Environmental Science and Data Center, Chinese Academy of Sciences. Available online: https://www.resdc.cn/DOI/DOI.aspx?DOIid=54 (accessed on 4 December 2021). (In Chinese).
- Zhao, Y.R.; Zhou, J.J.; Lei, L.; Xiang, J.; Huang, M.H.; Feng, W.; Zhu, G.F.; Wei, W.; Wang, J.A. Identification of driving factors for water yield in the upper reaches of Shiyang River based on InVEST model. Chin. J. Ecol. 2019, 38, 3789–3799. (In Chinese) [Google Scholar] [CrossRef]
- Zhou, W. Distribution of available soil water capacity in China. J. Geogr. Sci. 2005, 15, 3–12. (In Chinese) [Google Scholar] [CrossRef]
- Hu, Y.X.; Yu, X.X.; Liao, W. Study on the temporal and spatial pattern of water yield and its influencing factors in the Hanjiang River Basin. Resour. Environ. Yangtze River Basin 2022, 31, 73–82. (In Chinese) [Google Scholar]
- Hu, J.; Lv, Y.H.; Zhang, K.; Tao, Y.Z.; Li, T.; Ren, Y.J. Water conservation of typical vegetation types in the Bailugou Watershed of the Qilian Mountains. Acta Ecol. Sin. 2016, 36, 3338–3349. (In Chinese) [Google Scholar]
- Ahmed, M.A.A.; Abd-Elrahman, A.; Escobedo, F.J.; Cropper, W.P.; Martin, T.A.; Timilsina, N. Spatially-explicit modeling of multi-scale drivers of aboveground forest biomass and water yield in watersheds of the Southeastern United States. J. Environ. Manag. 2017, 199, 158–171. [Google Scholar] [CrossRef]
- Dong, X.Y.; Lu, Y. Temporal and spatial variation of precipitation and its impact on distribution pattern of water resources in Yunnan Province. Popul. Resour. Environ. China 2017, 27 (Suppl. S2), 140–144. (In Chinese) [Google Scholar]
- Peng, W.F.; Zhang, D.M.; Luo, Y.M.; Tao, S.; Xu, X. Analysis of vegetation NDVI variation in Sichuan Province based on natural factors. Acta Geogr. Sin. 2019, 74, 1758–1776. (In Chinese) [Google Scholar] [CrossRef]
- Delphin, S.; Escobedo, F.; Abd-Elrahman, A.; Cropper, W. Urbanization as a land use change driver of forest ecosystem services. Land Use Policy 2016, 54, 188–199. [Google Scholar] [CrossRef]


| Data Required | Data Source |
|---|---|
| Land Use | Downloaded from the Data Center for Resource and Environmental Sciences, Chinese Academy of Sciences [35,36] (https://www.resdc.cn/ (accessed on 4 December 2021)), including 4 periods of data in 2000, 2005, 2010 and 2018, with a spatial resolution of 100 m × 100 m. |
| Precipitation | Source from China Meteorological Data Network (https://data.cma.cn/ (accessed on 4 December 2021)) Monthly precipitation data from 2000 to 2018 were obtained by spatial interpolation using the meteorological software ANUSPLIN 4.1. |
| Potential evapotranspiration | Solar radiation data from the World Climate website (https://www.worldclim.org/ (accessed on 4 December 2021)), Temperature data from China Weather Data Network (https://data.cma.cn/ (accessed on 4 December 2021)), Calculated using Modified-Hargreaves formula. |
| Maximum soil depth | Soil depth data of Yunnan Province was extracted from the 1:1 million soil database of the Cold and Arid Zone Scientific Data Center, with a spatial resolution of 1 km. |
| Root depth | Referring to existing studies, the CSV table of root depth was constructed by land use/cover type as a unit [25,37]. |
| Plant available water content (PAWC) | The sand, powder, clay and organic carbon contents of the study area were extracted from the 1:1 million soil database of the Cold and Arid Zone Scientific Data Center, and PAWC was the difference between the field water holding capacity and the permanent wilting coefficient, both of which were calculated by the empirical equation [38]. |
| Soil saturation hydraulic conductivity | Soil data sets in the study area were extracted based on the Chinese soil data set mask, and the saturated hydraulic conductivity of the soil was calculated using the field calculator in the attribute table. |
| Basin Data | Extraction based on DEM data using the ArcGIS hydrological analysis tool. |
| DEM | Source from Geospatial Data Cloud (http://www.gscloud.cn (accessed on 4 December 2021)). |
| Flow rate coefficient | Reference model parameter table data [24]. |
| Terrain Index | Calculated from soil depth, percentage of slope and catchment area. |
| Percentage slope | Based on the ArcGIS spatial analysis and DEM calculation. |
| NDVI | MOD13Q1 satellite data, spatial resolution 1 km (http://www.ntsg.umt.edu (accessed on 4 December 2021)). |
| NPP | MOD17A3 dataset (http://www.ntsg.umt.edu (accessed on 4 December 2021)). |
| Population density, GDP | Yunnan Provincial Statistical Yearbook and Yunnan County and municipal government portals. |
| Distance from town | Euclidean distance calculation using ArcGIS. |
| Zhang factor | Z represents the seasonal characteristic value of precipitation, the study area belongs to the monsoon climate zone, precipitation is concentrated in summer, Z value is taken as 1 [31]. |
| Year | 2000 | 2005 | 2010 | 2018 |
|---|---|---|---|---|
| Moran’s I | 0.524 | 0.239 | 0.535 | 0.533 |
| Z-value | 876.35 | 56.36 | 376.84 | 1130.18 |
| p-value | 0.0000 | 0.0000 | 0.0000 | 0.0000 |
| Tier 1 Indicators | Secondary Indicators | Tertiary Indicators | Specific Indicators |
|---|---|---|---|
| Natural Environment | Climate factors | X1 | Average annual precipitation |
| X2 | Actual evaporation amount | ||
| Terrain factor | X3 | DEM | |
| Ecological factors | X4 | NPP | |
| X5 | NDVI | ||
| Socio-economic | Economic level | X6 | GDP |
| Social Development | X7 | Population density | |
| Traffic Location | X8 | Distance from town | |
| Land Use | X9 | Land Use Change |
| Factor | 2000 | 2010 | 2018 | ||||
|---|---|---|---|---|---|---|---|
| q-Value | q-Value Sorting | q-Value | q-Value Sorting | q-Value | q-Value Sorting | ||
| Natural Environment | Precipitation | 0.766 | 1 | 0.822 | 1 | 0.784 | 1 |
| Evaporation volume | 0.279 | 5 | 0.233 | 5 | 0.192 | 5 | |
| DEM | 0.434 | 4 | 0.402 | 4 | 0.532 | 2 | |
| NPP | 0.603 | 2 | 0.590 | 2 | 0.530 | 3 | |
| NDVI | 0.579 | 3 | 0.442 | 3 | 0.446 | 4 | |
| Socio-economic | GDP | 0.143 | 7 | 0.114 | 7 | 0.028 | 9 |
| Population density | 0.028 | 9 | 0.025 | 9 | 0.035 | 8 | |
| Distance from town | 0.103 | 8 | 0.054 | 8 | 0.071 | 7 | |
| Land Use | 0.152 | 6 | 0.120 | 6 | 0.112 | 6 | |
| Factor | 2000–2010 | 2010–2018 | 2000–2018 | ||||
|---|---|---|---|---|---|---|---|
| q-Value | q-Value Sorting | q-Value | q-Value Sorting | q-Value | q-Value Sorting | ||
| Natural Environmen | Precipitation change | 0.827 | 1 | 0.857 | 1 | 0.893 | 1 |
| Evapotranspiration change | 0.404 | 3 | 0.668 | 2 | 0.531 | 2 | |
| NPP change | 0.411 | 2 | 0.299 | 3 | 0.160 | 3 | |
| Socio-economic | GDP change | 0.101 | 4 | 0.044 | 4 | 0.011 | 6 |
| Population density change | 0.021 | 5 | 0.039 | 5 | 0.047 | 5 | |
| Change in distance from town | 0.005 | 7 | 0.013 | 7 | 0.004 | 7 | |
| Land use change | 0.006 | 6 | 0.023 | 6 | 0.060 | 4 | |
| 2000 | 2010 | 2018 | ||||||
|---|---|---|---|---|---|---|---|---|
| Reciprocal Factor | q-Value | Type | Reciprocal Factor | q-Value | Type | Reciprocal Factor | q-Value | Type |
| X1∩X6 | 0.811 | BE | X1∩X2 | 0.871 | BE | X1∩X7 | 0.829 | NE |
| X1∩X4 | 0.808 | BE | X1∩X7 | 0.851 | BE | X1∩X9 | 0.826 | BE |
| X1∩X5 | 0.807 | BE | X1∩X3 | 0.848 | BE | X1∩X4 | 0.826 | BE |
| X1∩X9 | 0.803 | BE | X1∩X5 | 0.845 | BE | X1∩X8 | 0.824 | BE |
| X1∩X2 | 0.798 | BE | X1∩X8 | 0.843 | BE | X1∩X5 | 0.815 | BE |
| X1∩X8 | 0.796 | BE | X1∩X9 | 0.843 | BE | X1∩X6 | 0.812 | BE |
| X1∩X7 | 0.793 | BE | X1∩X6 | 0.840 | BE | X1∩X2 | 0.808 | BE |
| X1∩X3 | 0.793 | BE | X1∩X4 | 0.836 | BE | X1∩X3 | 0.799 | BE |
| X4∩X5 | 0.718 | BE | X3∩X4 | 0.711 | BE | X3∩X4 | 0.764 | BE |
| X4∩X2 | 0.716 | BE | X4∩X8 | 0.687 | NE | X3∩X8 | 0.667 | NE |
| 2000–2010 | 2010–2018 | 2000–2018 | ||||||
|---|---|---|---|---|---|---|---|---|
| Reciprocal Factor | Q-Value | Type | Reciprocal Factor | q-Value | Type | Reciprocal Factor | q-Value | Type |
| X1∩X2 | 0.875 | BE | X1∩X2 | 0.911 | BE | X1∩X8 | 0.922 | NE |
| X1∩X9 | 0.860 | NE | X1∩X8 | 0.889 | BE | X1∩X9 | 0.919 | NE |
| X1∩X6 | 0.858 | BE | X1∩X6 | 0.887 | BE | X1∩X4 | 0.912 | BE |
| X1∩X8 | 0.844 | NE | X1∩X9 | 0.886 | NE | X1∩X6 | 0.909 | BE |
| X1∩X4 | 0.839 | BE | X1∩X4 | 0.875 | BE | X1∩X2 | 0.906 | BE |
| X1∩X7 | 0.837 | BE | X1∩X7 | 0.871 | BE | X1∩X7 | 0.903 | BE |
| X2∩X4 | 0.668 | BE | X2∩X4 | 0.770 | BE | X2∩X4 | 0.660 | BE |
| X2∩X6 | 0.546 | NE | X2∩X8 | 0.739 | BE | X2∩X9 | 0.644 | NE |
| X2∩X9 | 0.530 | BE | X2∩X7 | 0.711 | BE | X2∩X8 | 0.637 | NE |
| X4∩X8 | 0.507 | NE | X2∩X6 | 0.705 | BE | X2∩X6 | 0.601 | NE |
Disclaimer/Publisher’s Note: The statements, opinions and data contained in all publications are solely those of the individual author(s) and contributor(s) and not of MDPI and/or the editor(s). MDPI and/or the editor(s) disclaim responsibility for any injury to people or property resulting from any ideas, methods, instructions or products referred to in the content. |
© 2023 by the authors. Licensee MDPI, Basel, Switzerland. This article is an open access article distributed under the terms and conditions of the Creative Commons Attribution (CC BY) license (https://creativecommons.org/licenses/by/4.0/).
Share and Cite
Qin, Z.; Yang, J.; Qiu, M.; Liu, Z. Spatial-Temporal Distribution and the Influencing Factors of Water Conservation Function in Yunnan, China. Appl. Sci. 2023, 13, 11720. https://doi.org/10.3390/app132111720
Qin Z, Yang J, Qiu M, Liu Z. Spatial-Temporal Distribution and the Influencing Factors of Water Conservation Function in Yunnan, China. Applied Sciences. 2023; 13(21):11720. https://doi.org/10.3390/app132111720
Chicago/Turabian StyleQin, Zhuo, Jiameng Yang, Mengyuan Qiu, and Zhiyong Liu. 2023. "Spatial-Temporal Distribution and the Influencing Factors of Water Conservation Function in Yunnan, China" Applied Sciences 13, no. 21: 11720. https://doi.org/10.3390/app132111720
APA StyleQin, Z., Yang, J., Qiu, M., & Liu, Z. (2023). Spatial-Temporal Distribution and the Influencing Factors of Water Conservation Function in Yunnan, China. Applied Sciences, 13(21), 11720. https://doi.org/10.3390/app132111720