1. Introduction
1.1. General Context
Floods are the most widespread and disastrous weather-related natural disaster. Among the meteorological factors that can trigger a flood, the recurring ones are intense or prolonged precipitation, snow melting, or factors related to the direct or indirect action of mankind, such as the breaking of dams or dikes. It should also be considered that floods can occur in a few minutes or a longer period and can last for weeks, with disastrous consequences that can last for years [
1]. Flood risks are projected to increase globally because of the action of humanity, which affects the phenomenon of flooding, such as the factors that accelerate global warming and chaotic urban development [
2,
3,
4,
5]. When such floods occur, rapid mapping and keeping under observation will be vital for stakeholders in assessing the impact (authorities and especially the directly affected people) and coordinating disaster relief efforts. The speed of monitoring and obtaining useful information can often be the difference between life and death for dozens, hundreds, or even thousands of victims. However, the traditional methods of monitoring and prediction are often expensive, dangerous, and impractical.
The most serious event in the area studied in this paper, which took place with the Someș River and was the main actor, took place 52 years ago when, due to heavy rainfall, the river burst its banks, flooding roads, railways, and fields. The most affected towns in the Cluj area were Dej and Gherla, where the situation reached a critical point exceeding 8 m of accumulated water, starting from the base to the surface.
The importance of the reservoirs Tarnița and Fântânele played an important role in protecting the city of Cluj-Napoca, taking over the great floods from Dej and Gherla, where Someșul Mic and Someșul Mare left incredible material and human damage.
1.2. The Purpose of the Present Study
The purpose of this paper is to develop a complete workflow, which includes all the stages to accomplish a simulation in the case of the increase in the water flow of the Someșul Mic River. To achieve the final goal, namely, the simulation of the process of increasing the water flow, the following steps were necessary:
Creation of the topographic map for the studied area using the UAV technique.
Data processing developed following drone flight.
Preparation of documentation.
Creating a simulation to present possible disasters.
To achieve the final goal, it was necessary to consider all logistical, physical, and material elements, starting from the journey to the place where the follow-up study was to be conducted, the necessary equipment for its realization, and the specialized topographic equipment to the calculation of the necessary financial resources.
The inundability study has as its main purpose prevention against the dangers to which residents living in buildings in areas with high vulnerability from the point of view of placement may be exposed. It is our duty, as geodetic engineers, to support the institutions responsible for the safety and proper functioning of things. The purpose of the work is to fulfill a civic needs that our society needs.
The need for this research topic lies on the fact that previous works in the field have, in most cases, separated the aspect of taking geospatial data from the field from the aspect of processing these data with the help of GIS software and flood simulation software (for example, HEC-RAS 6.4.1.). Thus, in the case of this paper, a complete working model is proposed that covers all the phases necessary for the acquisition, processing, and use of the spatial information necessary for emergency interventions in the case of flooding, simulation, and forecasting of floods.
This study does not aim to replace other methods of conducting inundation studies, but to complement them with a new approach, considering the fact that each of the alternative methods also presents disadvantages that will be further discussed in the
Section 4.
On the other hand, the importance of this study also derives from the studied area, which presents particularities related to a location in the proximity of a large city, in an extremely inhabited area—the new urban area—on the bank of a river with a considerable flood potential. The study area around the dam on the Somes River was chosen because this area represents the most sensitive and interesting study area along the Somes River, due to the potential for direct and immediate impact on a vast number of inhabitants (over 55,000).
To complete this workflow and create a complete methodology, the following stages were necessary:
Establishing a network of ground control points (GCP).
Obtaining details from the field.
Achievement of an orthophoto plane with the help of a drone.
Creation of a digital topographical plan.
Completing the necessary documentation.
A significant study area was chosen that is located in the town of Floresti in Cluj County. The area is located in the vicinity of the second largest city in Romania (Cluj-Napoca), which in recent years has seen intensive urban development and reaches a commune with the largest number of inhabitants in Romania.
As a result, the interest in this study has increased in recent years due to the increasingly aggressive weather phenomena, with their frequency having possible destructive effects and increasing the risk level on constructions as well as residential houses in the studied area. Rainfall has been a major problem over the years, leading to imminent disasters; this is precisely what is sought to be prevented by conducting this follow-up study. The impact and risk on an upward slope, present on the surrounding sites of the Someș River because of the increase in its water flow, were simulated in this work.
1.3. UAV (Unmanned Aerial Vehicle)
There are numerous situations in the specialized literature in which studies and simulations of inundation were conducted starting from images taken using drone technology.
There are different approaches to this research area. The first approach aims to highlight a methodology for updating data concerning a hydrodynamic model, based on data acquired with the help of drones (UAVs). The model thus proposed is also very effective in the case of the need for the online updating of risk maps in the case of floods and their timely correction [
6].
Other approaches in specialized works use artificial intelligence models to develop a model for the automatic identification of flooded buildings using UAV aerial images [
7]. There are also very useful studies that used novel ways of measuring water depth for small bodies of water, which are typically more difficult to measure using classical technology [
8]. More and more fields identify the opportunity to use drones to collect necessary data in a faster, more precise, and non-intrusive way [
9,
10,
11]. Overflowing rivers can be the cause of catastrophic floods, mainly due to their morphological characteristics. These floods can occur due to flow variations, determined by heavy rains and the lack of systematization and regulation of the riverbanks. It is therefore necessary to use combined topo-geodesic and photogrammetric data acquisition techniques to obtain images and geospatial data necessary for the automatic extraction of interesting characteristic attributes [
12].
There are different methods we can use to generate DEMs. It has been demonstrated that the use of airborne LiDAR (Light Detecting and Ranging) sensors can produce very accurate and high-resolution DEMs but with higher acquisition and processing costs than in the case of drones equipped with photogrammetric sensors [
13,
14].
A comparative approach of UAV-UAS imagery and historical satellite datasets has proven extremely useful, as satellite imagery, such as the Landsat or Sentinel archives, extends decades back in time, allowing for the evaluation of changes over a historical time interval [
15,
16,
17,
18].
Several studies have presented and discussed the opportunity of UAV LiDAR data acquisition, referring primarily to the advantage of LiDAR to penetrate vegetation, which leads to an easier classification of points on the ground, of characteristic geometries of interest in the case flood studies, or even the lack of such a classification [
19].
The recent development of tools for the study of flood behavior makes it possible to model and simulate them, as well as highlight the characteristics of the drainage network, with the help of the GIS platform, where various data sources can be introduced, analyzed, modeled, and simulated, including those made with the help of UAVs [
20,
21,
22,
23,
24]. The combination of UAVs with water-level sensors has proven useful because this approach can provide a unitary and quasi-complete vision of the history and chronology of a flood phenomenon [
25].
A careful analysis of a significant sample (about 60) of papers helped to classify the sensors needed for similar studies, highlighting terrestrial photogrammetry at 31.7% and aerial photogrammetry at 26.7%, as the most frequently used low-cost detection method [
26]. If we refer to other types of sensors that are useful for estimating and preventing the effects of floods, ground-penetrating radar can obtain, in certain conditions, accurate estimates about the soil and water [
27,
28,
29].
It thus becomes obvious that technological advances in unmanned aerial vehicles (UAVs) offer a wealth of capabilities for the efficient and orderly production of images and topographical data, which are useful in the study, modeling, simulation, and prevention of floods [
30,
31,
32,
33,
34,
35,
36].
The effectiveness of the use of UAVs in the activity of providing information necessary for monitoring, simulating, modeling, and preventing floods has been demonstrated in numerous case studies that concern various geographical areas.
Thus, The Drone Watch project brought together the commercial flood modeling and risk specialist Ambiental Ltd. (Amersfoort, The Netherlands) and UAV imagery specialists Caintech Ltd. (Inverness, UK) and the University of Leicester, Loughborough University, and Imperial College London to use UAV technology to obtain information almost in real-time about the floods that occurred after winter storms in Cumbria (UK) in the winter of 2015. The near real-time accurate mapping of the flood extent and property and infrastructure damage in urban and rural areas was required for the estimation of insurance loss and insurance claim validation [
37].
In Queensland, Australia, in 2019, and in Luxembourg in 2022, UAVs were used to obtain necessary information for accurate modeling with high-quality elevation data. Considering the nature of information retrieval, drone mapping, and photogrammetry can provide finer-resolution elevation data than can be achieved through mapping with manned aircraft [
38].
To protect the lives and livelihoods of people, The Gambia has partnered with UNESCO to establish a state-of-the-art, end-to-end early warning system for floods that relies heavily on drones. The observation area is mainly based on the drainage basin of the Gambia River, the most sensitive area from the point of view of flooding in The Gambia. This partnership with UNESCO was established because, in 2010–2018, about 35,000 Gambians were directly affected by the consequences of floods. Thus, the drones managed to quickly identify any safe sites, unsafe areas, and evacuation routes. In addition, drones help with the rapid identification of damaged and at-risk individuals in post-disaster situations [
39].
The Utah Water Research Laboratory used UAVs on 25 May 2023 to obtain information with the help of over five flight sessions that spanned 19 m. Drone imagery revealed how the floodwaters affected surrounding neighborhoods, farmland, and grassland. The data collected from drones during a flood helped fine-tune flood predictions and modeling [
40].
2. Materials and Methods
2.1. Study Area
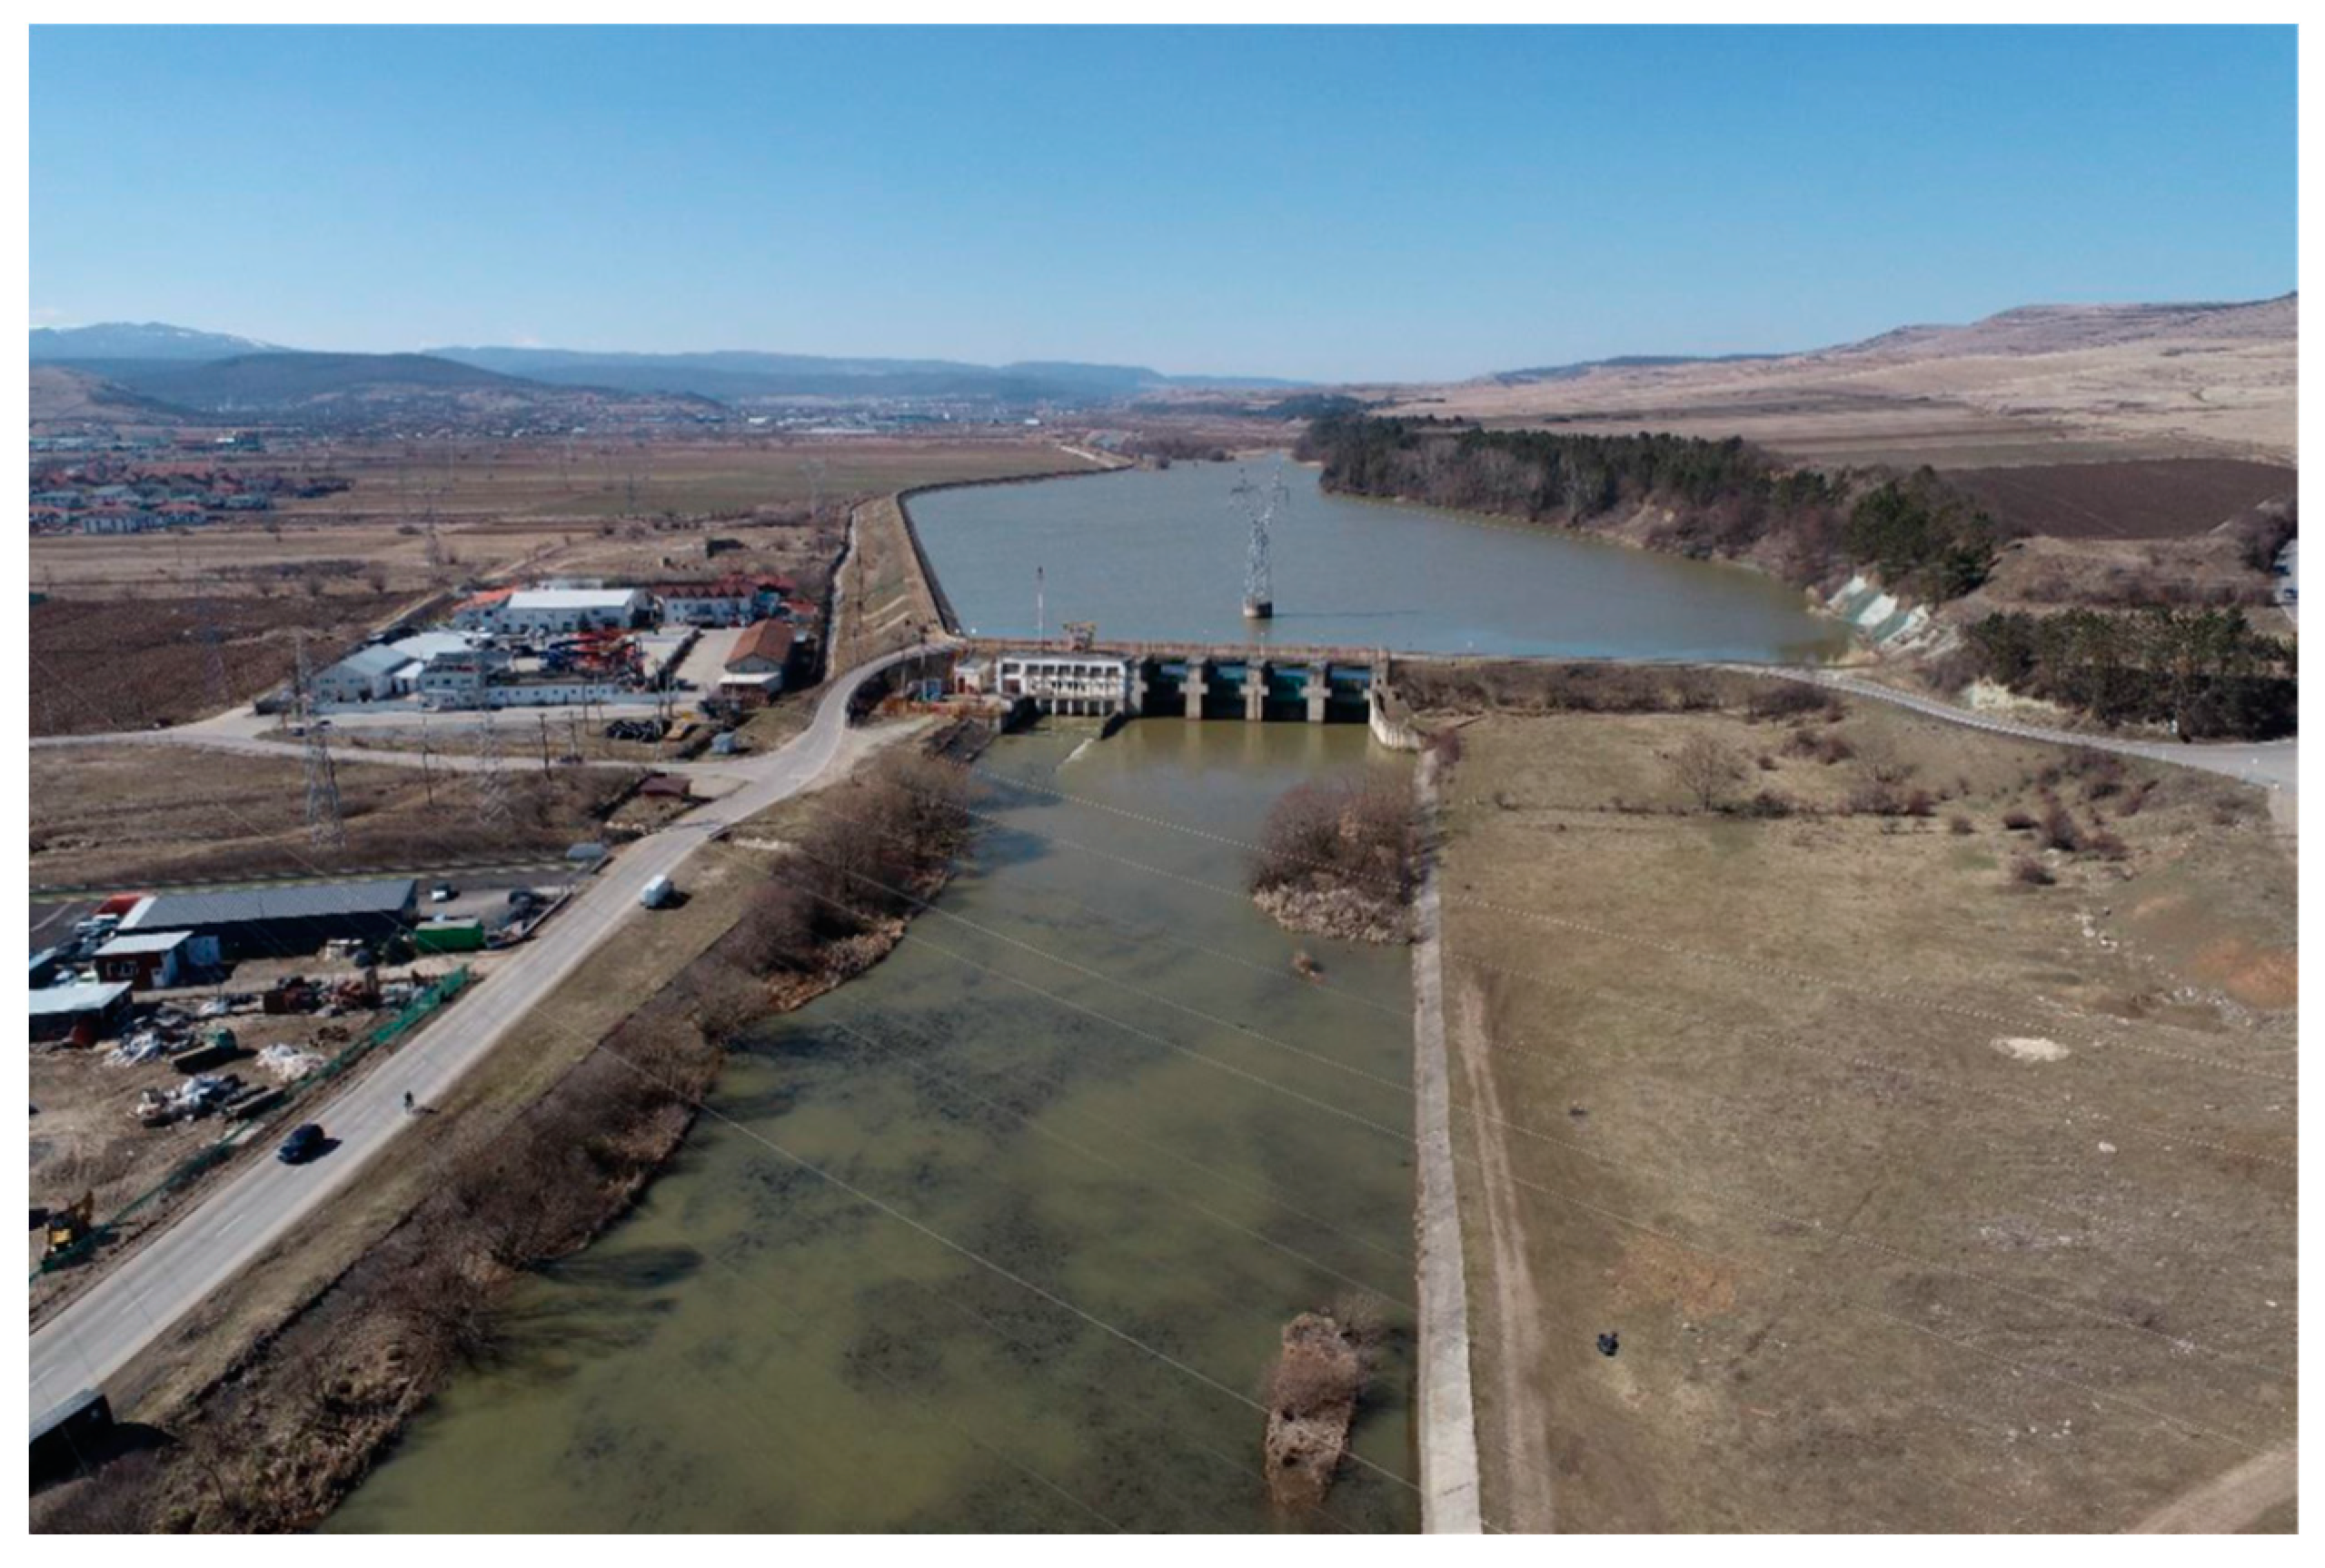
The study was conducted along the Someșul Mic River, in the Florești Commune, Cluj County. In this area, the studied river has the tributaries Capușul, Nadășul, and Borșa, each presenting large fluctuations in flow and water level. The length of the Someșul Mic River is 178 km, and it is formed by the union of two other rivers, namely, Someșul Rece and Someșul Cald (
Figure 1).
The geographical coordinates of the studied area are 47°8′41″ North Latitude and 23°54′48″ East Longitude. The course of water on the Someș-Tisa section has a moderate continental temperate climatic behavior, with its constant nature being its main characteristic. Average annual temperatures recorded along the Someș River are between 0 and 9 degrees Celsius, depending on the landform it crosses. The rain showers reach limits in the range of 1000–to 1400 mm in mountainous areas such as the Rodnei and Călimani Mountains, and in the studied area (Apuseni Mountains), they reach values in the range of 800–to 1200 mm.
2.2. Equipment Used
In Romania, accessing and using GNSS corrections from permanent stations requires access to the ROMPOS state network or another private network from the existing ones. In our case, we used the GNSS corrections received from the ROMPOS network managed by the National Cadaster and Real Estate Advertising Agency (ANCPI) [
41].
For additional precision of the results, it was necessary to coordinate the determination of ground control points (GGPs), and for this purpose, a GNSS Geomax (Geomax Widnau AG-Switzerland) Zenith 10 system with the Getac controller was used [
42]. In order to obtain a better precision of the coordinates of the points, corrections were received using the GSM modem connected to the Internet to receive the RTK (real-time kinematics) corrections. A number of six ground control points were determined, with known coordinates, three on one side and three on the other side of the river, as shown in
Table 1.
Both the number and the position of the ground control points (GCPs) were chosen taking into account the specialized literature, which describes a minimal number of 4 control points for areas smaller than 20 hectares, as is the case of this study area [
43,
44,
45,
46,
47].
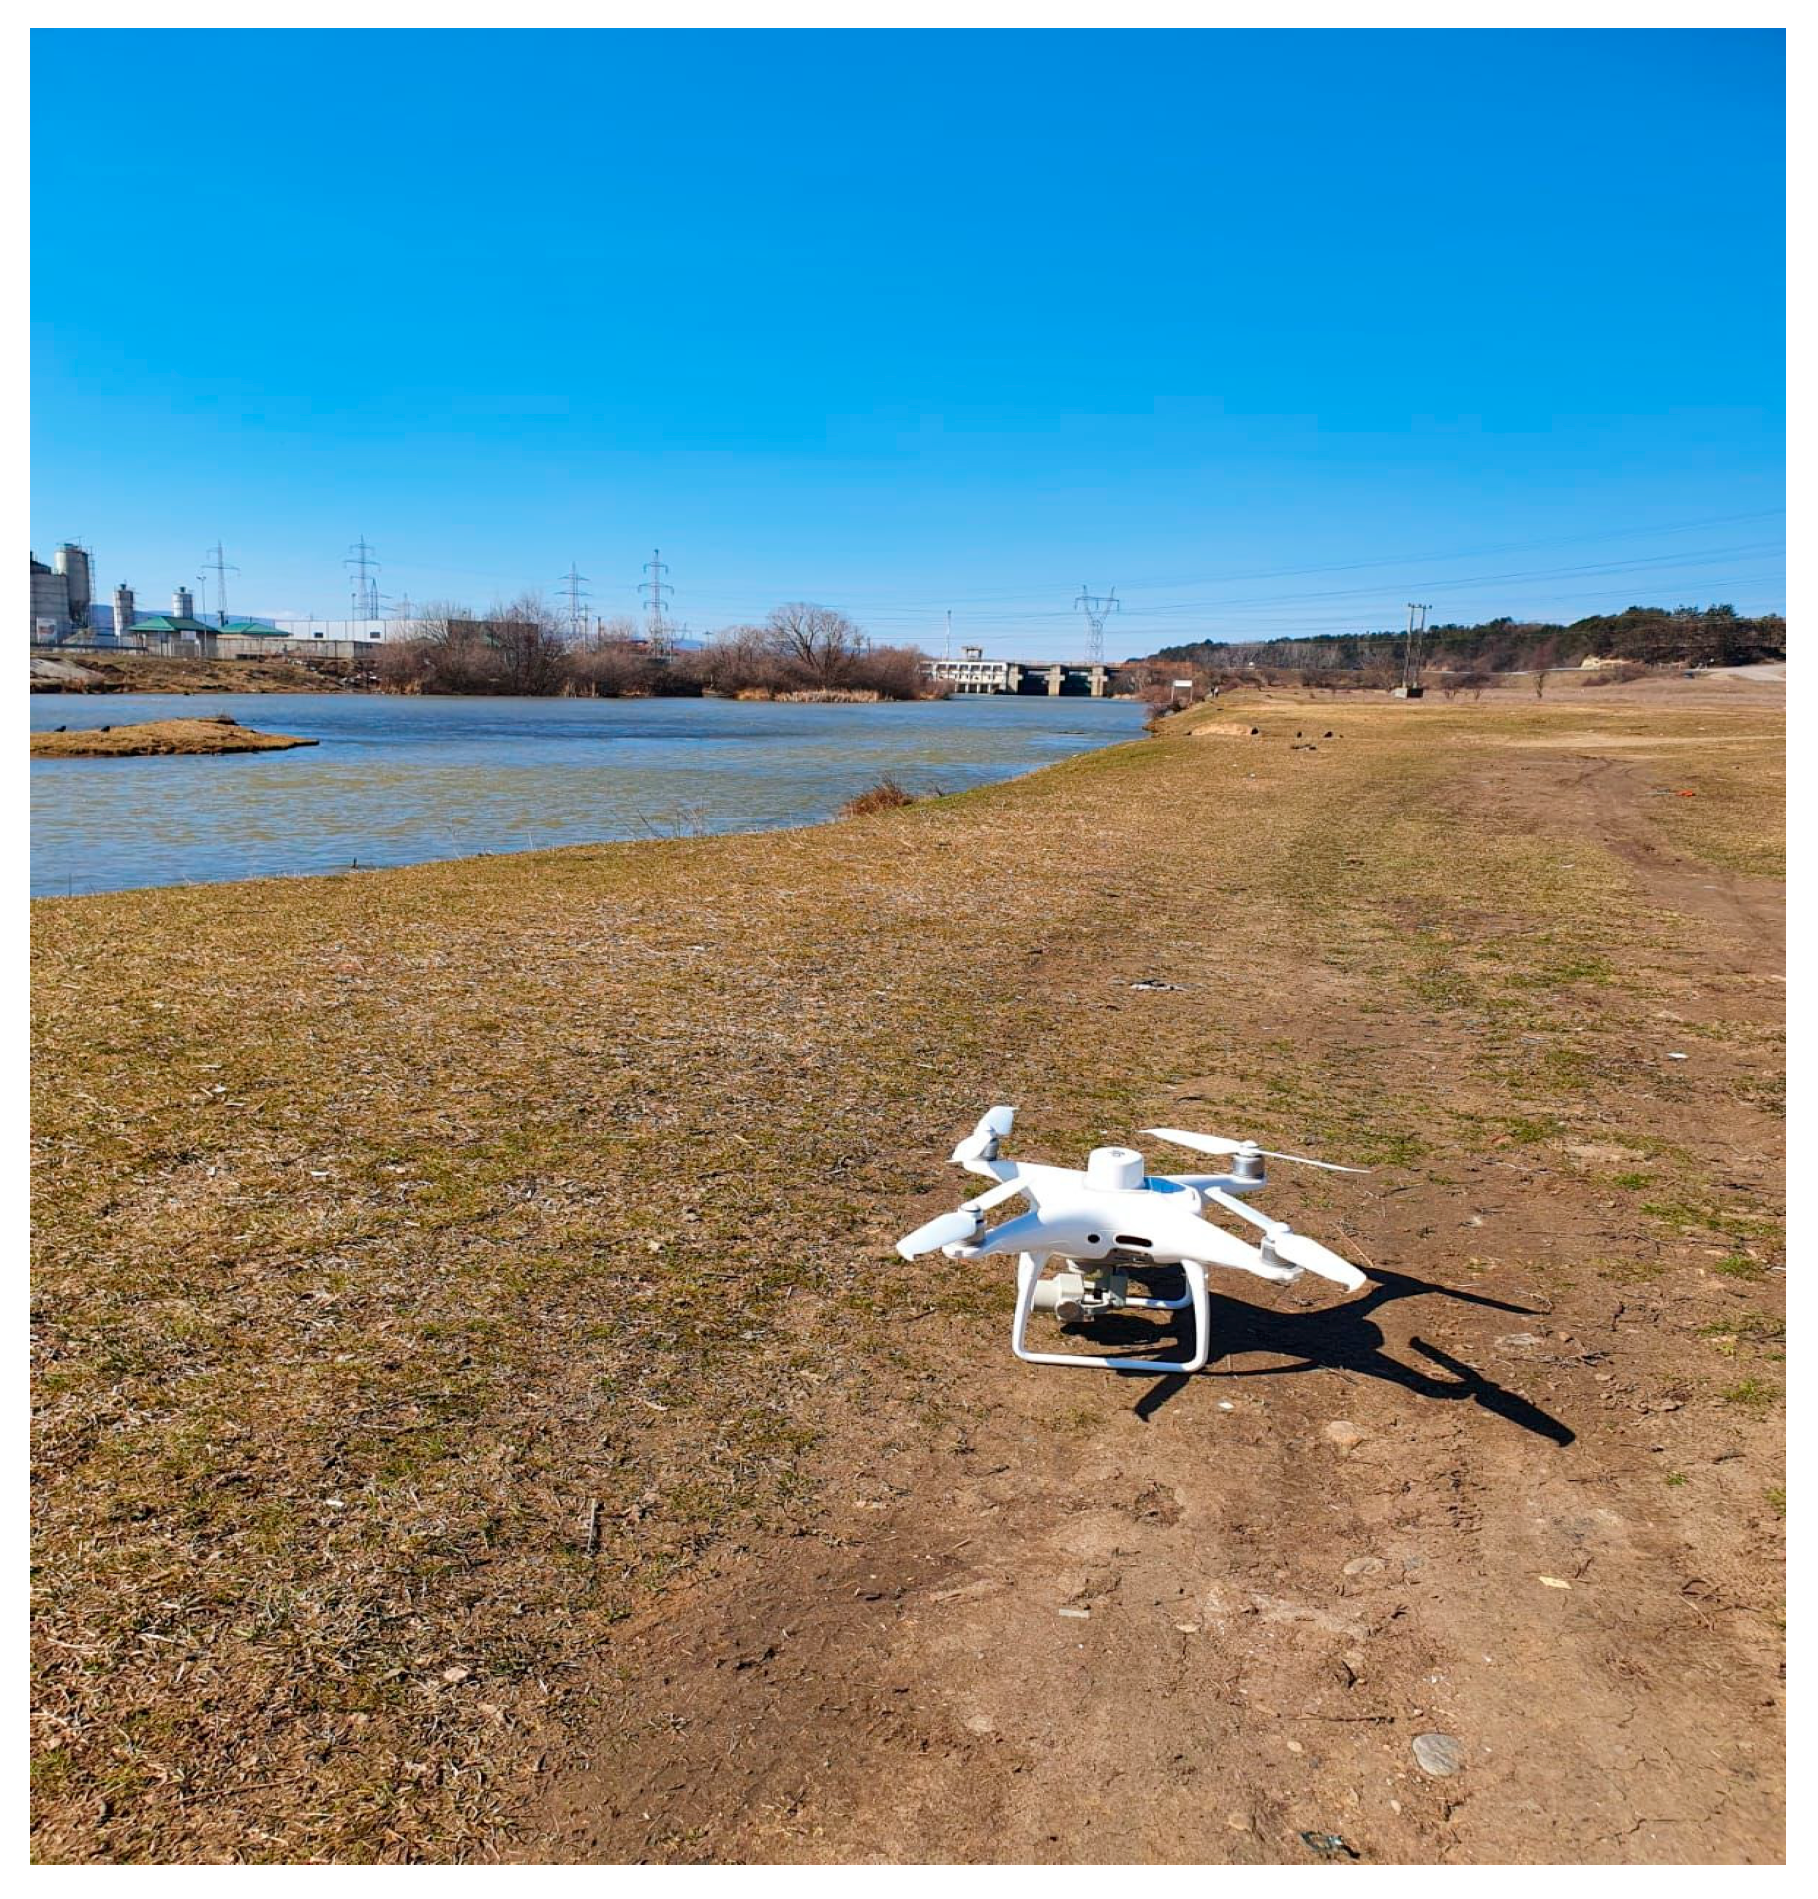
The DJI Phantom 4 drone was used (produced by DJI, Shenzen, China), having the advantage of being compact, with high precision, and being frequently used in low-altitude flights. The manufacturer has come up with a revolutionary technology for this model compared to old systems, with the aim of achieving the highest level of precision, facilitating pilots with a reduced number of control points on the ground, compared to earlier solutions (
Figure 2).
The camera has a 1/2.3” CMOS sensor effective pixels of 12.4 M, an ISO range of 100–3200 (video) and 100–1600 (photo), an electronic shutter speed of 8–1/8000 s, and an image size of 4000 × 3000.
The first step while conducting this work was the lifting of the elements from the land. Taking into account one of the most valuable features of topography in the case of floods, namely, the rate of precision related to the speed of results, the authors chose to conduct the measurements for this case study with the help of photogrammetric methods, according to the UAV (Unmanned Aerial Vehicle) technique, a method increasingly used in recent years because speed, accuracy, and precision are the key elements that offer the greatest potential in the development of topography; digital methods offer more possibilities than classical ones [
48].
For the good profitability of the work, GNSS-type systems were also used. The connection of these systems to the satellites was performed in advance with the help of the ROMPOS national network.
Reflective targets were used to mark the six control points (
Figure 3). There were two groups of points: the first three control points were marked on the left bank of the Someș (from where the drone took off) and the other three on the right bank of the Someș. In places where the targets could not be mounted due to concrete, a special spray was used to mark the topographic points in a bright color so that they could be easily seen in the aerial photographs taken with the UAV technology.
To acquire the data necessary for the case study, it was necessary to make two flights. The first flight covered the area in the immediate vicinity of the dam and the second flight covered the dam itself, it being necessary to perform the simulation of the dam cracking. Because the dam was not included in the first flight, being a key element in the simulation, the extracted data were still used to create the Digital Terrain Model. The processing of the data resulting from the second flight was conducted in relation to the first and is exemplified in the following.
The most important thing when starting any topographical work is the reconnaissance of the terrain. This was performed in the case of the measurements in this paper, carefully choosing the areas where the six control points were mounted, as they would later be useful for the georeferencing of the resulting orthophoto plane. Three reference points were installed on the left bank of the Someș River and the other three on the right bank. The areas of the control points were carefully chosen, aiming to choose an open area to ensure the easy visibility of the targets from the drone. The points were materialized by targets printed on a resistant material in the grass and dirt areas (
Figure 3) and by spray (in a color that was as obvious as possible) in the shape of an “L” in the concrete areas. The markings in a parking lot, in the area where the corner that had to be visible from the drone was marked with an arrow, were also used as reference points. The control point itself was taken either as the center of the square, in the case of targets printed on material or plastic, or in the center of the “L”-shaped marking. In practice, it is recommended that these reference marks are not located at a distance greater than 200 m, as this can considerably affect the accuracy of the work.
After choosing the mounting areas of the landmarks and their materialization, they determined their coordinates with the help of GNSS equipment. To achieve this step, the static measurement method was used. We started with the first point, which was near the drone’s takeoff and landing area. In general, in practice, the most often used static measurement method is the one that offers the highest accuracy. In general, the only impediment this method presents is the need to park in areas as open as possible, offering an unobstructed view of the sky. In the case of the static method, the GNSS equipment was installed in a fixed station, with the observation period being 60 min for each point.
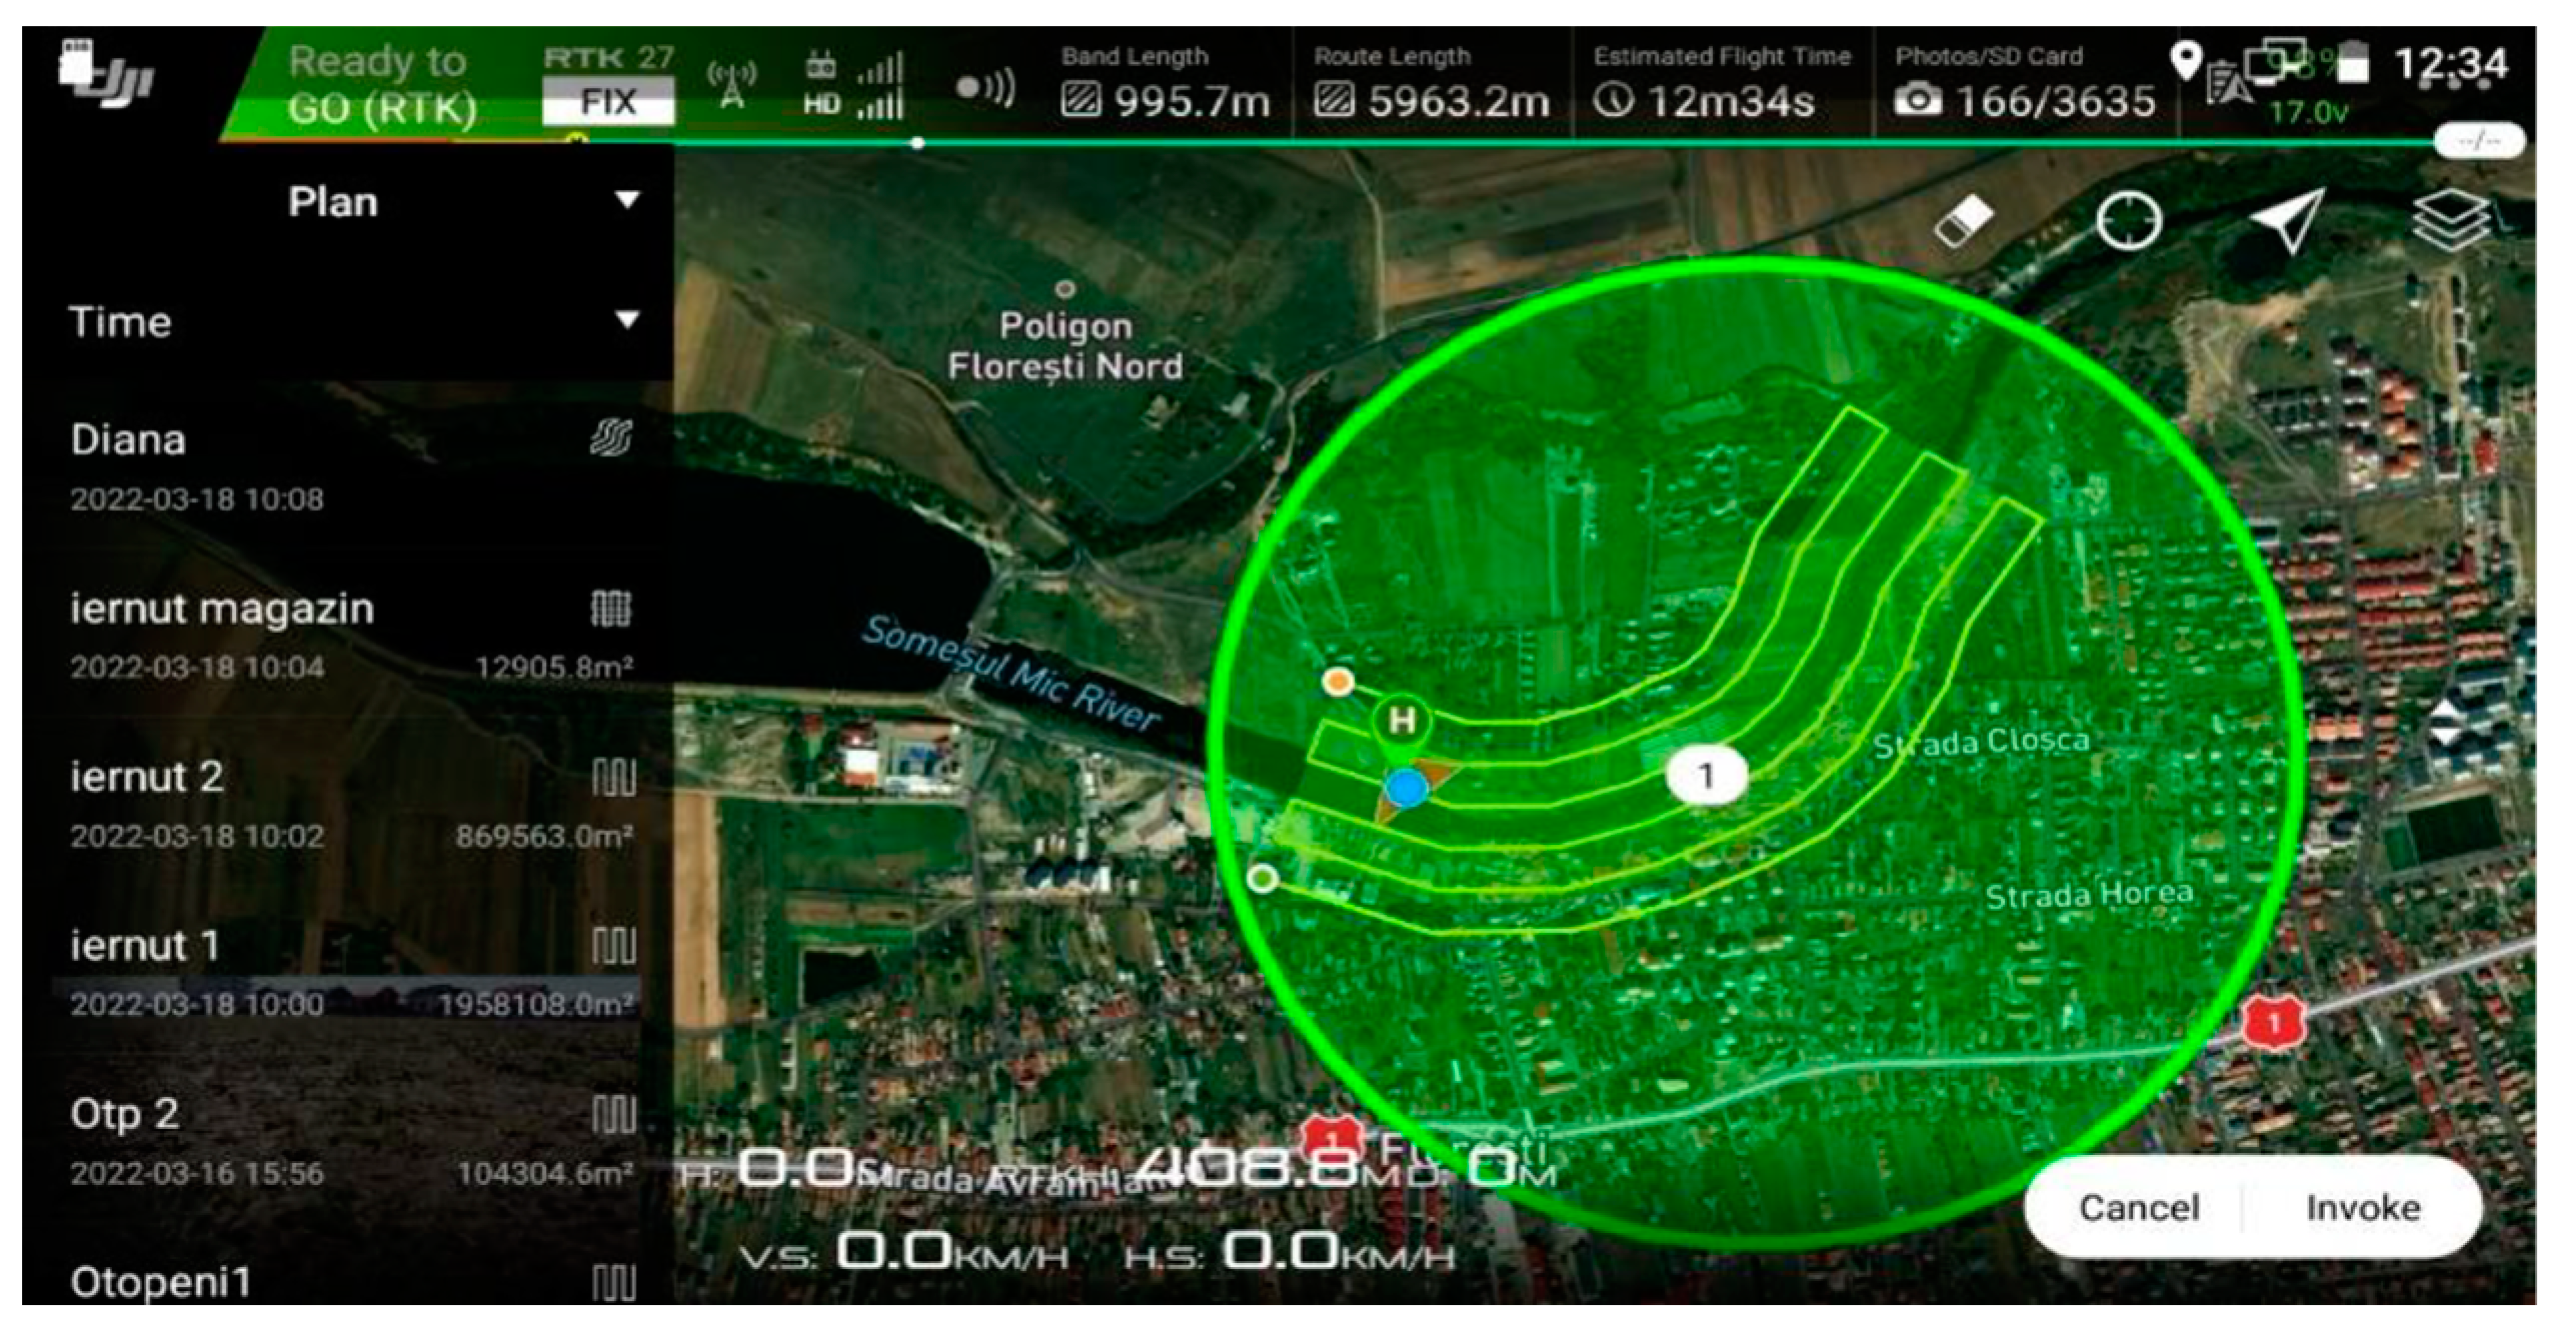
After determining the coordinates of the six control points using the static mode, the actual flight was started. The first step in making the flight was approval from the Romanian Civil Aeronautical Authority (AACR). For the aerial images to be of the highest possible quality, the weather conditions were monitored both the evening before and the morning of the flight because too aggressive wind and precipitation can affect the actual flight. The take-off and landing area was chosen in an open area, without trees and vegetation to be able to monitor the drone from the immediate vicinity of the take-off point, which is the same as the landing point. As can be seen in
Figure 4, the first flight had a duration of about 14 min over an area of about 20 ha (198,809 m
2), at 120 m height.
Since the greatest clarity was chosen in the construction of the cloud of points, the execution time of the process was a long one, more precisely approximately 60 h. This is due to the number of pixels that this level of clarity produces.
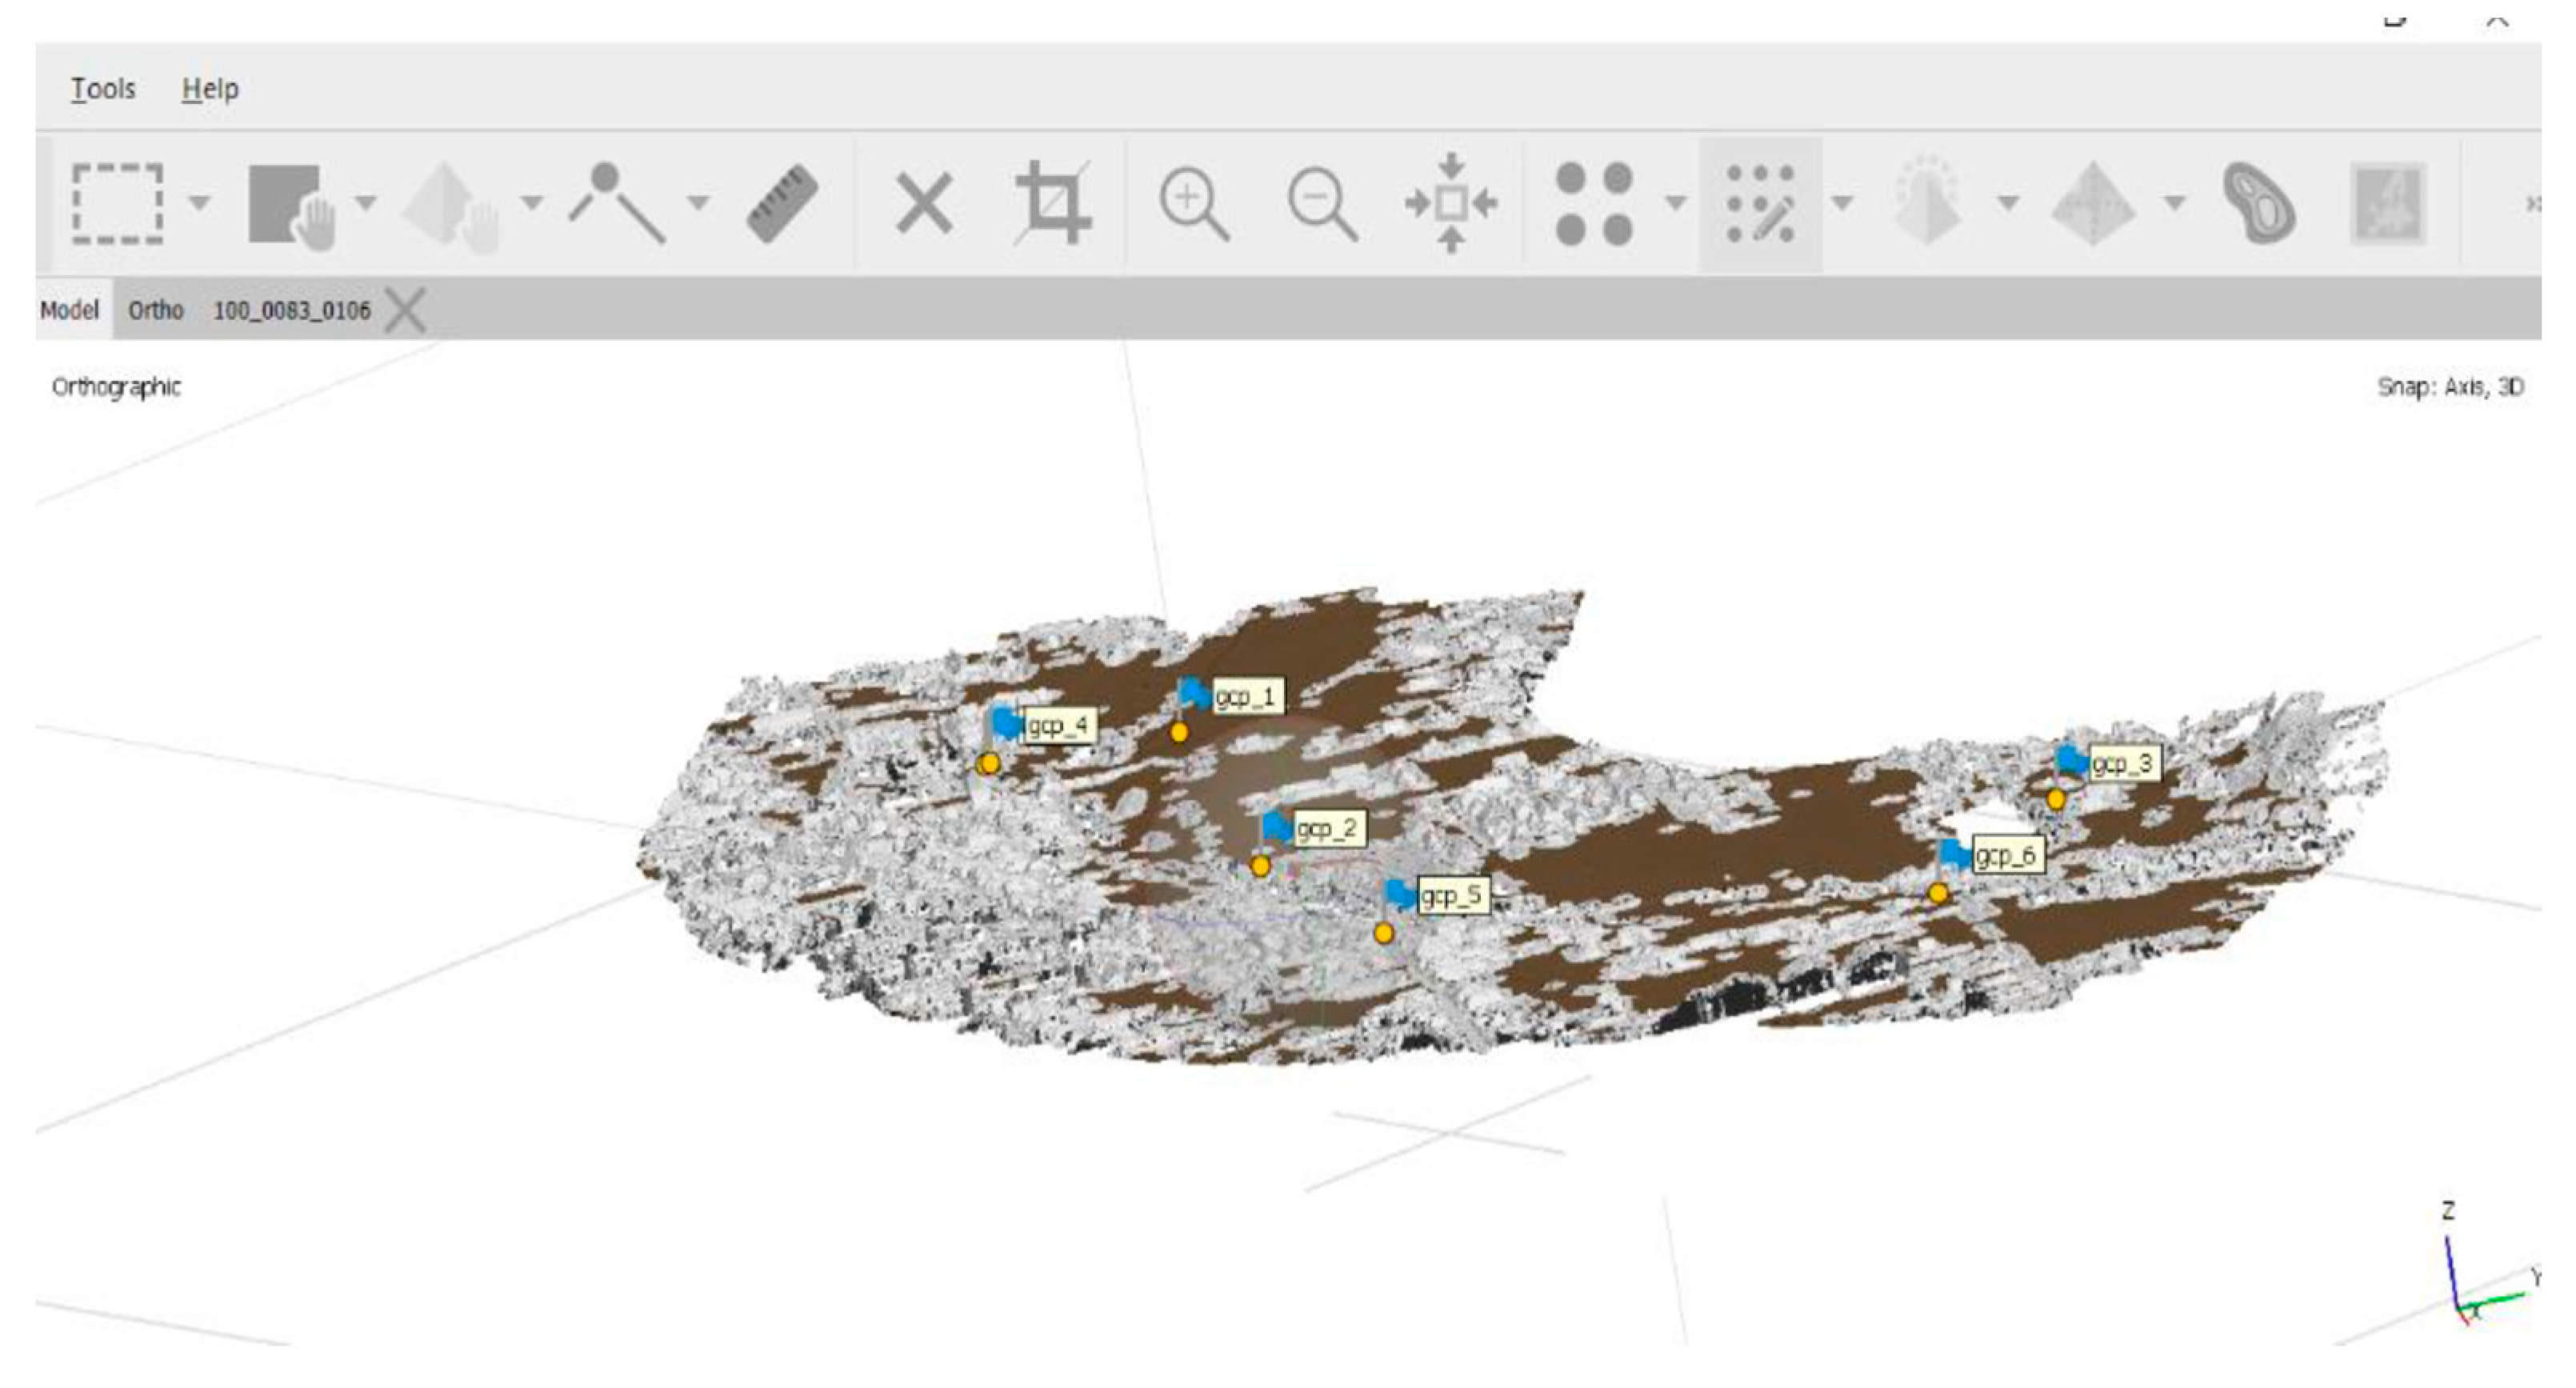
Since there were many constructions and excessive vegetation in the area chosen for the study, a so-called cleaning was necessary to have a DEM as clean as possible to create the level curves (
Figure 5).
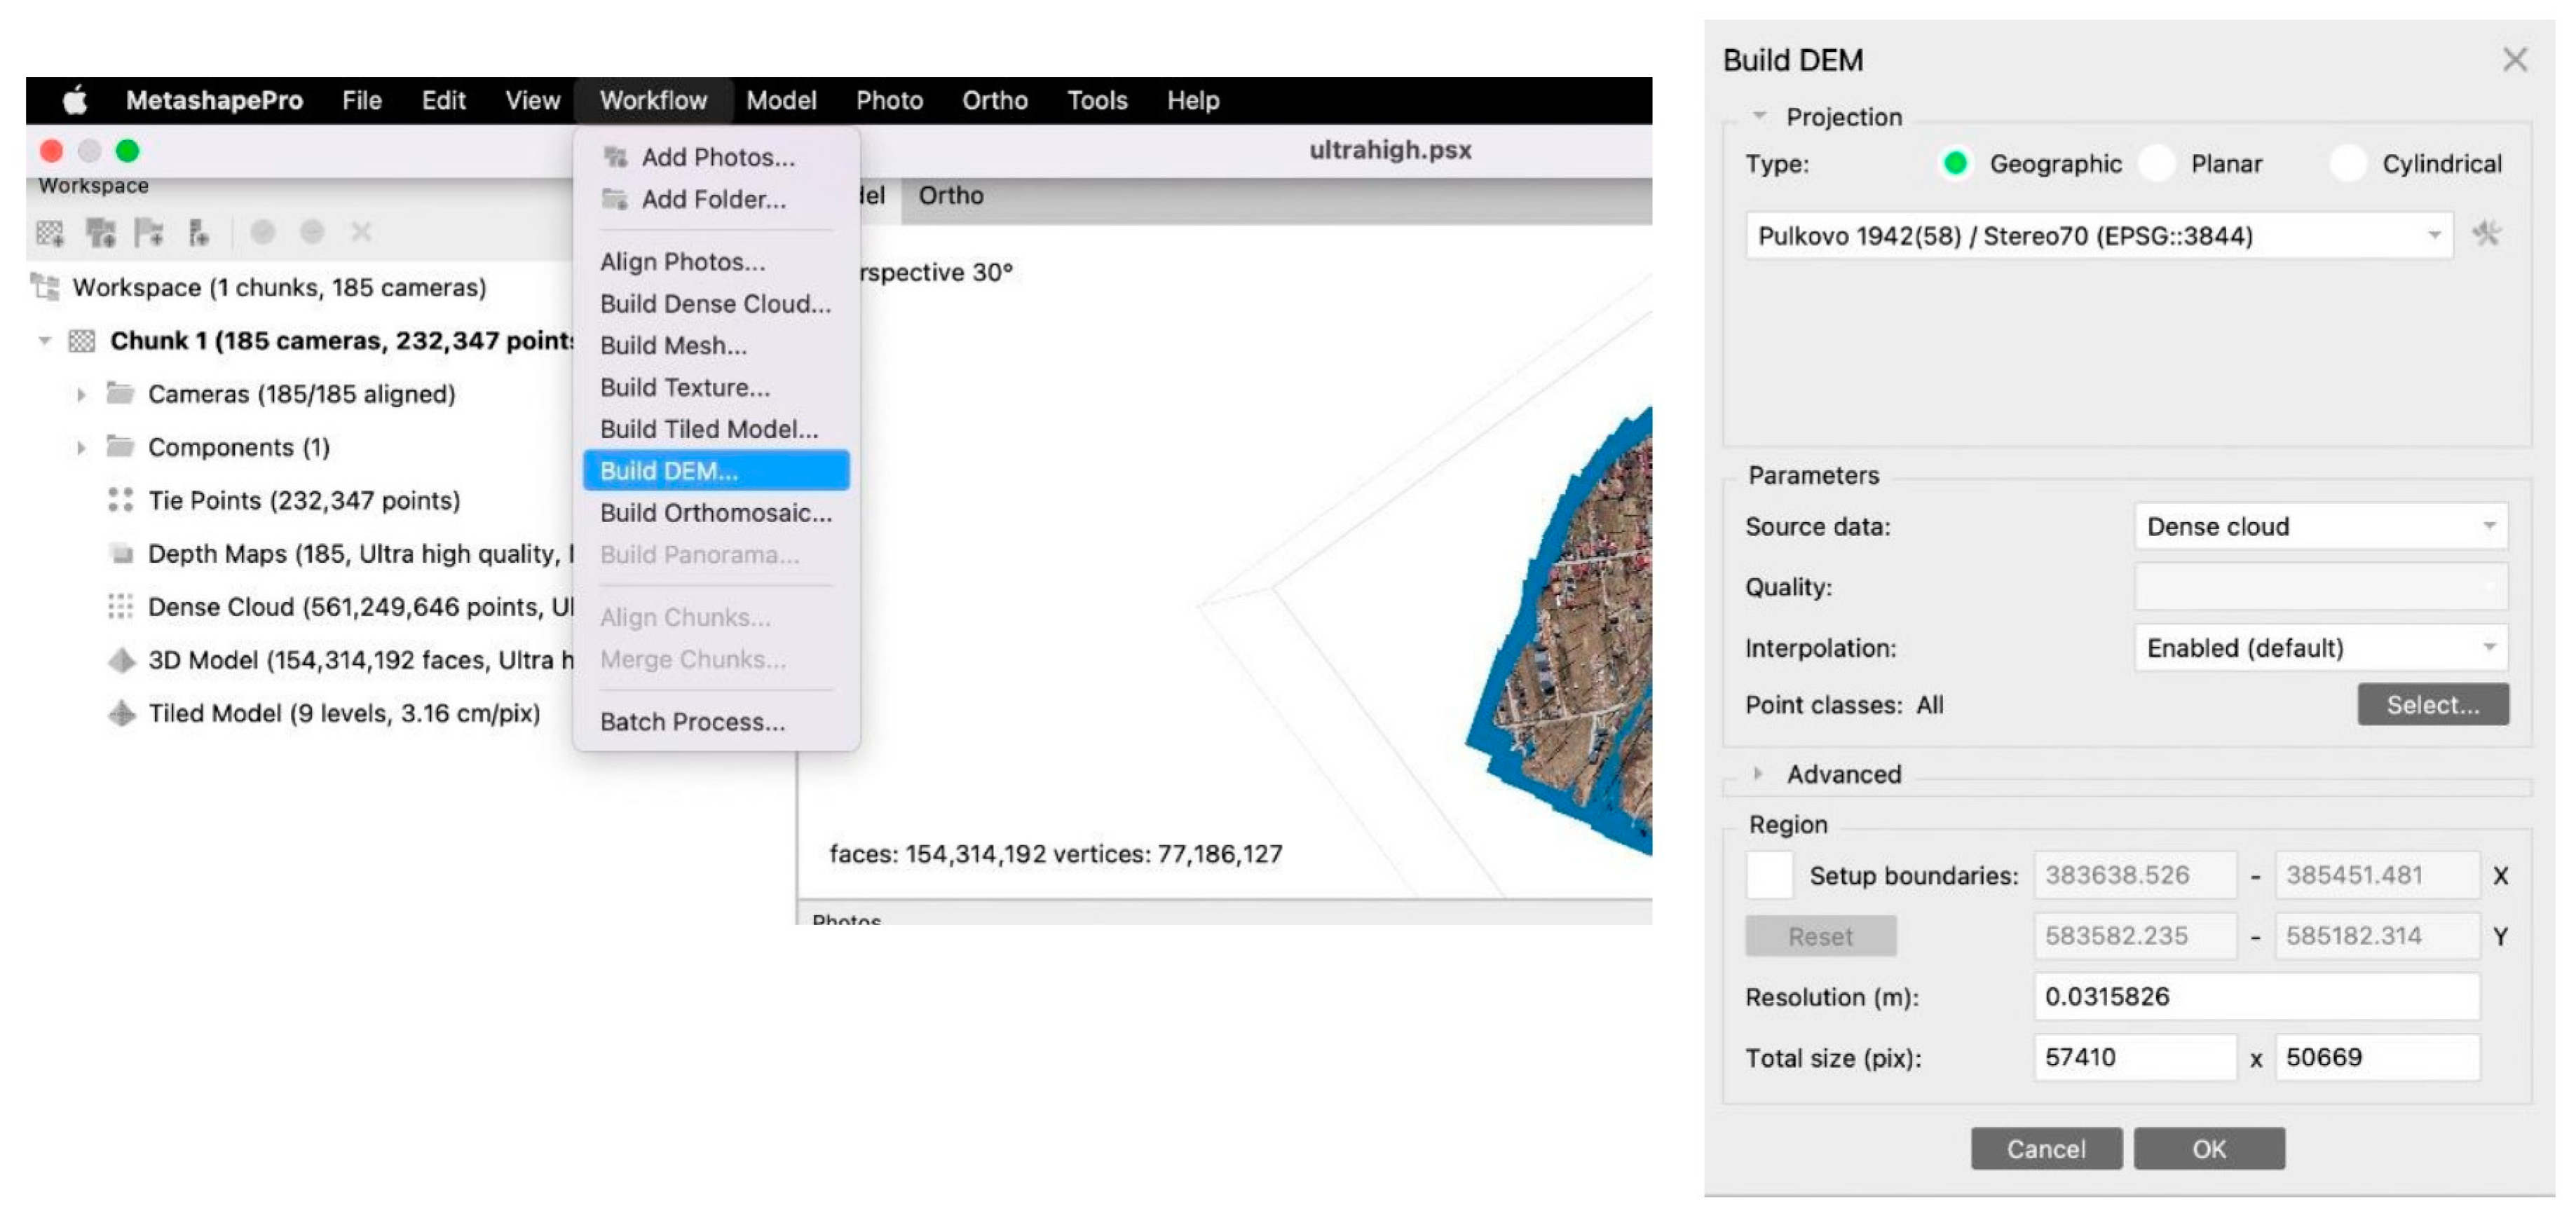
Immediately after this texture was obtained, the software allowed the generation of the inclined model (
Figure 6). With the help of the previously generated structures, the DEM (Digital Elevation Model) was drawn. The georeferencing system used was Pulkovo 1942 (58)/Stereo 70. Relatedly, the cloud of points needed to use some classifications in the case of the DEM as well. Finally, the steps taken previously to achieve the graphic format of the measurements obtained with the help of UAV technology led to the acquisition of the orthophoto plane.
3. Results
3.1. Obtaining the Orthophoto Plan and the Digital Elevation Model (DEM)
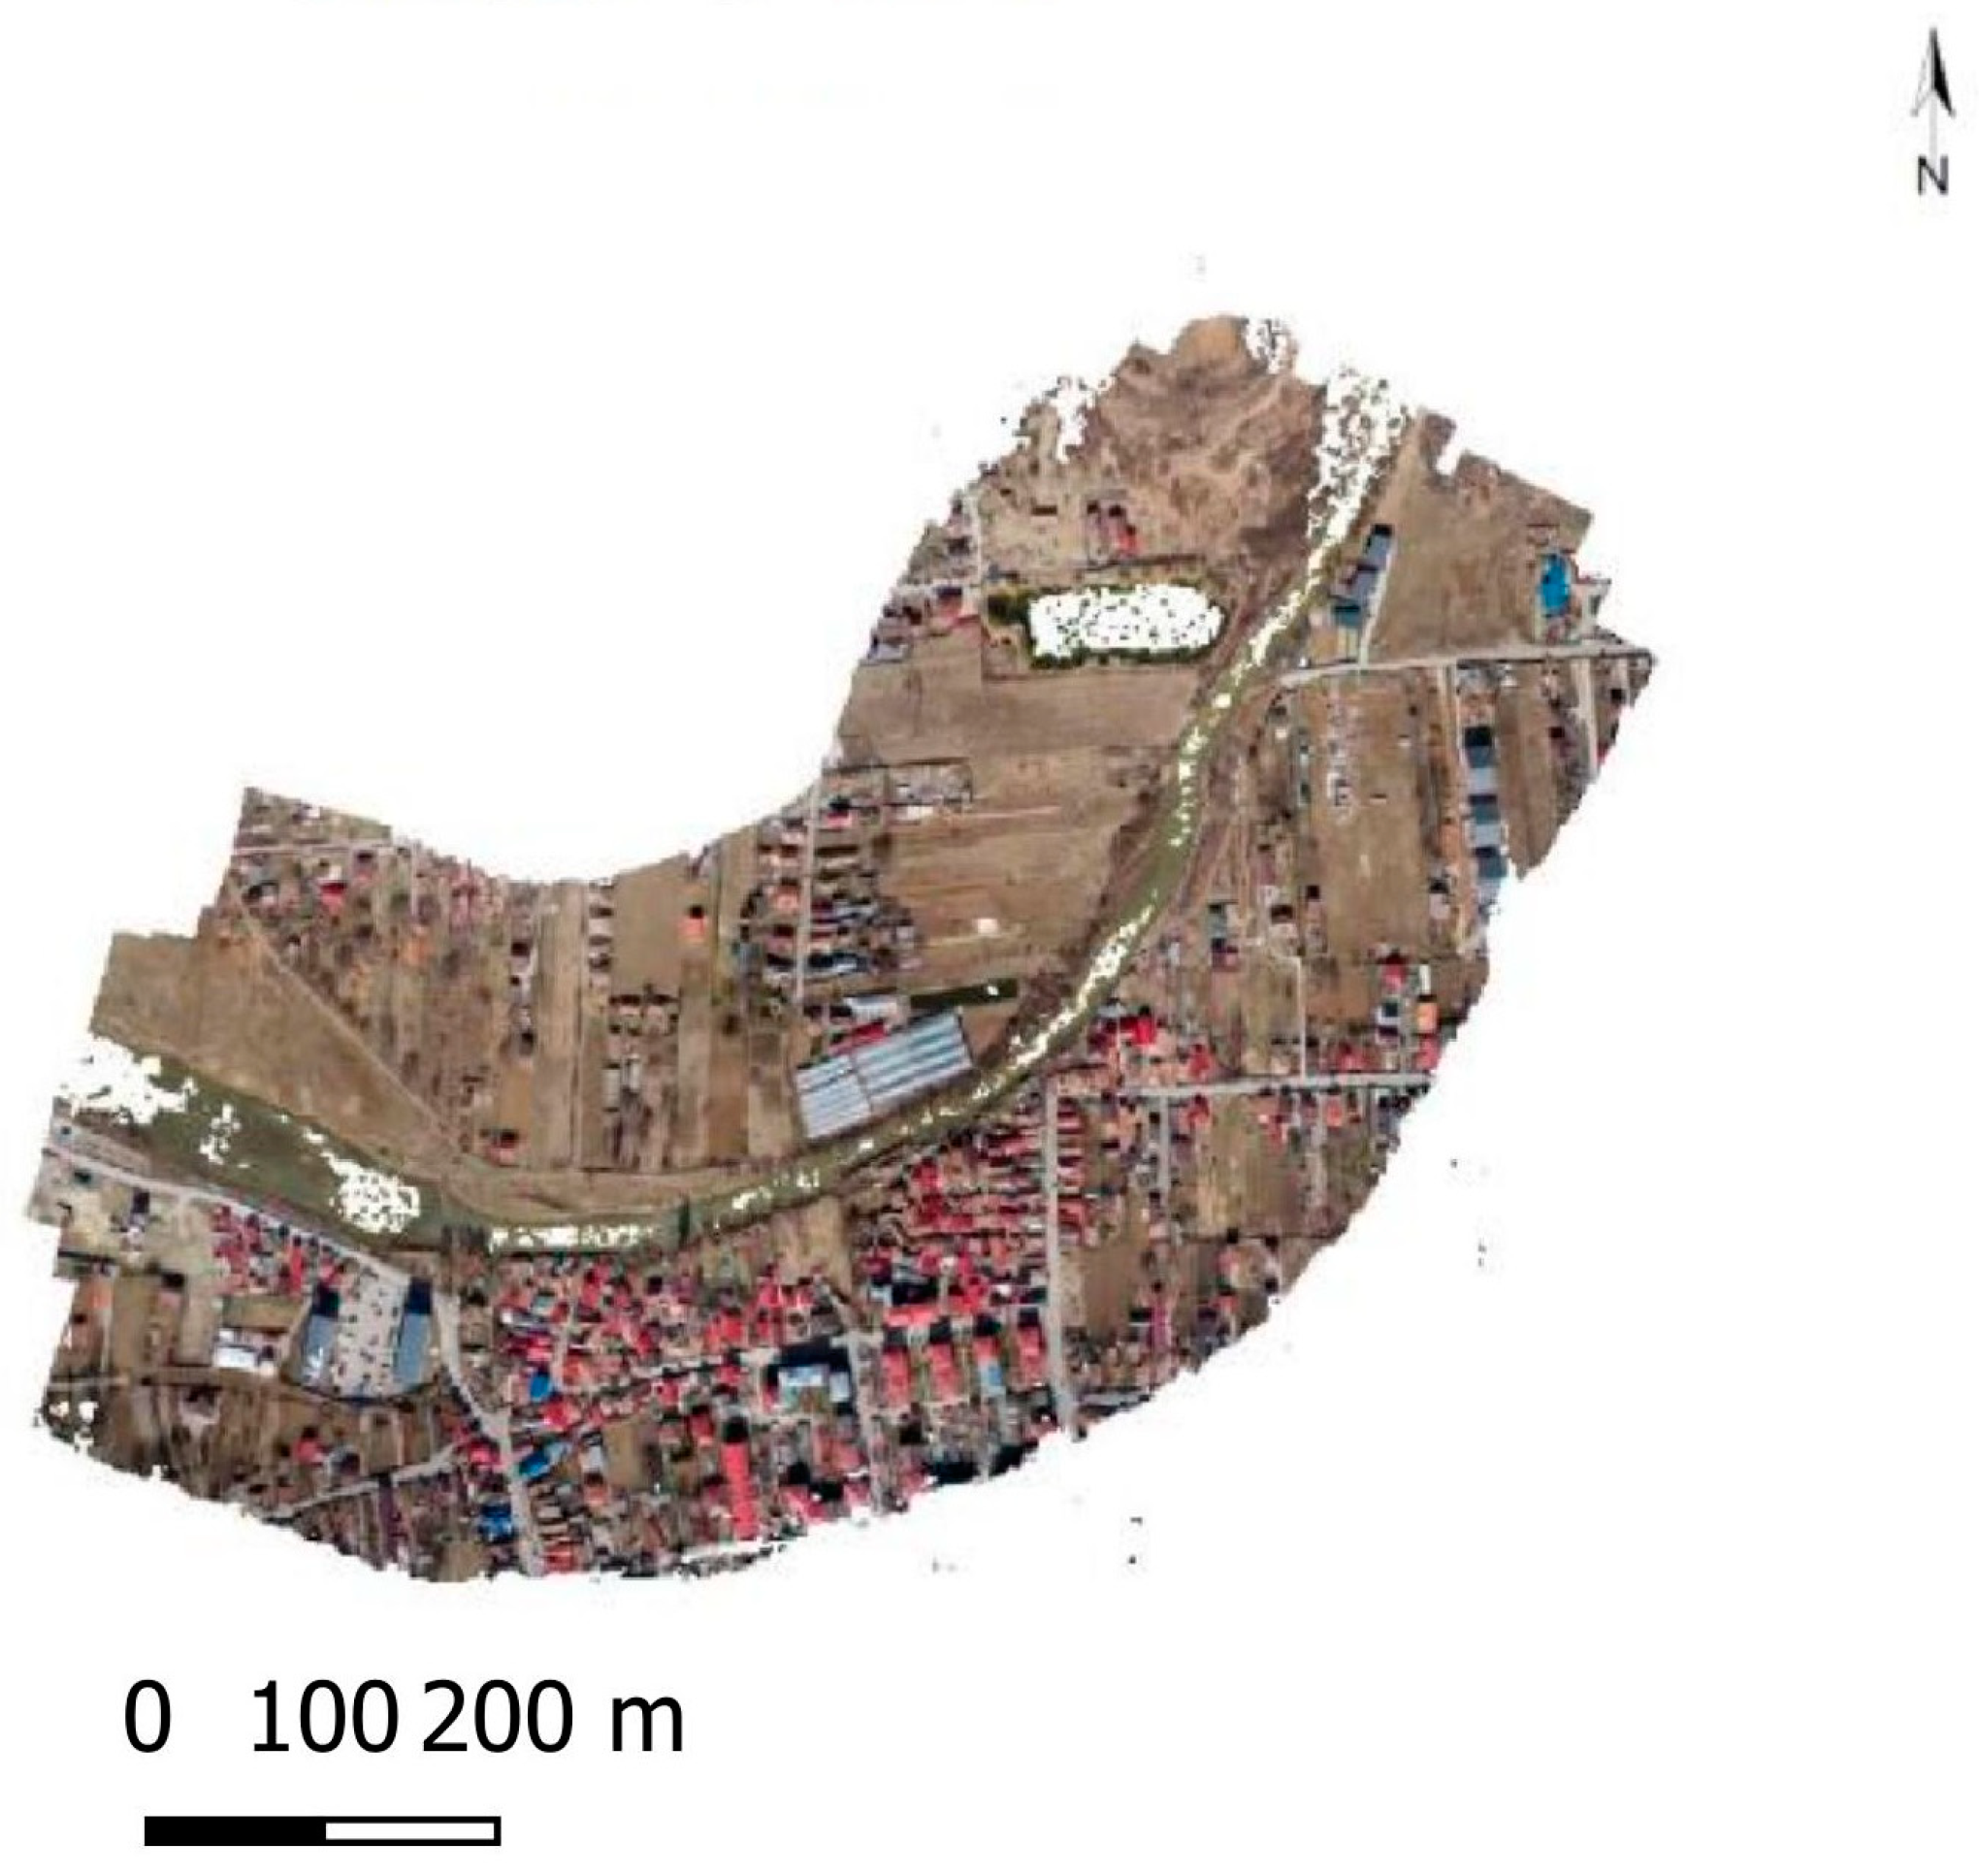
The first concrete result needed for the inundation study was the orthoimage of the study area (
Figure 7). To have a better view of the orthophoto plane in the studied area, the option “Show Base Map” was used, which more clearly highlights the surroundings adjacent to the area of interest.
Therefore, all the stages necessary for the generation of the orthophoto plane were completed, with each stage having its own characteristics. At the beginning of the process, 185 aerial photographs were aligned, generating 232,347 points, representing the totality of drone position points and image intersections. The ultra-high-quality point cloud was then built, generating a volume of 561,249,646 points, which then produced 154,314,192 faces of the mesh. The mesh was used to build the tilted model with a diversity of nine levels and a resolution of 3.16 cm/pixel. From this model, the DEM was obtained with a plane resolution of 57,438 × 51,180 and a terrestrial resolution of 3.16 cm/pixel.
The next step to construct the digital model of the ground was to obtain the characteristic level curves (
Figure 8). These contour lines were created in the Global Mapper 23 program (Blue Marble Geographics, Hallowell, ME, USA). To create the level curves, the authors decided to use the DEM exported from the AgiSoft Metashape 1.8.5. program, saved with the “.tiff” extension.
The next step was to export the contour lines from the Global Mapper program. The curves were exported as a “.dxf” type file, which was necessary for compatibility with the ArcGIS 10.5 program (ESRI-United States of America). The contour lines represent the basis on which the digital terrain model will be created later.
Since “.dxf” files do not allow us to add elevation values, there is a crucial step in determining the Raster Model, namely, the transformation of the contour lines into a “.shp” file (shape file). For the subsequent processing of the digital model, the extension of the ArcGIS program, namely, ArcScene, was used.
The digital model of the ground can be observed in the figure below (
Figure 9).
3.2. Achievement of the Inundation Simulation Using the Hec-Ras Program
To conduct the simulation, the data from the second flight were used, data that were processed according to the procedure used for the first flight. To simulate the dam cracking, the Hec-Ras 6.4.1. software (US Army Corps of Engineers, Hydrologic Engineering Center-United States of America) was used.
Before starting the work, the measuring system was set. Since the Hec-Ras software uses the imperial measurement system, it was necessary to change the settings to the metric system. After this, the areas of interest were set up, namely, the possibly flooded area and the accumulation area.
Since the DEM with which the simulation was conducted was previously georeferenced, it was not necessary to choose a spatial reference system, and it was then possible and easy to select the necessary DEM. After importing the DEM, the choice of the area to be studied followed, a step achieved by creating the geometries.
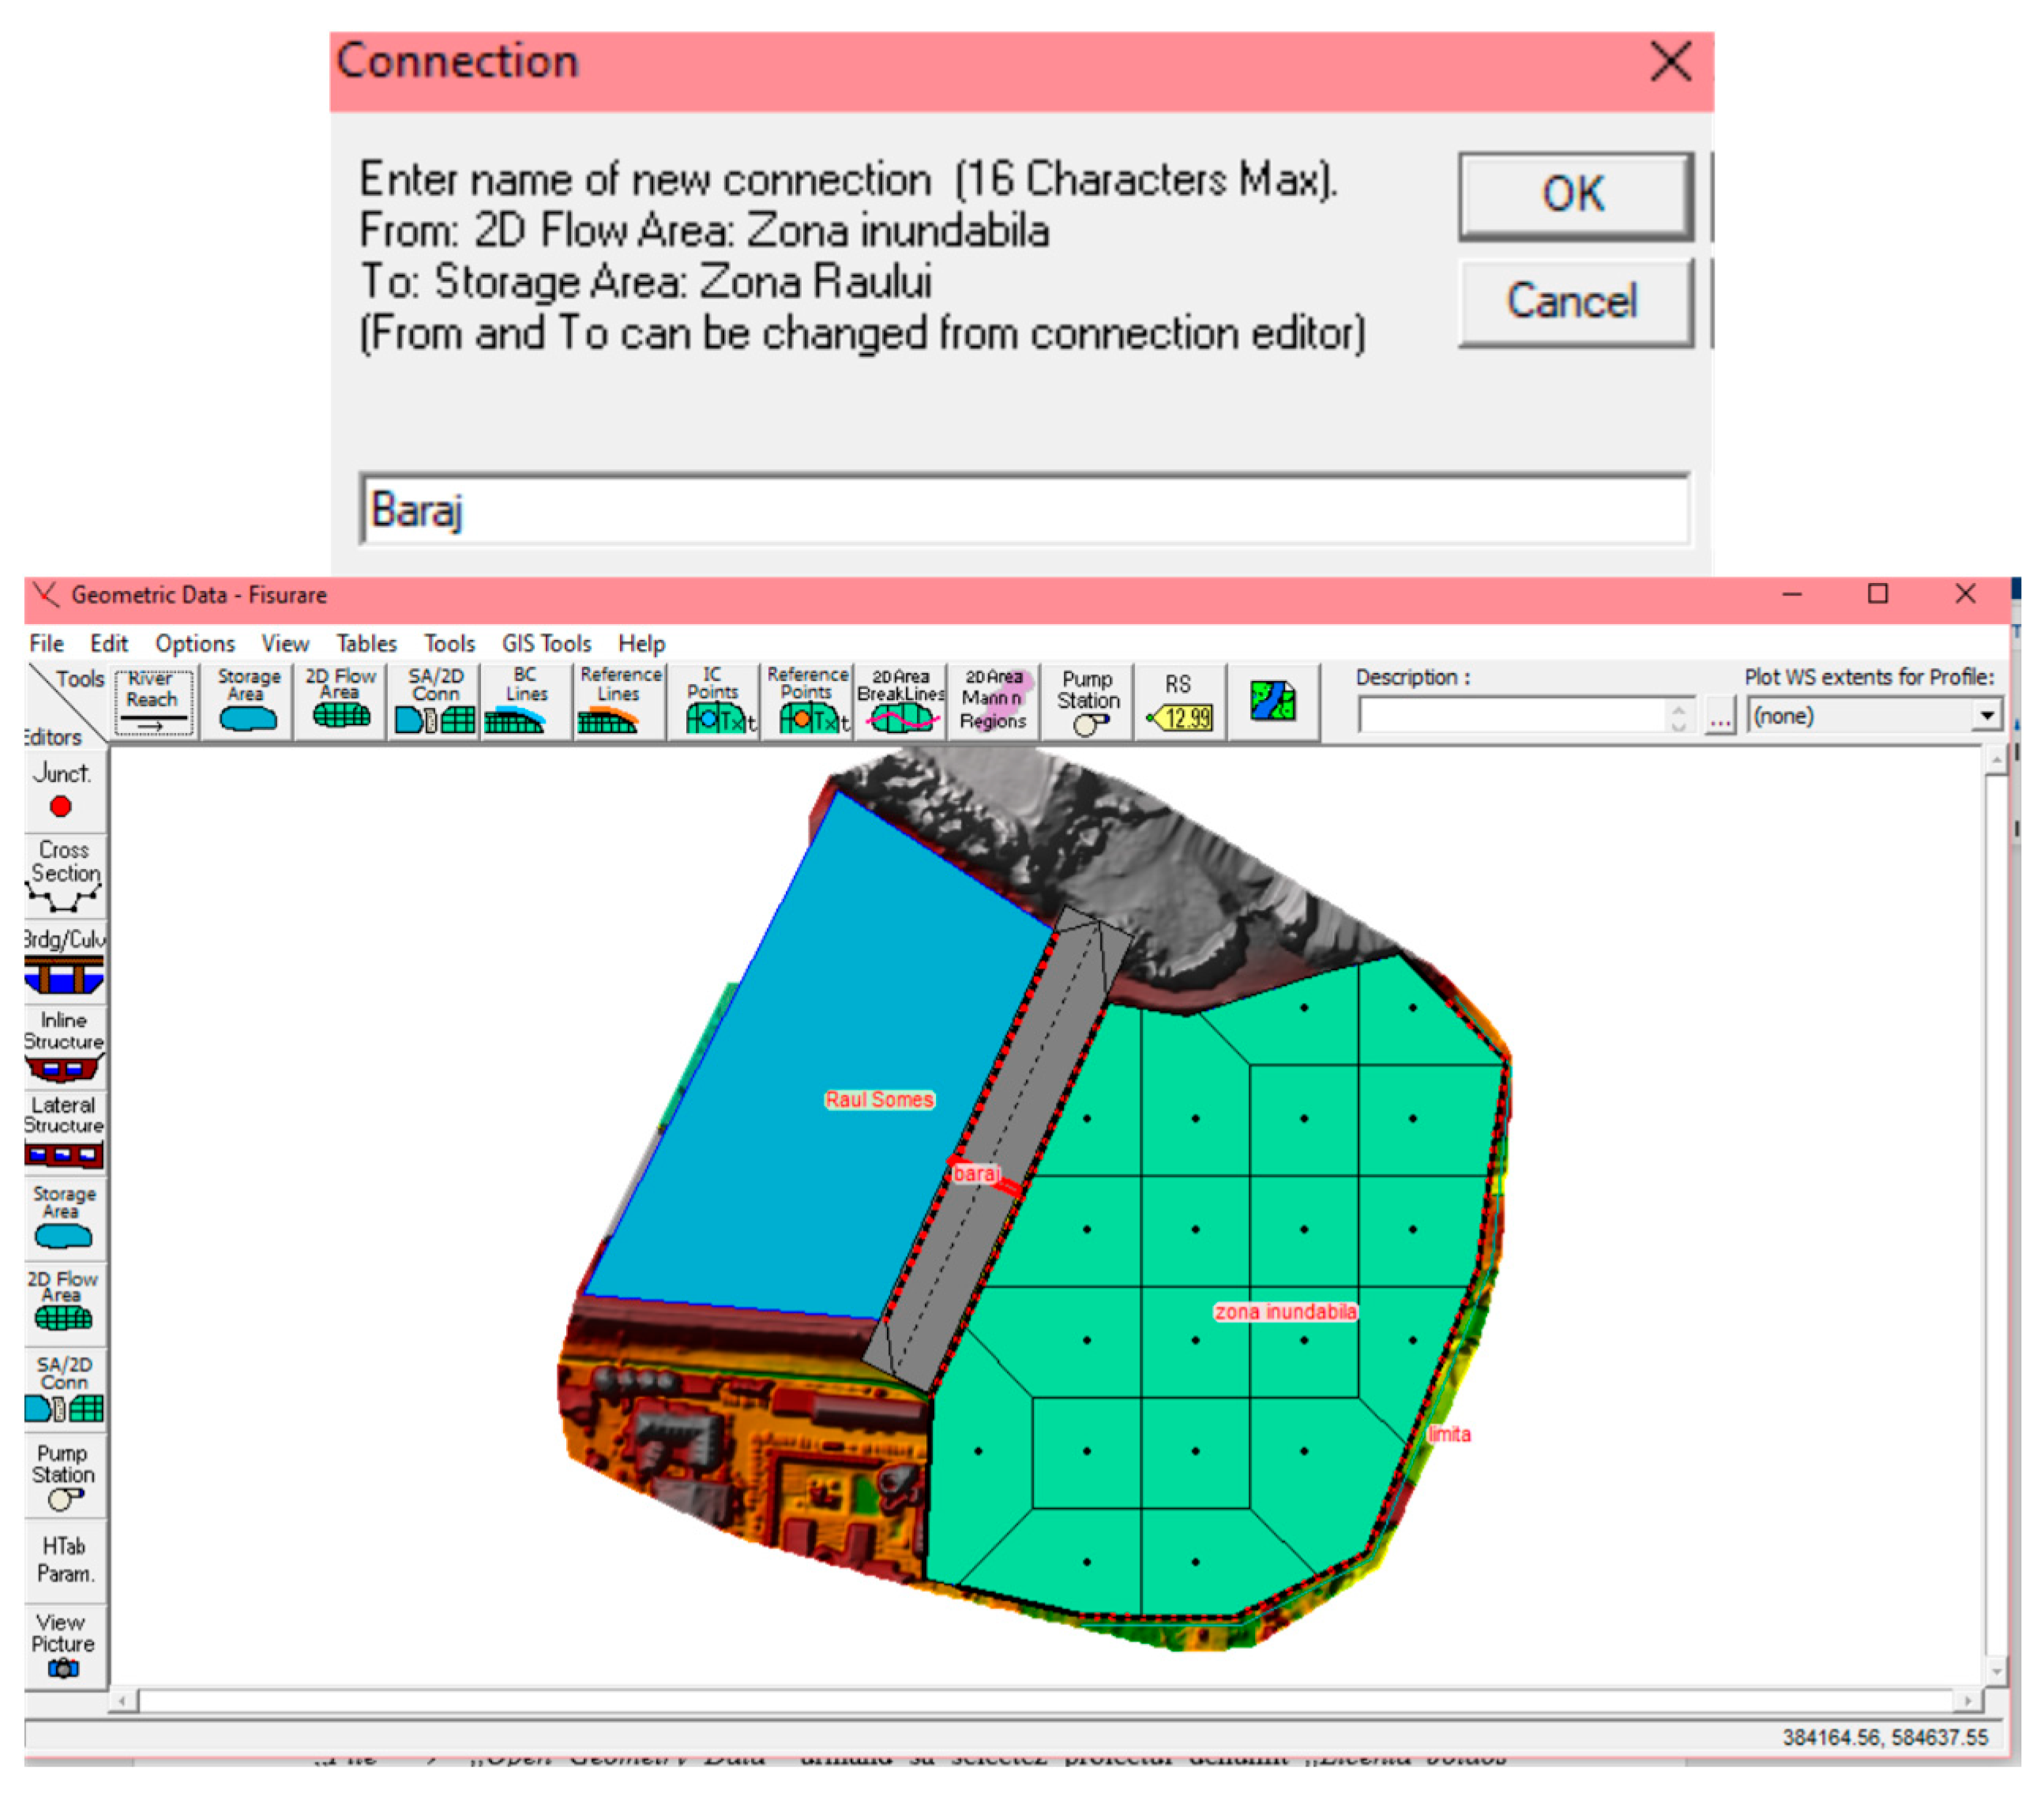
To continue the work, two functions of the program were used, namely, “2D Flow Area” and “Storage Area”. The “Storage Area” option was used to define the portion of the Someș River, accessing “Edit Geometry” and selecting the portion of the Someș River to be studied. The “2D Flow Area” option was used to create a perimeter that represents the potentially flooded area. After the creation of the Someș River area and the possibly floodable area, the realized geometry was saved.
The next step consists of defining the area of the studied dam, accessing the “Tools” → “SA/2D Conn” option, and then generating a polyline in the middle of the dam so that this function connects the two previously mentioned areas, namely, the area of the Someș River and the flood area. After making the connection between the zones, it was necessary to create a boundary that defines the end of the flood zone (
Figure 10).
Creating the layered structure of the potentially flooded area was the next step.
The subsequent step represented the creation of points called “Cells”, and the “Force Mesh Recomputation” option was used to perform the next step. The elevations at which the Someș River is located led to the determination of the river’s volume. The minimum elevation of the river is 335.146 m–0 m3 and the maximum elevation is 408.927 m–1055.577 × 103 m3.
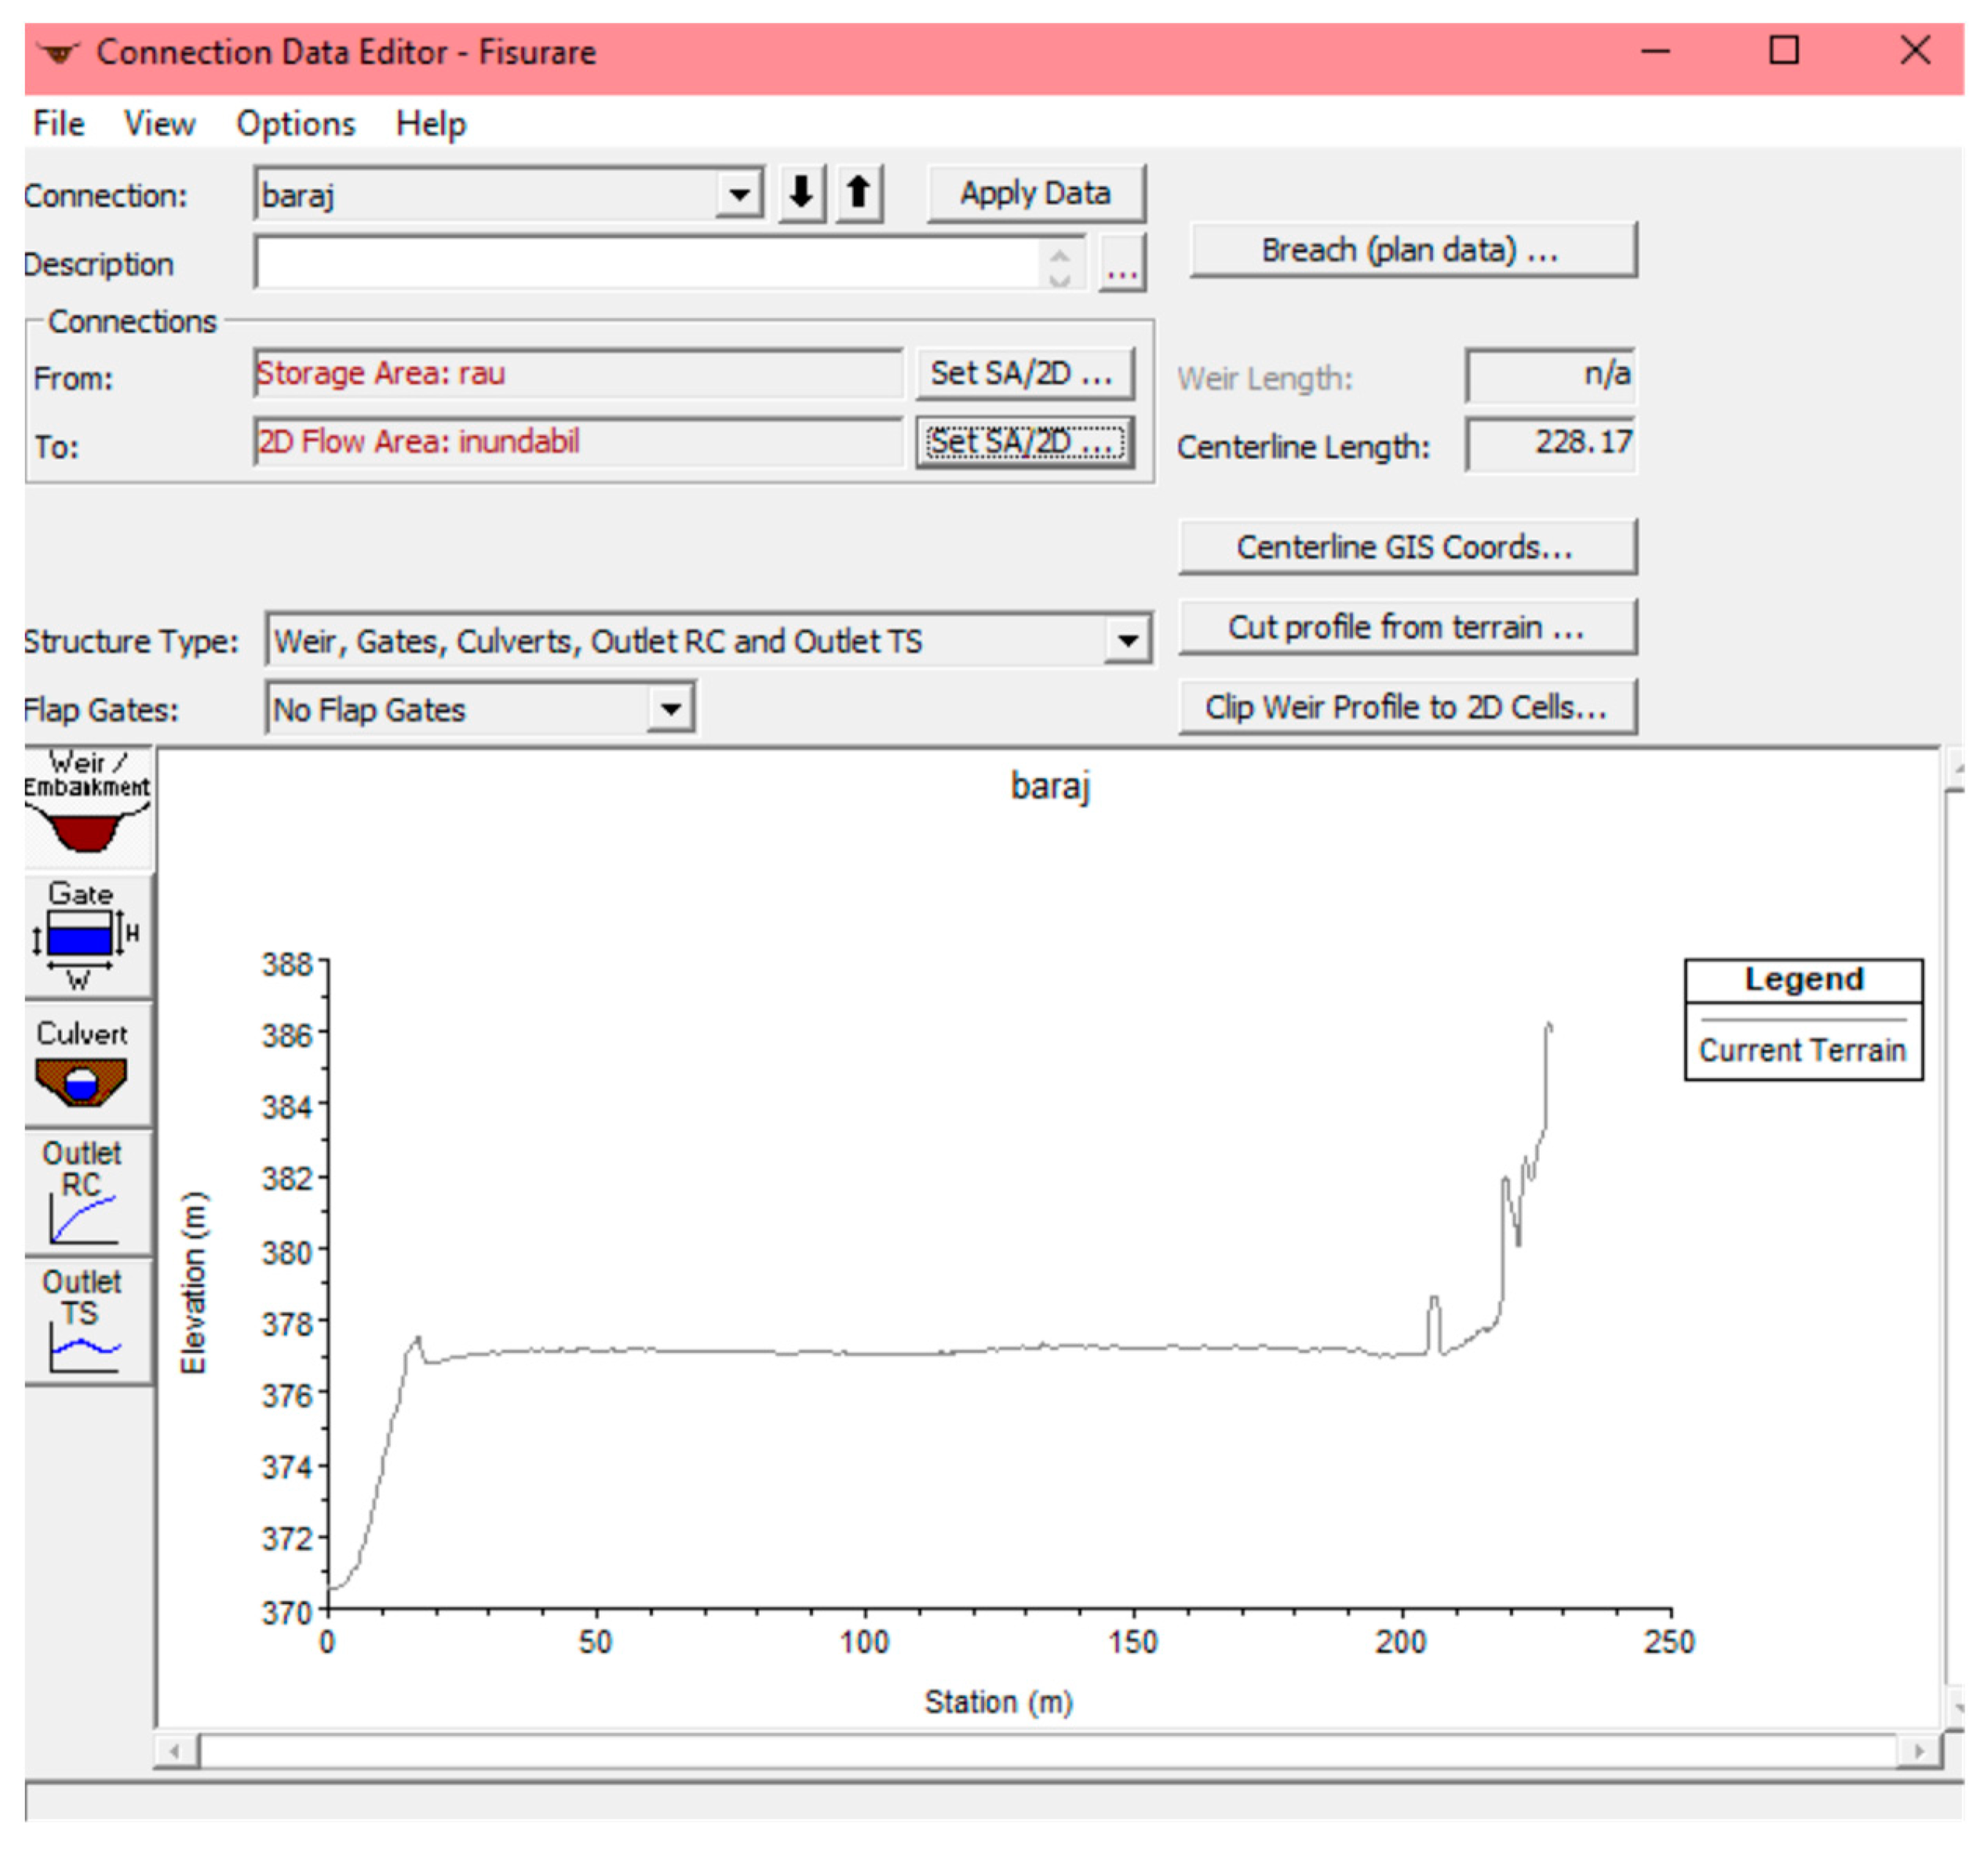
The dam is defined as a unifying element that makes the connection between the Someș River, which represents the water drainage area, and the water overflow area, represented by the possibly flooded area.
The graph represented in
Figure 11 was automatically generated by the software Hec-Ras and the graph represents the dam itself.
The dam breaching parameters were established, and after accessing the “Breach” function, it was necessary to use “Breach This Structure”, which is necessary for processing the parameter values.
The main conditions that the program imposes are the internal limits, represented in this case by the Someș River, and the external limits of the flood zone. Each of these limits is set according to each one, namely, the internal one by the flow of water from the river, reported in a time interval, and the external one by the friction of the water with the flood zone. The graphic representation was made with the help of the “BC Lines” function, with the condition that the outer limit should be perpendicular to the axis of the water flow and at a height as high as possible, so that, in the end, the spread of water does not reach the boundary of the polygon that includes the flood zone. If these conditions are not respected, the risk will be the occurrence of errors. The simulations considered extremely important elements that can define a flood, such as the friction force of the water and the flow speeds.
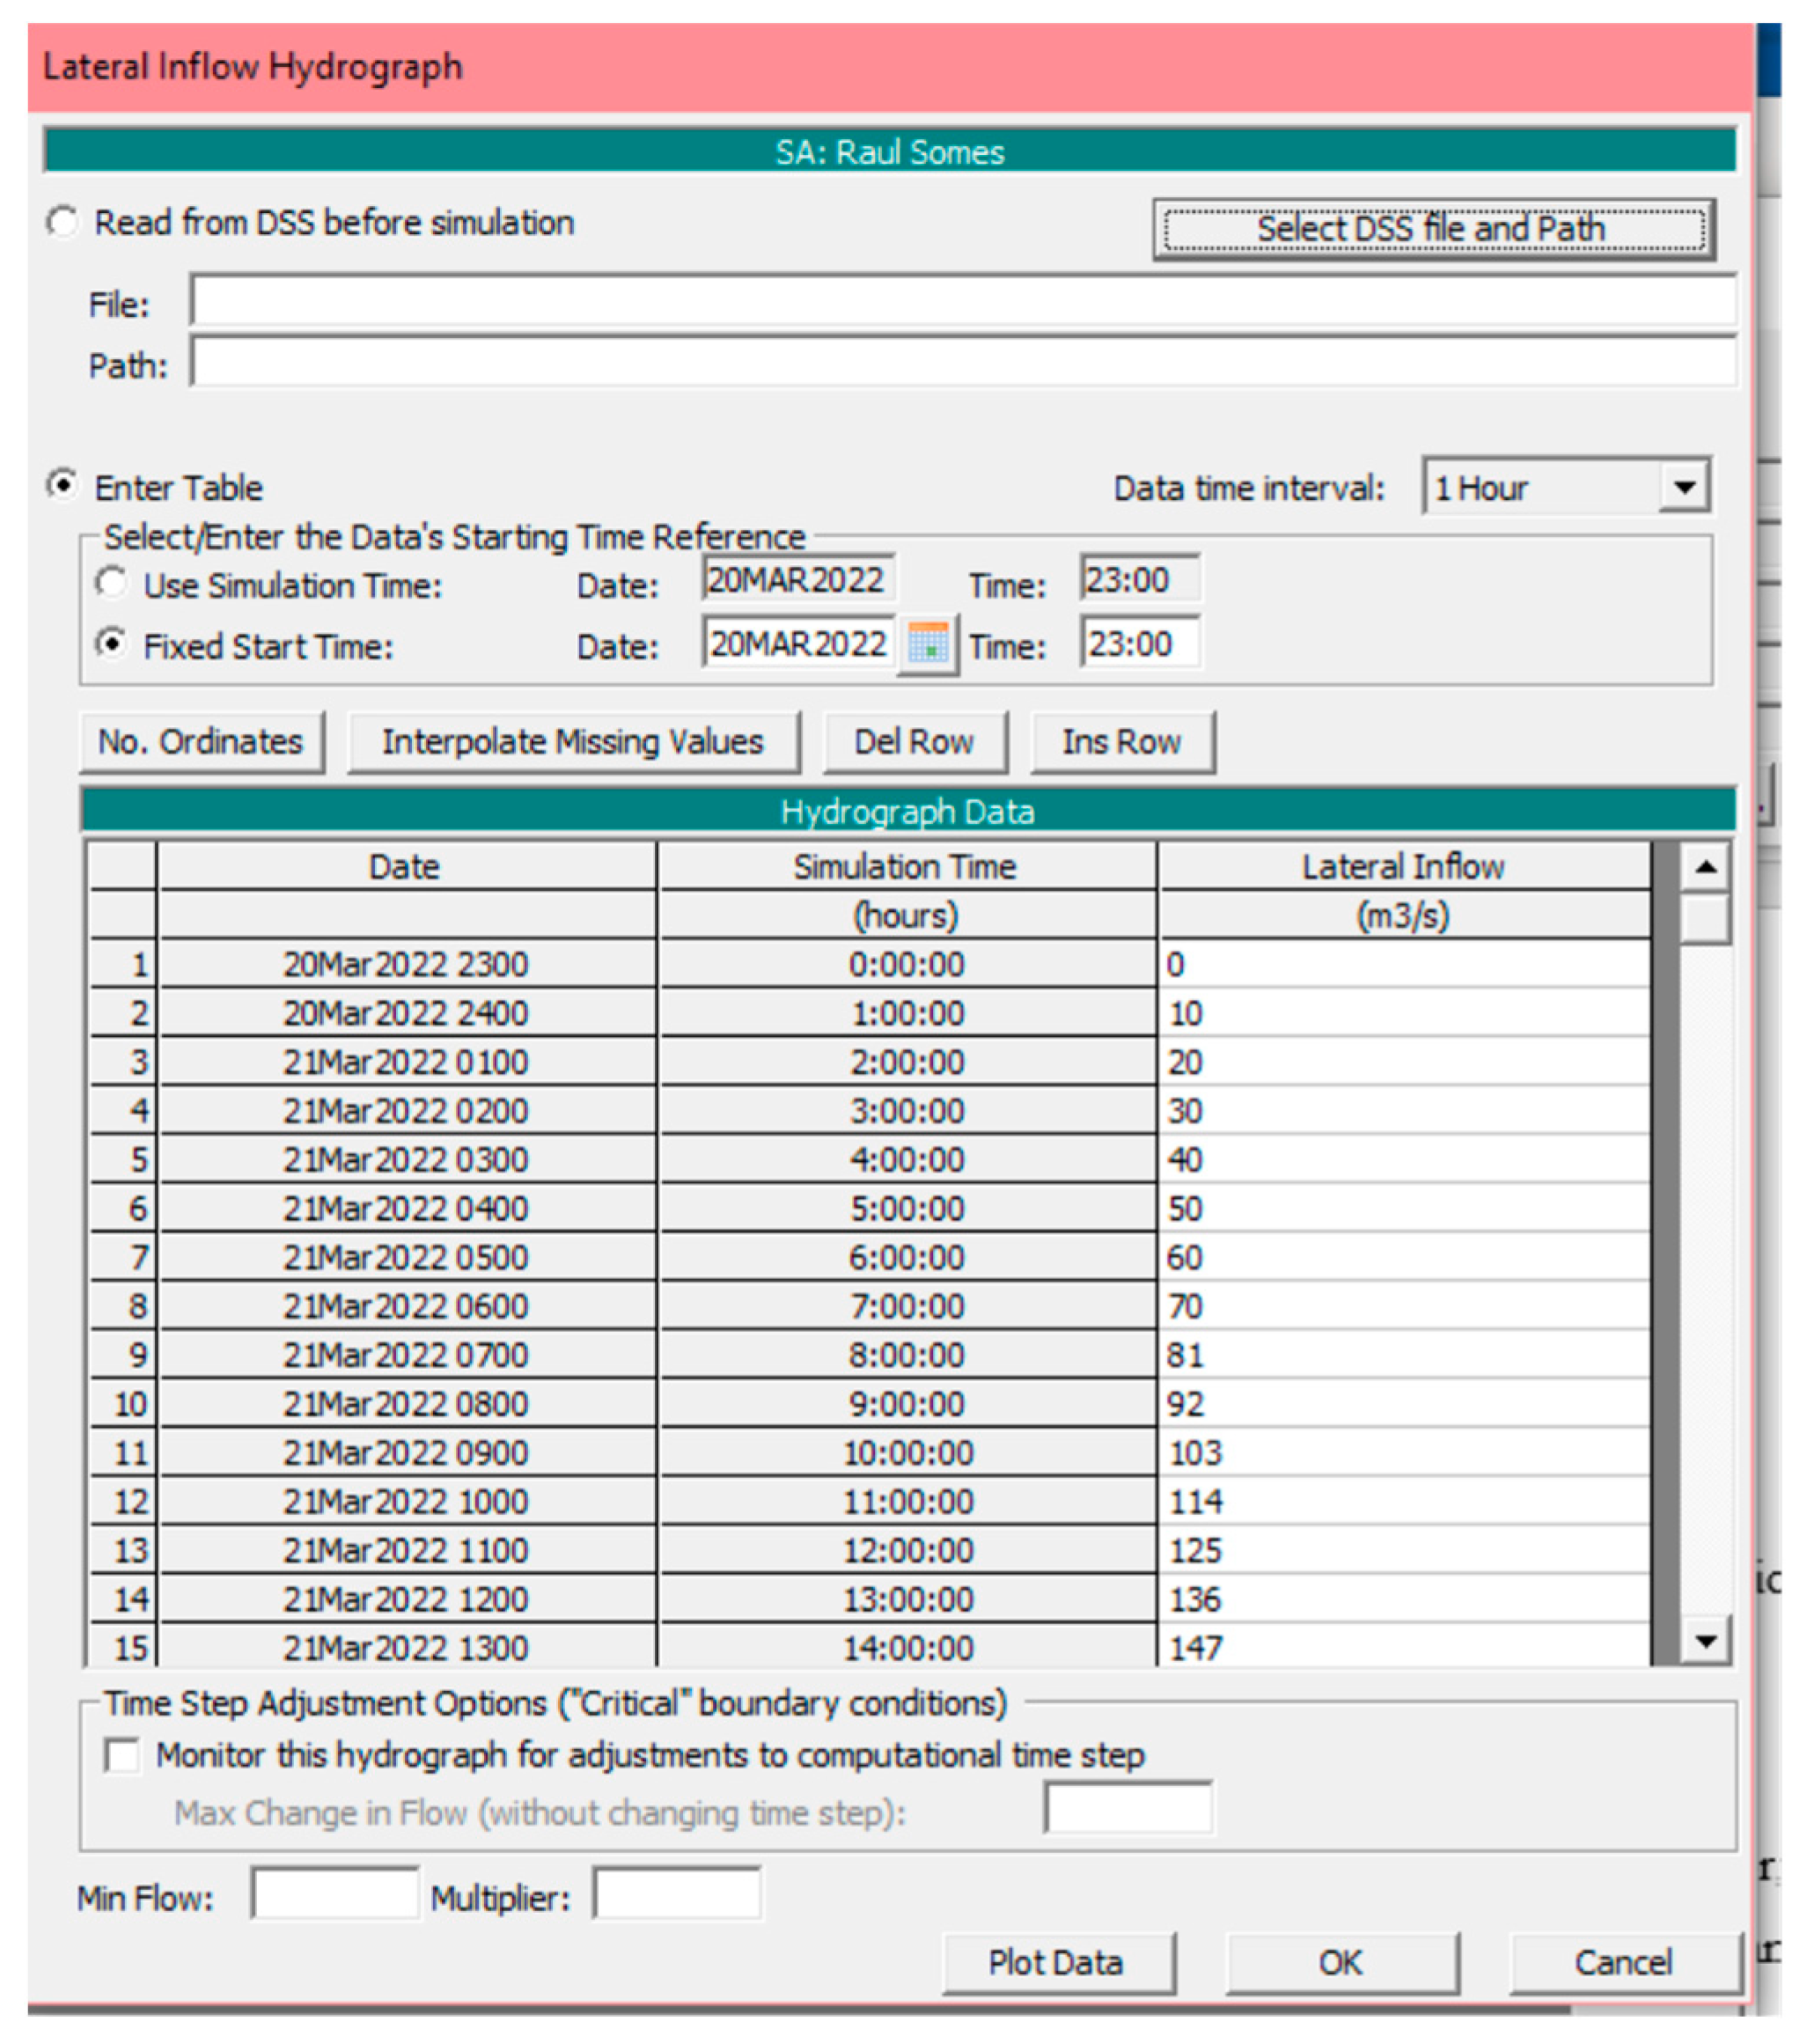
As shown in
Figure 12, the dam overflow started on 20 March 2022, starting at 23:00, the overflow time interval being defined hour by hour, and the flooding duration was 5 days until the date of 25 March 2022, until 02:00.
Next followed the setting of the minimum elevation, namely, 335.00 m as previously presented, and then it was possible to initialize the simulation. The time intervals for the flood and crack process were then set and then the processing time was set to 15 s.
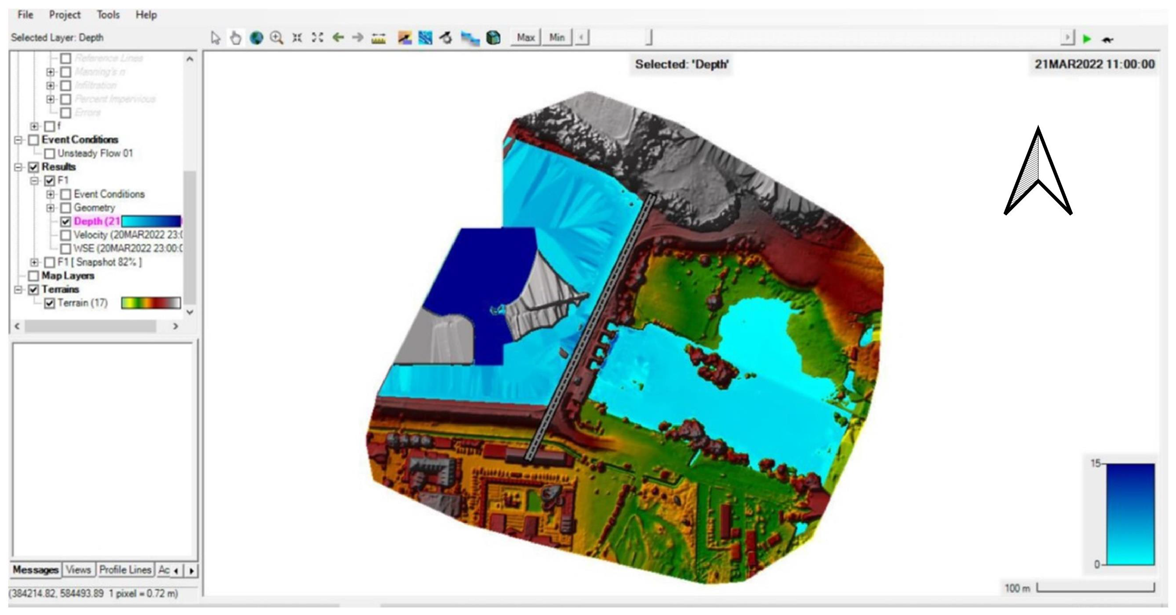
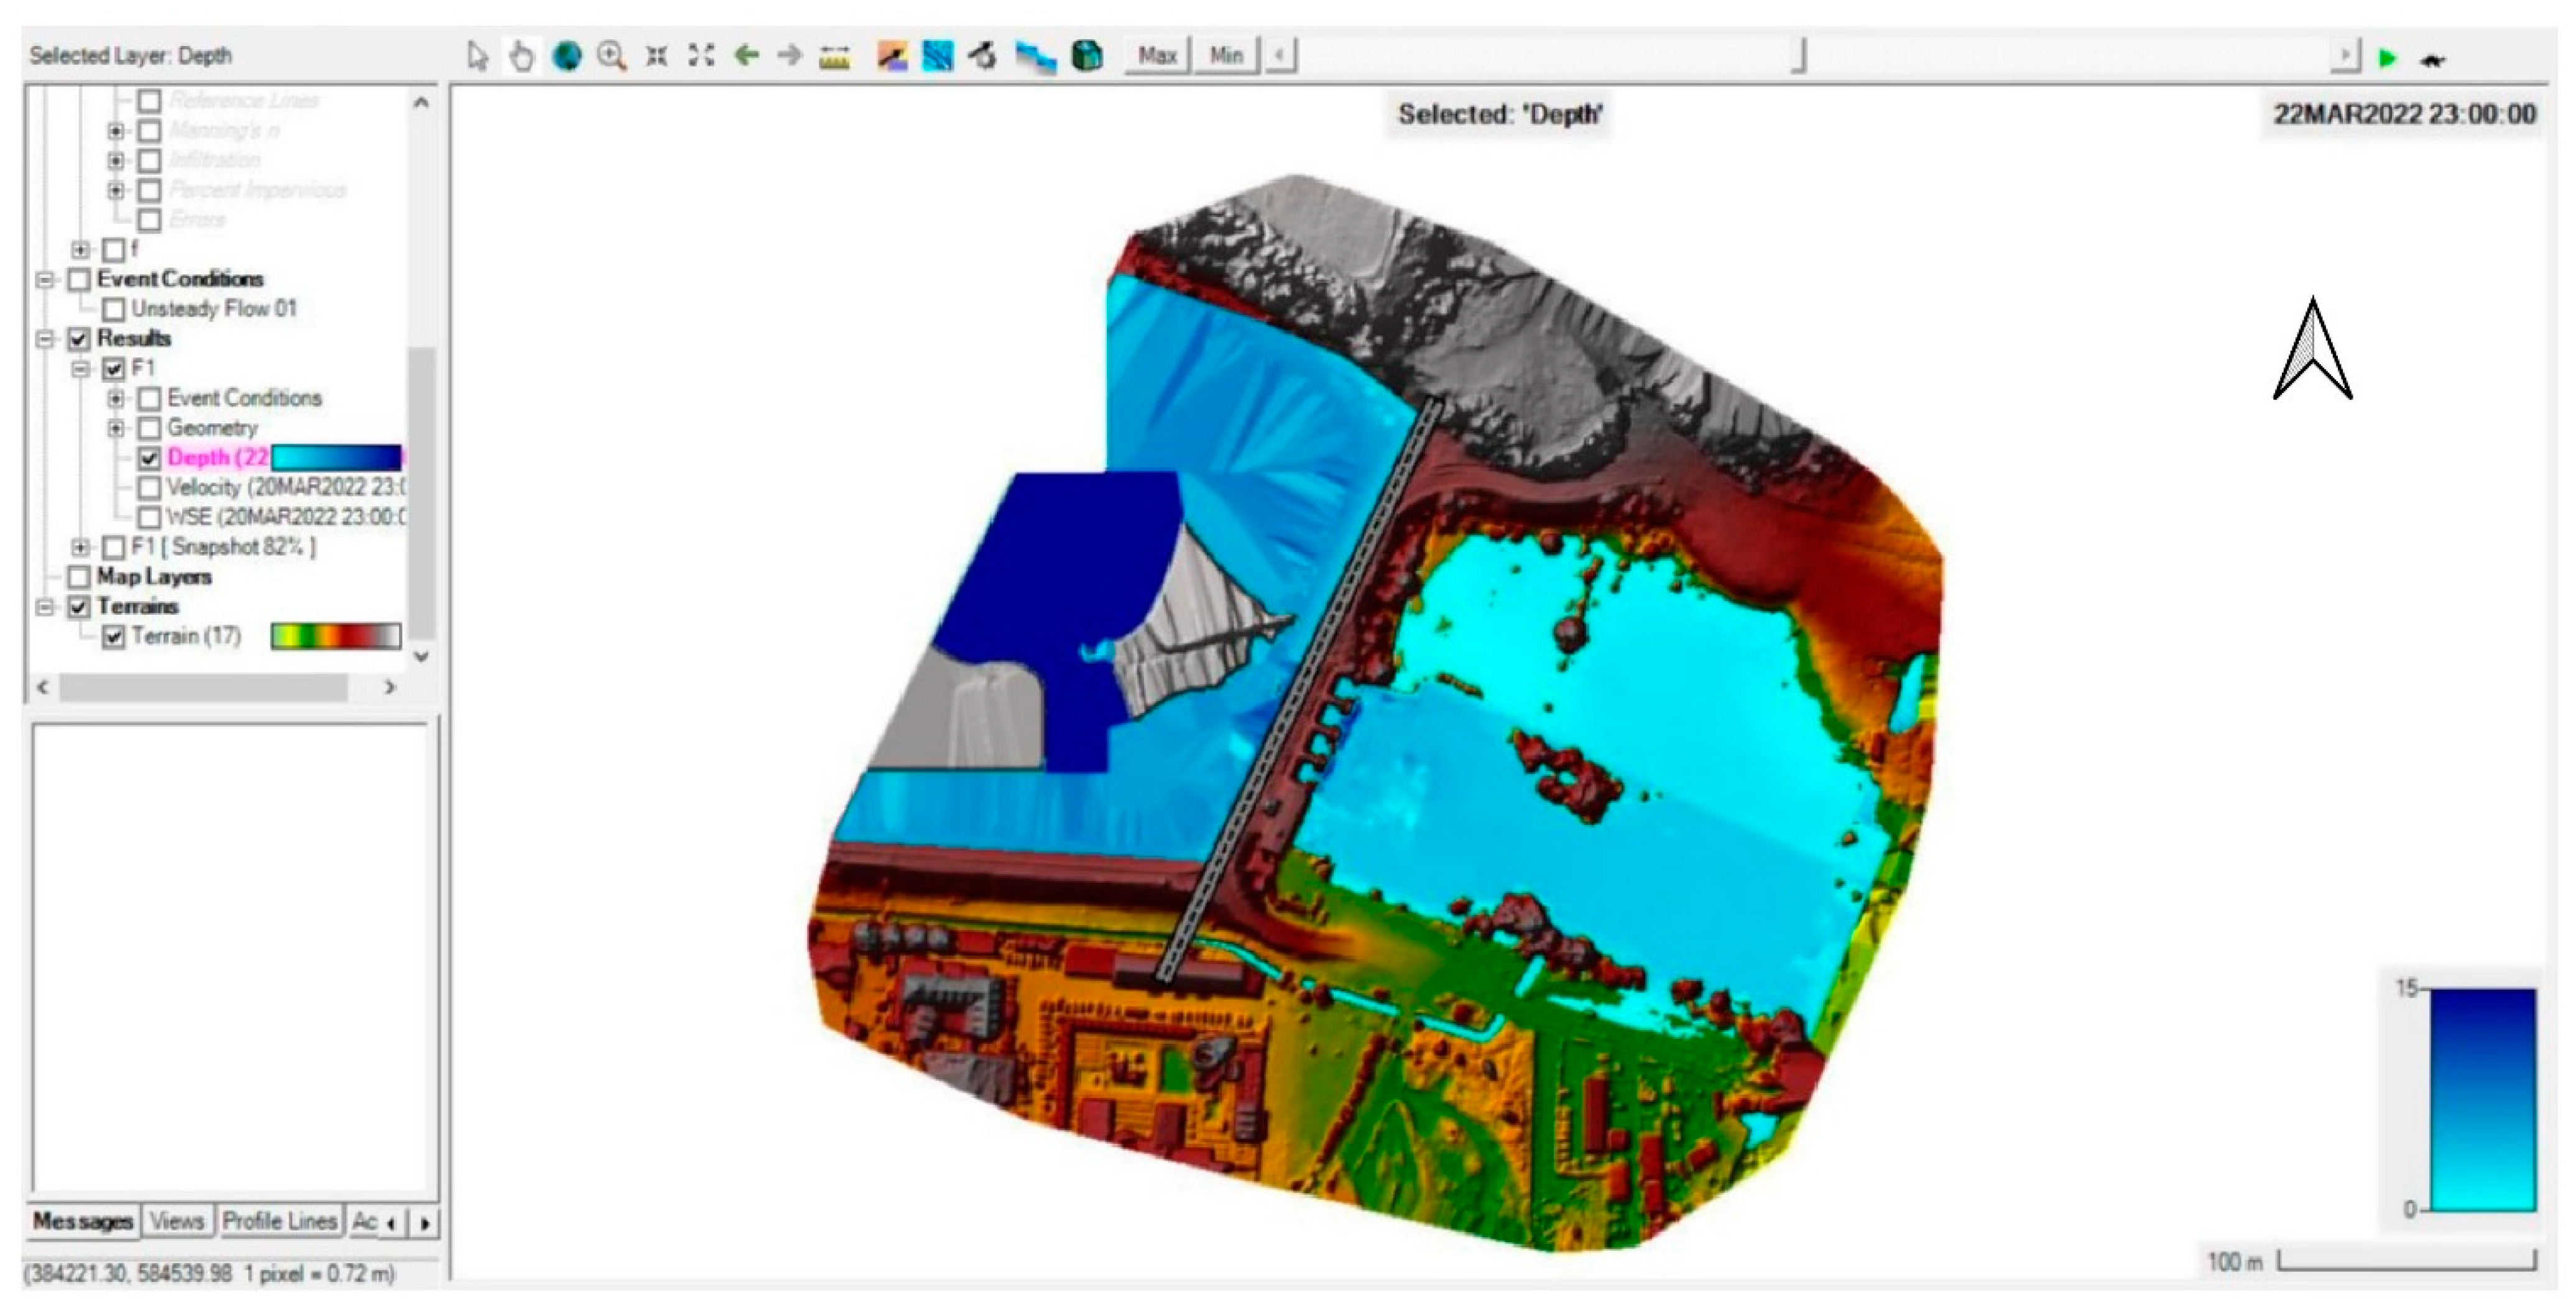
In the following (
Figure 13), the results of the performed simulation are presented. For better visibility and clarity of the figures, we chose to present the initial and intermediate stages of the floods in
Appendix A and
Appendix B, respectively.
4. Discussion
This study proposed an approach that highlights how surveying equipment, photogrammetric equipment (UAVs, Unmanned Aerial Vehicles), and GIS software can contribute to the creation of a complete workflow that can be ensured in an extremely short time (almost real-time) to obtain useful information for the prevention, simulation, and rapid intervention in the case of floods. Both the equipment and the software used belong to the entry-level–medium category from the point of view of costs. However, the obtained results allow the generation of extremely valuable maps and information for those who are responsible for the intervention in the flood study area.
The use of technology was chosen as an alternative to the use of satellite images taking into account the fact that, for the type of images of phenomena that extend over a longer period of time, it is recommended to use satellite images, but for ongoing phenomena, it is more difficult to use these images satellite images for Romania and similar countries that do not invest in emerging technologies. This means that, in such regions, the specialists have exclusively available commercial satellite images with resolutions lower than 0.5 m, which do not provide the clarity and precision necessary for the most accurate modeling of the terrain. In other words, for simulation and forecasting, it is better to use satellite images, because they can look at a more general framework (the entirety of the Somes River, in our case), but for punctual emergency intervention, to see the amount and area of the affected areas, it is recommended to use UAV equipment.
The type of revisiting of the satellites must also be considered, which sometimes can take 5–10 days, so that the provision of exclusive information based on satellite images from such sensors, for a phenomenon that happens in a few hours, can be late. Thus, we refer to a commercial resolution of 1m, a maximum of 0.5 m compared to 2–3 cm/pixel with the drone, which allows obtaining DEMs much more precisely and in a more accurate way.
One of the advantages of using UAV images is that they can also be taken on days with a lot of clouds, by flying below the cloud ceiling, which is simply impossible for satellite images. Another aspect related to costs is also important: the processing and interpretation of satellite images involve better-trained specialists; thus, it requires higher costs [
49,
50,
51,
52].
Of course, in addition to the advantages presented related to obtaining images using UAV compared to satellites, there are also several limitations and disadvantages, which are listed below:
The obligation to obtain flight authorization from relevant institutions makes flying in certain areas difficult, or even extremely limited, with the need for special flight permits.
The limited flight ceiling, for example, in the study area, it was limited by law to a maximum of 120 m above the ground.
For weather conditions related to wind, it is recommended that UAV flights be conducted in wind conditions of a maximum of 12–18 mph.
The take-off and landing area must be relatively flat, respecting distances from crowds of people and without endangering people not involved in the UAV flight.
Cold weather can be an impediment, given that the flight takes place in cold weather conditions that do not comply with the technical specifications of the UAV equipment (less than −5 degrees Celsius).
The position of the Sun can affect the quality of certain photos, depending on the location of the drone’s photo sensor.
For the legal operation of UAV flights, qualified personnel with pilot licenses are required.
Certain areas (waters and lakes) present particularities of reflectivity that make it very difficult or even impossible to process images in specialized software (Pix4D, AgiSoft, etc.).
First, an orthorectified image was obtained by processing the images obtained from the UAV flights. An average error of 2–3 cm was obtained, compared to significantly chosen points (dam edge, road marks, etc.) measured with the help of GNSS (Global Navigation Satellite System) technology. The points determined with the help of GNSS can be the subject of field measurements and office jobs that would involve several days of measurements and office calculations for an equivalent study area (approximately 2 hectares). This would include grid point verification and compensation, point density by planimetric displacement method, and complex calculations.
It must be considered that, following some field activities (UAV flights) that totaled 1 h of fieldwork, information was obtained with a tolerable error for the preparation of analyses, simulations, and GIS modeling for flood studies.
Also, a DEM of the study area was obtained, which proved useful in the subsequent preparation of the simulation and flood studies. The generated 3D model respects the relief and level curves that exist in the area.
Research, articles, case studies, and works previously published by specialists in this field of study have focused on the separate study of the way in which useful geospatial information can be obtained with the help of terrestrial measurement technologies or GIS analysis with predetermined information. The main topic that this study proposed to analyze is related to the efficient and fast way in which information related to floods can be obtained from the ground, with the help of UAV, because in the case of an intervention in the event of a disaster, time is the most considerable challenge.
The contributions of photogrammetry and topography to the field of preventing the effects of natural disasters have been known for several years. However, there are certain regions (the studied one is an example) where the authorities are still skeptical about the use of UAV information in the case of rapid intervention, complaining of a certain dubious accuracy.
Our study was concerned with an important area located in the immediate vicinity of the city of Cluj-Napoca, Romania. We therefore studied an extremely populated area (approximately 450,000 inhabitants in the metropolitan area), Floresti Commune, an urban locality with the largest population in Romania, according to the most recent population census (approximately 55,000 inhabitants). Although the operation of UAVs (Unmanned Aerial Vehicles) could also present certain risks, especially in the case of fully autonomous flights, these risks can be avoided by announcing the flights in advance. They have the advantage of durability.
5. Conclusions
Monitoring a disastrous event is important at present because the consequences of such a phenomenon directly affect society. The involvement of the authors in this research area was motivated by this and aimed to contribute to the prevention of disasters and to the limitation of material and (especially) human damage caused by them. The purpose of this work was the study of an area with high flood potential of the residential houses in the immediate vicinity.
As in any other field, there are advantages and disadvantages to the use of photogrammetric measurement methods, such as: The first significant advantage is the time taken to take aerial photograms; and the reduced staff, as only one authorized person is required to perform the flight. Important disadvantages to mention are the tracking of favorable weather conditions, the energy deficit of the battery, the need for the presence of a specialized person in the processing of the data acquired in the field for their correctness, and, from the authors’ point of view, the high cost of the necessary equipment in order to conduct photogrammetric measurements. In terms of the latter disadvantage, this study was conducted with UAV and GNSS equipment at the entry-level range.
The purpose of this work was to develop a complete workflow that includes all the stages conducted to accomplish a simulation in the case of the increase in the water flow of the Someșul Mic River. To achieve the final goal, namely, the simulation of the process of increasing the water flow, it was necessary to undertake the following steps:
The creation of a topographic map for the studied area using UAV technique was achieved after downloading and processing the images taken during the two UAV flights. Good precisions were obtained (2–3 cm/pixel), sufficient to create an orthophoto image, which faithfully reflected the studied area and that are the basis for the preparation of subsequent documents (DEM, level curves, flood simulation, etc.)
The data processing developed following the drone flight was undertaken with the Agisoft Metashape 1.8.5 software, processed and transformed into shapefiles with the help of Global Mapper, and processed with the help of the HEC-RAS software to obtain the estimated results.
The preparation of documentation was conducted by converting the file formats resulting from the images by transforming them into HEC-RAS-compatible files (shapefiles).
Creating a simulation to present possible disasters: The elevations at which the Someș River is located led to the determination of the river’s volume. The minimum elevation of the river is 335.146 m–0 m3 and the maximum elevation is 408.927 m–1055.577 × 103 m3.
The dam was defined as a unifying element that connects the Someș River, which represents the water drainage area, and the water overflow area, represented by the possibly flooded area. The intended simulation was successfully conducted for the three phases of the possible flood (primary, intermediate, and final), which proves that the initial data taken with the drone were suitable for creating a complete workflow.
This study therefore implemented a complete workflow model, starting at the stage of retrieving primary information (in the form of images from the drone), continuing with the stage of downloading and processing, and ending with the stage of transformation, modeling, and processing using specialized flood simulation software.
In the future, the authors aim for this simulation to be used by specialists to help people in areas possibly affected by natural disasters. The development of the study procedure can be conducted by adding several cycles of measurements with the aim of a more thorough detailing, for a better clarity of the evolution of the possible flooding process. Another approach direction for future studies is related to the applications of UAV LiDAR sensors for collecting information that can be used for flooding monitoring and simulations. The greatest desire of the authors of this paper is that the effort put into the development of this simulation model be a direct support in avoiding a disaster.


 ,
, 


