Article

Analytic Investigation of Hooked Stirrups on Seismic Behavior of Reinforced Concrete 3D Frame Buildings

by
Ibrahim Baran Karasin
Department of Construction Technology, Diyarbakir Vocational School of Technical Sciences, Dicle University, Diyarbakır 21280, Turkey
Appl. Sci. 2023, 13(20), 11590; https://doi.org/10.3390/app132011590
Submission received: 8 September 2023 / Revised: 19 October 2023 / Accepted: 21 October 2023 / Published: 23 October 2023

Abstract

:
Ensuring the safety and stability of buildings during earthquakes is of utmost importance. This can be achieved by assessing the seismic performance of reinforced concrete structures with consideration of design details. This study focused on the seismic behavior of reinforced concrete buildings by comparing the effects of two different types of stirrups, namely those with a 135° angled end-hook shape and straight hooks, with variation of concrete strength. Pushover analysis of a sample building was performed to determine the effect of hook shape on stirrup reinforcement with a constant volumetric ratio for various concrete strength classes. The results of the analysis indicated significant differences in concrete strength and seismic behavior between the two stirrup configurations. The hooked stirrups demonstrated superior energy dissipation capability and ductility, which led to better seismic performance compared to unhooked stirrups across varying levels of concrete strength. To extend the investigation, the study compared the Mander et al., Kent–Scott–Park, and Kappos–Konstantinidis concrete models with different concrete classes (C50-C25-C20-C16-C10). The findings emphasized the importance of stirrup configuration in the design of earthquake-resistant structures. The study concluded that RC structural performance with the 135-degree hooked concrete members exhibited much better behavior of the 90-degree members for the various concrete strength. In this way, it has been revealed the arrangement and detailing of reinforcement in the construction beams and columns improves the governing effect on seismic structural performance.

1. Introduction

In areas that are prone to frequent earthquakes, it is crucial to ensure that reinforced concrete buildings always maintain their stability and structural integrity. Achieving this requires extensive study of the various structural components and their response to seismic loads. Reinforced concrete structures are widely used due to their ability to carry these loads, but their seismic response is highly dependent on reinforcement detailing and arrangement. Stirrups, which form an integral part of the reinforced concrete structure, increase the load-carrying capacity of columns and beams to resist lateral forces during earthquakes. Stirrups prevent buckling by confining the concrete and improve the seismic performance of the structure by increasing energy dissipation.
In order to obtain a comprehensive assessment of the seismic behavior of reinforced concrete structures, this study specifically focuses on the effect of two different types of stirrups, i.e., hooked and unhooked stirrups. Previous research has shown that hooked stirrups can improve energy dissipation and ductility by providing additional restraint to the concrete core, while unhooked stirrups, although widely used, may provide relatively limited benefits in this regard [1,2,3,4,5,6,7,8,9,10,11,12,13,14,15,16,17,18]. Rosso et al. [19] estimated the effect of corrosion on the capacity and ductility in their study. Cucuzza et al. [20] have compared numerical and analytical predictions for the shear capacity of fiber-reinforced concrete beams based on experimental literature tests considering the role of the fracture energy in the size effect. Saribas et al. [21] have investigated the effects of the hook angle and hook length of the sub-standard transverse reinforcement on the compression behavior of the columns in their experimental study. In her thesis study, Güley [22] compared the compressive strengths, maximum load deflections, ductility, and stress–strain relations of confined concrete using experimental setups with hook angles of 135°, 112.5°, and 90°. While analyzing the obtained data, she considered and compared mathematical concrete models proposed by Mander, Saatçioğlu and Razvi, and İlki. Turmanidze [23] found in his experimental thesis that when hook angles are 90/135°, 90° hooks open and 135° hooks do not. As a result of this opening, the longitudinal reinforcement starts to buckle in this direction, since the buckling length perpendicular to the 90° stirrup arm direction increases. This study has shown that it is a very important requirement that the stirrup hook angles should be 135° as specified in the regulations; otherwise, if even one of the hooks is 90°, unexpected capacity reductions and collapses are inevitable because of the asymmetrical confinement effect caused by stirrup opening and early longitudinal reinforcement buckling.
Many researchers are working on developing new strategies to address stirrup deficiencies. The study by Montuori et al. [24] investigates the impact of the confined concrete constitutive law used on the flexural strength and curvature ductility of reinforced concrete sections strengthened by wrapping them with FRP (fiber-reinforced polymer). The stress–strain relationship of confined concrete is affected by the number of layers, the type of FRP used, as well as the size and shape of the section. Fakharifar et al. [25] have suggested an innovative hybrid reinforcement method that incorporates both traditional longitudinal steel reinforcement and FRP stirrups. Fiber-reinforced polymers (FRP), such as carbon fibers (CFRP), glass fibers (GFR), and aramid fibers (AFRP), have superior properties compared with steel stirrups to enhance the strength and ductility capacities of concrete columns [26,27]. Montuori et al. [28] examined and compared the outcomes of an analysis that investigated different constitutive models for reinforced concrete components confined with FRP. Their study presents a comparative analysis that aims to highlight the “critical issues” that impact the constitutive laws. The innovative FRP wrapping techniques with the advantages of corrosion resistance and high strength to weight ratio are also available for ultra-high-performance concrete (UHPC) to enhance the compressive performance of the composite columns [29]. The main advantage of this approach is the improved strength and ductility, which is achieved through the significant confining pressure that the FRP stirrups provide to the longitudinal steel reinforcement and core concrete.
When axial pressure is applied to reinforced concrete structural members, the load causes longitudinal shortening and transverse expansion due to the Poisson effect. However, confinement pressure applied in the transverse direction can delay cracks and collapse caused by lateral expansion, thereby improving the strength and strain capacity of the concrete. This confinement effect transforms the uniaxial stress state into a triaxial stress state [30]. The effect of confinement on the stress–strain relationship was first reported by Considere in 1903 [31], and Richart et al.’s 1928 [32] study revealed that applying lateral oil pressure increased the axial compressive strength of concrete. Since then, researchers have conducted numerous studies and proposed analytical models to better understand the mechanism of confinement in concrete. Spiral or rectangular geometry transverse reinforcements are commonly used to characterize the winding effect in reinforced concrete structures. Burdette and Hilsdorf’s 1971 [33] experiments suggested that stirrups with different hook angles and placement frequency increase column ductility. Meanwhile, wrapping was found to slightly increase strength. Kent and Park’s 1971 [34] model for confined and unconfined concrete under uniaxial compression, based on the experimental results of Roy and Sozen, Soliman and Yu, and Bertero and Felippa, has been widely accepted by researchers. Scott et al. [35] later improved this work in 1982. During the 1980s and 1990s, renowned researchers, including Mander et al. [36,37] in 1988 and Saatcioglu and Razvi [38] in 1992, made significant contributions to the field of study by presenting distinct models based on their experimental investigations. In the 2000s, a group of primary researchers, such as İlki et al. [39] in 2004, Binici [40] in 2005, Eid and Dancygier [41] in 2006, and Konstantinidis et al. [42] in 2007, emerged. They each presented diverse models derived from empirical findings.
In certain situations, various researcher’s models can produce distinct outcomes. To investigate this, this study analyzed the stress–strain graphs put forth by Scott et al. [33], Kappos et al. [43], and Mander et al. [34], and compared them against different concrete strength grades, including C10 (compressive strength 10 MPa), C16 (compressive strength 16 MPa), C20 (compressive strength 20 MPa), C25 (compressive strength 25 MPa), and C50 (compressive strength 50 MPa).
The SeismoStruct 2023 software [44] served as the numerical analysis tool for conducting comprehensive simulations, ensuring accuracy and reliability. This enabled the efficient examination and evaluation of the dynamic response and compressive strength of structures, considering both hooked and unhooked stirrups.
The shape of the standard end-hook shear, according to SNI 03-2847-2013 [1], can be seen in Figure 1a. The shape of the 90° end-hook (tied by wire on both ends) is shown in Figure 1b.
The utilization of a 135-degree bend at both ends for single-leg crossties is widely prescribed in global building codes, including the Indonesian Concrete Code [16].
Concrete’s structural behavior is typically assessed through mono-axial compressive tests, which determine the relationship between mono-axial stress and the corresponding strain. However, in most cases, concrete experiences a tri-axial stress state. If transverse stresses are insignificant, then the mono-axial state is representative of the stress condition, and the mono-axial compression resistance is dependable. Conversely, when lateral stresses are significant, concrete’s behavior changes significantly in terms of resistance and ductility [45]. Generally, confinement increases compressive strength and rotational ductility of critical sections [28]. The author observed significant structural damage in Figure 2, Figure 3 and Figure 4, which can be attributed to the absence of stirrups and 90-degree hooked stirrups. These images were obtained during site inspections [46] conducted by the author to investigate the impact of the Kahramanmaraş and Pazarcık Earthquakes on 6th February 2023 in Diyarbakır province, located around 240 km from the epicenters of the earthquakes.
The main objective of this research is to reveal the significant differences in concrete strength and seismic behavior resulting from the use of different stirrup configurations. By performing numerous numerical analyses on sample structure, it was aimed to demonstrate the different effects of hooked and unhooked stirrups on the seismic performance of reinforced concrete buildings considering various concrete classes. In this manner, it is noted that a simple constructional ‘detail’, such as unhooked stirrups, may have a greater impact on the seismic behavior of the entire structure.

2. Materials and Methods

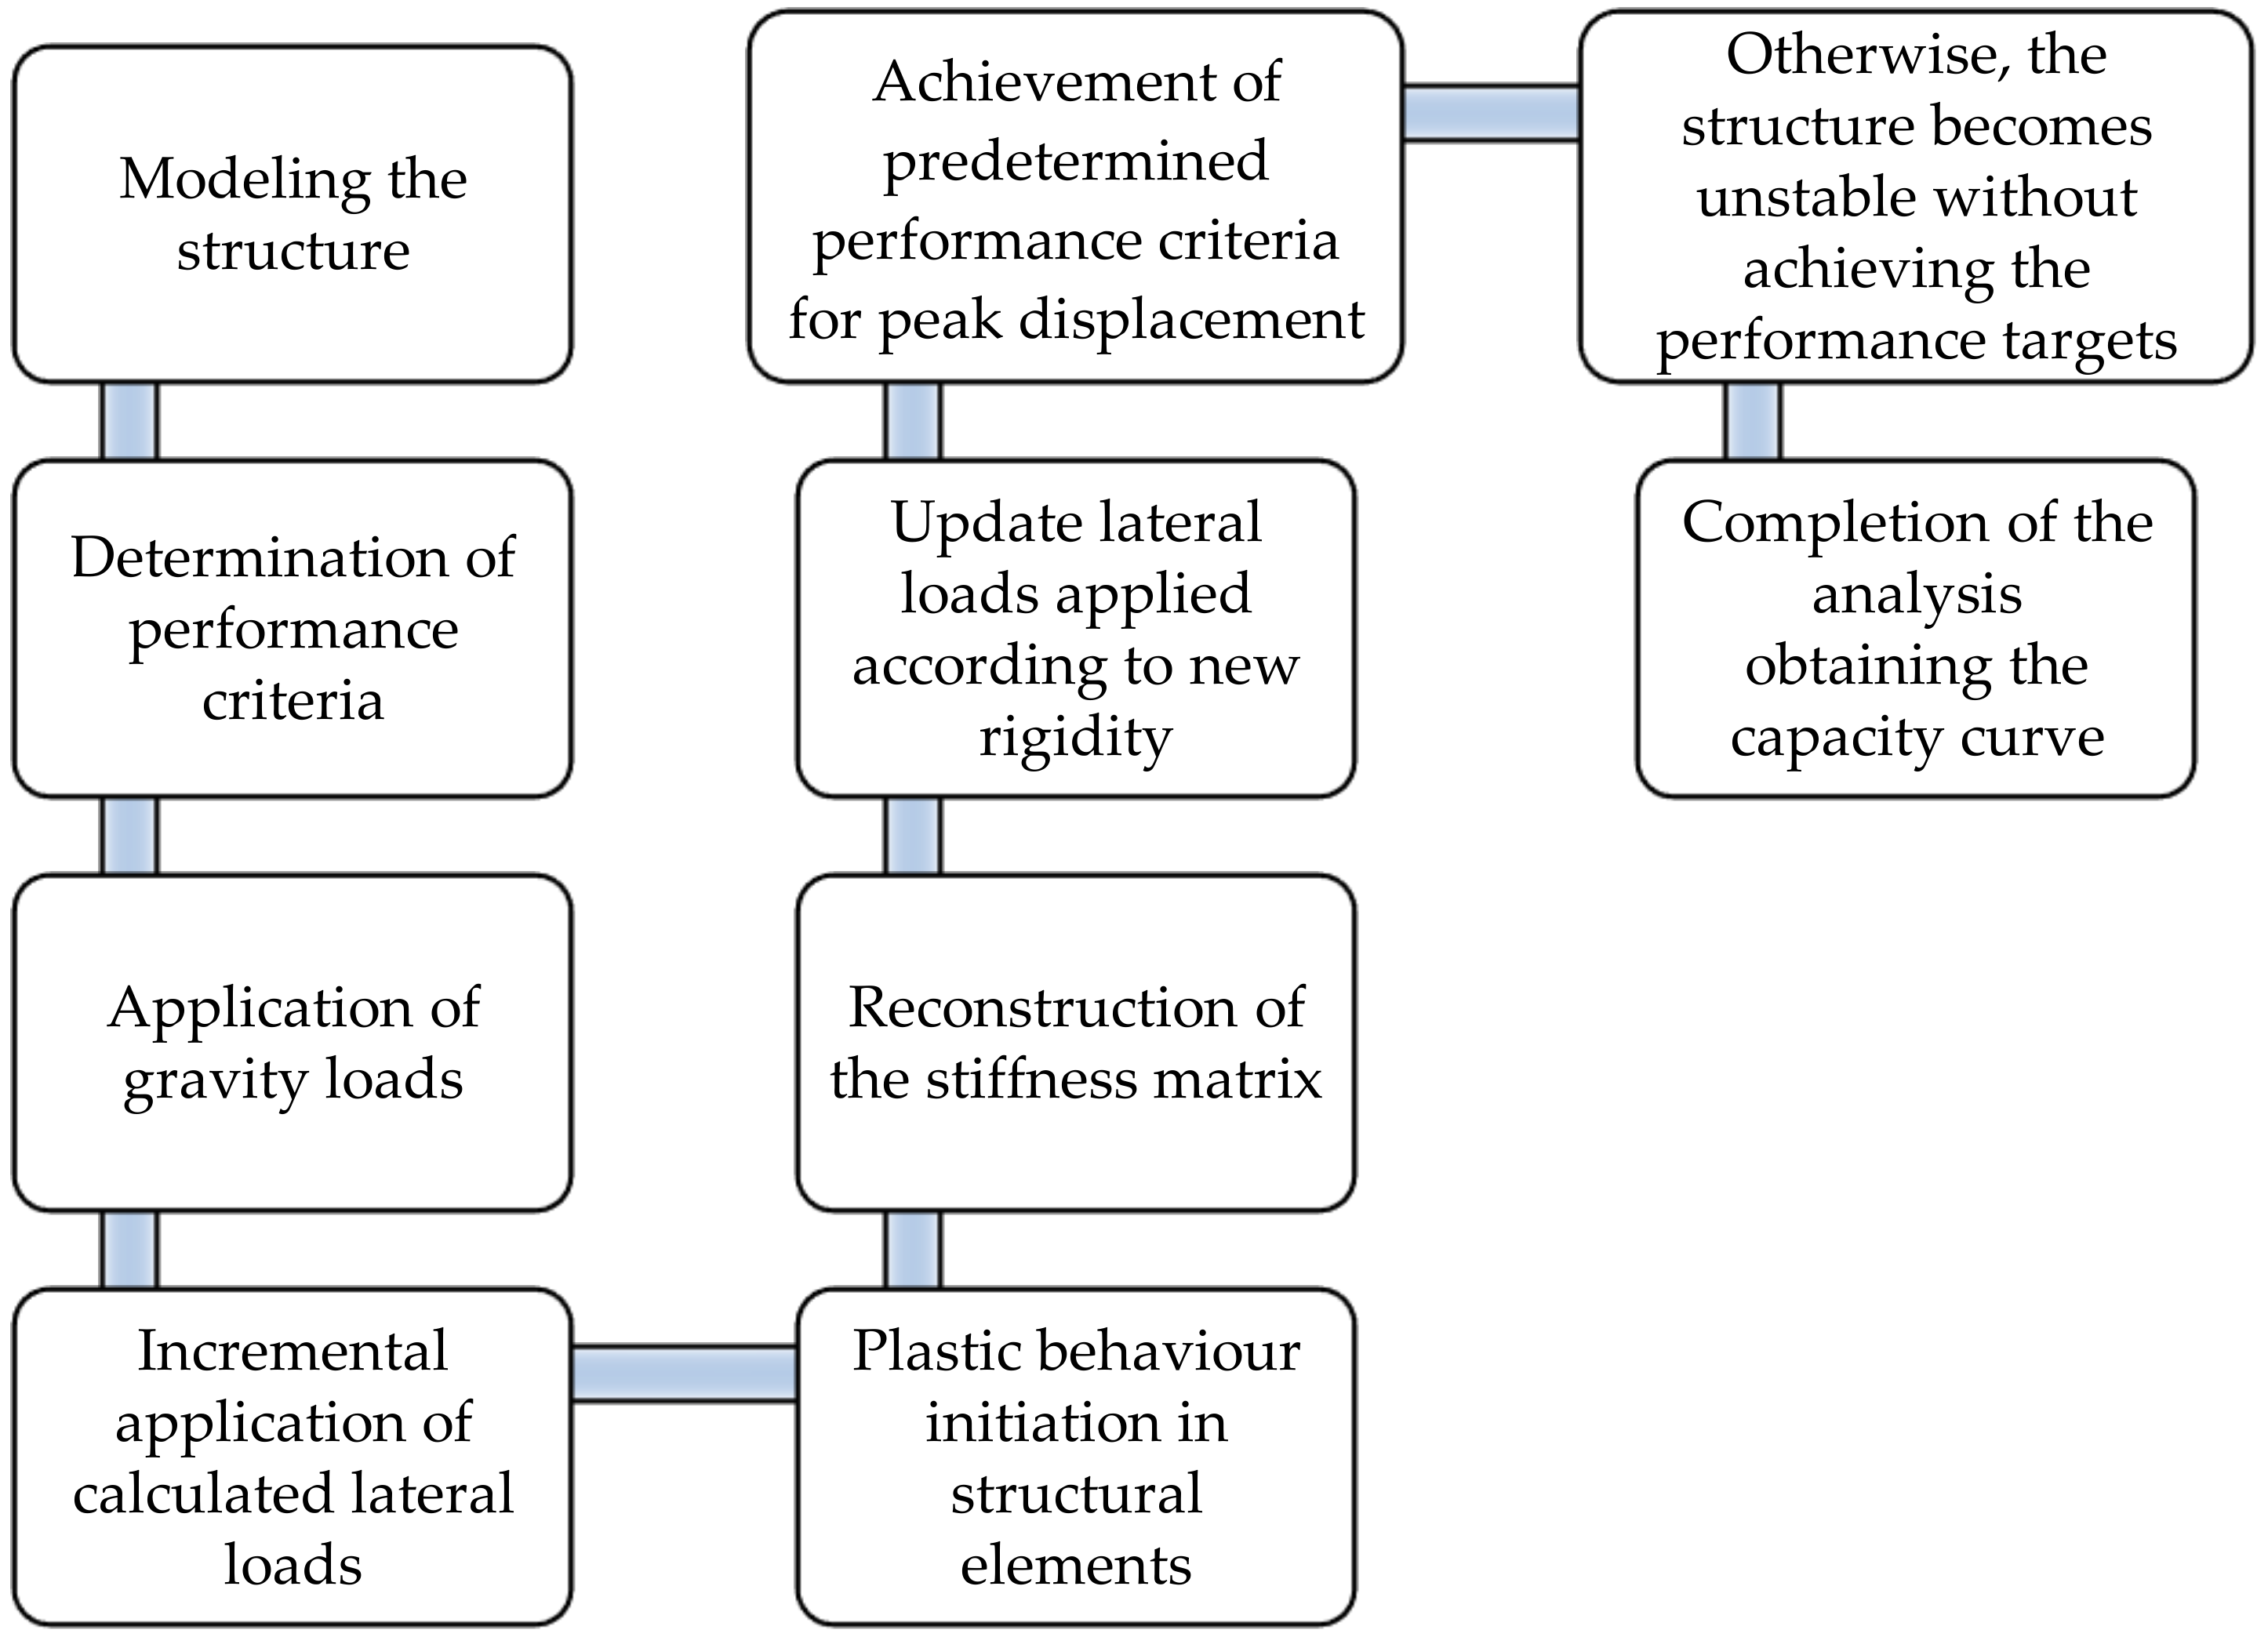
2.1. Pushover Analysis

In the field of structural engineering, the pushover analysis method is used to estimate how a structure will respond to increasing lateral forces and a consistent vertical load distribution until a target displacement is achieved. The process involves multiple sequential elastic analyses that together form an approximation of the force-displacement curve for the entire structure. To begin, a two- or three-dimensional model is created that includes load-deformation diagrams for all lateral force-resisting elements. Vertical loads are applied first, followed by a pre-defined lateral load pattern that is distributed throughout the building height. The lateral forces are gradually increased until some of the structural elements begin to yield. At this point, the model is adjusted to account for the reduced stiffness of the affected elements, and the lateral forces are increased again until additional elements yield. This process is repeated until a controlled displacement at the top of the building reaches a certain level of deformation, or the structure becomes unstable. The resulting data are plotted to create a capacity curve that shows the relationship between roof displacement and base shear [47]. There are two types of static pushover analysis: force-controlled and displacement-controlled. In the force-controlled pushover procedure, the specific load combination is applied as directed. This procedure should be used when the load is already known, such as in the case of gravity loading. However, numerical issues can arise with this procedure, affecting the accuracy of the results. The target displacement may be associated with very small positive or even negative lateral stiffness due to the development of mechanisms and P-delta effects [48].
Pushover analysis, which has a flowchart shown in Figure 5, has become the preferred method for evaluating seismic performance of structures by codes due to its ease of concept and computation. This analysis allows for the monitoring of the overall capacity curve of the structure as well as the sequence of yielding and failure at the elemental and structural levels. The goal of pushover analysis is to estimate critical response parameters as close to those estimated by nonlinear dynamic analysis as possible [49,50,51,52].
Pushover analysis can provide valuable insight into the elastic and inelastic behavior of structures during earthquakes, given that the structure is appropriately modeled, the lateral load model is selected carefully, and the results are interpreted meticulously. However, for low- and medium-rise buildings with a dominant fundamental mode response, pushover analysis is more suitable. For specialized and high-rise buildings, pushover analysis should be complemented by other evaluation procedures, as higher modes can significantly impact the response [53,54,55].

2.2. Concrete and Rebar Models

In designing and evaluating structures, it is crucial to recognize how building materials behave under various loading conditions. Mathematical models in a wide range of literature are tools that analyze the behavior of building materials under loads. During the process of mathematical modeling, the stress–strain relationship (σ-ε) of the material is evaluated. This relationship is connected to the equations of equilibrium and conformity, which express the material’s shape changes and stress or force. Equilibrium and compatibility equations are independent of material properties and can help identify the margin of error based on the accuracy of the stress–strain relationship. To simplify the analysis, idealized and simplified (σ-ε) curves, called mathematical models, are used in the design and evaluation of structures. These models are necessary for multivariable strength issues related to concrete and steel. Reinforced concrete structures, which consist of concrete and steel with different material properties, require a range of material models. There are many material models used for both concrete and steel, but studies on the relationship between these models are limited. Defining the stress–strain relationship for any material is critical in ensuring structural safety during civil engineering design and evaluation. Material models, such as the Mander et al. concrete model [37], Kent–Scott–Park concrete model [35], Kappos–Konstantinidis nonlinear concrete model [43], and Menegetto–Pinto steel model [56], are used in this study to compare different concrete models per confinement type.

2.2.1. Mander Concrete Model

Based on Mander et al.’s research [36,37], it is recommended that concrete under compressive loading is analyzed using a uniaxial model with fixed confinement. This model is applicable to circular and rectangular sections and can be used for both static and dynamic axial compressive loading. The effect of transverse confinement reinforcement is fixed, and the calculated strain is assumed to be the same throughout the entire stress–strain per unit. To use this model, specific parameters must be provided, including concrete compressive strength (fc), tensile strength (ft), strain per unit at greatest stress, modulus of elasticity (Ec), and specific weight [39]. The stress–strain relationship graph for this model is illustrated in Figure 6. It provides some insight into tensile stresses and the effect of reinforcement.

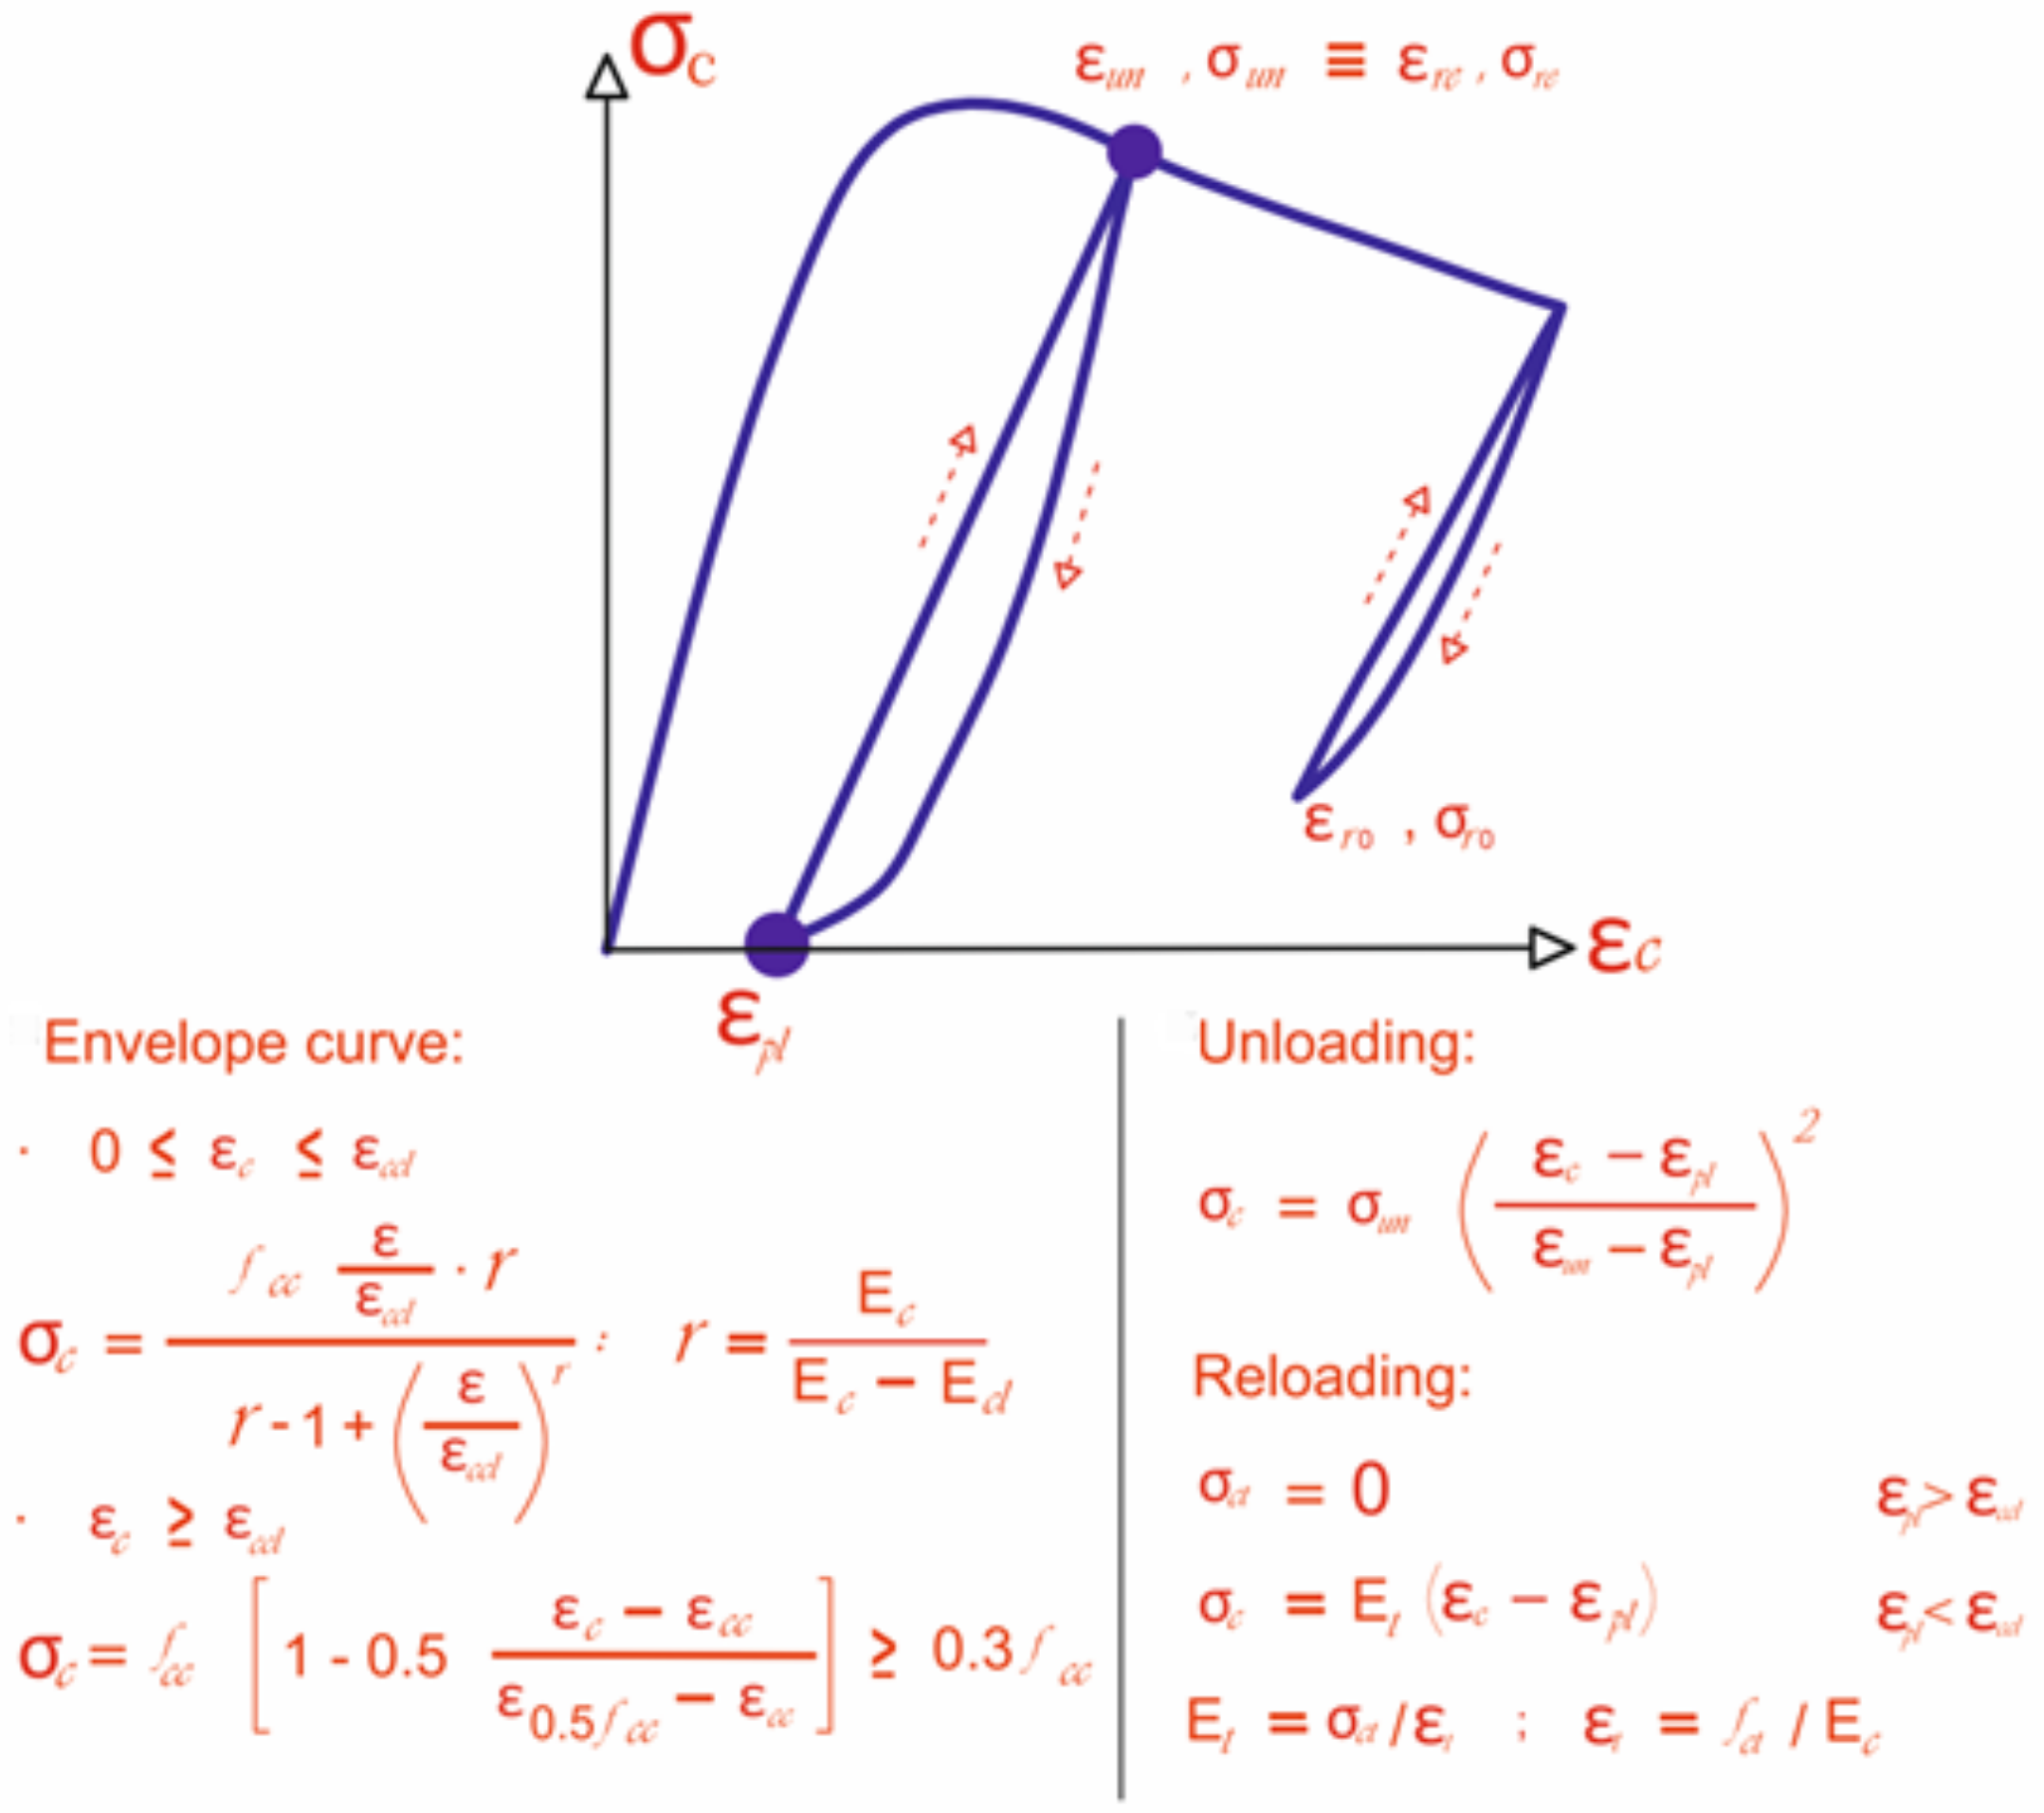
2.2.2. Kappos–Konstantinidis Nonlinear Concrete Model

This model, developed and programmed by Kappos and Konstantinidis [43], is a nonlinear, uniaxial model that incorporates a fixed effect of confinement. It utilizes the constitutive relationship proposed by Nagashima et al. [57] and has been statistically calibrated using a diverse range of experimental data. The impact of transverse confinement is accounted for through the use of a modified Sheikh and Uzumeri [58] factor, which serves as the confinement coefficient. Additionally, there is a consistent fixed effect of confinement throughout the entire stress–strain definition range. To define this model, values for concrete compressive strength (fc), tensile strength (ft), modulus of elasticity, and specific weight parameters are required. Figure 7 displays the stress–strain graphs for this model, which illustrate the unloading relation that is also represented by a second-order parabolic curve.

2.2.3. Kent–Scott–Park Concrete Model
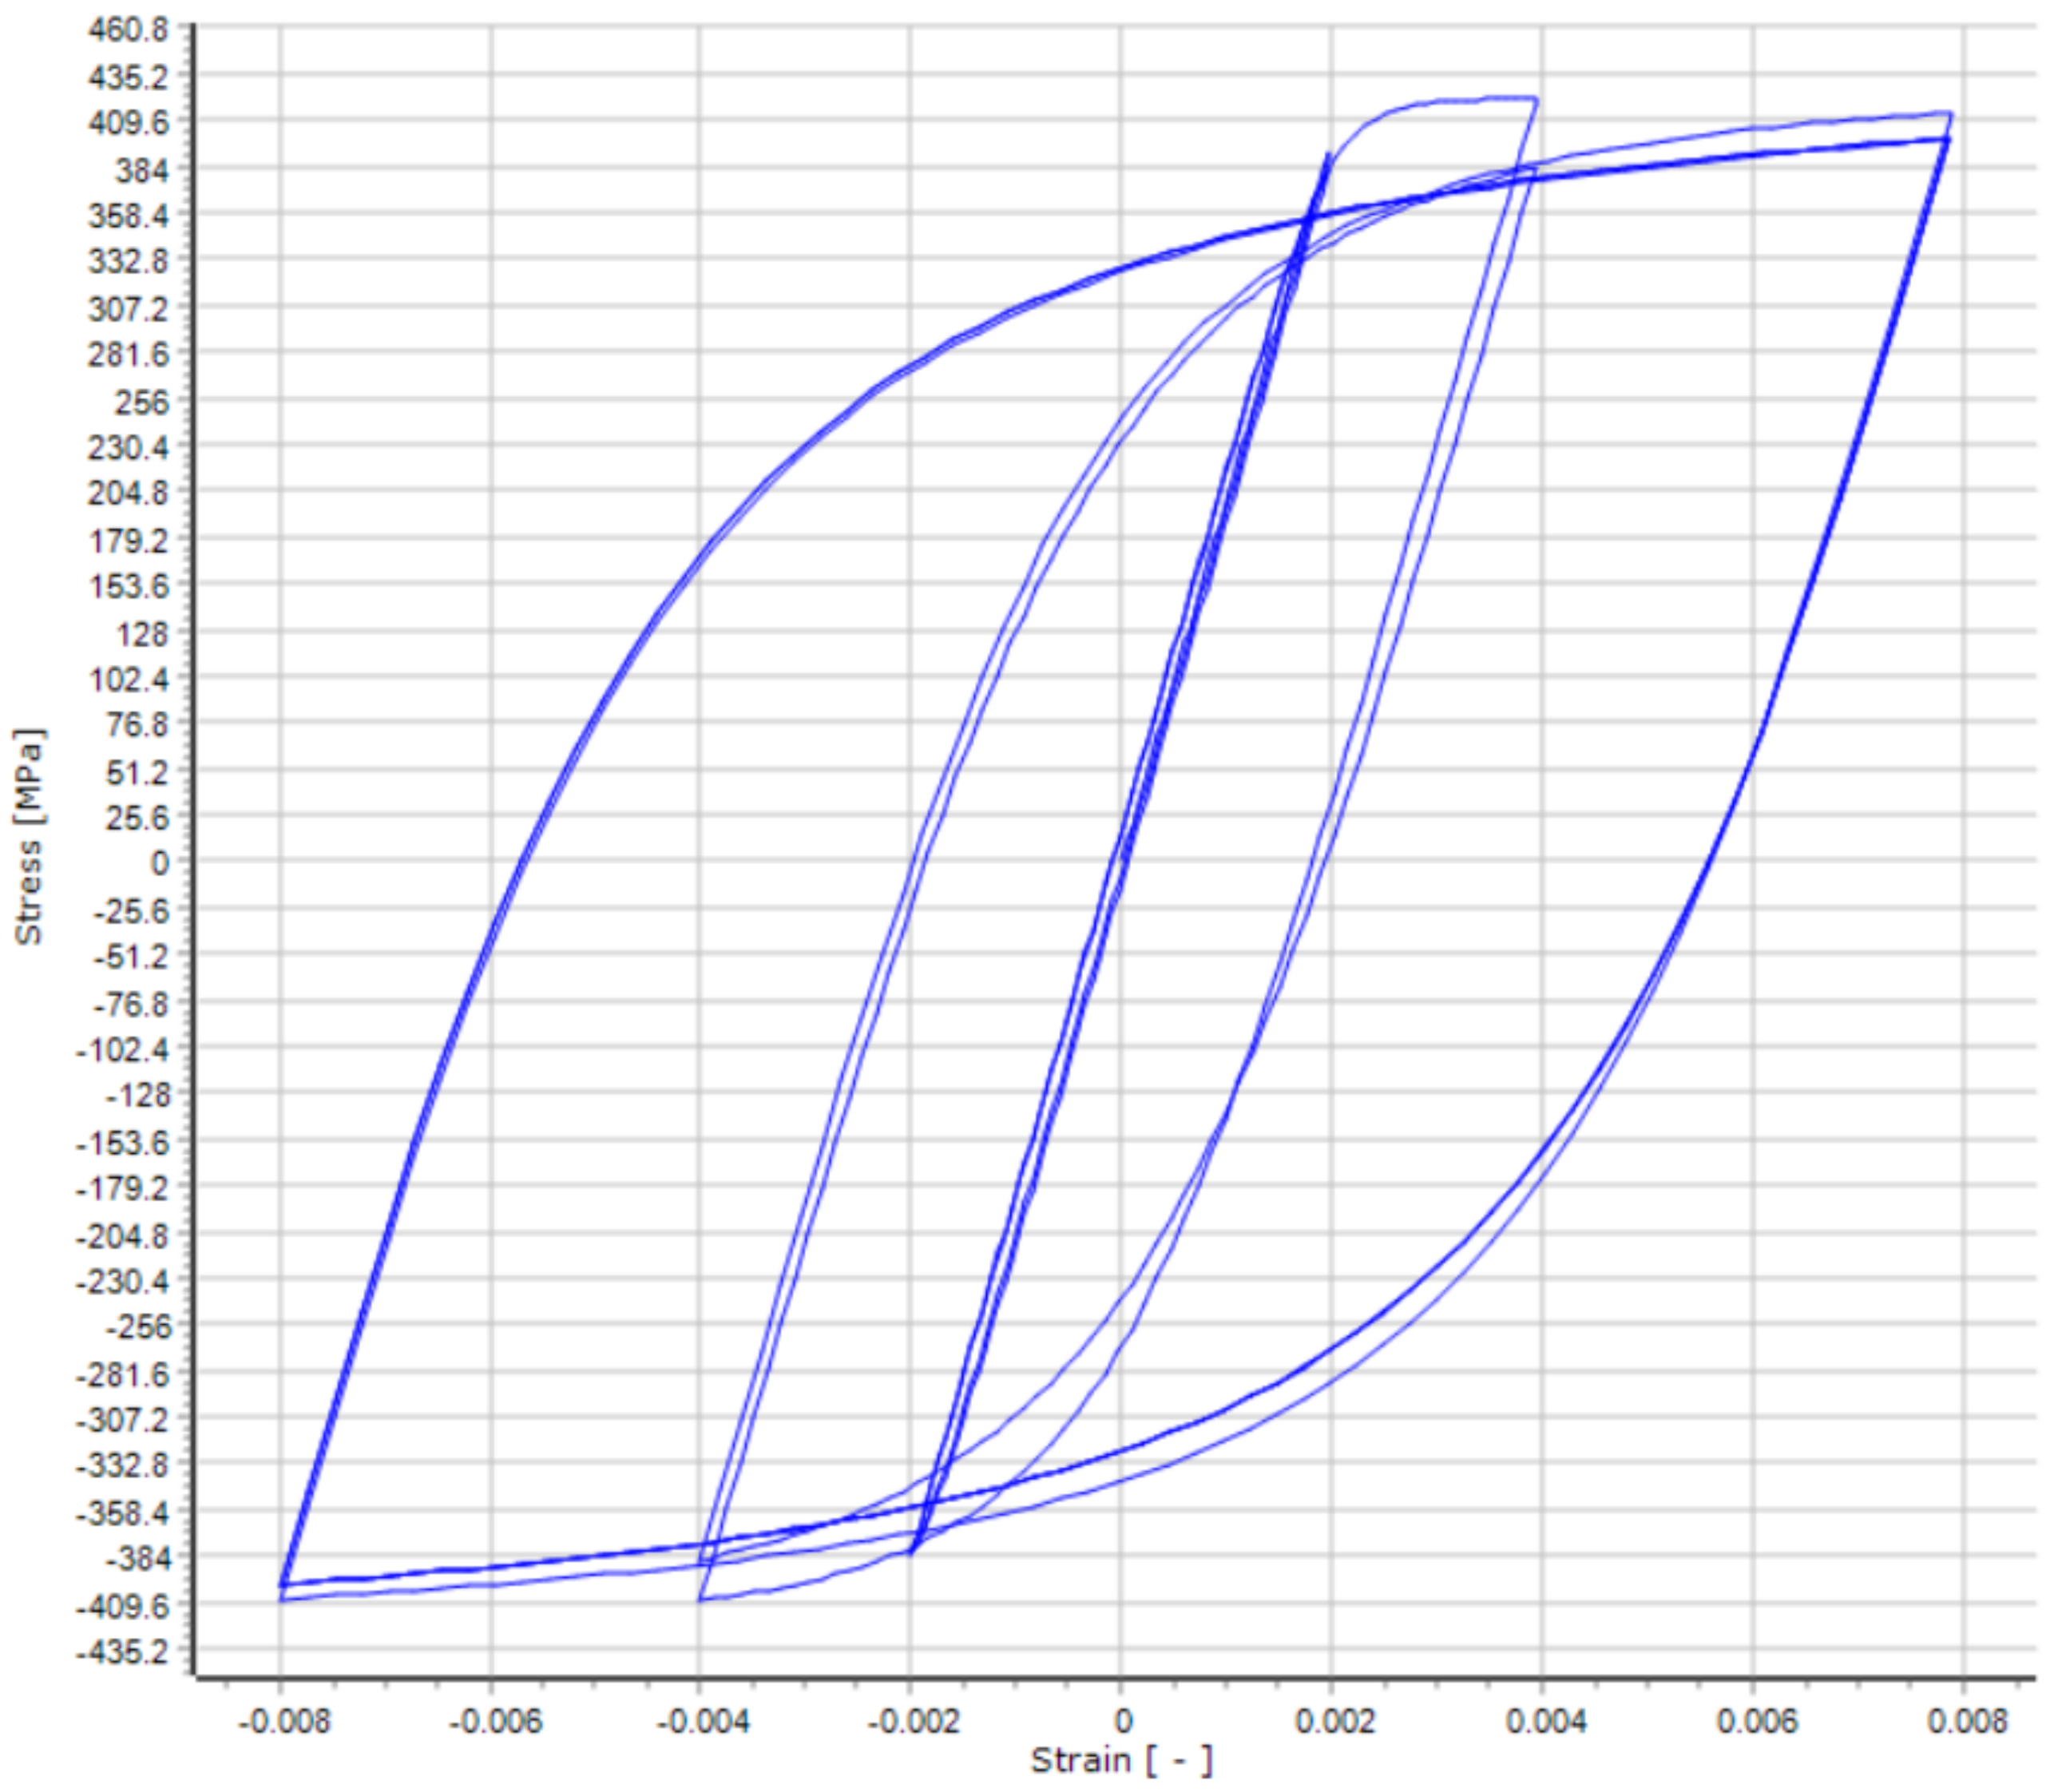
The stress–strain relation for this model is determined by four parameters: axial compressive strength (fc), strain at the compressive strength (ε0), crushing strain (εm), and strength at or beyond εm (fr). This concrete constitutive model is versatile, as it can be applied to both confined and unconfined concrete by adjusting parameter values. In the Kent–Scott–Park model [32,33], the concrete stress–strain relation under compression loading is described by three regions, as shown in Figure 8, assuming positive compression.

2.2.4. Steel Model

The analysis utilized the Menegotto–Pinto steel model, which is classified as a uniaxial steel model. Yassin [59] coded this model based on the stress–strain relationship established in Menegotto and Pinto’s [56] work. It is important to note that this model is best suited for modeling reinforced concrete structures, particularly those that are subject to complex loading and significant load changes. Prota et al. [60] have discussed that with proper calibration, this model can also be used to model smooth rebars that are commonly found in existing structures [61,62]. Figure 9 displays the stress–strain graphs for this model.
The steel material model is chosen as single and constant since the focus of the study is on the concrete strength with respect to different stirrup configurations.

2.3. Plastic Hinge Model

The distributed plastic hinge model was chosen as the nonlinear plastic hinge model. This section focuses on the selection and explanation of the distributed plastic hinge model as the nonlinear plastic hinge model.
The distributed plastic hinge model considers plasticity distributed across all cross-sections and the entire length of the structural element, as illustrated in Figure 10. The model encompasses three distinct types of structural behavior: modeling of longitudinal steel reinforcing bars, modeling of confined concrete’s nonlinear behavior (core concrete), and modeling of unconfined concrete (cover concrete) [63]. In structural element design, numerical models are employed to analyze situations where stress–strain curves extend beyond the elastic region after deformation. These models can be broadly classified into distributed and lumped plasticity. The ‘Evaluation and Design Based on Deformation’ framework for existing or newly constructed structures involves creating internal force–strain relationships using nonlinear modeling techniques.
The strength and deformation capacities of the structural system during earthquake movements are evaluated using both static and dynamic methods. These capacities, aligned with performance targets, are then compared with internal force and strain demands [65]. In summary, the adoption of the distributed plastic hinge model is based on its ability to account for distributed plasticity across the element’s sections and length, providing a more accurate representation of the structural behavior. This allows for a comprehensive understanding of the complex response of structural elements beyond the elastic region, ensuring the design meets performance targets and safety requirements. Utilizing the plastic hinge model for analysis offers the advantage of enhanced accuracy, although it comes with the drawback of increased analysis duration due to its intricate focus on structural components. Despite this potential drawback, the model was chosen to achieve more precise analysis outcomes.
The bond between rebar and concrete is crucial for the strength and stability of reinforced concrete (RC) structures. It allows for load-bearing and coordinated deformation. To analyze the mechanical performance of important components in the plastic stage of RC structures, such as beam–column joints, column–foundation connections, and beam–shear wall connections, a clear understanding of the bond–stress–slip relationship is necessary [66,67,68]. In order to consider the bond–slip relationship of rebars, the nonlinear link definition was defined alongside the plastic hinge definition. The multilinear curve, which is the polygonal hysteresis loop explained in the study of Sivaselvan and Reinhorn [69], was chosen as the response curve for this definition in SeismoStruct software [44].

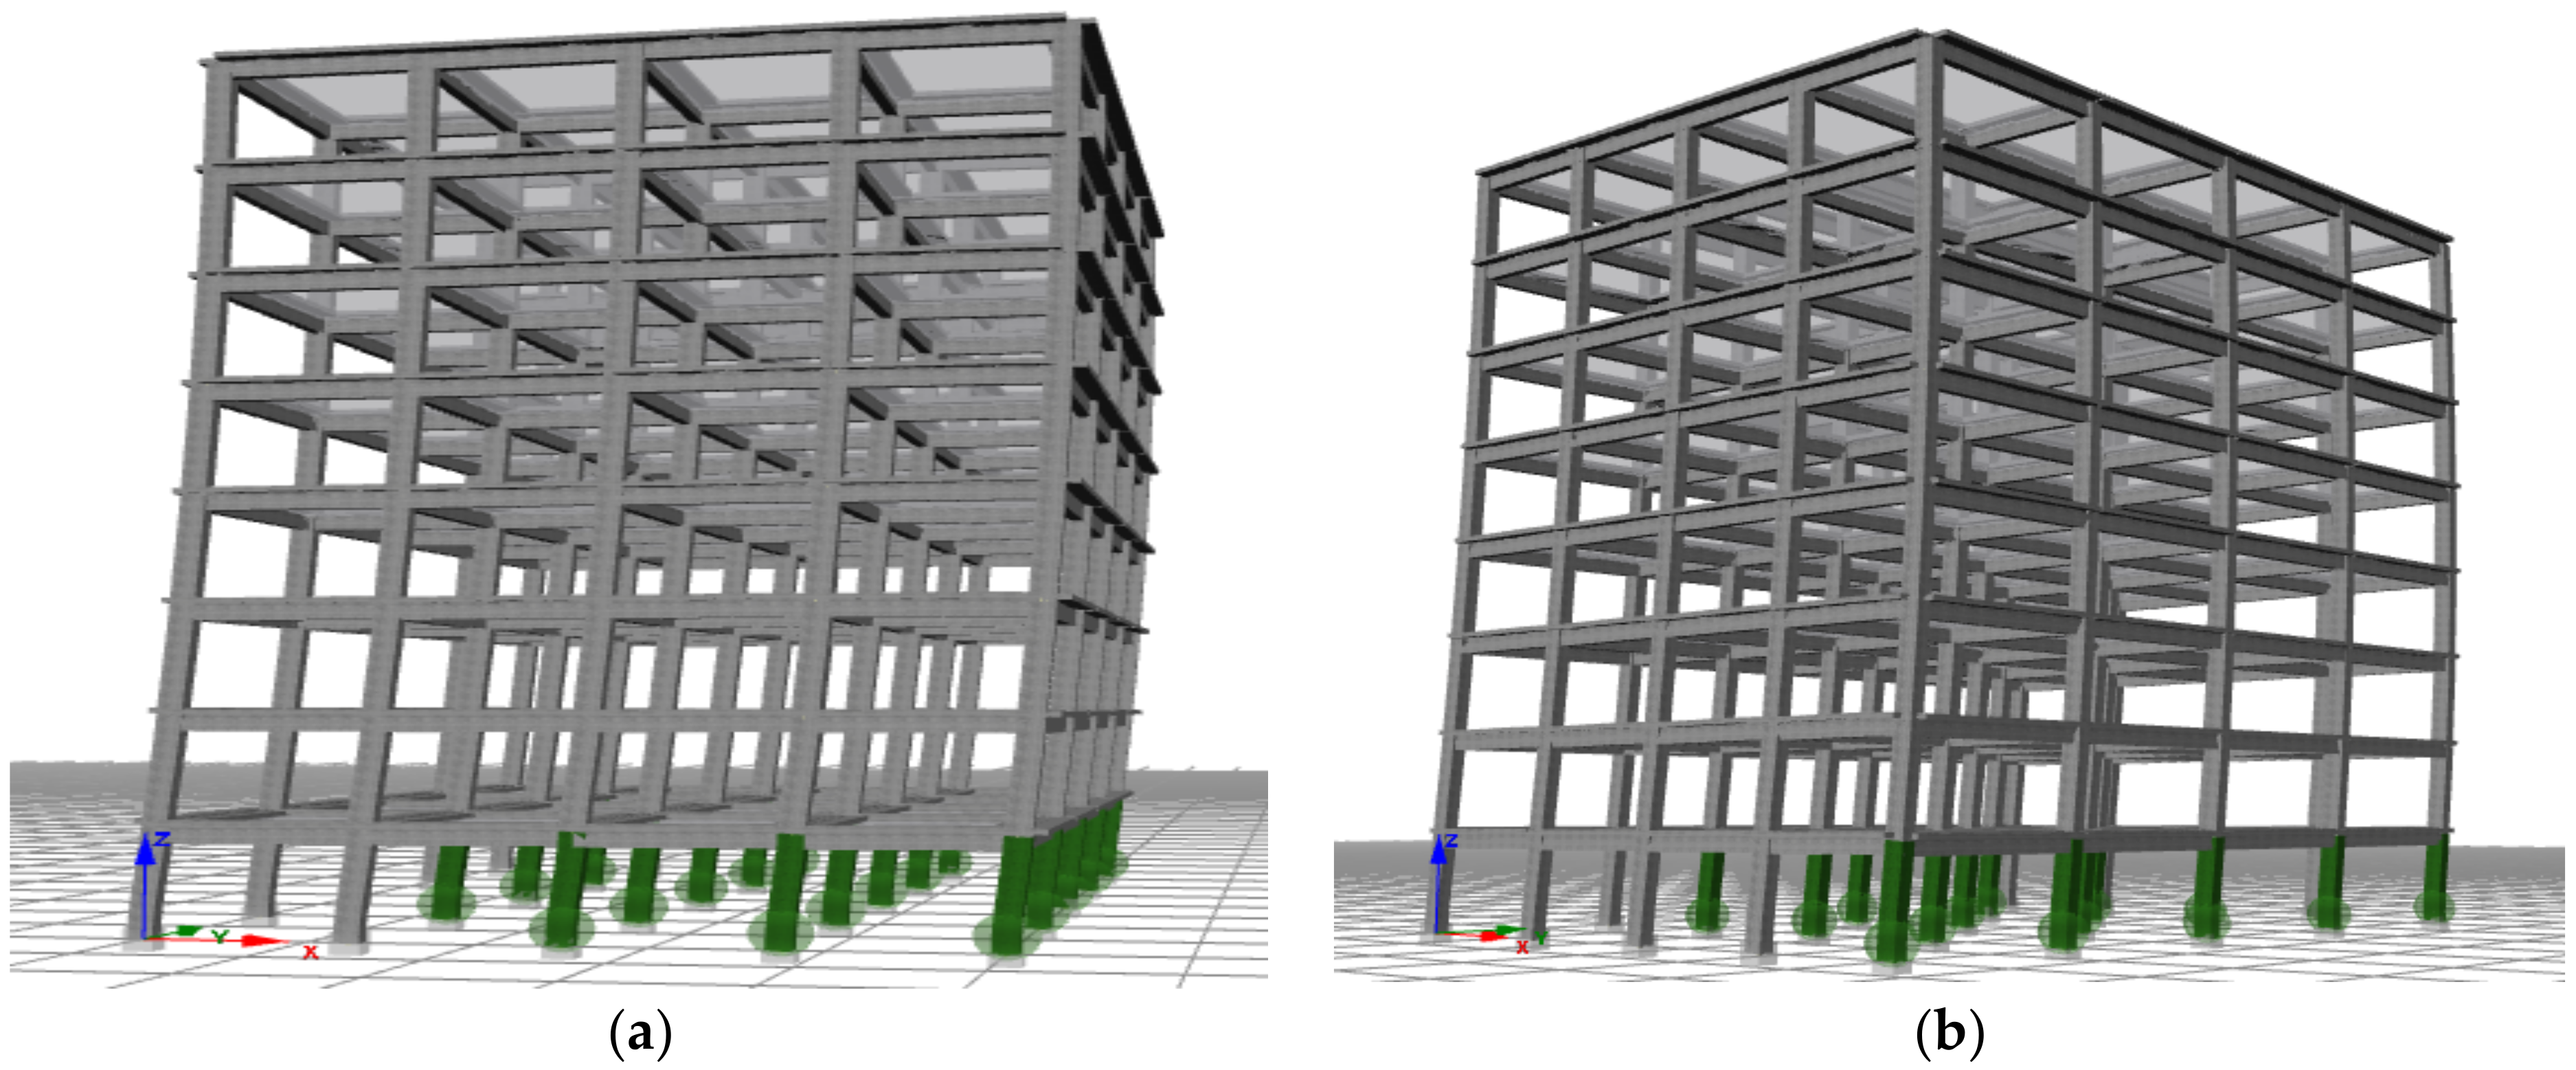
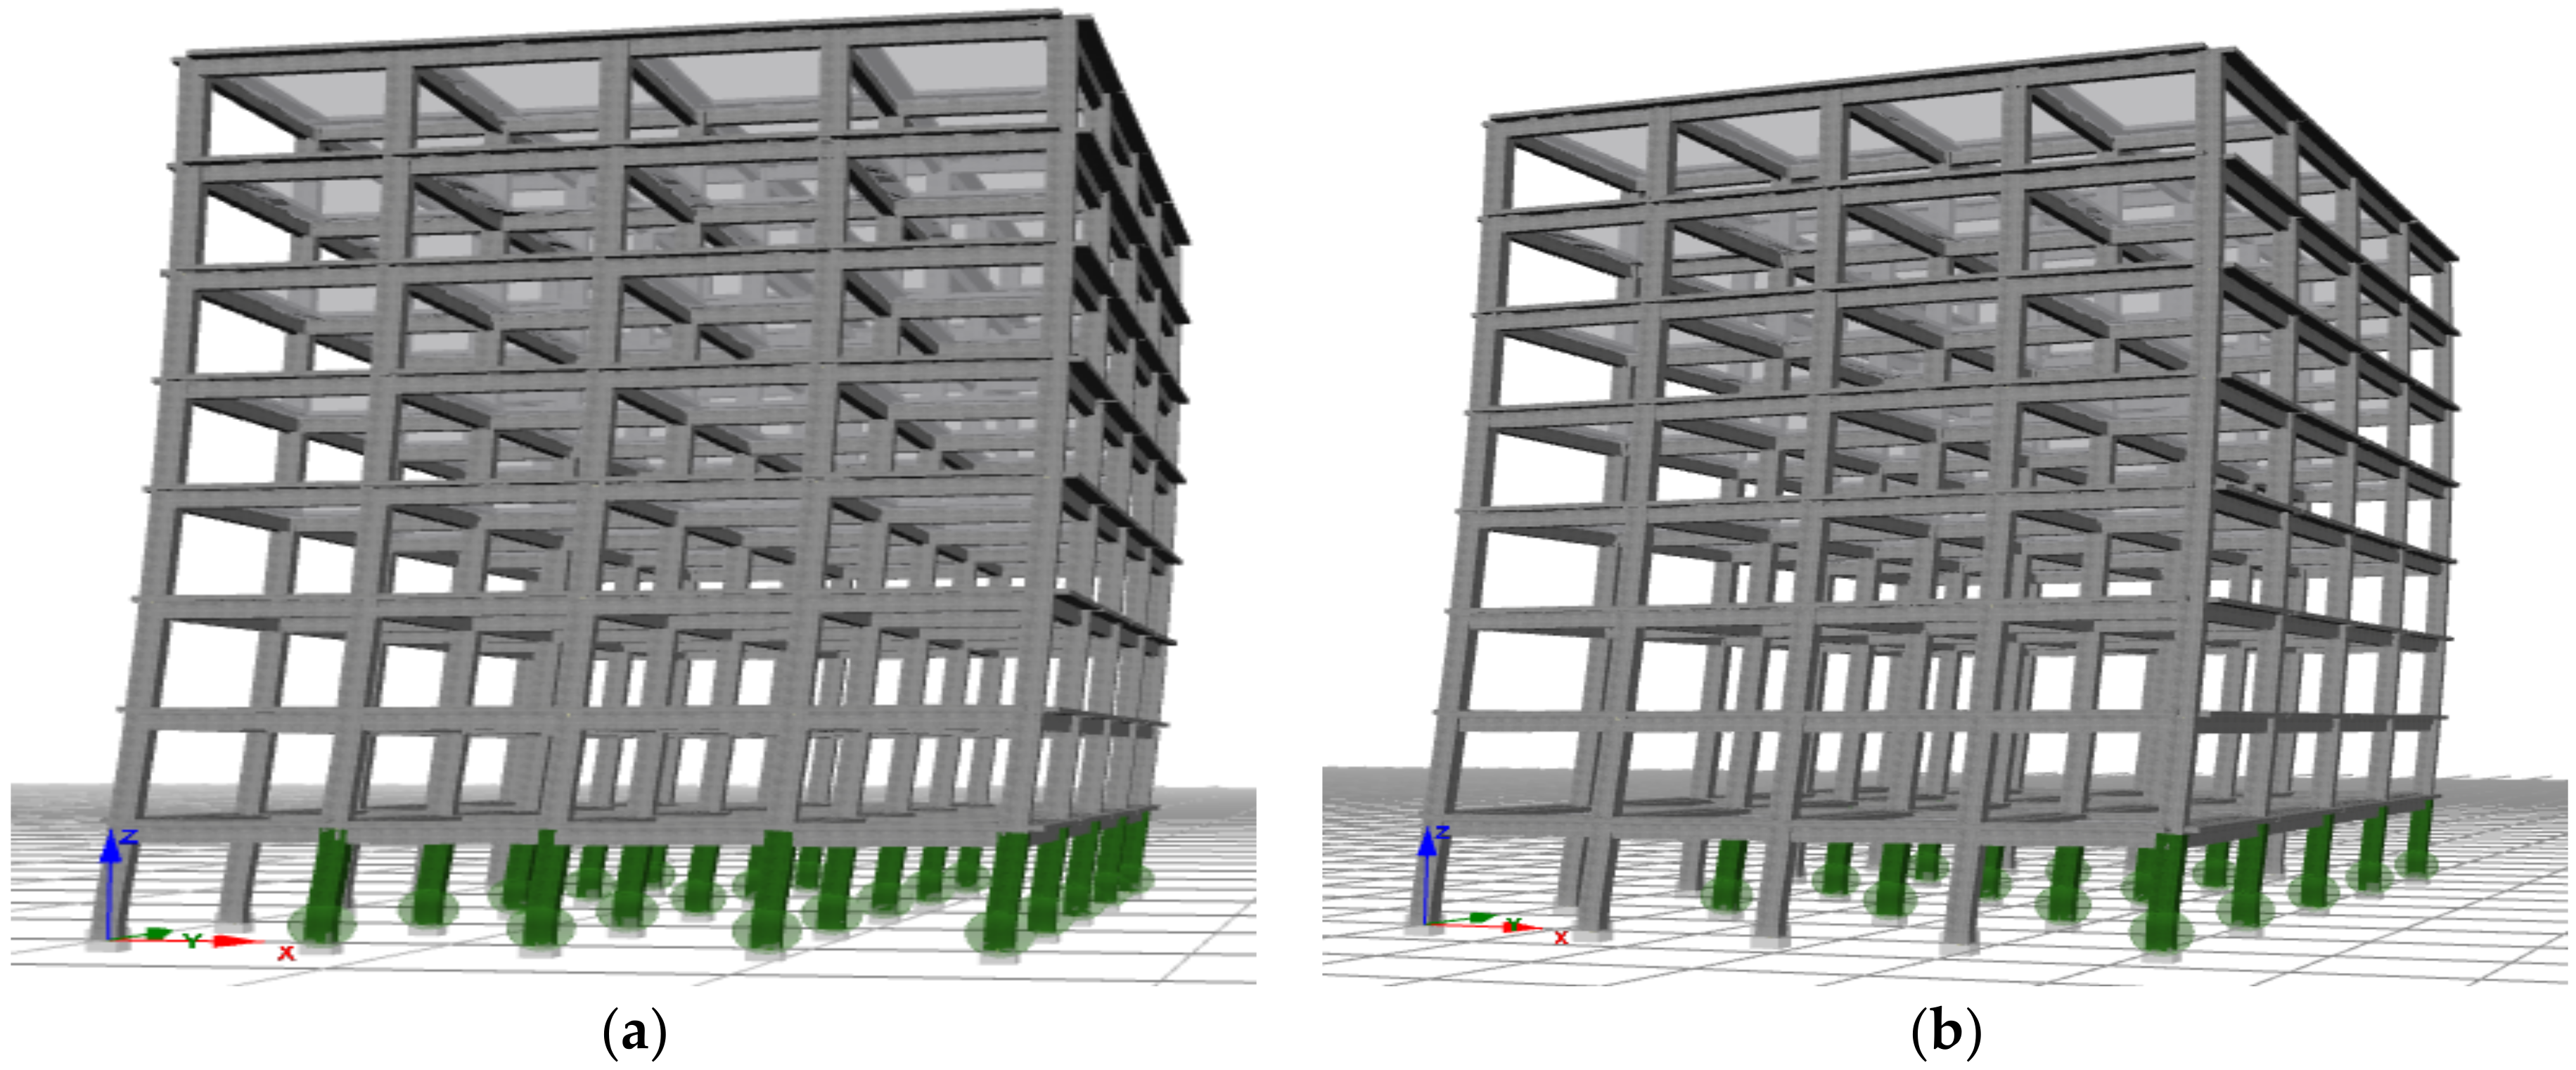
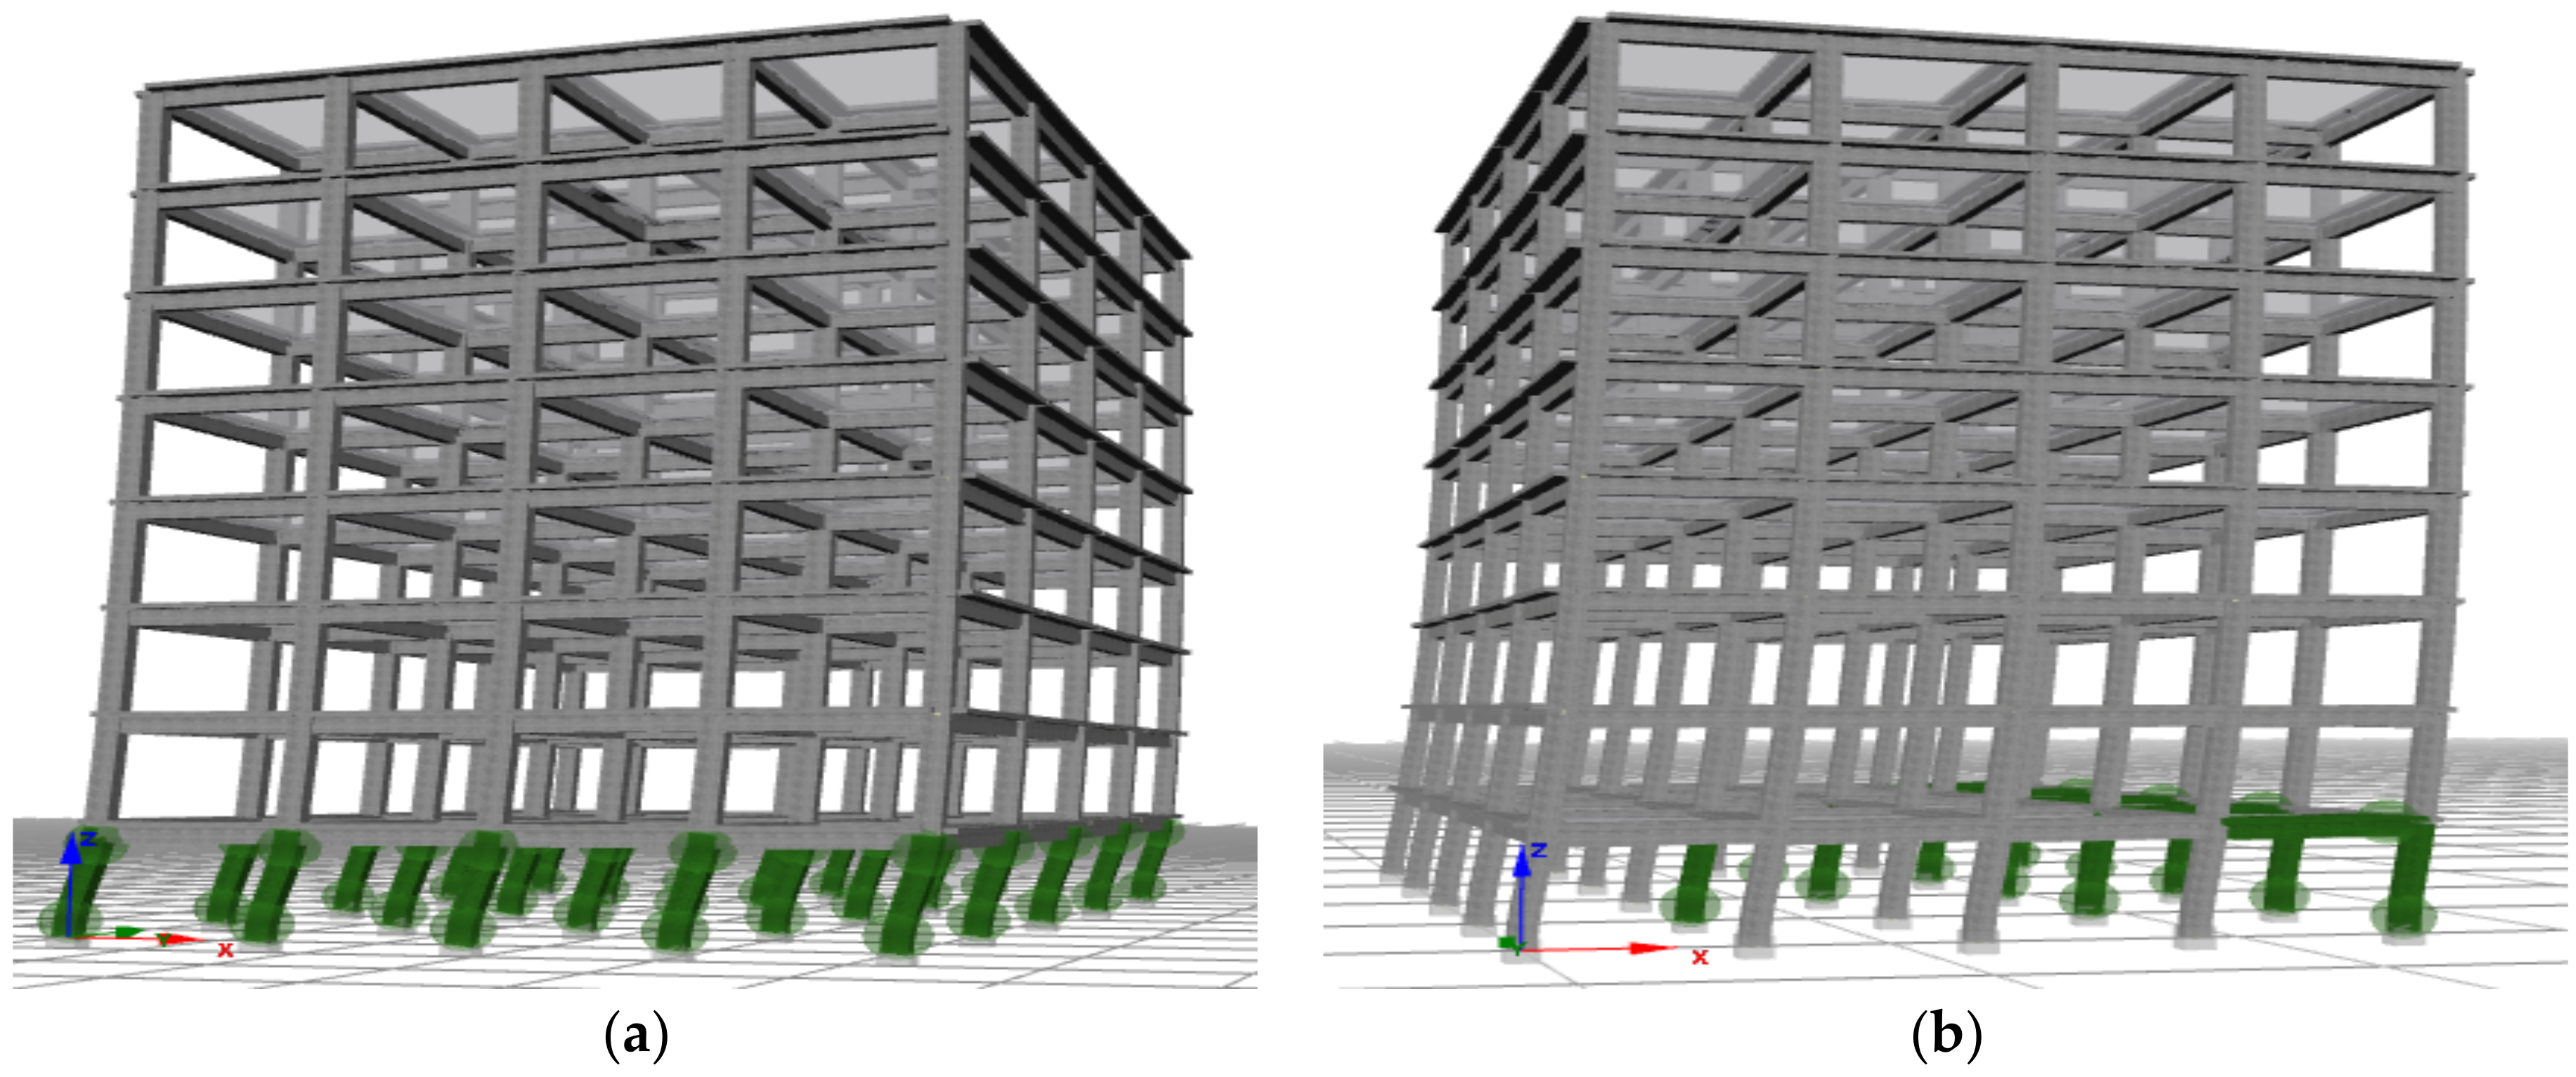
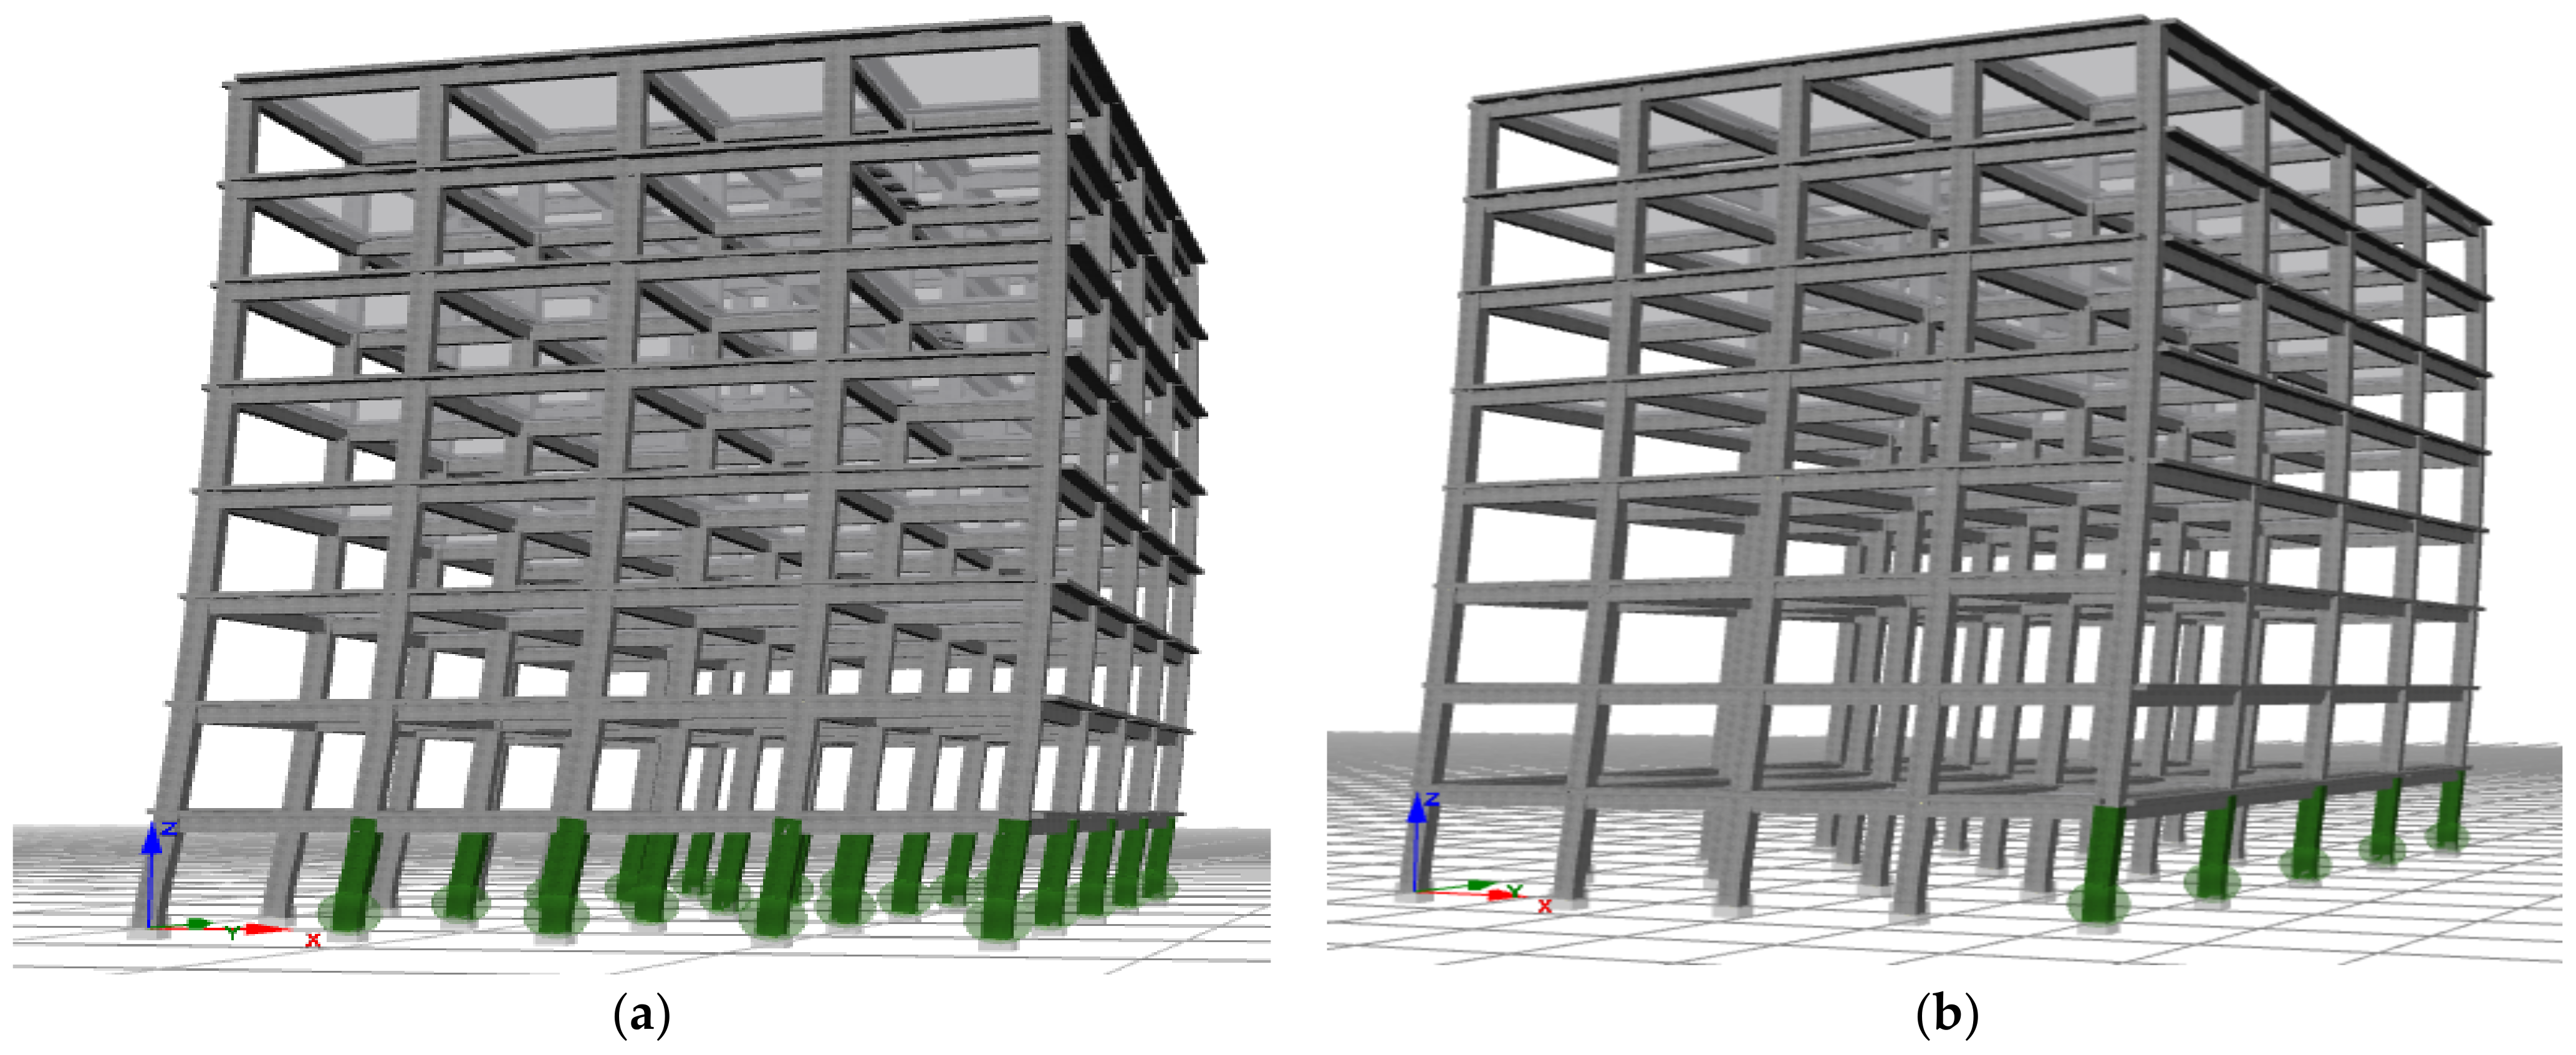
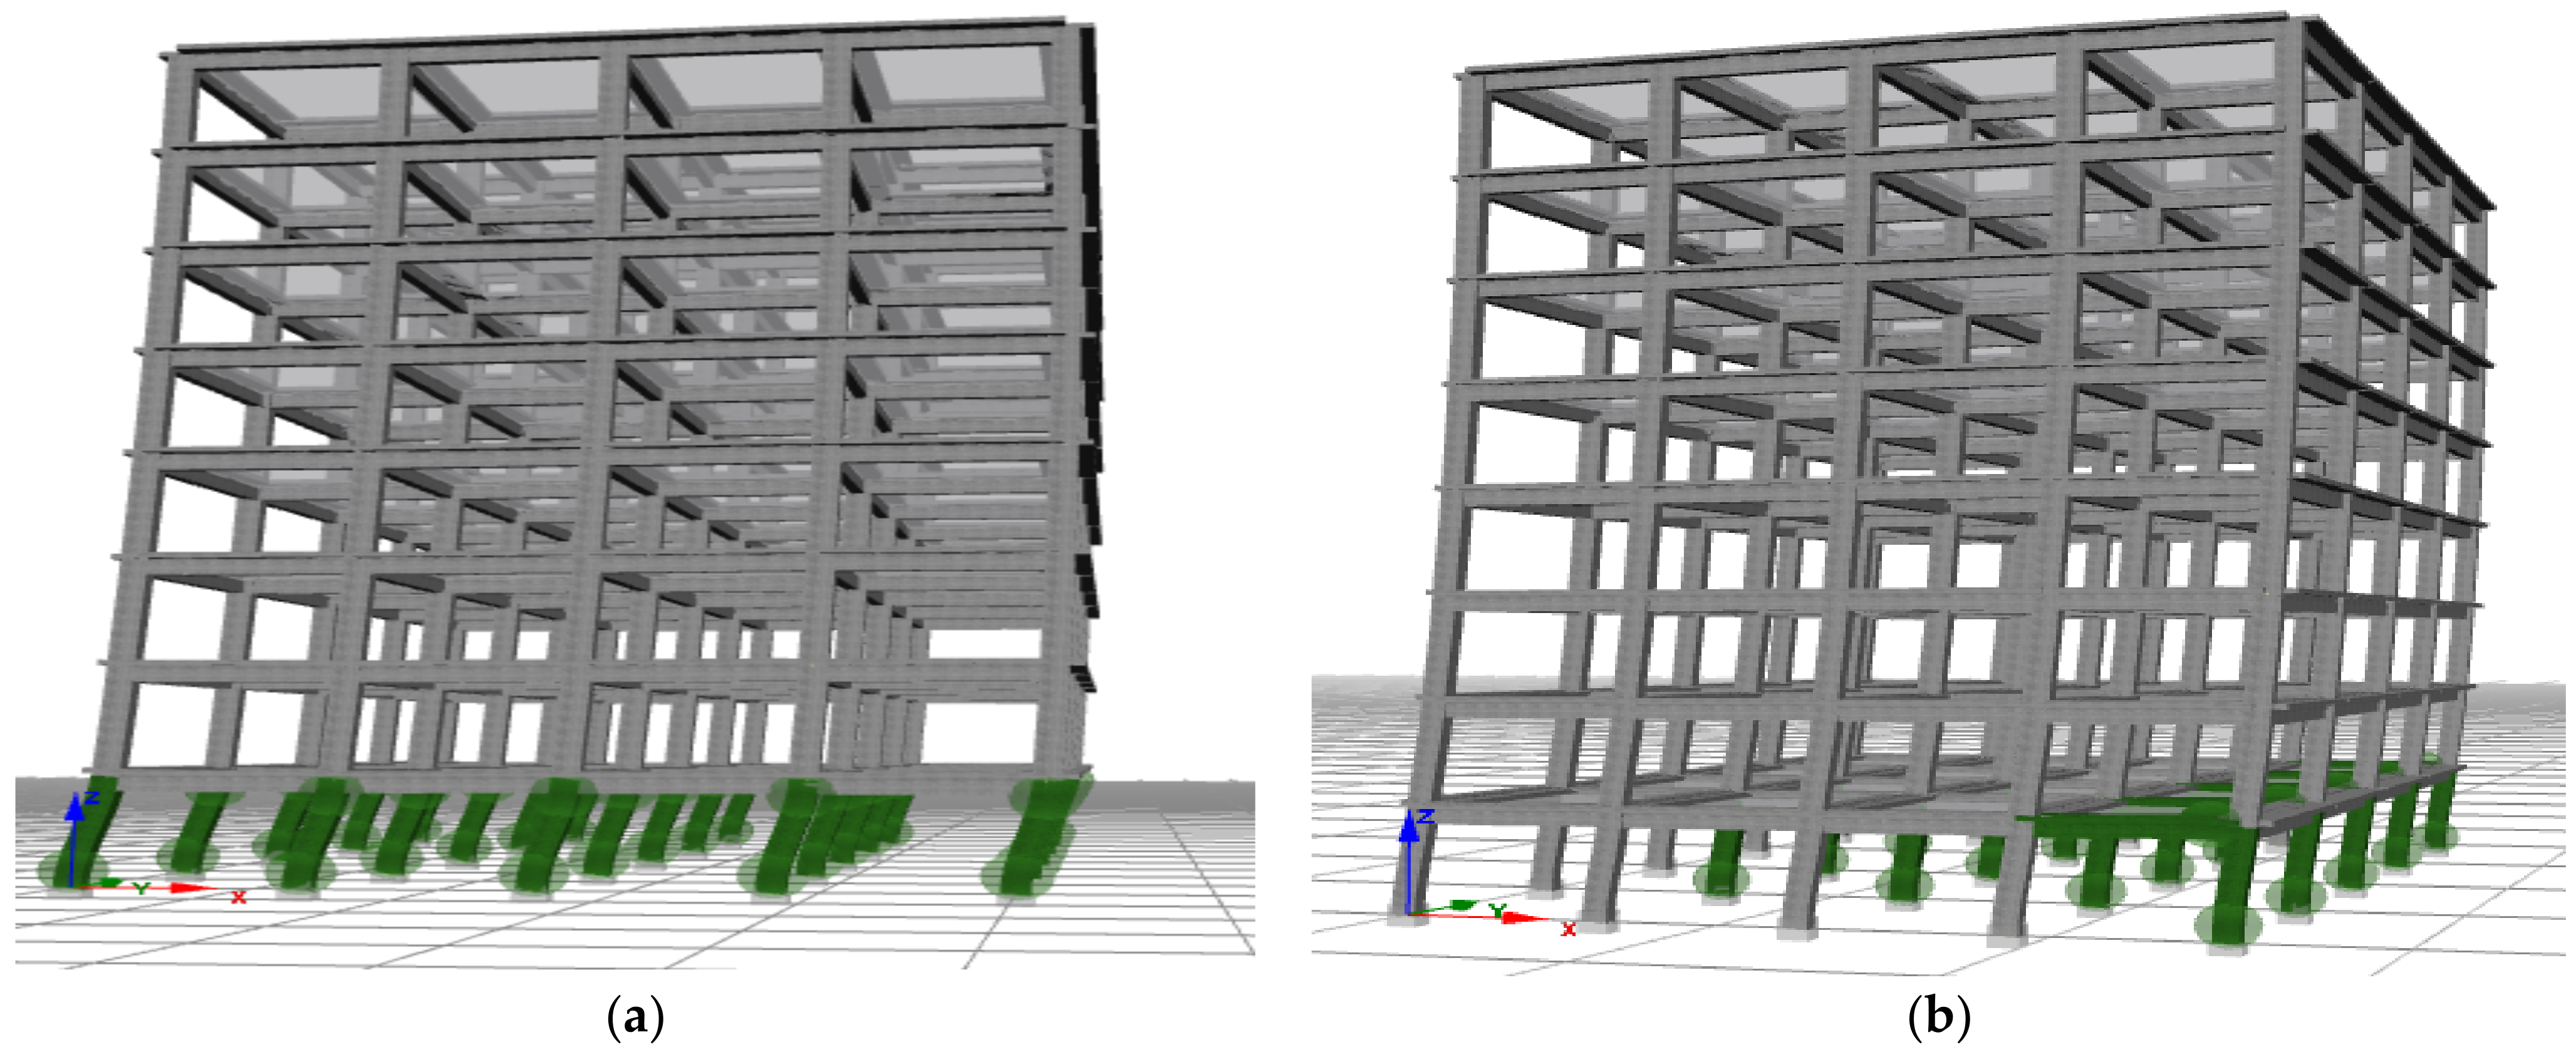
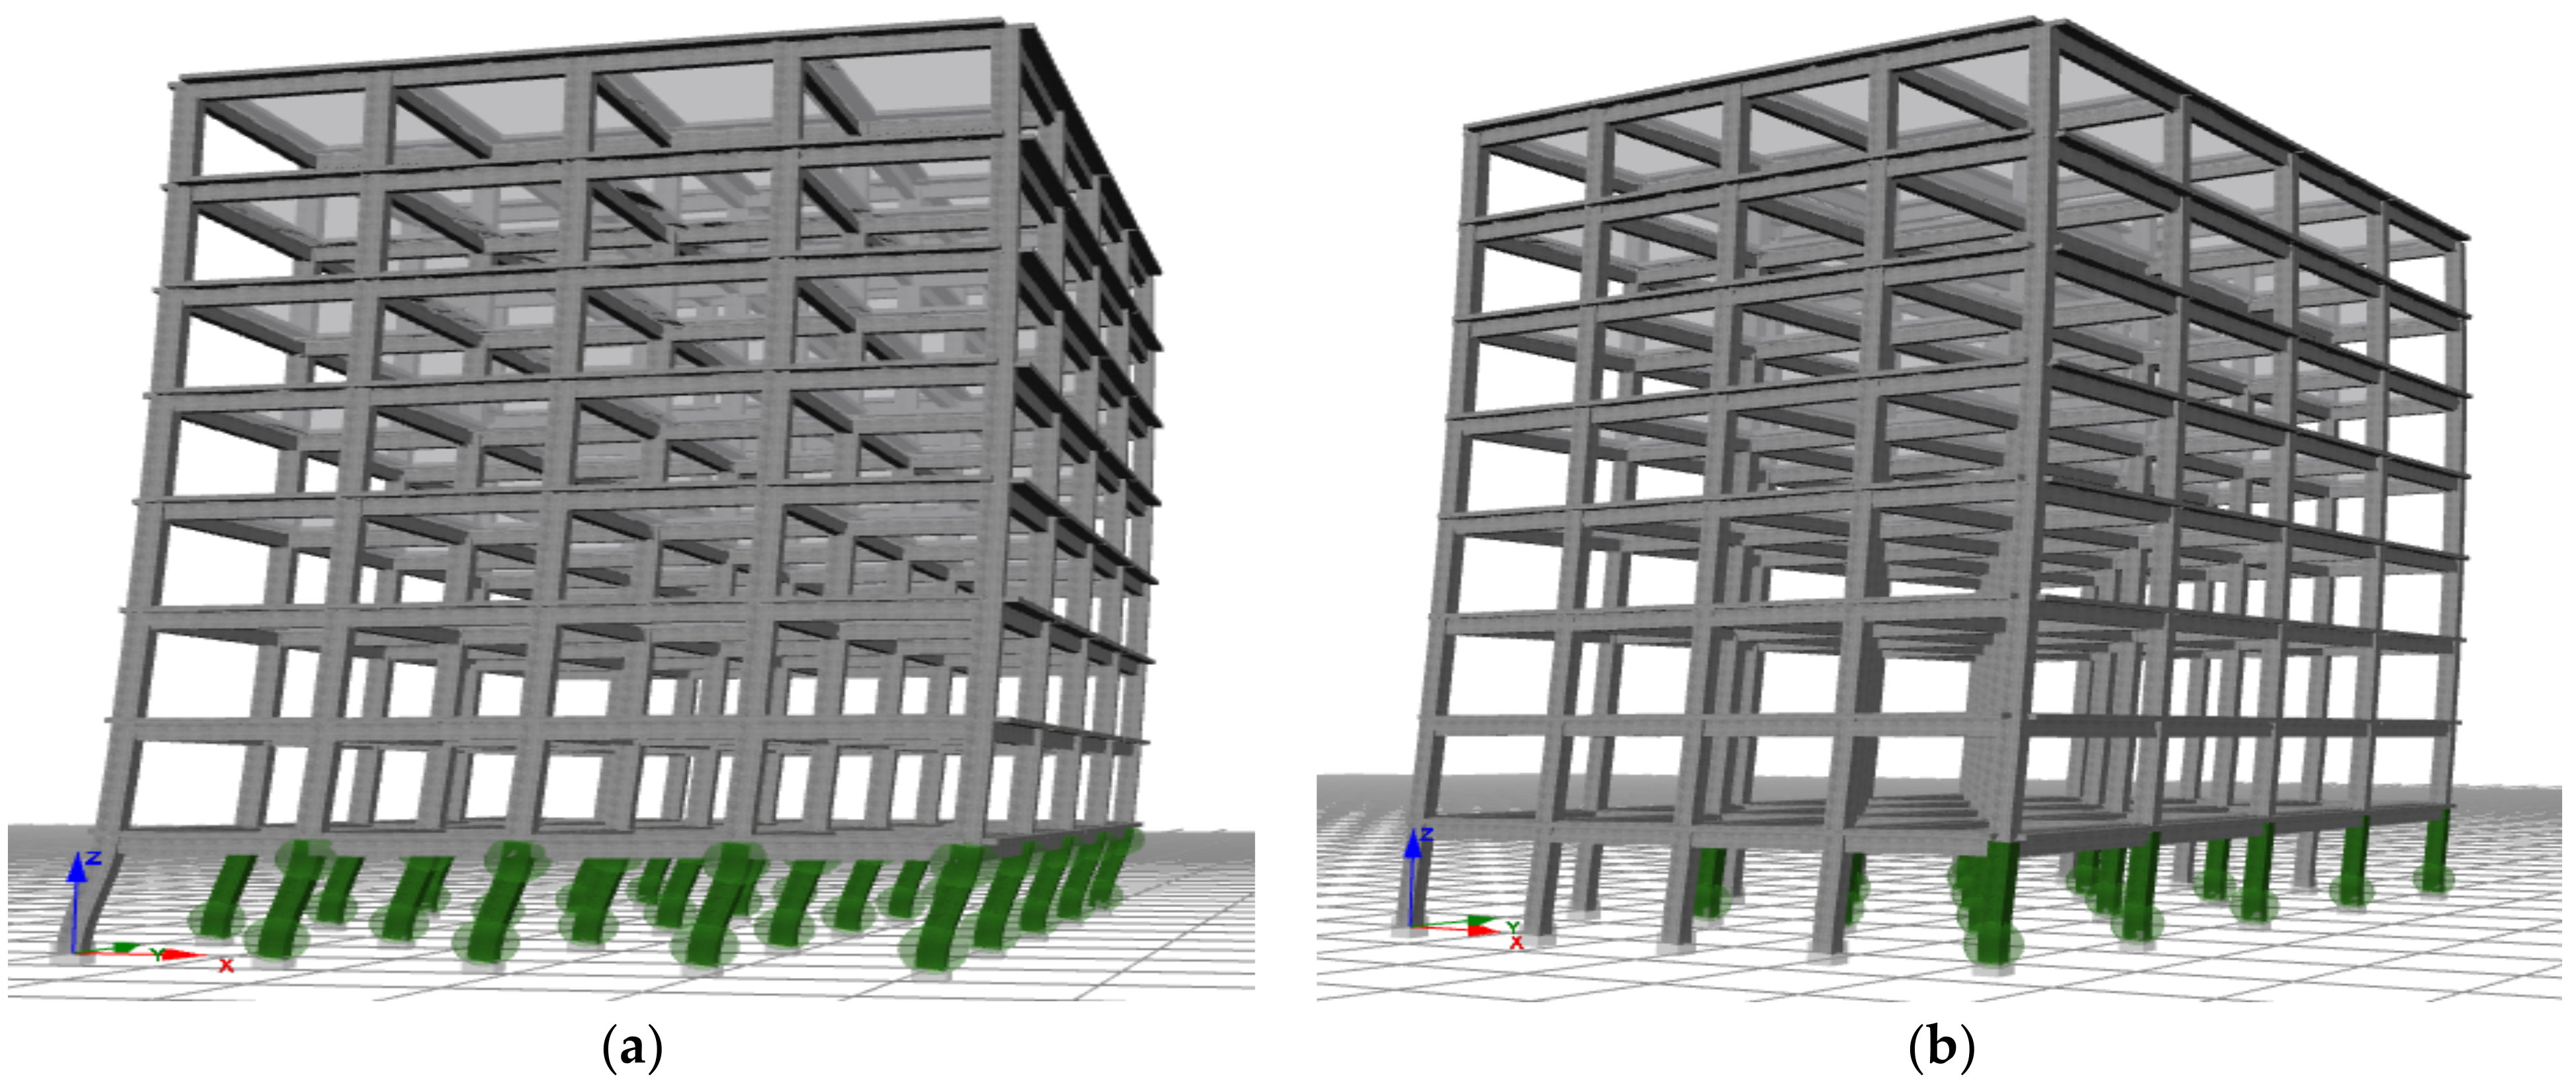
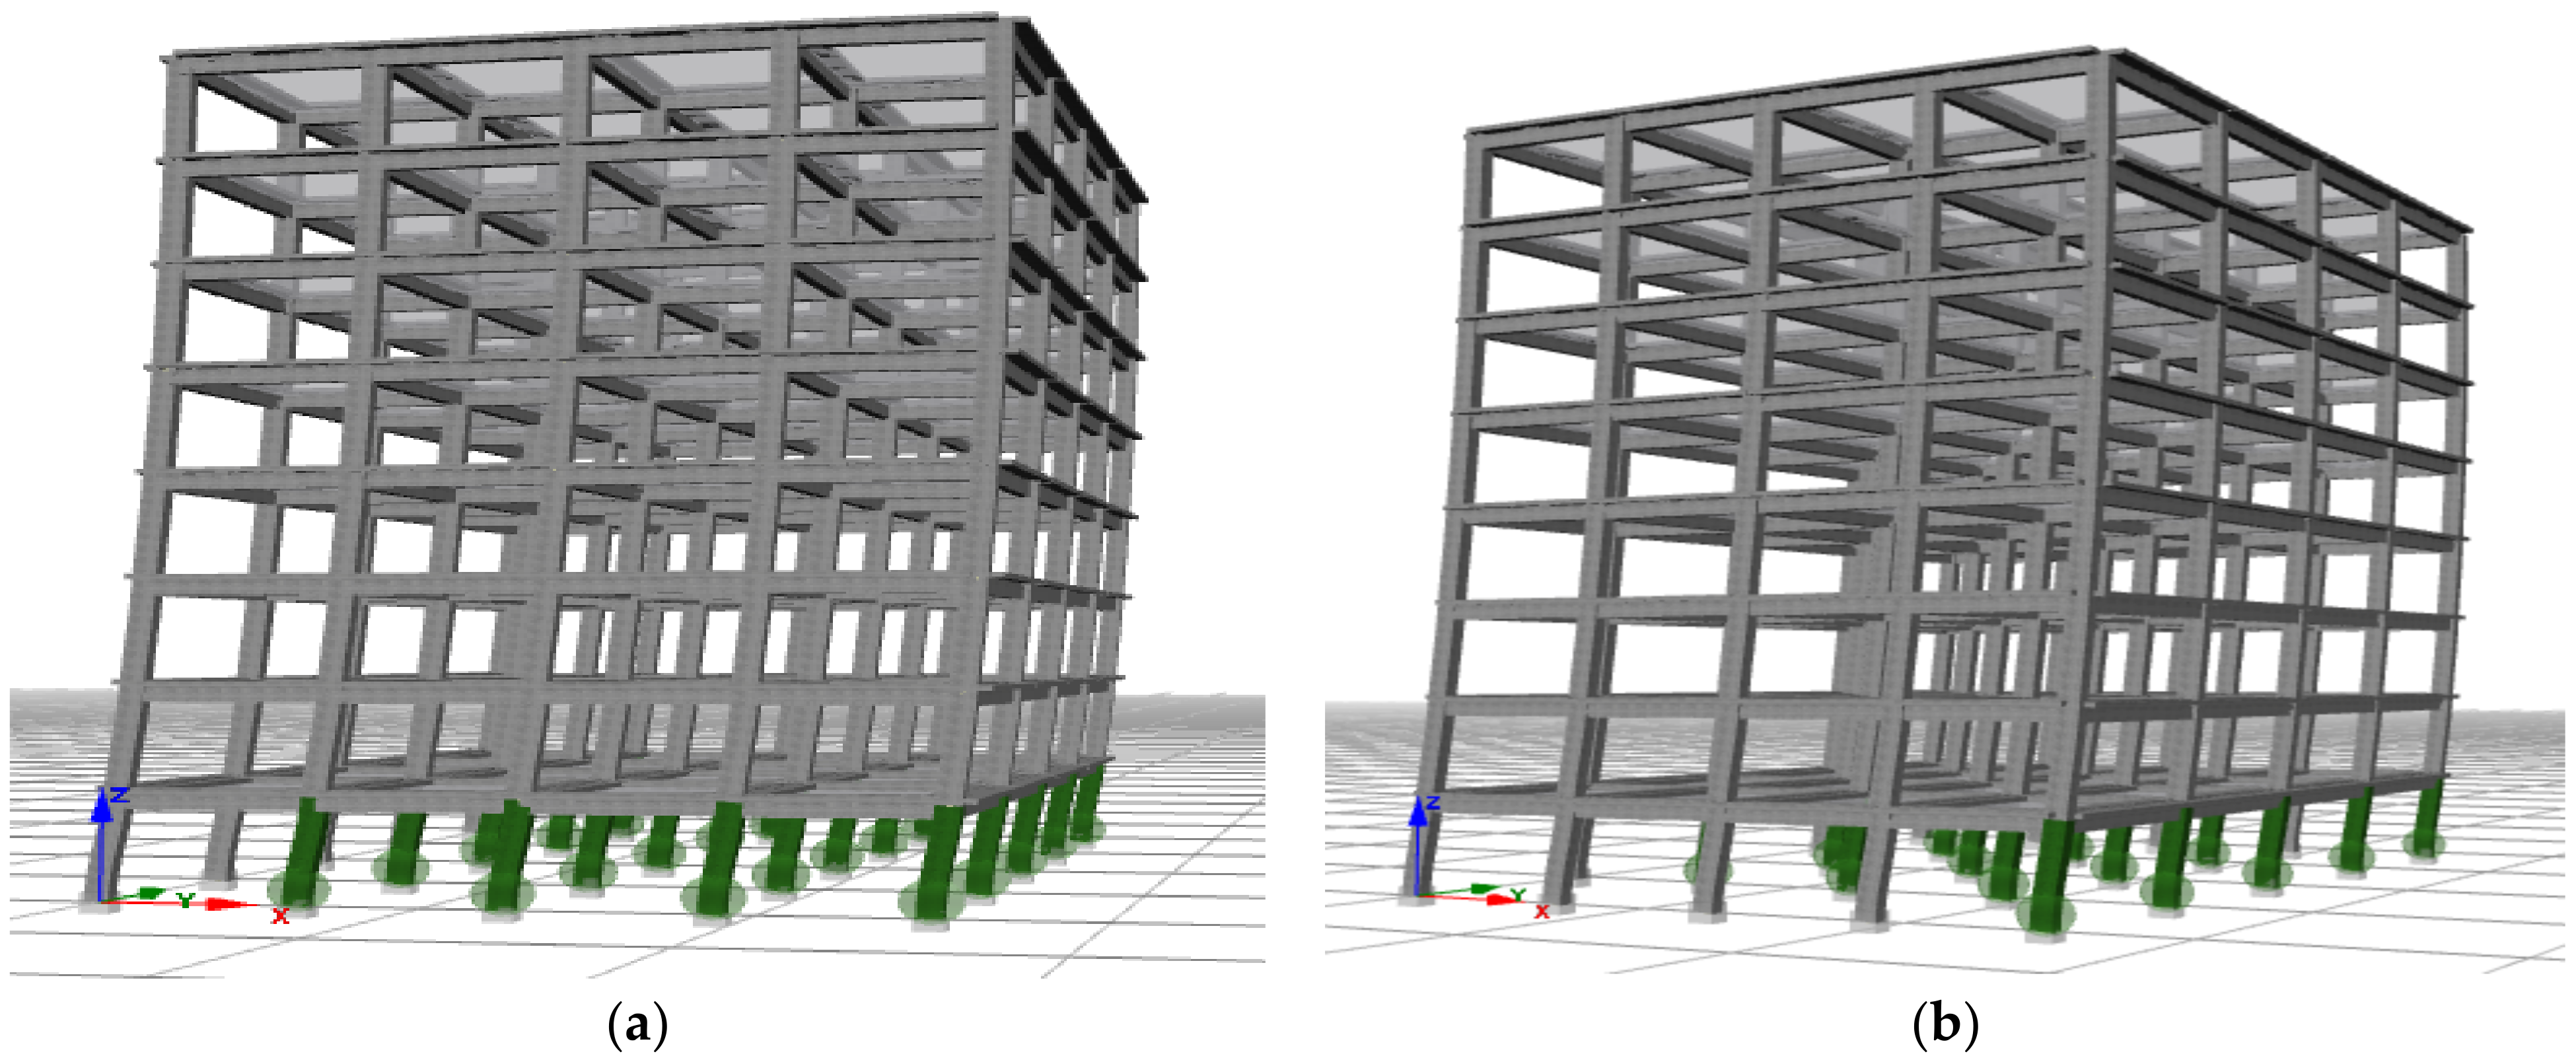
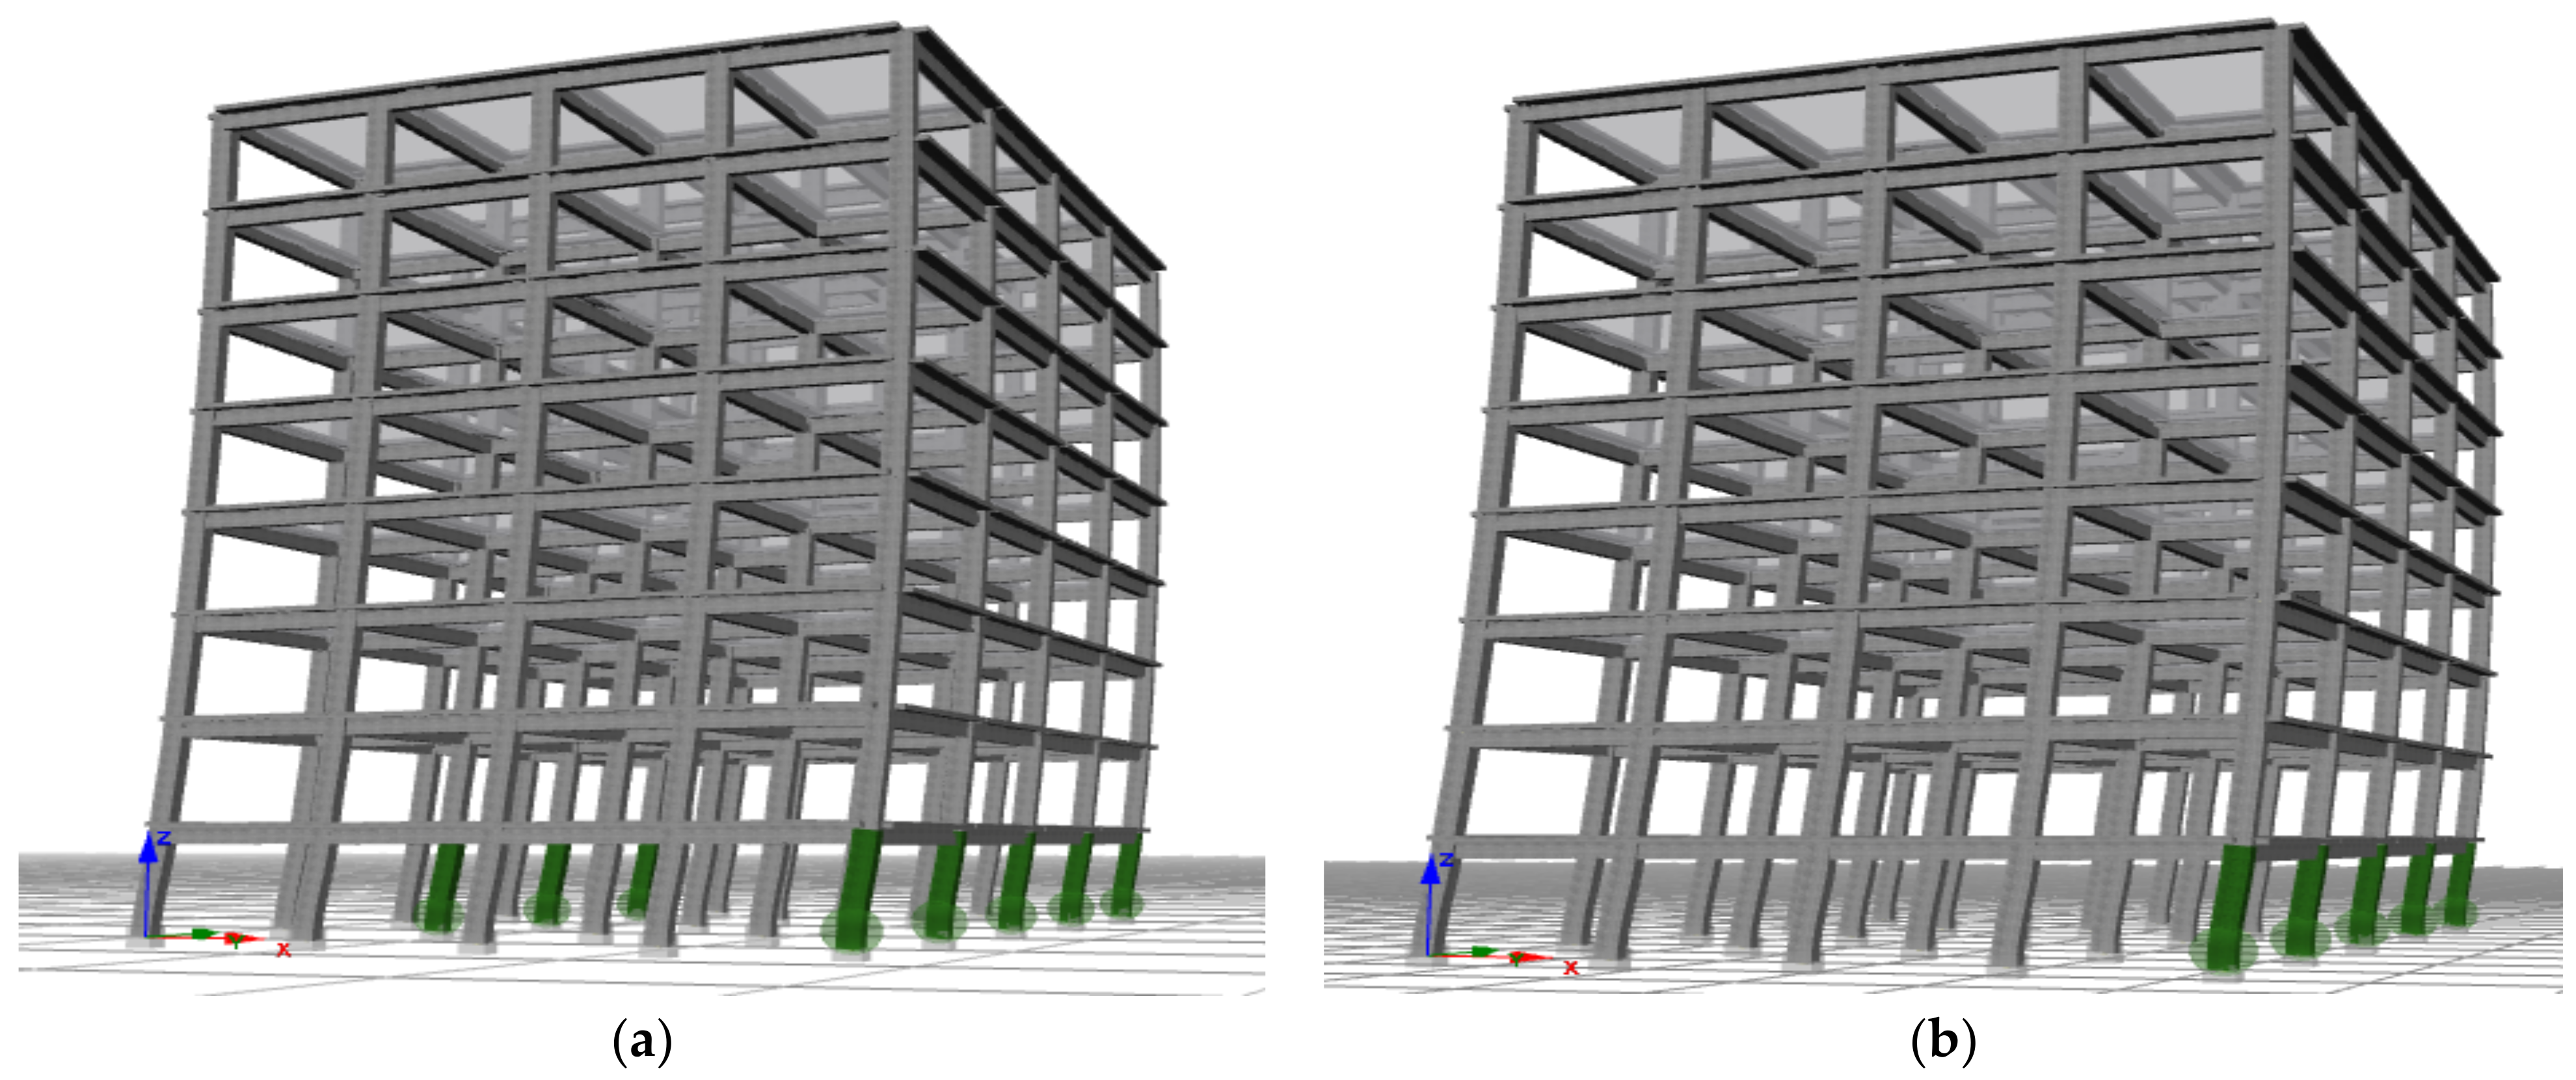
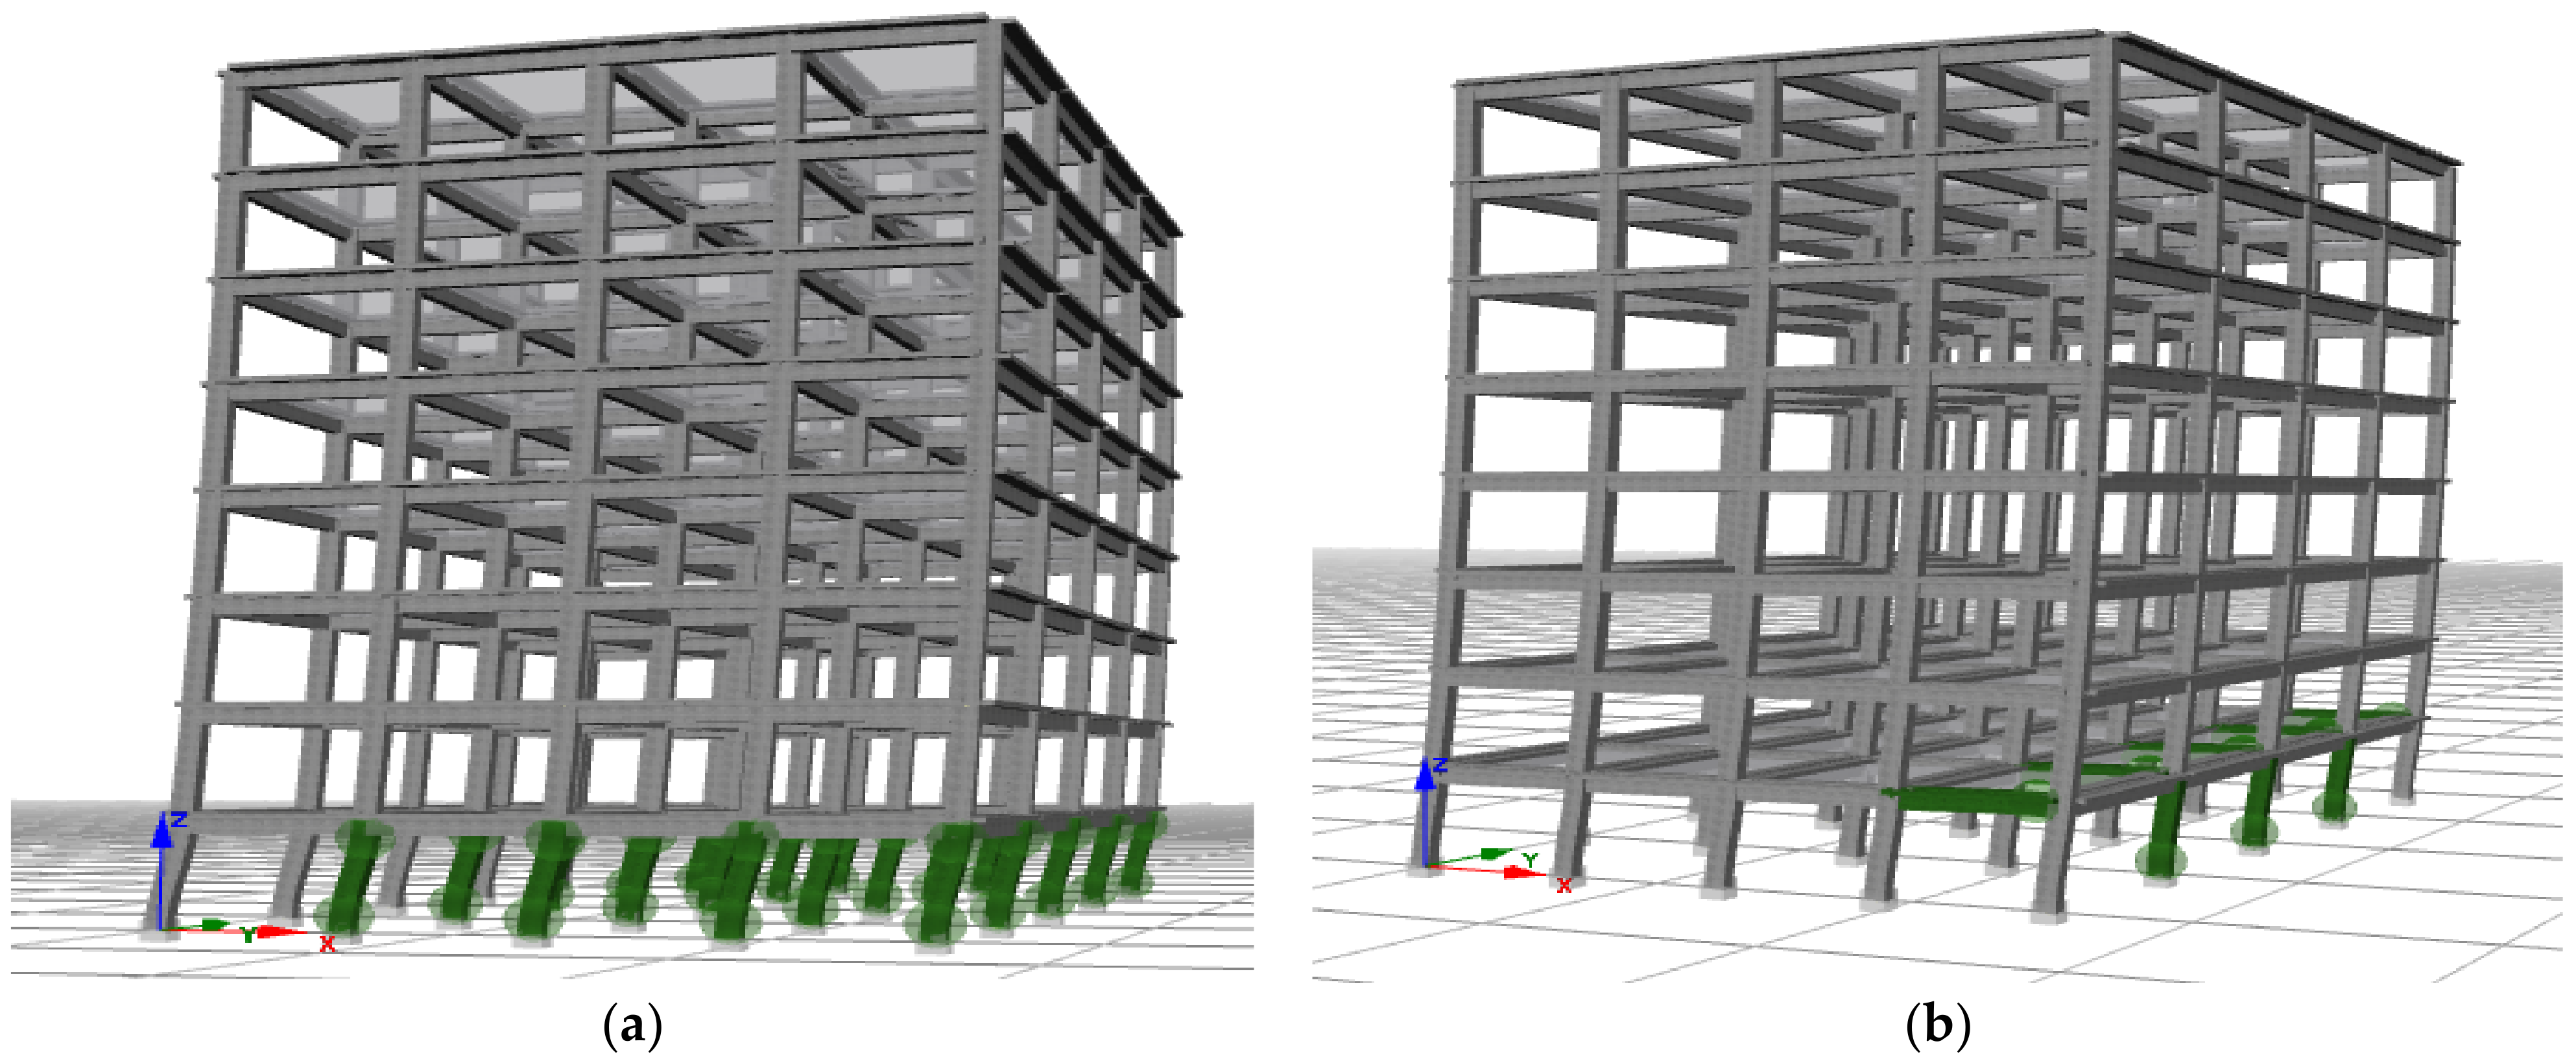
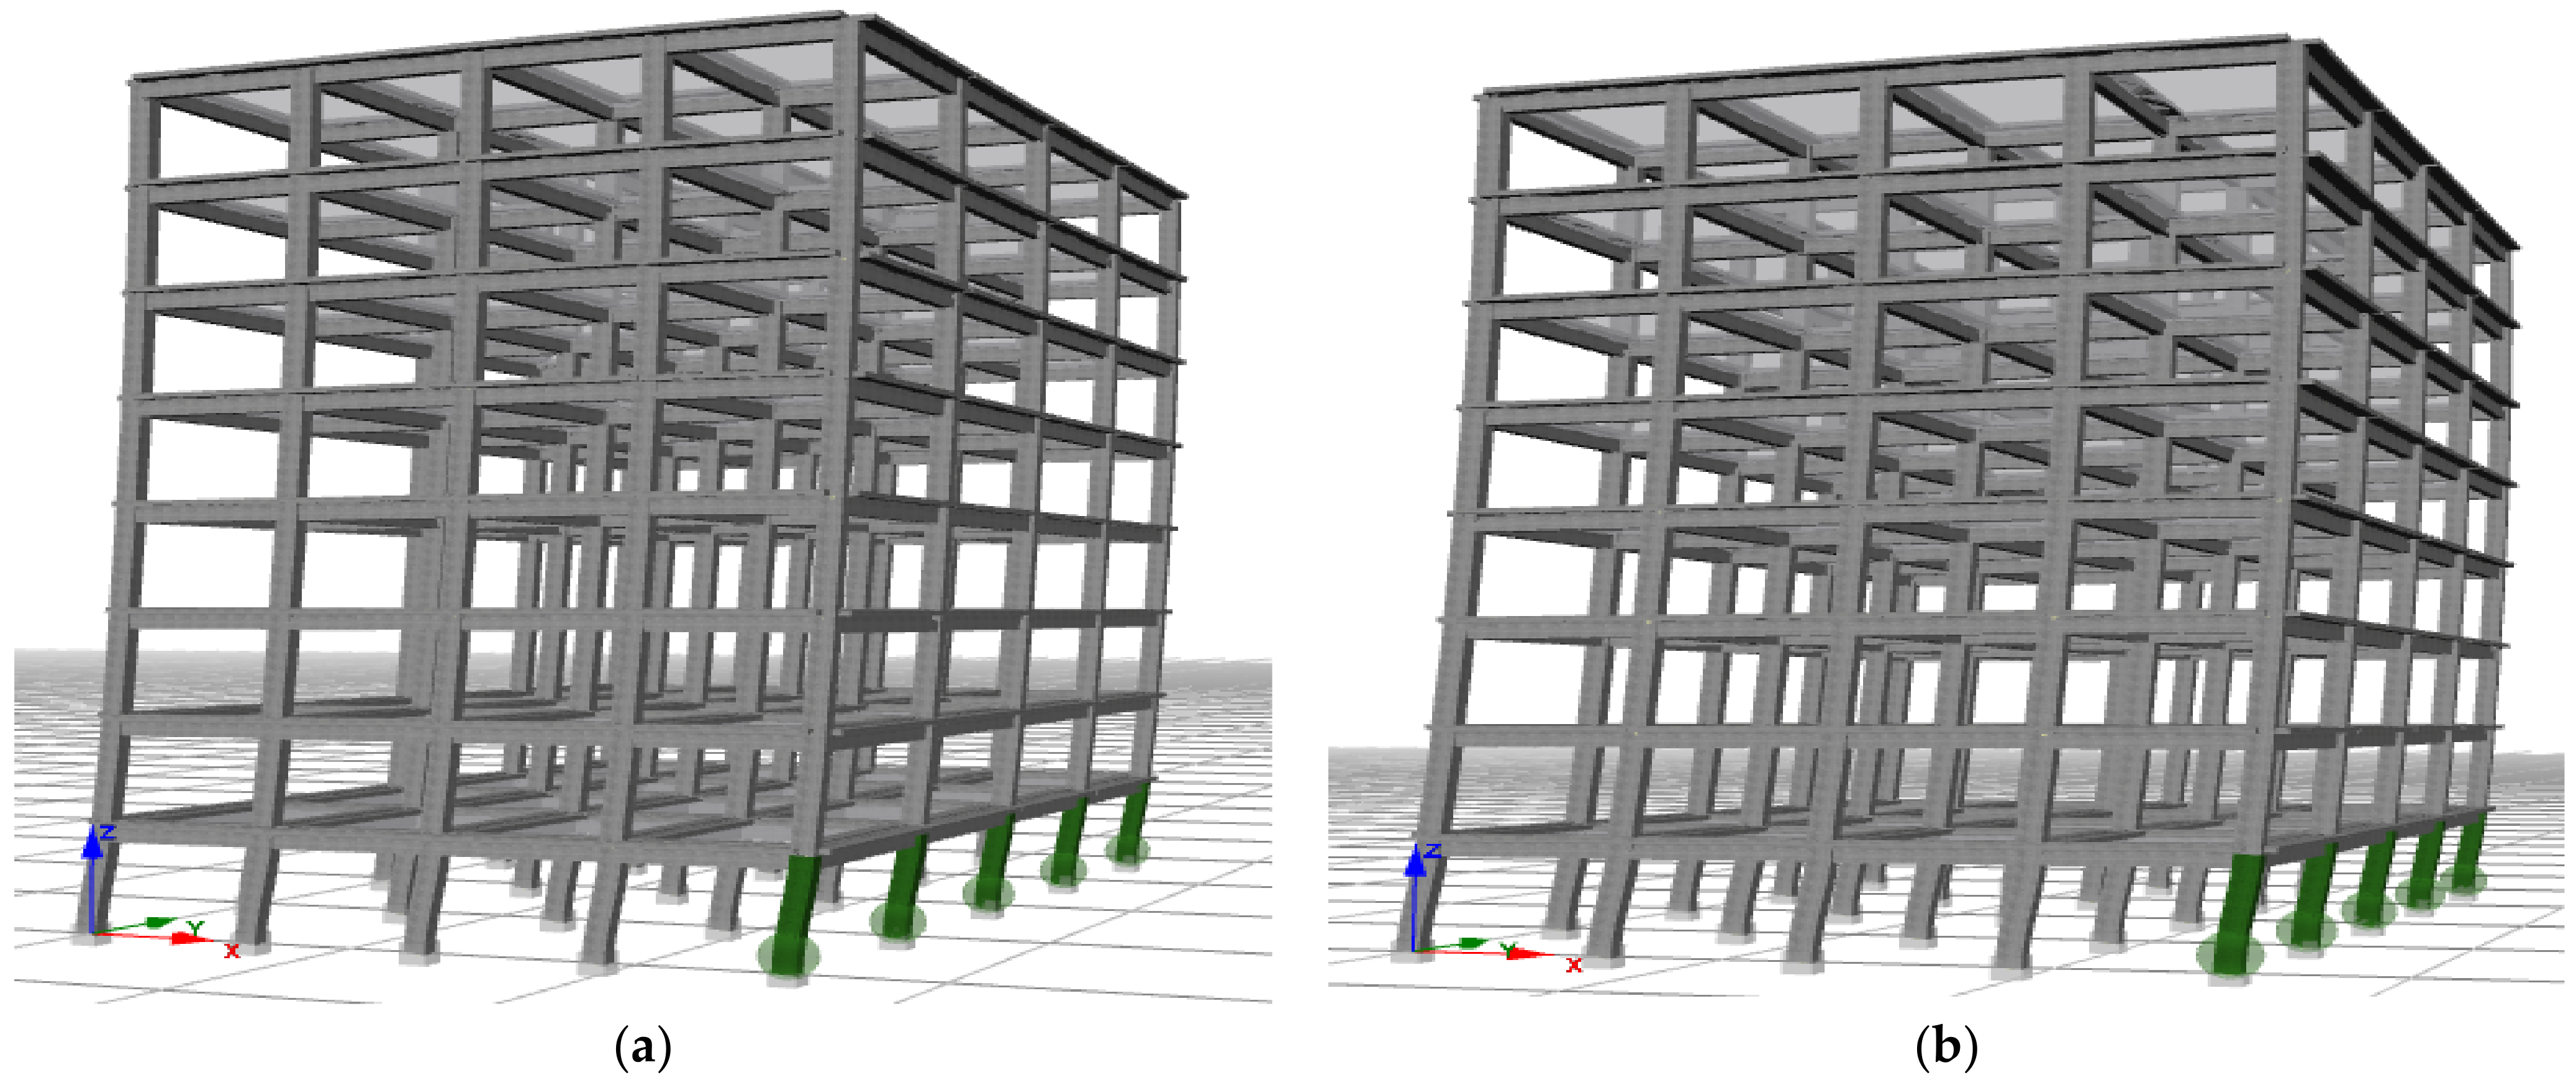
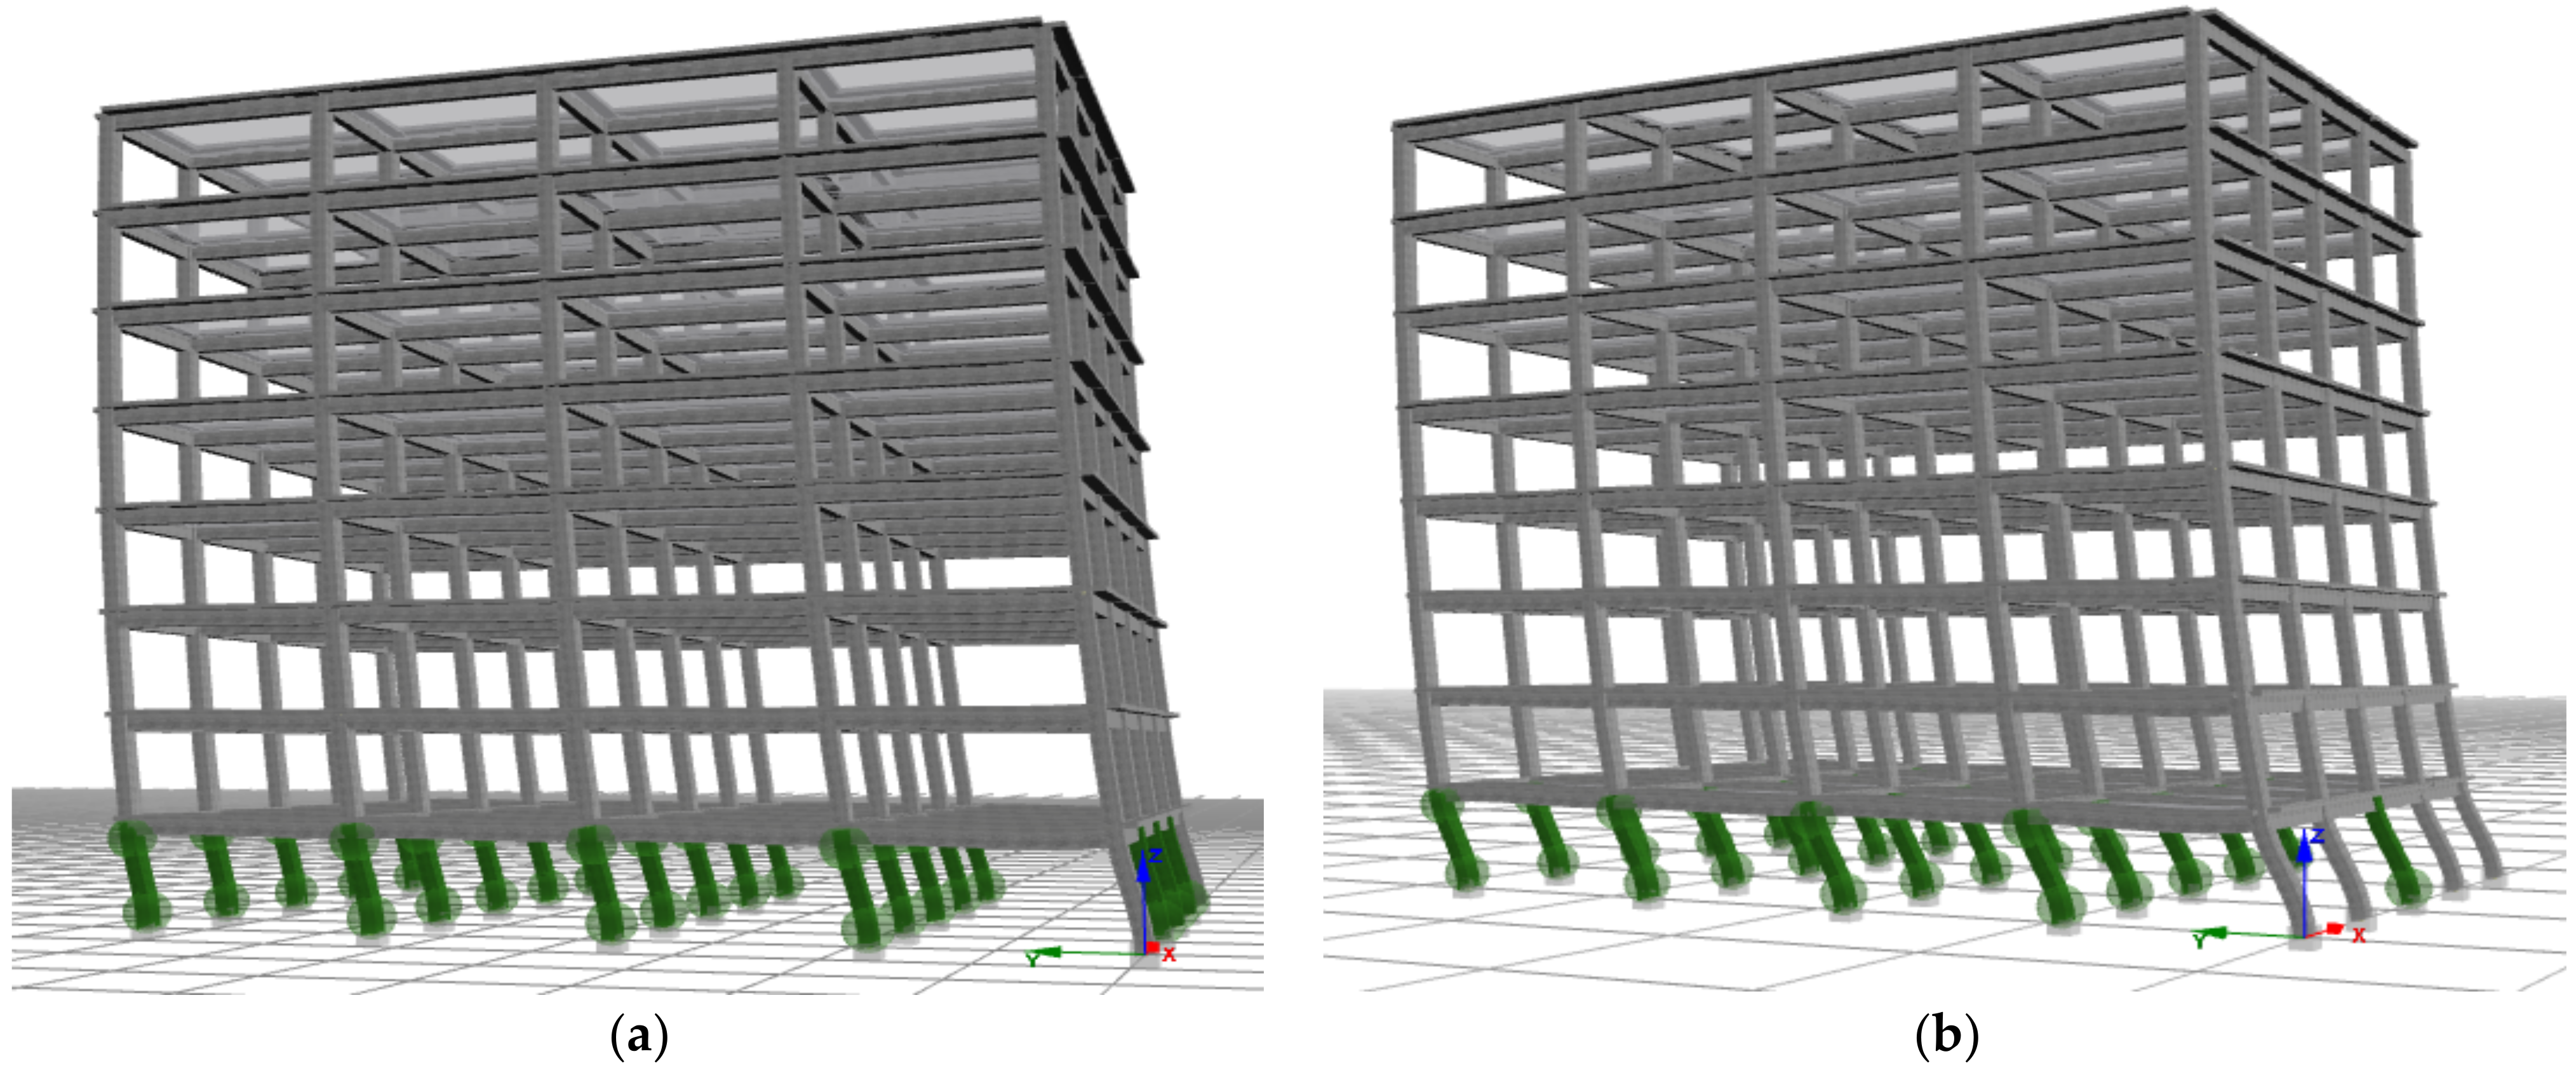
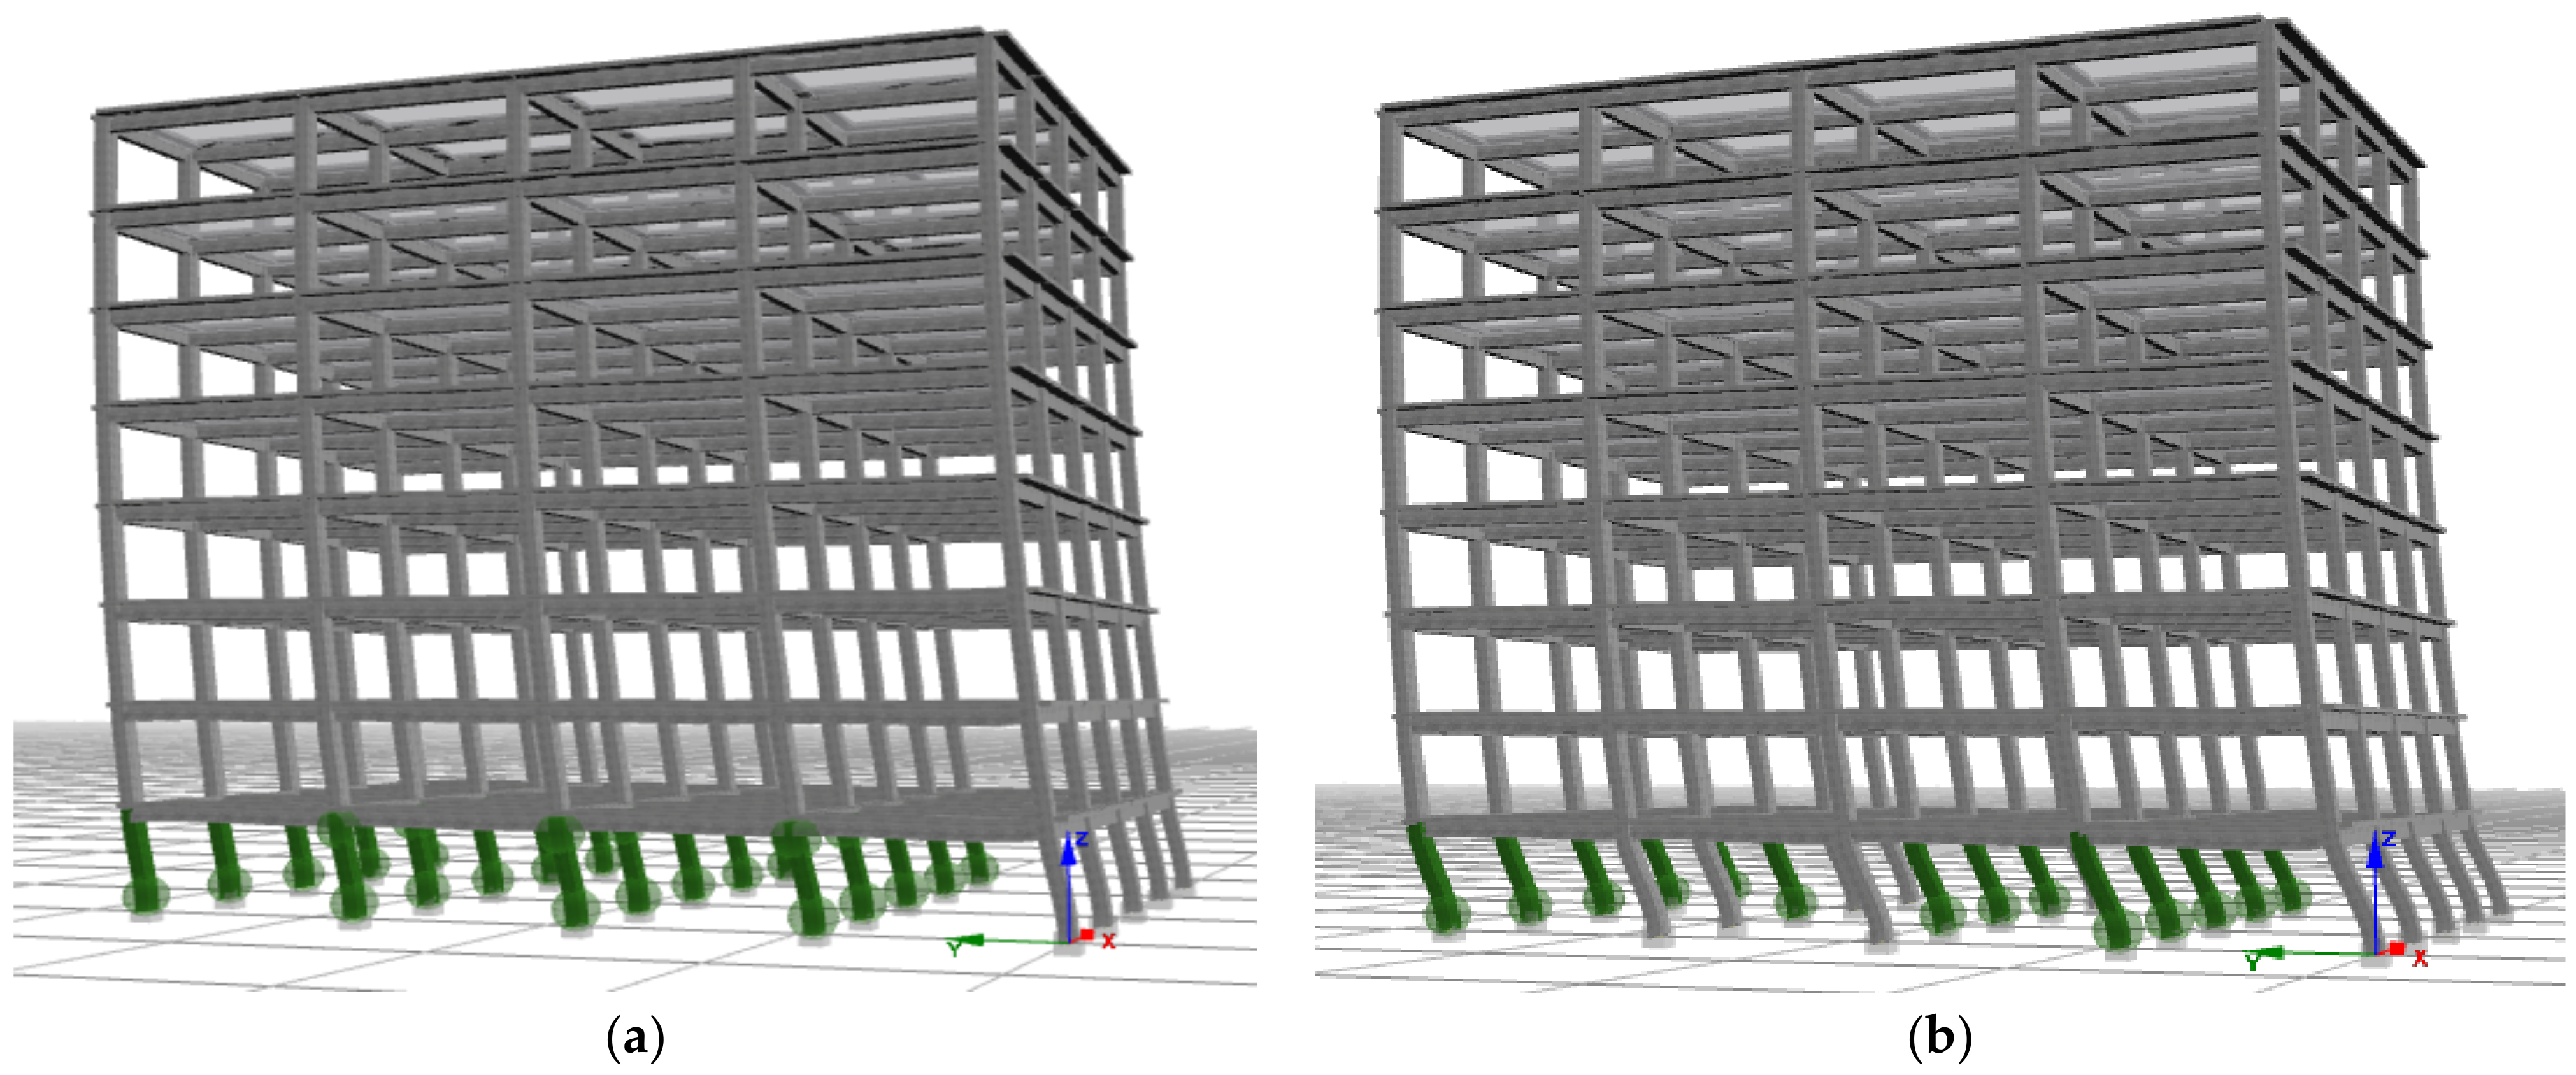
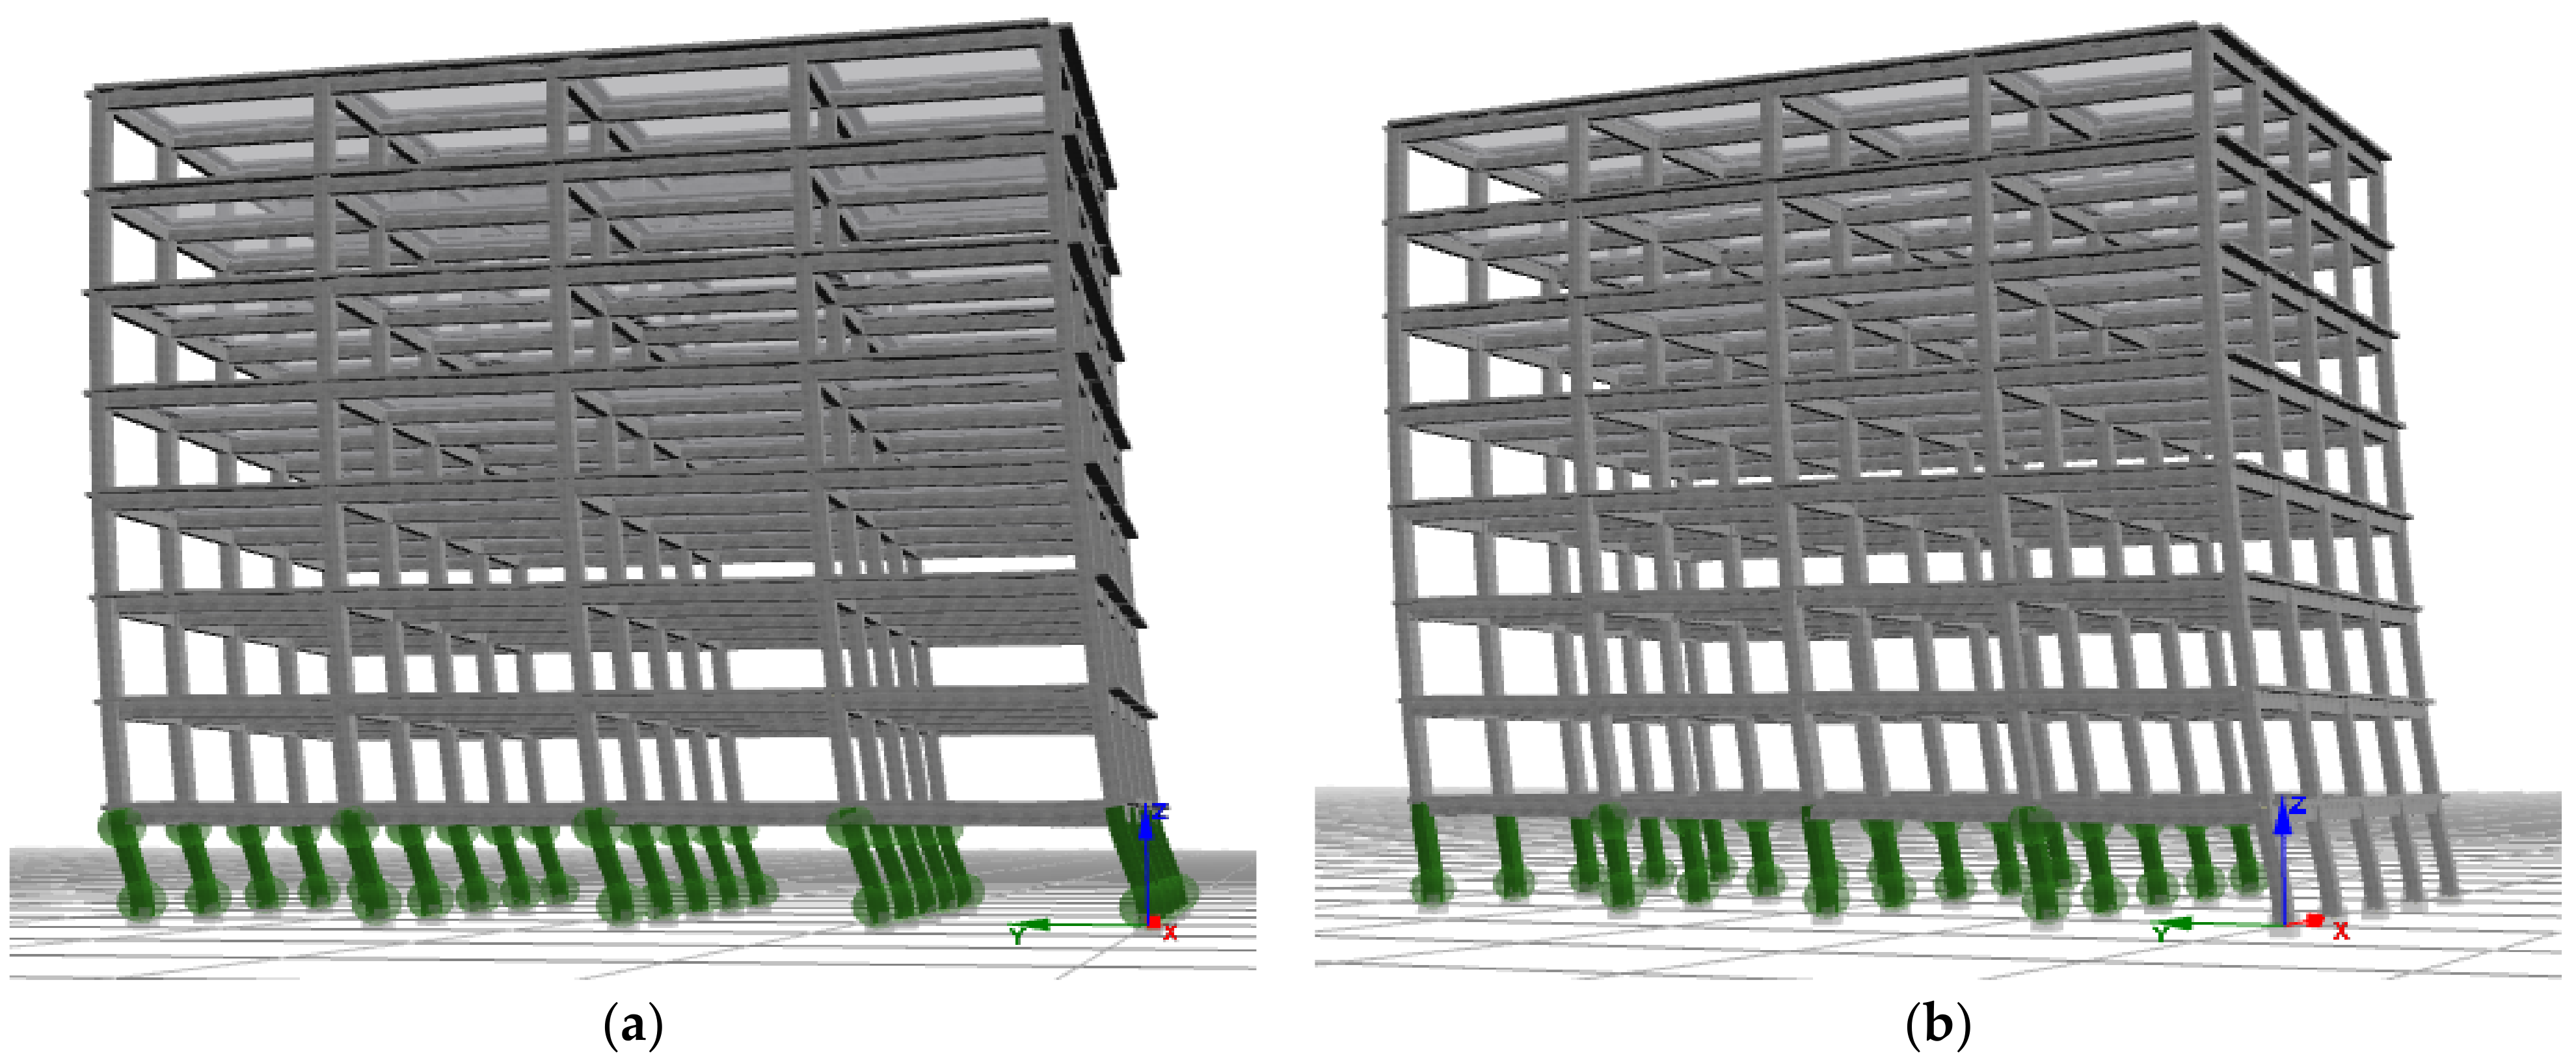
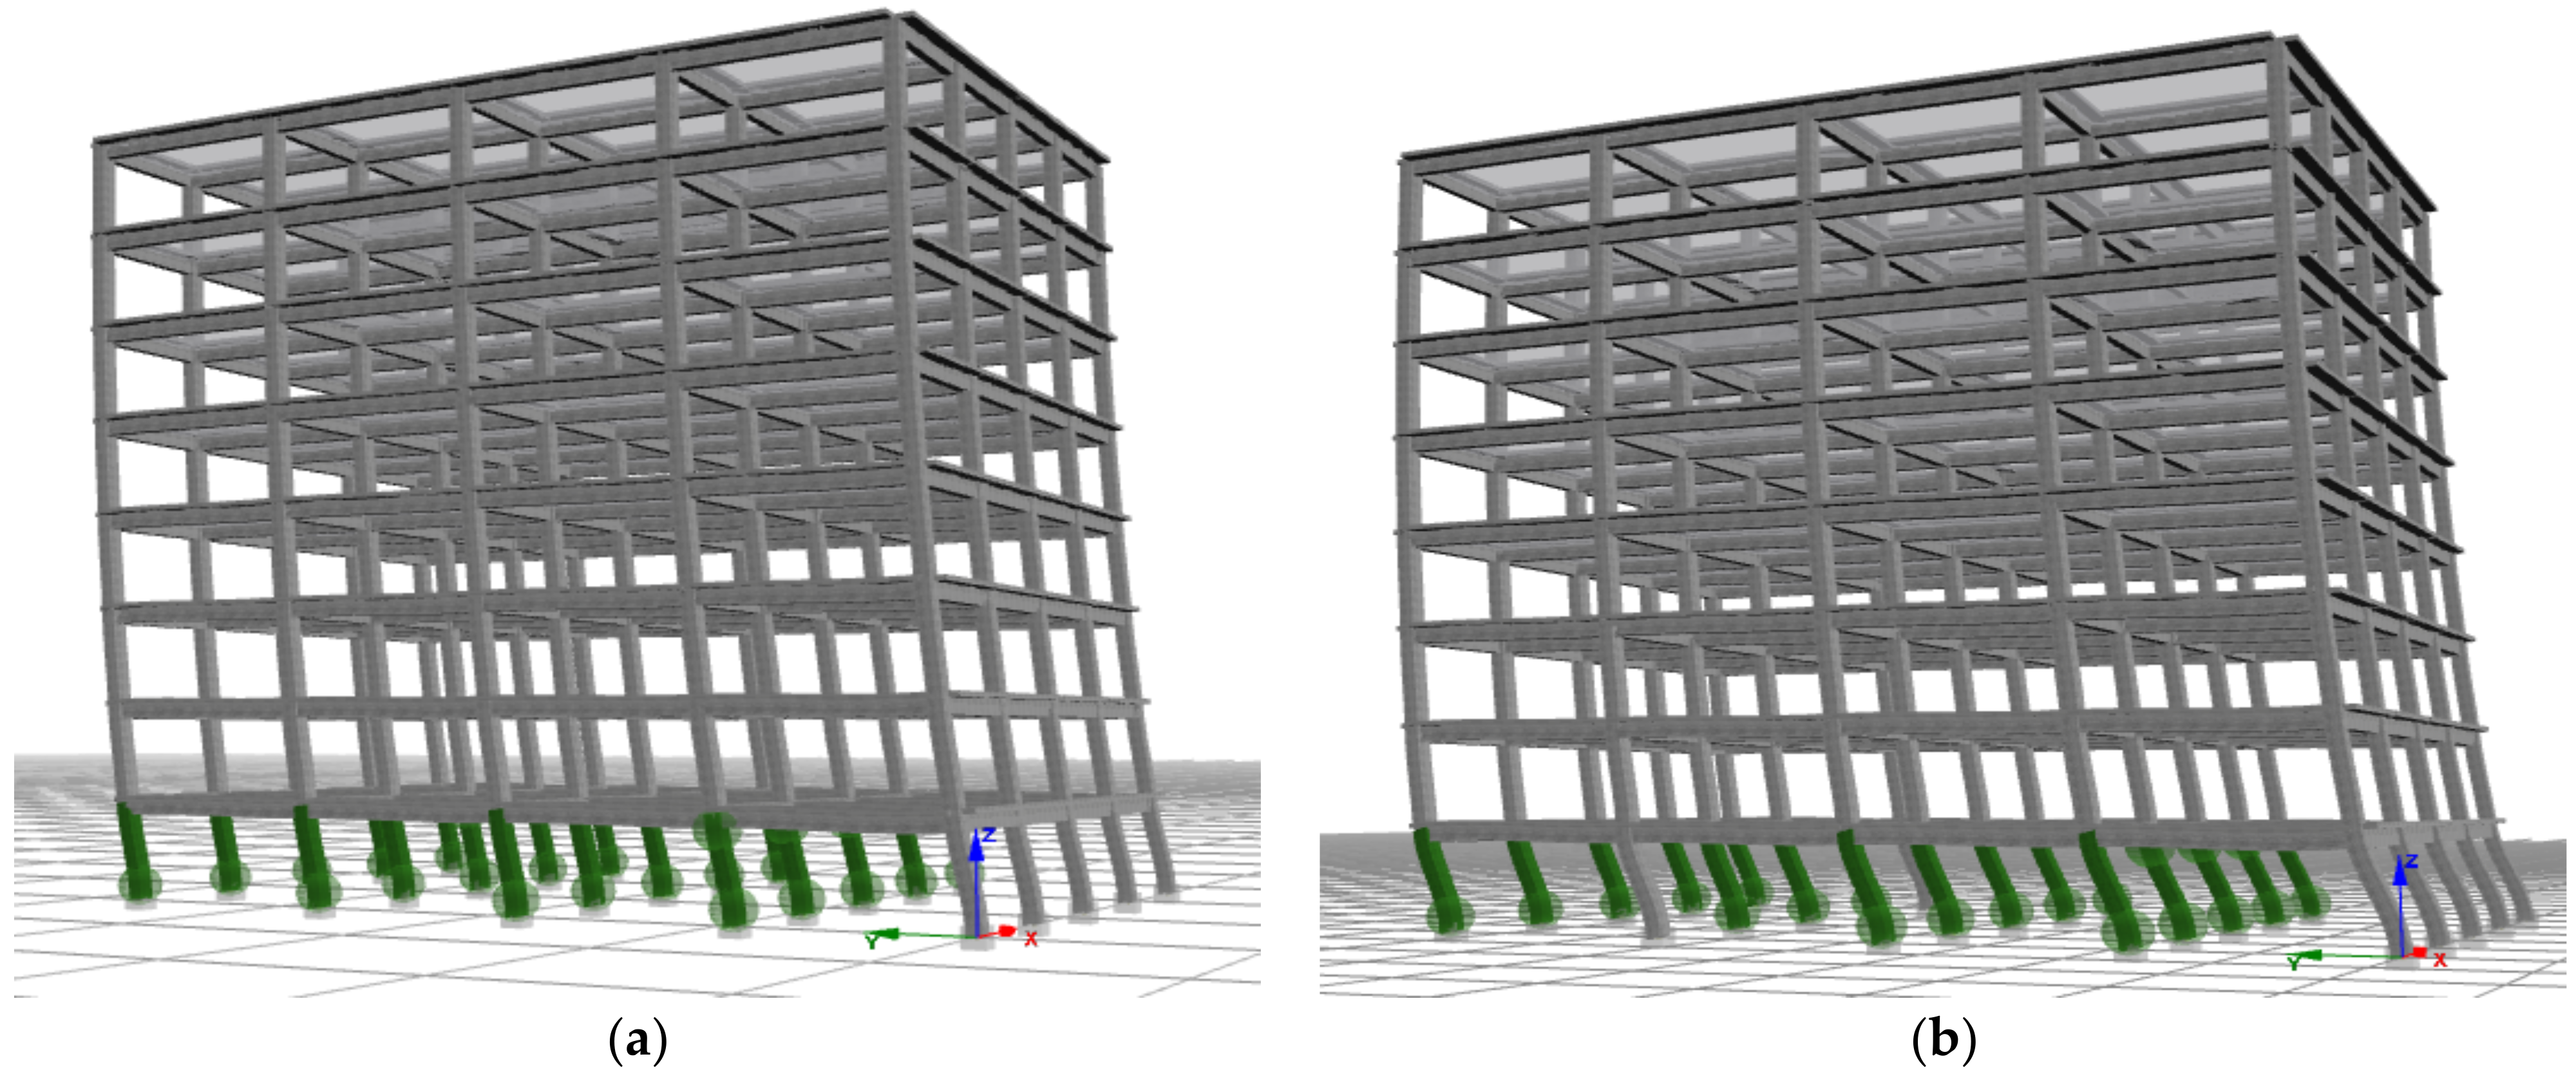
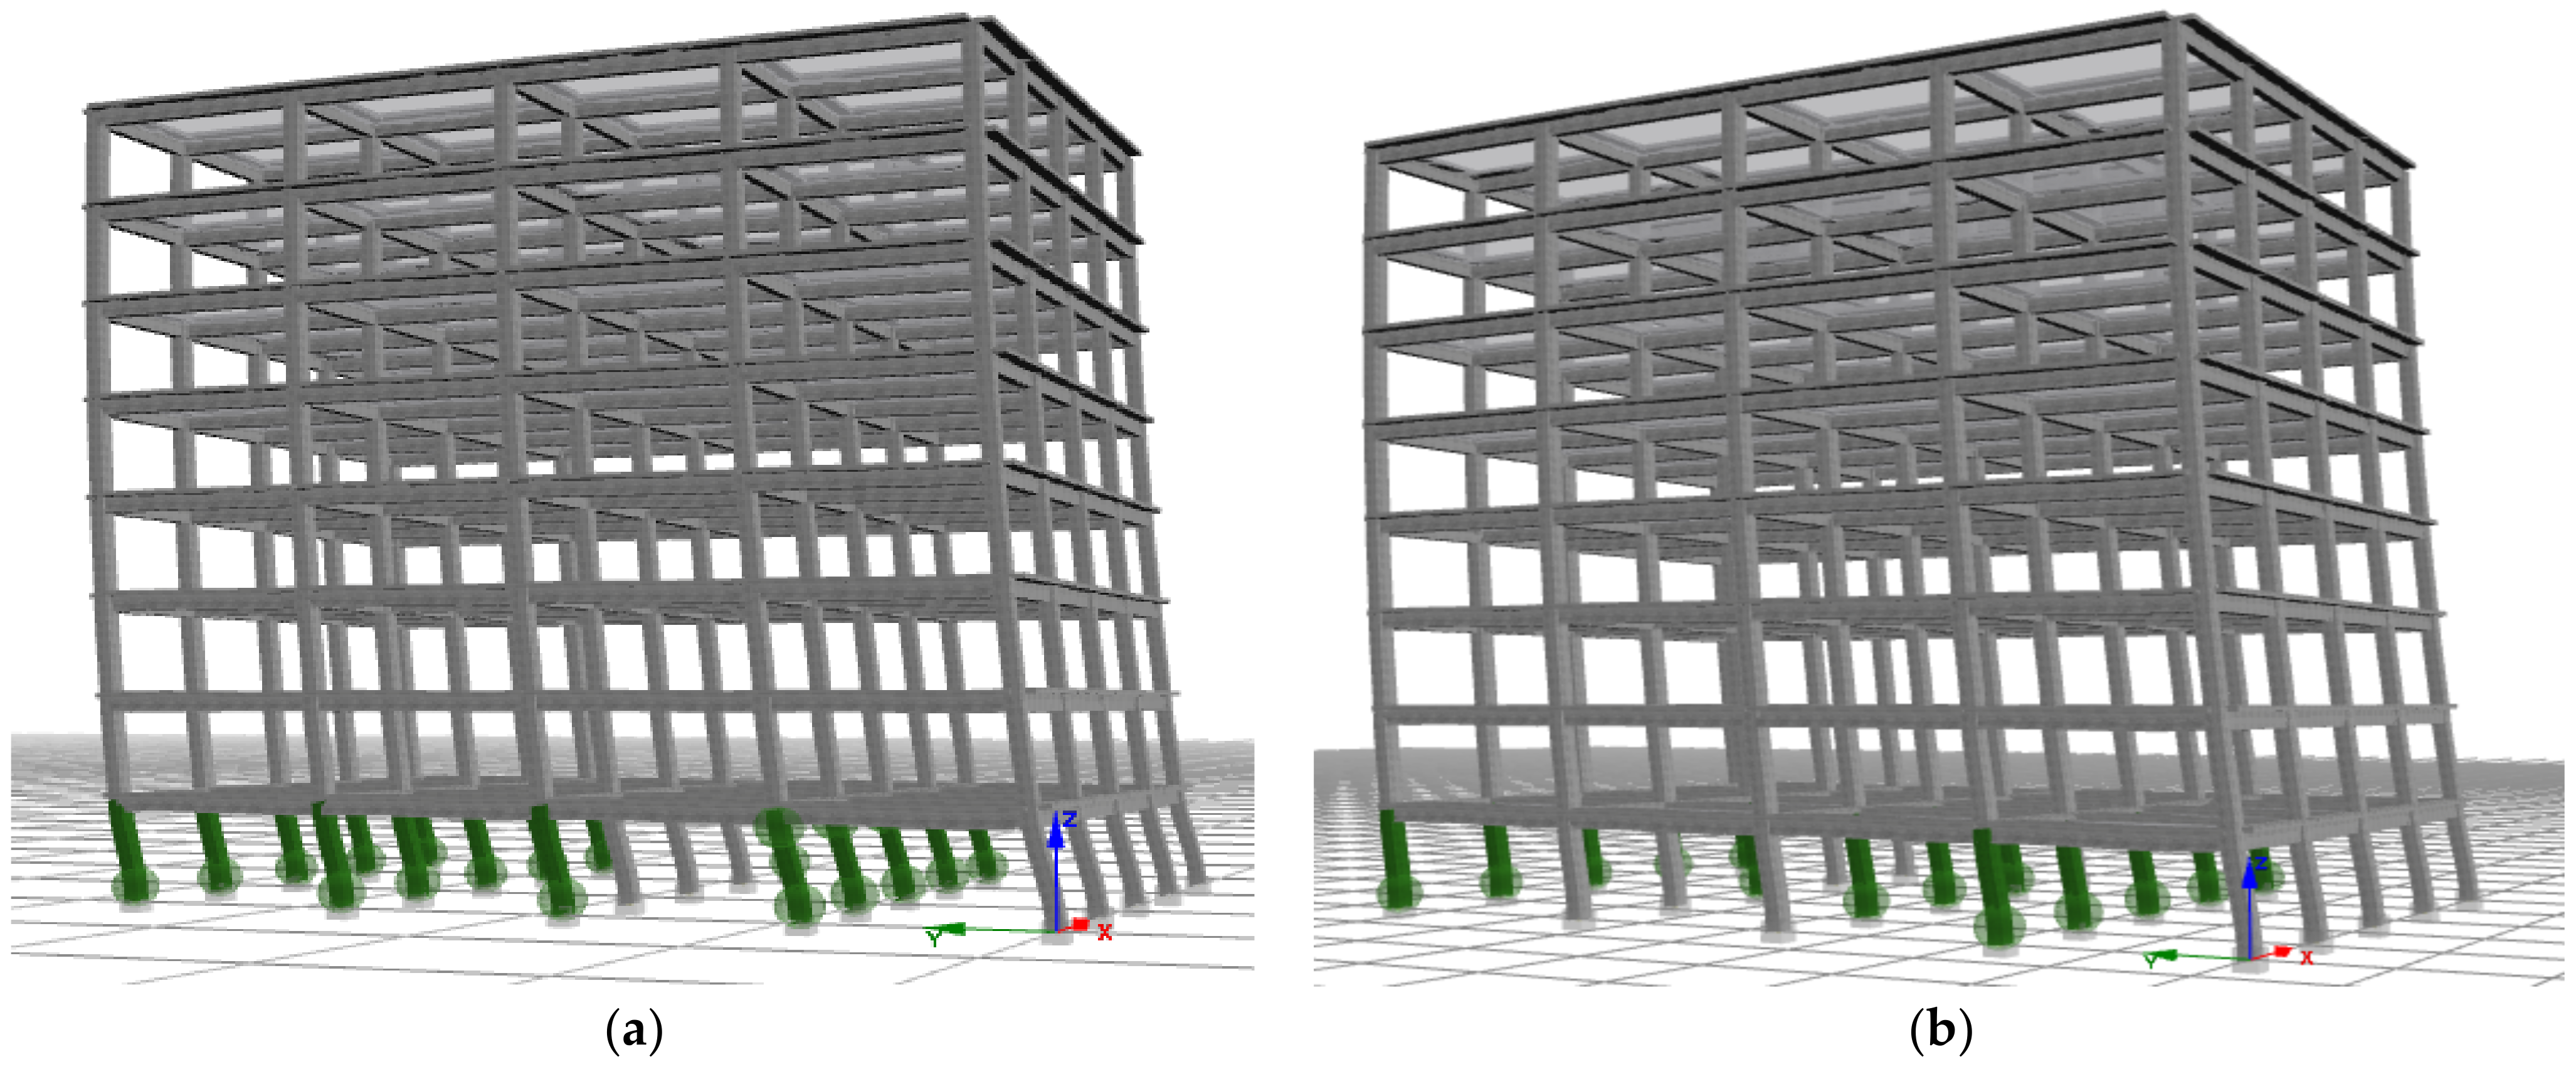
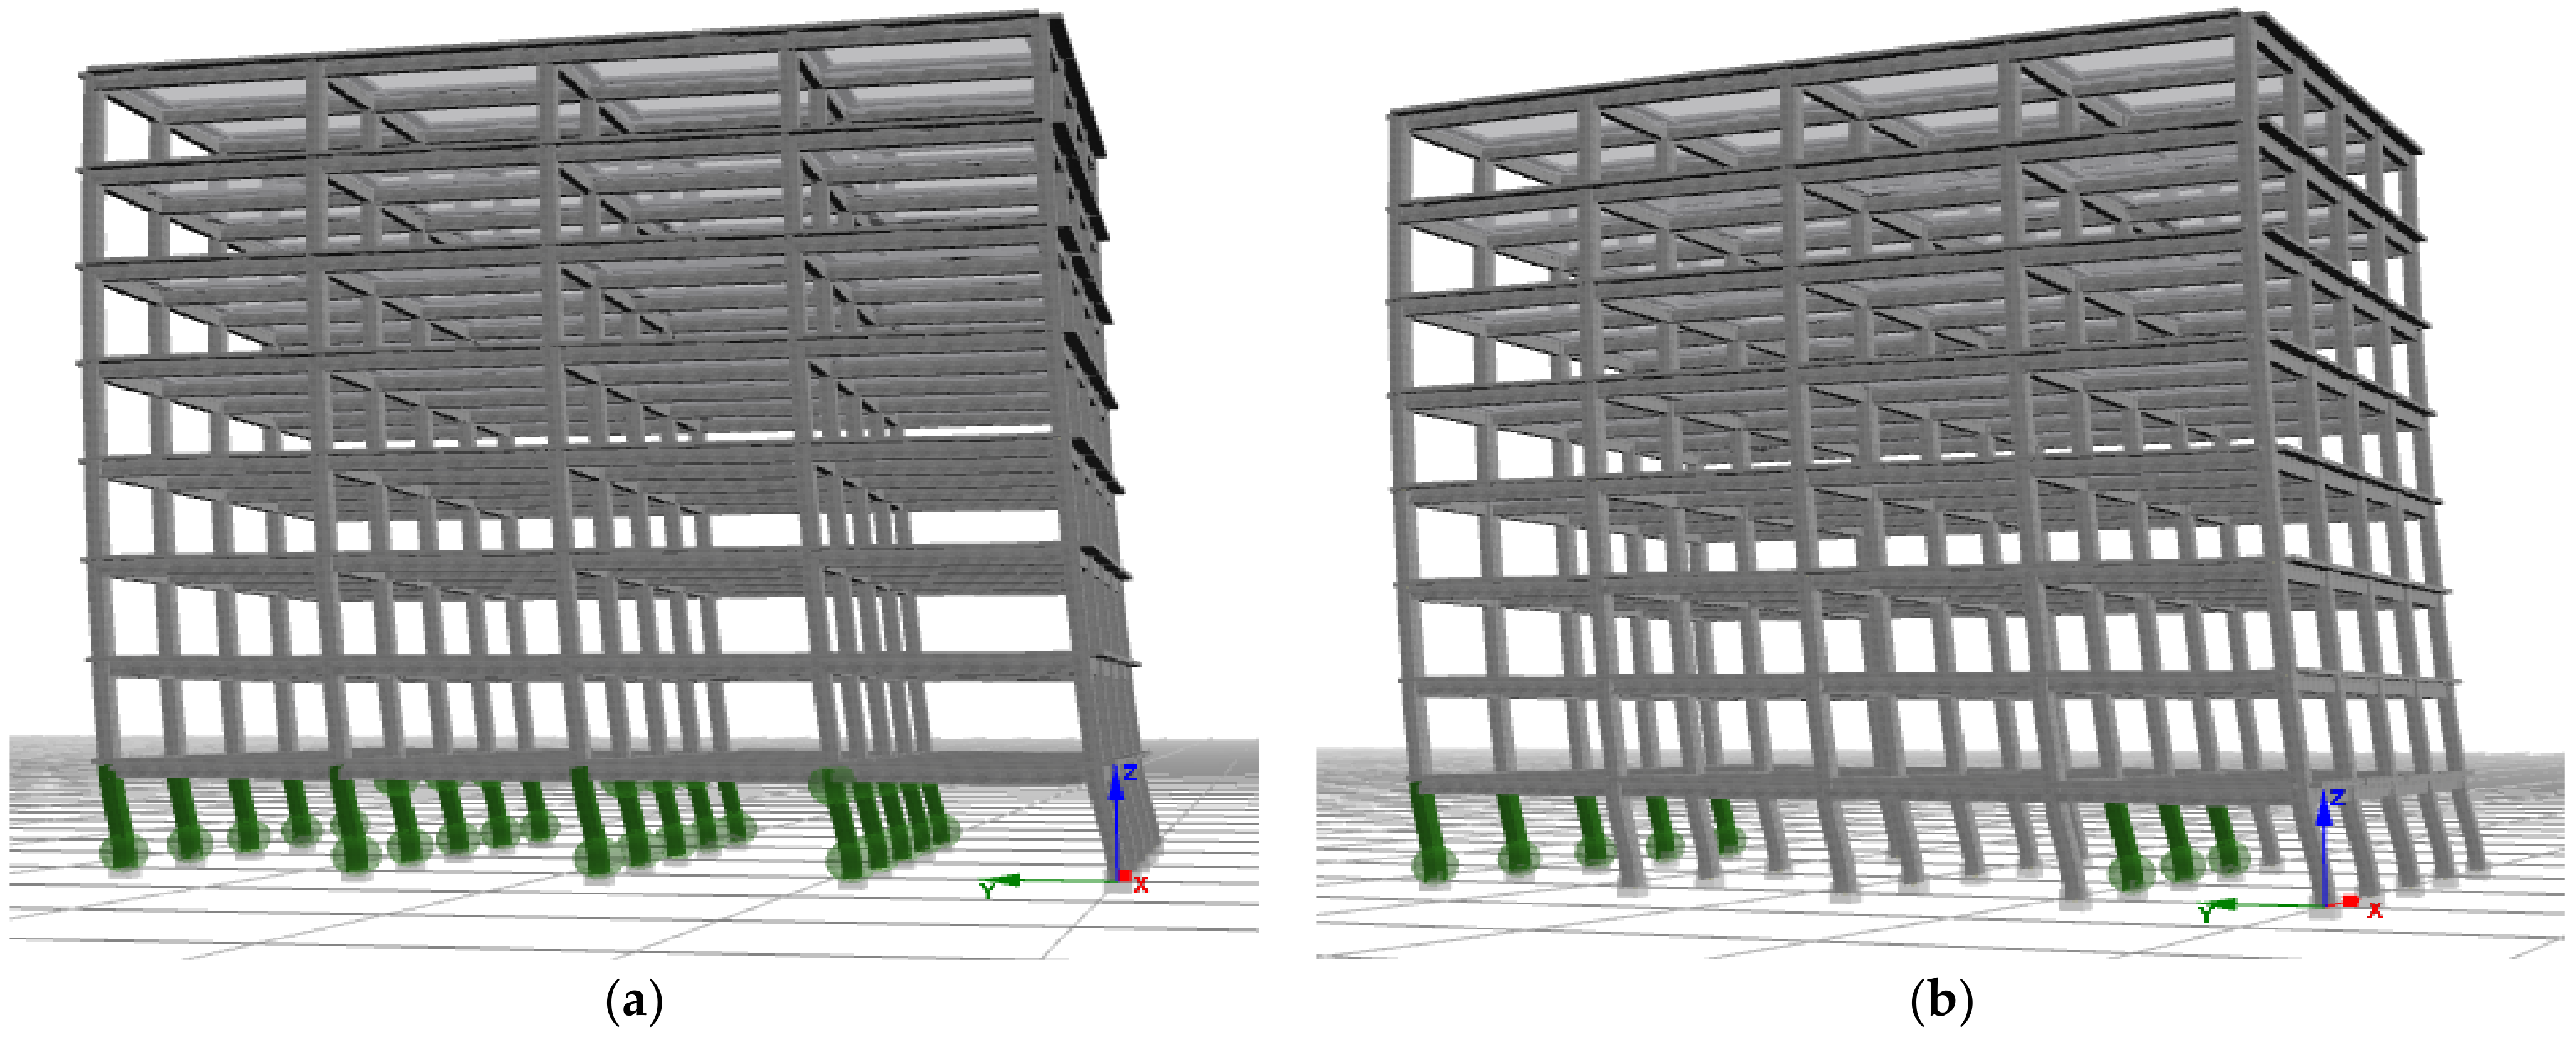
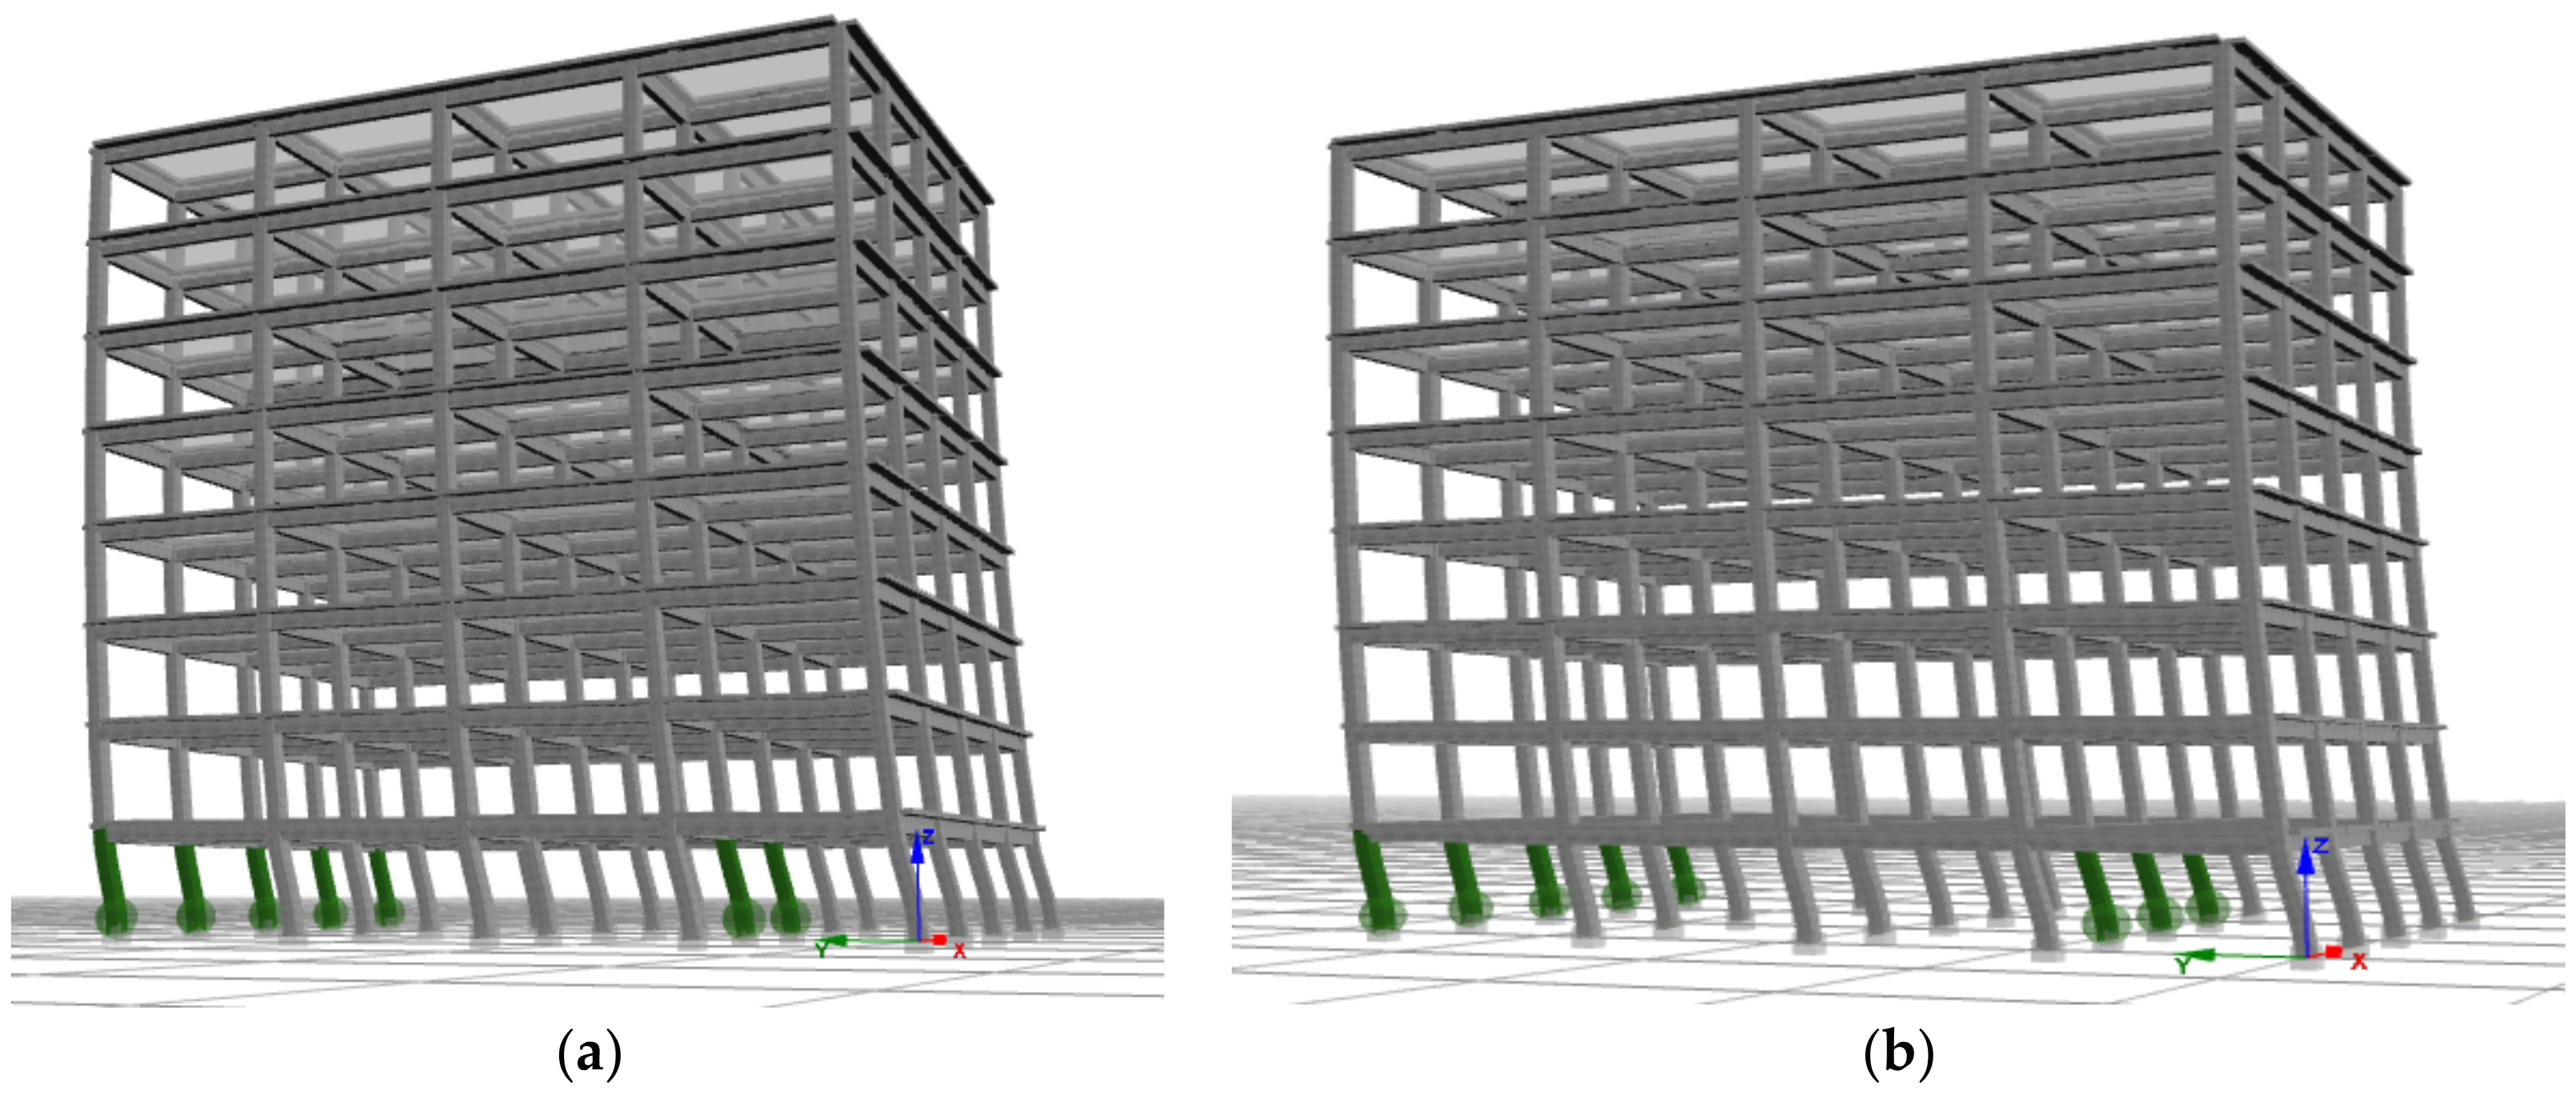
2.4. Description of the Model Building

The SeismoStruct software [44] was used for typical building plan areas with a plan area of 20 m × 18 m, as shown in Figure 11. It is modeled as an eight-story building with a height of 32 m, as illustrated in Figure 11.
The geometric and material properties of the mentioned building are represented in Table 1. The building model cases selected for analysis with respect to the concrete grades of C10, C16, C20, C25, and C50 for the stirrups of the structural element, such as beam and columns with 135° angled end-hook shape and straight hooks. The other parameters, including dynamic parameters, were considered as constant for all the analysis cases.

3. Results

The pushover analysis of the eight-story model building was performed to examine the effect of the hook type of stirrups on the concrete quality of the structural elements. The base shear versus top displacement graphs of the building have been plotted and compared for each concrete grade and type of the transverse reinforcement after assigning sectional properties, support conditions, static and dynamic loading, and a combination of loading types. However, in order to evaluate the cases, mathematical models of the stress–strain relationship are also considered to state the behavior of confined concrete under loads. These models are necessary for multivariable strength issues related to the concrete and steel properties. Mander et al., Kent-Scott-Park, and Kappos-Konstantinidis material models were compared along with the steel model of Menegetto-Pinto, selected as constant model, in order to evaluate different concrete models for confinement type.

3.1. Parameter Analysis

To further study the seismic performance of 135-degree hooked stirrups and 90-degree hooked stirrups with different concrete grades, a parametric study is carried out to evaluate the effect of stirrup configuration on the seismic performance of structures. In this section, a multistory RC building model used in the parametric study was first established, after which the analysis results were presented.

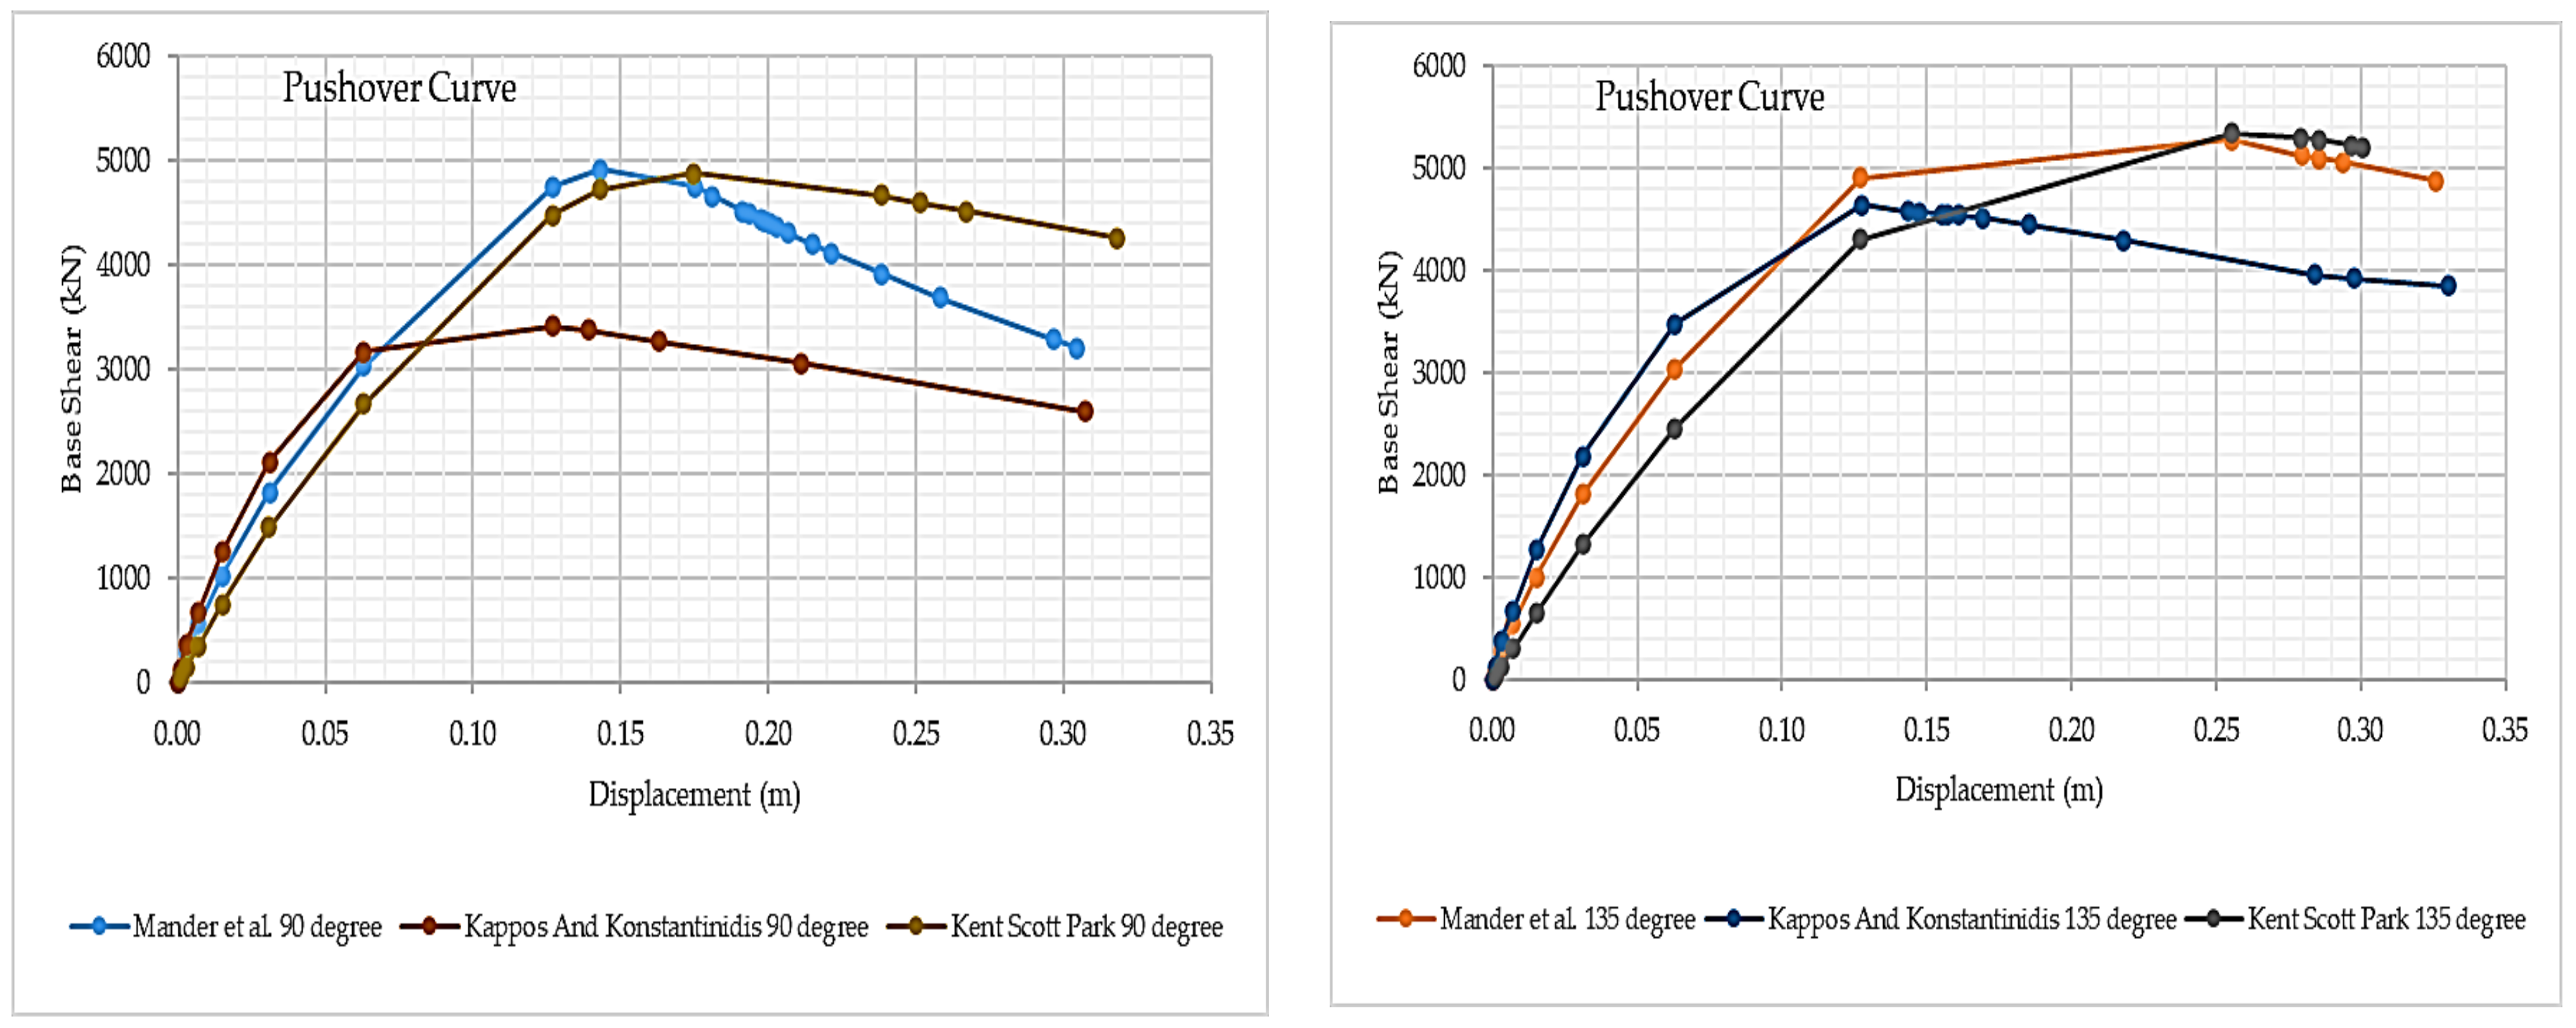
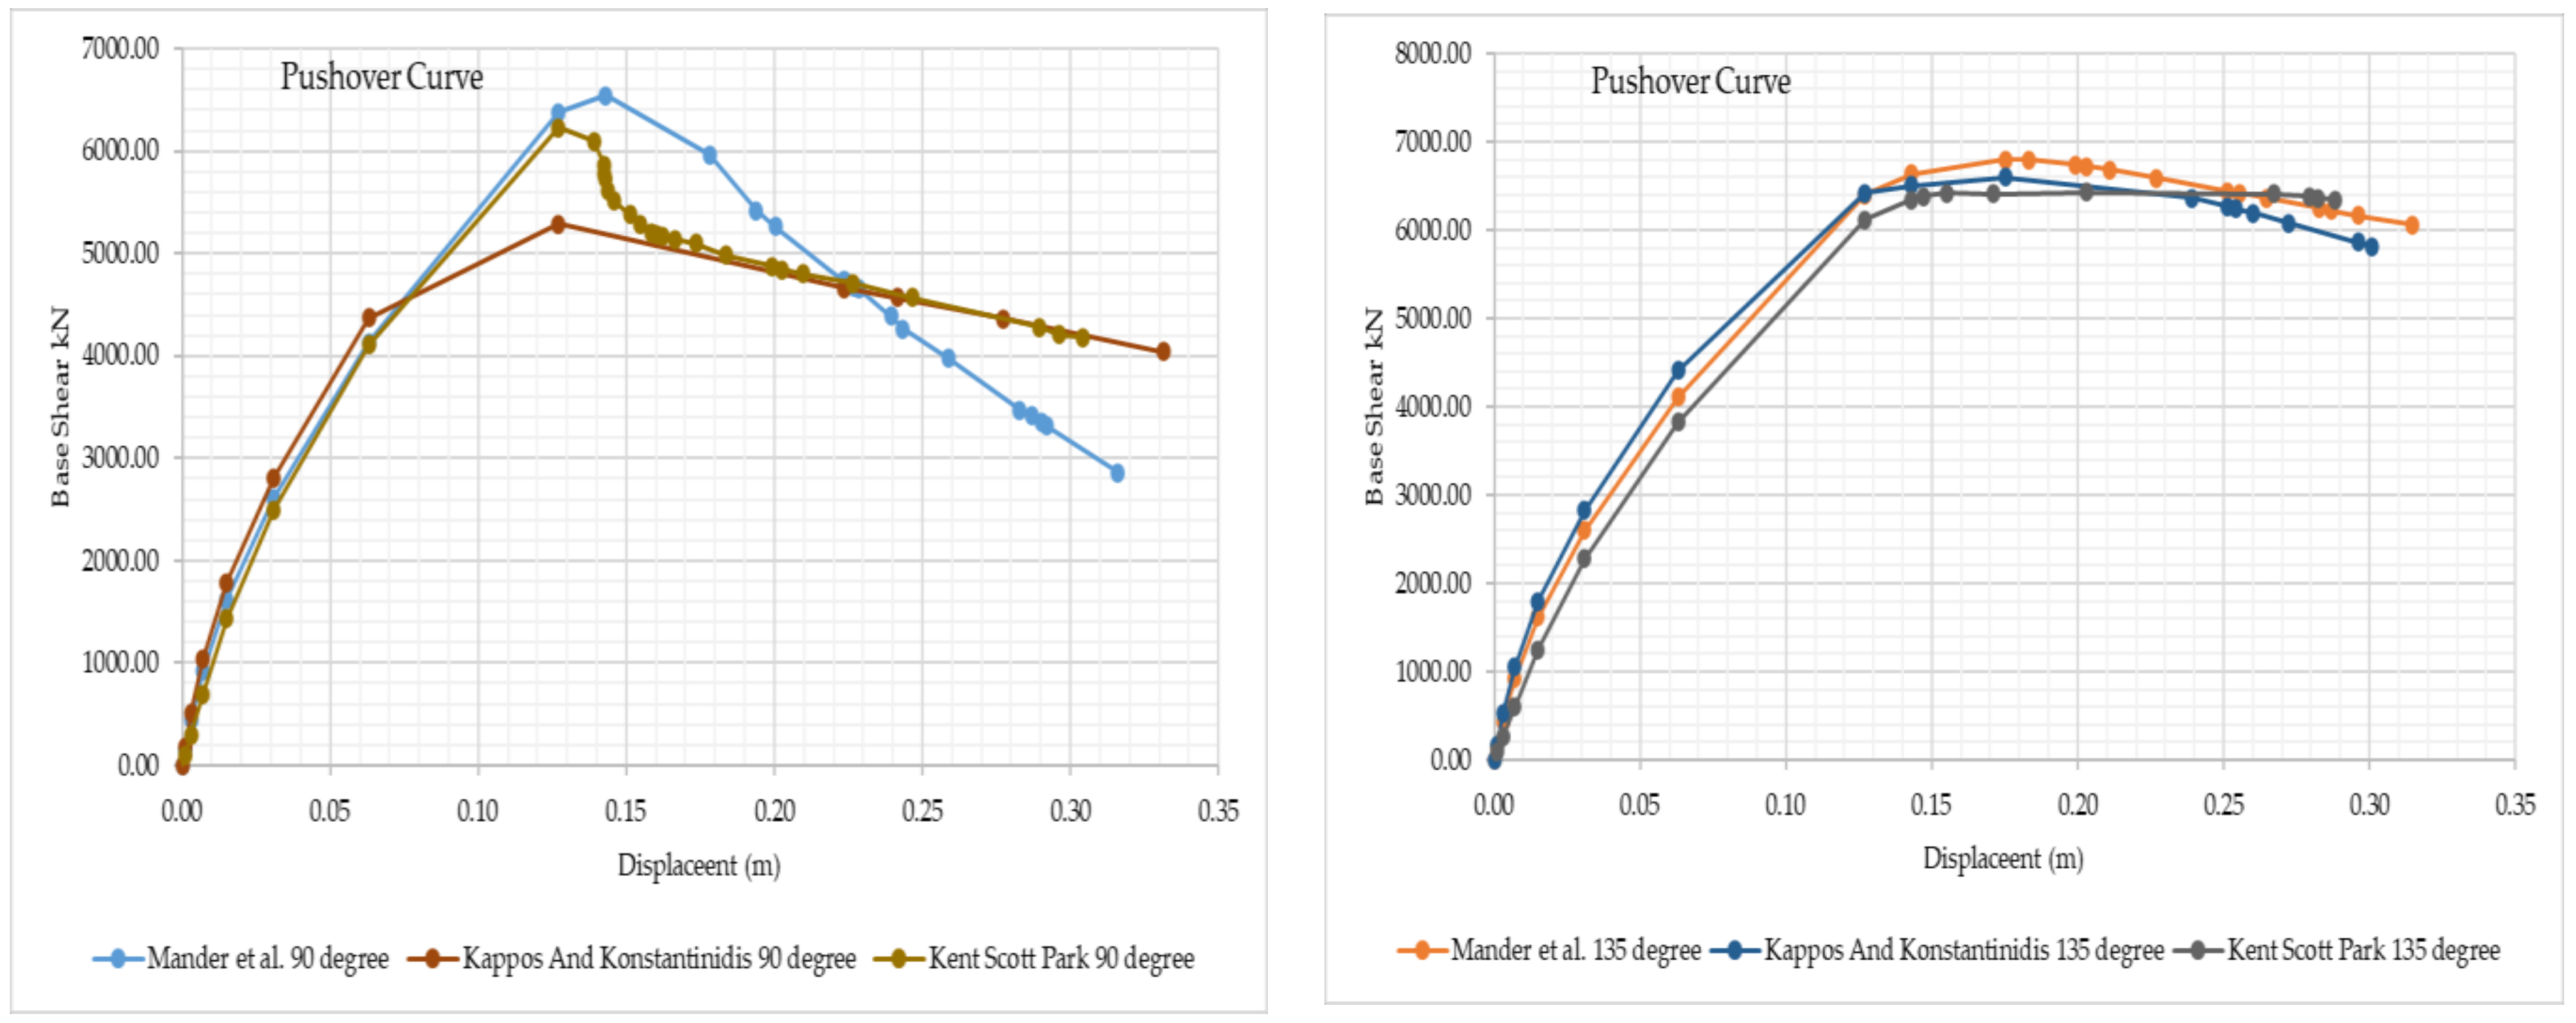
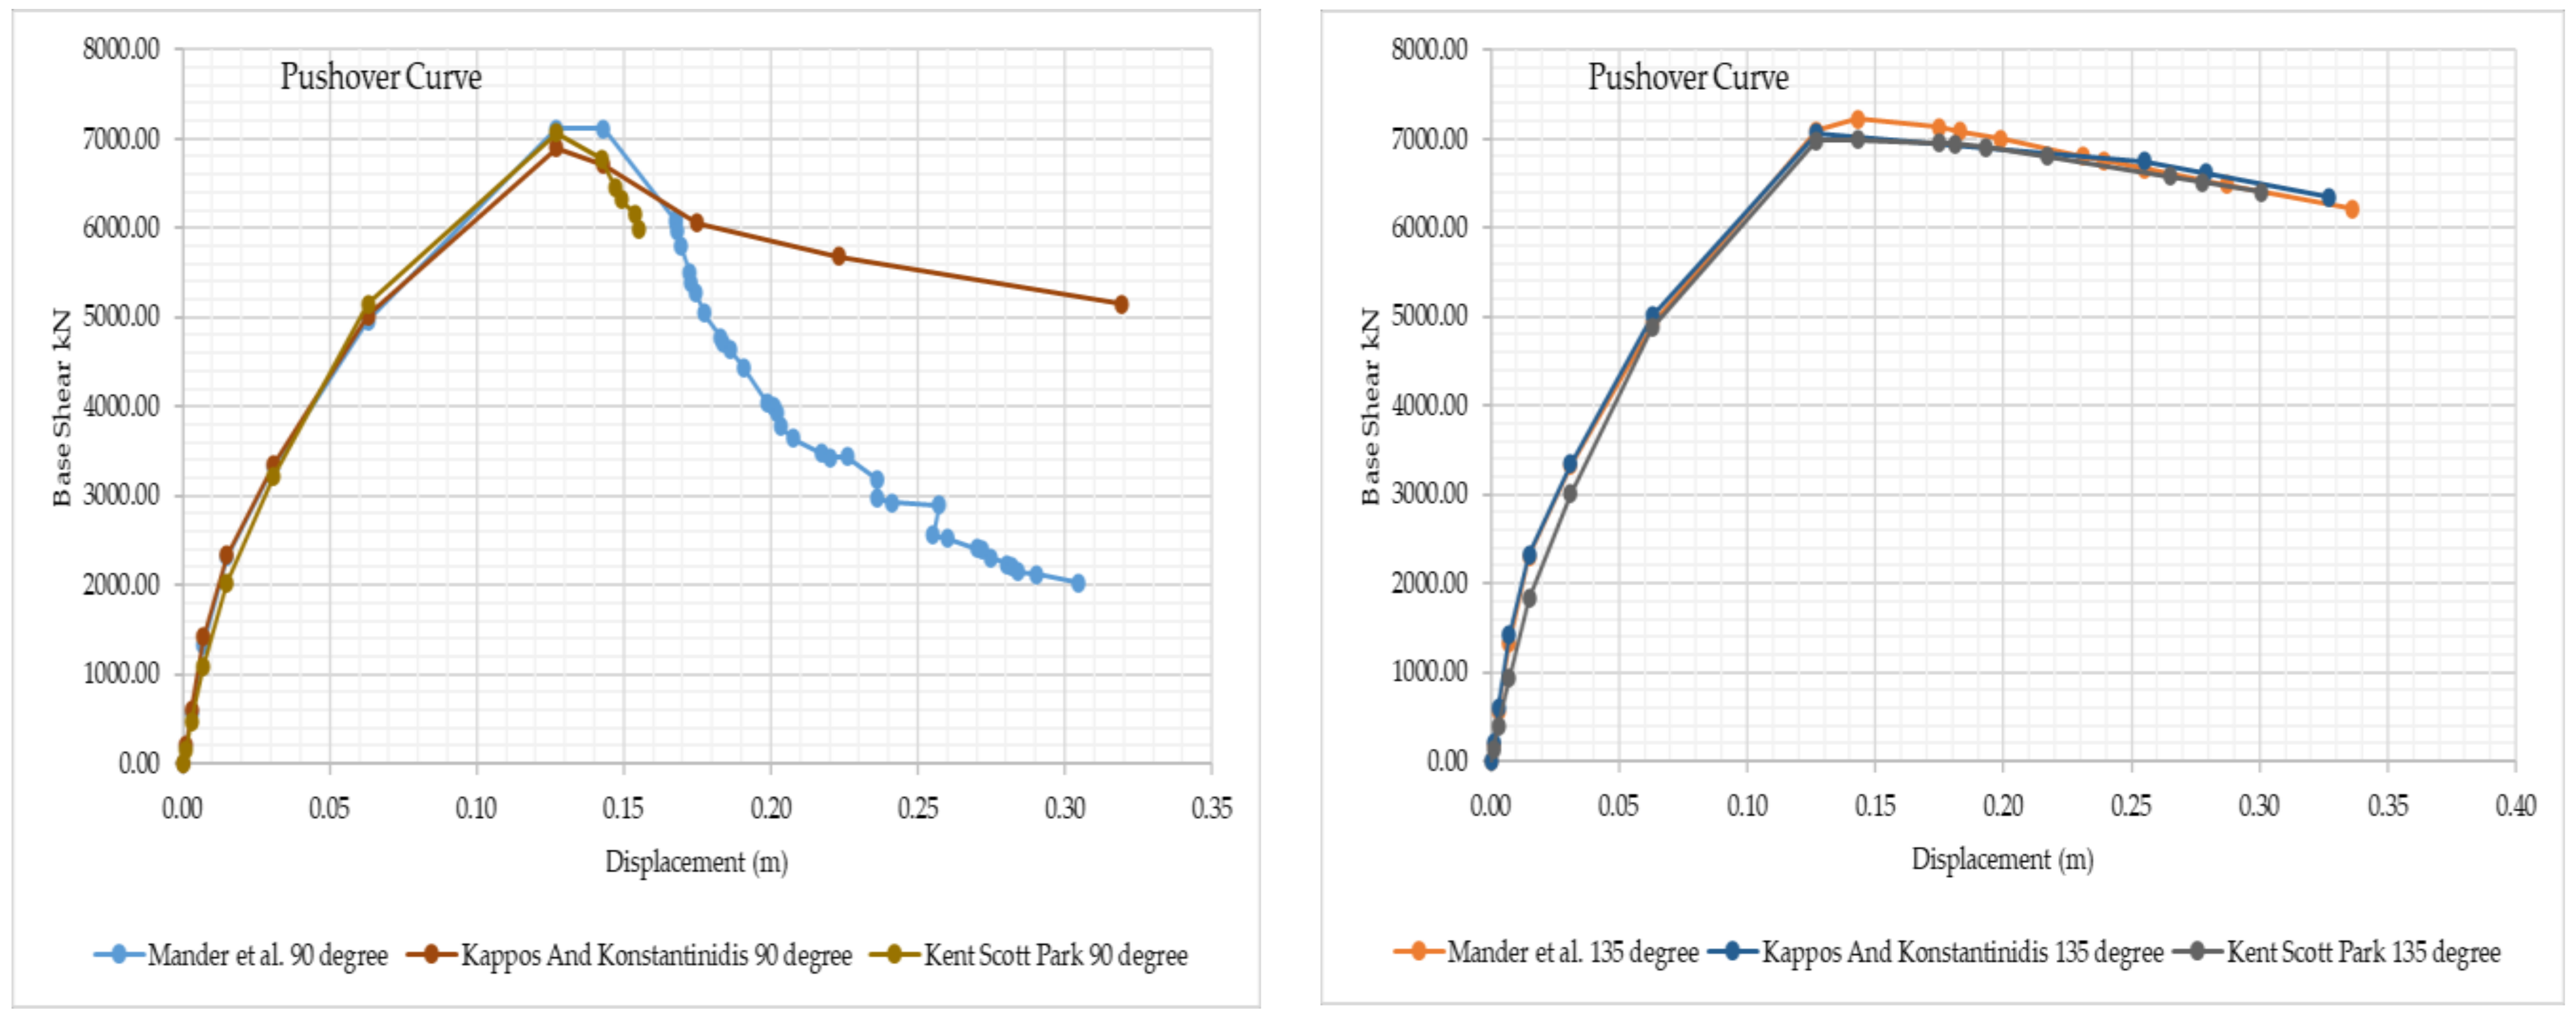
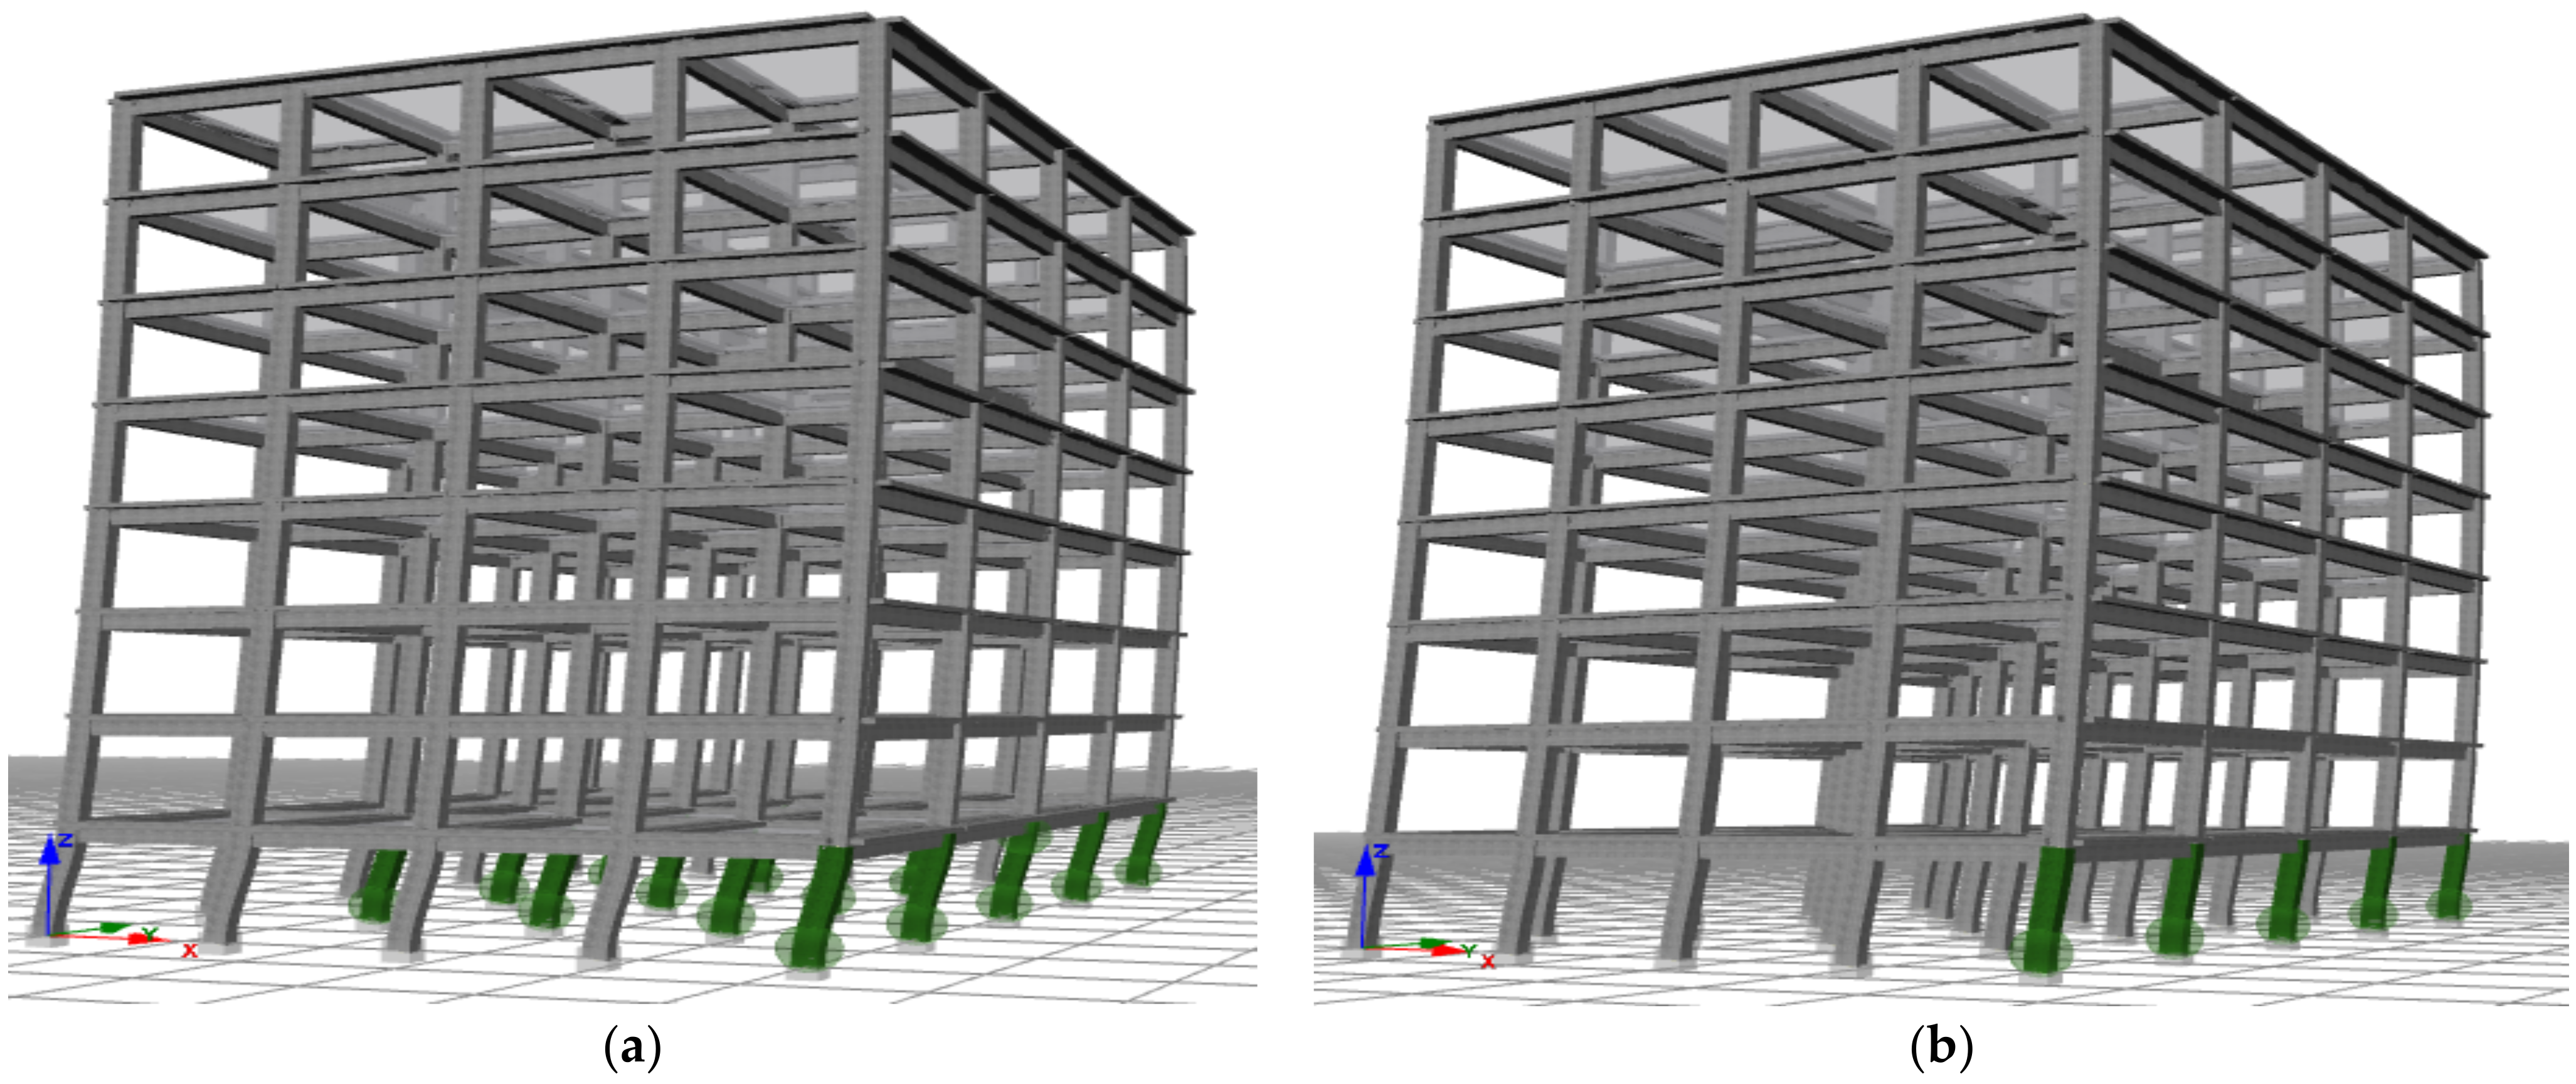
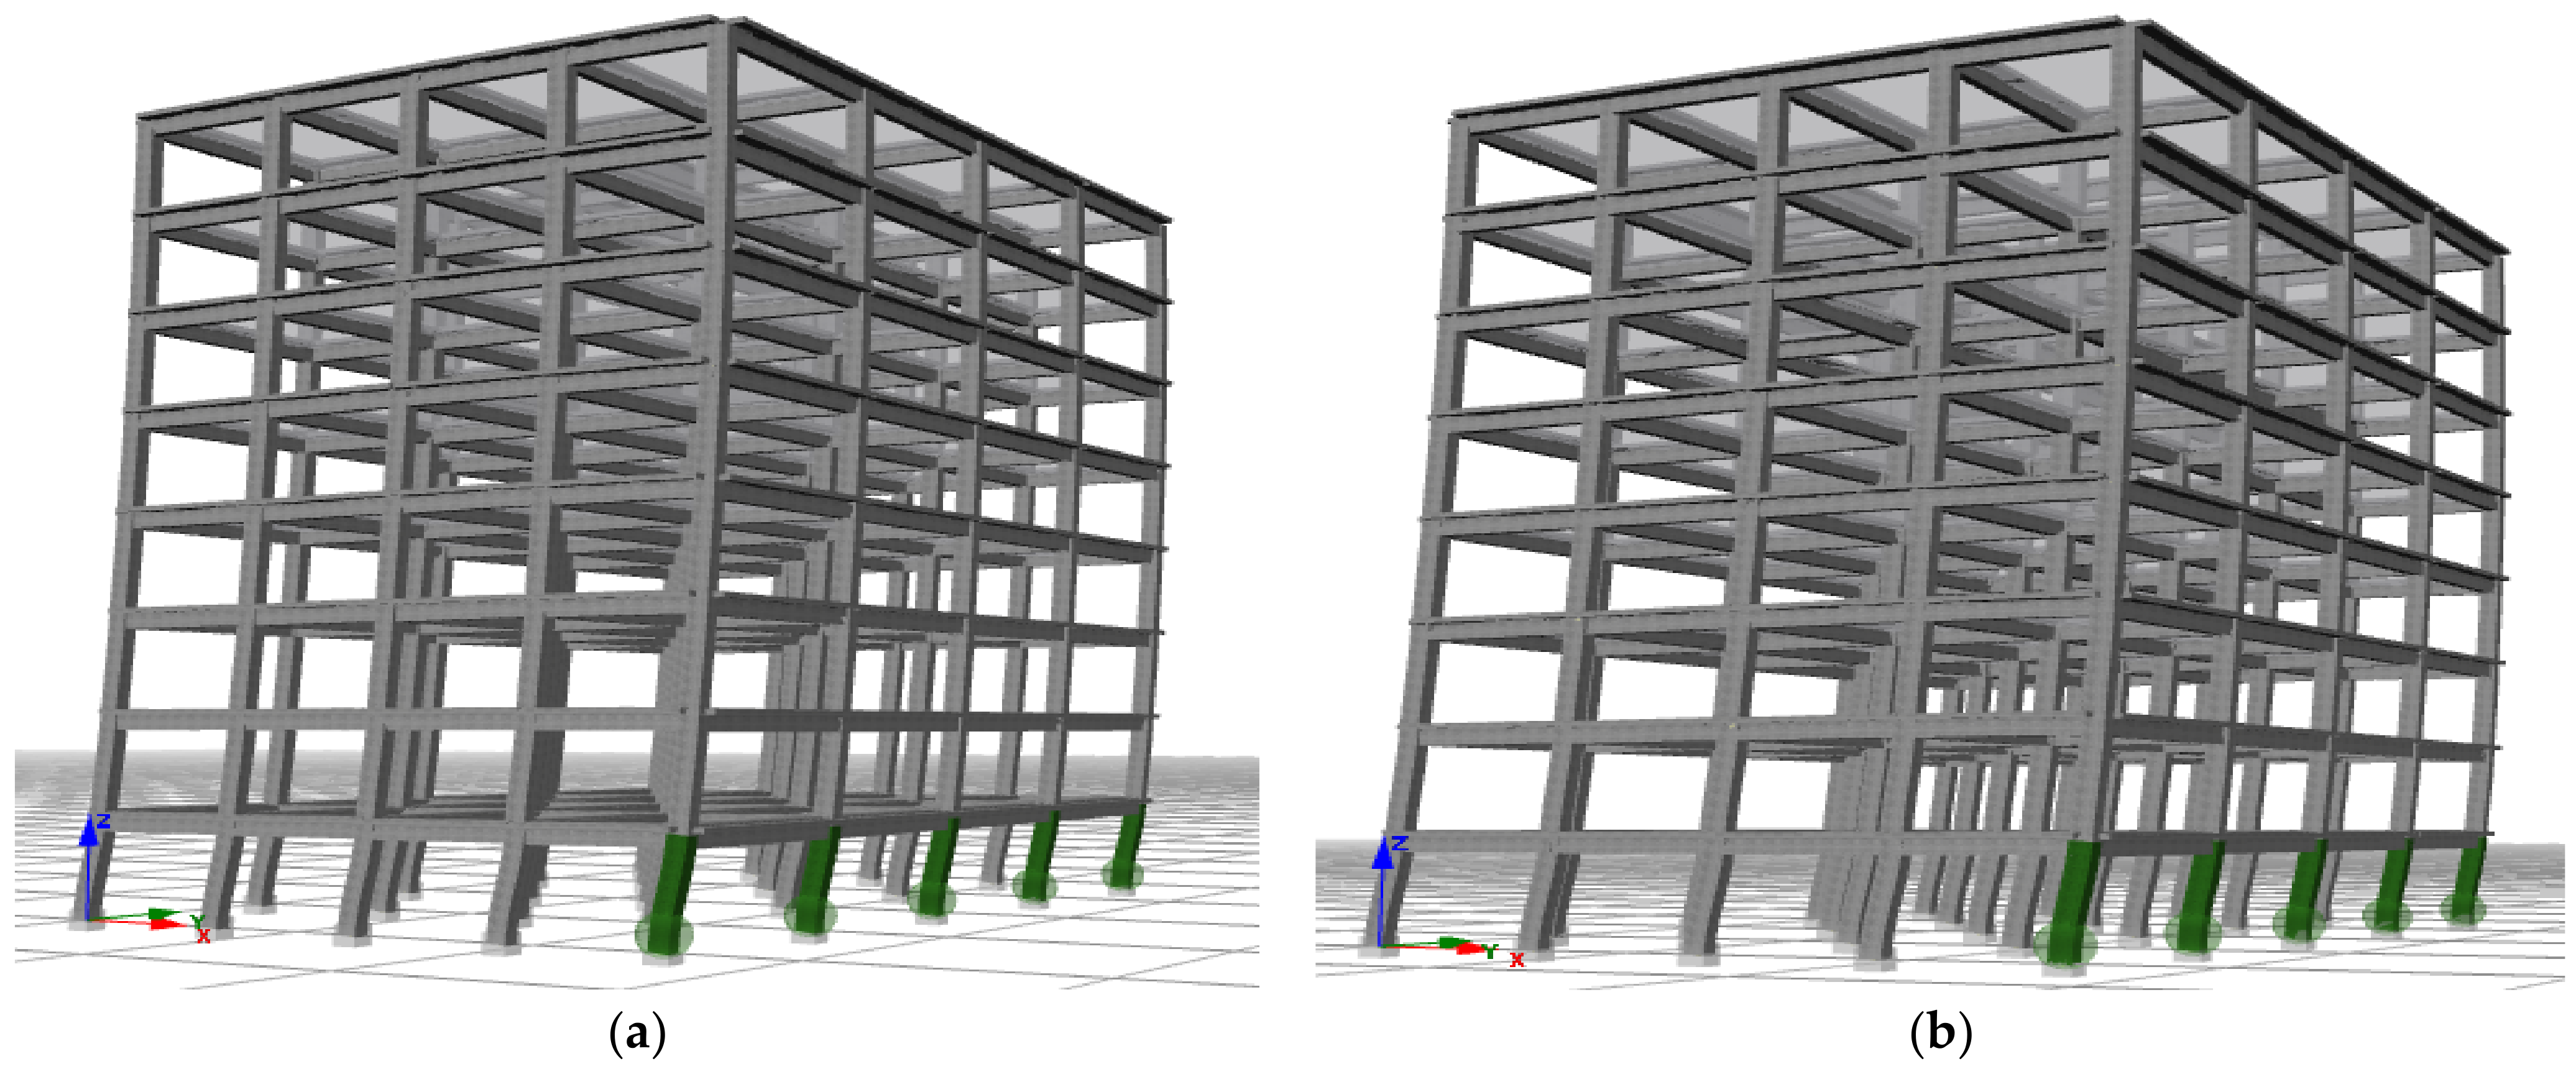
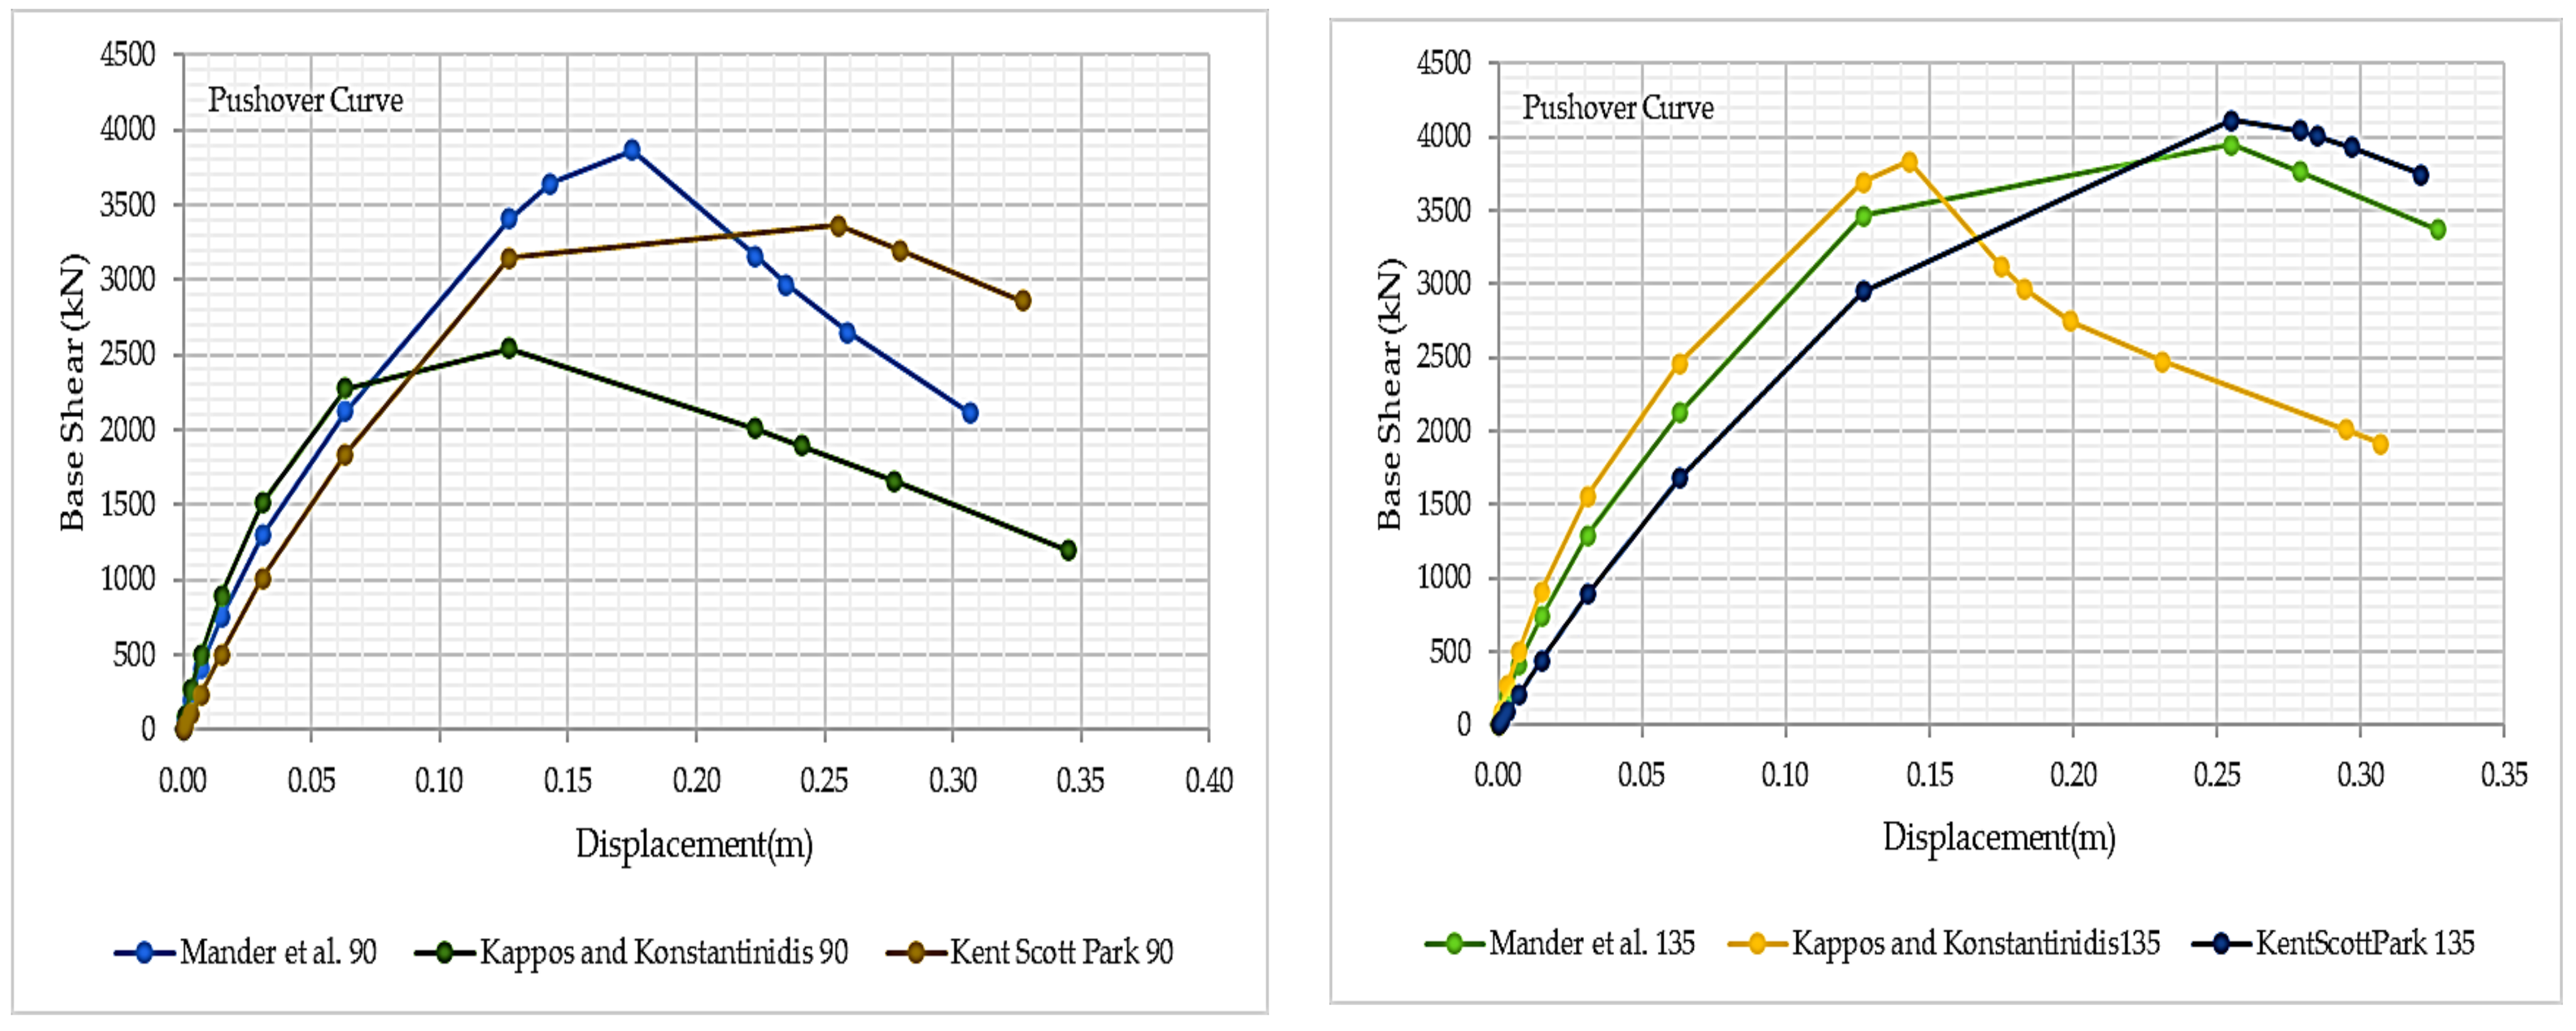
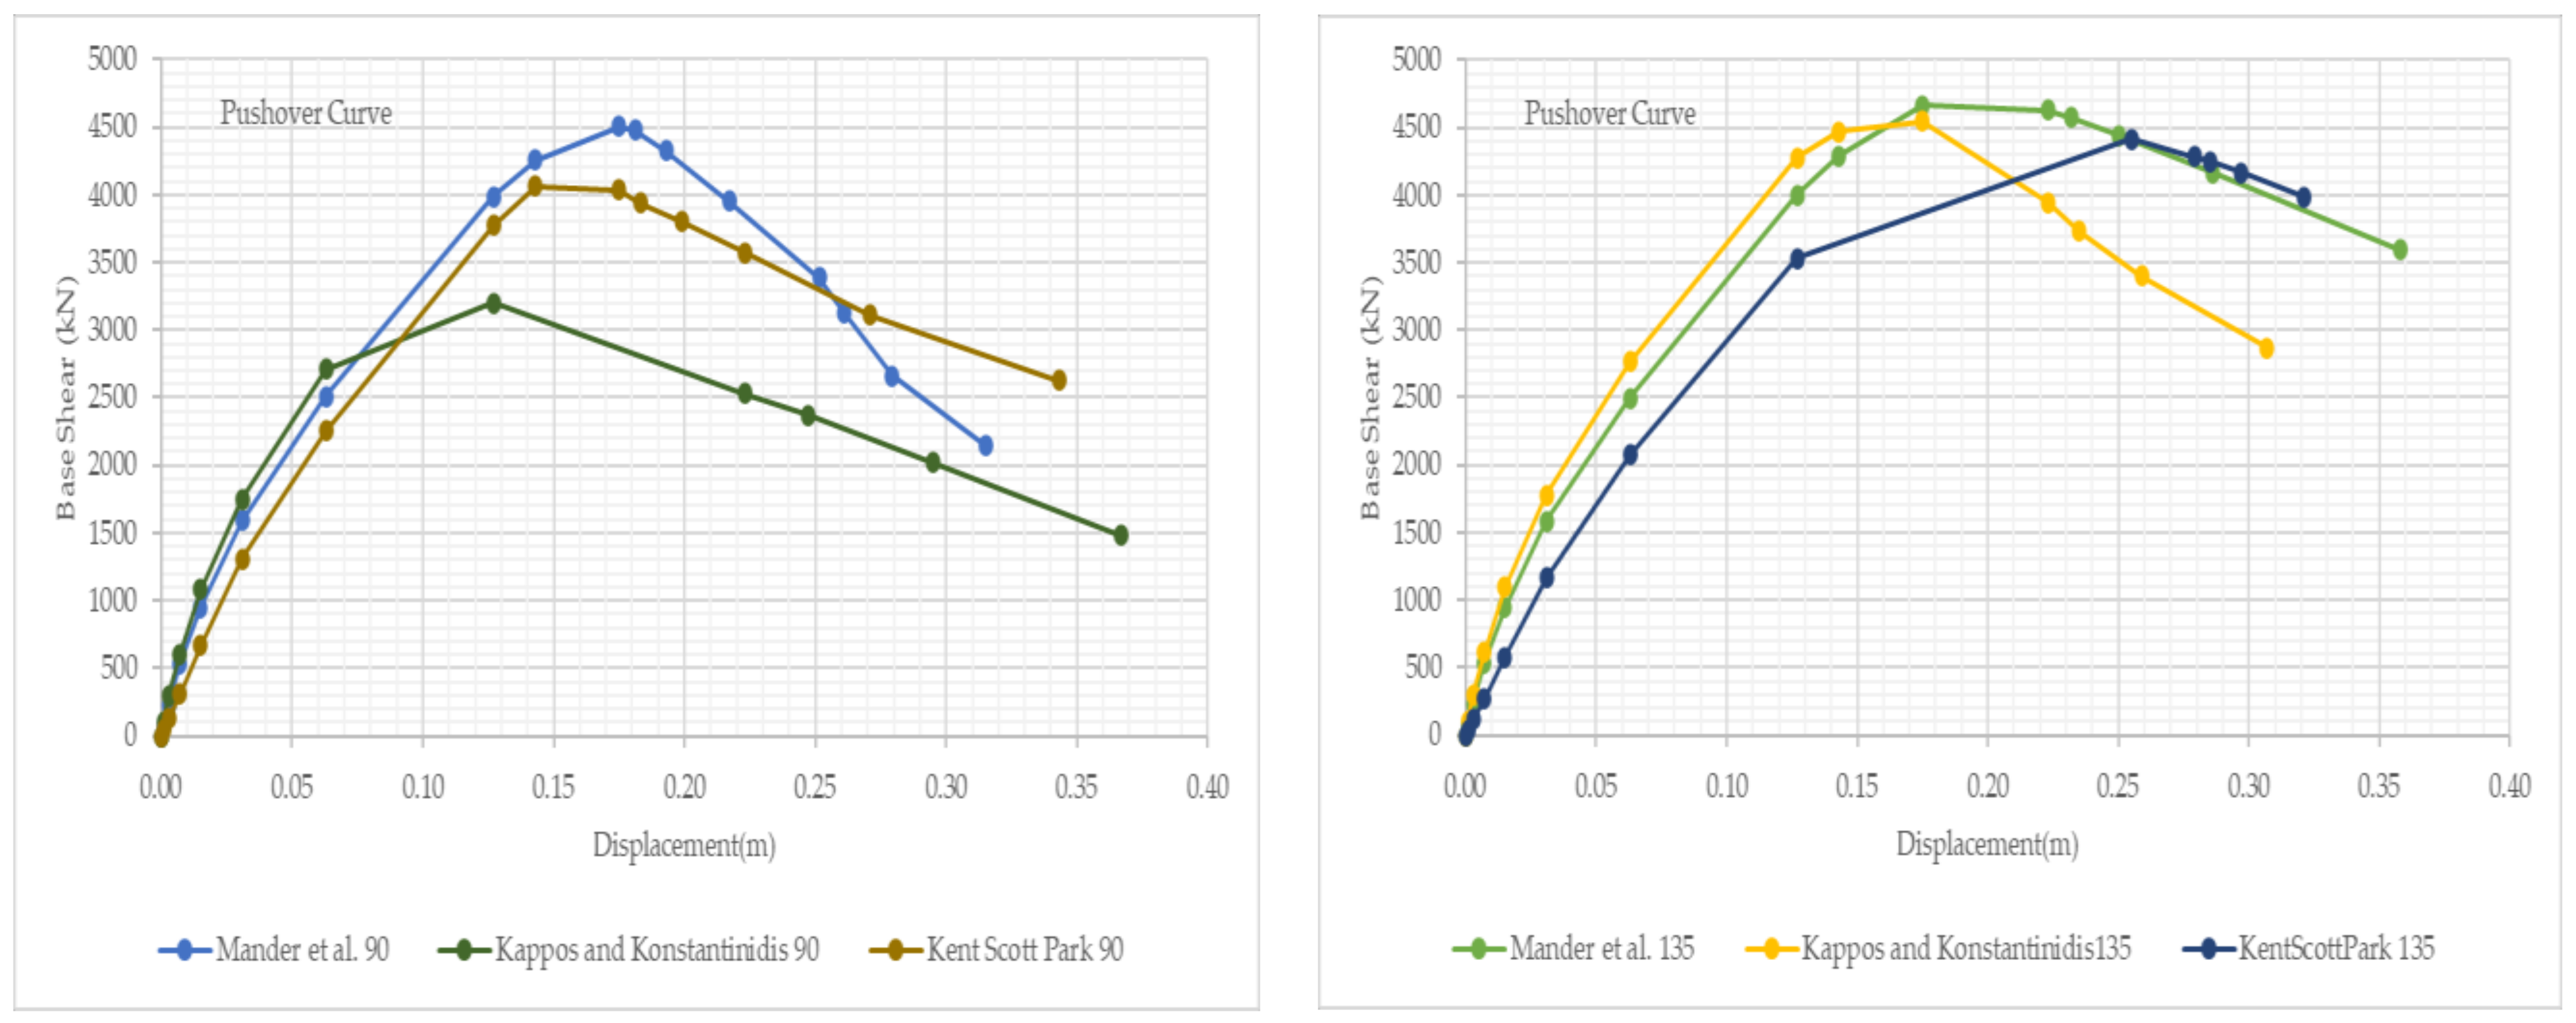
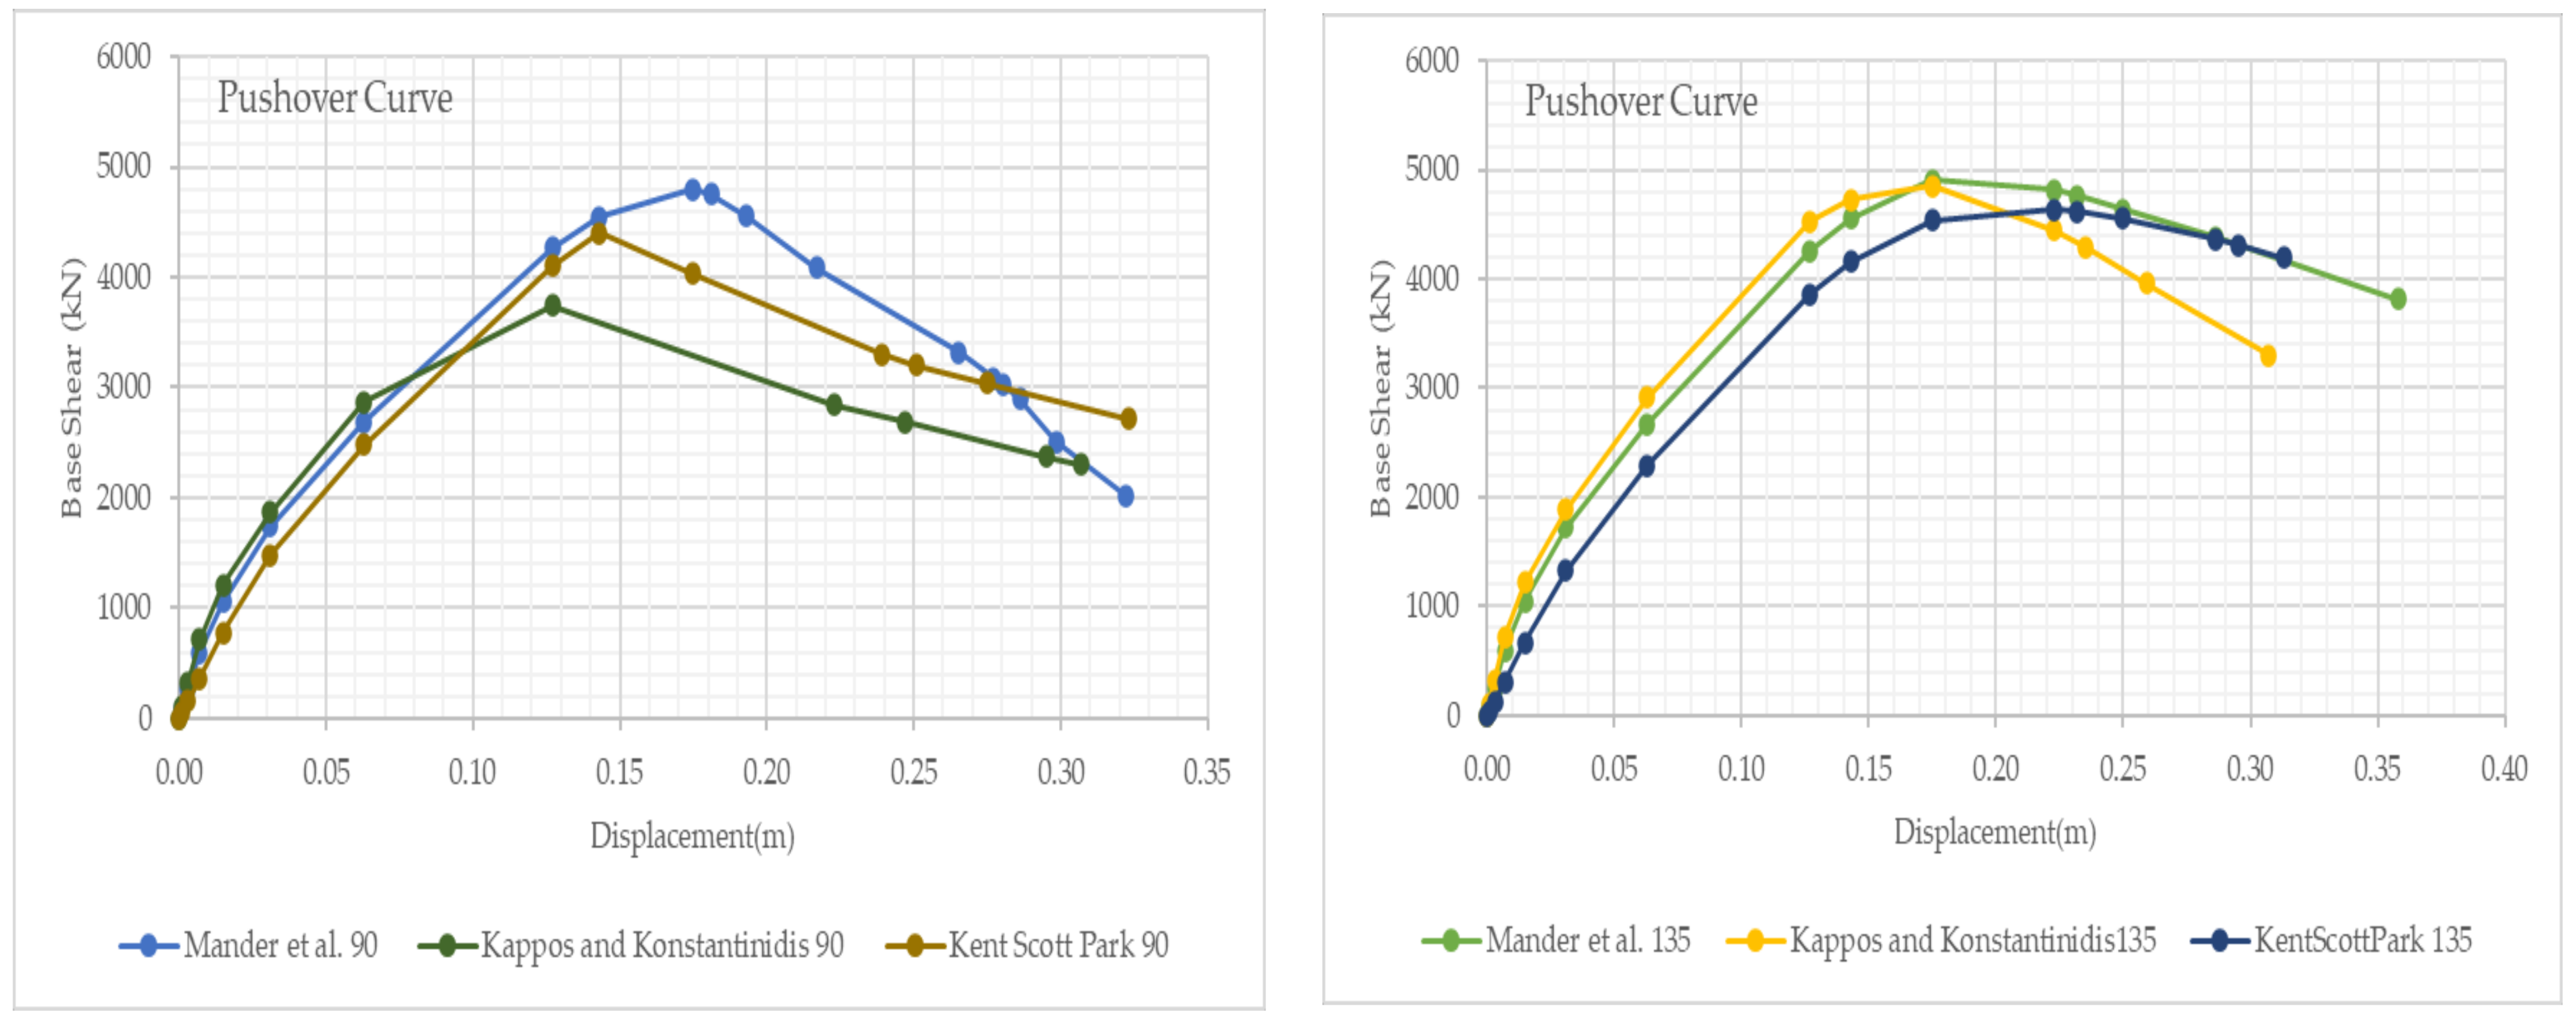
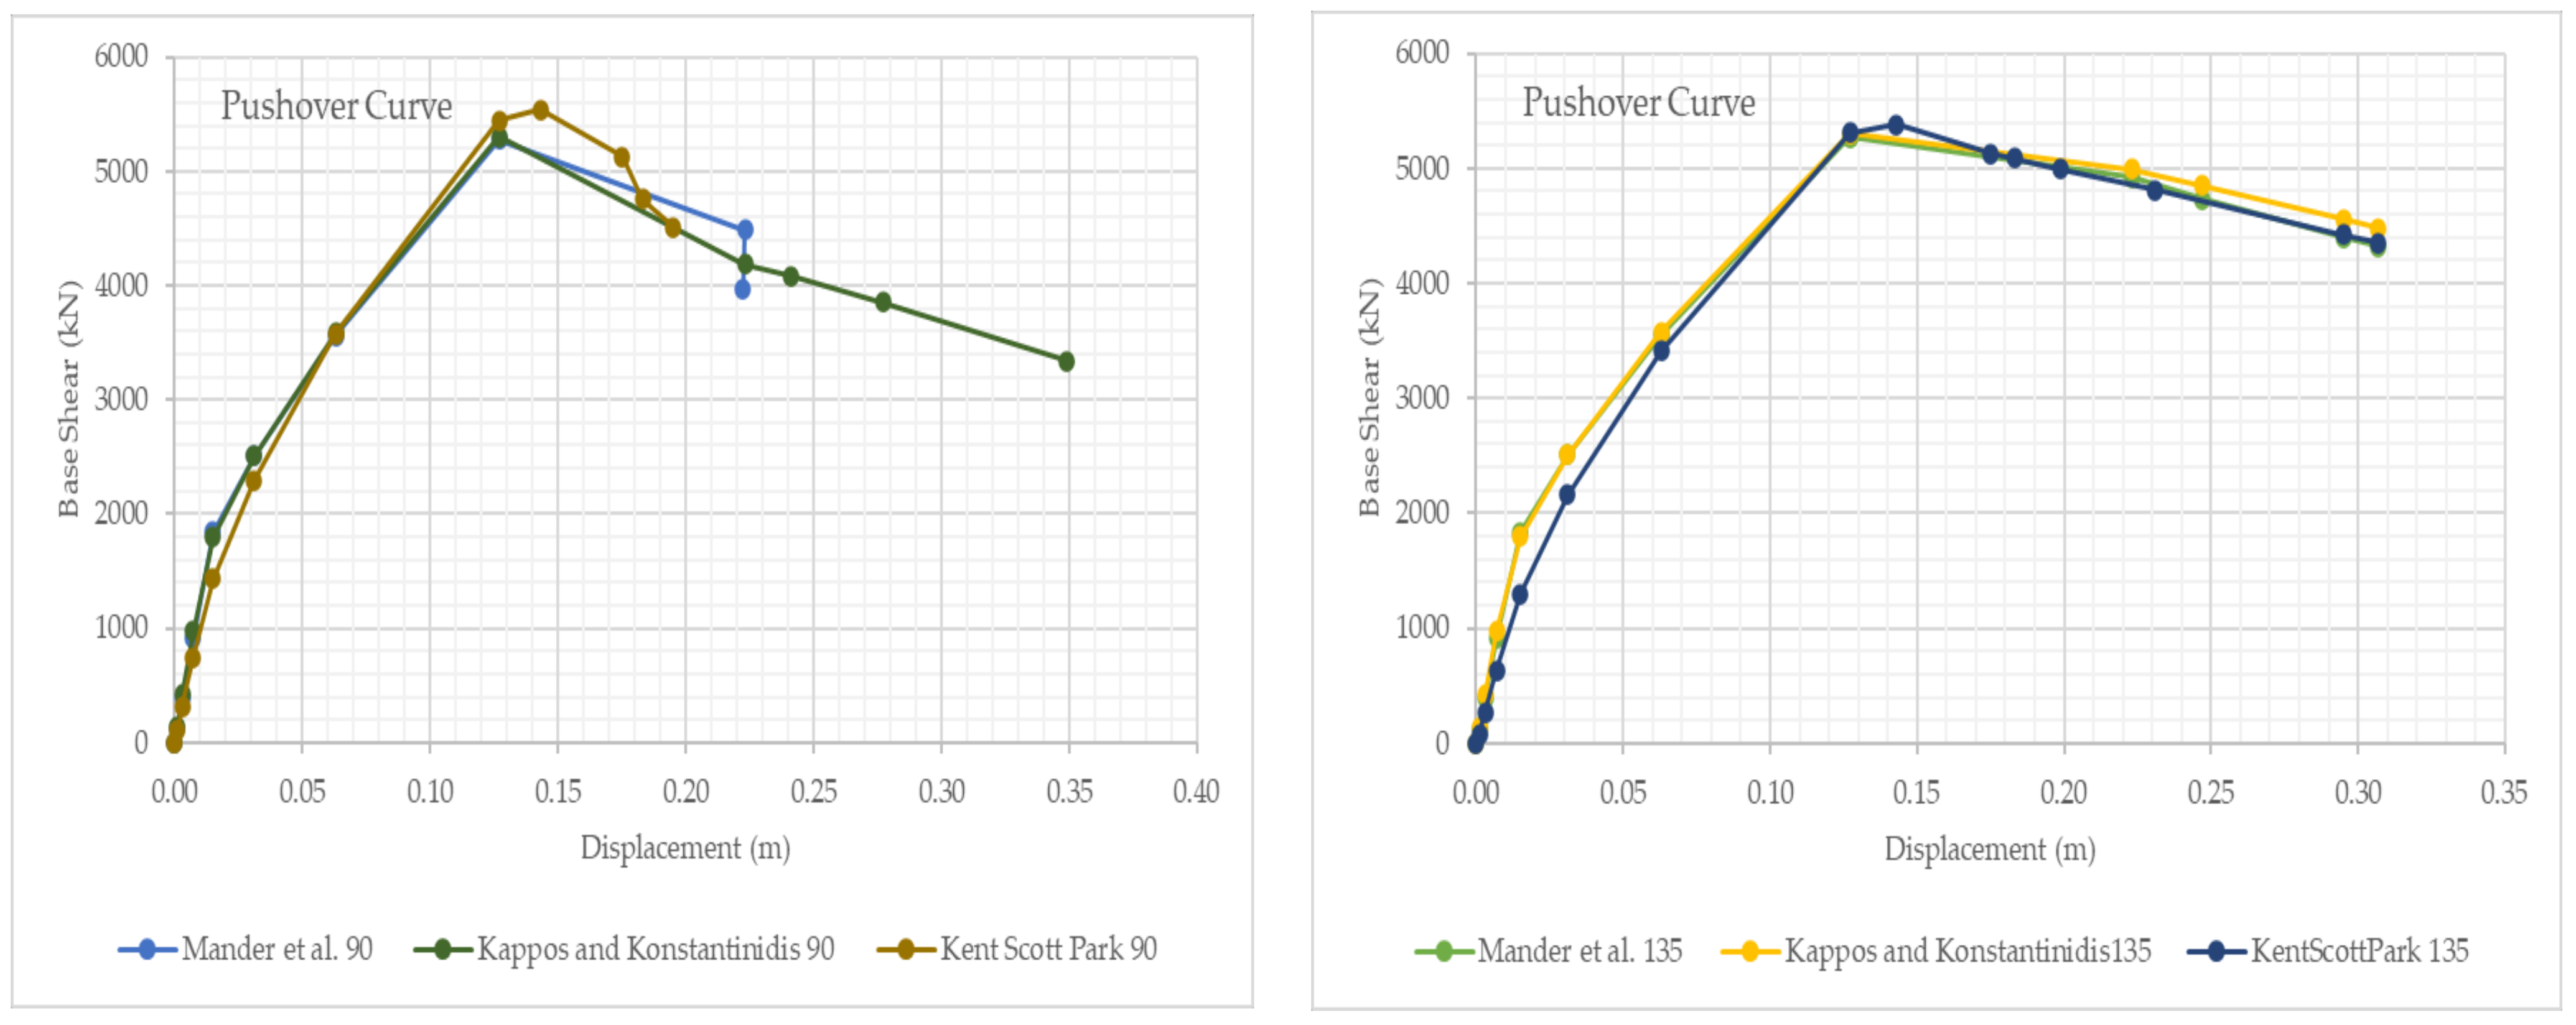
Pushover Analysis of the Modeled Building and Results

The pushover analyses in the X-direction are presented in Figure 12 according to the concrete models for the C10 concrete class with the Menegetto–Pinto steel model. Based on these analyses, graphs showing the initial damage status for 90° (straight) and 135° (hooked) stirrups are illustrated in Figure 13, Figure 14 and Figure 15 for the Kent–Scott–Park, Mander et al., and Kappos–Konstantinidis concrete models, respectively. The 3D view of the multistoried building under seismic loading represents concrete crushing, depicted in green.
During the pushover analysis of the model building, it was observed that there were differences in the top displacements and base shear peak values between the models for both cases. However, the structural elements of the hooked (135°) stirrup case exhibited better performance in both base shear and displacement capacity as compared to the straight (90°) stirrup case. Furthermore, the initial damage zones in the 3D view of the multistoried building, as illustrated in Figure 13, Figure 14 and Figure 15, showed that the concrete crush began at load factors (LF) of 4.4727, 4.7476, and 3.4156 for straight stirrups (90°) and the hooked (135°) case experienced concrete crush starting at load factors of 4.7347, 4.8998, and 4.6383 of Kent–Scott–Park, Mander et al., and Kappos–Konstantinidis, respectively.
The pushover analyses in the X-direction are presented in Figure 16 according to the concrete models for the C16 concrete class with the Menegetto–Pinto steel model. Based on these analyses, graphs showing the initial damage status for 90° (straight) and 135° (hooked) stirrups are illustrated in Figure 17, Figure 18 and Figure 19 for the Kent–Scott–Park, Mander et al., and Kappos–Konstantinidis concrete models, respectively. The 3D view of the multistoried building under seismic loading represents concrete crushing, depicted in green.
During the pushover analysis of the model building, it was observed that there were differences in the top displacements and base shear peak values between the models for both cases. However, the structural elements of the hooked (135°) stirrup case exhibited better performance in both base shear and displacement capacity as compared to the straight (90°) stirrup case. Furthermore, the initial damage zones in the 3D view of the multistoried building, as illustrated in Figure 17, Figure 18 and Figure 19, showed that the concrete crush began at load factors (LF) of 5.3244, 5.6951, and 4.1404 for straight stirrups (90°) of Kent–Scott–Park, Mander et al., and Kappos–Konstantinidis, respectively. On the other hand, it demonstrated that the hooked (135°) case experienced concrete crush starting at load factors of 5.4109, 5.6245, and 5.6497 for Kent–Scott–Park, Mander et al., and Kappos–Konstantinidis, respectively.
The pushover analyses in the X-direction are presented in Figure 20 according to the concrete models for the C20 concrete class with the Menegetto–Pinto steel model. Based on these analyses, graphs showing the initial damage status for 90° (straight) and 135° (hooked) stirrups are illustrated in Figure 21, Figure 22 and Figure 23 for the Kent–Scott–Park, Mander et al., and Kappos–Konstantinidis concrete models, respectively. The 3D view of the multistoried building under seismic loading represents concrete crushing, depicted in green.
During the pushover analysis of the model building, it was observed that there were differences in the top displacements and base shear peak values between the models for both cases. However, the structural elements of the hooked (135°) stirrup case exhibited better performance in both base shear and displacement capacity as compared to the straight (90°) stirrup case. Furthermore, the initial damage zones in the 3D view of the multistoried building, as illustrated in Figure 21, Figure 22 and Figure 23, showed that the concrete crush began at load factors (LF) of 5.0944, 6.067, and 4.5997 for straight stirrups (90°) of Kent–Scott–Park, Mander et al., and Kappos–Konstantinidis, respectively. On the other hand, it demonstrated that the hooked (135°) case experienced concrete crush starting at load factors of 5.4478, 6.21, and 5.9781 for Kent–Scott–Park, Mander et al., and Kappos–Konstantinidis, respectively.
The pushover analyses in the X-direction are presented in Figure 24 according to the concrete models for the C25 concrete class with the Menegetto–Pinto steel model. Based on these analyses, graphs showing the initial damage status for 90° (straight) and 135° (hooked) stirrups are illustrated in Figure 25, Figure 26 and Figure 27 for the Kent–Scott–Park, Mander et al., and Kappos–Konstantinidis concrete models, respectively. The 3D view of the multistoried building under seismic loading represents concrete crushing, depicted in green.
During the pushover analysis of the model building, it was observed that there were differences in the top displacements and base shear peak values between the models for both cases. However, the structural elements of the hooked (135°) stirrup case exhibited better performance in both base shear and displacement capacity as compared to the straight (90°) stirrup case. Furthermore, the initial damage zones in the 3D view of the multistoried building, as illustrated in Figure 25, Figure 26 and Figure 27, showed that the concrete crush began at load factors (LF) of 6.1932, 6.5467, and 5.2844 for straight stirrups (90°) of Kent–Scott–Park, Mander et al., and Kappos–Konstantinidis, respectively. On the other hand, it demonstrated that the hooked (135°) case experienced concrete crush starting at load factors of 6.3438, 6.6342, and 6.4215 for Kent–Scott–Park, Mander et al., and Kappos–Konstantinidis, respectively.
The pushover analyses in the X-direction are presented in Figure 28 according to the concrete models for the C50 concrete class with the Menegetto–Pinto steel model. Based on these analyses, graphs showing the initial damage status for 90° (straight) and 135° (hooked) stirrups are illustrated in Figure 29, Figure 30 and Figure 31 for the Kent–Scott–Park, Mander et al., and Kappos–Konstantinidis concrete models, respectively. The 3D view of the multistoried building under seismic loading represents concrete crushing, depicted in green.
During the pushover analysis of the model building, it was observed that there were differences in the top displacements and base shear peak values between the models for both cases. However, the structural elements of the hooked (135°) stirrup case exhibited better performance in both base shear and displacement capacity as compared to the straight (90°) stirrup case. Furthermore, the initial damage zones in the 3D view of the multistoried building, as illustrated in Figure 29, Figure 30 and Figure 31, showed that the concrete crush began at load factors (LF) of 6.9757, 7.1151, and 6.8999 for straight stirrups (90°) of Kent–Scott–Park, Mander et al., and Kappos–Konstantinidis, respectively. On the other hand, it demonstrated that the hooked (135°) case experienced concrete crush starting at load factors of 6.9841, 7.2813, and 7.0672 for Kent–Scott–Park, Mander et al., and Kappos–Konstantinidis, respectively.
These analyses were also repeated in the Y-direction, since the sample building is not symmetrical. The pushover analyses in the Y-direction are presented in Figure 32 according to the concrete models for the C10 concrete class with the Menegetto–Pinto steel model. Based on these analyses, graphs showing the initial damage status for 90° (straight) and 135° (hooked) stirrups are illustrated in Figure 33, Figure 34 and Figure 35 for the Kent–Scott–Park, Mander et al., and Kappos–Konstantinidis concrete models, respectively. The 3D view of the multistoried building under seismic loading represents concrete crushing, depicted in green.
During the pushover analysis of the model building, it was observed that there were differences in the top displacements and base shear peak values between the models for both cases. However, the structural elements of the hooked (135°) stirrup case exhibited better performance in both base shear and displacement capacity as compared to the straight (90°) stirrup case. Furthermore, the initial damage zones in the 3D view of the multistoried building, as illustrated in Figure 33, Figure 34 and Figure 35, showed that the concrete crush began at load factors (LF) of 3.3656, 3.1594, and 2.5392 for straight stirrups (90°) of Kent–Scott–Park, Mander et al., and Kappos–Konstantinidis, respectively. On the other hand, it demonstrated that the hooked (135°) case experienced concrete crush starting at load factors of 4.1138, 3.6938, and 3.6938 for Kent–Scott–Park, Mander et al., and Kappos–Konstantinidis, respectively.
The pushover analyses in the Y-direction are presented in Figure 36 according to the concrete models for the C16 concrete class with the Menegetto–Pinto steel model. Based on these analyses, graphs showing the initial damage status for 90° (straight) and 135° (hooked) stirrups are illustrated in Figure 37, Figure 38 and Figure 39 for the Kent–Scott–Park, Mander et al., and Kappos–Konstantinidis concrete models, respectively. The 3D view of the multistoried building under seismic loading represents concrete crushing, depicted in green.
During the pushover analysis of the model building, it was observed that there were differences in the top displacements and base shear peak values between the models for both cases. However, the structural elements of the hooked (135°) stirrup case exhibited better performance in both base shear and displacement capacity as compared to the straight (90°) stirrup case. Furthermore, the initial damage zones in the 3D view of the multistoried building, as illustrated in Figure 37, Figure 38 and Figure 39, showed that the concrete crush began at load factors (LF) of 4.037, 4.5053, and 3.2018 for straight stirrups (90°) of Kent–Scott–Park, Mander et al., and Kappos–Konstantinidis, respectively. On the other hand, the figures demonstrated that the hooked (135°) case experienced concrete crush starting at load factors of 4.4135, 4.6645, and 4.4671 for Kent–Scott–Park, Mander et al., and Kappos–Konstantinidis, respectively.
The pushover analyses in the Y-direction are presented in Figure 40 according to the concrete models for the C20 concrete class with the Menegetto–Pinto steel model. Based on these analyses, graphs showing the initial damage status for 90° (straight) and 135° (hooked) stirrups are illustrated in Figure 41, Figure 42 and Figure 43 for the Kent–Scott–Park, Mander et al., and Kappos–Konstantinidis concrete models, respectively. The 3D view of the multistoried building under seismic loading represents concrete crushing, depicted in green.
During the pushover analysis of the model building, it was observed that there were differences in the top displacements and base shear peak values between the models for both cases. However, the structural elements of the hooked (135°) stirrup case exhibited better performance in both base shear and displacement capacity as compared to the straight (90°) stirrup case. Furthermore, the initial damage zones in the 3D view of the multistoried building, as illustrated in Figure 41, Figure 42 and Figure 43, showed that the concrete crush began at load factors (LF) of 4.0301, 4.57954, and 3.7479 for straight stirrups (90°) of Kent–Scott–Park, Mander et al., and Kappos–Konstantinidis, respectively. On the other hand, it demonstrated that the hooked (135°) case experienced concrete crush starting at load factors of 5.5364, 4.9073, and 4.8492 for Kent–Scott–Park, Mander et al., and Kappos–Konstantinidis, respectively.
The pushover analyses in the Y-direction are presented in Figure 44 according to the concrete models for the C25 concrete class with the Menegetto–Pinto steel model. Based on these analyses, graphs showing the initial damage status for 90° (straight) and 135° (hooked) stirrups are illustrated in Figure 45, Figure 46 and Figure 47 for the Kent–Scott–Park, Mander et al., and Kappos–Konstantinidis concrete models, respectively. The 3D view of the multistoried building under seismic loading represents concrete crushing, depicted in green.
During the pushover analysis of the model building, it was observed that there were differences in the top displacements and base shear peak values between the models for both cases. However, the structural elements of the hooked (135°) stirrup case exhibited better performance in both base shear and displacement capacity as compared to the straight (90°) stirrup case. Furthermore, the initial damage zones in the 3D view of the multistoried building, as illustrated in Figure 45, Figure 46 and Figure 47, showed that the concrete crush began at load factors (LF) of 4.7881, 5.1352, and 4.3378 for straight stirrups (90°) of Kent–Scott–Park, Mander et al., and Kappos–Konstantinidis, respectively. On the other hand, it demonstrated that the hooked (135°) case experienced concrete crush starting at load factors of 4.8227, 5.17, and 5.0707 for Kent–Scott–Park, Mander et al., and Kappos–Konstantinidis, respectively.
The pushover analyses in the Y-direction are presented in Figure 48 according to the concrete models for the C50 concrete class with the Menegetto–Pinto steel model. Based on these analyses, graphs showing the initial damage status for 90° (straight) and 135° (hooked) stirrups are illustrated in Figure 49, Figure 50 and Figure 51 for the Kent–Scott–Park, Mander et al., and Kappos–Konstantinidis concrete models, respectively. The 3D view of the multistoried building under seismic loading represents concrete crushing, depicted in green.
During the pushover analysis of the model building, it was observed that there were differences in the top displacements and base shear peak values between the models for both cases. However, the structural elements of the hooked (135°) stirrup case exhibited better performance in both base shear and displacement capacity as compared to the straight (90°) stirrup case. Furthermore, the initial damage zones in the 3D view of the multistoried building, as illustrated in Figure 49, Figure 50 and Figure 51, showed that the concrete crush began at load factors (LF) of 5.3634, 5.4869, and 5.2569 for straight stirrups (90°) of Kent–Scott–Park, Mander et al., and Kappos–Konstantinidis, respectively. On the other hand, it demonstrated that the hooked (135°) case experienced concrete crush starting at load factors of 5.3948, 5.4993, and 5.2843 for Kent–Scott–Park, Mander et al., and Kappos–Konstantinidis, respectively.
Within the scope of the study, the results of the 54 analyses, performed using different material models, various stirrup arrangements, and different concrete classes, were evaluated. As a result of these analyses, the initial damage conditions of the structural models were determined. Only concrete crushing was taken into consideration for the initial damage condition, and the load factor values related to concrete crushing are presented in detail in Table 2.
According to the parameter analysis, concrete crush (initial damage) occurs at a significantly lower load factor with a 90-degree stirrup configuration compared to a 135-degree configuration. Concrete crush can be considered as premature failure of an element. It is noted that the tendency of premature failure decreases as concrete grade increases in every case. This can be interpreted as the confining effect of the stirrups decreases as the concrete class increases. Table 3 demonstrates the differences between these two configurations as percentages.
The effect of stirrup configuration on load factor levels is decreasing as concrete quality increases, as shown in Table 3. The Kappos–Konstantinidis concrete model is clearly more sensitive to the stirrup configuration in both the X- and Y-directions than other concrete models. It can be observed that the 135-degree stirrup configuration shows better performance than the 90-degree stirrup configuration in all cases except one case. The concrete grade C16 and concrete model Mander et al. combination shows that the 90-degree stirrups configuration is better than the 135-degree configuration. Figure 15 explains the reason, as the number of elements that were damaged occurred are just five in 135-degree configuration, while almost whole ground floor elements were damaged at quite similar load factor levels.
Based on the data obtained from the study, the effect of stirrup angle on the load factor for the Kent–Scott–Park model in case of initial damage shows that 135-degree stirrup increases by 10.81% compared to 90-degree stirrup, which is 3.21% in the Mander et al. model and 35.8% in the Kappos–Konstantinidis model in the analysis for the C10 concrete class. When a similar comparison was made for the Y-direction, increases of 22.23%, 25.06%, and 45.47% were observed, respectively. For concrete class C50, the results of the analysis in the X-direction show increases of 0.12% for Kent–Scott–Park, 2.34% for Mander et al., and 2.42% for Kappos–Konstantinidis. In the Y-direction, these rates were recorded as 0.59%, 0.23%, and 0.52%, respectively. As a result, it is seen that the sensitivity of the structures in the Y-direction to the stirrup condition is higher than in the X-direction. It is important to point out that this interesting result could be a significant effect of the difference in the number of elements damaged.
The peak displacement values corresponding to the maximum base shear force show similar results for almost all concrete classes and stirrup configurations. The highest base shear force was observed in the Mander et al. concrete model for the 90-degree stirrup configuration and in the Kent–Scott–Park model for the 135-degree configuration. The lowest base shear force was obtained for the Kappos–Konstantinidis concrete model in each analysis. The Mander et al. model has a peak base shear value 0.82% higher than the Kent–Scott–Park model, while the Kent–Scott–Park model has a peak base shear performance 42.69% higher than the Kappos–Konstantinidis model for the 90-degree stirrup configuration and the C10 concrete class in the X-direction. In the Y-direction, the Mander et al. model has a 14.89% better performance than the Kent–Scott–Park model, while the Kent–Scott–Park model has a 32.43% higher base shear than the Kappos–Konstantinidis model. For the 135-degree configuration, the Kent–Scott–Park model has a 1.14% higher peak base shear than the Mander et al. model but the difference with the Kappos–Konstantinidis model drops to 15.07%. In the Y-direction, the Kent–Scott–Park model has a 3.94% higher base shear than the Mander et al. model but the difference with the Kappos–Konstantinidis model drops to 7.28%. Briefly, in both the X- and Y-directions, the Kappos–Konstantinidis model seems to give the most sensitive response to the stirrup configuration. However, it is noted that the sensitivity of the stirrup configuration decreases with increasing concrete class.

4. Conclusions

In this study, the effect of reinforcement configurations of columns and beams on the element ductility of an eight-story sample structure investigated by the pushover static analysis method for the cases of only hooked or unhooked reinforcement configurations is investigated. In this framework, the C10, C16, C20, C25, and C50 concrete classes were used, which are commonly encountered in developing countries due to workmanship errors. The variable factors in the study are hook angle, concrete strength, and material models used in the numerical analysis. Hook angles: 135° and 90°. The distance between the transverse doublings was the same for all specimens, i.e., 10 cm. The data obtained from the analyses, mathematical inputs such as the compressive strengths of the confined concrete, and the displacements corresponding to the maximum load were compared considering the mathematical models of Mander et al., Kent–Scott–Park, and Kappos–Konstantinidis. The following results were obtained from these comparisons: 135-degree hook angle models showed the highest performance among all three material models. The 135-degree hook angle significantly increased the energy dissipation capacity in all three models for low-strength concretes (C10, C16, and C20). Among the five concrete classes, C10, the most ductile group, presented the highest sensitivity. However, it is also noted that the differences between the models tend to have less variations with increases in concrete strength.
The conclusion of the study is summarized as follows:
  • The purpose of this paper is to examine the way reinforced concrete structures behave during earthquakes with respect to the types of stirrups for various levels of concrete strength and the material models. By evaluating how stirrup configuration impacts the seismic performance of buildings, the study emphasizes the crucial role of accurate reinforcement detailing in creating structures that can withstand earthquakes.
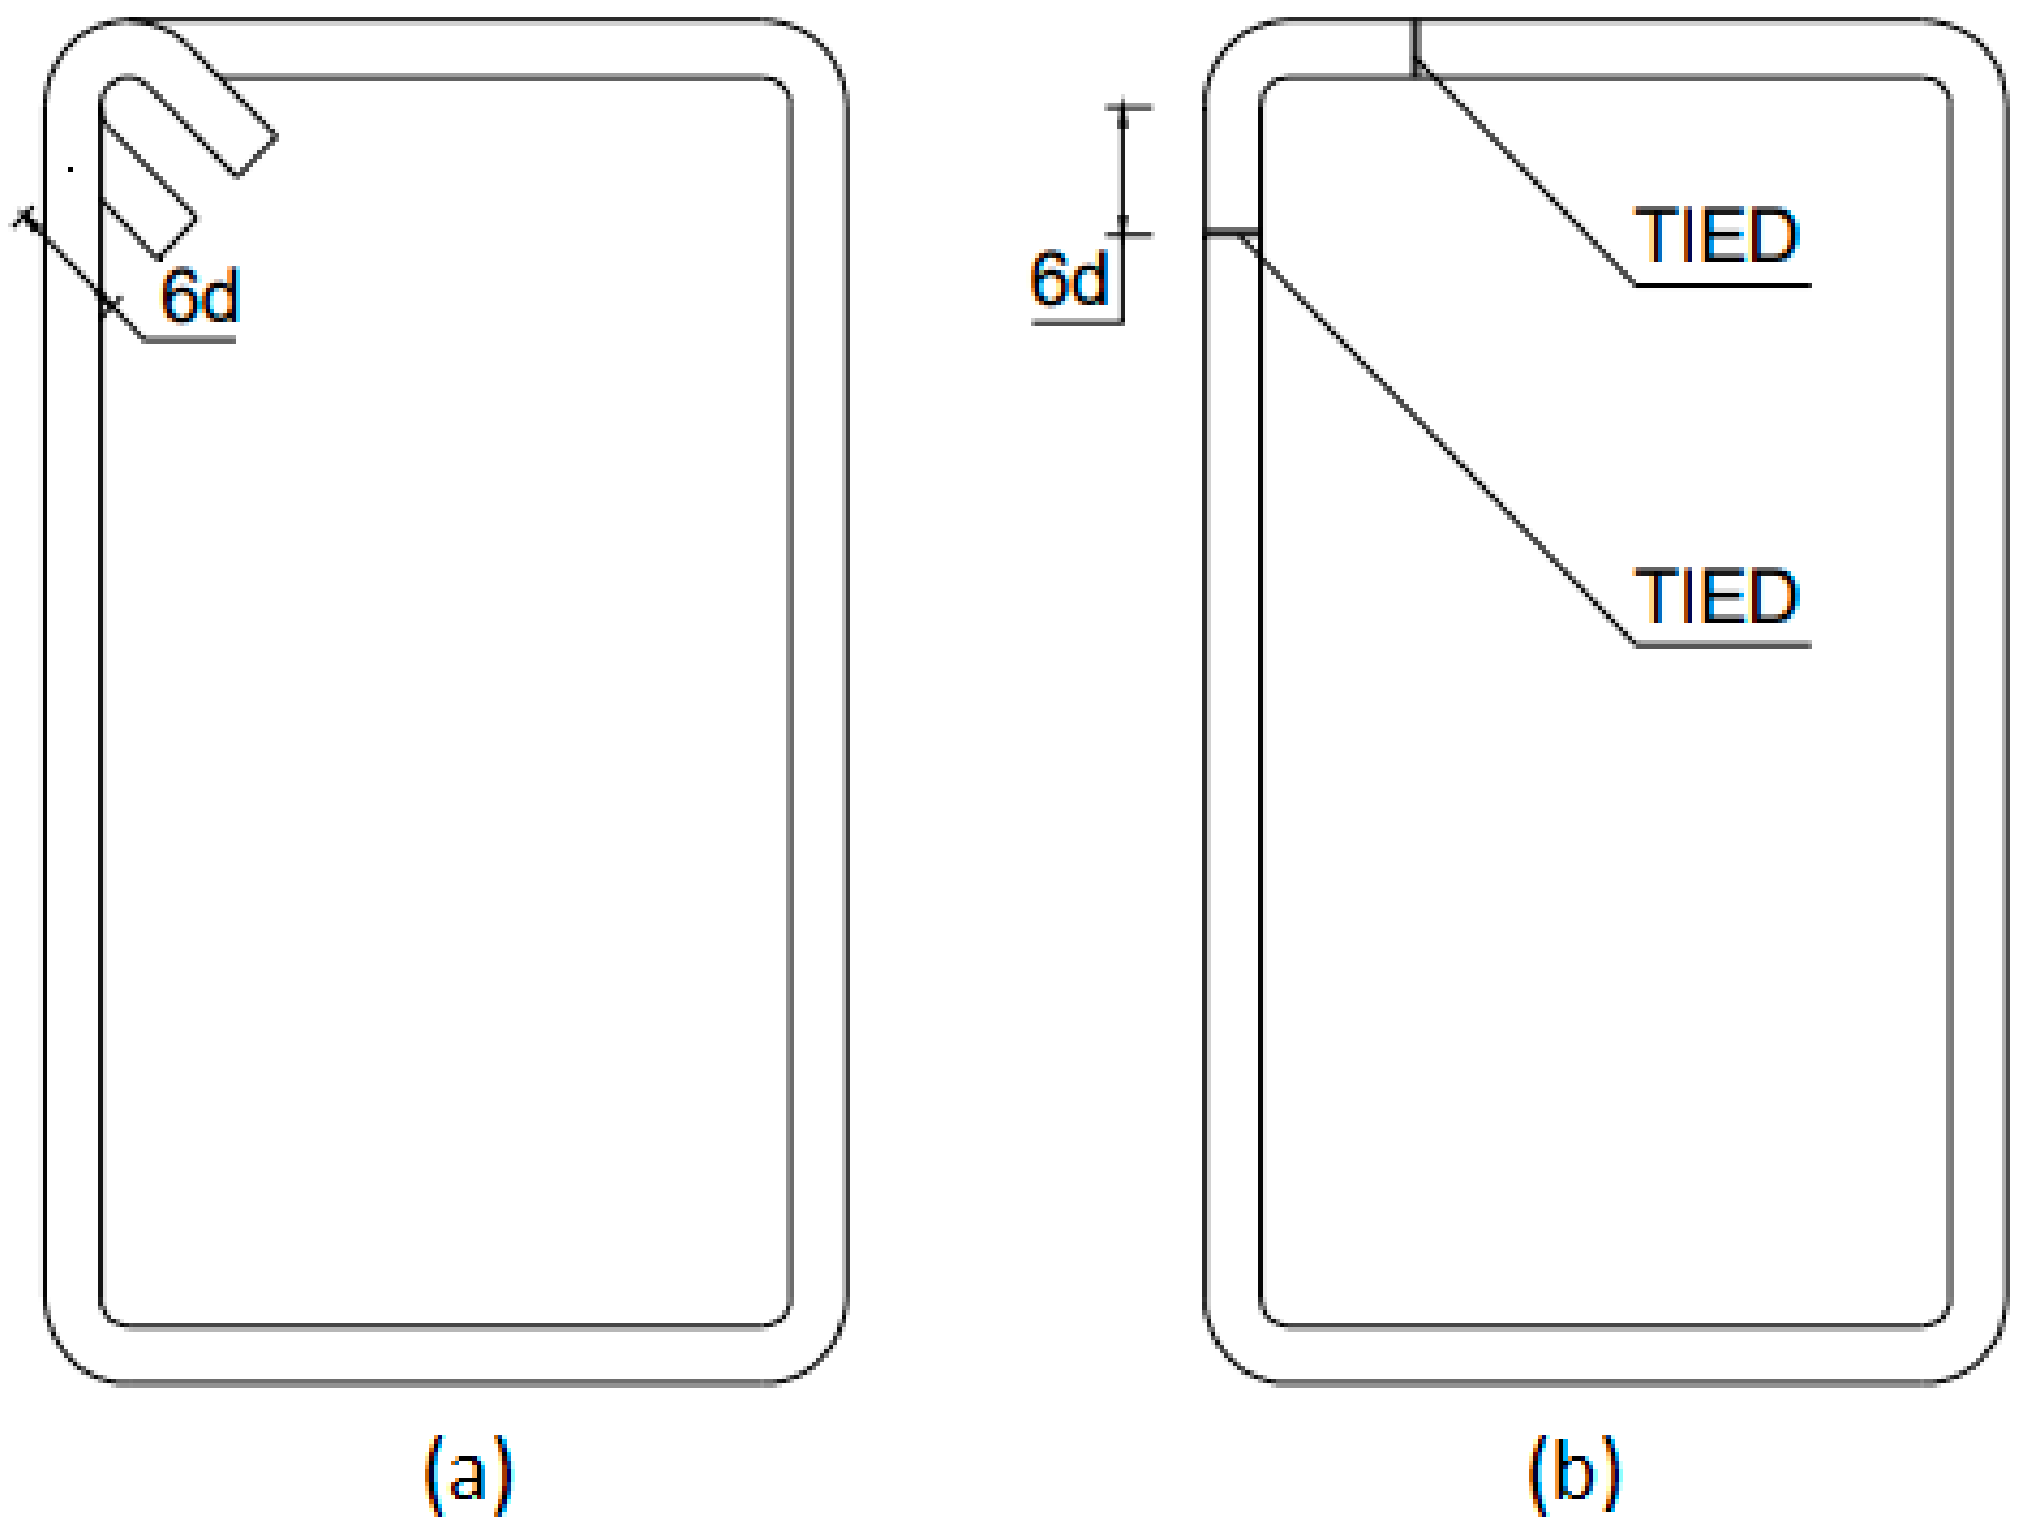
  • The 135-degree stirrup configuration shows significantly better performance than that of the 90-degree configuration in each case.
  • Comparison of initial damage load factors may not always be sufficient to evaluate the seismic performance of a building also the number of damaged elements may be taken into consideration.
  • The effect of hooked systems on ductility and axial load-carrying capacity of low-strength concretes was found to be much higher. As the concrete strength increases, this effect is found to be at much lower levels, since the structure is more prone to brittle behavior.
  • The Kappos–Konstantinidis model was the most sensitive to the stirrup configuration among the concrete material models, while the Mander et al. model, which showed a similar behavior in almost all concrete classes, was the least sensitive model.
  • With just a small difference in construction details, such as the type of hook used, the confinement effect on concrete can have a significant impact on the ductility of the entire system.

Funding

This research received no external funding.

Institutional Review Board Statement

Not applicable.

Informed Consent Statement

Not applicable.

Data Availability Statement

Most data are included in the manuscript.

Conflicts of Interest

The author declares no conflict of interest.

References

  1. Syll, A.S.; Kanakubo, T. Impact of Corrosion on the Bond Strength between Concrete and Rebar: A Systematic Review. Materials 2022, 15, 7016. [Google Scholar] [CrossRef]
  2. Li, P.; Cheng, Q.; Chen, N.; Tian, Y.; Fang, J.; Jiang, H. Experimental Study on Shear Behavior of Non-Stirrup Ultra-High Performance Concrete Beams. Materials 2023, 16, 4177. [Google Scholar] [CrossRef]
  3. Li, S.-S.; Zheng, J.-Y.; Zhang, J.-H.; Li, H.-M.; Guo, G.-Q.; Chen, A.-J.; Xie, W. Experimental Investigation on Shear Capacity of Steel-Fiber-Reinforced High-Strength Concrete Corbels. Materials 2023, 16, 3055. [Google Scholar] [CrossRef]
  4. Zhou, L.; Li, X.; Yan, Q. Performance of Grouting Sleeve-Connected Prefabricated Beams Subjected to Impact Loading. Buildings 2022, 12, 2146. [Google Scholar] [CrossRef]
  5. Jaber, M.H.; Abd Al-Zahra, B.I.; Ibrahim, A.A.; Hassan, R.F.; Al-Salim, N.H.; Hussein, H.H. Exploring the Effect of Varying Fiber Dosages as Stirrup Substitutes in Torsion-Loaded Concrete Beams. Buildings 2023, 13, 1865. [Google Scholar] [CrossRef]
  6. Işık, E. Investigation of the contribution of the reinforcement tie to the seismic behavior of reinforced-concrete columns. Bitlis Eren Univ. J. Sci. Technol. 2022, 12, 21–26. [Google Scholar] [CrossRef]
  7. Cui, F.; Song, L.; Wang, X.; Li, M.; Hu, P.; Deng, S.; Zhang, X.; Li, H. Seismic Fragility Analysis of the Aging RC Columns under the Combined Action of Freeze–Thaw Cycles and Chloride-Induced Corrosion. Buildings 2022, 12, 2223. [Google Scholar] [CrossRef]
  8. Bayat, H.; Ubysz, A.; Maj, M.; Chalecki, M.; Wójt, J.; Tamrazyan, A. Experimental Research of Ratio between Residual and Elastic Strains εres/εE in High-Strength Concrete Beams Subjected to Bending. Materials 2021, 14, 6007. [Google Scholar] [CrossRef] [PubMed]
  9. Mei, Z.; Wu, B.; Bursi, O.S.; Xu, G.; Wang, Z.; Wang, T.; Ning, X.; Liu, Y. Hybrid simulation with online model updating: Application to a reinforced concrete bridge endowed with tall piers. Mech. Syst. Signal Process. 2019, 123, 533–553. [Google Scholar] [CrossRef]
  10. Rodrigues, H.F.P. Biaxial Seismic Behaviour of Reinforced Concrete Columns. Ph.D. Thesis, Aveiro University Civil Engineering Department, Aveiro, Portugal, 2012. [Google Scholar]
  11. Tang, Z.; He, Z.; Chen, Z.; Chen, L.; Xue, H.; Zhuge, H. Experimental and Numerical Study on Ultimate Shear Load Carrying Capacity of Corroded RC Beams. Adv. Civ. Eng. 2021, 2021, 4848483. [Google Scholar] [CrossRef]
  12. Law, D.W.; Tang, D.; Molyneaux, T.K.C.; Gravina, R. Impact of crack width on bond: Confined and unconfined rebar. Mater. Struct. 2011, 44, 1287–1296. [Google Scholar] [CrossRef]
  13. Pham, T.M.; Hao, H. Impact Behavior of FRP-Strengthened RC Beams without Stirrups. J. Compos. Constr. 2016, 20, 04016011. [Google Scholar] [CrossRef]
  14. Aksoylu, C.; Özkılıç, Y.O.; Hadzima-Nyarko, M.; Isık, E.; Arslan, M.H. Investigation on Improvement in Shear Performance of Reinforced-Concrete Beams Produced with Recycled Steel Wires from Waste Tires. Sustainability 2022, 14, 13360. [Google Scholar] [CrossRef]
  15. Karahan, Ş.; Büyüksaraç, A.; Işık, E. The Relationship Between Concrete Strengths Obtained by Destructive and Non-destructive Methods. Iran. J. Sci. Technol. Trans. Civ. Eng. 2020, 44, 91–105. [Google Scholar] [CrossRef]
  16. SNI 2847:2013; Structural Concrete Arrangements for Buildings. Indonesian National Standards: Jakarta, Indonesia, 2013.
  17. Feng, Q.; Wei, P.; Zhao, K.; Xu, R. Experimental investigation of stirrup confinement effects on bond-slip responses for corner and middle bars. Constr. Build. Mater. 2022, 314, 125629. [Google Scholar] [CrossRef]
  18. Işık, E.; Özdemir, M.; Karasin, I.B.; Karasin, A. Comparison of Material Models Used in Reinforced Concrete Structures. Bitlis Eren Üniversitesi Fen Bilim. Derg. 2019, 8, 968–984. [Google Scholar] [CrossRef]
  19. Rosso, M.M.; Asso, R.; Aloisio, A.; Di Benedetto, M.; Cucuzza, R.; Greco, R. Corrosion effects on the capacity and ductility of concrete half-joint bridges. Constr. Build. Mater. 2022, 360, 129555. [Google Scholar] [CrossRef]
  20. Cucuzza, R.; Aloisio, A.; Accornero, F.; Marinelli, A.; Bassoli, E.; Marano, G.C. Size-scale effects and modelling issues of fibre-reinforced concrete beams. Constr. Build. Mater. 2023, 392, 131727. [Google Scholar] [CrossRef]
  21. Saribas, I.; Ispir, M.; Ilki, A. Effects of Sub-Standard Detailing of Transverse Reinforcement on the Behavior of Square RC Columns. In Proceedings of the World Congress on Advances in Structural Engineering and Mechanics, Jeju, Republic of Korea, 8–12 September 2013. [Google Scholar]
  22. Güley, E.E. Effects of Details of Transverse Reinforcement on Ductility of Lightly Confined Substandard Square and Rectangular Columns. Master’s Thesis, İstanbul Technical University, İstanbul, Turkey, 2014. [Google Scholar]
  23. Turmanidze, Z. The Effects of Tie Hook Angle on Structural Behavior of Reinforced Concrete Columns. Master’s Thesis, Karadeniz Technical University, Trabzon, Turkey, 2017. [Google Scholar]
  24. Montuori, R.; Piluso, V.; Tisi, A. Ultimate behavior of FRP wrapped sections under axial force and bending: Influence of stress-strain confinement model. Compos. Part B Eng. 2013, 54, 85–96. [Google Scholar] [CrossRef]
  25. Fakharifar, M.; Dalvand, A.; Sharbatdar, M.K.; Chen, G.; Sneed, L. Innovative hybrid reinforcement constituting conventional longitudinal steel and FRP stirrups for improved seismic strength and ductility of RC structures. Front. Struct. Civ. Eng 2016, 10, 44–62. [Google Scholar] [CrossRef]
  26. Djafar-Henni, I.; Kassoul, A. Stress–strain model of confined concrete with Aramid FRP wraps. Constr. Build. Mater. 2018, 186, 1016–1030. [Google Scholar] [CrossRef]
  27. Günaslan, S.E.; Karaşin, A.; Öncü, M.E. Properties of FRP materials for strengthening. Int. J. Innov. Sci. Eng. Technol. 2014, 1, 656–660. [Google Scholar]
  28. Montuori, R.; Piluso, V.; Tisi, A. Comparative analysis and critical issues of the main constitutive laws for concrete elements confined with FRP. Compos. Part B Eng. 2012, 43, 3219–3230. [Google Scholar] [CrossRef]
  29. Ding, Y.; Zhou, Z.; Tian, H.; Peng, Z. Compressive behavior of concrete-filled ultra-high performance concrete tube with FRP stirrups. Structures 2022, 46, 611–624. [Google Scholar] [CrossRef]
  30. Ateş, A.O. Improvement of Seismic Performance of Reinforced Concrete Columns Using Glass Fiber Reinforced Sprayed Mortar with/without Textile Reinforcement. Ph.D. Thesis, İstanbul Technical University, İstanbul, Turkey, 2022. [Google Scholar]
  31. Considere, A. Experimental Researches on Reinforced Concrete; Moisseiff, L.S., Translator; McGraw Publishing Co.: New York, NY, USA, 1903; p. 188. [Google Scholar]
  32. Richart, F.E.; Brandtzaeg, A.; Brown, R.L. A Study of the Failure of Concrete under Combined Compressive Stresses; University of Illinois at Urbana Champaign, College of Engineering, Engineering Experiment Station: Bozeman, MT, USA, 1928. [Google Scholar]
  33. Burdette, E.G.; Hilsdorf, H.K. Behavior of laterally reinforced concrete columns. J. Struct. Div. 1971, 97, 587–602. [Google Scholar] [CrossRef]
  34. Kent, D.C.; Park, R. Flexural members with confined concrete. J. Struct. Div. 1971, 97, 1969–1990. [Google Scholar] [CrossRef]
  35. Scott, B.D.; Park, R.; Priestley, M.J.N. Stress–strain behavior of concrete confined by overlapping hoops at low and high strain rates. ACI J. 1982, 79, 13–27. [Google Scholar] [CrossRef]
  36. Mander, J.B.; Priestley, M.N.J.; Park, R. Observed stress strain behavior of confined concrete. J. Struct. Eng. 1988, 114, 1827–1849. [Google Scholar] [CrossRef]
  37. Mander, J.B.; Priestley, M.N.J.; Park, R. Theoretical stress-strain model for confined concrete. J. Struct. Eng. 1988, 114, 1804–1825. [Google Scholar] [CrossRef]
  38. Saatcioglu, M.; Razvi, S.R. Strength and ductility of confined concrete. J. Struct. Eng. 1992, 118, 1590–1607. [Google Scholar] [CrossRef]
  39. İlki, A.; Kumbasar, N.; Koc, V. Low strength concrete members externally confined with FRP sheets. Struct. Eng. Mech. 2004, 18, 167–194. [Google Scholar] [CrossRef]
  40. Binici, B. An analytical model for stress–strain behavior of confined concrete. Eng. Struct. 2005, 27, 1040–1051. [Google Scholar] [CrossRef]
  41. Eid, R.; Dancygier, A.N. Confinement effectiveness in circular concrete columns. Eng. Struct. 2006, 28, 1885–1896. [Google Scholar] [CrossRef]
  42. Konstantinidis, D.; Kappos, A.; Izzuddin, B.A. Analytical Stress–Strain Model for High-Strength Concrete Members under cyclic loading. J. Struct. Eng. 2007, 133, 484–494. [Google Scholar] [CrossRef]
  43. Kappos, A.J.; Konstantinidis, D. Statistical analysis of confined High Strength Concrete. Mater. Struct. 1999, 32, 734–748. [Google Scholar] [CrossRef]
  44. Seismosoft, SeismoStruct—A Computer Program for Static and Dynamic Nonlinear Analysis of Framed Structures. Available online: http://www.seismosoft.com (accessed on 13 August 2023).
  45. Montuori, R.; Piluso, V. Analysis and modelling of CFT members: Moment curvature analysis. Thin-Walled Struct. 2015, 86, 157–166. [Google Scholar] [CrossRef]
  46. Karasin, I.B. Comparative Analysis of the 2023 Pazarcık and Elbistan Earthquakes in Diyarbakır. Buildings 2023, 13, 2474. [Google Scholar] [CrossRef]
  47. Oğuz, S. Evaluation of Pushover Analysis Procedures for Frame Structure. Master’s Thesis, Middle East Technical University, Ankara, Turkey, 2005. [Google Scholar]
  48. Krawinkler, H.; Seneviratna, G.D.P.K. Pros and cons of a pushover analysis of seismic performance evaluation. Eng. Struct. 1998, 20, 452–464. [Google Scholar] [CrossRef]
  49. Chopra, A.K.; Goel, R.K.A. Modal pushover analysis procedure for estimating seismic demands for buildings. Earthq. Eng. Struct. Dyn. 2002, 31, 561–582. [Google Scholar] [CrossRef]
  50. Karasin, I.B.; Işık, E. Effect of soil conditions on seismic performance of building for different structure behavior coefficients. Dicle Univ. J. Eng. 2017, 8, 661–673. [Google Scholar]
  51. Karasin, I.B.; Işık, E.; Demirci, A.; Aydın, M.C. The effect of site-specific design spectra for geographical location on reinforced-concrete structure performance. Dicle Univ. J. Eng. 2020, 11, 1319–1330. [Google Scholar]
  52. Işık, E.; Karasin, I.B.; Ulu, A.E. Investigation of earthquake behavior of reinforced-concrete buildings built on soil slope. Eur. J. Sci. Technol. 2020, 20, 162–170. [Google Scholar] [CrossRef]
  53. Işık, E.; Harirchian, E.; Bilgin, H.; Jadhav, K. The effect of material strength and discontinuity in RC structures according to different site-specific design spectra. Res. Eng. Struct. Mater 2021, 7, 413–430. [Google Scholar] [CrossRef]
  54. Işık, E.; Karasin, İ.B.; Karasin, A. The effect of different earthquake ground motion levels on the performance of steel structures in settlements with different seismic hazards. Struct. Eng. Mech. 2022, 84, 85–100. [Google Scholar] [CrossRef]
  55. Sullivan, T.J.; Calvi, G.M.; Priestley, M.J.N. Initial stiffness versus secant stiffness in displacement-based design. In Proceedings of the 13th World Conference of Earthquake Engineering (WCEE), Vancouver, BC, Canada, 1–6 August 2004. [Google Scholar]
  56. Menegotto, M.; Pinto, P.E. Method of analysis for cyclically loaded R.C. plane frames including changes in geometry and non-elastic behavior of elements under combined normal force and bending. In Proceedings of the Symposium on the Resistance and Ultimate Deformability of Structures Acted on by Well Defined Repeated Loads, International Association for Bridge and Structural Engineering, Zurich, Switzerland; 1973; pp. 15–22. [Google Scholar]
  57. Nagashima, T.; Sugano, S.; Kimura, H.; Ichikawa, A. Monotonic Axial Compression Test on Ultra-High Strength Concrete Tied Columns. In Proceedings of the 10th World Conference on Earthquake Engineering, No. 5, Rotterdam, The Netherlands; 1992; pp. 2983–2988. [Google Scholar]
  58. Sheikh, S.A.; Uzumeri, S.M. Analytical model for concrete confinement in tied columns. J. Struct. Div. 1982, 108, 2703–2722. [Google Scholar] [CrossRef]
  59. Yassin, M.H.M. Nonlinear Analysis of Prestressed Concrete Structures under Monotonic and Cyclic Loads. Ph.D. Thesis, University of California, Berkeley, CA, USA, 1994. [Google Scholar]
  60. Prota, A.; De Cicco, F.; Cosenza, E. Cyclic behavior of smooth steel reinforcing bars: Experimental analysis and modeling issues. J. Earthq. Eng. 2009, 13, 500–519. [Google Scholar] [CrossRef]
  61. Işik, E.; Özdemir, M. Consistency of concrete material models that used for RC buildings. Sci. Her. Voronezh State Univ. Archit. Civ. Eng. 2017, 36, 92–105. [Google Scholar]
  62. Antoniou, S.; Pinho, R. Seismostruct–Seismic Analysis Program by Seismosoft, Technical Manual and User Manual; University of Pavia: Pavia, Italy, 2003. [Google Scholar]
  63. Yön, B.; Calayır, Y. The soil effect on the seismic behaviour of reinforced concrete buildings. Earthq. Struct. 2015, 8, 133–152. [Google Scholar] [CrossRef]
  64. Yön, B. Seismic vulnerability assessment of RC buildings according to the 2007 and 2018 Turkish seismic codes. Earthq. Struct. 2020, 18, 709–718. [Google Scholar] [CrossRef]
  65. TBEC 2018. Turkey Building Earthquake Code; Disaster and Emergency Management Presidency: Ankara, Turkey, 2018.
  66. Ketiyot, R.; Hansapinyo, C.; Charatpangoon, B. Nonlinear strut-and-tie model with bond-slip effect for analysis of RC beam-column joints under lateral loading. Int. J. Geomate 2018, 15, 81–88. [Google Scholar] [CrossRef]
  67. Gao, X.; Li, N.; Ren, X. Analytic solution for the bond stress-slip relationship between rebar and concrete. Constr. Build. Mater. 2019, 197, 385–397. [Google Scholar] [CrossRef]
  68. Alfarah, B.; Murcia-Delso, J.; López-Almansa, F.; Oller, S. RC structures cyclic behavior simulation with a model integrating plasticity, damage, and bondslip. Earthq. Eng. Struct. Dyn. 2018, 47, 460–478. [Google Scholar] [CrossRef]
  69. Sivaselvan, M.V.; Reinhorn, A.M. Hysteretic Models for Cyclic Behavior of Deteriorating Inelastic Structures; Technical Report; Multidisciplinary Center for Earthquake Engineering Research: Buffalo, NY, USA, 1999. [Google Scholar]
Figure 1. Sample of hooked (a) and unhooked (b) stirrups [1].
Applsci 13 11590 g001
Figure 2. Heavily damaged and collapsed elements due to lack of stirrups and 90° hooked configuration.
Applsci 13 11590 g002
Figure 3. Heavily damaged column elements due to 90° hooked stirrups.
Applsci 13 11590 g003
Figure 4. Heavily damaged column element and bond-slip due to 90° hooked stirrups.
Applsci 13 11590 g004
Figure 5. Flowchart of the static pushover analysis.
Applsci 13 11590 g005
Figure 6. Mander concrete model [36].
Applsci 13 11590 g006
Figure 7. Concrete model according to Konstantinidis et al. [42,43].
Applsci 13 11590 g007
Figure 8. Concrete model according to the Kent–Scott–Park model [34,35].
Applsci 13 11590 g008
Figure 9. Menegotto-Pinto steel model.
Applsci 13 11590 g009
Figure 10. Fiber modeling and cross-section details [63,64].
Applsci 13 11590 g010
Figure 11. Blueprint of the sample building.
Applsci 13 11590 g011
Figure 12. Pushover curves of different concrete models for C10 grade in the X-direction.
Applsci 13 11590 g012
Figure 13. Kent–Scott–Park in the X-direction. (a) 90° (C10, LF: 4.4727), (b) 135° (C10, LF: 4.7347).
Applsci 13 11590 g013
Figure 14. Mander et al. in the X-direction. (a) 90° (C10, LF: 4.7476), (b) 135° (C10, LF: 4.8998).
Applsci 13 11590 g014
Figure 15. Kappos–Konstantinidis in the X-direction. (a) 90° (C10, LF: 3.4156), (b) 135° (C10, LF: 4.6383).
Applsci 13 11590 g015
Figure 16. Pushover curves of different concrete models for C16 grade in the X-direction.
Applsci 13 11590 g016
Figure 17. Kent–Scott–Park in the X-direction. (a) 90° (C16, LF: 5.3244), (b) 135° (C16, LF: 5.4109).
Applsci 13 11590 g017
Figure 18. Mander et al. in the X-direction. (a) 90° (C16, LF: 5.6951), (b) 135° (C16, LF: 5.6245).
Applsci 13 11590 g018
Figure 19. Kappos–Konstantinidis in the X-direction. (a) 90° (C16, LF: 4.1404), (b) 135° (C16, LF: 5.6497).
Applsci 13 11590 g019
Figure 20. Pushover curves of different concrete models for C20 grade in the X-direction.
Applsci 13 11590 g020
Figure 21. Kent–Scott–Park in the X-direction. (a) 90° (C20, LF: 5.0944), (b) 135° (C20, LF: 5.4478).
Applsci 13 11590 g021
Figure 22. Mander et al. in the X-direction. (a) 90° (C20, LF: 6.067), (b) 135° (C20, LF: 6.21).
Applsci 13 11590 g022
Figure 23. Kappos–Konstantinidis in the X-direction. (a) 90° (C20, LF: 4.5997), (b) 135° (C20, LF: 5.9781).
Applsci 13 11590 g023
Figure 24. Pushover curves of different concrete models for C25 grade in the X-direction.
Applsci 13 11590 g024
Figure 25. Kent–Scott–Park in the X-direction. (a) 90° (C25, LF: 6.1932), (b) 135° (C25, LF: 6.3438).
Applsci 13 11590 g025
Figure 26. Mander et al. in the X-direction. (a) 90° (C25, LF: 6.5467), (b) 135° (C25, LF: 6.6342).
Applsci 13 11590 g026
Figure 27. Kappos–Konstantinidis in the X-direction. (a) 90° (C25, LF: 5.2844), (b) 135° (C25, LF: 6.4215).
Applsci 13 11590 g027
Figure 28. Pushover curves of different concrete models for C50 grade in the X-direction.
Applsci 13 11590 g028
Figure 29. Kent–Scott–Park in the X-direction. (a) 90° (C50, LF: 6.9757), (b) 135° (C50, LF: 6.9841).
Applsci 13 11590 g029
Figure 30. Mander et al. in the X-direction. (a) 90° (C50, LF: 7.1151), (b) 135° (C50, LF: 7.2813).
Applsci 13 11590 g030
Figure 31. Kappos–Konstantinidis in the X-direction. (a) 90° (C50, LF: 6.8999), (b) 135° (C50, LF: 7.0672).
Applsci 13 11590 g031
Figure 32. Pushover curves of different concrete models for C10 grade in the Y-direction.
Applsci 13 11590 g032
Figure 33. Kent–Scott–Park in the Y-direction. (a) 90° (C10, LF: 3.3656), (b) 135° (C10, LF: 4.1138).
Applsci 13 11590 g033
Figure 34. Mander et al. in the Y-direction. (a) 90° (C10, LF: 3.1594), (b) 135° (C10, LF: 3.9511).
Applsci 13 11590 g034
Figure 35. Kappos–Konstantinidis in the Y-direction. (a) 90° (C10, LF: 2.5392), (b) 135° (C10, LF: 3.6938).
Applsci 13 11590 g035
Figure 36. Pushover curves of different concrete models for C16 grade in the Y-direction.
Applsci 13 11590 g036
Figure 37. Kent–Scott–Park in the Y-direction. (a) 90° (C16, LF: 4.037), (b) 135° (C16, LF: 4.4135).
Applsci 13 11590 g037
Figure 38. Mander et al. in the Y-direction. (a) 90° (C16, LF: 4.5053), (b) 135° (C16, LF: 4.6645).
Applsci 13 11590 g038
Figure 39. Kappos–Konstantinidis in the Y-direction. (a) 90° (C16, LF: 3.2018), (b) 135° (C16, LF: 4.4671).
Applsci 13 11590 g039
Figure 40. Pushover curves of different concrete models for C20 grade in the Y-direction.
Applsci 13 11590 g040
Figure 41. Kent–Scott–Park in the Y-direction. (a) 90° (C20, LF: 4.0301), (b) 135° (C20, LF: 4.5364).
Applsci 13 11590 g041
Figure 42. Mander et al. in the Y-direction. (a) 90° (C20, LF: 4.7954), (b) 135° (C20, LF: 4.9073).
Applsci 13 11590 g042
Figure 43. Kappos–Konstantinidis in the Y-direction. (a) 90° (C20, LF: 3.7479), (b) 135° (C20, LF: 4.8492).
Applsci 13 11590 g043
Figure 44. Pushover curves of different concrete models for C25 grade in the Y-direction.
Applsci 13 11590 g044
Figure 45. Kent–Scott–Park in the Y-direction. (a) 90° (C25, LF: 4.8781), (b) 135° (C25, LF: 4.8227).
Applsci 13 11590 g045
Figure 46. Mander et al. in the Y-direction. (a) 90° (C25, LF: 5.1352), (b) 135° (C25, LF: 5.17).
Applsci 13 11590 g046
Figure 47. Kappos–Konstantinidis in the Y-direction. (a) 90° (C25, LF: 4.3378), (b) 135° (C25, LF: 5.0707).
Applsci 13 11590 g047
Figure 48. Pushover curves of different concrete models for C50 grade in the Y-direction.
Applsci 13 11590 g048
Figure 49. Kent–Scott–Park in the Y-direction. (a) 90° (C50, LF: 5.3634), (b) 135° (C50, LF: 5.3948).
Applsci 13 11590 g049
Figure 50. Mander et al. in the Y-direction. (a) 90° (C50, LF: 5.4869), (b) 135° (C50, LF: 5.4993).
Applsci 13 11590 g050
Figure 51. Kappos–Konstantinidis in the Y-direction. (a) 90° (C50, LF: 5.2569), (b) 135° (C50, LF: 5.2843).
Applsci 13 11590 g051
Table 1. Specification of the reference sample building.
ParameterValueParameterValue
Concrete gradeC50-C25-C20-C16 and C10Transverse reinforcement (Columns)Φ10/100
Reinforcement gradeS420Transverse reinforcement (beam)Φ10/150
Beams250 × 600 mmSteel material modelMenegotto–Pinto
Height of floor120 mmConstraint typeRigid diaphragm
Height of each story3 mLocal ground typeZC
Cover thickness25 mmIncremental load (only for pushover)10 kN
Columns500 × 400 mmPermanent Load7 kN/m
Longitudinal
Reinforcement (columns)
16Φ16Damping5%
Target-displacement (8-story)0.30 m (only for pushover)Importance classIV
Table 2. First damage load factor values of different concrete models with different concrete grades in the X- and Y-directions.
Concrete Model/DirectionKent–Scott–Park (X)Mander et al. (X)Kappos
and Konstantinidis (X)
Kent–Scott–Park (Y)Mander et al. (Y)Kappos
and Konstantinidis (Y)
Concrete Grade/
Hook Angle (°)
901359013590135901359013590135
C104.27274.73474.74764.89983.41564.63833.36564.11383.15943.95112.53923.6938
C165.32445.41095.69515.62454.14045.64974.0374.41354.50534.66453.20184.4671
C205.09445.44786.0676.214.59975.97814.03014.53644.79544.90733.74794.8492
C256.19326.34386.54676.63425.28446.42154.78814.82275.13525.174.33785.0707
C506.97576.98417.11517.28136.89997.06725.36345.39485.48695.49935.25695.2843
Table 3. Load factor ratios different concrete models with different concrete grades in the X- and Y-directions (135°/90°).
Concrete Model/DirectionKent–Scott–Park (X)Mander et al. (X)Kappos and
Konstantinidis (X)
Kent–Scott–Park (Y)Mander et al. (Y)Kappos and
Konstantinidis (Y)
C1010.81%3.21%35.80%22.23%25.06%45.47%
C161.62%−1.24%36.45%9.33%3.53%39.52%
C206.94%2.36%29.97%12.56%2.33%29.38%
C252.43%1.34%21.52%0.72%0.68%16.90%
C500.12%2.34%2.42%0.59%0.23%0.52%
Disclaimer/Publisher’s Note: The statements, opinions and data contained in all publications are solely those of the individual author(s) and contributor(s) and not of MDPI and/or the editor(s). MDPI and/or the editor(s) disclaim responsibility for any injury to people or property resulting from any ideas, methods, instructions or products referred to in the content.

