1. Introduction
The advancement of navigation technology has created a highly competitive and complex environment for the transportation industry. Companies that adopt new technologies increase their chance to be market leaders by optimizing internal processes. The efficient management of orders, pick-up, and delivery of goods is the key to generating profit and staying competitive in the long term. While the additional cost of the distribution of goods is 70 percent for the food and beverage industry [
1], the continuous growth of the population living in the urban area has increased the volume of goods delivered to customers [
2]. Furthermore, the density of the population in the urban area has generated traffic problems, and urban logistics have experienced significant changes in recent years. Thus, the number of customers ordering online has increased and they are putting pressure on shipping companies because they want fast and cheap delivery. In order not to delay the delivery of goods, manufacturers adhere to the process of distributed manufacturing by moving production sites as close as possible to the location of demand [
3]. Companies that transport small packages minimize the cost by keeping up the routes of the drivers and want to build customer relationships by using the same agents to visit the same customers at about the same time every day [
4], which is why it should come as no surprise that the vehicle routing problem (VRP) is a popular optimization problem when it comes to finding the best possible routes (several types of routing problems have been extended from the VRP). Although there are many route optimization software options available on the market, each has its limitations, and choosing the right one is critical to a company’s long-term success and growth.
The adaptive routing algorithm makes decisions dynamically based on the parameters that are constantly changing, and adaptation to a set of data and new constraints is done in real time to generate the best route. Shaoliang proposes an adaptive quantum genetic algorithm based on binary coding for assigning routes to specific vehicles [
5]. The self-adaptive angular acceleration algorithm is used in order to have a small number of iterations. When the threshold is exceeded, the evolution ends and can determine the optimal solution to the problem. Chen et al. present a new two-level VRP model for electric vehicles based on an adaptive local search algorithm [
6]. By simulating the freight transportation process with real-time traffic conditions, the algorithm satisfies the VRP constraints. Sbai et al. present an adaptive genetic algorithm for minimizing the total transportation cost with a homogeneous fleet of vehicles and determining for a given route the loading arrangement of the items transported on the vehicle loading surface based on the two-dimensional orthogonal function [
7]. Li et al. propose an algorithm using particle swarm optimization for route planning [
8]. The algorithm increases the weight in the initial stage and gradually reduces the weight in the final stage by adaptively adjusting the weight, which is combined with the historical search information.
Vehicle fleet management software is an essential tool for transportation companies looking to optimize their costs, but not all software solutions are suitable because each solution has different limitations. Before the development of the software solution, we conducted a study to determine the necessary characteristics based on the identified constraints, thus defining a set of requirements that are considered most relevant by potential users who are working in the transportation business [
9]. One of the most common constraints is the limited number of stops that can be included in the optimization algorithm, which makes it difficult to manage complex delivery routes. Other solutions are limited by the volume of vehicles that a dispatcher can allocate to a route optimization plan by having difficulty in allocating single or multiple delivery windows. The lack of customized options makes it difficult for companies to meet their unique business needs, and the lack of integration with other systems prevents the optimization process from generating routes in real time.
The iRoute solution is a software platform that offers planning, optimization, and route monitoring services for picking up and distributing packages within logistics fleets regardless of their main field of activity. Our solution offers other criteria in selecting routes in addition to the traditional ones, such as routes with the minimum distance or duration to reach all locations. The main innovation is the implementation of an adaptative algorithm based on historical routes for commercial vehicle fleets. Instead of finding the best route, it tries to adapt the calculated optimized routes with historical data from previously executed routes in such a way that the newly adapted optimized routes fit better to the customer’s business, local conditions, or driving styles of the customer’s employees. We compared our adaptive algorithm with other commercial or open-source solutions and in all cases we obtained promising results, with improvements between 15% and 20%.
This article is organized as follows.
Section 2 details an overview of related work and the background, and
Section 3 presents the project’s implementation and components. Information about the algorithm and functions used is presented in
Section 4, with details about tests and results written in
Section 5. Finally, in
Section 6 we present the conclusions and future work.
2. Background
Designing and developing software for the vehicle routing problem are very difficult tasks. Even though several types of VRPs solve real-world routing problems, our application is not limited to a single software solution. It finds solutions to problems such as capacity vehicle routing problems (CVRPs), vehicle routing problems with time windows (VRPTWs), and pickup and delivery problems with time windows (PDPTWs).
The CVRP is the most common version of the VRP that takes into account vehicle capacity constraints. Each vehicle is identical and has a limited capacity to transport goods that must be delivered to different locations, starting from a central warehouse. The capable vehicle routing problem (CVRP) is a business adaptation of the vehicle routing problem having relevance in the goods distribution process [
10]. The CVRP finds a set of routes having the minimum total cost for vehicles with a limited capacity serving a set of customers [
11]. The CVRP offers an optimal solution when we have a closed route circle, unique customer service by a single vehicle, and the allocated vehicle capacity must not be exceeded [
12]. For a routing problem, the CVRP can optimally serve up to 360 clients through heuristic methods [
13]. Zhao et al. designed a hybrid optimization algorithm for the CVRP that searches in two stages on variable domains, which is superior to evolutionary quantum algorithms due to the simplicity and efficiency of the algorithm [
14]. The CVRP is an NP-hard problem, and there are no efficient algorithms for solving large-sized problems with an acceptable computation time for a quality solution. Most research has focused on designing heuristic and meta-heuristic algorithms to obtain an optimal solution for the CVRP problem, such as adapted ant colony optimization (ACO) algorithms [
15], customized genetic algorithms (GAs) [
16], ant system (AS) [
17], tailored particle swarm optimization (PSO) [
18], adapted artificial bee colony (ABC) [
19] or firefly algorithms (FAs) [
20], and Tabu Search (TS) [
21].
The vehicle routing problem with time windows (VRPTW) is obtained by using time constraints for visiting each node to the classic VRP problem. In the VRPTW problem, vehicles have pre-determined capacities and pre-defined delivery windows and are not allowed to visit a location outside a time window. The standard VRPTW is defined as a complete graph where customers are nodes, but for real-world solutions VRPTW must connect non-straight paths. VRPsolver is a tool that is based on Branch-Cut-and-Price to solve VRPTWs tested under real urban conditions [
22]. All the obtained subproblems are defined as graphs with associated resources based on edges or vertices, and the main formula contains the objective function and the mapping function. An adaptive memetic algorithm for determining the optimal solution of the VRPTW problem was described by Nalepa and Blocho [
23]. The algorithm allows for changing different parameters in an adaptable way, such as the population size, the family size (parents and children), and the selection scheme. The main disadvantage is that adjusting the parameters requires a high computational cost to validate them. Zhong proposed a mathematical model for VRPTWs by adaptively changing the crossover probabilities based on a genetic algorithm. The results proved that the convergence speed can be improved by using the new algorithm [
24]. Göçken et al. proposed a hybrid version of the genetic standard algorithm using constructive heuristic methods to find efficient solutions for VRPTWs minimizing the total distance and waiting time [
25]. Another algorithm for solving the VRPTW solution is the one proposed by Yan et al., which uses the elite ant system [
26]. The initialization strategy defines a set of clients for the first delivery to increase the convergence speed of the algorithm, and the mutation strategy improves the local search capability. Yu et al. proposed a new VRPTW variant, a solution used for the route of delivery vehicles for parcel lockers [
27]. The algorithm includes new constraints, such as how customers are assigned to parcel lockers and how packages are distributed to parcel lockers. Customers can opt for different delivery options; thus, customers can request home delivery, select parcel lockers, and choose a mixed delivery.
The PDPTW is an extension of the VRPTW that, besides the constraint where a customer must be delivered or collected in a specified time frame, involves several customers and suppliers that are geographically located. The vehicle’s capacity must not be exceeded by the quantity transported. Furthermore, another constraint is that a customer must not be visited before his supplier. Kalina and Vokrinek implemented a parallel algorithm based on the negotiation of the agent for the VRPTW and PDPTW problems where private solvers perform the parallel execution of certain solutions that return a sequence of time-improving results [
28]. Chami et al. solve a variant of the PDP with multiple objectives involving various ranking heuristics that allow all locations to be selected according to a predefined or calculated rank [
29]. Nalepa and Blocho proposed a parallel memetic algorithm to minimize total travel costs for PDPTW problems [
30]. Parallel processes communicate asynchronously and periodically to exchange the optimal solutions found so far.
Our approach uses traditional algorithms (such as the VRPTW and the CVRP) as a starting point in identifying the optimized routes. From there, we process the resulting routes and update them in terms of changing path, estimated duration, and distance between any two consecutive locations in such a way that the final adapted optimized route uses the previously executed routes’ knowledge. So, our solution comes on top of the results of standard VRP algorithms, making the resulting routes easier for the drivers to follow. Based on a survey we conducted at the end of our research work on 68 business transport owners, most of them (~72%) confirmed that, for drivers, selecting the known road and taking into account local road conditions offer more comfort and schedule predictability than imposing theoretical shorter routes.
3. Methods—Project Implementation
Our solution combines data acquisition with data processing and is presented in real time, with an integration layer for communicating with external solutions and a presentation layer in both web and mobile technologies.
The novelty of the system is the approach that we have considered by developing an algorithm that will determine the most common path used by historical tracks and adapt the optimization results for real commercial customers that want to have more confidence that their drivers can fulfill the route plan without compromising the customer’s satisfaction.
3.1. Solution Data Users
The iRoute solution has four main actors:
- -
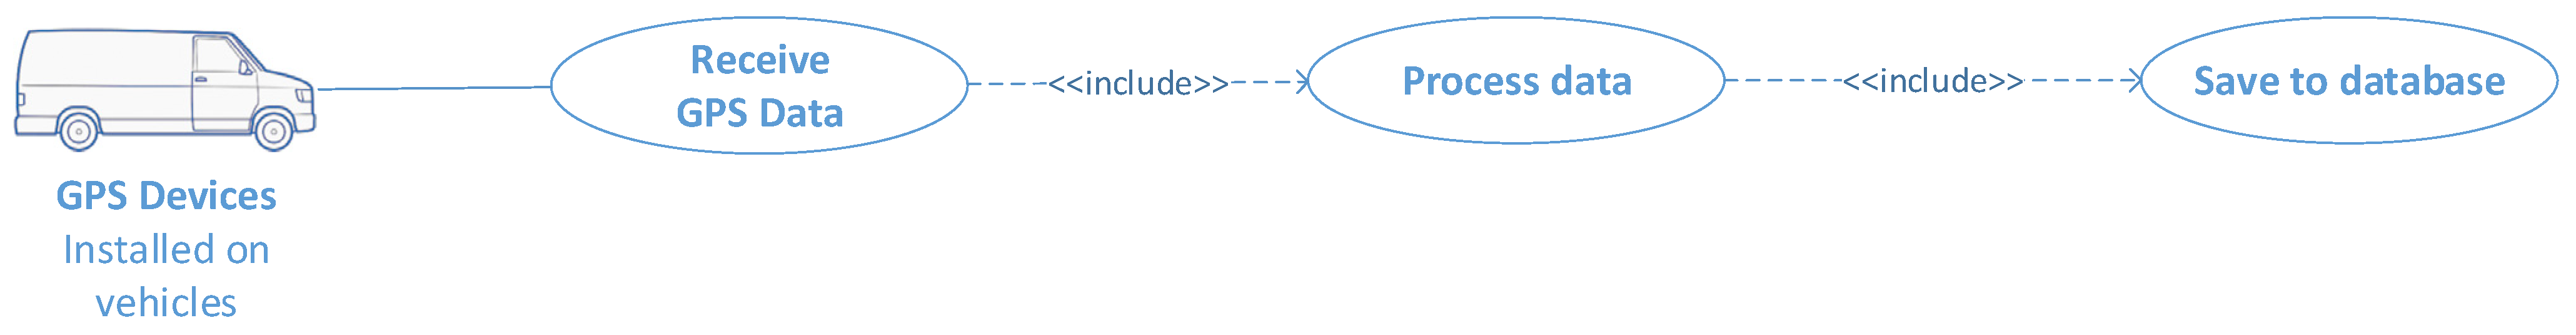
The GPS device: The telematic device and the sensors installed on the vehicle will send data to the solution’s data acquisition endpoint that will process and present the data in user-friendly maps and reports. This information is being used for validating the execution of the plan and helping plans adjust to the real-field execution (
Figure 1).
- -
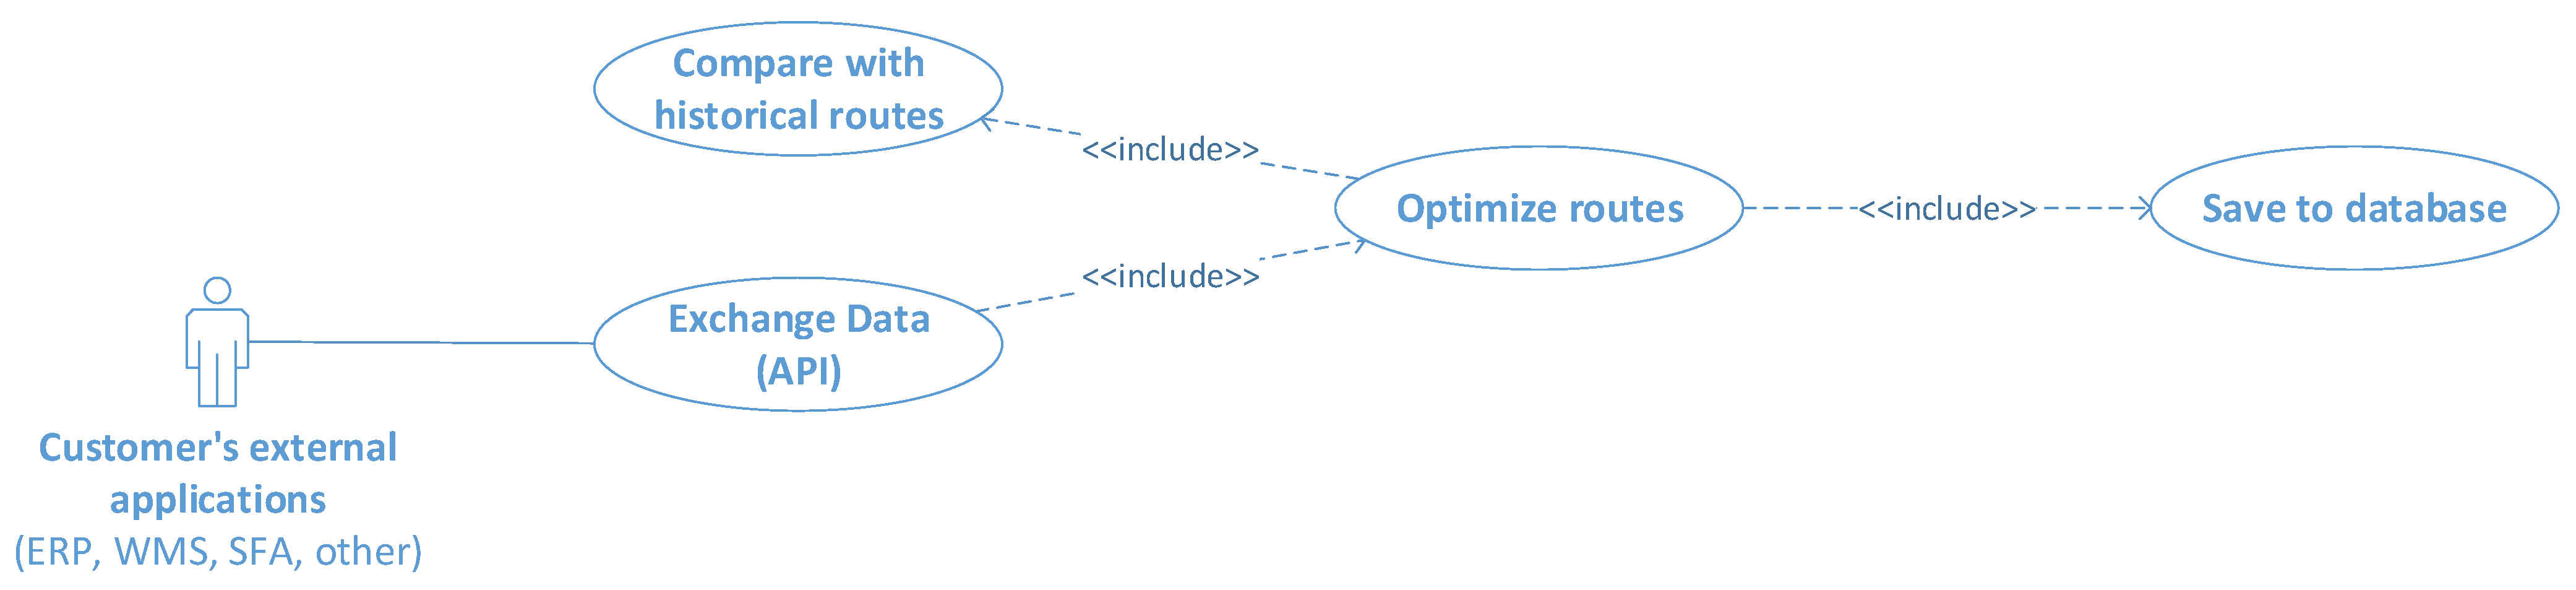
The customer applications: So that this solution is as automatic as possible, with little or no human intervention, the solution relies on web services that permit the communication of useful data between the customer’s solutions (ERP, WMS, SFA, and others) and the iRoute solution (
Figure 2).
- -
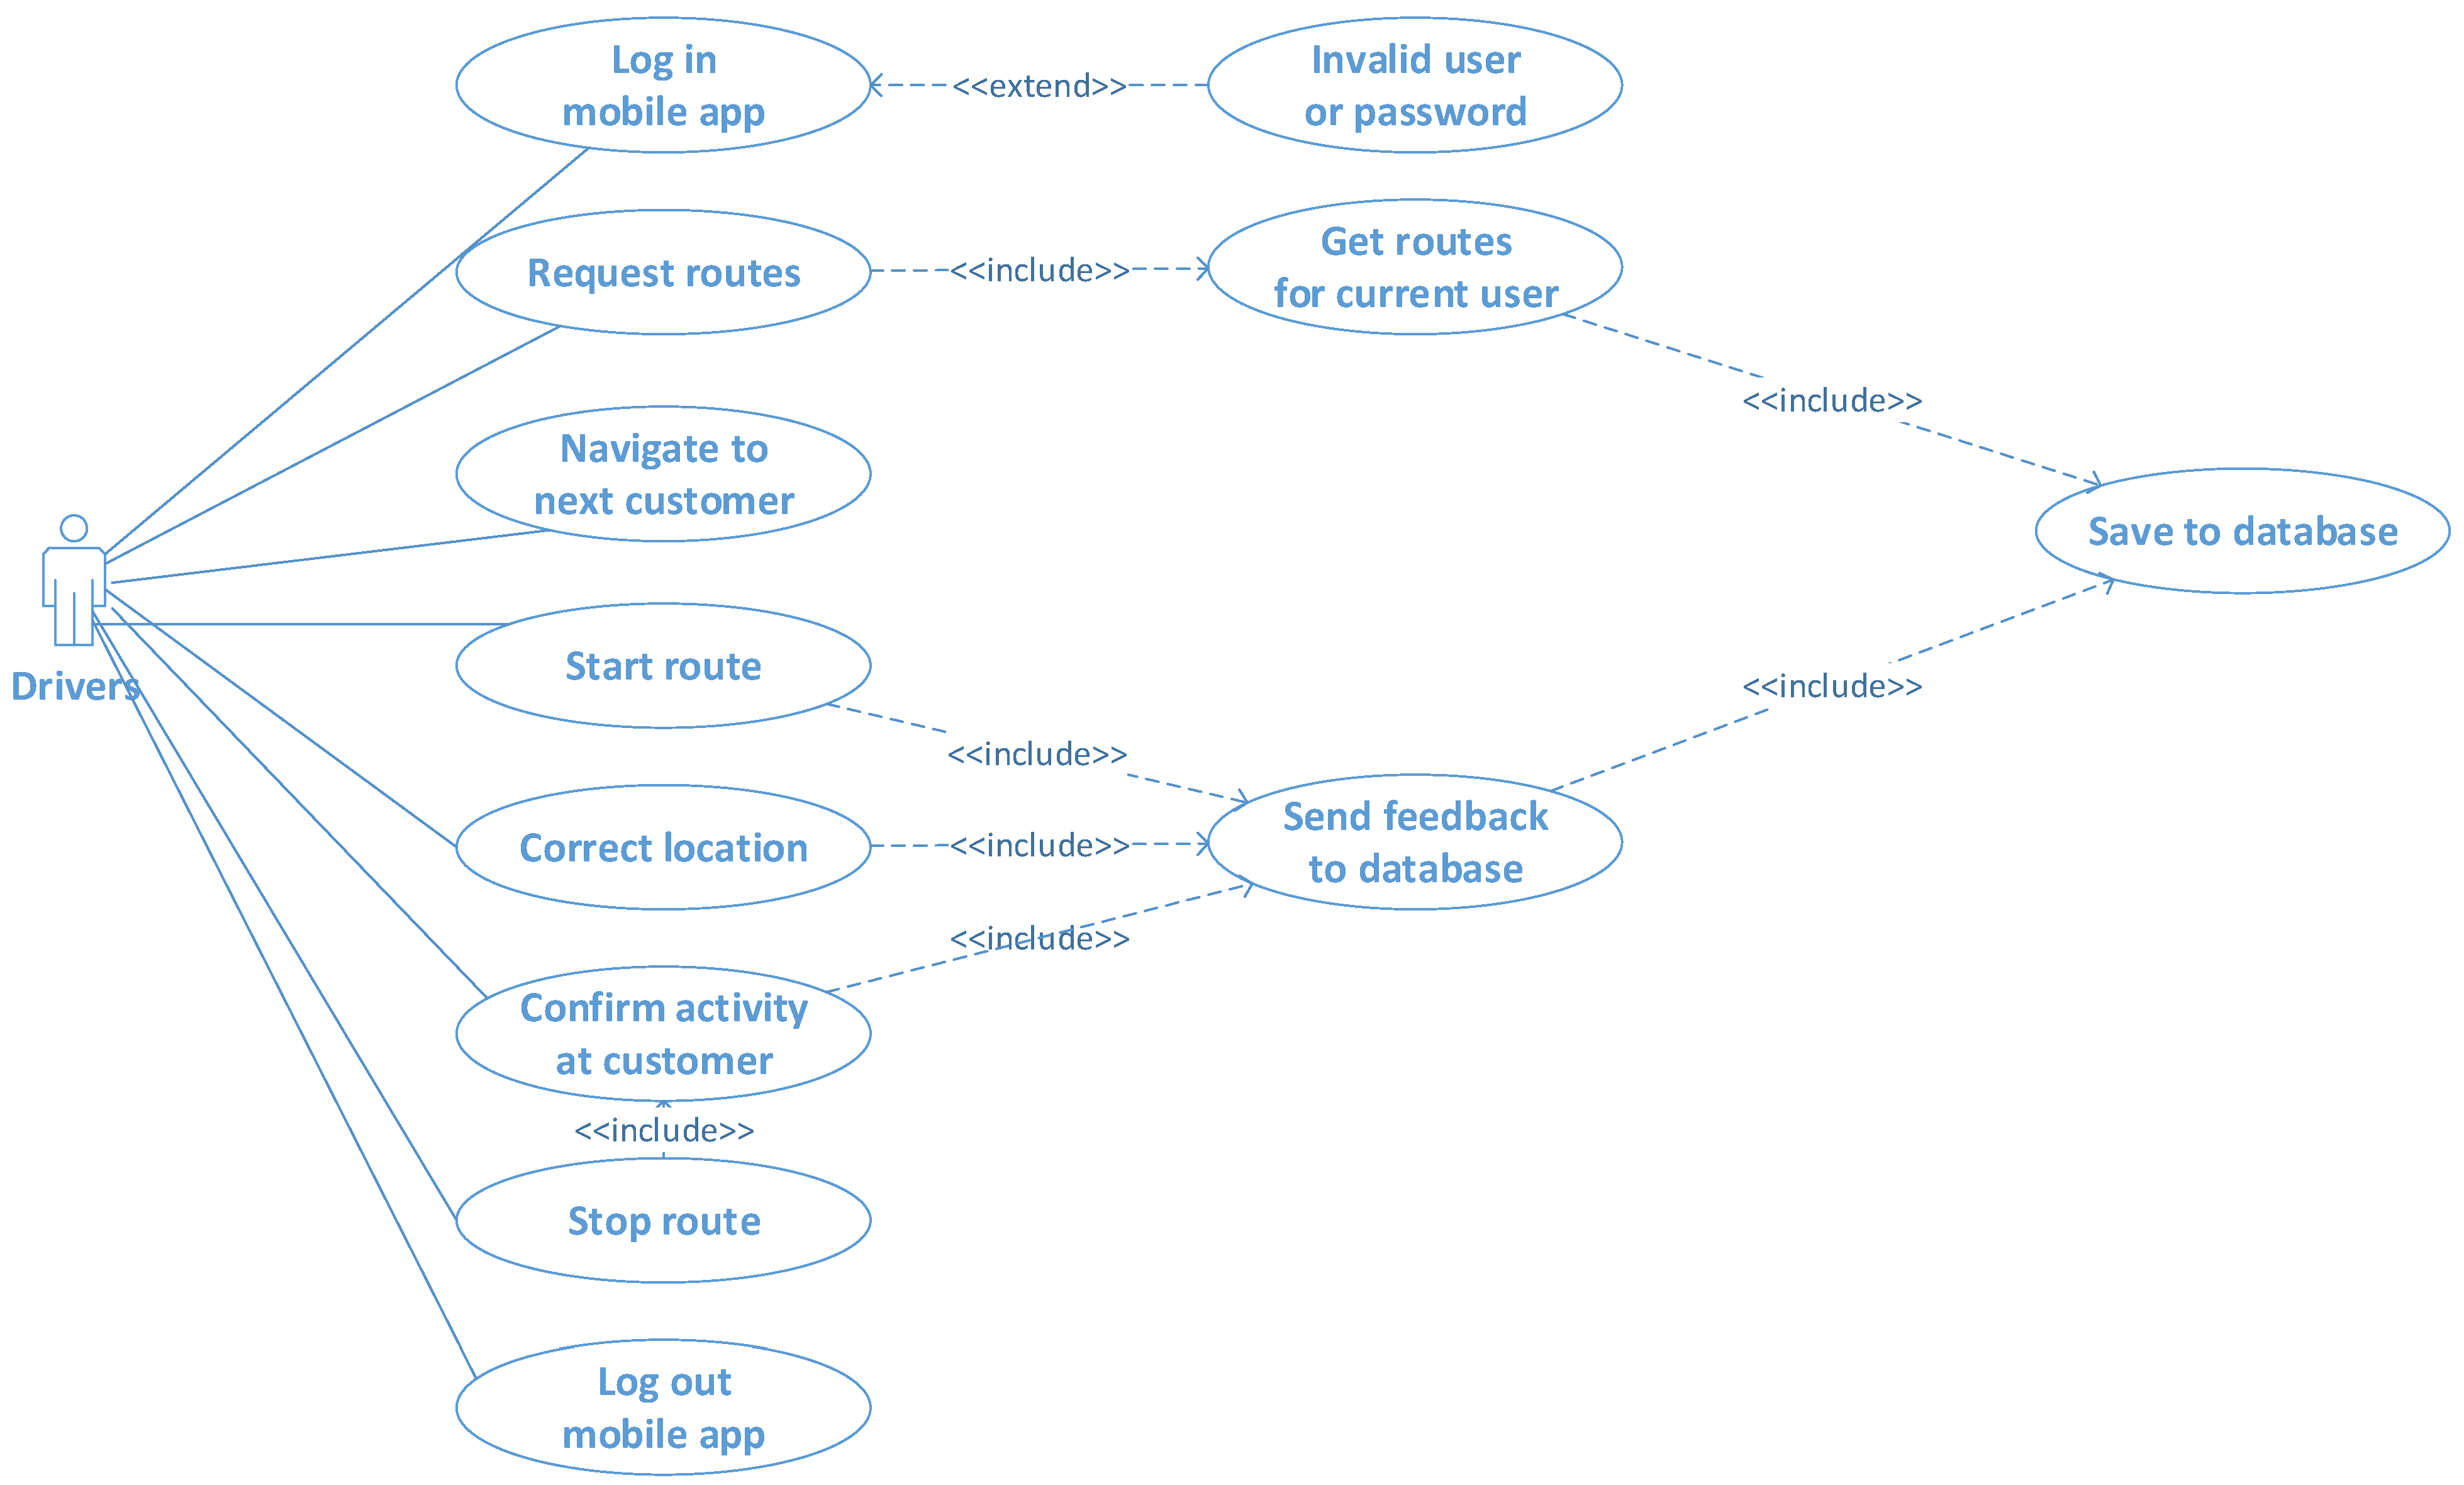
The mobile app user (driver): The execution of the route will be controlled by the end-users of this solution, the drivers. They use the mobile application for obtaining the planned route, consulting the route sequence and visits plan, sending useful feedback about the execution of each delivery/collection, and signaling any inadvertences (correcting the location, providing reasons why the end-customer rejected or partially rejected the order, and so on) (
Figure 3).
- -
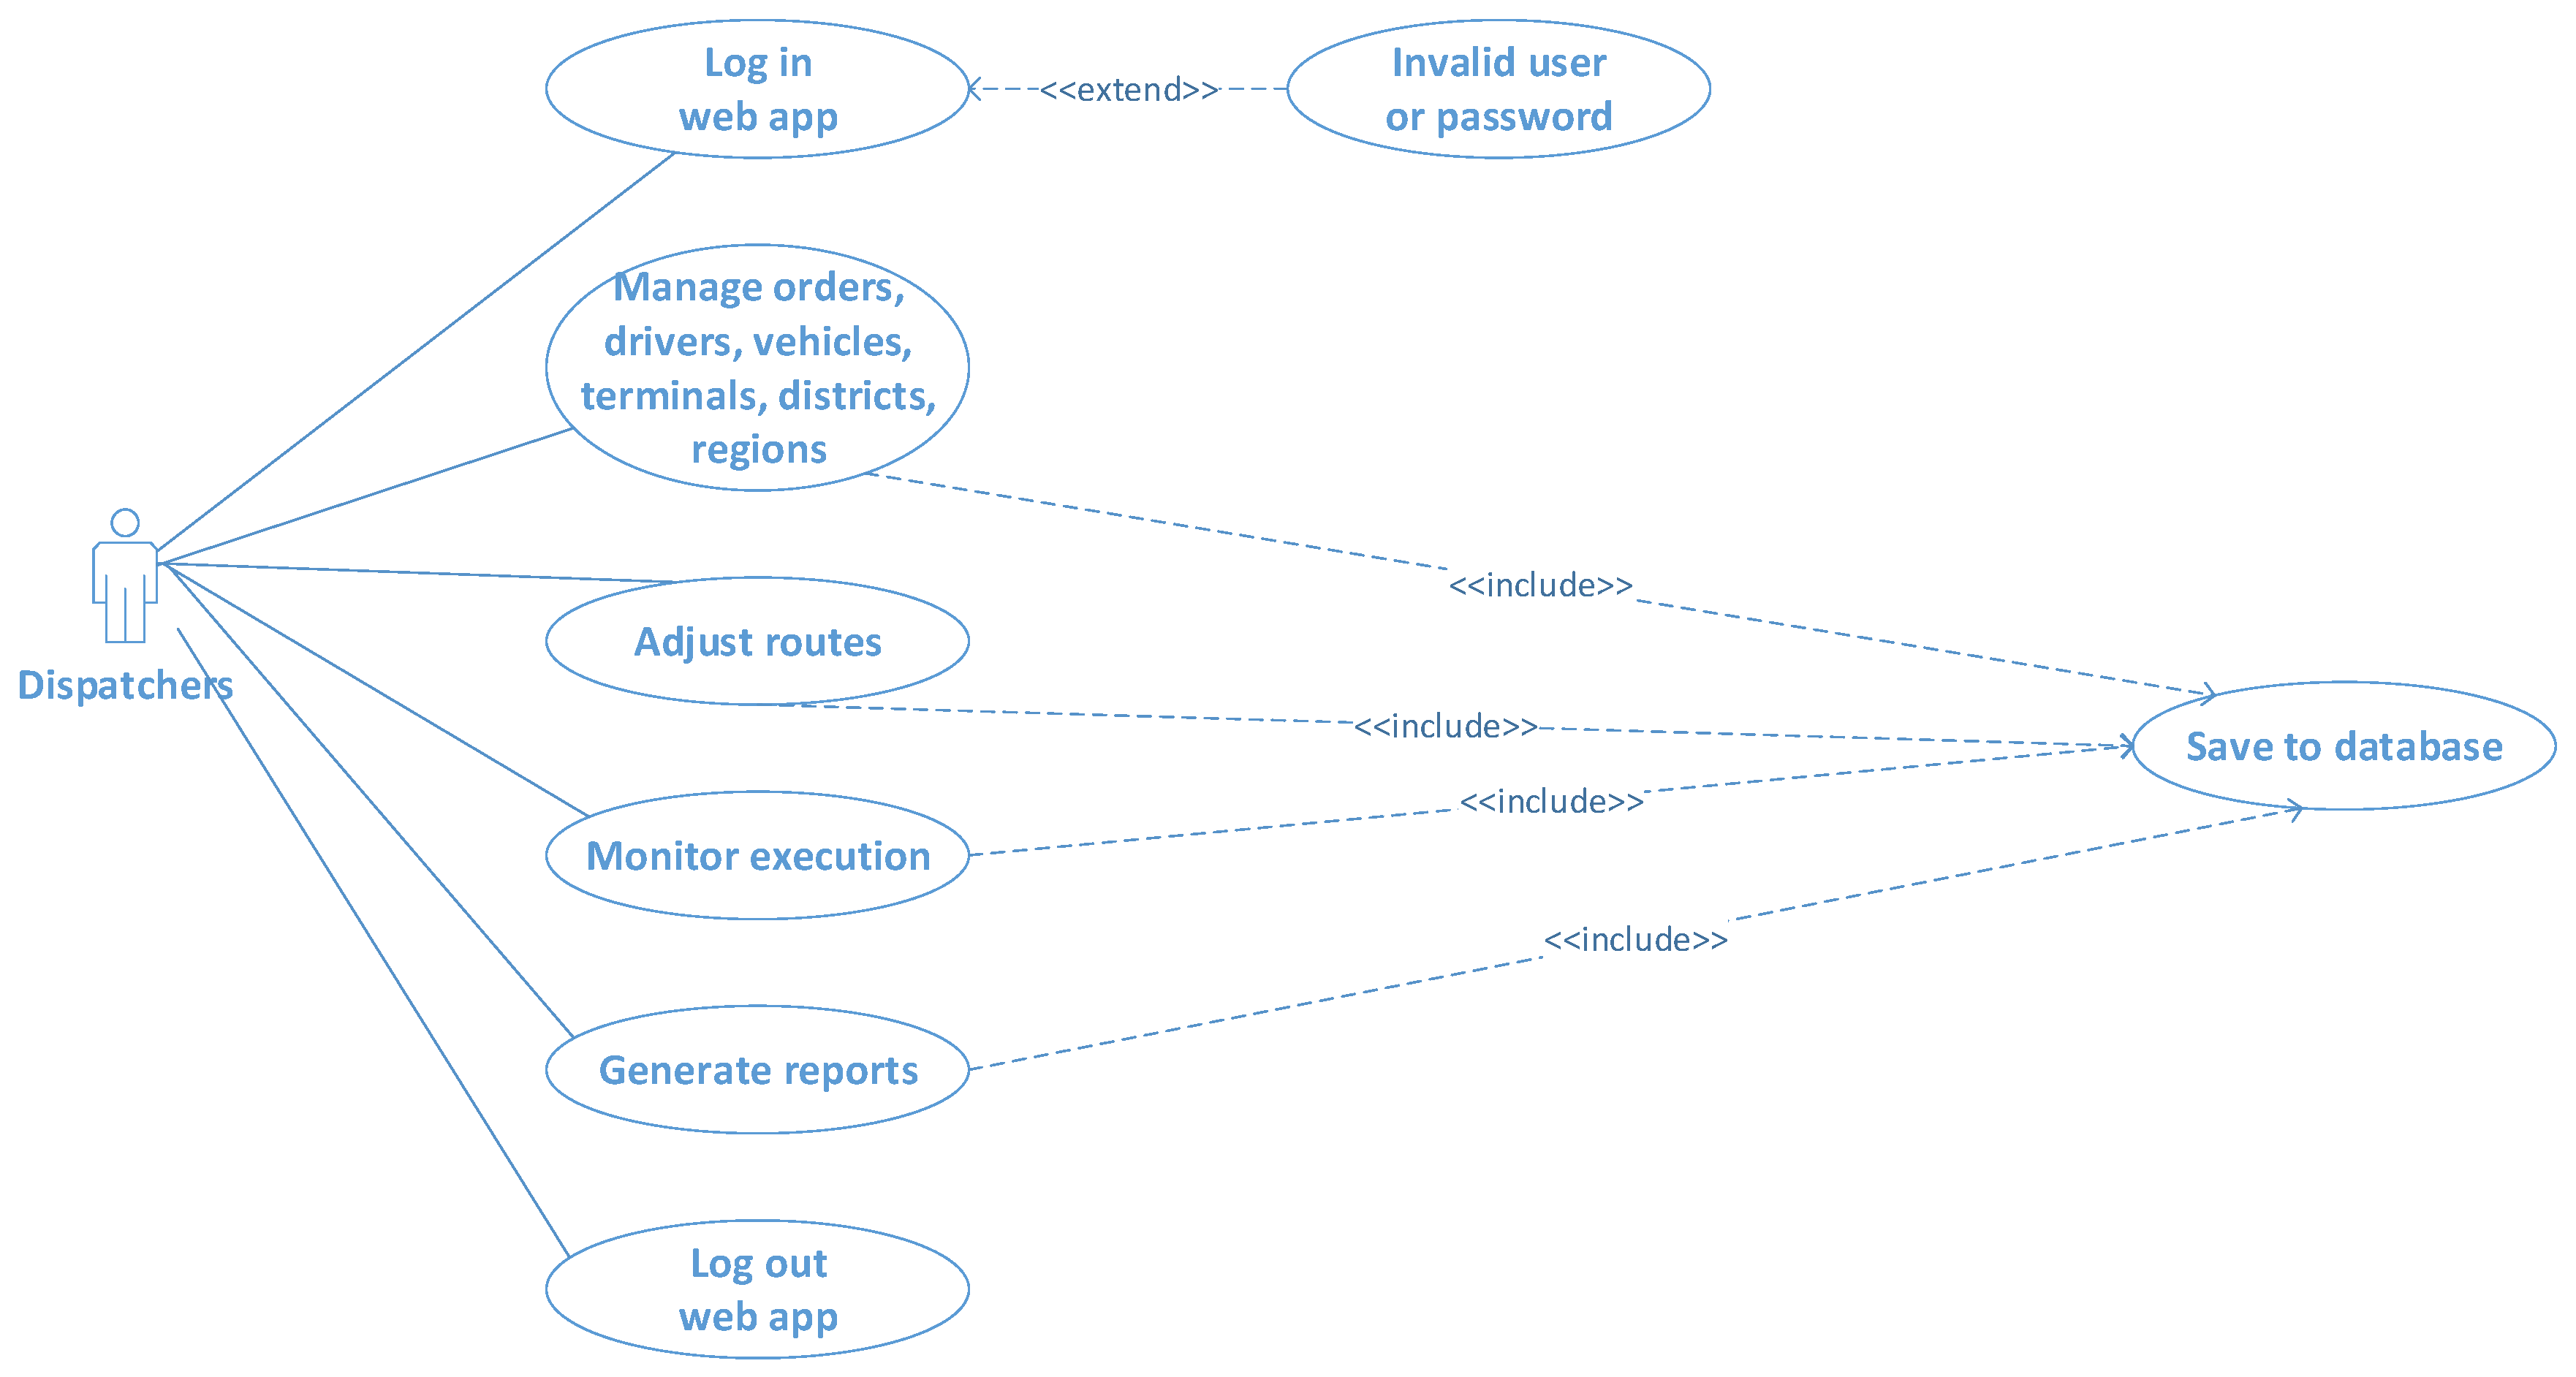
The web app user (dispatcher): The automatic upload of the customer’s orders and resources should be monitored and validated by a dispatcher, who can customize the plan based on their knowledge or last-minute updates, monitor the execution of routes, and generate reports for plan analysis (
Figure 4).
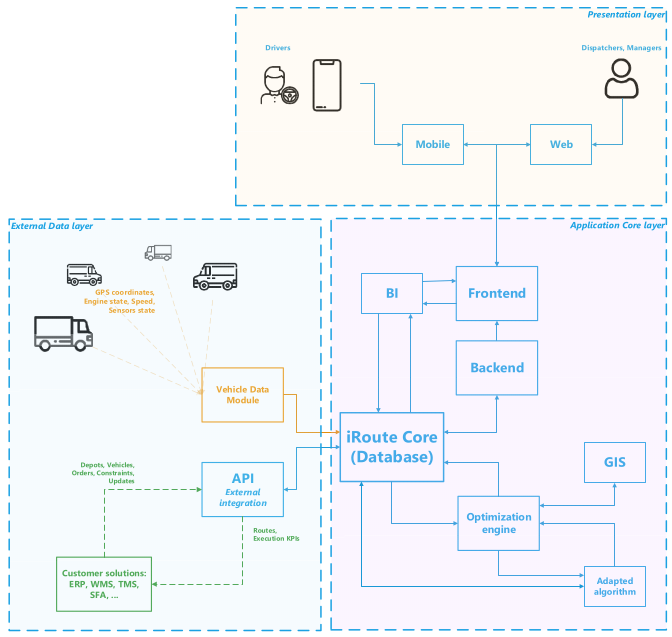
3.2. Solution Data Layers
With the iRoute solution, the data can be split into three different layers:
- -
External data layer: Here, the data are received from telematic devices that have a bi-directional data exchange with customer solutions through web services.
- -
Application core layer: Here, we have the main component of the solution, the database, and all the services and modules that process and transform the input data into useful output data. Based on the customer profile, the business rules and logic are customized and adapted for each customer’s needs.
- -
Presentation layer: Here, the processed data are presented to the end-users, the dispatchers, management users, and drivers through dedicated web and mobile interfaces.
These layers are represented in
Figure 5 with all the components that are being used:
In the following paragraphs, we present details about each module from the above architecture.
- (A)
Layer: External Data
Module: Vehicle Data
The module gathers information received from GPS and telematics sensors via devices that are placed inside vehicles and stores it in the database (as pointed out with red markers in
Figure 6).
Communication with multiple devices is handled by the communication services, managing bidirectional data connections with different device configurations that include wired or wireless sensors. Moreover, the communication server permits remote over-the-air configuration by sending device commands through the GPRS connection.
Through the module, communication between the devices and the server is ensured using bidirectional connections through a remote configuration of the devices; thus, the sensors connected to the AVL device send data to the module.
The data transmitted by the GPS devices are collected and manipulated using predefined rules to be used by the application’s clients (use case G.1).
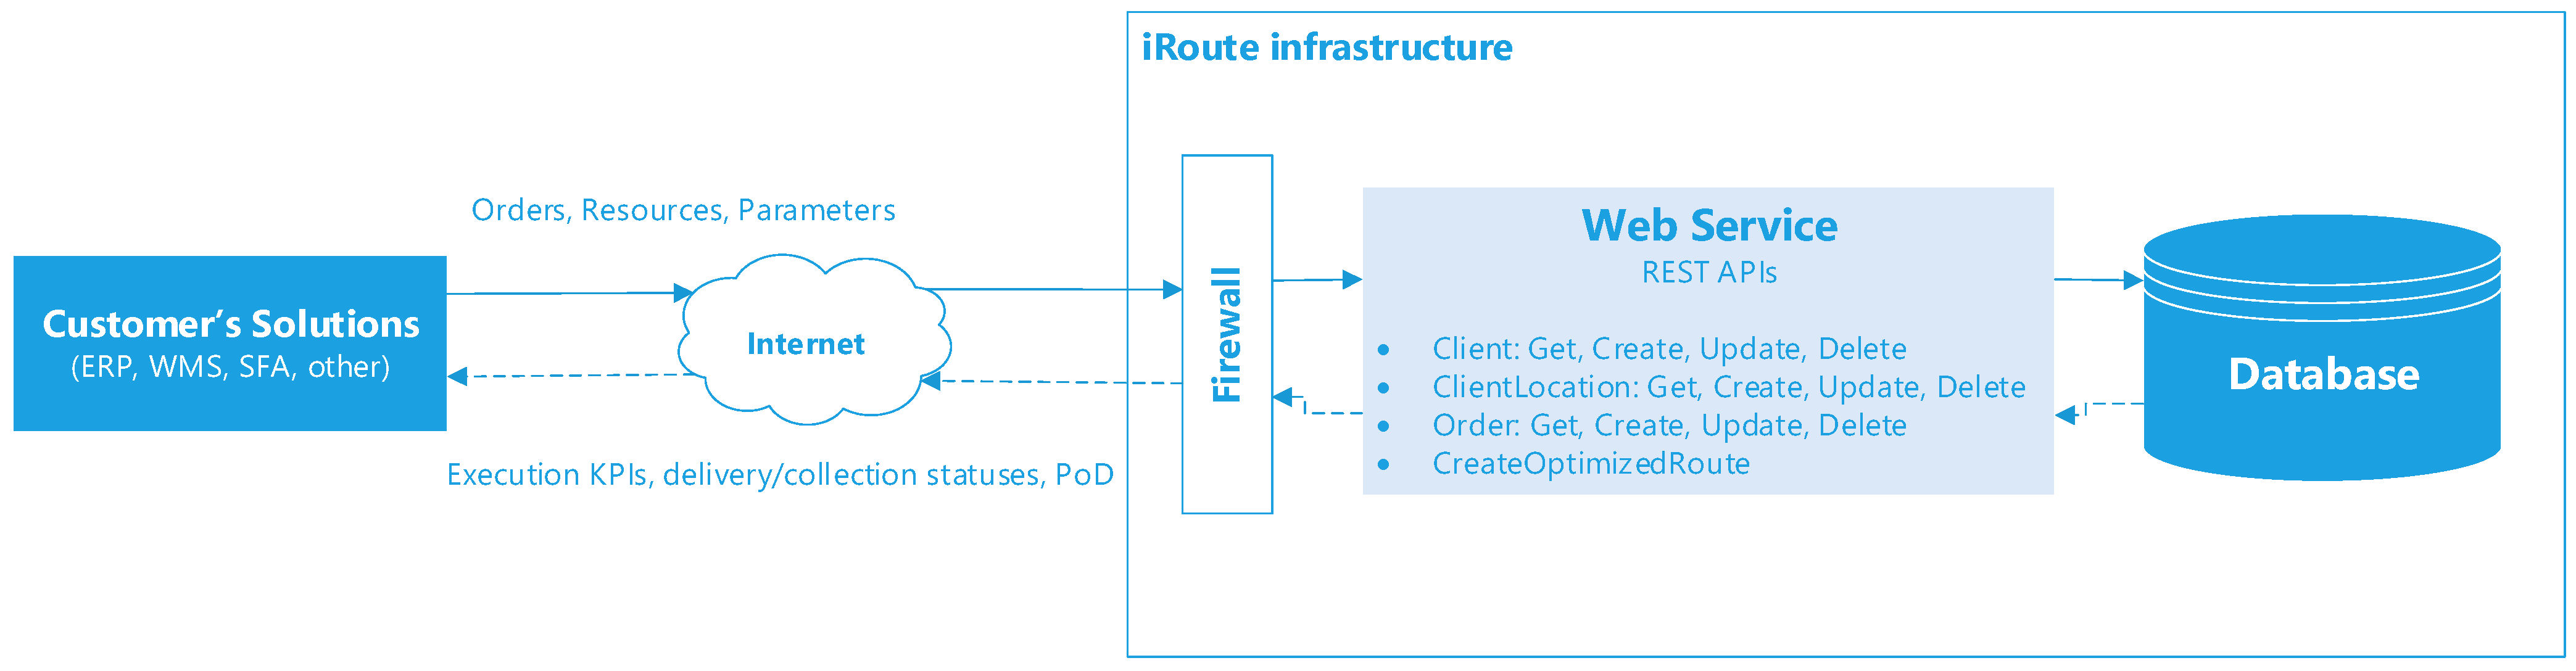
Module: Integration
This module consists of a set of predefined methods that enable different software solutions to communicate with the iRoute solution for sending or obtaining useful information needed in the planning or monitoring of the route plan execution process as seen in
Figure 7.
Some of the exchanged data are:
- -
Orders: Information about what tasks need to be fulfilled by the mobile workforce, such as delivering goods, collecting waste, and servicing end-customer equipment. These tasks can have different constraints, such as weight/volume/value, time windows, priority, and many more.
- -
Resources: Updated info about the resources used in the planning process, such as vehicles, drivers, types of goods, and customer location metadata.
- -
Plan parameters: Optionally, the plan parameters can be changed dynamically based on different business needs. For example, during weekdays, the plan should strictly consider the constraints, while during weekends the plan can be more flexible. These changes can be made in real time also by the dispatchers.
- -
Route execution: After the routes are finished, the customer’s solution can use the execution information for future data flows. Some of the data that are being pulled from the iRoute web services include route execution KPIs (distance, duration, costs, stops, number of locations visited), location delivery/collection statuses, and proof-of-delivery.
- (B)
Layer: Application Core
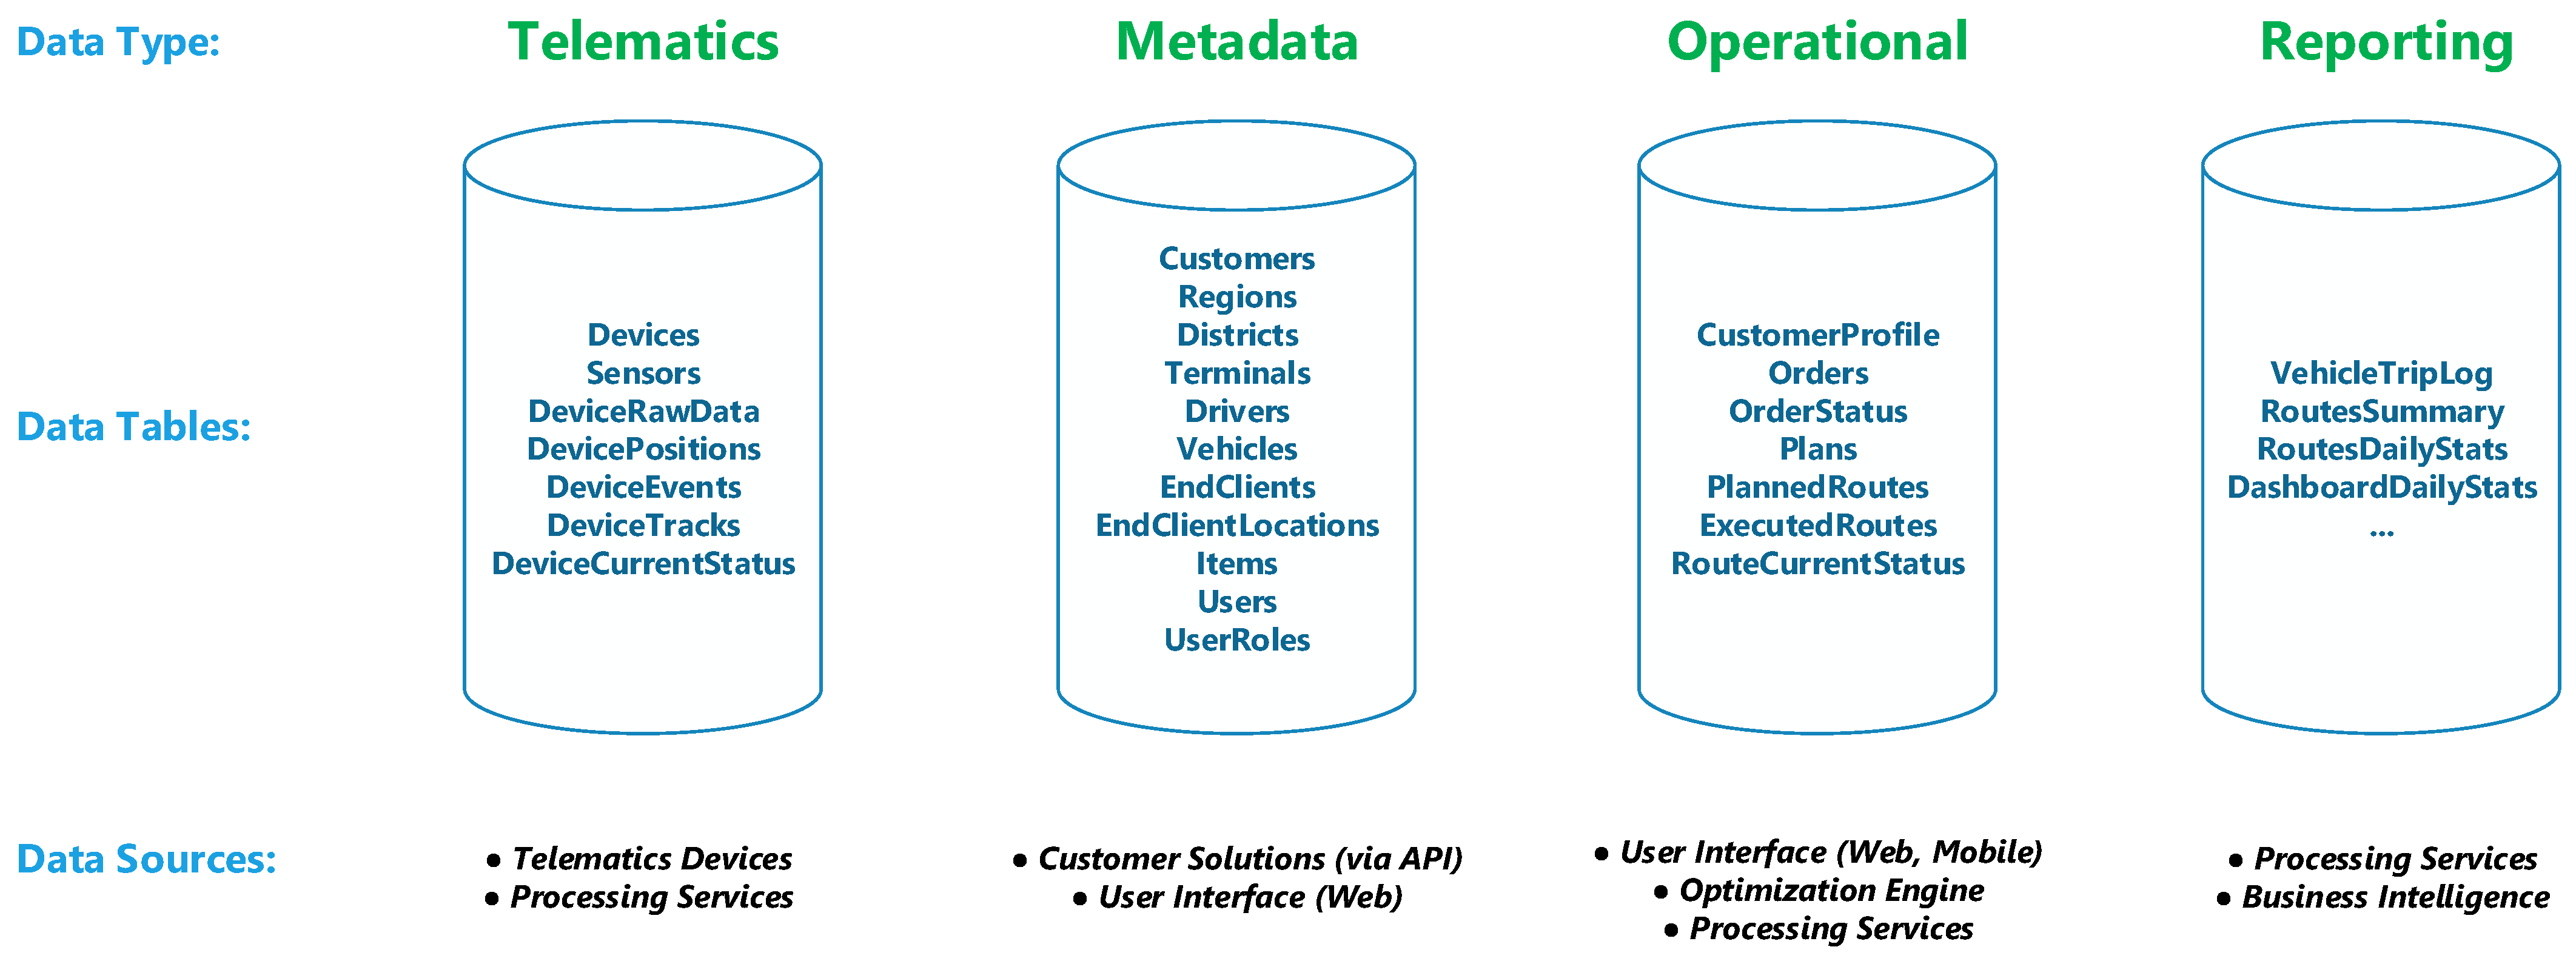
Module; Database
The database is the central component of the iRoute solution where all the data are stored from all the solution’s modules.
We have used a relational database, the Microsoft SQL Server, for having all the enterprise features a SaaS needs for its end-users.
The data stored can be grouped by usage and data source into four main categories (
Figure 8): Telematics, Metadata, Operational, and Reporting. There are also other data and tables, but they are not specific to this planning platform.
Module: Processing services
Processing services are responsible for transforming GPS data before they can be used by application modules. Primary data go through a data-cleaning process and then are transformed into useful data to create reports and the possibility of being viewed by the user.
Module: User Profile
The optimization process is customizable according to the parameters selected by the clients to provide the best results according to the client’s preferences. The parameters are configured in the user interface as the company data profile. Users with an administrator role can select the optimization criteria that can be used, such as map type, time window allocation, driver break period, metric type, vehicle category, and other constraints.
Module: Optimization Engine
After the database, another important module is the optimization engine, which takes the orders and customer resources and defines routes that try to cover optimally as much as possible all the orders that it receives. The module uses the user profile to tailor the algorithm based on the customer’s needs.
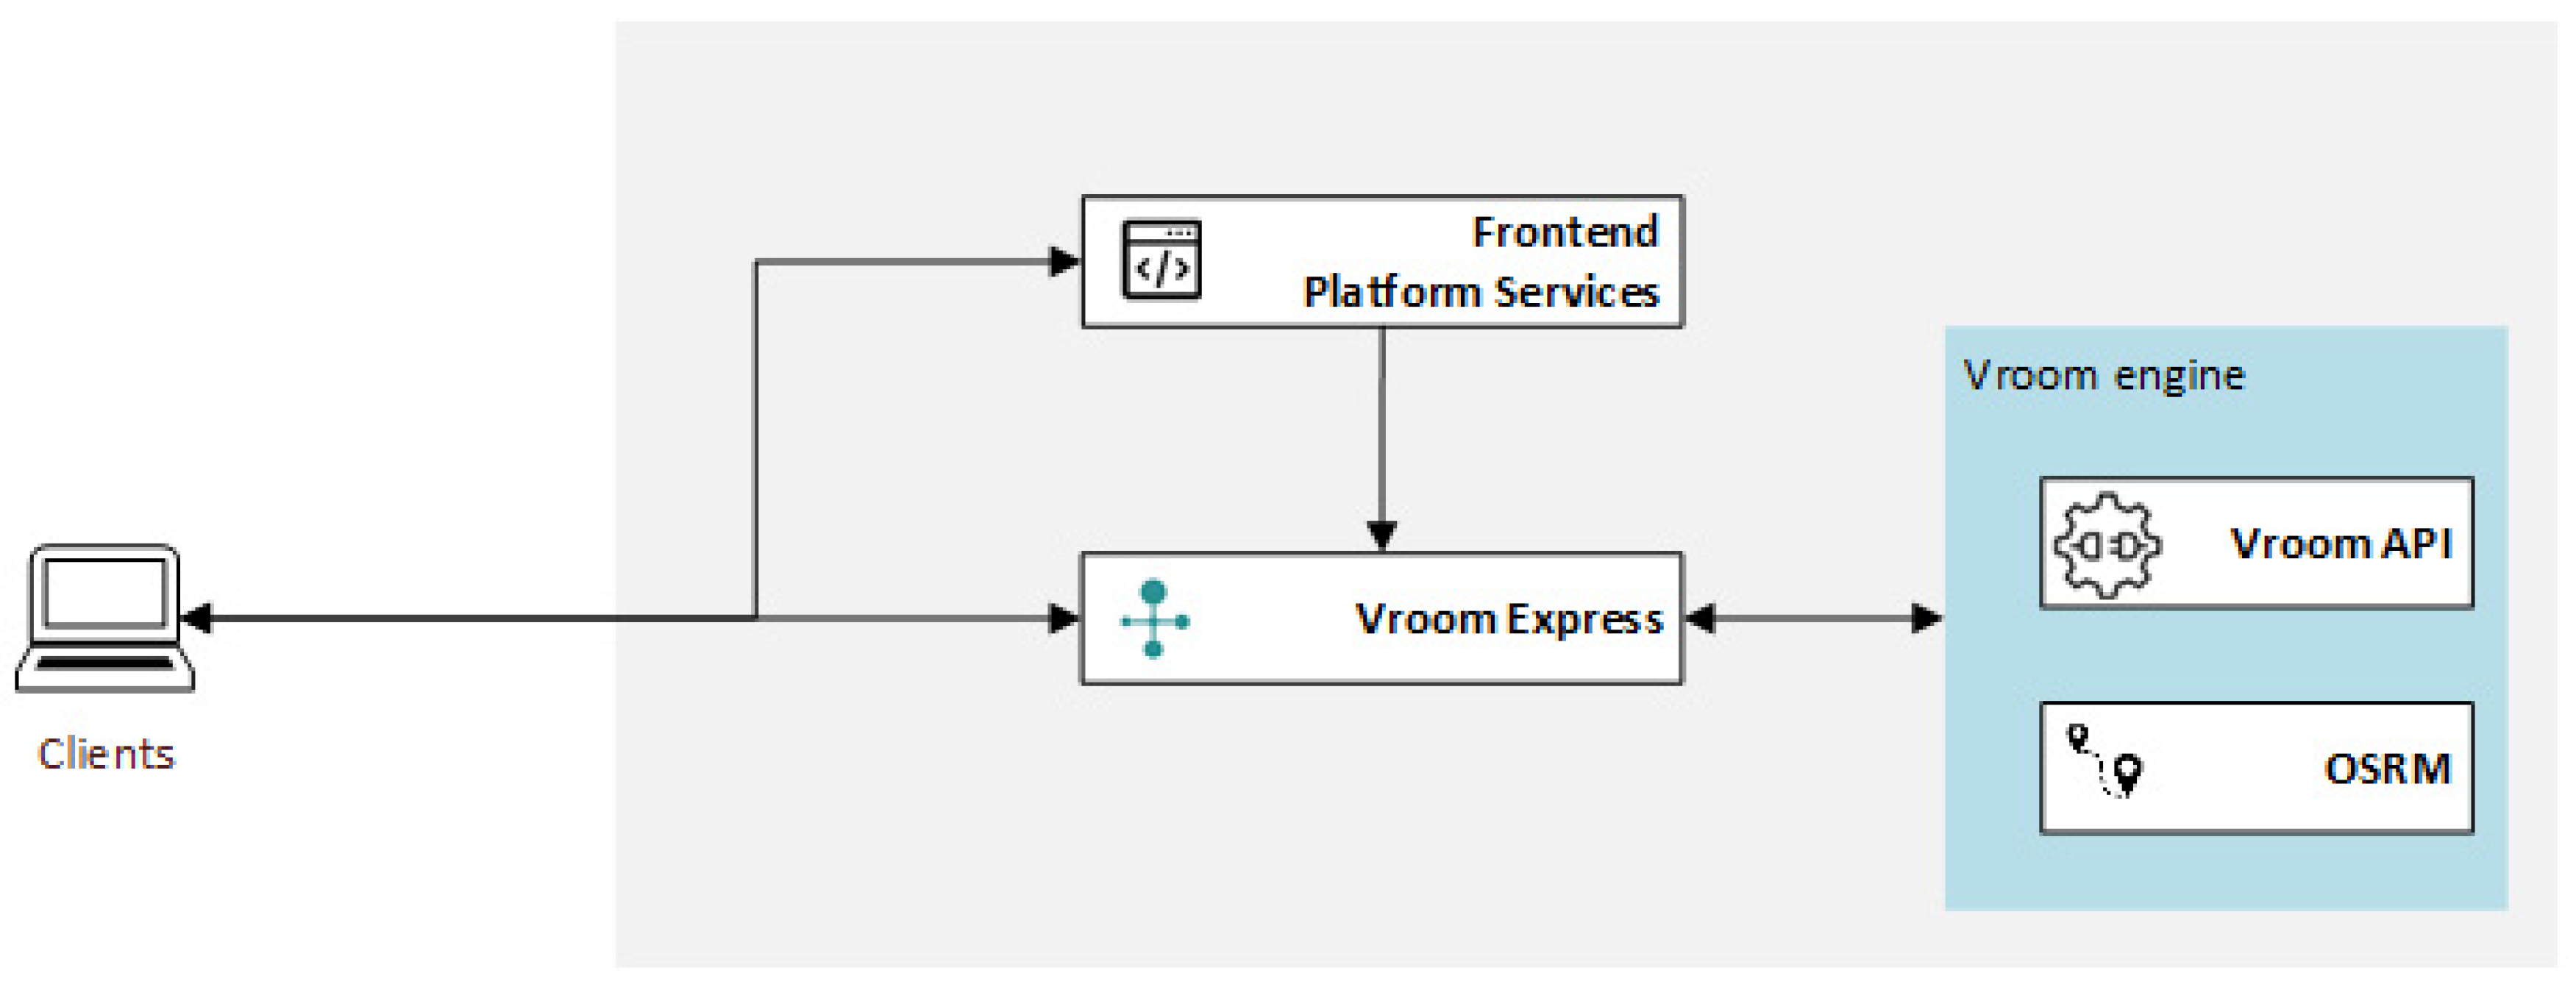
We started using the algorithms from the Vehicle Routing Open-source Optimization Machine (VROOM) solution, an open-source optimization engine based on input data that calculates the best route for each vehicle with a low computational cost [
31]. The VROOM works based on open-source routing engines and encompasses the Open-Source Routing Machine (OSRM), which uses data from the OpenStreetMap project. The VROOM can be customized through user-defined cost matrices and can be integrated into any routing engine. OpenStreetMap (OSM) is an open database for visualizing, analyzing, and interpreting geographic data [
32]. We used it as a good source of information, based on community collaboration, that does not add up to the end-customer’s license costs. Other map systems can be used if there is a specific need.
The data flow consists of receiving the initial raw data (resource availability, orders, and route parameters) then processing these data by the optimization engine based on the pre-developed algorithms and road data from the OSRM (
Figure 9). In the end, the plan with the optimized routes is returned to the client with enriched KPI data.
Module: Route monitor
Route monitoring services analyze the data received in almost real time to display detailed information about the progress and status of routes. The dispatcher can monitor the route driven by the drivers, the current location, and the status of the delivery/pickup of every location visited.
Module: Driver Feedback
In this module, the application offers the driver all the information needed for driving on a route. The driver confirms any action taken (start route, end route, arrive at the customer, deliver goods, or correct the location of the customer).
- (C)
Layer: Presentation
Module: Web Application
The web application was created to give end-users access to the data according to the assigned role. The web application contains functionalities such as authentication in the application, system administration, report generation, and others.
Module: Mobile Application
The mobile application allows drivers to access information about the clients’ locations based on the road map on the respective day. The field operations of the driver are collected as feedback and are analyzed to improve the customer–driver relationship.
4. Proposed Historical Routing Algorithm
Our former article [
33] presented the prototype of the historical route optimization algorithm of the iRoute solution. At present, however, we have come to identify certain key variables that factor towards better results and thus propose that route optimization be done according to the following specific data: orders, customer locations, vehicles, work schedule, constraints, and route planning parameters. In this way, the segments that are repeated during a route will be identified and saved to improve the optimization algorithm.
The iRoute solution proposes to optimize vehicle routes taking into account real constraints encountered by drivers day by day. Suppose route X has been driven many times (at least 10) by drivers with differences in terms of time, distance, or path used compared with the theoretically optimized route. In that case, it is very reasonable to expect that in practice the drivers will not use the proposed route due to their knowledge of local road conditions, style of driving (e.g., preferring extra-urban roads), or any other factors that will impact the total execution of the route. Or suppose they will be compelled to use the theoretical route. In that case, they will not be comfortable and they will try to point out at the end that the reason their execution was different from the plan is that the plan was not realistic. It lacked local conditions about the road network, traffic, community, and other factors. This is the reason that we wanted to use the historical tracks and give credit to the drivers for choosing the best route to deliver or collect the goods. Our new adapted route is supposed to minimize the differences between the plan and the execution, still offering a good enough plan to cover all the locations from the route. The final solution will also offer the dispatchers a way of validating the execution path or just segments of it so that the driver does not deliberately take a longer path just for his/her needs. The invalid historical segments will not be used in the adapted route algorithm.
The similarity ratio between the route segments was calculated by using the Curve Matching library, which is based on the normalization of each curve with Procrustes analysis, and then calculating the Fréchet distance between each of the curves.
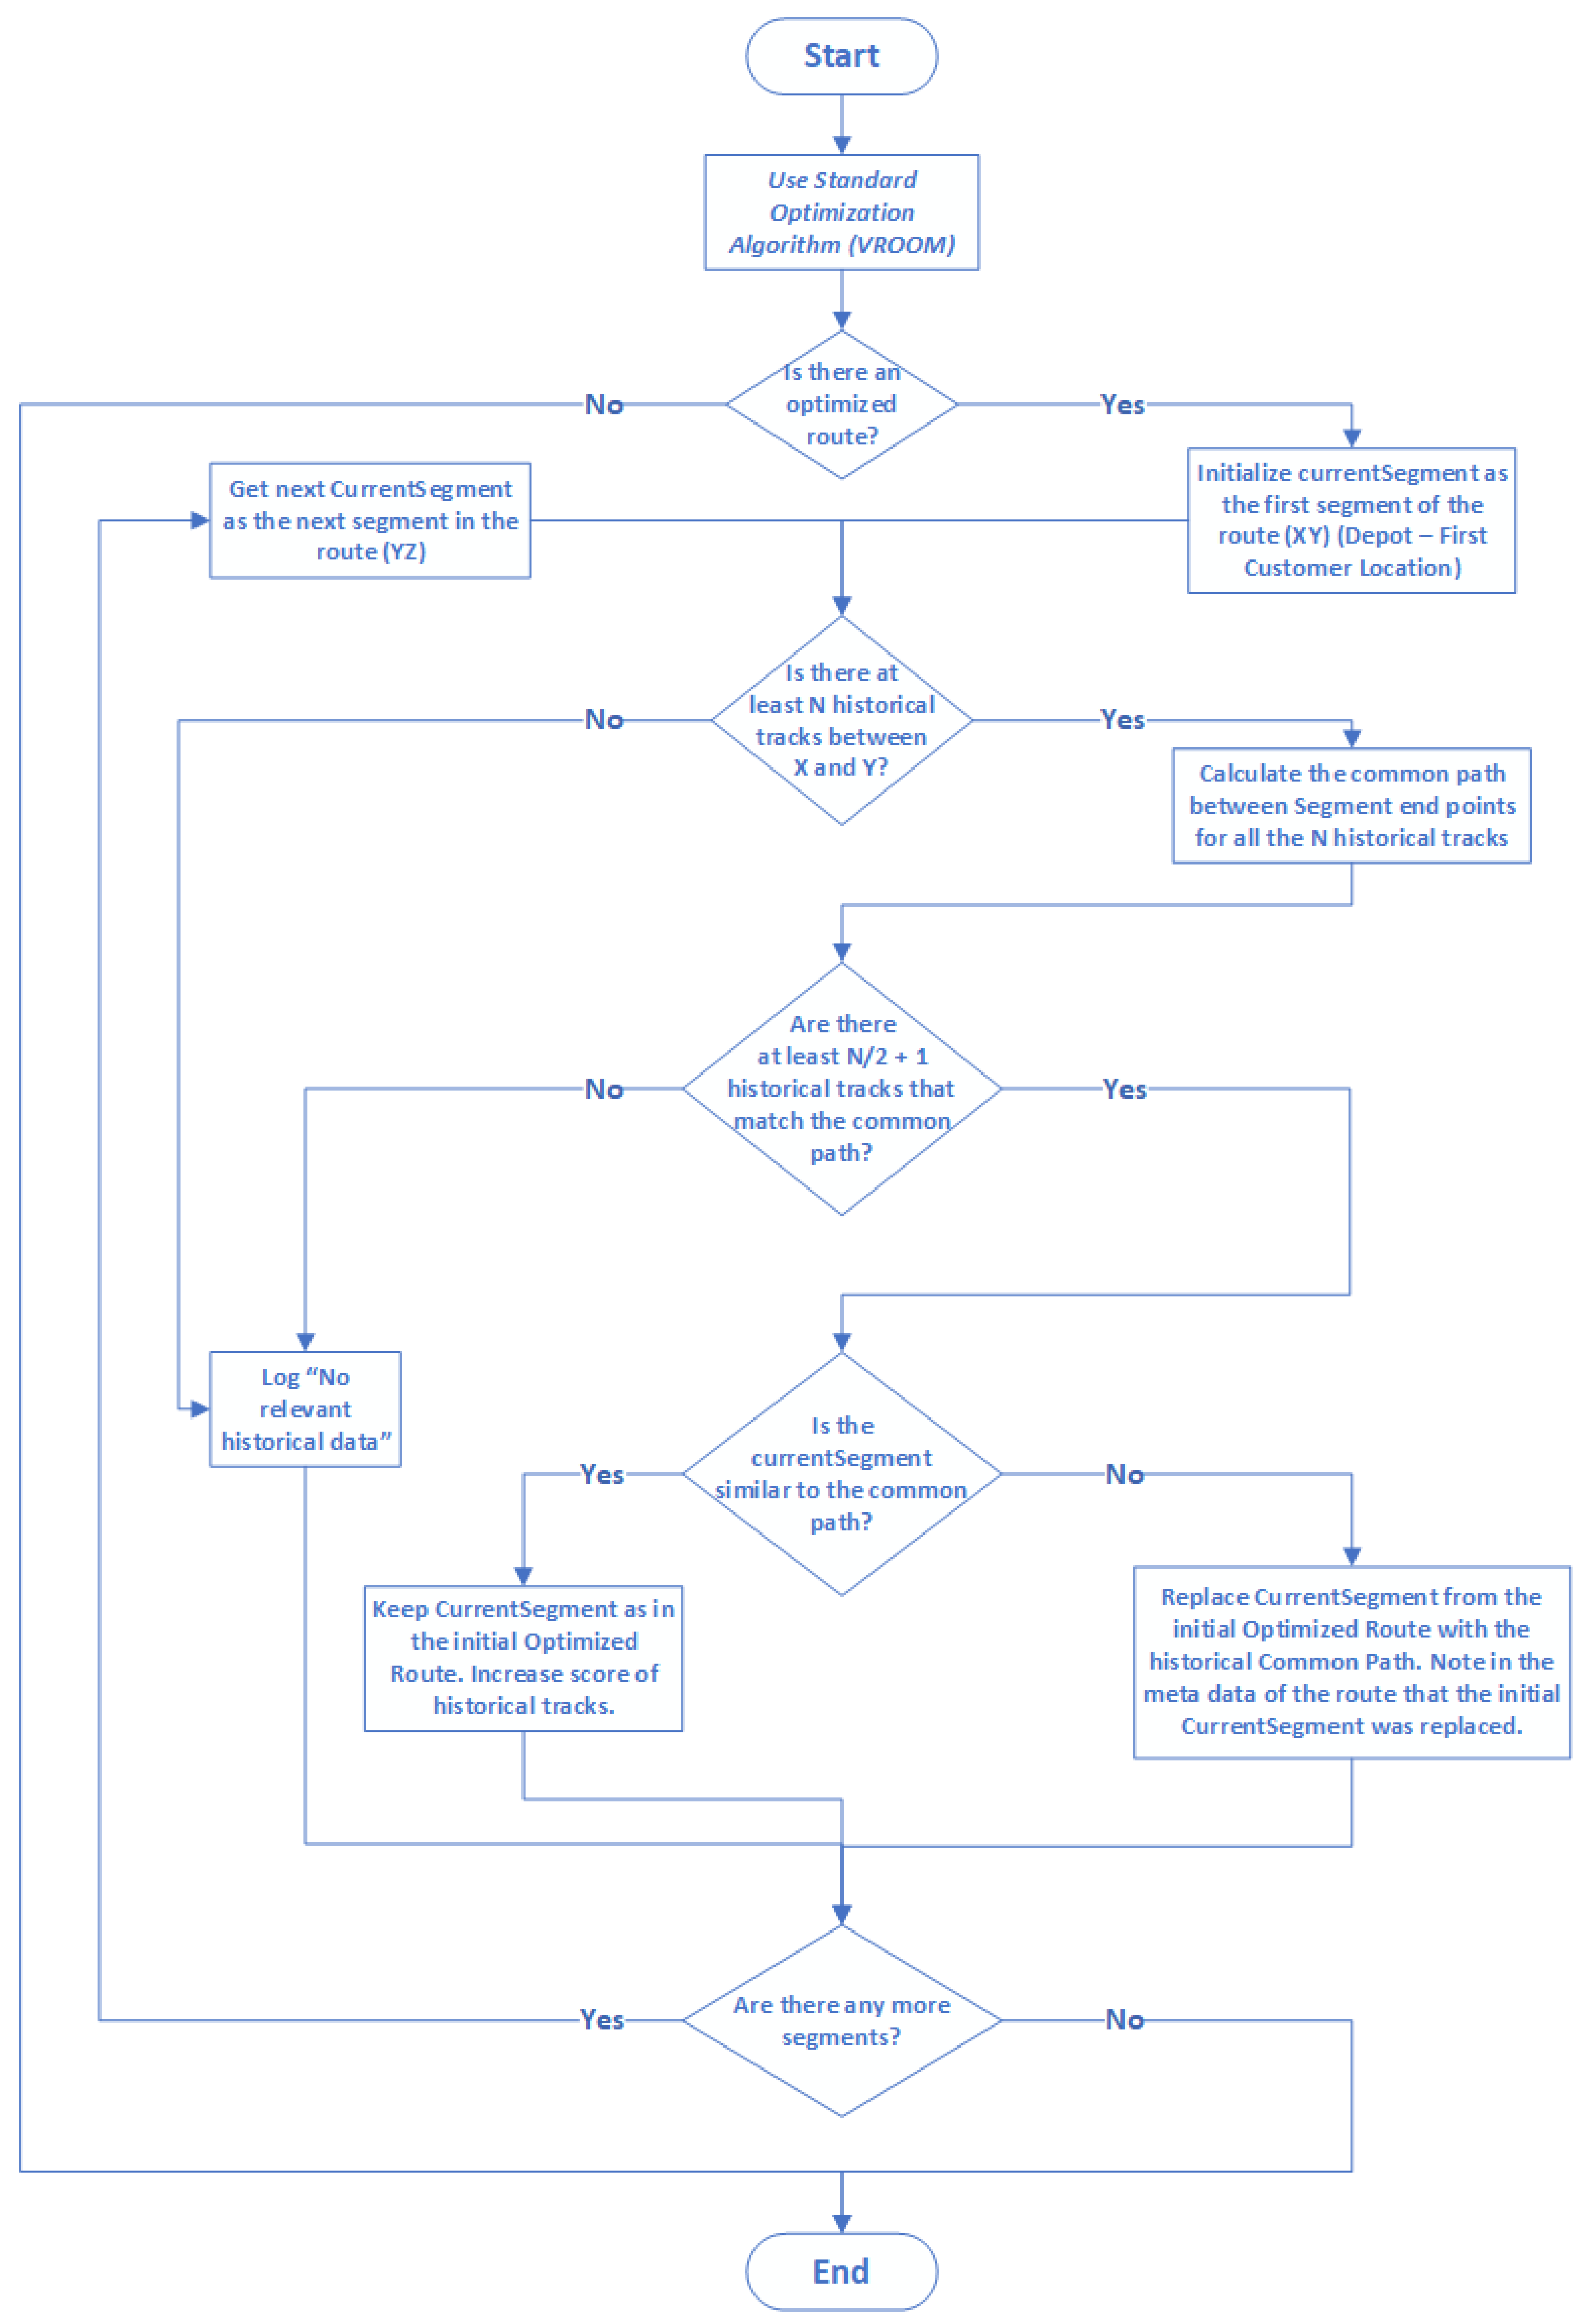
The proposed route optimization adjustment process is described below:
- Step 1.
Obtain the input—orders, locations, vehicles, constraints—and call standard VRP algorithms (VROOM) to obtain an initial optimized route for the data received.
- Step 2.
Subsequently, for each segment (customer X to customer X + 1 locations) of the standard route from Step 1:
- (1)
Check if there is historical track information about the road path between customer location X and customer location X + 1;
- (2)
Check whether we have a minimum of N such executed history track segments or not;
-
Initially, N could be 10, but it will be a parameter, which can be adjusted time, after obtaining enough data;
- (3)
For those N historical data trips, compare the segments and count the paths that are similar to an acceptable percentage (e.g., more than 90%), as the common road traveled from X to X + 1;
- (4)
If we discover a majority of historical segments that are similar to the common path, the algorithm will check the common path with the current optimal segment (provided by the VROOM in Step 1):
- a.
If the common and optimized road segments are similar, then we keep the current optimized segment and we score positively the historical tracks for later reference;
- b.
If the common and optimized segments are not similar, the algorithm will overwrite the optimized segment between X and X + 1 with the common path from the historical routes. The algorithm will note in the metadata of the route that the segment (X, X + 1) was adjusted;
- (5)
If the algorithm does not find a majority common path, the process for this segment is stopped, as there are not enough historically similar data to adapt the current optimized segment. The algorithm continues with the next segment until the last one.
The algorithm is described in the next logic diagram (
Figure 10) and is also written as pseudocode in
Appendix A.
5. Discussion and Results
For testing the developed algorithm, we used real anonymized data from a preselected group of customers. In total, the tests were run on 427 routes that were driven with 28 vehicles in 6 months, also having access to historical track data from the last 2 years.
- (A)
Comparing the results of our algorithm with other solutions
-
First, we compared our algorithm with three existing standard solutions:
- (a)
The Vroom CVRPTW algorithm;
- (b)
The HERE Maps API Routing algorithm with traffic data (Waypoints Sequence API 8.2.5);
- (c)
The Google Maps API Routing algorithm with traffic data.
Because our algorithm uses historical data, we could not use classic datasets such as Solomon [
34] or Homberger and Gehring [
35]. That is why we have used our anonymized data, for which we have historical executions.
The purpose of the comparison is to have a high-level view of how our adaptive algorithm results compare when being used on different optimization algorithms. For this, we tested the first 20 routes from our historical set of routes by calling the API of the three solutions, then applying our adapted algorithm, and then comparing the results (
Table 1).
D1 = Total distance of the planned route obtained by applying the standard algorithm
D2 = Total distance of the iRoute adapted algorithm run on the results of the standard algorithm
Diff = Improved difference between the execution and the plan (the formula is described in next section (B)).
From the above tests, we can see that, in general, our algorithm obtains between 15% and 19% smaller differences between the real historical execution distance and the planned distance. We can also see that this difference is smaller for Here Maps and Google Maps, as they use the historical data on traffic. Still, there is an average improvement of at least 12% and this difference can be a game changer for some businesses in terms of efficiency.
There are many planning solutions on the market. Most of them are commercial, like Google Maps or HERE Maps. We have chosen to use an open-source solution (VROOM) that uses OpenStreetMap road data so that our work can be reused by other research projects in the future at low cost and without any copyright issues. In the next section, we run our algorithm on optimized routes generated by the VROOM solution.
- (B)
Calculate the improvements compared to the VROOM standard algorithm
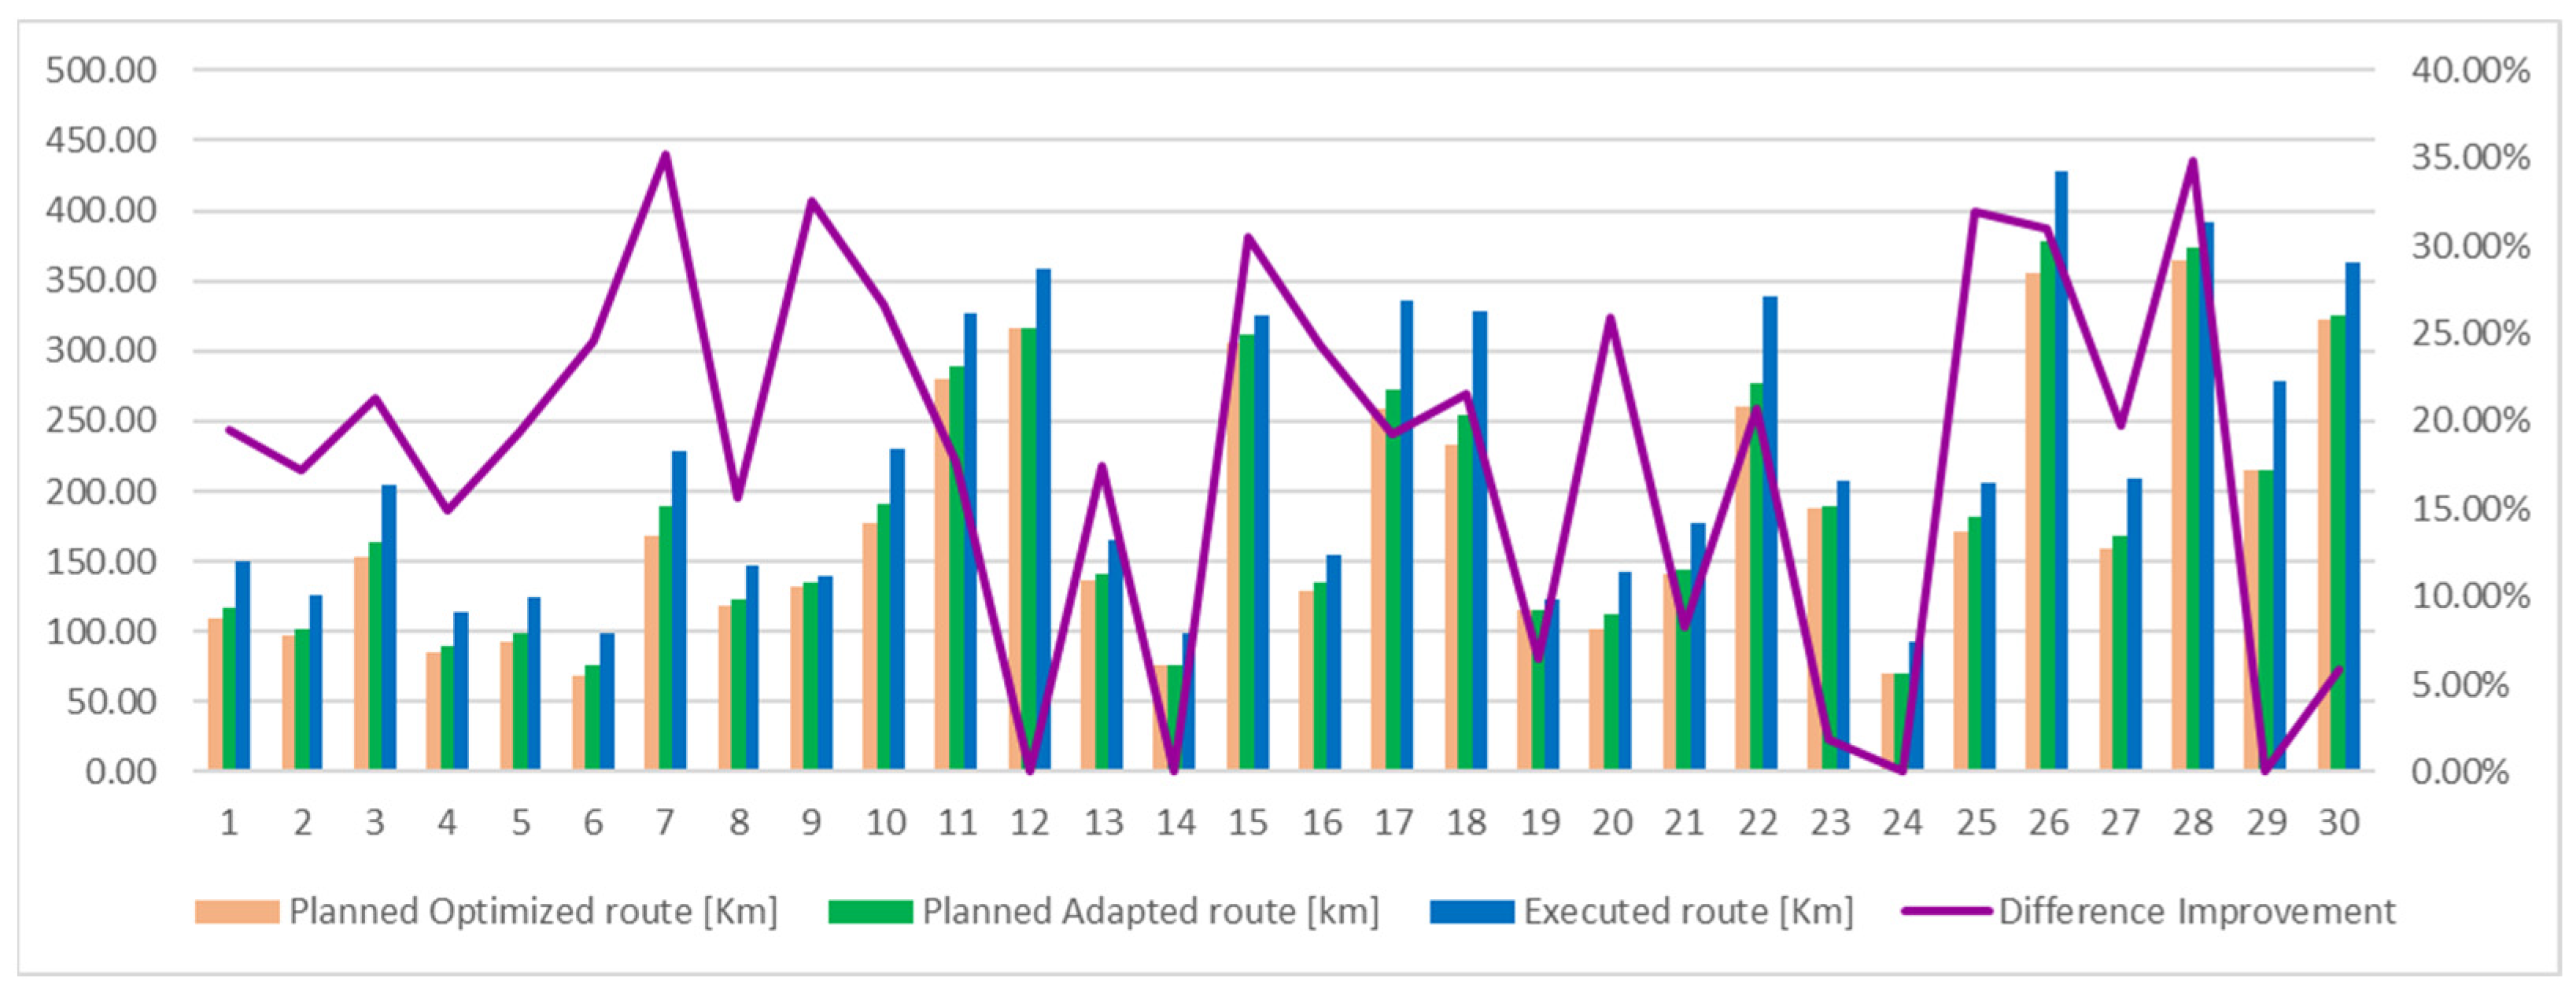
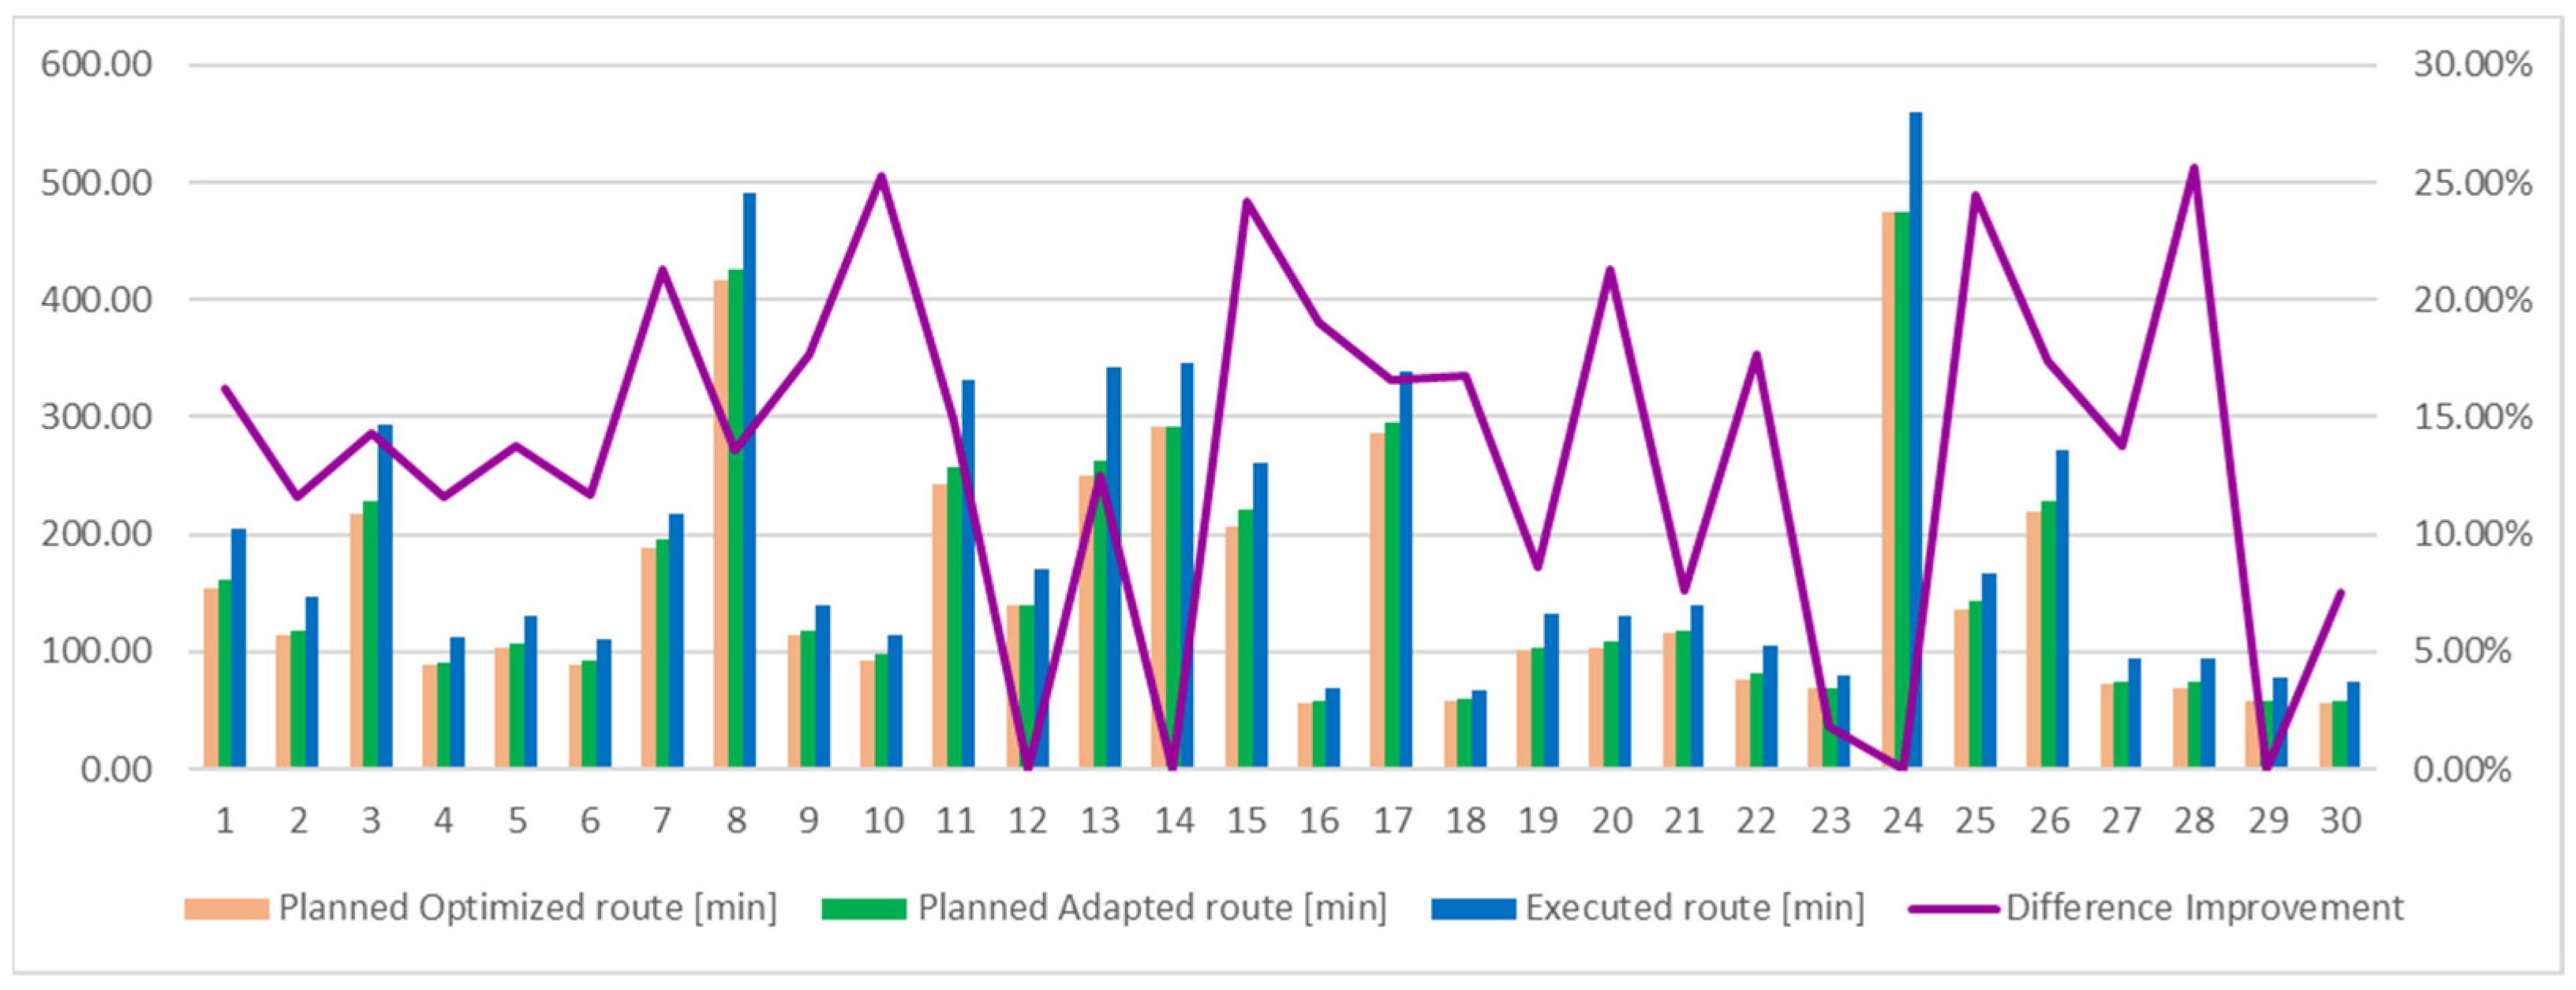
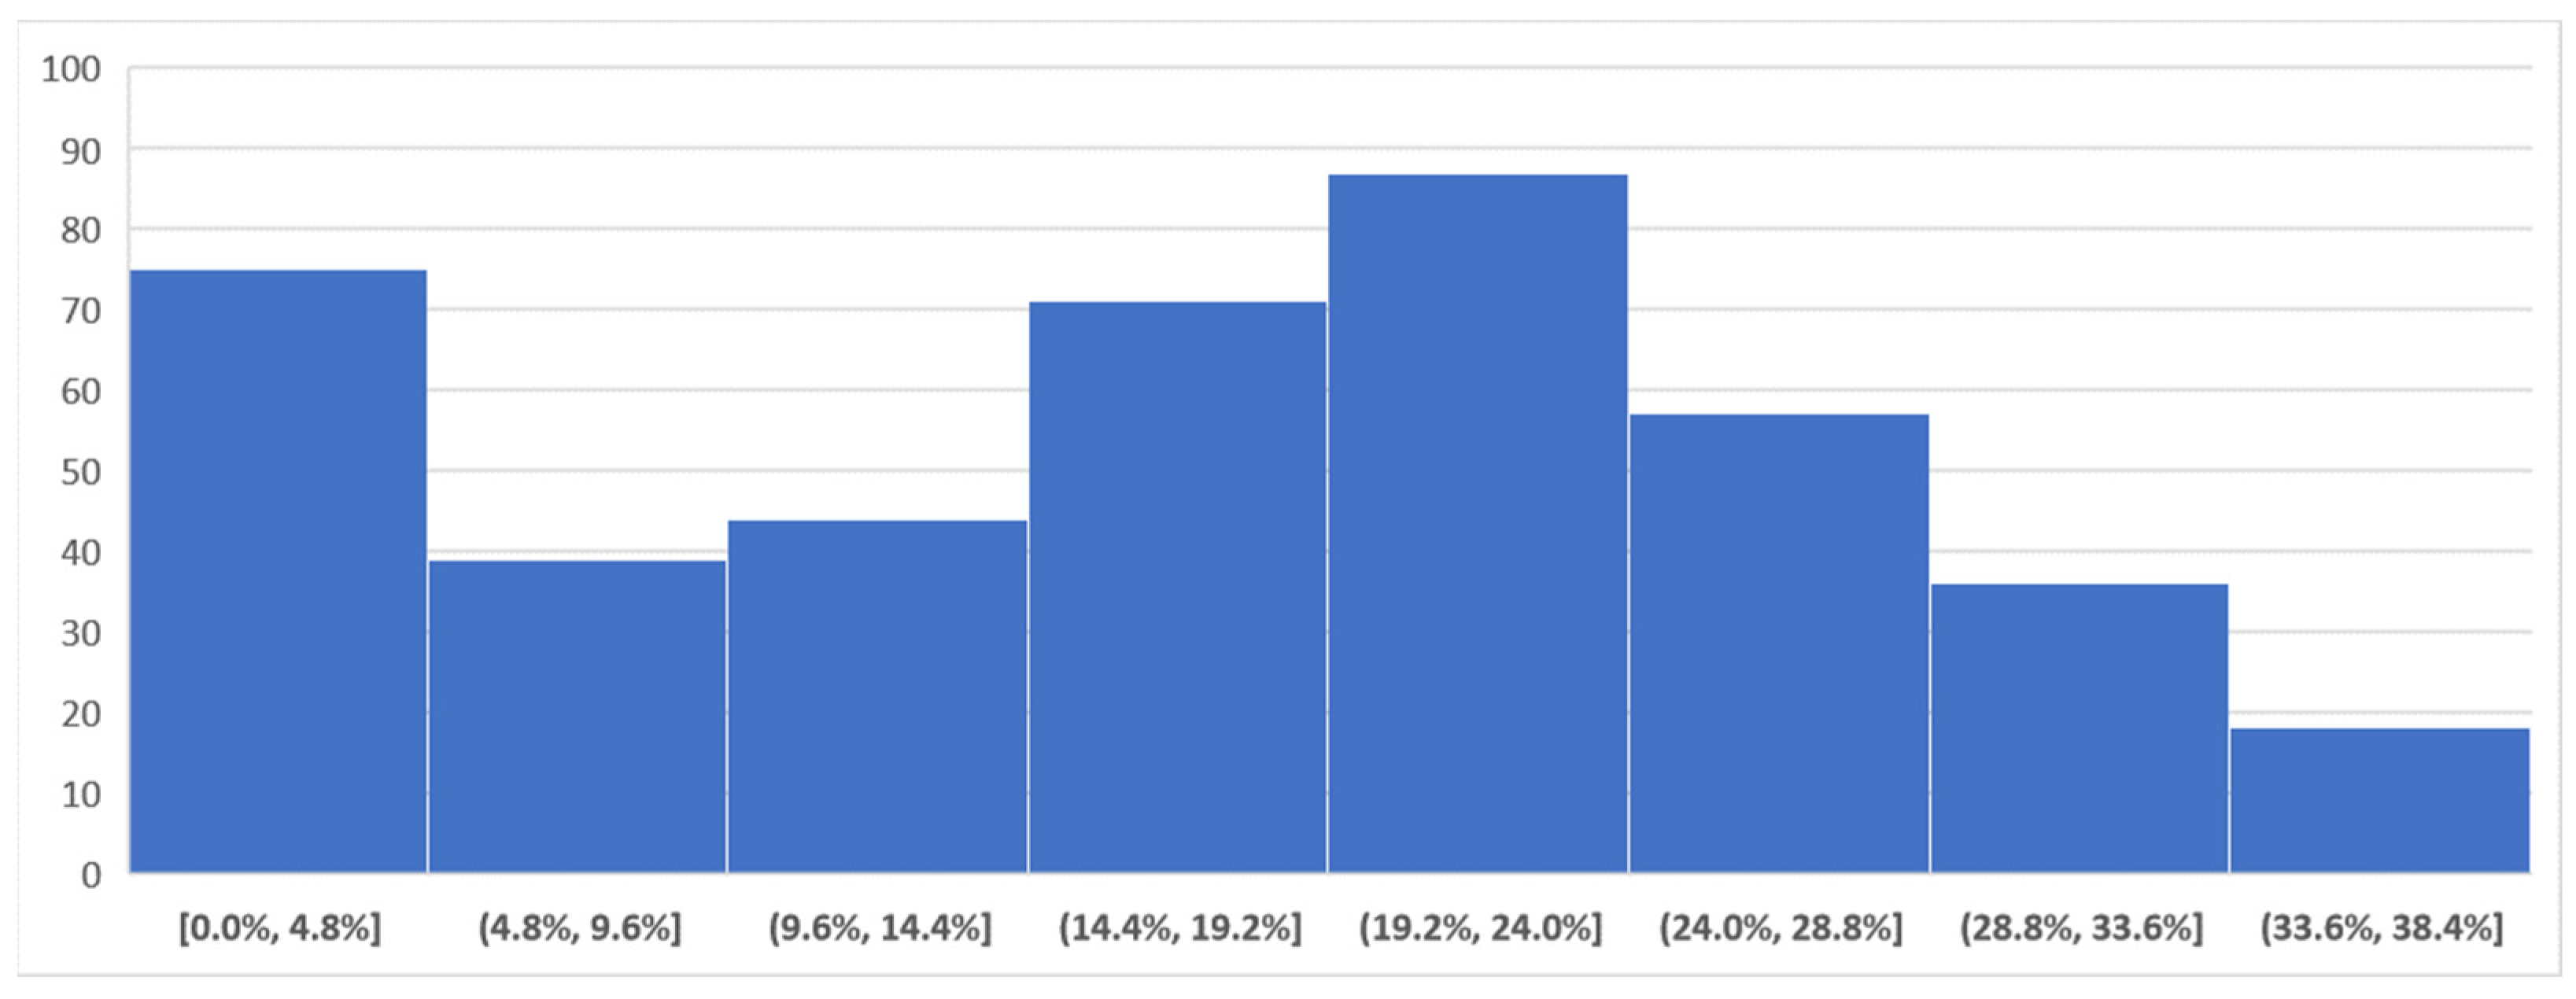
Next, we used only the VROOM solution and calculated the difference improvements in both distance and duration for all 427 routes by comparing the difference between execution and optimized routes versus execution and adapted routes. The results are presented below in
Table 2 and
Table 3 and
Figure 11,
Figure 12,
Figure 13 and
Figure 14, with an average decrease in the difference between executed routes and planned routes by 19.6% for distance and 14.2% for duration.
The improvement percent was calculated by the following formula:
where:
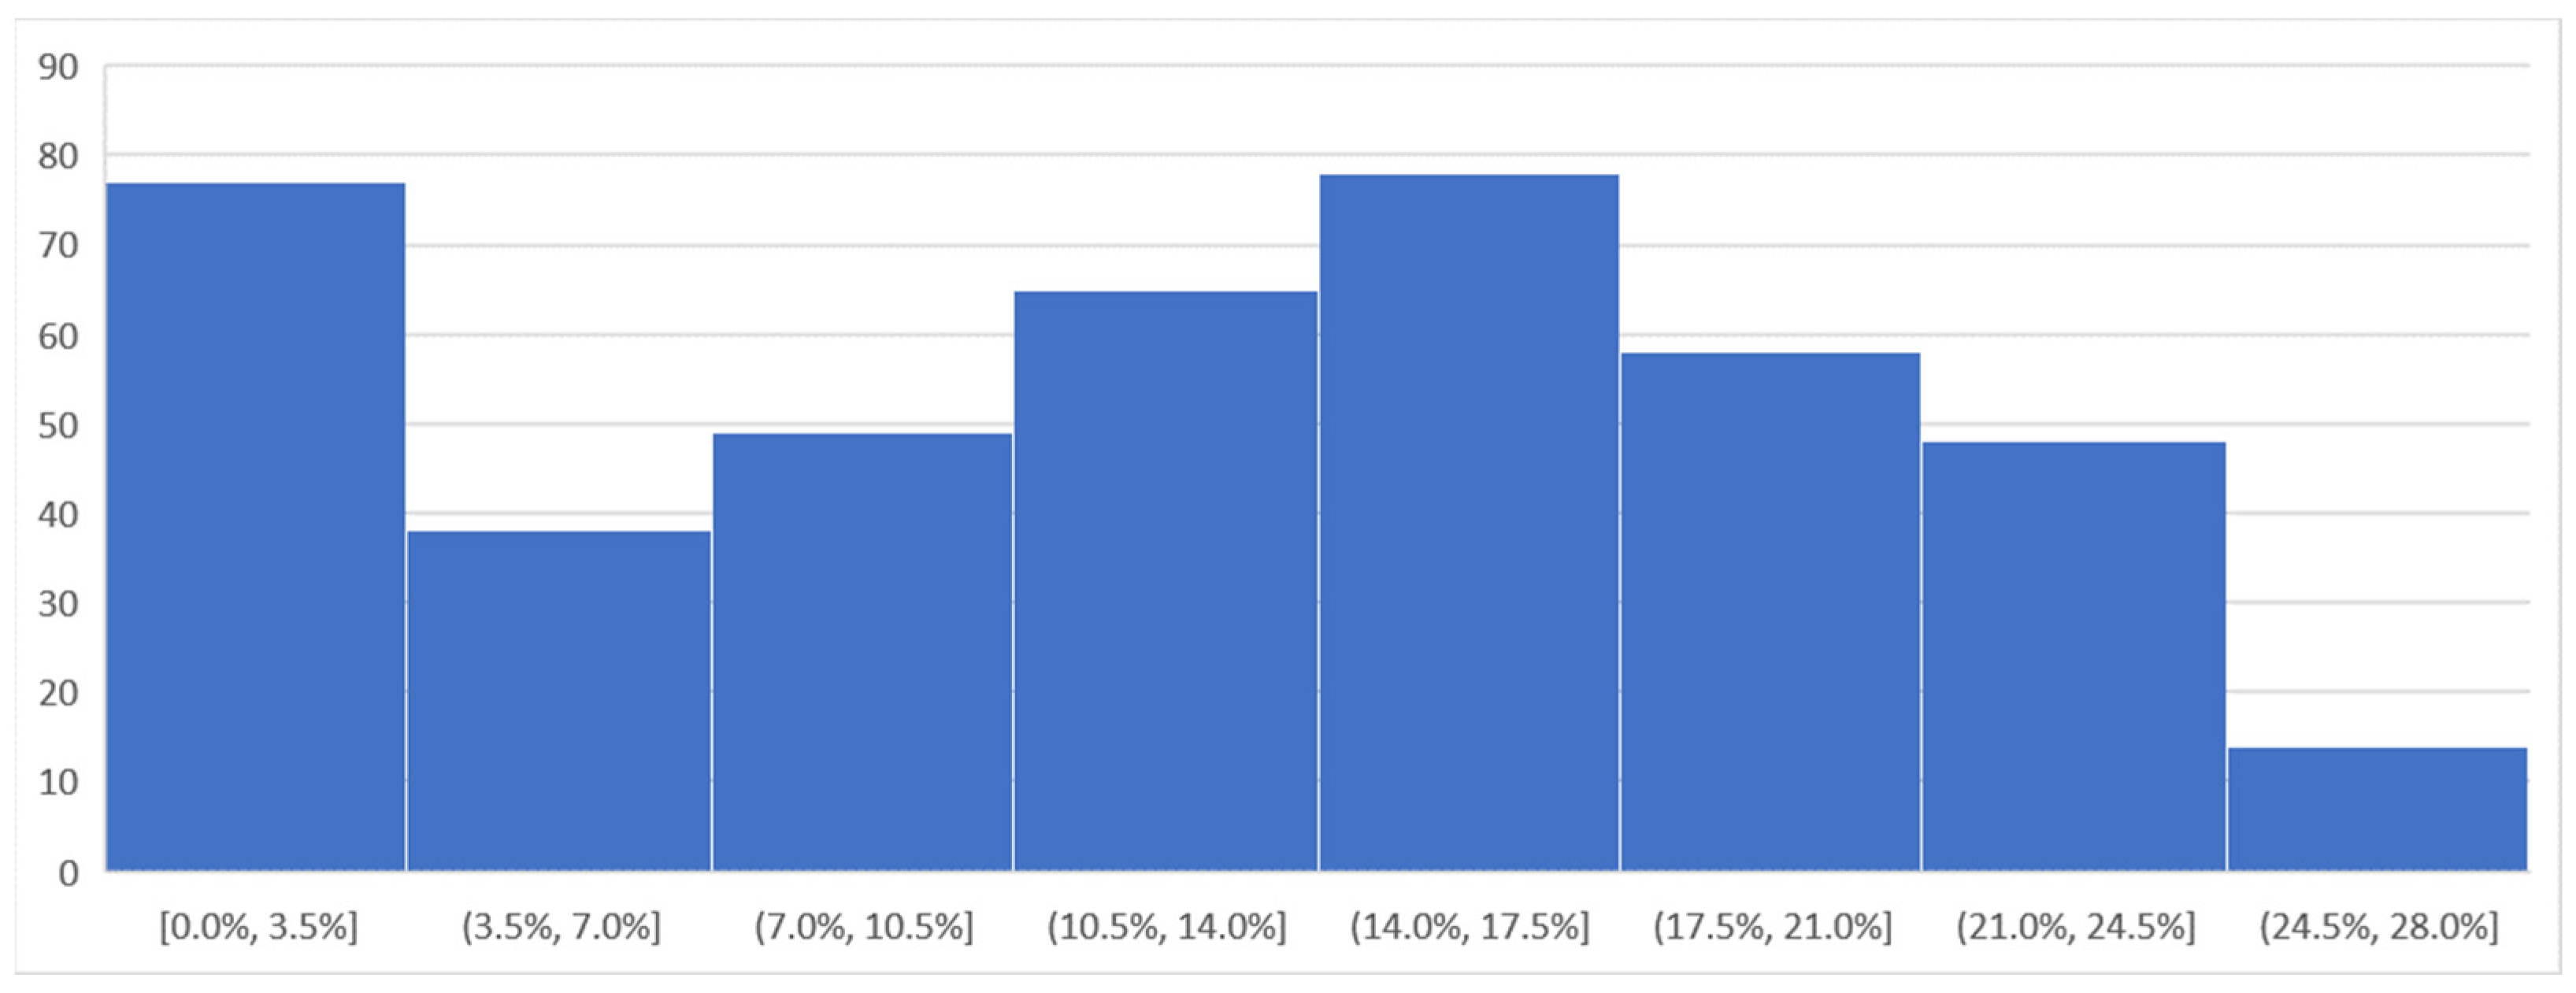
Based on these charts, we can see that the improvements are scaling between zero—for not enough historical data or when the path used was the same as the historical one—and 35%. The longer the route, the more probable it is that an improvement can be obtained, as the combination of roads to be used increases.
From the histograms, we can see that 75 routes (17.5% of 427) were not improved or had improvements of less than 5%. But, for 273 routes (63.9%) the improvements were more than 10%. That means that if a customer had used our algorithm for planning his routes, he would have better scheduled his routes and known from the start of the day when his vehicles would be available. In the long term, this knowledge is useful for a more agile strategy when taking new orders, employing more drivers, or buying more vehicles.
A more realistic plan can also increase customer satisfaction by obtaining more accurate visit schedules. The motivation of the drivers could also increase to respect the plan, as they can see that the route segments are similar to what they know can be achieved on the road.
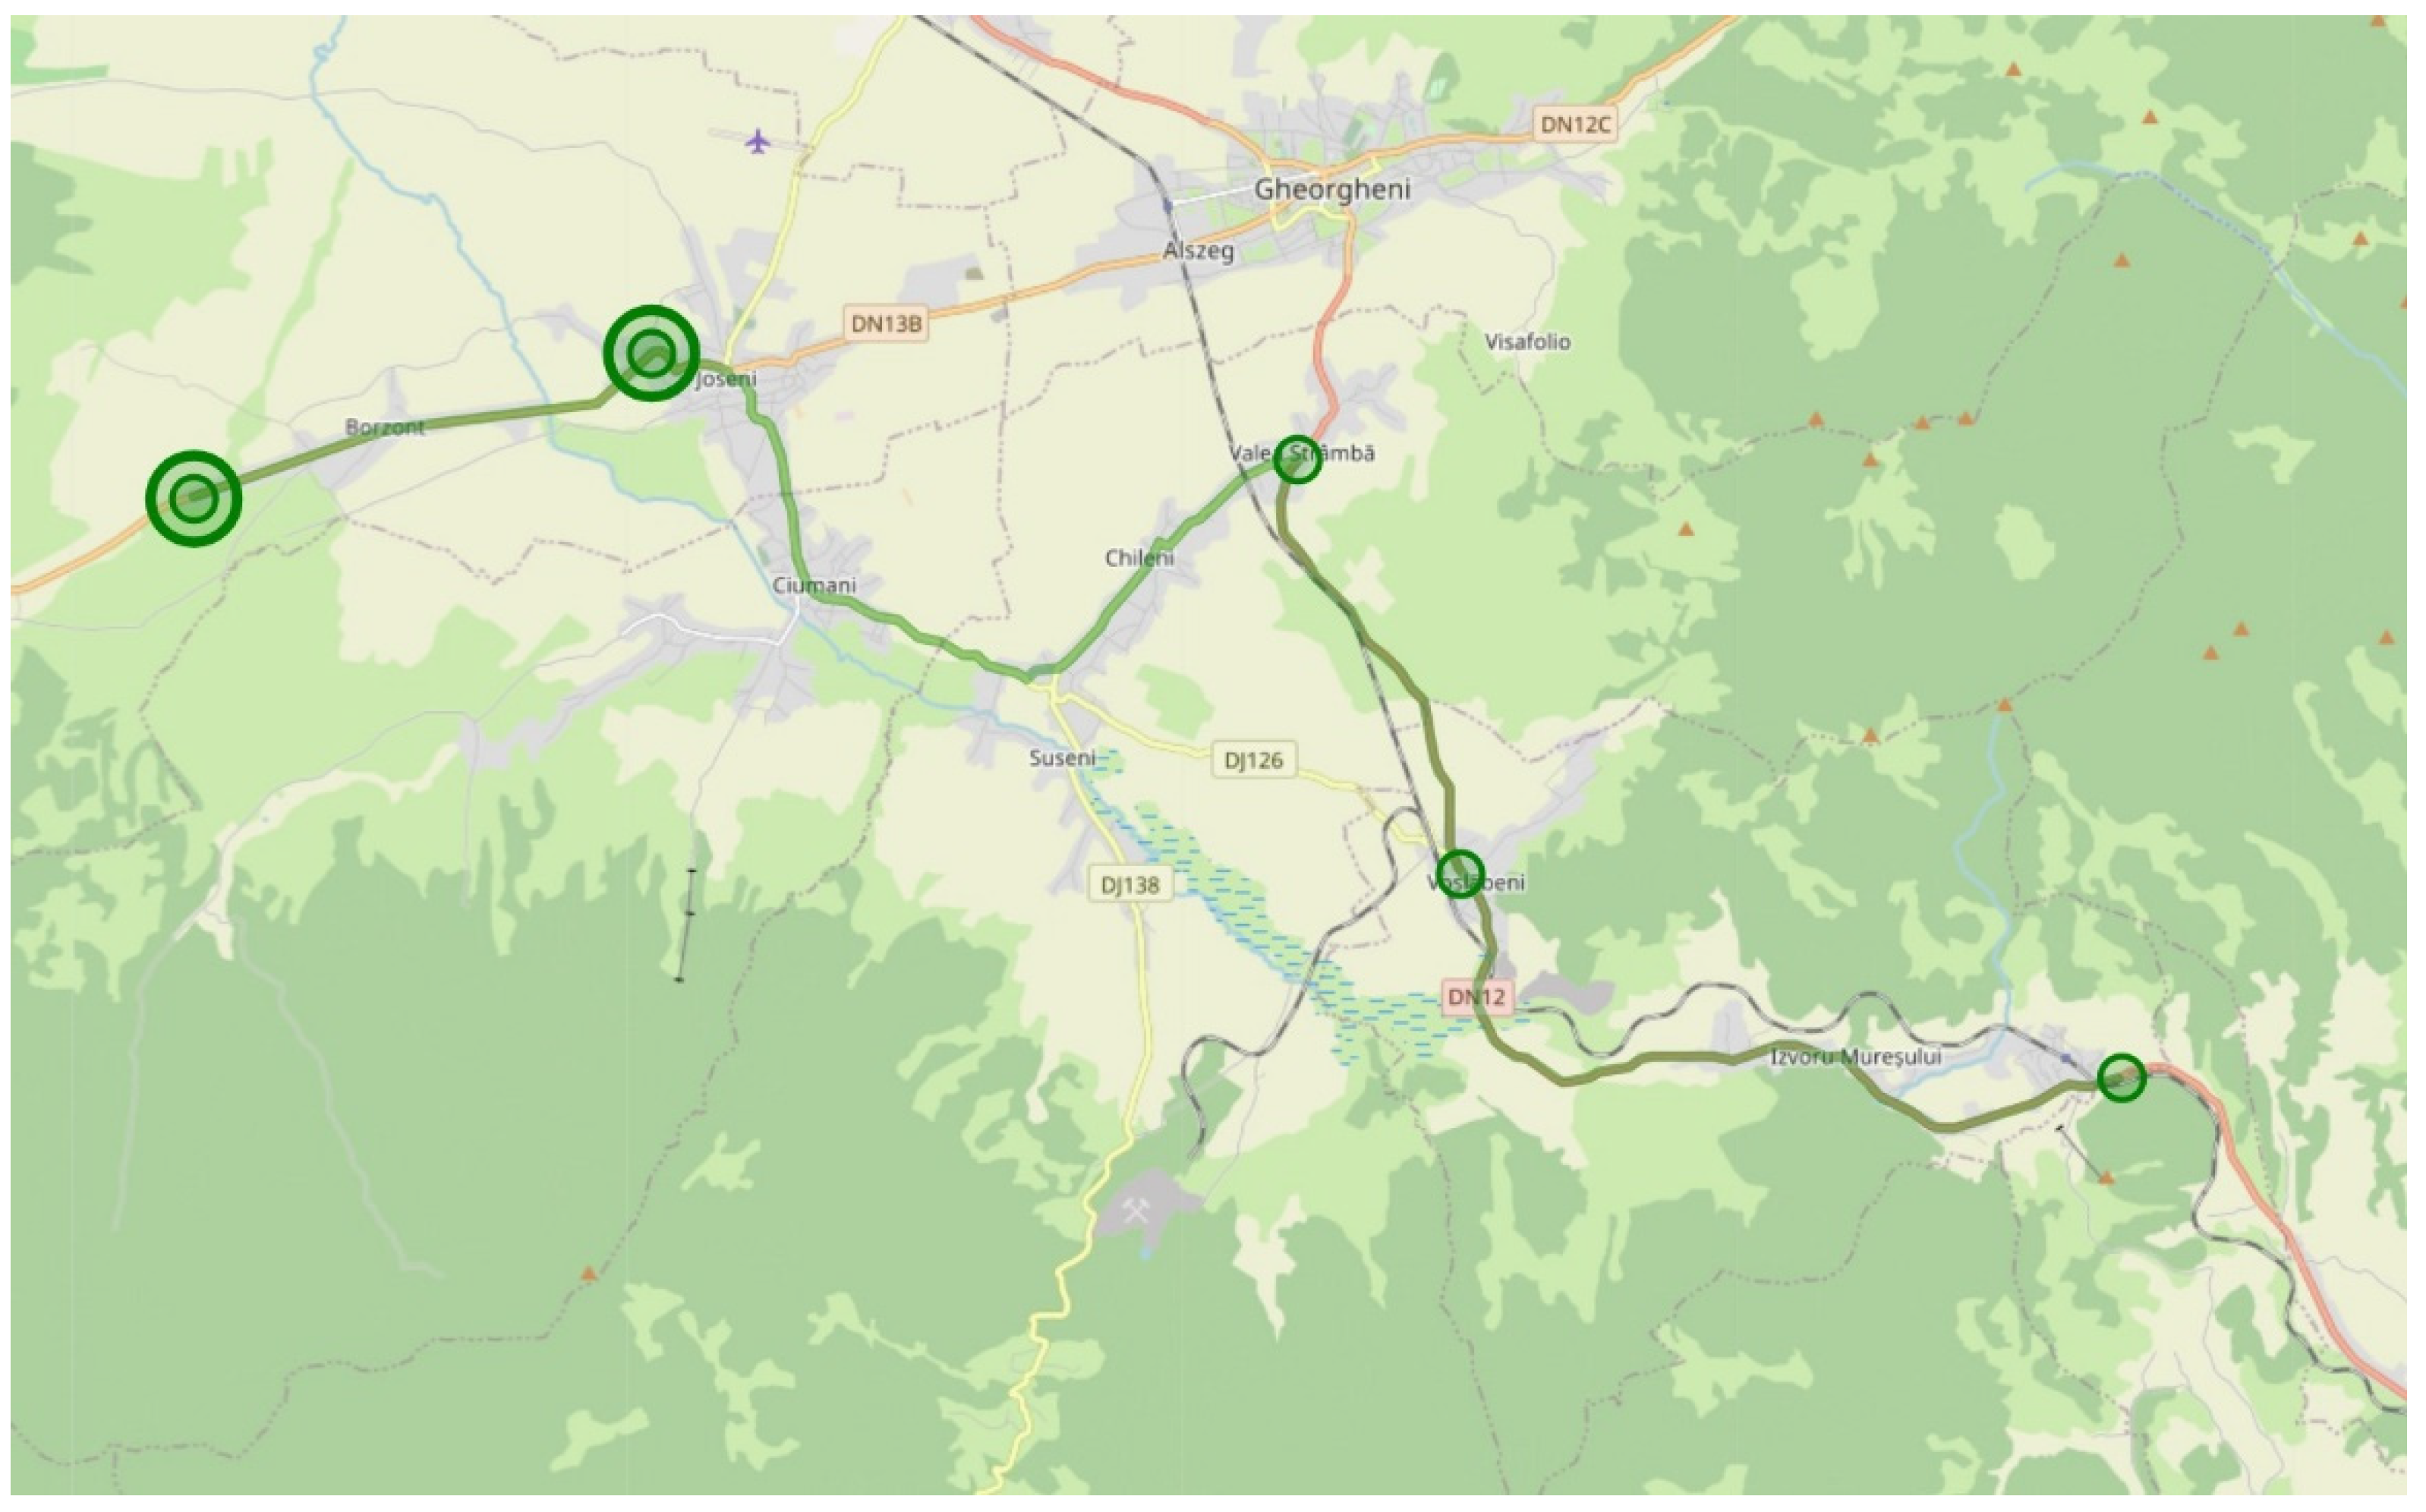
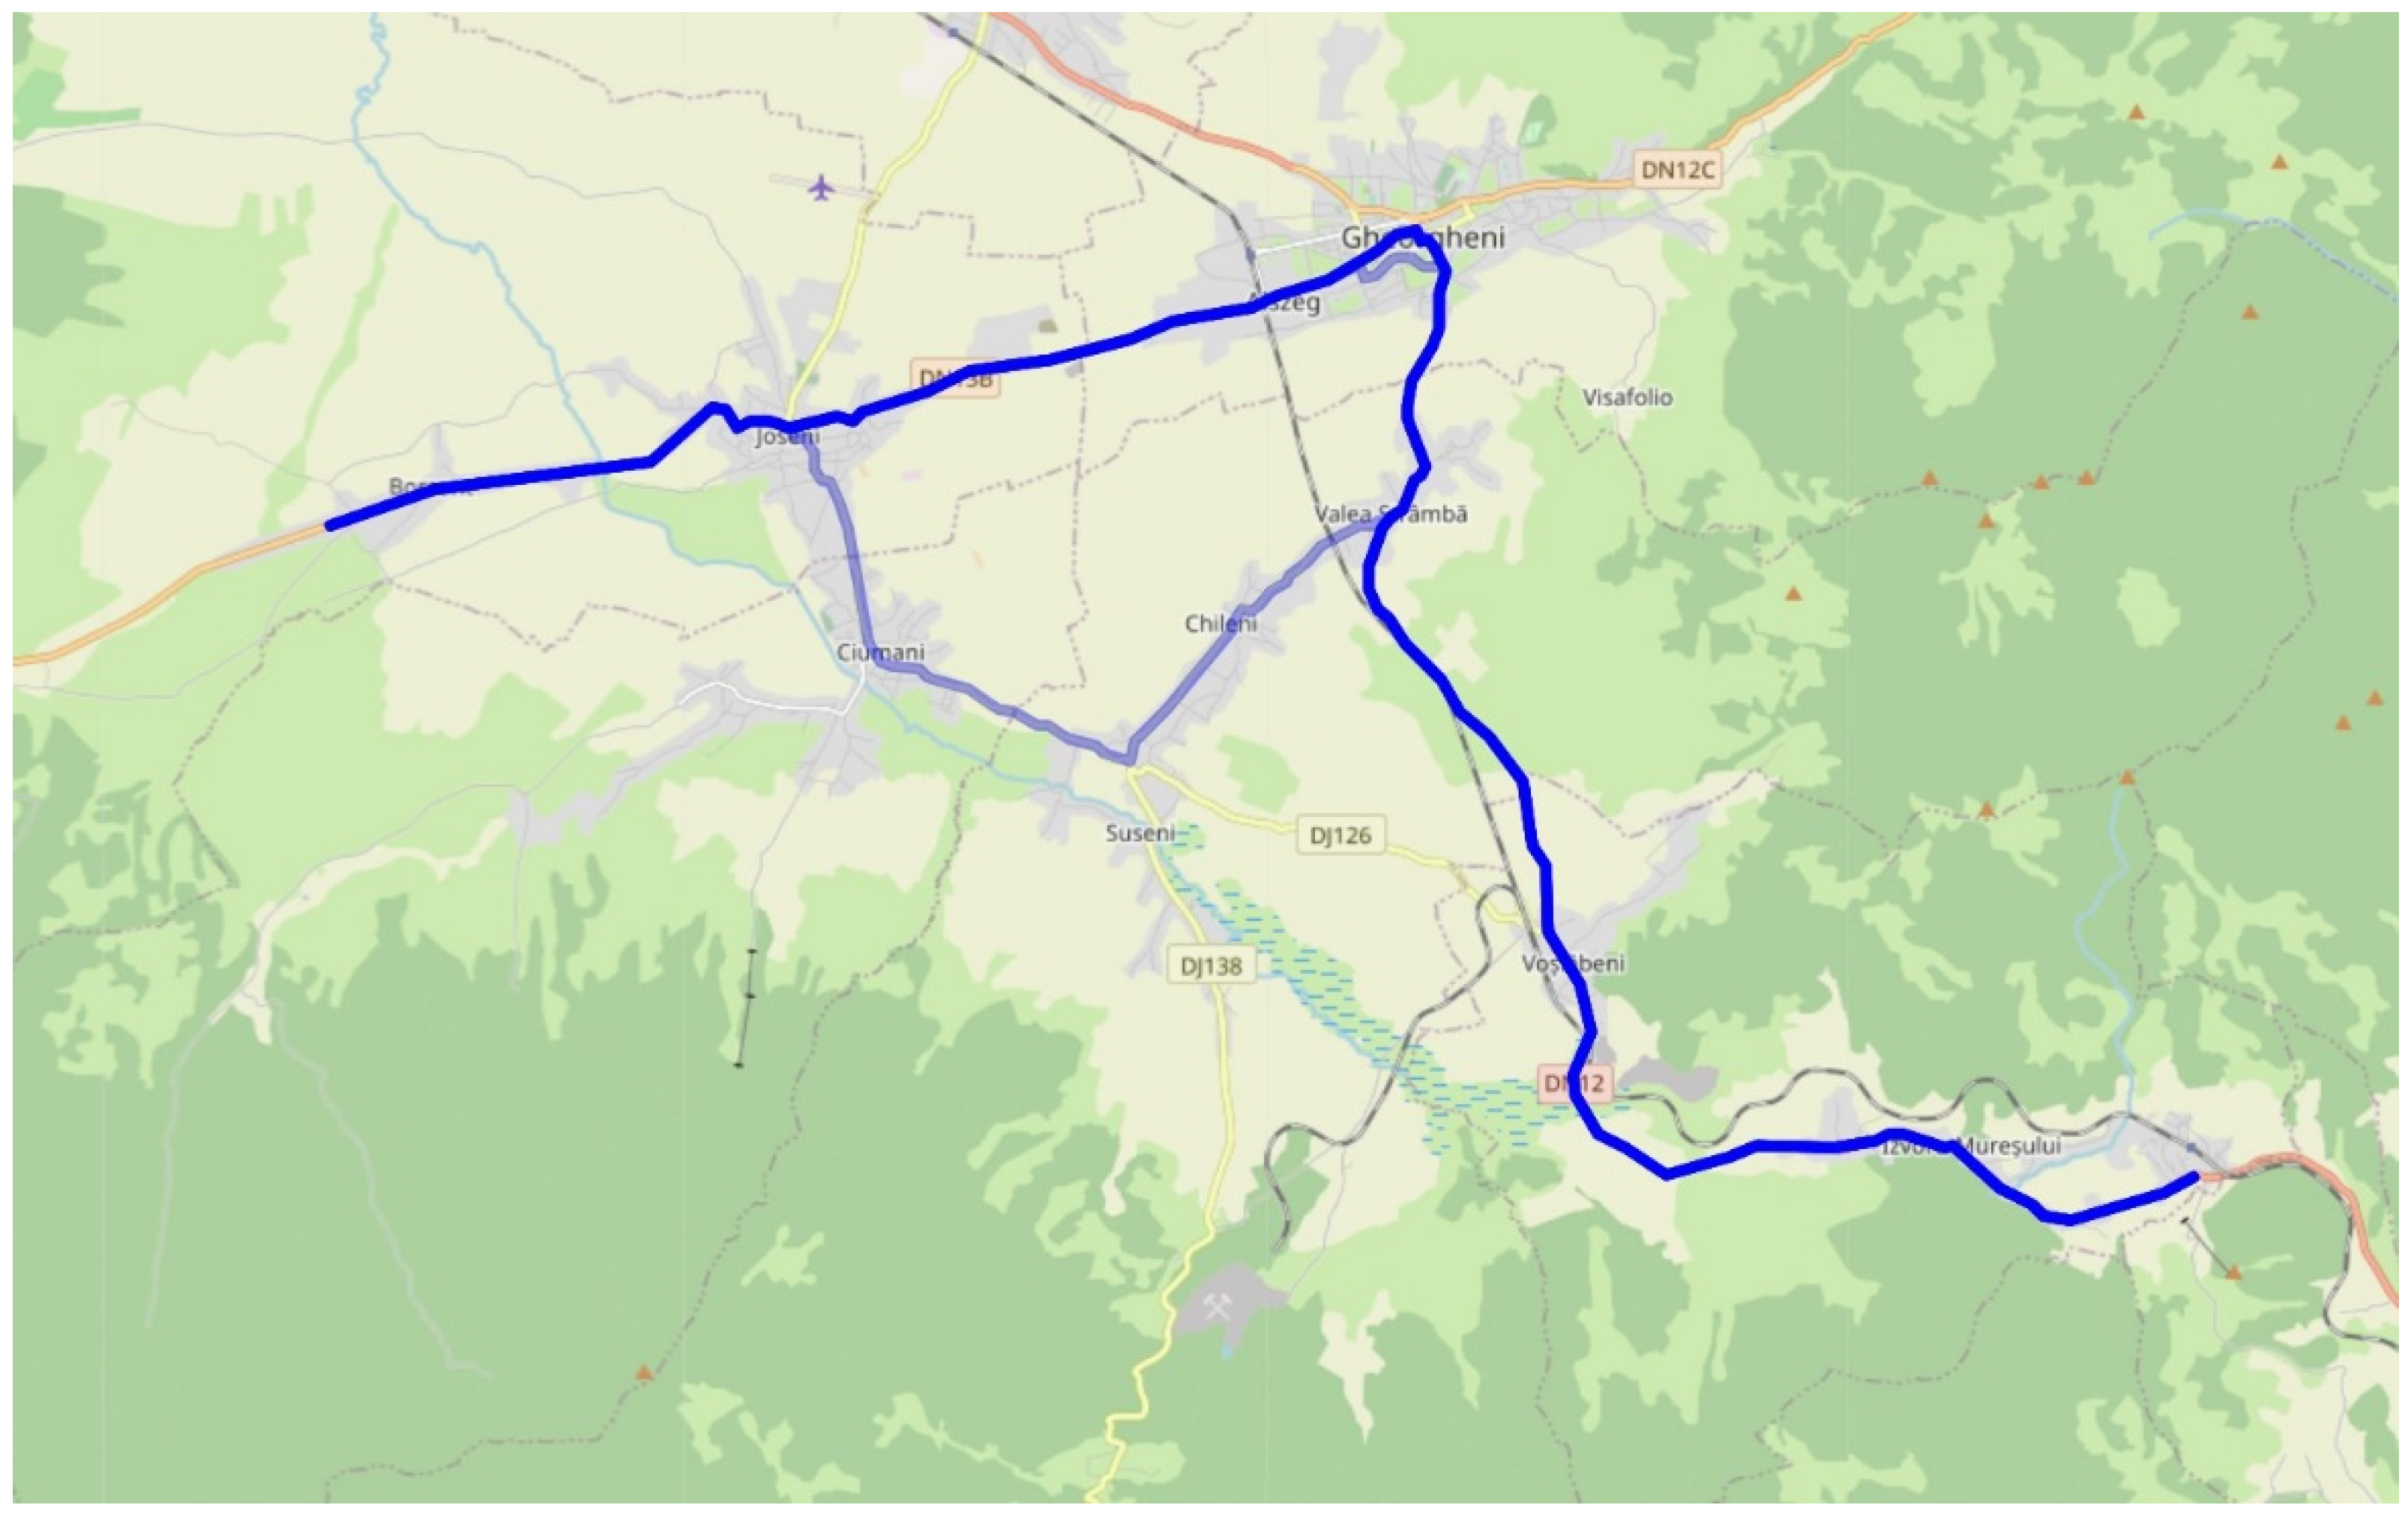
Below, we have illustrated an example of a route adaptation according to the historical tracks. The information is represented in different colors: the theoretical optimized route is green, while the historical tracks are blue and the final adapted route is red (
Figure 15,
Figure 16 and
Figure 17).
The example above illustrates a case where the historical tracks indicate that the drivers use the national road (DN12C) instead of the regional road (DJ126), even if the distance is greater (14 km vs. 12 km). The reason is that the regional road is very bad (
Figure 18), with road construction signs and lots of potholes, and the smaller distance takes 5 min more to be driven by the truck.
Our solution delivers routes that are more accurate, reliable, and efficient than other traditional solutions. While we may not find the fastest routes, our routes are more likely to be followed by drivers and result in a smaller difference between planned and executed routes. This benefits our customers by offering their end customers a reliable estimated time of arrival, increasing drivers’ adoption of the solution, and improving customer satisfaction. Nonetheless, driving on known roads reduces the risk of driving events by avoiding road hazards that a driver frequently driving in that region might know.
- (C)
Validate the solution with customers
To validate the need for our solution approach in the logistics business, we conducted a quantitative survey with 68 business owners in this industry. The questions are presented in
Appendix B. The survey was about the experience of the respondents with planning solutions, feedback about the differences between the plan and execution, what the causes of these differences are, and how are they dealing with them. In the end, we asked about the benefits and disadvantages of an adaptive algorithm and whether they are considering evaluating such a solution.
The results of the survey are as follows:
- -
A total of 64.7% of the respondents are using a software solution for planning and monitoring the routes. That means that, on one side, there are businesses that do not have a planning solution and they can use solutions such as iRoute. On the other side, the ones that have a solution already know the shortcomings when it comes to the difference between the plan and execution and they could be convinced to try a different solution that will better suit their needs;
- -
More than 68% of the respondents visit most of their customers at least on a monthly rate. This type of customer could benefit from a solution like iRoute. Their historical routes will be available in a few months;
- -
A total of 70% of the respondents have a difference between the execution and plan for more than 10%. Only 15% have differences of less than 10%. The rest do not know what the difference is as they probably do not use a solution that shows them this indicator;
- -
The main reasons for these differences were the longer stops, the road conditions, and the road traffic. The first reason is not addressed by our algorithm (yet), but the latter two can be reduced by using iRoute;
- -
The most voted-for benefit of an adaptive algorithm was better predictability, followed by increased customer satisfaction;
- -
Next, we asked about the downsides of using an adaptive algorithm and the most voted-for one was that it needs historical execution data to be used. For this, we will try to find other sources of historical data to be used in the beginning, such as road traffic patterns, anonymously using data from other customers in the same area, and so on;
- -
A total of 73.5% of the respondents are willing to evaluate a solution such as iRoute.
From this survey, we can see that the companies would need a solution that uses our adaptive algorithm, as they need better predictability in their daily schedule and need to know if their drivers are using the company resources in the most sustainable way possible.
6. Conclusions
Small and medium-sized enterprises managing a transport fleet have a great interest in optimizing their operational costs. Those companies face difficulties in implementing a solution for optimizing vehicle routes using existing algorithms. Current affordable solutions have limitations, such as a very limited number of stops or vehicles that can be planned, and the existing customer applications cannot be integrated into these solutions.
In this article, we presented a new scalable and easy-to-tailor solution using an optimized algorithm that offers more realistic planned routes, in such a way that drivers will have a route execution time that is close to the planned route time. The algorithm validation was performed over 6 months using 28 vehicles and 427 different routes. For experimental results, the distance and duration of initially planned routes were compared with the executed routes. A duration decrease of 14.2% and an average distance decrease of 19.6% were observed.
Our integrated platform is a complete software-to-hardware solution that provides clients with all the necessary tools to make their business more competitive in transportation logistics. Vehicles have installed a hardware telematics component that transmits data in real time to a communications server. Drivers receive adapted optimized routes in their mobile application and the users with the dispatcher role use the web application for route planning and route monitoring. If needed, the solution can be easily integrated with the client’s existing solutions through web services.
The goal of the IRoute solution is not to provide the customers with the best optimization percentages from the market. Many solutions can do that with more or less success. What we are proposing to customers is to have a solution that they can rely on when they are planning their day-by-day business. It is more useful for a business to know with great precision what their delivery fleet can deliver/collect in a specific timeframe than to use a theoretical plan based on theoretical or not-up-to-date road conditions that can promise better results but are hard to achieve by the drivers. The risks of driving on a road with hazards (potholes, construction sections) can be reduced if we take into consideration the driver’s knowledge of the daily road path used. In the end, every business should rely on the sustainable usage of its resources for long-term business continuity.
As for future work, we want to add new features to the algorithm so it becomes more adaptable to each customer’s business. One of the manual activities that takes up the dispatcher’s time is the validation of the executed path. For this, we will implement an AI method to identify normal detours versus drivers taking deliberately longer paths for her/his interest. Also, after obtaining enough historical data we could adapt the minimum parameters to increase the similar historical paths from 10 to 20, 50, and 100 before using them to adapt the current route. Also, when obtaining diverse historical data we could take into consideration the time of day, the day of the week, month, or season, or any other benchmark indicator to identify similar conditions with the current route.
Author Contributions
Conceptualization, F.A., C.V.M., D.A.M., N.G. and A.V.; Methodology, F.A., C.V.M., D.A.M., N.G. and A.V.; Software, F.A., V.R., D.M. and D.S.; Validation, F.A., C.V.M., D.A.M., N.G., A.V., V.R., D.M. and D.S.; Formal analysis, F.A.; Investigation, F.A., C.V.M., D.A.M., N.G. and A.V.; Resources, F.A., C.V.M., D.A.M., N.G. and A.V.; Data curation, F.A.; Writing—original draft, F.A., C.V.M., D.A.M., N.G. and A.V.; Writing—review & editing, F.A., C.V.M., D.A.M., N.G. and A.V.; Visualization, F.A., C.V.M., D.A.M., N.G. and A.V.; Supervision, F.A., C.V.M., D.A.M., N.G. and A.V.; Project administration, F.A., N.G., A.V. and C.V.M.; Funding acquisition, F.A. and N.G. All authors have read and agreed to the published version of the manuscript.
Funding
This scientific research project, within Innovation Programme—European Cooperation Eureka—Eurostars Subprogramme, was funded by a grant of the Romanian Ministry of Education and Research, UEFISCDI, project number PN-III-P3-3.5-EUK-2019-0210 contract number 191/2020.
Institutional Review Board Statement
Not applicable.
Informed Consent Statement
Not applicable.
Data Availability Statement
Not applicable.
Conflicts of Interest
The authors declare no conflict of interest.
Appendix A. Pseudocode of the Adaptive Algorithm for Route Planning Using Historical Tracks
currentOptimalRoute = get_current_optimal_route();
relevantHistoricalRoutes[] = get_relevant_historical_list_routes(currentOptimizalRoute); |
| |
| function historical_adapted_optimal_route() do |
| |
for i <= 0, currentOptimalRoute.visits do
optimalPath = optimizedTrack(i,i + 1);
//get the initial optimized track |
| |
if (check_historical_data(optimzedRoute.visit[i], optimzedRoute.visit[i + 1]) ) do
//check if we have sufficient (N >=10 tracks) historical data trails between the two visits |
| |
if (historicalPath = calculate_common_historical_path (currentOptimalRoute.visit[i], currentOptimalRoute.visit[i + 1])) do
//calculate the common historical path and check that the majority of the historical paths contain it |
| |
if (shapeSimilarity(optimalPath, historicalPath) < 0.8) do
//shapeSimilarity is an external function from curve matcher of David Chanin Github repository) |
| |
currentOptimalRoute.path[i,i + 1] = historicalPath;
//overwrite the current optimized route path with the historicalRoute
end for i |
| |
| end function |
| |
function calculate_common_historical_path(index1, index2) do
maxSimilarHistoricalPaths = 0;
bestCommonHistoricalPath = 0; |
| |
for i <= 0, relevantHistoricalRoutes [].size do
for j <= i + 1, relevantHistoricalRoutes [].size do |
| |
numberSimilarPaths = 0;
historicalPathSimilarity[i,j] = shapeSimilarity(relevantHistoricalRoutes[i].path(index1, index2), relevantHistoricalRoutes [j].path(index1, index2);
//save the similarity ratio for the two paths in a matrix; |
| |
if (historicalPathSimilarity[i,j])
numberSimilarPaths ++;
end for j |
| |
if (maxSimilarHistoricalPaths < numberSimilarPaths) do
maxSimilarHistoricalPaths = numberSimilarPaths
bestCommonHistoricalPath = i;
end if |
| |
| end for i; |
| |
if (maxSimilarHistoricalPaths >= relevantHistoricalRoutes[].size/2)
return relevantHistoricalRoutes [bestCommonHistoricalPath].path(index1,index2);
else
return null;//no common historical path was found for the current segment |
| |
| end function |
Appendix B. Quantitative Survey
We will show 2 random answers—respondent 16 and respondent 50, to better illustrate the received feedback.
Answer R16: Romania
Answer R50: Slovenia
- 2
Do you use a software solution for planning and monitoring the execution of your fleet routes?
- 3
How often do you visit most of your customers?
Answer R16: Weekly
Answer R50: Monthly
- 4
Do your drivers use a mobile application to get details about the route he/she needs to execute?
Answer R16: Yes
Answer R50: No
- 5
What average difference in terms of distance or duration do you get between planned routes and executed routes?
-
they are almost the same
±5–10%
I don’t know
±10–20%
±20–30%
more than 30%
Answer R16: ±10–20%
Answer R50: I don’t know
- 6
What are the reasons for getting differences between planned and execution?
| Strongly agree |
| Strongly agree |
| Strongly agree |
| Strongly agree |
| Neither agree nor disagree |
| Disagree |
| Disagree |
| Neither agree nor disagree |
| Neither agree nor disagree |
| Neither agree nor disagree |
| Neither agree nor disagree |
| Agree |
| Agree |
| Neither agree nor disagree |
| Disagree |
| Agree |
- 7
How do you manage these differences in your daily route plan?
| Almost never |
| Never |
| Almost never |
| Almost never |
| Neither agree nor disagree |
| Occasionally |
| Almost every time |
| Almost every time |
| Occasionally |
| Almost never |
- 8
If you were to use a software solution that would try to adapt the optimized routes based on the historical execution of your routes, what benefits would you get if the difference between planned and execution would decrease?
| Agree |
| Agree |
| Agree |
| Agree |
| Disagree |
| Agree |
| Neither agree nor disagree |
| Strongly agree |
| Agree |
| Neither agree nor disagree |
- 9
If you were to use a software solution that would try to adapt the optimized routes based on the historical execution of your routes, what disadvantages do you think that such a solution would bring?
| Neither agree nor disagree |
| Agree |
| Neither agree nor disagree |
| Agree |
| Neither agree nor disagree |
| Agree |
| Strongly Agree |
| Neither agree nor disagree |
| Agree |
| Neither agree nor disagree |
- 10
Would you be interested in testing such a software solution?
Answer R16: Yes
Answer R50: Yes
References
- Dopson, L.R.; Hayes, D.K. Food and Beverage Cost Control Study Guide; Wiley: Hoboken, NJ, USA, 2015. [Google Scholar]
- Lagorio, A.; Pinto, R.; Golini, R. Research in urban logistics: A systematic literature review. Int. J. Phys. Distrib. Logist. Manag. 2016, 46, 908–931. [Google Scholar] [CrossRef]
- Alarcon-Gerbier, E.; Buscher, U. Integrated Scheduling of Production and Distribution Operations with Site Selection. In Logistics Management. Lecture Notes in Logistics; Bierwirth, C., Kirschstein, T., Sackmann, D., Eds.; Springer: Cham, Switzerland, 2019. [Google Scholar] [CrossRef]
- Groër, C.; Golden, B.; Wasil, E. The Consistent Vehicle Routing Problem. Manuf. Serv. Oper. Manag. 2008, 11, 630–643. [Google Scholar] [CrossRef]
- Yang, S. A Self-adaptive Quantum Genetic Algorithm for Vehicle Routing and Scheduling. In Proceedings of the IEEE 5th International Conference on Computer and Communications (ICCC), Chengdu, China, 6–9 December 2019; pp. 1–7. [Google Scholar] [CrossRef]
- Chen, B.; Li, C.; Zeng, S.; Yang, S.; Mavrovouniotis, M. An Adaptive Evolutionary Algorithm for Bi-Level Multi-objective VRPs with Real-Time Traffic Conditions. In Proceedings of the IEEE Symposium Series on Computational Intelligence (SSCI), Orlando, FL, USA, 5–7 December 2021; pp. 1–8. [Google Scholar] [CrossRef]
- Sbai, I.; Limem, O.; Krichen, S. An Adaptive Genetic Algorithm for the Capacitated Vehicle Routing Problem with Time Windows and Two-Dimensional Loading Constraints. In Proceedings of the IEEE/ACS 14th International Conference on Computer Systems and Applications (AICCSA), Hammamet, Tunisia, 30 October–3 November 2017; pp. 88–95. [Google Scholar] [CrossRef]
- Li, J.; Su, Z.; Tan, S.; Hu, H. Arctangent Adaptive Inertia Weight Particle Swarm Optimization for Logistics Distribution Route Planning. In Proceedings of the 8th International Conference on Intelligent Computing and Signal Processing (ICSP), Xi’an, China, 21–23 April 2023; pp. 1383–1386. [Google Scholar] [CrossRef]
- Anghelache, F.; Mitrea, D.A.; Goga, N.; Vasilateanu, A.; Radulescu, V.; Scurtu, D.; Musat, D.; Pavaloiu, B. A quantitative research for determining the user requirements for an innovative route planning system targeted for the commercial vehicle fleets. In Proceedings of the 13th International Conference on Electronics, Computers and Artificial Intelligence (ECAI), Pitesti, Romania, 1–3 July 2021; pp. 1–4. [Google Scholar] [CrossRef]
- Karimi, H.; Seifi, A. Analytic center stabilization of column generation algorithm for the capacitated vehicle routing problem. Optim. Methods Softw. 2015, 30, 1109–1125. [Google Scholar] [CrossRef]
- Borcinova, Z. Two models of the capacitated vehicle routing problem. Croat. Oper. Res. Rev. 2017, 8, 463–469. [Google Scholar] [CrossRef]
- Lahyani, R.; Khemakhem, M.; Semet, F. Rich vehicle routing problems: From a taxonomy to a definition. Eur. J. Oper. Res. 2015, 241, 1–14. [Google Scholar] [CrossRef]
- Pecin, D.; Pessoa, A.; Poggi, M.; Uchoa, E. Improved branch-cut-and-price for capacitated vehicle routing. Math. Prog. Comp. 2017, 9, 61–100. [Google Scholar] [CrossRef]
- Zhao, Y.; Leng, L.; Qian, Z.; Wang, W. A Discrete Hybrid Invasive Weed Optimization Algorithm for the Capacitated Vehicle Routing Problem. Procedia Comput. Sci. 2016, 91, 978–987. [Google Scholar] [CrossRef]
- Kuo, R.J.; Zulvia, F.E. Hybrid genetic ant colony optimization algorithm for capacitated vehicle routing problem with fuzzy demand—A case study on garbage collection system. In Proceedings of the 4th International Conference on Industrial Engineering and Applications (ICIEA), Nagoya, Japan, 21–23 April 2017; pp. 244–248. [Google Scholar] [CrossRef]
- Guloyan, G.; Aydin, R. Optimization of Capacitated Vehicle Routing Problem for Recyclable Solid Waste Collection Using Genetic and Seed Genetic Algorithms Hybridized with Greedy Algorithm. In Proceedings of the IEEE International Conference on Industrial Engineering and Engineering Management (IEEM), Singapore, 14–17 December 2020; pp. 595–599. [Google Scholar] [CrossRef]
- Yan, X.; Li, W.; Huang, Y.; Mahmoodi, S. An Adaptive Parameter for Max-Min Elite Ant System to Solve CVRP Problem. In Proceedings of the 17th International Conference on Computational Intelligence and Security (CIS), Chengdu, China, 19–22 November 2021; pp. 580–584. [Google Scholar] [CrossRef]
- Mar, F.; Mahmudy, W.F.; Santoso, P.B. Hybrid Particle Swarm Optimization and Simulated Annealing for Capacitated Vehicle Routing Problem. In Proceedings of the International Conference on Sustainable Information Engineering and Technology (SIET), Lombok, Indonesia, 28–30 September 2019; pp. 66–71. [Google Scholar] [CrossRef]
- Mingprasert, S.; Masuchun, R. Adaptive artificial bee colony algorithm for solving the capacitated vehicle routing problem. In Proceedings of the 9th International Conference on Knowledge and Smart Technology (KST), Chonburi, Thailand, 1–4 February 2017; pp. 23–27. [Google Scholar] [CrossRef]
- Yesodha, R.; Amudha, T. An Improved Firefly Algorithm for Capacitated Vehicle Routing Optimization. In Proceedings of the Amity International Conference on Artificial Intelligence (AICAI), Dubai, United Arab Emirates, 4–6 February 2019; pp. 163–169. [Google Scholar] [CrossRef]
- Souza, I.P.; Boeres, M.C.S.; Moraes, R.E.N. A robust algorithm based on Differential Evolution with local search for the Capacitated Vehicle Routing Problem. Swarm Evol. Comput. 2023, 77, 101245. [Google Scholar] [CrossRef]
- Clementino, T.; Rosas, J.; De Freitas, R.; Uchoa, E. Solving real urban VRPTW instances by applying a Branch-Cut-and-Price via VRPsolver. In Proceedings of the 2022 XVLIII Latin American Computer Conference (CLEI), Armenia, Colombia, 17–21 October 2022; pp. 1–8. [Google Scholar] [CrossRef]
- Nalepa, J.; Blocho, M. Adaptive memetic algorithm for minimizing distance in the vehicle routing problem with time windows. Soft Comput. 2016, 20, 2309–2327. [Google Scholar] [CrossRef]
- Zhong-yue, S.; Zhong-liang, G.; Qin, W. An improved adaptive genetic algorithm for vehicle routing problem. In Proceedings of the International Conference on Logistics Systems and Intelligent Management (ICLSIM), Harbin, China, 9–10 January 2010; pp. 116–120. [Google Scholar] [CrossRef]
- Göçken, T.; Yaktubay, M.; Kiliç, F. Improvement of a genetic algorithm approach for the solution of vehicle routing problem with time windows. In Proceedings of the International Artificial Intelligence and Data Processing Symposium (IDAP), Malatya, Turkey, 16–17 September 2017; pp. 1–8. [Google Scholar] [CrossRef]
- Yan, X.; Tan, L.; Chen, J.; Li, B. A Multi-Strategy Elite Ant System Algorithm for Vehicle Routing Problem with Time Window. In Proceedings of the IEEE 3rd International Conference on Information Systems and Computer Aided Education (ICISCAE), Dalian, China, 27–29 September 2020; pp. 215–220. [Google Scholar] [CrossRef]
- Yu, V.F.; Susanto, H.; Jodiawan, P.; Ho, T.-W.; Lin, S.-W.; Huang, Y.-T. A Simulated Annealing Algorithm for the Vehicle Routing Problem with Parcel Lockers. IEEE Access 2022, 10, 20764–20782. [Google Scholar] [CrossRef]
- Kalina, P.; Vokřínek, J. Parallel solver for vehicle routing and pickup and delivery problems with time windows based on agent negotiation. In Proceedings of the IEEE International Conference on Systems, Man, and Cybernetics (SMC), Seoul, Republic of Korea, 14–17 October 2012; pp. 1558–1563. [Google Scholar] [CrossRef]
- Chami, Z.A.; Manier, H.; Manier, M.-A.; Fitouri, C. A hybrid genetic algorithm to solve a multi-objective Pickup and Delivery Problem. IFAC-Pap. 2017, 50, 14656–14661. [Google Scholar] [CrossRef]
- Nalepa, J.; Blocho, M. A Parallel Memetic Algorithm for the Pickup and Delivery Problem with Time Windows. In Proceedings of the 2017 25th Euromicro International Conference on Parallel, Distributed and Network-based Processing (PDP), St. Petersburg, Russia, 6–8 March 2017; pp. 1–8. [Google Scholar] [CrossRef]
- Vehicle Routing Open-Source Optimization Machine. Available online: http://vroom-project.org/ (accessed on 14 September 2023).
- Open Street Map Elements. Available online: https://wiki.openstreetmap.org/wiki/Main_Page (accessed on 14 September 2023).
- Anghelache, F.; Mitrea, D.A.; Goga, N.; Vasilateanu, A.; Radulescu, V.; Scurtu, D.; Musat, D. Adaptive Route Planning Algorithm based on Historical Executions for Commercial Vehicle Fleets. In Proceedings of the IEEE International Conference on Blockchain, Smart Healthcare and Emerging Technologies (SmartBlock4Health), Bucharest, Romania, 24–25 October 2022; pp. 1–6. [Google Scholar] [CrossRef]
- Solomon Benchmark. Available online: https://www.sintef.no/projectweb/top/vrptw/solomon-benchmark/ (accessed on 14 September 2023).
- Gehring & Homberger Benchmark. Available online: https://www.sintef.no/projectweb/top/vrptw/homberger-benchmark/ (accessed on 14 September 2023).
Figure 1.
iRoute use case—GPS devices.
Figure 1.
iRoute use case—GPS devices.
Figure 2.
iRoute use case—customer external applications.
Figure 2.
iRoute use case—customer external applications.
Figure 3.
iRoute use case—drivers.
Figure 3.
iRoute use case—drivers.
Figure 4.
iRoute use case—dispatchers.
Figure 4.
iRoute use case—dispatchers.
Figure 5.
iRoute high-level architecture.
Figure 5.
iRoute high-level architecture.
Figure 6.
Device mounted on a vehicle.
Figure 6.
Device mounted on a vehicle.
Figure 7.
High-level architecture of web services.
Figure 7.
High-level architecture of web services.
Figure 8.
iRoute database data catalogs.
Figure 8.
iRoute database data catalogs.
Figure 9.
High-level view of the optimization engine.
Figure 9.
High-level view of the optimization engine.
Figure 10.
Algorithm flowchart.
Figure 10.
Algorithm flowchart.
Figure 11.
Statistics for distances—sample (first 30 routes).
Figure 11.
Statistics for distances—sample (first 30 routes).
Figure 12.
Statistics for durations—sample (first 30 routes).
Figure 12.
Statistics for durations—sample (first 30 routes).
Figure 13.
Histogram of difference improvement (distance).
Figure 13.
Histogram of difference improvement (distance).
Figure 14.
Histogram of difference improvement (duration).
Figure 14.
Histogram of difference improvement (duration).
Figure 15.
Initial optimized route.
Figure 15.
Initial optimized route.
Figure 16.
Historical routes (the most used track is drawn with a more opaque blue color).
Figure 16.
Historical routes (the most used track is drawn with a more opaque blue color).
Figure 17.
Initial optimized route (green) versus adapted optimized route (red).
Figure 17.
Initial optimized route (green) versus adapted optimized route (red).
Figure 18.
Potholes on a regional road (Source: Google Maps—Street View).
Figure 18.
Potholes on a regional road (Source: Google Maps—Street View).
Table 1.
Testing results—Comparison iRoute algorithm within different solutions.
Table 1.
Testing results—Comparison iRoute algorithm within different solutions.
| Route # | No. of Stops | Real Historical Execution Distance (Km) | VROOM | Google Maps | HERE Maps |
|---|
| D1 (Km) | D2 (Km) | Diff (%) | D1 (Km) | D2 (Km) | Diff (%) | D1 (Km) | D2 (Km) | Diff (%) |
|---|
| 1 | 16 | 150.41 | 109.49 | 117.48 | 19.53% | 105.56 | 107.66 | 4.69% | 105.25 | 107.94 | 5.95% |
| 2 | 12 | 126.74 | 96.72 | 101.89 | 17.22% | 105.00 | 108.68 | 16.95% | 106.27 | 108.73 | 12.04% |
| 3 | 22 | 204.51 | 153.24 | 164.16 | 21.30% | 161.45 | 170.65 | 21.36% | 162.50 | 171.25 | 20.82% |
| 4 | 10 | 114.23 | 85.61 | 89.88 | 14.92% | 97.52 | 100.17 | 15.85% | 96.94 | 100.26 | 19.20% |
| 5 | 12 | 124.89 | 93.18 | 99.31 | 19.33% | 96.39 | 99.38 | 10.52% | 94.99 | 99.54 | 15.22% |
| 6 | 8 | 98.43 | 68.44 | 75.82 | 24.61% | 74.95 | 81.45 | 27.67% | 76.19 | 81.65 | 24.55% |
| 7 | 9 | 228.29 | 168.93 | 189.84 | 35.23% | 189.76 | 196.09 | 16.44% | 188.92 | 196.35 | 18.86% |
| 8 | 18 | 146.88 | 118.97 | 123.35 | 15.69% | 120.83 | 127.97 | 27.42% | 122.72 | 128.16 | 22.50% |
| 9 | 9 | 140.01 | 131.6 | 134.34 | 32.58% | 128.23 | 128.49 | 2.24% | 126.59 | 127.15 | 4.18% |
| 10 | 10 | 230.46 | 177.45 | 191.59 | 26.67% | 174.58 | 176.57 | 3.57% | 172.41 | 174.69 | 3.93% |
| 11 | 12 | 326.37 | 280.67 | 288.75 | 17.68% | 277.44 | 282.75 | 10.85% | 276.75 | 283.30 | 13.20% |
| 12 | 14 | 358.88 | 315.81 | 315.81 | 0.00% | 345.59 | 345.59 | 0.00% | 340.23 | 340.23 | 0.00% |
| 13 | 12 | 164.78 | 136.76 | 141.64 | 17.42% | 151.08 | 151.87 | 5.76% | 150.87 | 151.27 | 2.89% |
| 14 | 18 | 99.09 | 76.29 | 76.29 | 0.00% | 83.08 | 83.08 | 0.00% | 83.68 | 83.68 | 0.00% |
| 15 | 5 | 325.19 | 305.67 | 311.62 | 30.48% | 317.99 | 320.22 | 30.93% | 318.59 | 320.28 | 25.57% |
| 16 | 6 | 154.59 | 128.3 | 134.69 | 24.31% | 145.77 | 148.29 | 28.58% | 148.30 | 149.38 | 17.22% |
| 17 | 6 | 335.41 | 258.26 | 273.09 | 19.22% | 247.57 | 271.92 | 27.72% | 251.08 | 272.34 | 25.21% |
| 18 | 12 | 328.34 | 233.12 | 253.68 | 21.59% | 259.07 | 275.44 | 23.63% | 262.33 | 276.20 | 21.01% |
| 19 | 6 | 122.87 | 115.49 | 115.97 | 6.50% | 116.30 | 118.57 | 34.61% | 115.83 | 117.16 | 18.85% |
| 20 | 22 | 143.03 | 101.55 | 112.28 | 25.87% | 114.43 | 120.10 | 19.84% | 114.78 | 120.24 | 19.34% |
| | Average | 21.68% | Average | 18.26% | Average | 16.14% |
Table 2.
Distance improvement.
Table 2.
Distance improvement.
| Route # | No. of Locations | Distance of Planned Optimized Route—Standard Solutions
(km) | Distance of Planned Adapted Route—iRoute Solution
(km) | Distance of Real Executed Route
(km) | Difference Improvement |
|---|
| [1] | [2] | [3] | [4] | [5] | [6] |
| 1 | 16 | 109.49 | 117.48 | 150.41 | 19.53% |
| 2 | 12 | 96.72 | 101.89 | 126.74 | 17.22% |
| 3 | 22 | 153.24 | 164.16 | 204.51 | 21.30% |
| 4 | 10 | 85.61 | 89.88 | 114.23 | 14.92% |
| 5 | 12 | 93.18 | 99.31 | 124.89 | 19.33% |
| 6 | 8 | 68.44 | 75.82 | 98.43 | 24.61% |
| … | | | | | |
| 427 | 18 | 120.78 | 127.87 | 157.72 | 19.19% |
| | | | | Average | 19.60% |
Table 3.
Duration improvement.
Table 3.
Duration improvement.
| Route # | No. of Locations | Duration of Planned Optimized Route—Standard Solutions
(minutes) | Duration of Planned Adapted Route—iRoute Solution
(minutes) | Duration of Real Executed Route
(minutes) | Difference Improvement |
|---|
| [1] | [2] | [3] | [4] | [5] | [6] |
| 1 | 16 | 153.21 | 161.48 | 204.23 | 16.21% |
| 2 | 12 | 114.05 | 117.78 | 146.14 | 11.62% |
| 3 | 22 | 217.24 | 228.14 | 293.31 | 14.33% |
| 4 | 10 | 88.21 | 91.02 | 112.41 | 11.61% |
| 5 | 12 | 103.25 | 107.11 | 131.34 | 13.74% |
| 6 | 8 | 89.26 | 91.81 | 111.03 | 11.71% |
| … | | | | | |
| 427 | 18 | 192.37 | 201.31 | 249.24 | 15.72% |
| | | | | Average | 14.20% |
| Disclaimer/Publisher’s Note: The statements, opinions and data contained in all publications are solely those of the individual author(s) and contributor(s) and not of MDPI and/or the editor(s). MDPI and/or the editor(s) disclaim responsibility for any injury to people or property resulting from any ideas, methods, instructions or products referred to in the content. |
© 2023 by the authors. Licensee MDPI, Basel, Switzerland. This article is an open access article distributed under the terms and conditions of the Creative Commons Attribution (CC BY) license (https://creativecommons.org/licenses/by/4.0/).


 ,
, 


