2.1. The Cognitive Architecture CAAI
The CAAI was developed in the research project “Kognitive Architektur für Cyber-physische Produktionssysteme und Industrie 4.0” (KOARCH) (
https://www.th-koeln.de/informatik-und-ingenieurwissenschaften/koarch---kognitive-architektur-fuer-cyber-physische-produktionssysteme-und-industrie-40_56155.php (accessed on 16 October 2023)). KOARCH was established due to the lack of standardized architectures for AI applications in the industry. As a result, specialists often develop and implement their own architectures for various problems, which can be complex and costly. The KOARCH project aims to develop a reference architecture for production systems that can track a given use case (optimization, predictive maintenance, etc.), using an AI-based cognitive module. The architecture should meet general requirements, such as reliability, flexibility, generalizability, and adaptability. Furthermore, 12 specific requirements were defined at the beginning of the project [
6]. These requirements are listed in
Table 1.
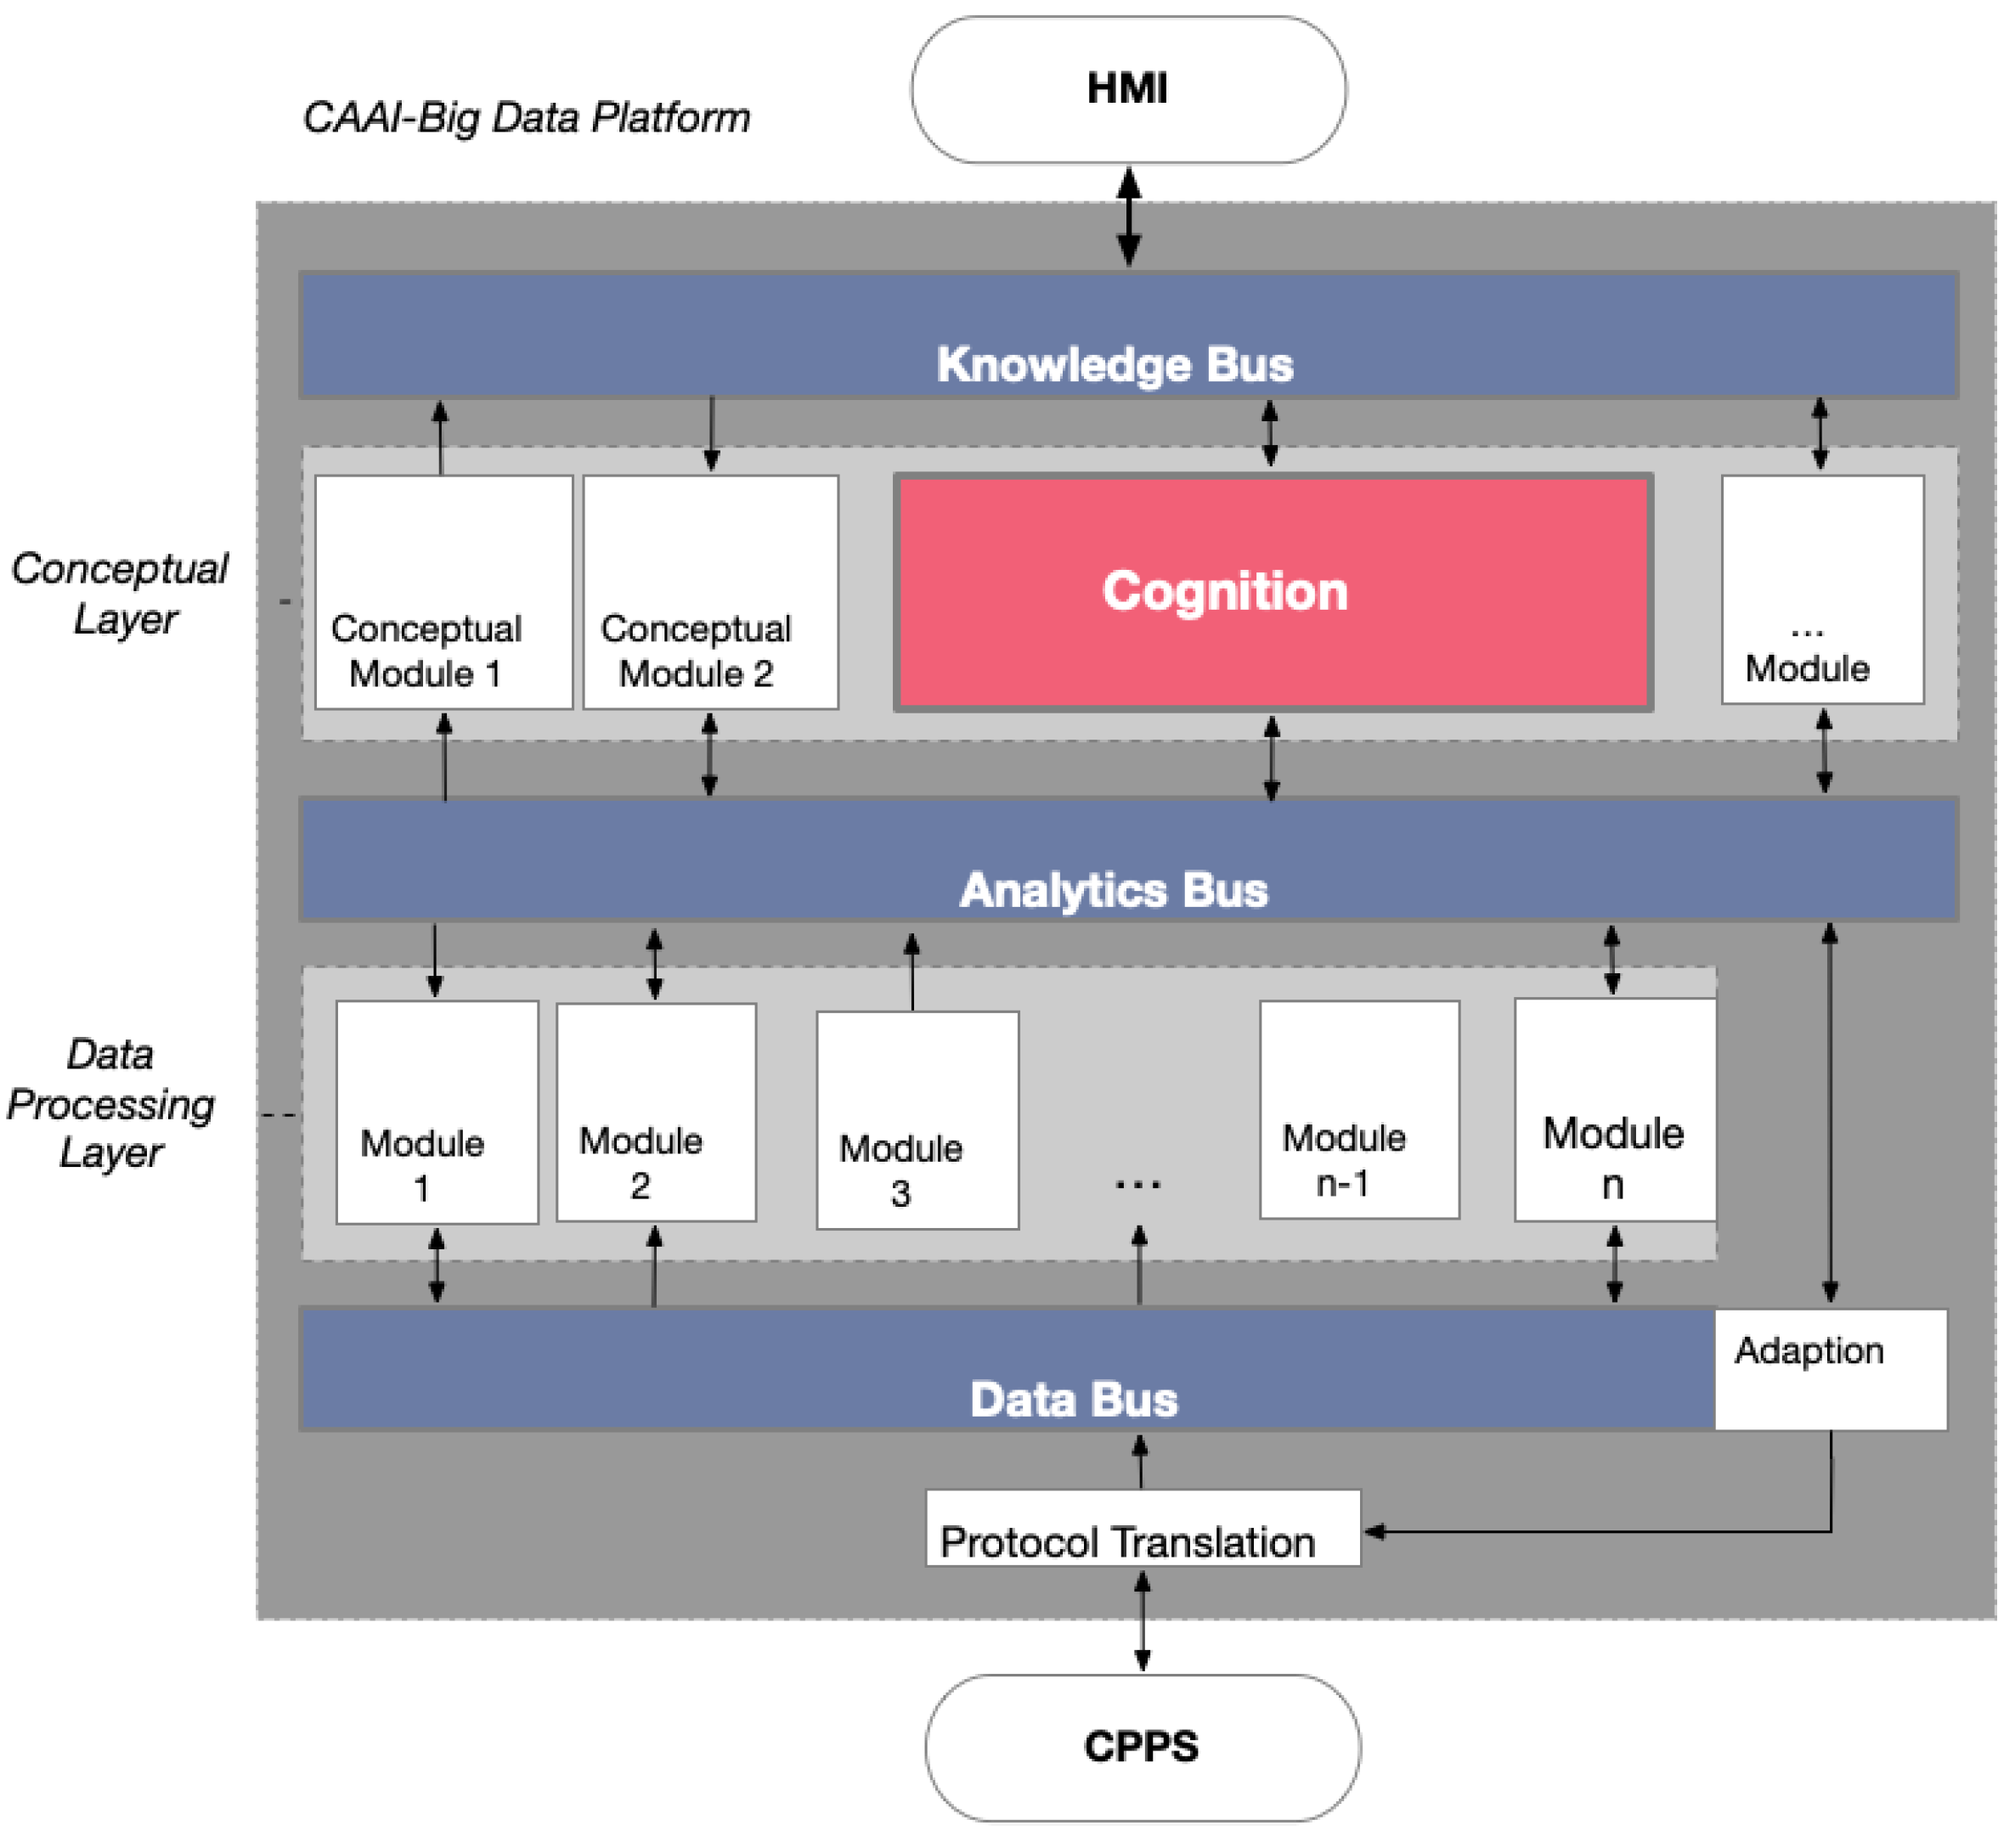
The idea of the KOARCH project was to develop an architecture that meets these requirements, based on a BDP. This BDP is mapped in
Figure 1. By looking at the structure of the architecture, it can be seen that the different components are realized via different modules. This modularization of the CAAI allows for flexible adaptation or extension. A virtualized container is used for every module or component of the BDP. Kubernetes is used as a framework to orchestrate the different micro-services. The BDP is divided into two main layers: the conceptual layer and the data processing layer. The modules of these layers communicate via three different buses. Raw data from the CPPS, demonstrators, or external simulation modules enter the BDP via the data bus. Cleaned and preprocessed data are transported back to the data bus by the preprocessing module, to be forwarded to other modules of the data processing layer. The analytics bus ensures connection between the modules of the data processing layer and the conceptual layer. Results transmitted here have significantly higher information density than those from the data bus. The most influential component is the cognition module, located in the conceptual layer. It compiles pipelines for suitable algorithms based on overall goals and boundary conditions. The knowledge bus is responsible for communication between the Human–Machine Interface (HMI) and the conceptual layer, transmitting user commands and goals, as well as for reporting of the process and results to the user.
The idea is that the users can define one or more higher-level goals, such as optimization, anomaly detection, predictive maintenance, etc. Additionally, they can establish constraints for the process. These constraints include the definition of signals that the algorithm utilizes as features for the respective algorithm, as well as limits for the associated values. Moreover, target-dependent settings can be configured. For instance, in an optimization application, the objective function and the optimization goal (minimization or maximization) can be specified.
During the subsequent step, the cognitive module forms processing pipelines based on the selected objective. It selects appropriate preprocessing steps and algorithms. For decision making, the cognitive module relies on simulation data and experience from similar, previously developed applications. Moreover, SMBO has been implemented, to achieve maximum performance of the algorithms.
The evaluation of the architecture was performed using a Versatile Production System (VPS). This VPS is located in a laboratory of the Ostwestfalen-Lippe University of Applied Sciences (TH OWL). The VPS is a modular production system that processes corn, to produce popcorn and package it. The use case involves optimizing the efficiency of the popcorn packaging process. The goal is to reduce the amount of corn used and to maximize the volume of the popcorn. To achieve this objective, various algorithms, including Regression Trees, Kriging models, and other algorithms in BML configurations, were benchmarked. It is important to note that the VPS is solely a test setup within the smart factory at the university. It does not represent a real-world production system and is exclusively utilized for demonstration purposes. During the retrospective evaluation of the architecture, it became apparent that the CAAI performs well for fixed tasks. However, an individual implementation effort is still required for each use case. These findings will be detailed in a forthcoming paper.
During the detailed analysis of the architecture, it was observed that a critical category of algorithms, namely OML algorithms, had not been incorporated in the implementation. The configuration of the CPPS creates an ideal environment for the deployment of OML algorithms. The production system machinery generates continuous streams of data. Implementing OML strategies would mean these vast quantities of data would not need to be stored, alleviating storage demands. Furthermore, the system could flexibly and swiftly adapt to concept drifts. Therefore, the primary focus of this article was to evaluate the potential and effectiveness of integrating OML algorithms within the CPPS context and to demonstrate the importance of integrating OML capabilities into the CAAI framework. The comparison of BML and OML in the context of a real-world application is unprecedented in this field of research.
2.2. The Need for Online Machine Learning
The volume of data generated from various sources has increased enormously in recent years (“Big Data”). Technological advances have enabled the continuous collection of data. Sensor data, web data, social media data, share prices, search queries, clickstream data, operational monitoring data, online advertising, mobile data, and the Internet of Things data are referred to as streaming data. Streaming data, or streams of data, is an infinite and continuous flow of data from a source, often arriving at very high speeds. Therefore, streaming data is a subset of Big Data. In addition to the increased frequency, streaming data and static data also differ, in that the former have less structure. Streaming data are loosely structured, volatile (only available once), and always “flowing” data. They require real-time or near-real-time analysis. As the data stream is constantly being produced and never ends, it is not possible to store this enormous amount of data and only then carry out analyses on it (as with batch data).
The classical BML approach boils down to the following [
7]:
Loading and pre-processing the train data;
Fitting a model to the data;
Calculating the performance of the model on the test data.
This procedure has certain disadvantages. Batch learning models are not suitable for handling streaming data, since multiple passes over the data are not possible. The batch models may soon become outdated due to concept drifts (i.e., data distribution changes over time). Furthermore, BML has problems regarding storage requirements, unknown data, and accessibility of data, which will be discussed next.
For example, in the case of energy consumption forecasts, the previously known consumption values are only one element that is required for the modeling. In practice, future demand is driven by a range of non-stationary forces—such as climate variability, population growth, or disruptive clean energy technologies—that may require both gradual and sudden domain adjustment. Therefore, prediction, classification, regression, or anomaly detection approaches should be able to detect and respond to conceptual deviations in a timely manner, so that the model can be updated as quickly as possible. Although BML models can be retrained regularly, this is infeasible in many situations because the training is too expensive.
Another problem for BML is that it cannot incorporate new data containing unknown attributes. When new data are made available, the model has to be learned from scratch with a new dataset composed of the old data and the new data. This is particularly difficult in a situation where new data and attributes come in every day, every hour, every minute or even with every measurement, as is the case for production processes.
The enormous amount of data can lead to another problem, where the dataset size exceeds the available amount of RAM. Possible solutions include the optimization of data types (sparse representations), the usage of a partial dataset (“out-of-core learning”), i.e., the data are divided into blocks or mini-batches, or the application of highly simplified models.
Last but not least, data accessibility is a problem for BML: each time the BML model is trained, features must be extracted. The problem is that some features are no longer available after some time, e.g., because they were overwritten or simply deleted. This means that features that were still available last week may no longer be available at the current time. In general, it is not always possible to provide all data at the same time and in the same place. In addition to these issues, BML and especially deep learning algorithms can cause high energy costs.
The challenges of streaming data led to the development of a class of methods known as incremental or online learning methods. The introduction of different methods of online learning/incremental learning has been quite slow over the years, but the situation is now changing [
8,
9,
10]. The point of incremental learning is to fit an ML model to a data stream. In other words, the data are not available in their entirety, but the observations are provided one at a time. This way, the models can be updated incrementally before the data are discarded. The axioms for stream learning, which form the foundation of OML, can be derived from the following requirements [
9]:
Each instance can only be used once;
The processing time is severely limited;
The memory is limited (“sublinear in the length of the stream”);
The algorithm must be able to deliver a result at any time (“anytime property”);
Data streams are assumed to change over time, i.e., the data sources are not stationary.
2.2.1. OML Methods
There are many ML models that can be adapted to OML implementations. For example, online linear regression is a popular method in OML. Stochastic Gradient Descent (SGD) is used to update the coefficients in the implementation of an online linear regression model, as not all data are available at once. SGD is commonly used to train neural networks.
Tree-based algorithms are also popular in OML. Trees have nodes for testing attributes, usually by comparison, and branches for storing the test results and making predictions (of a class in classification or a value in regression). One challenge with streaming data is the high storage requirements, as it is impossible to save all data. Trees allow for compact representation, making them popular methods in OML. A BML tree reuses instances to calculate the best splitting attributes (“splits”). Therefore, using BML decision tree methods like Classification And Regression Tree (CART) is not effective in a streaming data context. Instead, Hoeffding trees are used in OML. They do not reuse instances but wait for new instances to arrive [
11]. As an incremental decision tree learner, a Hoeffding tree is better suited to a streaming data context. It is based on the idea that a small sample is often sufficient to select an optimal splitting attribute, supported by the statistical result known as the Hoeffding bound. The Hoeffding tree converges to a tree generated by a BML algorithm with sufficiently large data [
9]. However, streaming data can be very noisy, affecting performance (in terms of prediction accuracy) and potentially generating very large trees. Several extensions of the basic Hoeffding tree exist, such as Hoeffding Anytime Trees that work similarly but use a modified splitting procedure.
The Hoeffding Adaptive Tree (HAT) [
12] is an extension of the Hoeffding tree, incorporating a mechanism for identifying concept drift. It employs an instance of the ADWIN [
13] concept drift detector at each decision node, to monitor potential shifts in data distribution.
2.2.2. The Evaluation Frame: How to Compare the Methods
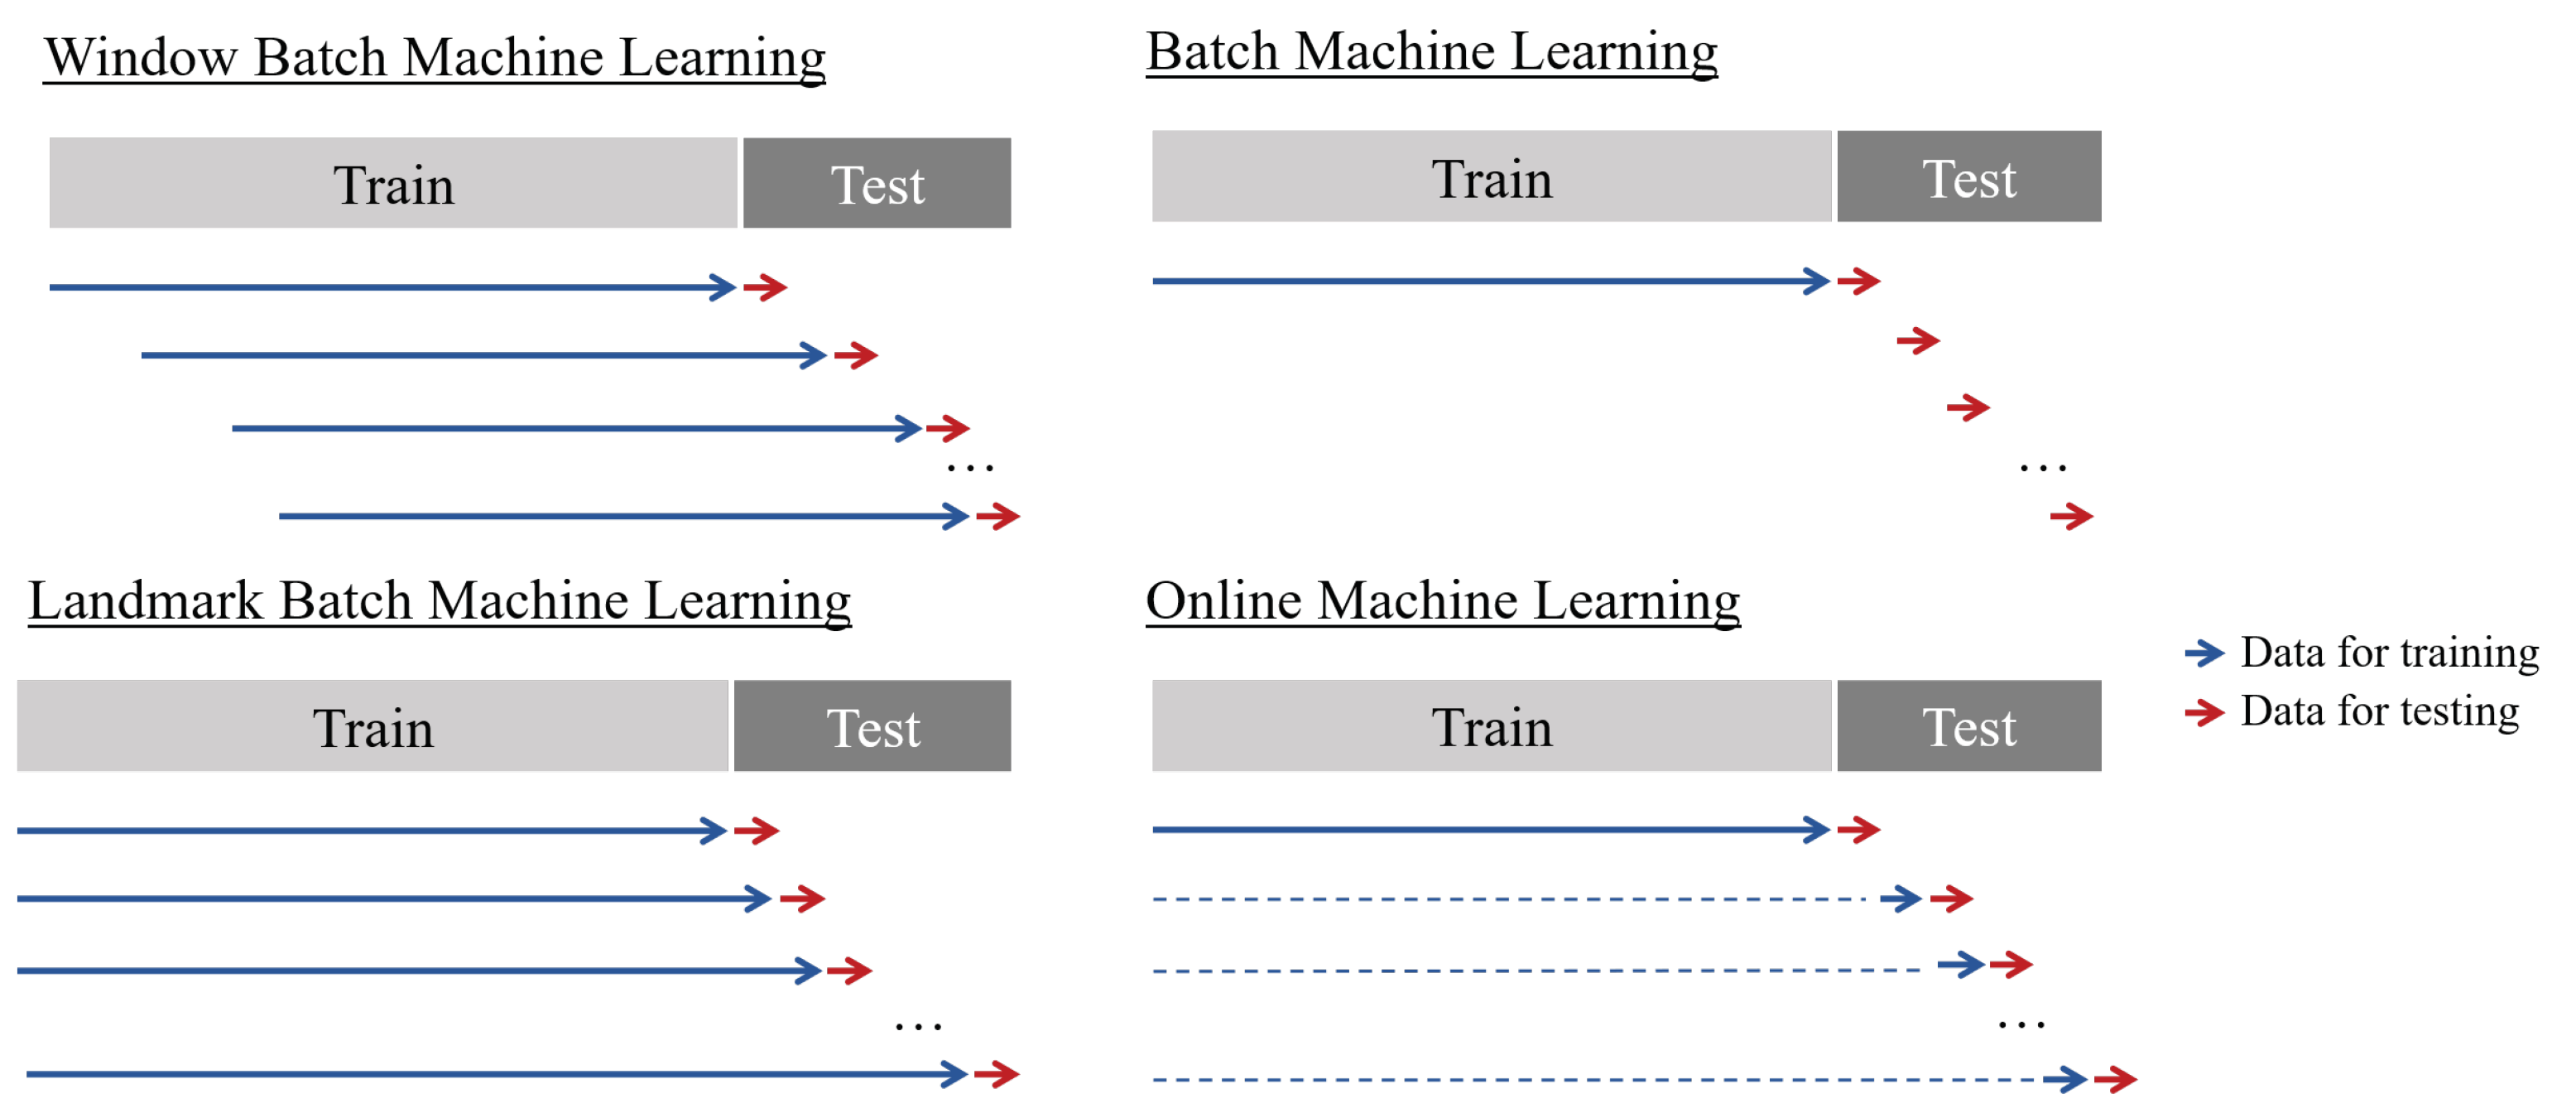
To compare OML to classical approaches, and to evaluate the strengths and weaknesses of various forecasting methods, different approaches were employed in our experiments. Three distinct methods were used to generate the training dataset for batch procedures. In order to provide a detailed explanation of these methods, it is important to first describe the experimental procedure. The objective of each method was to produce point forecasts with maximum accuracy for a predetermined horizon of 150 data points in the future. However, the development of models differed among the methods. For batch procedures, a classical train–test split was used, referred to as “batch” hereafter, along with a train–test split using a landmark approach and a train–test split with a shifting window. Additionally, the OML approach was utilized for model development. The evaluation functions eval_bml, eval_bml_landmark, eval_bml_window, and eval_oml_horizon accept two data frames as arguments:
train, denoted as , with size , is used to fit the model;
test, denoted as , with size , is used to evaluate the model on new (unseen) data.
First, the method eval_bml implements the “classical” BML approach. The algorithm is trained once on the training dataset, resulting in a model, denoted as , that is not modified. The model is evaluated on the test data, where the horizon, denoted as , specifies the size of the partitions that is split into. If , then the basic ML train–test setting is implemented. If , an OML setting is simulated.
Second, the method eval_bml_landmark implements a landmark approach. The first step is similar to that of the BML approach, resulting in an initial model . However, subsequent steps differ: after making a prediction with for the batch of data instances from the interval , the algorithm is retrained on the interval , to produce an updated model . During the third step of the landmark BML approach, makes predictions for , and a new algorithm, , is trained on .
Third, the method eval_bml_window implements a window approach. Again, the first step is similar to that of the BML approach, resulting in an initial model, . Subsequent steps are similar to those of the landmark approach, with one important exception: instead of being trained on the complete set of seen data, the algorithm is trained on a moving window of size .
Finally, the method eval_oml_horizon implements an OML approach. This approach differs fundamentally from BML approaches because every single instance is used for both prediction and training. If , a “pure” OML algorithm is implemented. If , OML computations are performed h times.
A summary of the training and test set generation process, related to the corresponding evaluation procedure, can be found in
Table A1 in the
Appendix A. Additionally,
Figure 2 visualizes the differences between the evaluation techniques introduced. Several criteria were used to evaluate the different approaches, including Mean Absolute Error (MAE), computation time, and memory consumption. The selection of these metrics was based on the different requirements that an end user might have for the system. While the model with the lowest error was preferred, computation time can be a crucial factor in high-frequency data, and memory consumption should not be ignored, as more complex models can take up several gigabytes. By memory consumption, we do not mean an exact calculation of the size of the model, but measurements of peak memory consumption during the model’s training and testing processes. This approach allowed us to conveniently compare the memory consumption of ML algorithms from different Python packages (
sklearn and
River). All the evaluation methods described in this section are available in the open-source
spotRiver package on GitHub (
https://github.com/sequential-parameter-optimization, accessed on 16 October 2023).
2.2.3. Real-World Application: Slitting Machines
In the experiments discussed in this work, data were collected using a test setup for winding stations from “Kampf Schneid- und Wickeltechnik GmbH & Co. KG”, Wiehl, Germany, a company that specializes in building machines for slitting and winding web-shaped materials such as paper, plastic films, or aluminum foil, as depicted in
Figure 3. A paper core is secured between two winding stations, to wind the web into a roll, achieving a diameter of up to 1500 mm and weights of up to 6 tons. The necessary web tension for different materials is maintained by a drive, which adjusts to compensate for the increasing diameter.
The test setup facilitated the evaluation of new concepts for winding stations and helped in determining the lifespan of various components, including bearings and belts. Additional sensors were installed to monitor temperatures and vibration levels at different points, enabling a more comprehensive analysis of their behavior. In one of the trials, a machine run to wind up a representative material was simulated under defined conditions, including parameters such as material thickness, material density, material width, induced tension, machine speed, and acceleration and deceleration times, in addition to core and finished diameters.
For the current experimental setup, sensor data from the winding machine were collected locally and supplied by the company. Machine learning algorithms were executed on a separate device. In the future, the plan is to establish a bi-directional connection between the sensors and the computing device.
The collected time-series data encapsulated information regarding motor temperature, revolutions, and torques, as well as data from external sensors monitoring temperature and vibration levels. For the experiments outlined in this article, only specific data were utilized: motor revolution [], motor torque [Nm], and the vibration data at a particular point. The vibration data were measured in analog values between 0 and 27,648, related to a range between 0–25 []. Motor revolution and torque were used as input features, while the vibration level was the prediction target. Data were logged every one hundredth of a second, with each timestamp recording the respective feature values. To simulate external influences, such as roll handling or other factory operations, further vibrations were introduced intermittently by gently hitting and shaking the winding stations.
In our experiments, the data provided by Kampf Schneid-und Wickeltechnik GmbH & Co. KG were utilized, to predict the vibration of level station 1, using motor revolution and torque. A forecast horizon of t = 150 was defined. This horizon refers to the time when the models will be updated again. For instance, in this experiment, the models were updated after collecting 150 data points, although each approach employed a distinct strategy. The classic batch method did not update the model and only utilized training data. The batch approach with a landmark strategy included newly collected data in the training data and created a new model on the enlarged dataset. On the other hand, the batch model with a shifting window approach excluded the first 150 data points of the training set and appended each new 150 data points to the end of the training data. A new model was then produced based on this new dataset, ensuring that the length of the training dataset remained constant. Finally, in the OML approach, 150 data points were collected and sequentially passed to the model.
In the batch approaches, a Decision Tree Regressor from the
sklearn package [
14] was utilized, while the Hoeffding Tree Regressor (HTR) from the
River package [
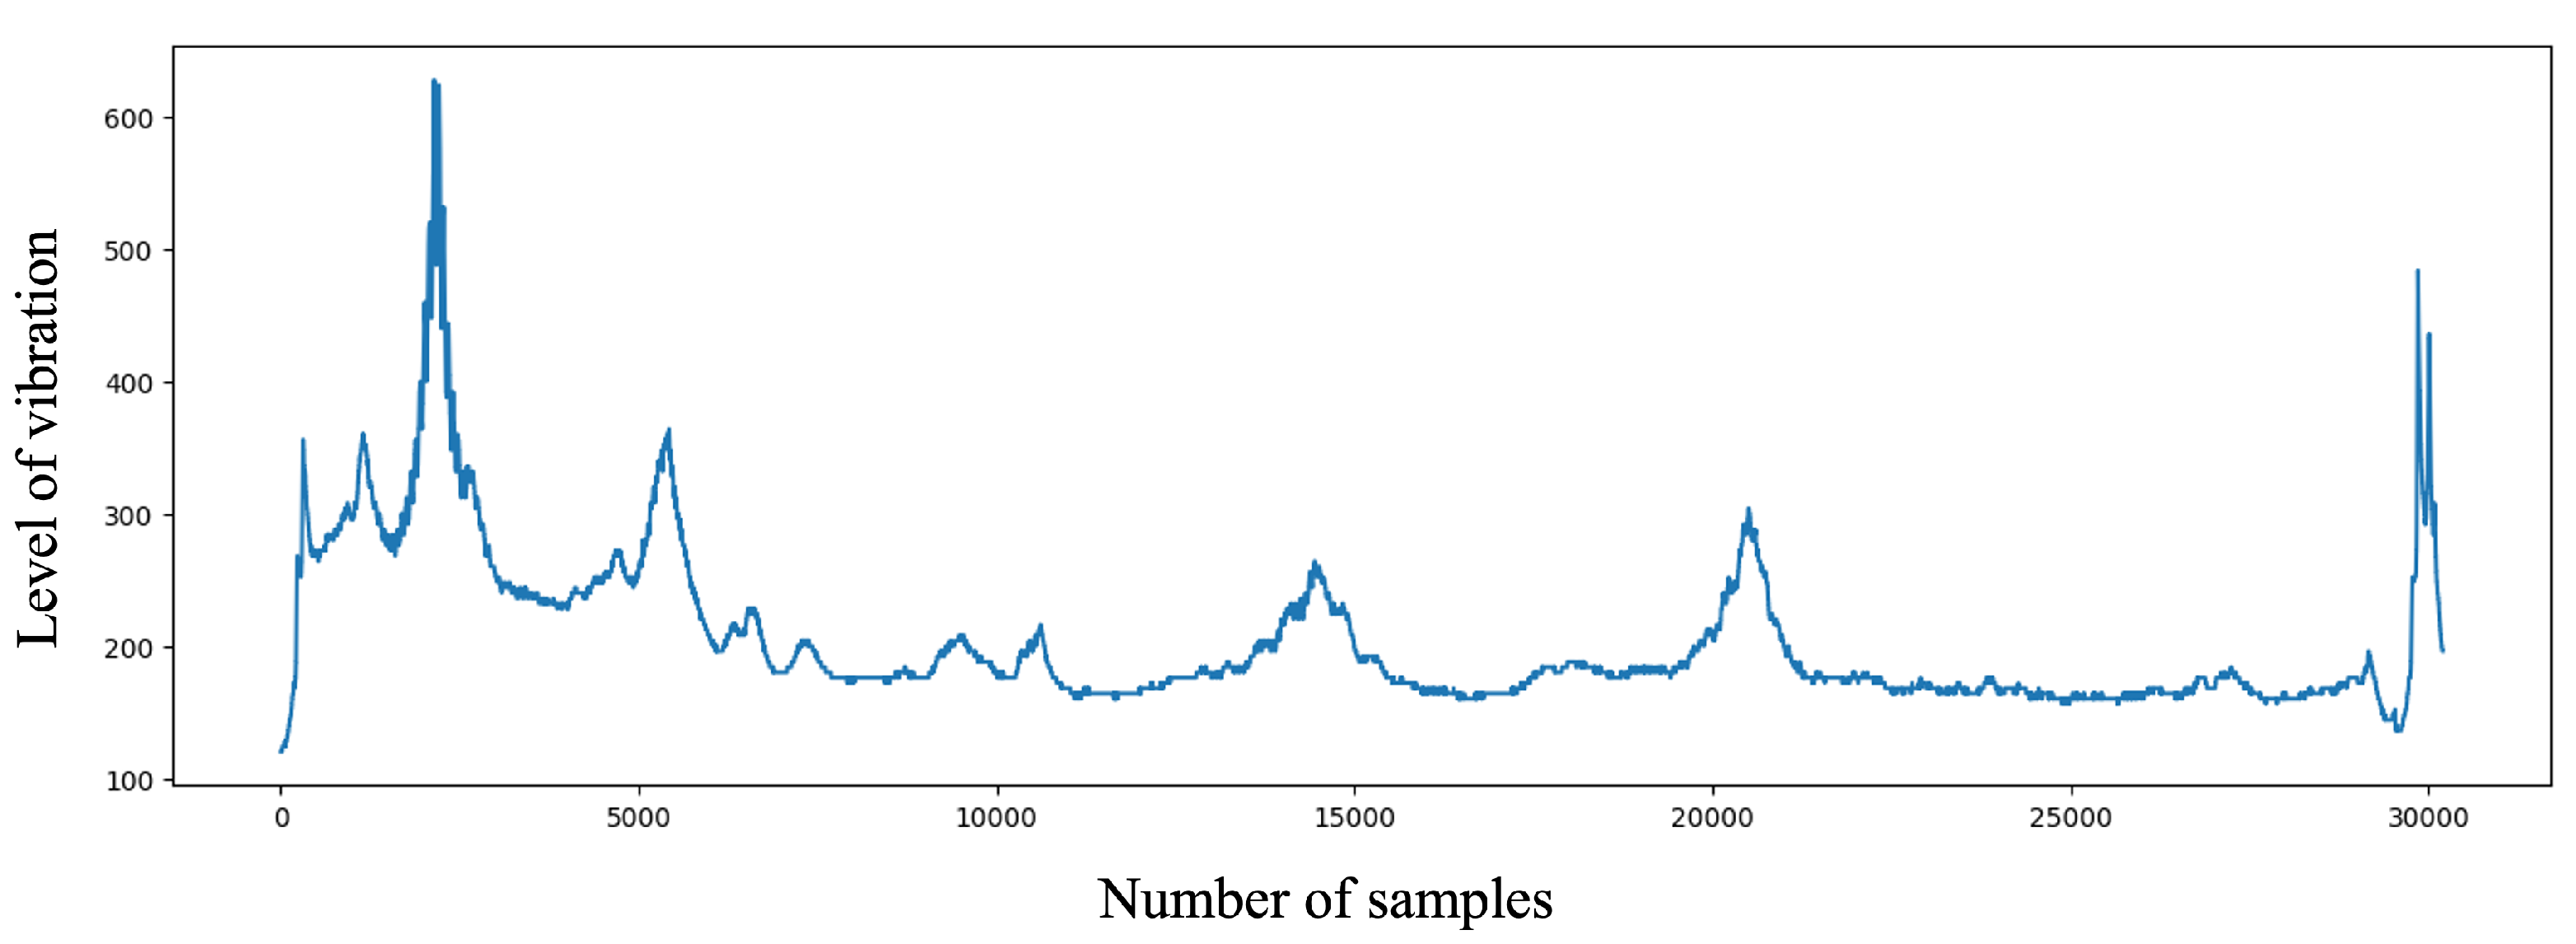
8] was used in the OML approach. Before passing data to the regressor, it was standardized. For the initial training of the models, 1,462,555 samples were used. The subsequent evaluation horizon consisted of 30,196 data points. This test set included four potential future evolutions of the vibration level.
Figure 4 displays the temporal evolution of the vibration observed in one test scenario, revealing distinct local peaks followed by sharp drops and subsequent slow recovery before the emergence of new peaks.
2.3. Hyperparameter Tuning
The goal of HPT is to optimize the hyperparameters in a way that improves the performance of an ML model. This is an important but usually difficult and computationally intensive task. The simplest approach—but also the most computationally expensive—is a manual search (or trial and error) [
15].
Common approaches include the Simple Random Search (RS), where hyperparameters are randomly and repeatedly selected for evaluation, and the grid search. Directed search methods and other model-free algorithms, such as evolution strategies [
16] or pattern search [
17], also play an important role. Hyperband, a multi-armed bandit strategy that dynamically allocates resources to a set of random configurations and uses successive bisections to stop configurations with poor performance [
18], is also commonly used in the HPT domain. The most sophisticated and efficient approaches are Bayesian Optimization (BO) and SMBO methods, which are based on the optimization of cost functions obtained through simulations or experiments.
For this article, we considered an HPT approach based on the Sequential Parameter Optimization Toolbox (SPOT) [
7], which is suitable for situations where only limited resources are available. This may be due to limited availability or cost of hardware. Another reason might be that confidential data may only be processed locally, due to legal requirements. Furthermore, our approach emphasizes the importance of understanding algorithms as a key tool for transparency and explainability. This can be enabled by quantifying the contribution of ML and Deep Learning components (nodes, layers, split decisions, activation functions, etc.) and understanding the meaning of hyperparameters and their interactions. The SPOT provides statistical tools for understanding hyperparameters and their interactions. Additionally, the SPOT software code is available in the open-source
spotPython and
spotRiver packages on GitHub (
https://github.com/sequential-parameter-optimization, accessed on 16 October 2023), allowing for replicability of results. The SPOT is established open-source software that has been maintained for over 15 years [
7]. It includes SMBO methods for tuning, based on classical regression and analysis of variance techniques, tree-based models such as CART and RF, BO (Gaussian Process Models, also known as Kriging), and combinations of different meta-modeling approaches. Any ML model in scikit-learn (
sklearn) can be used as a meta-model.
The loop of the model-based tuning process with the SPOT can be divided into the following steps [
7]:
Setup: Different combinations of hyperparameter values are evaluated, in order to build an initial design.
Evaluation: The new or initial hyperparameters are evaluated.
Termination: The loop checks weather a termination criterion like maximum number of iteration or maximum tuning time has been reached.
Selection: This step selects samples for building the surrogate model.
Building Surrogate: The surrogate is built.
Surrogate Search: The algorithm searches for the best hyperparameter settings based on the surrogate model.
Optimal Computing Budget Allocation (OCBA): This step is used to determine the number of repeated evaluations.
2.3.1. SMBO Tuning Setup
In order to find the optimal parameters for the HRT algorithm, we employed Gaussian Process Regression (GPR) [
19] as a surrogate model in the context of SMBO. GPR, also known as the Kriging model, is the default surrogate choice for SMBO within the SPOT framework. To drive this optimization process, we chose the Differential Evolution (DE) [
20] algorithm as our optimization method.
The optimization bounds, along with the default values assigned to the tuned hyperparameters, are outlined in
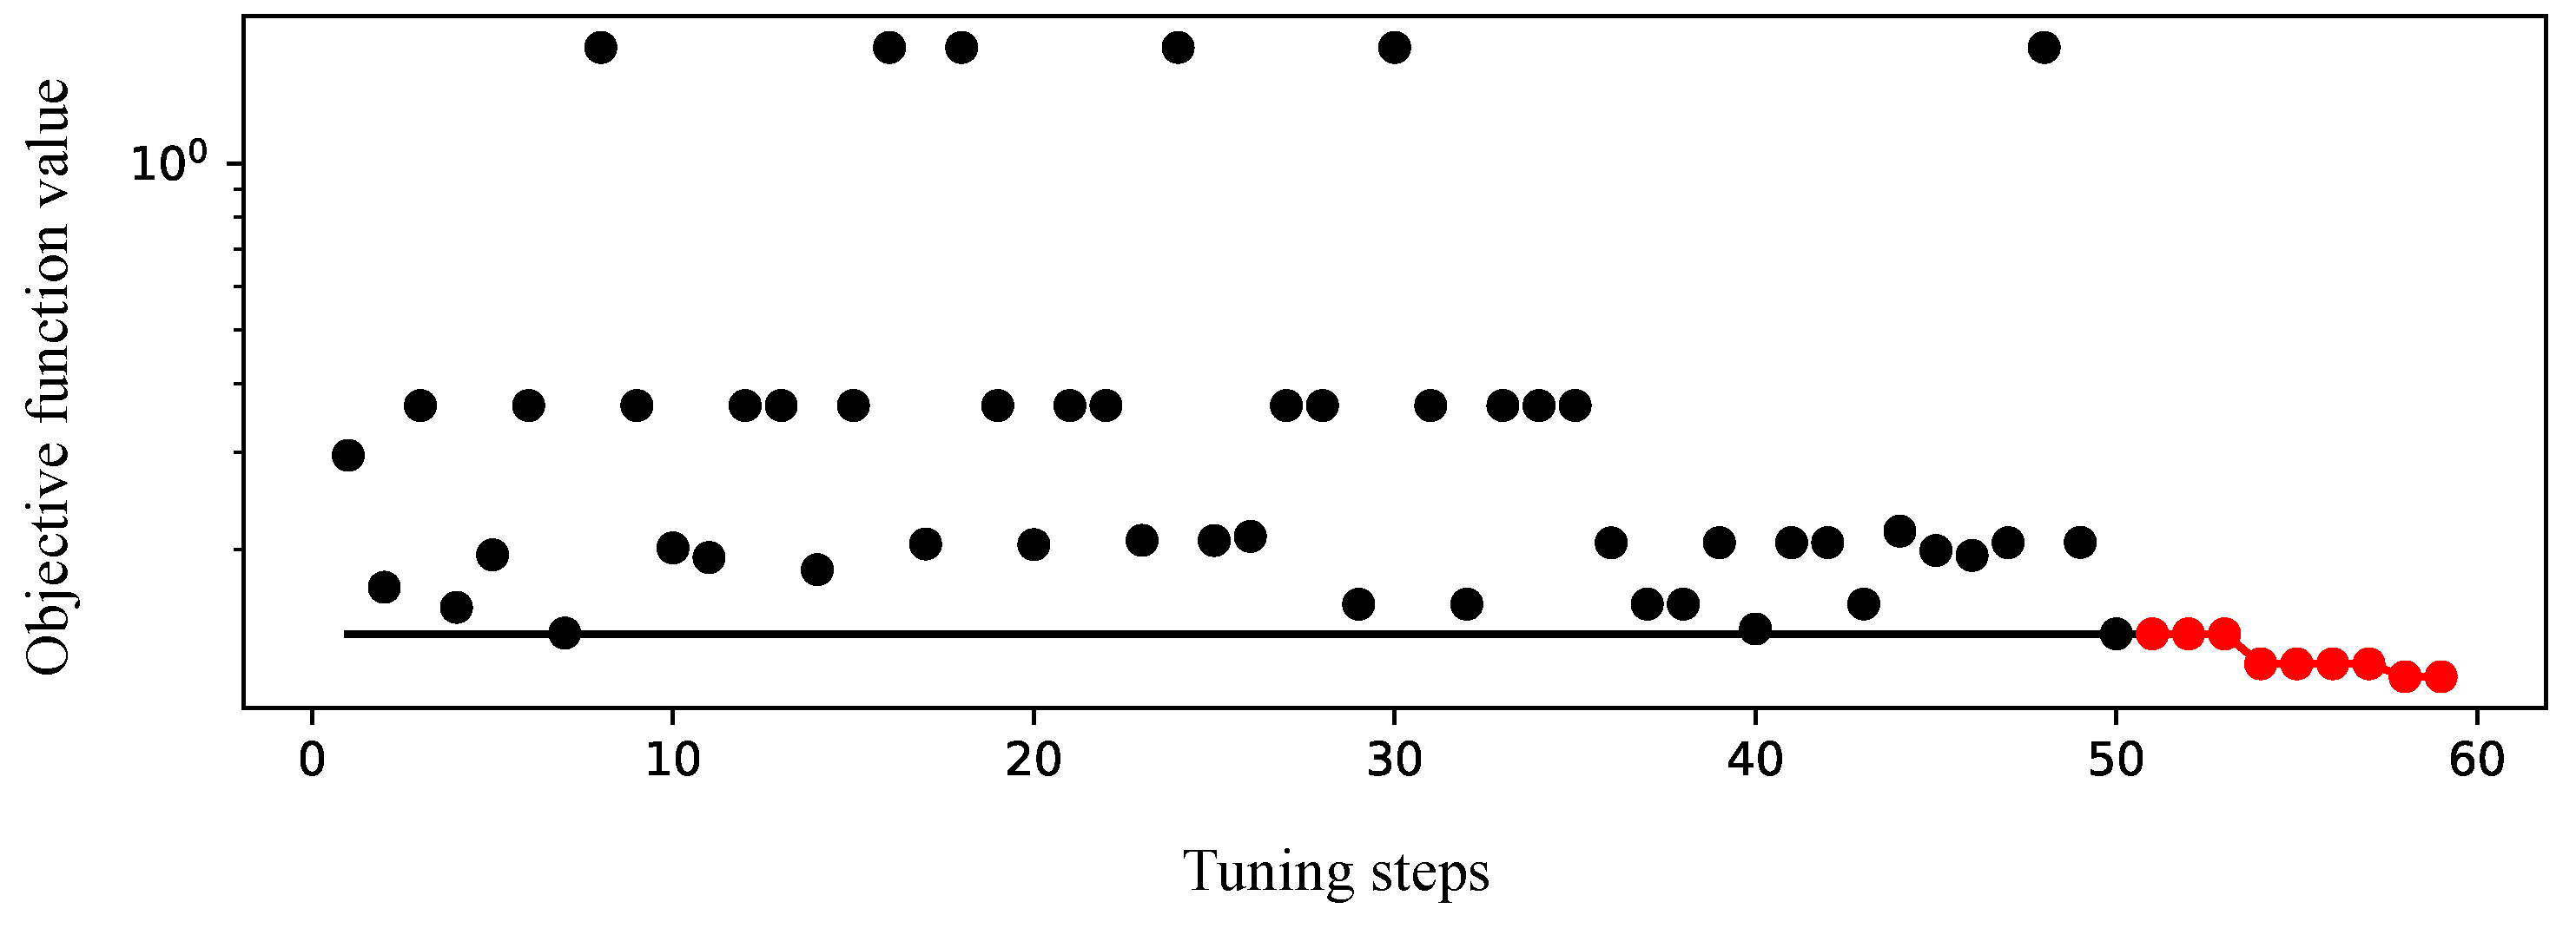
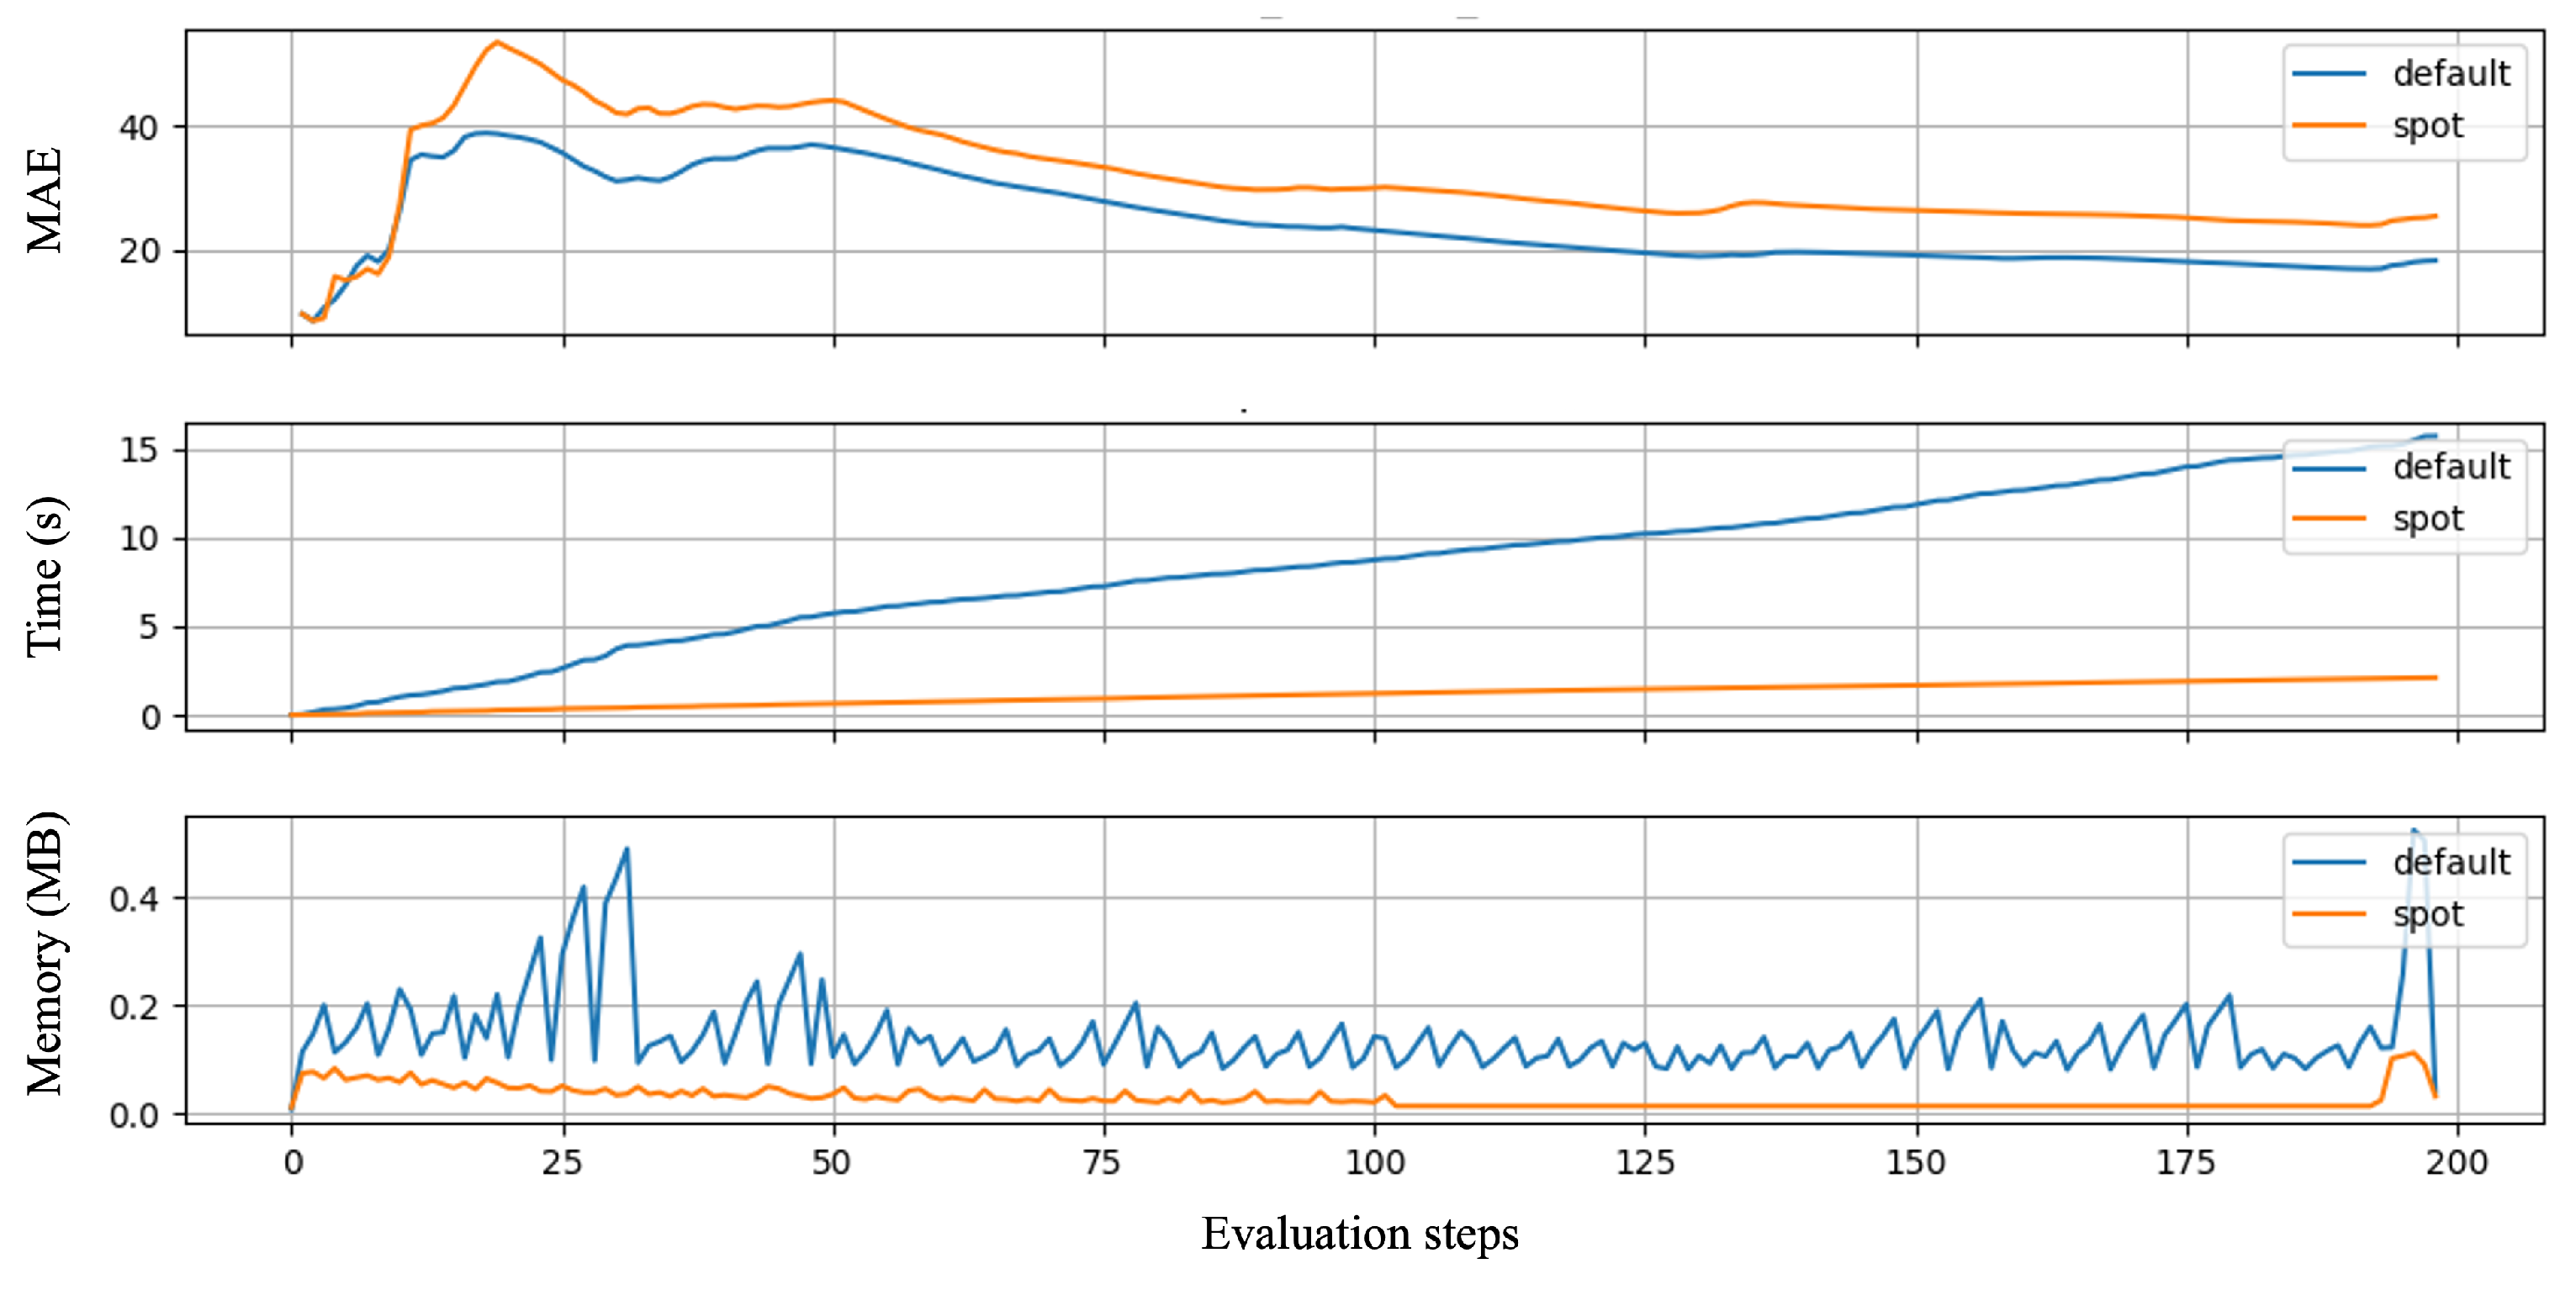
Table 2. Notably, the optimization process is time limited, with a maximum duration of 100 min. It is important to emphasize that this countdown starts only after the initialization of the initial surrogate model design, which in our specific case consisted of 50 data points. Due to the fact that our dataset was very large (almost 1.5 million samples), we used only 2% of the trainings and test set for the HPT. The remaining data were subsequently used for the actual training and evaluation of the tuned and default model. The goal of the optimization is to minimize a combined value of MAE, computation time, and memory usage. These values are weighted differently (MAE: 1, memory consumption:
, calculation time:
).
