
Evaluation of Structural Stresses of Mountain-Embedded Railway Systems

 ,
,  ,
,  and
and 
Abstract
:1. Introduction
2. Simulation Model for the Mountain-ERS Track
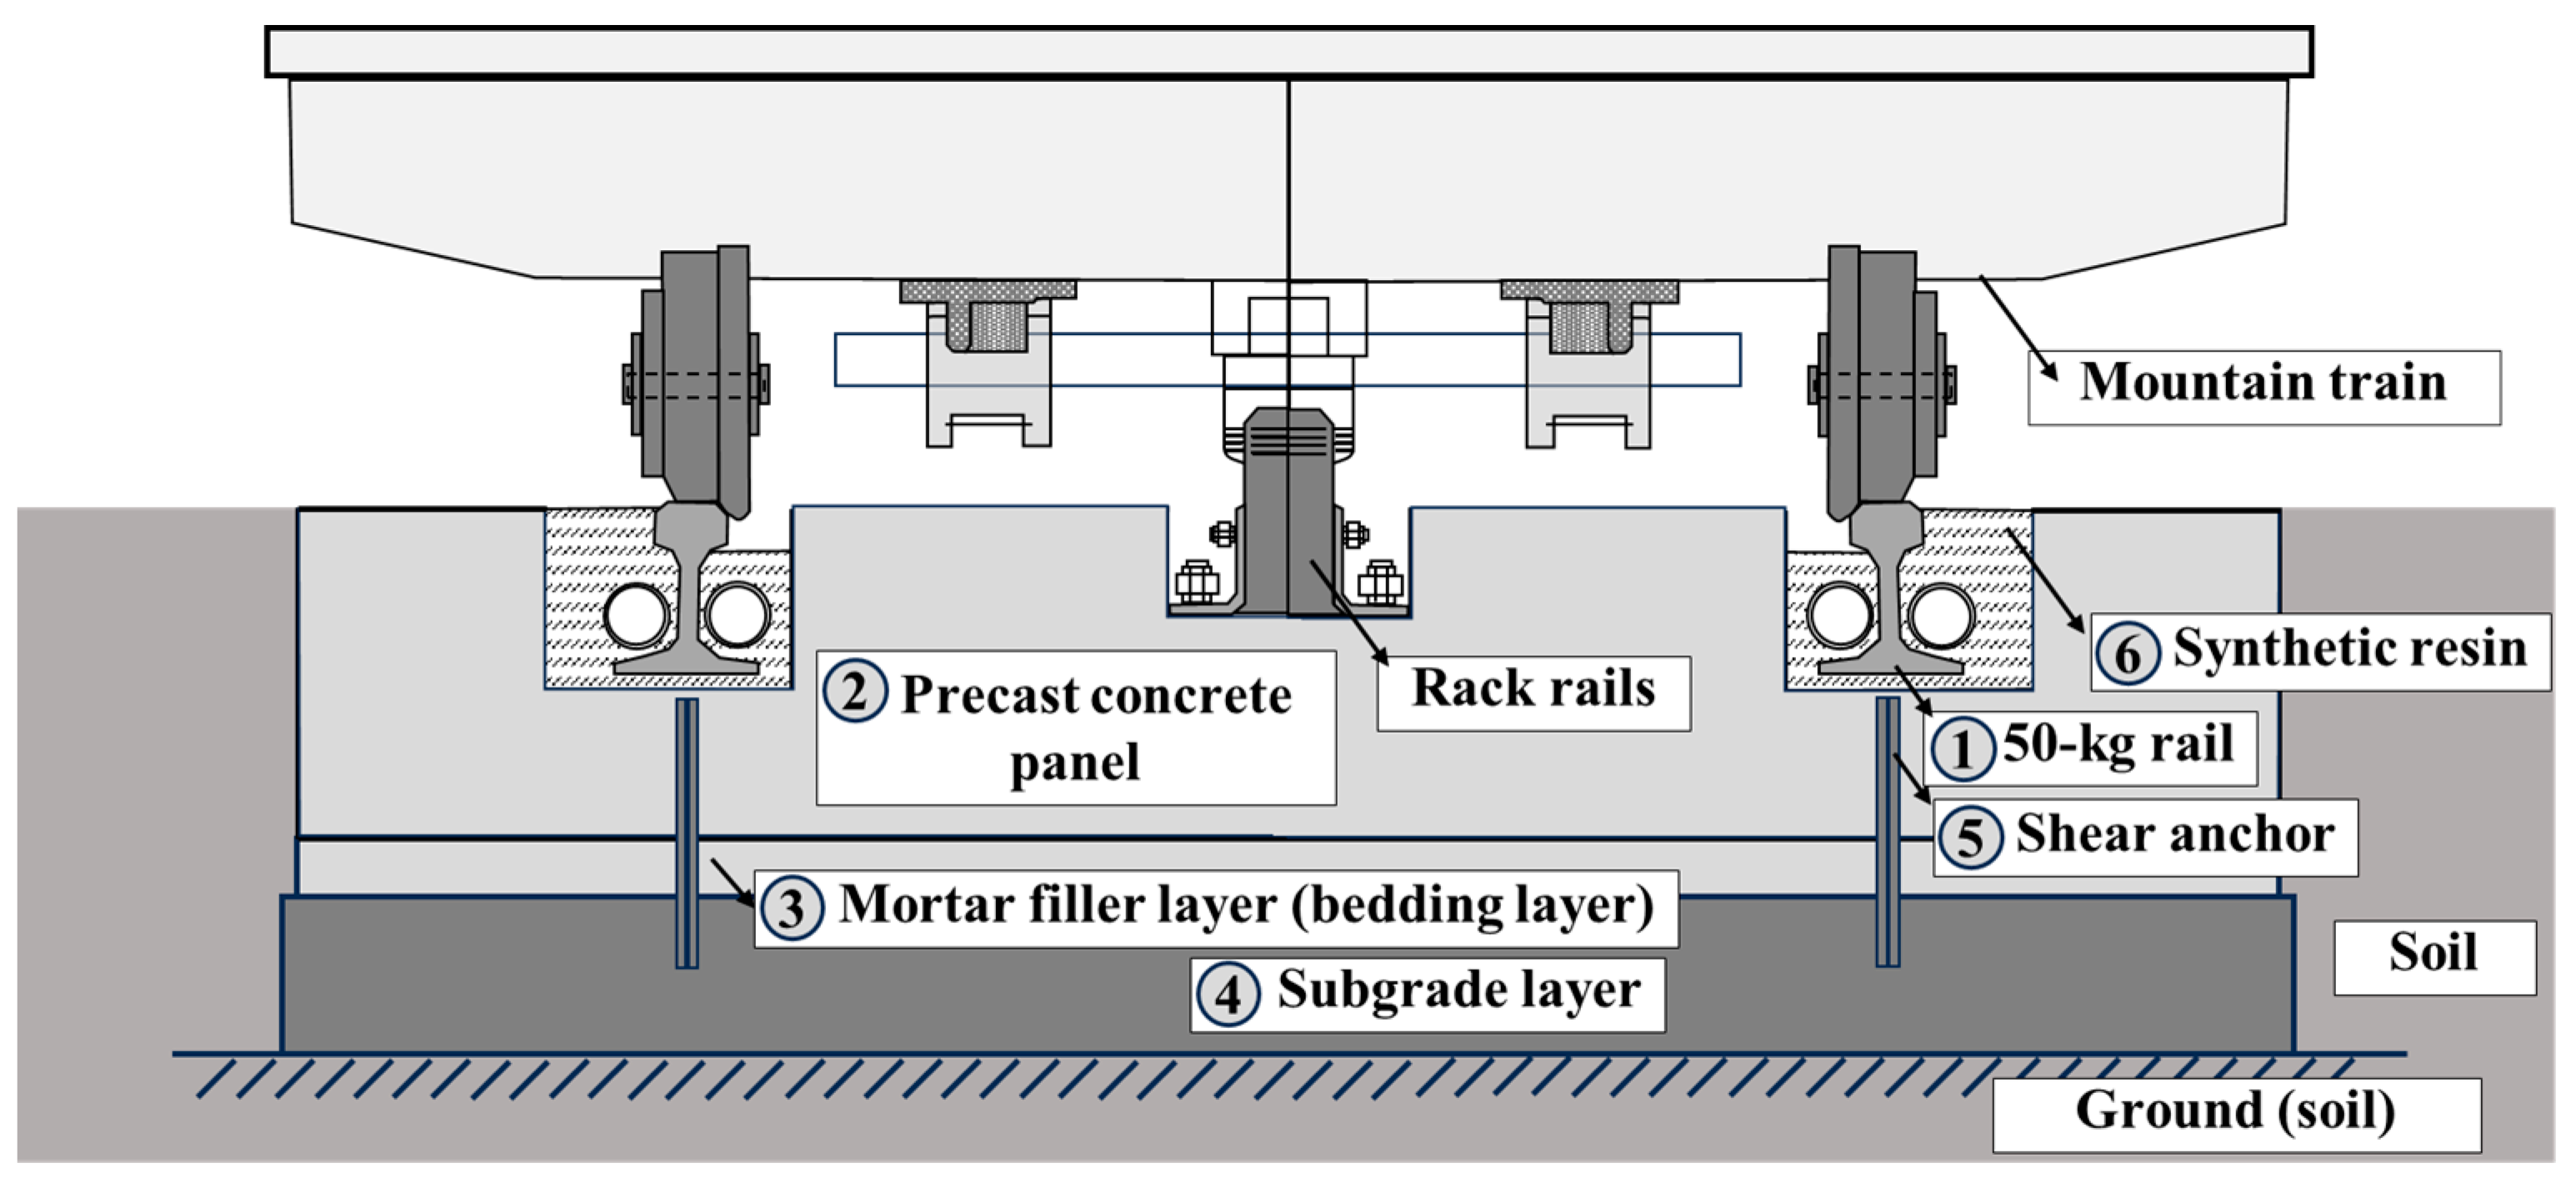
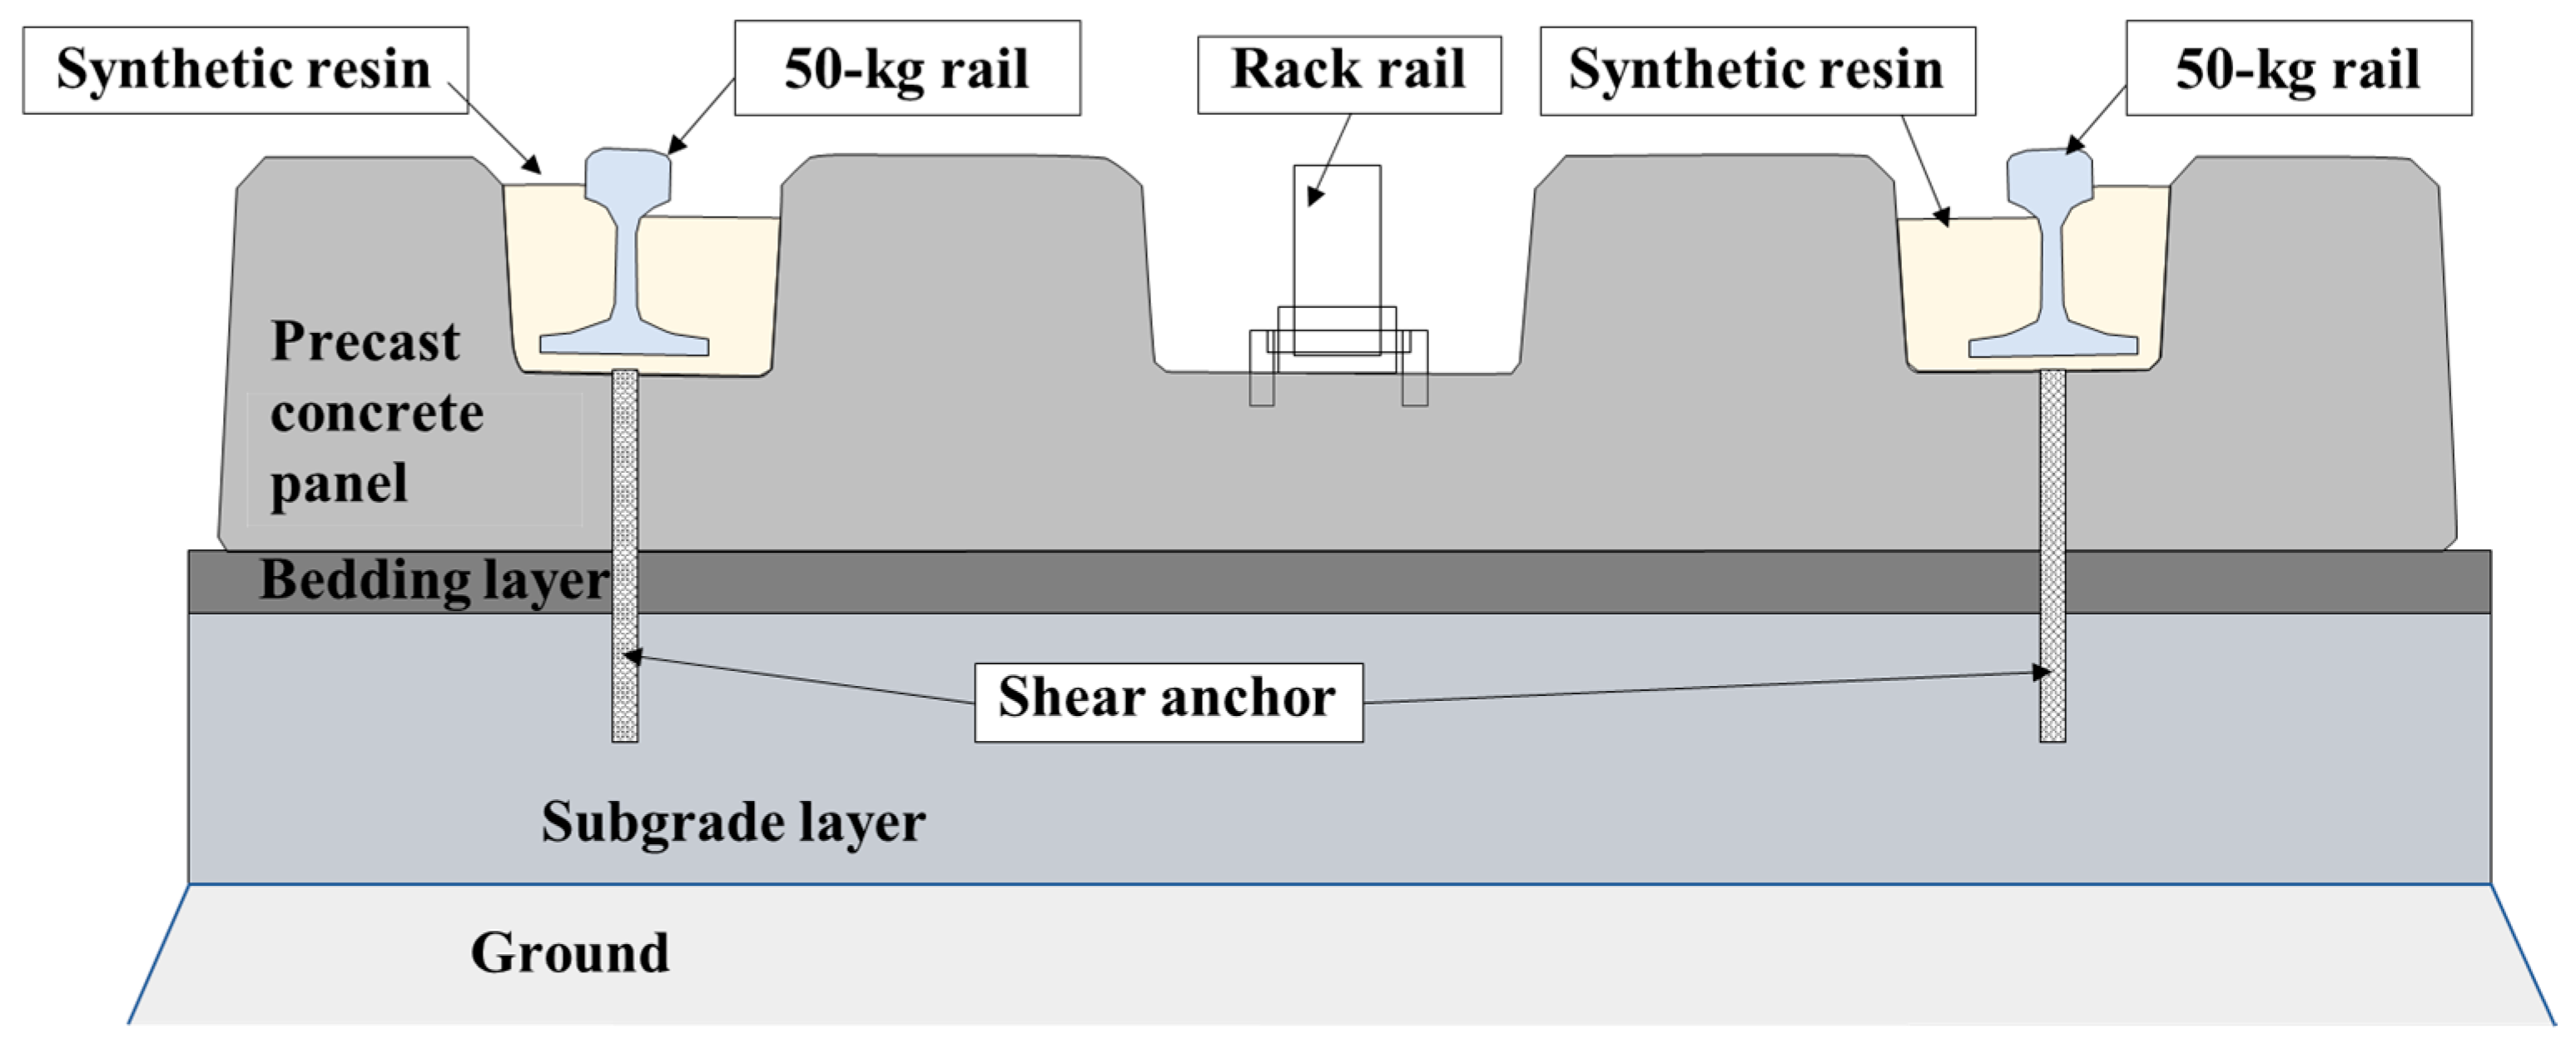
2.1. Mountain-ERS Track
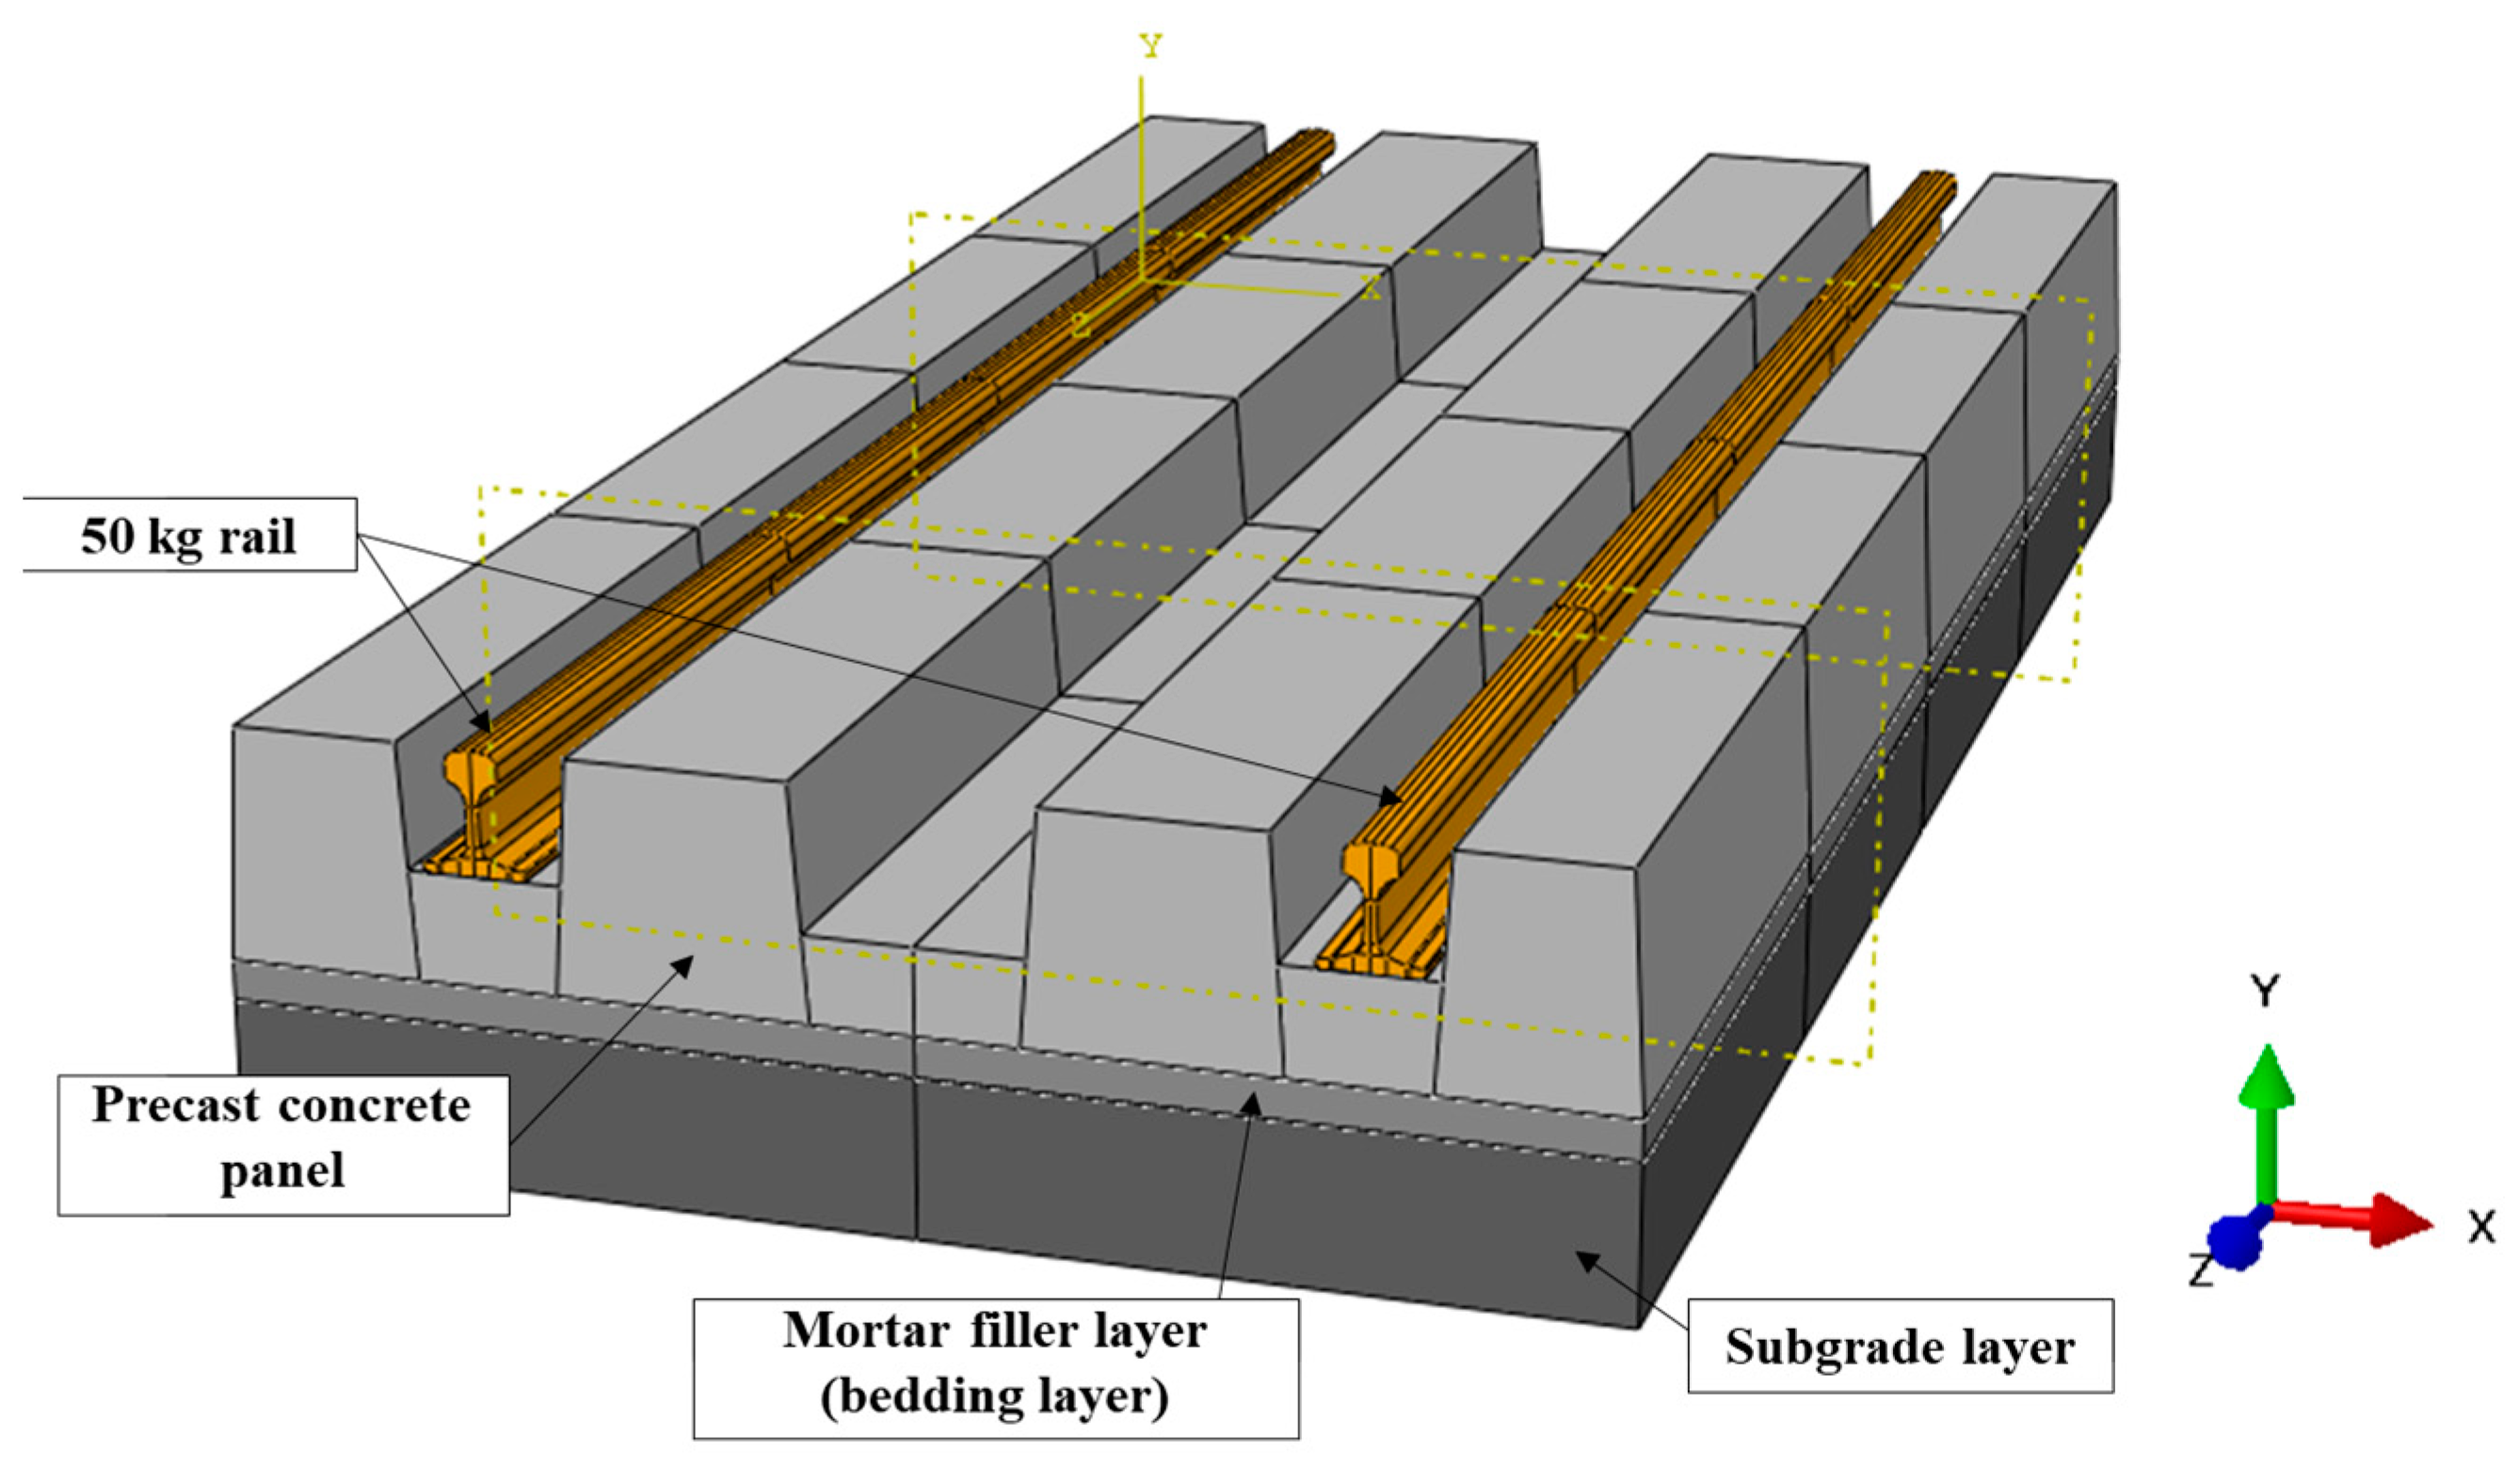
2.2. Finite Element Analysis Model for the Mountain-ERS Track
2.3. Material Properties
2.3.1. Concrete
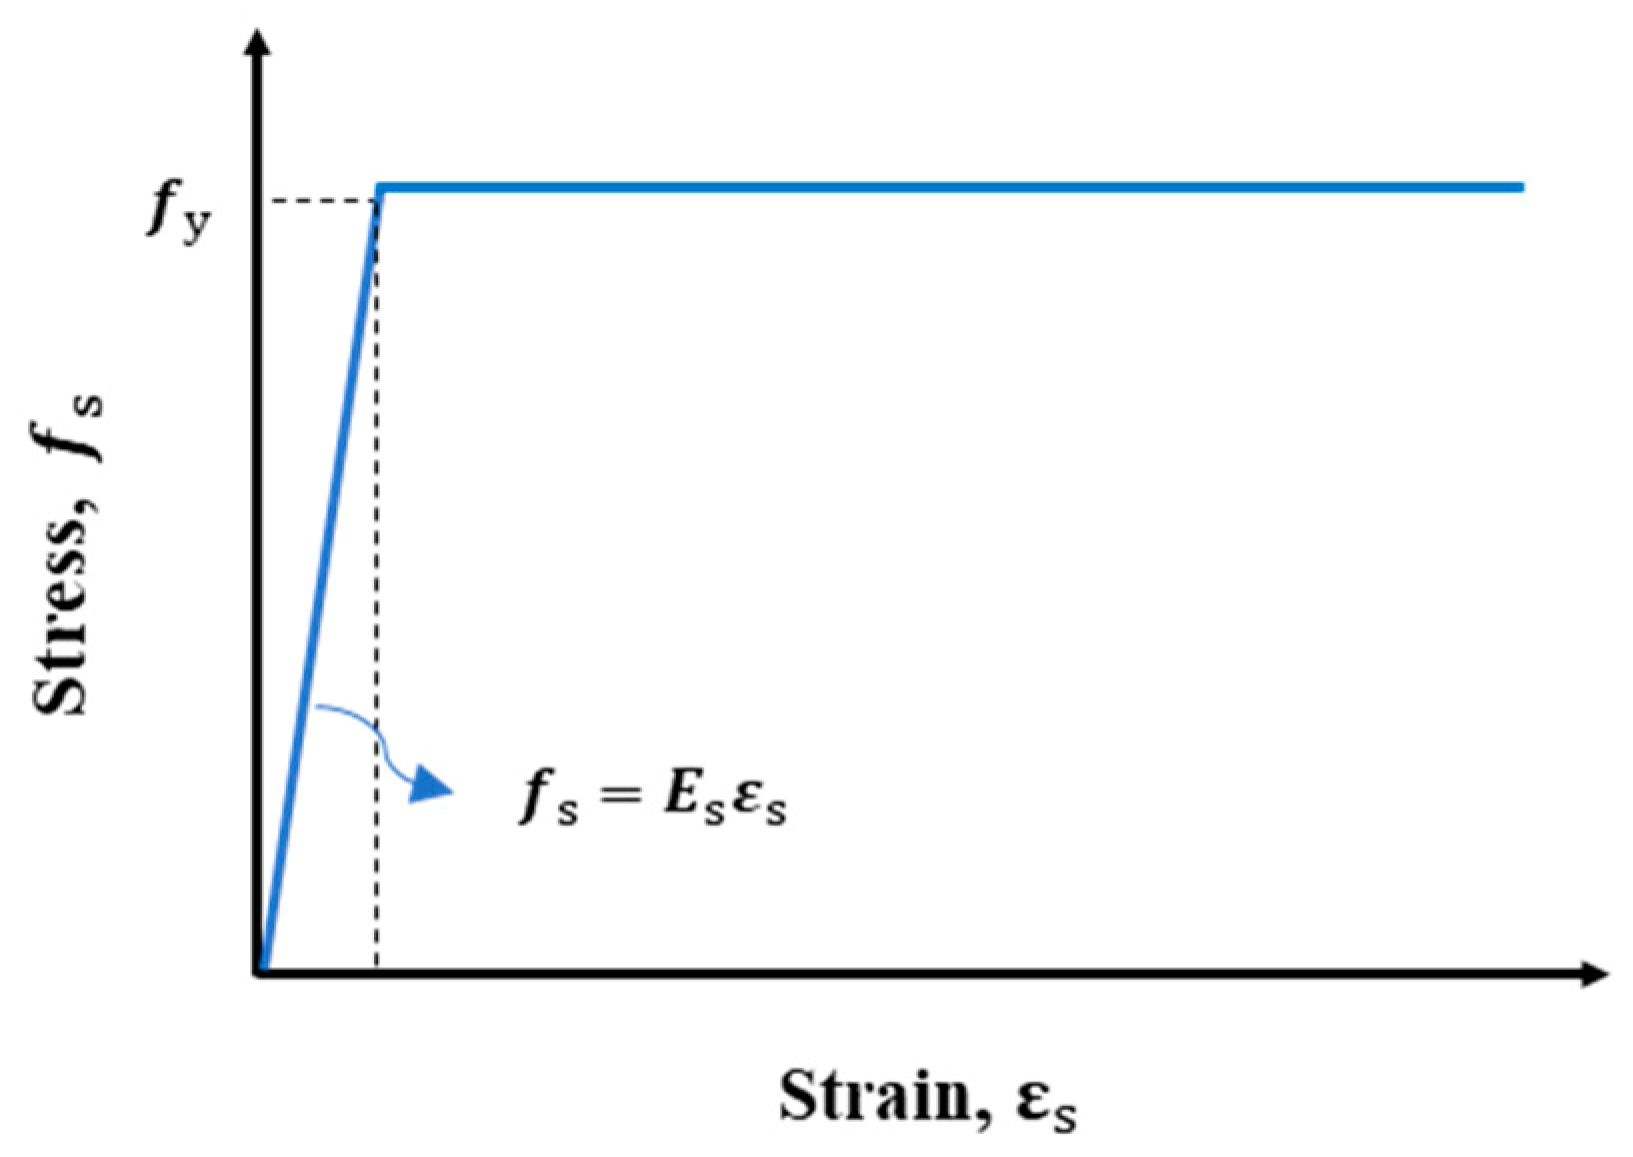
2.3.2. Steel
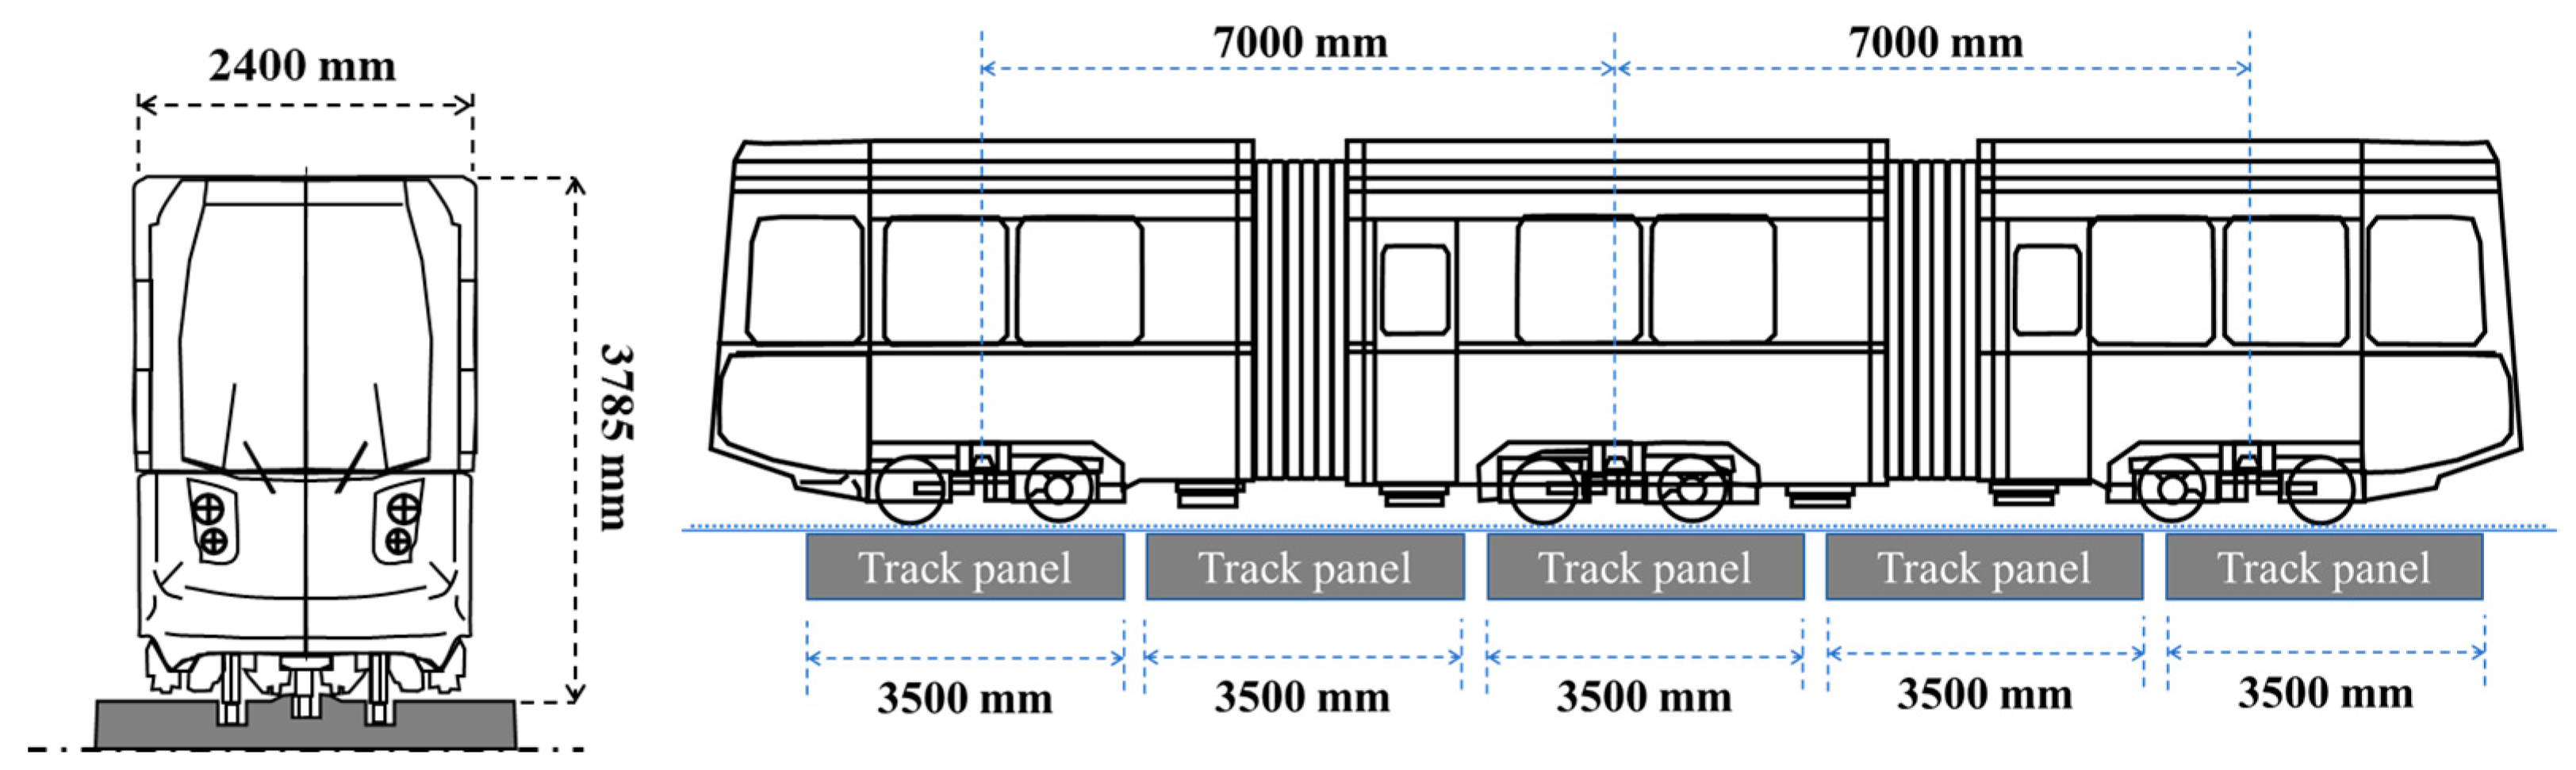
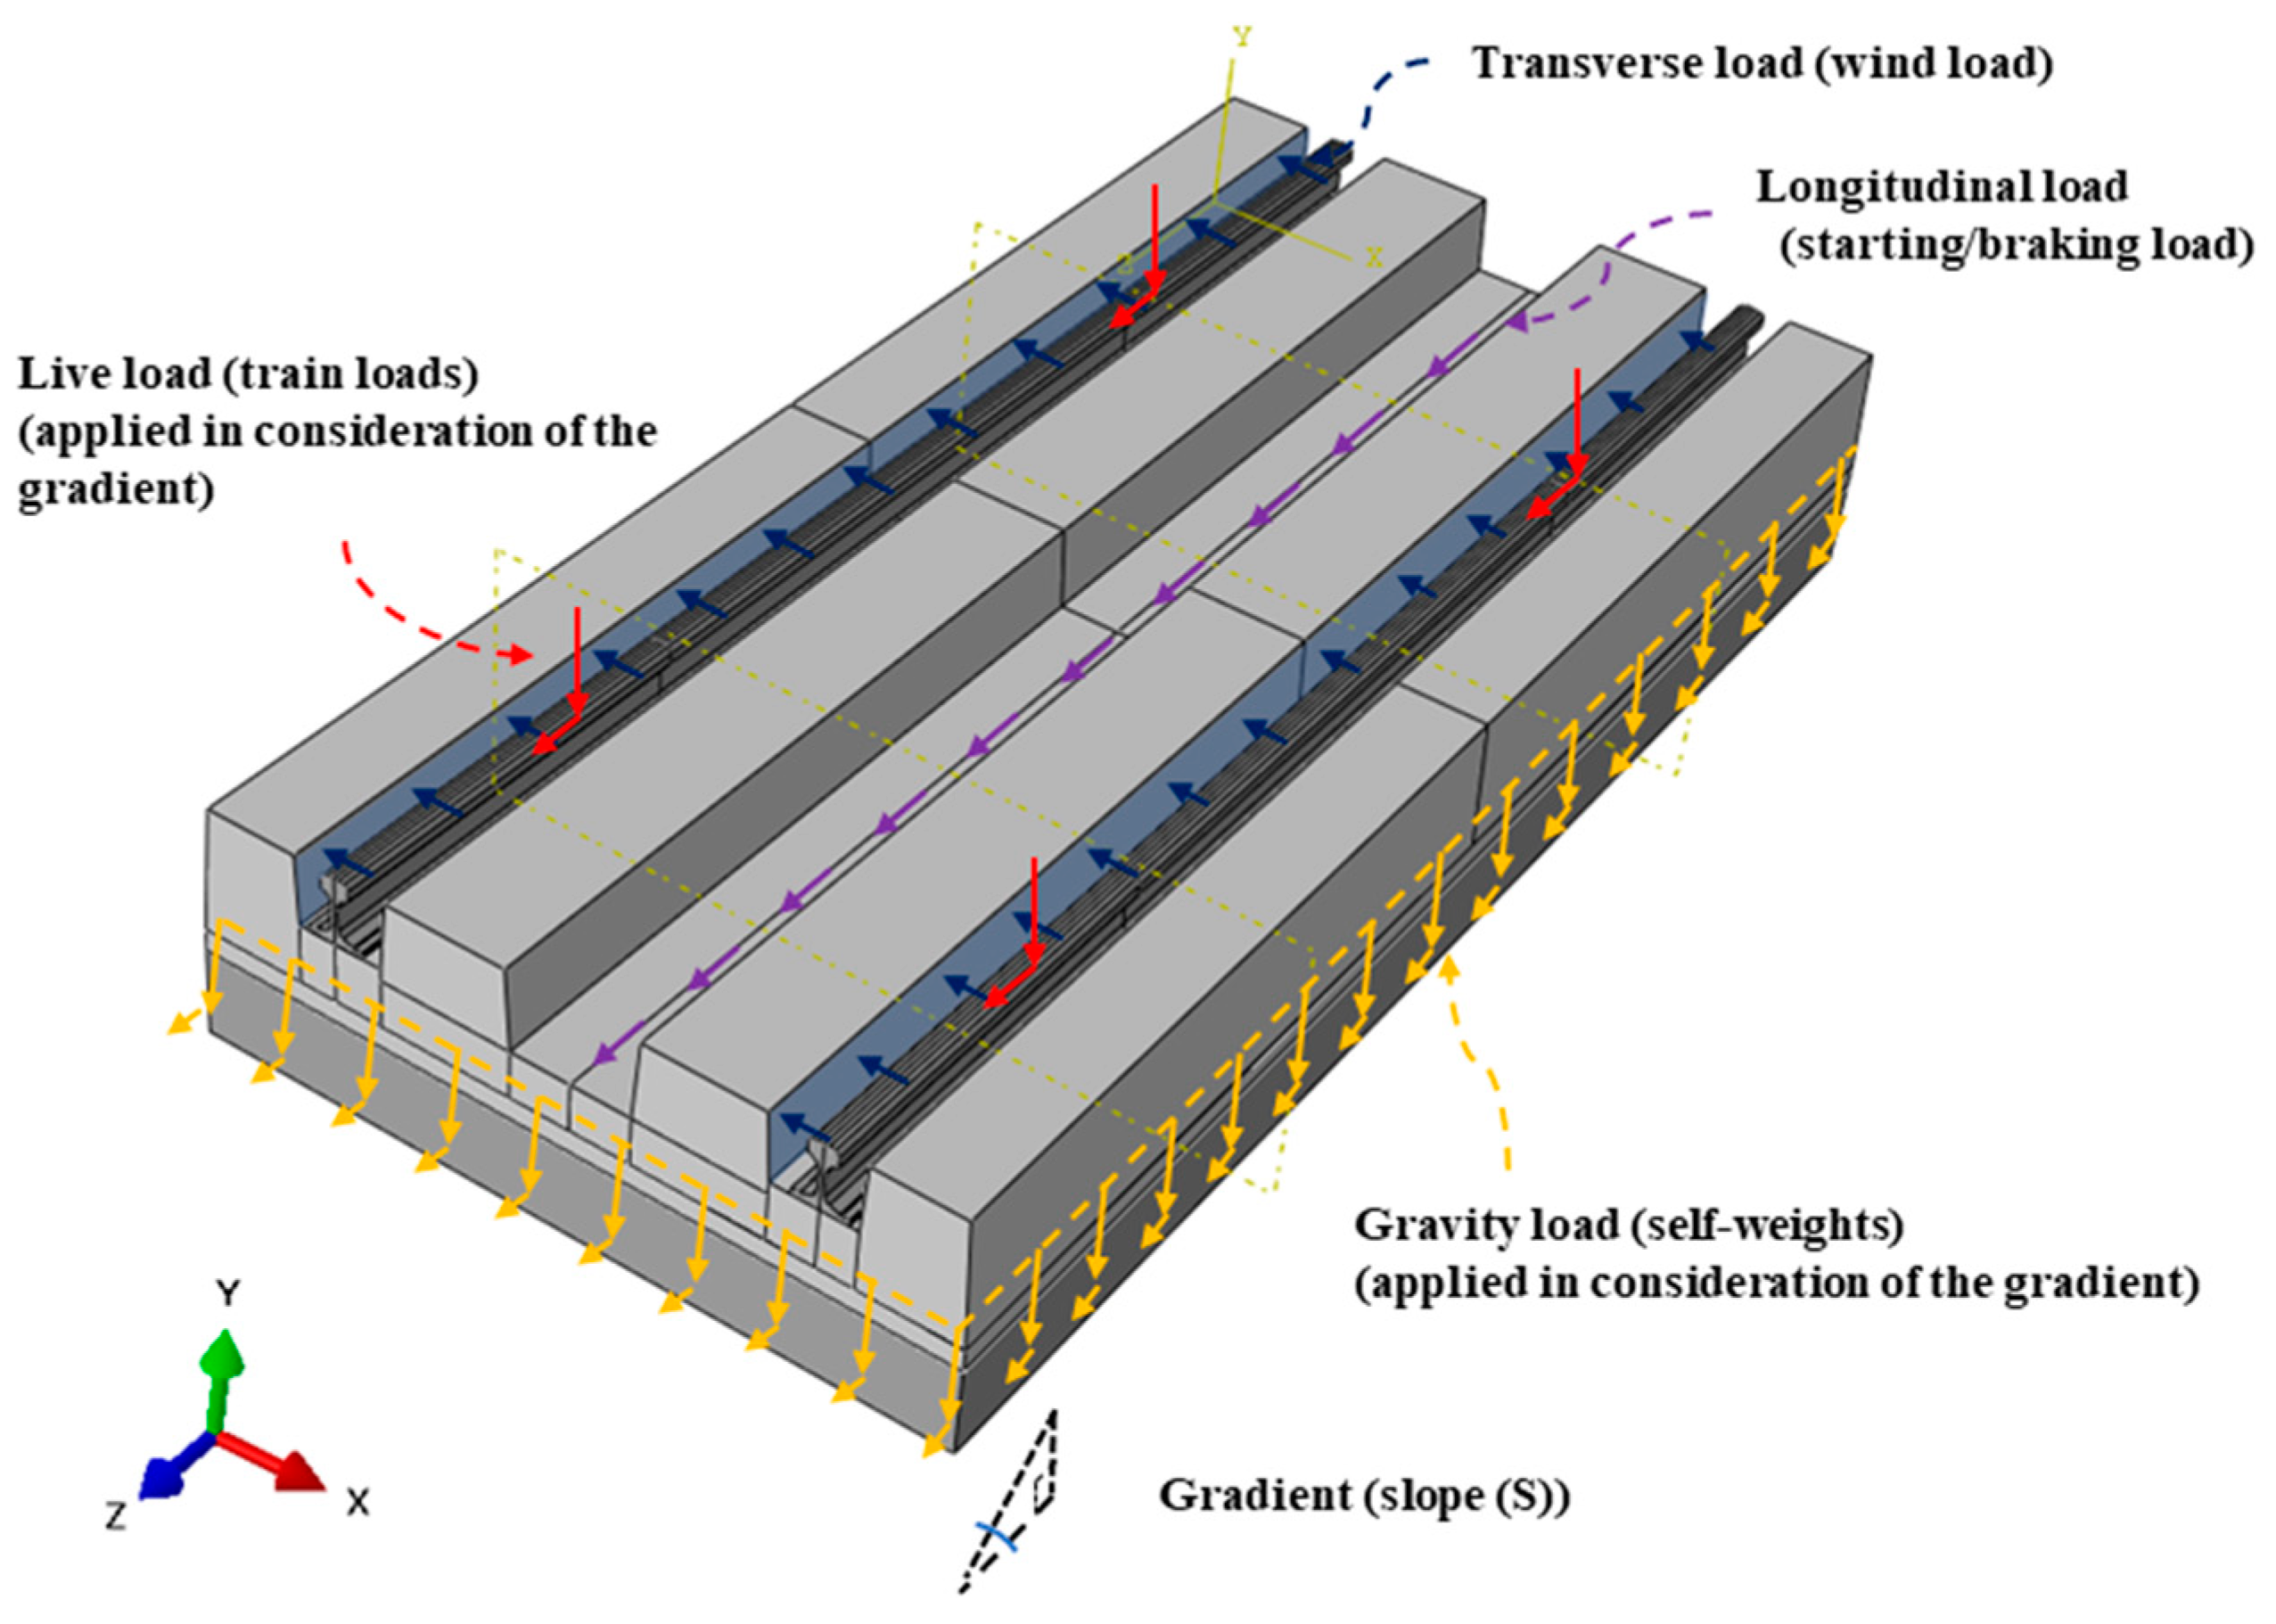
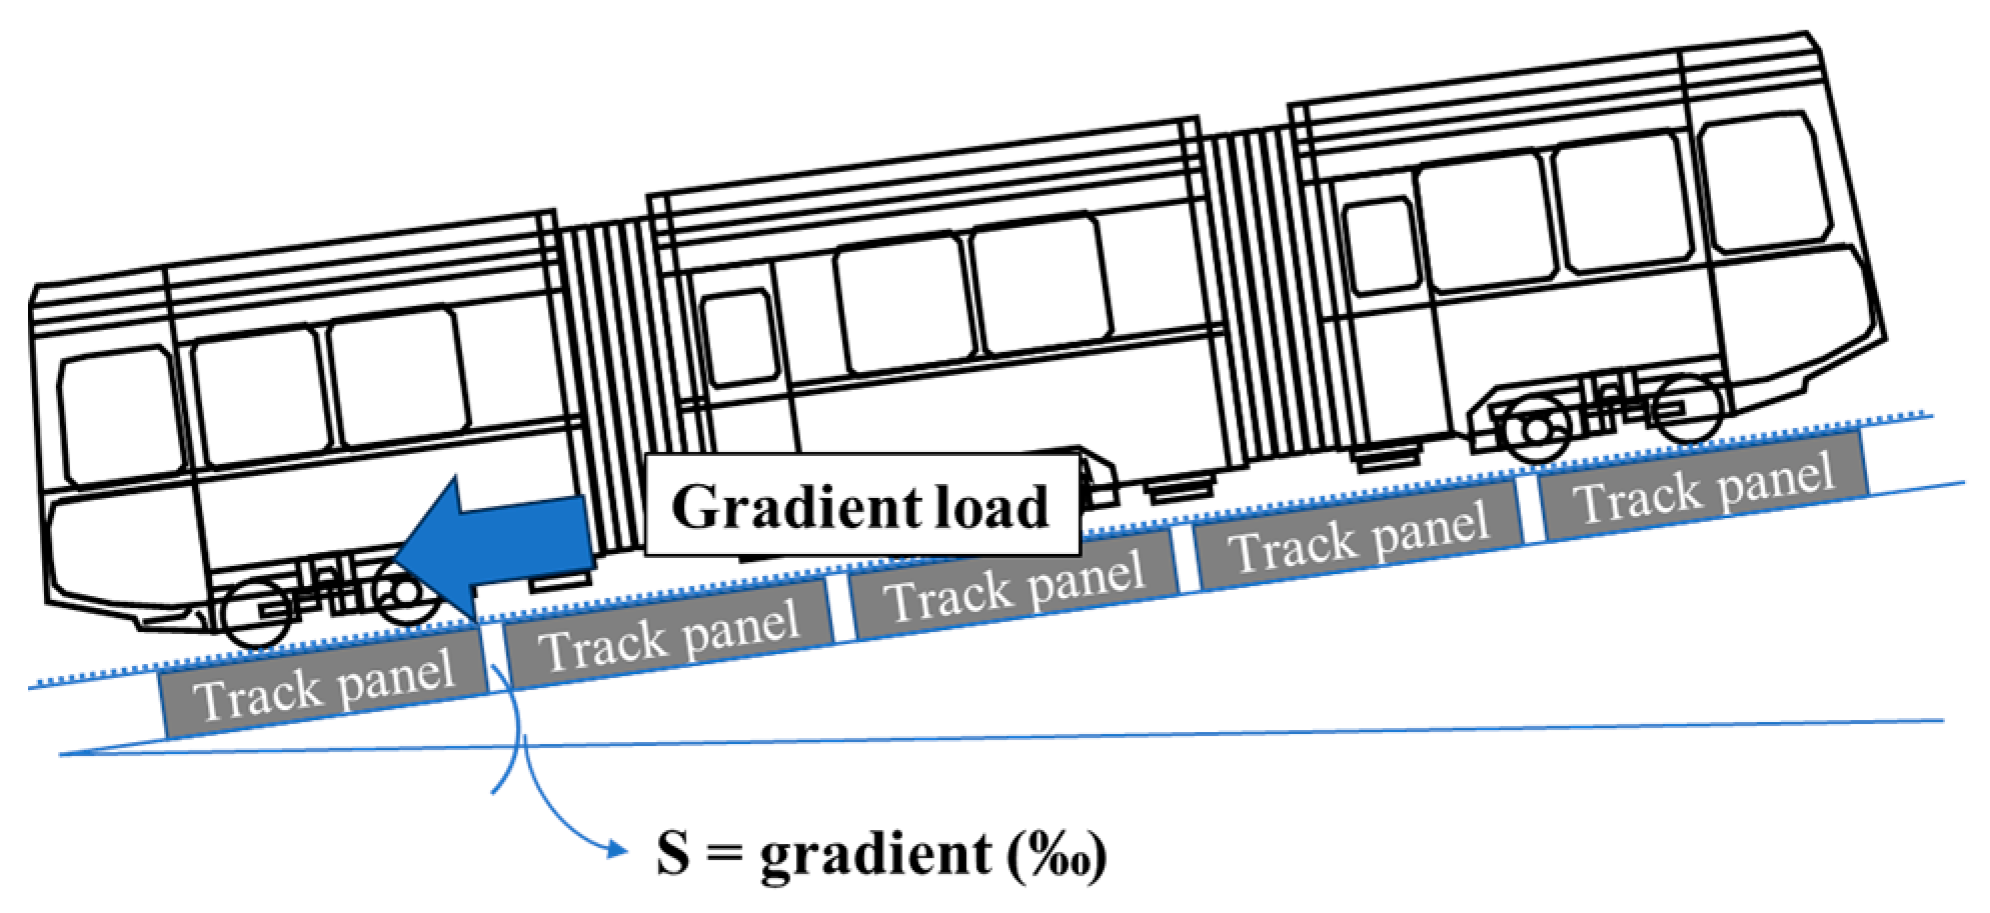
2.4. Load Conditions
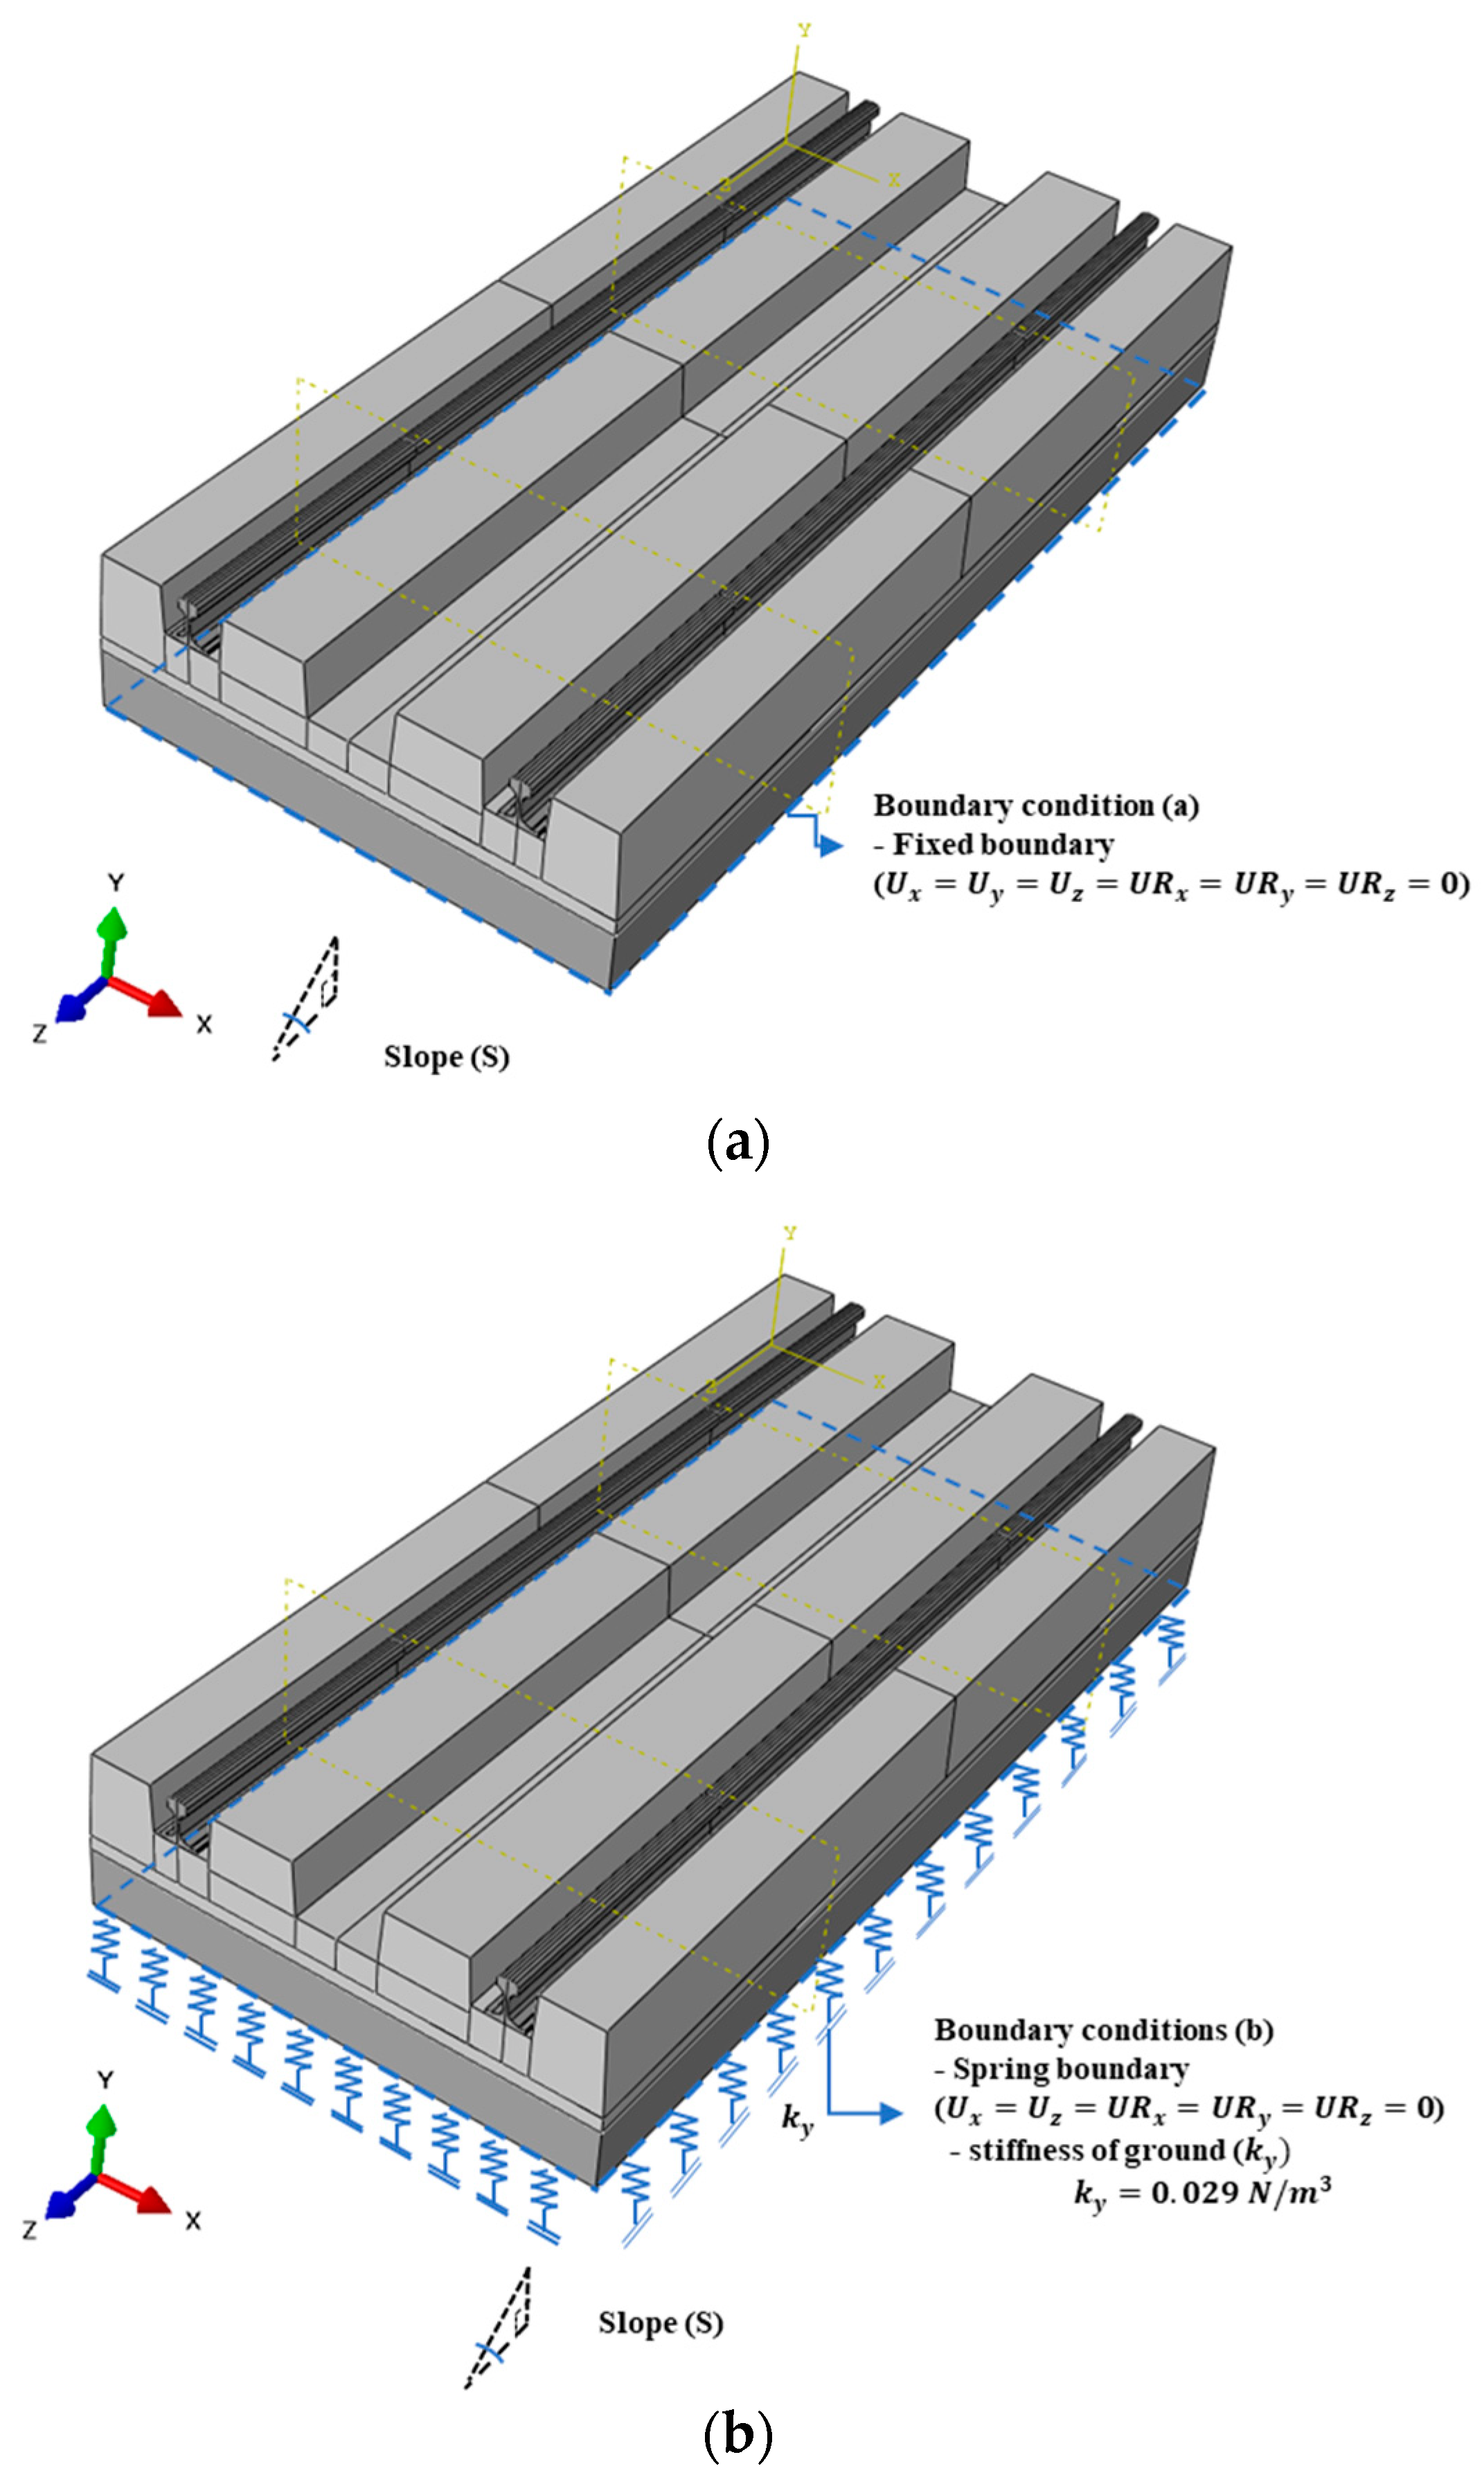
2.5. Boundary Conditions
3. Parametric Study for the Establishment of the Track Boundary Conditions of the Reference Model of the Mountain-ERS
3.1. Mesh Convergence Analysis
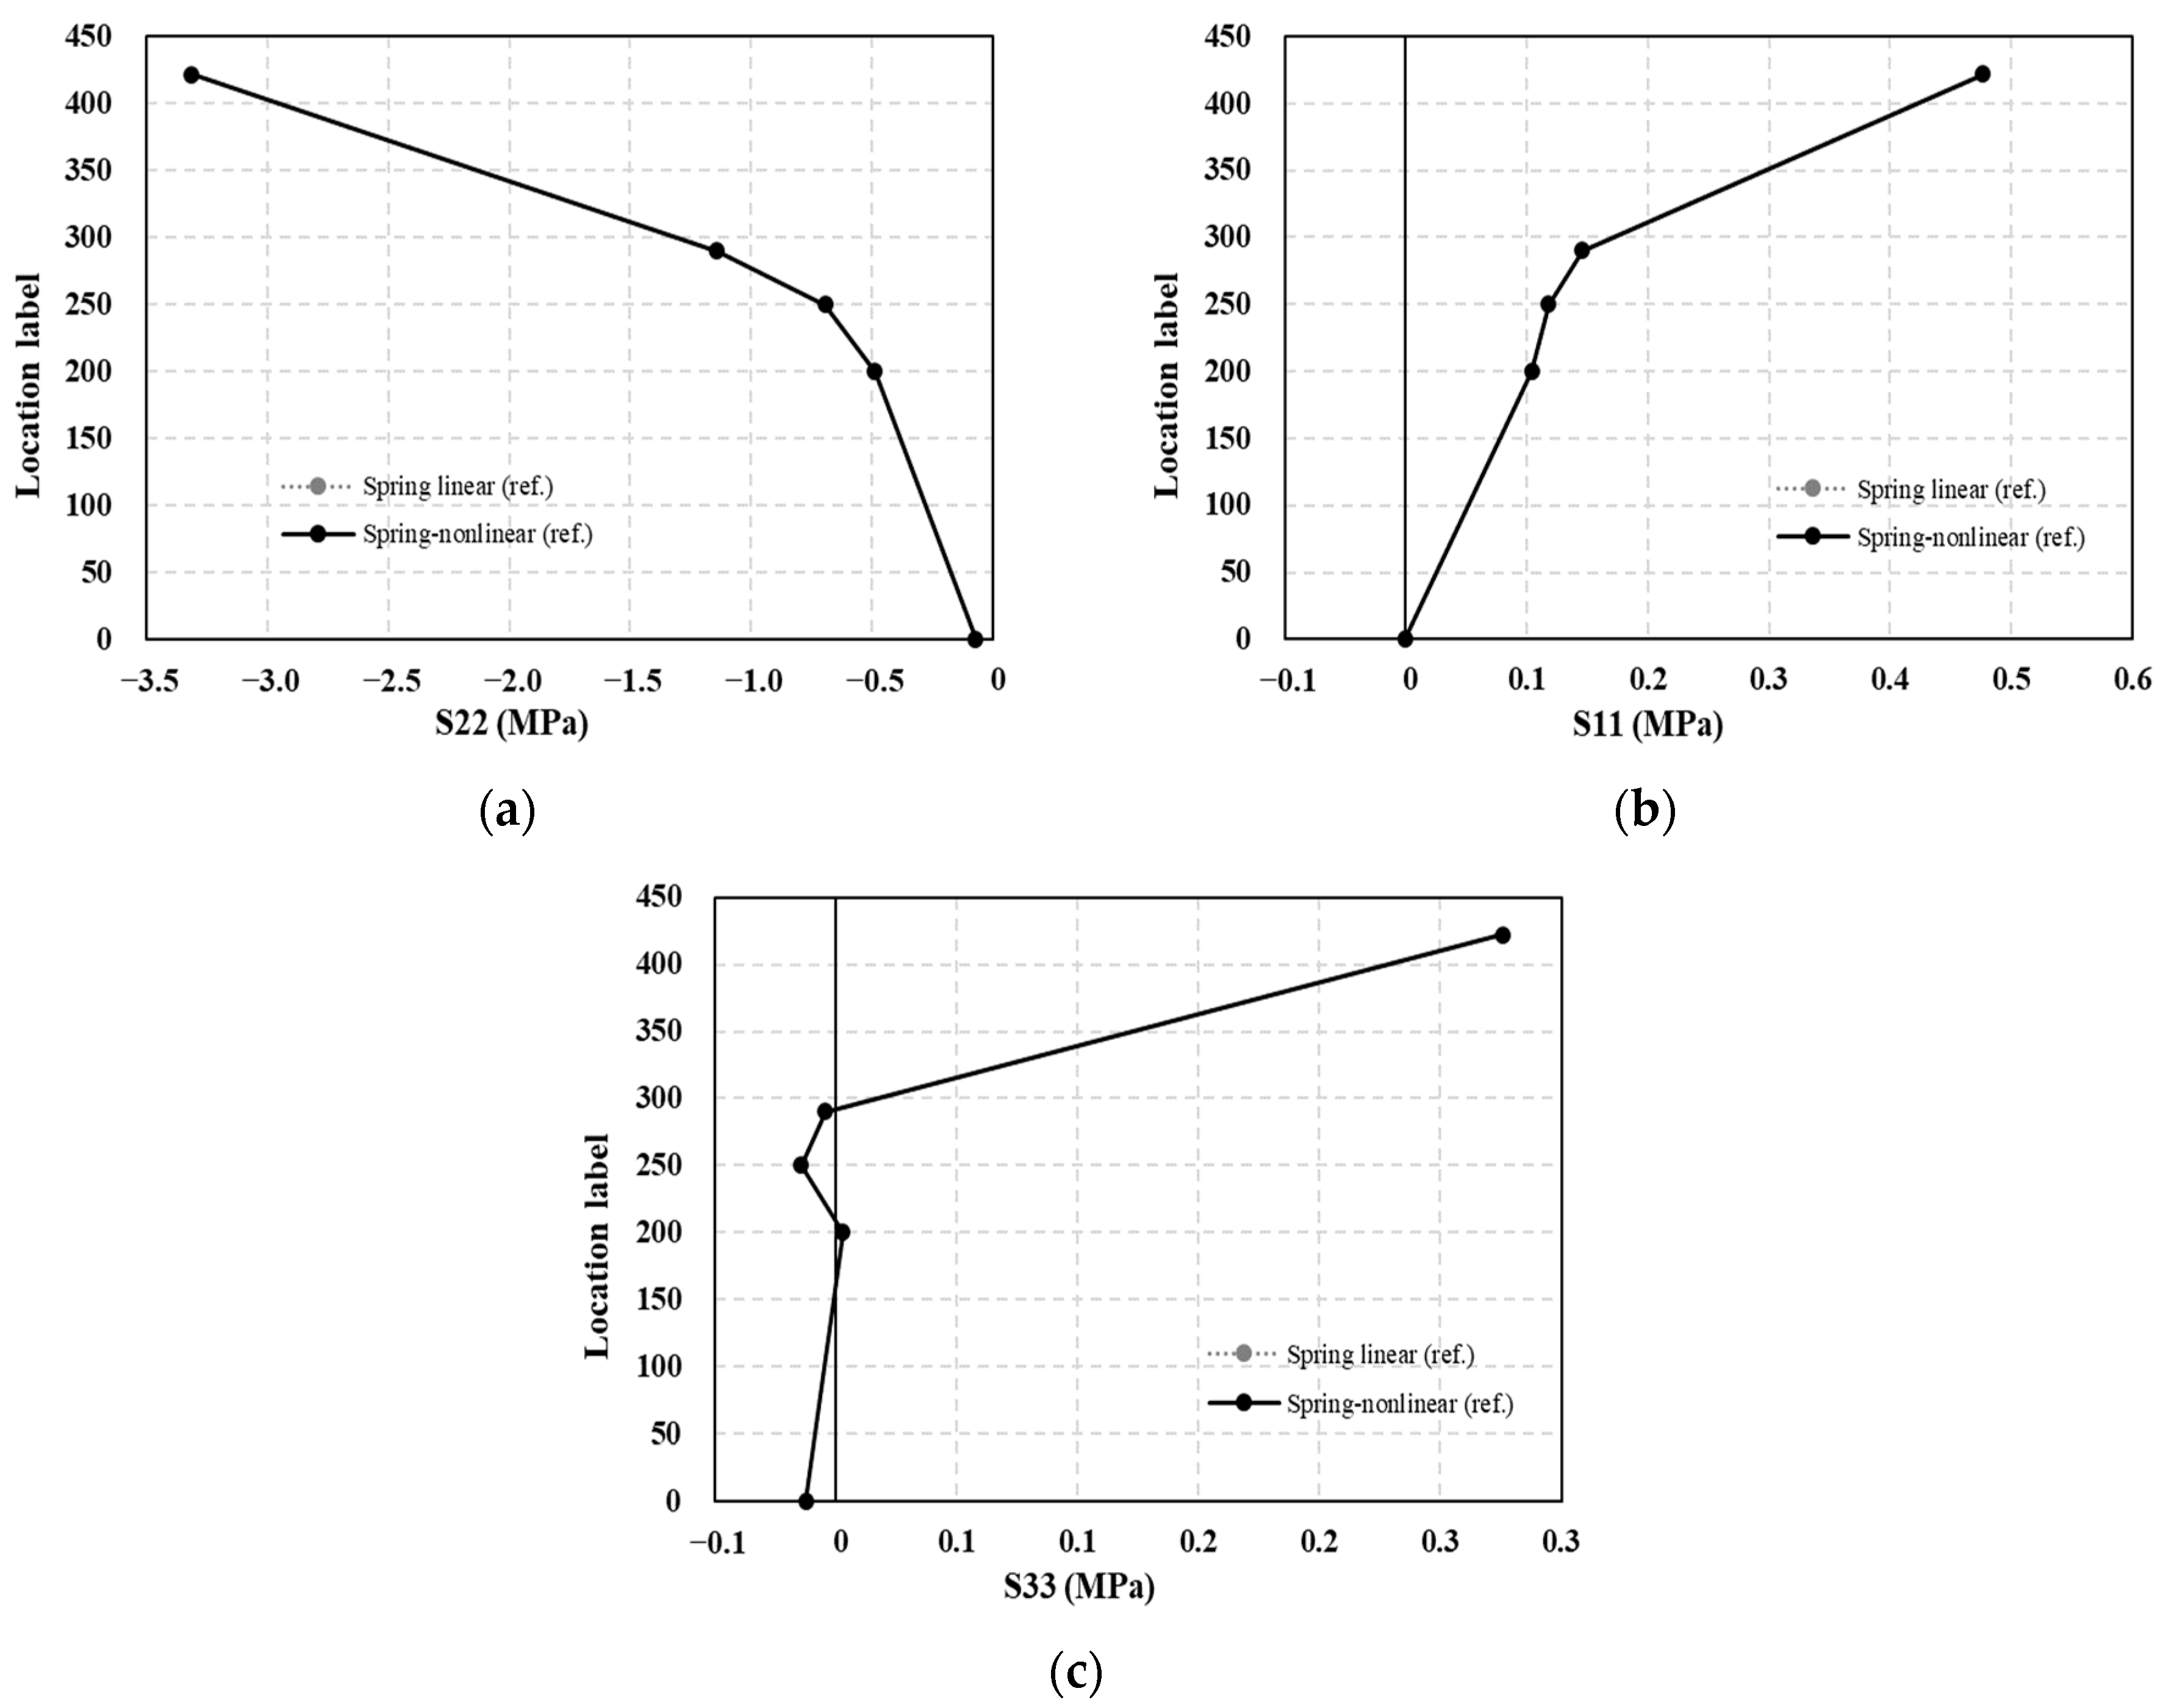
3.2. Examination of the Nonlinear Effects on the Structural Behavior of the Mountain-ERS Track
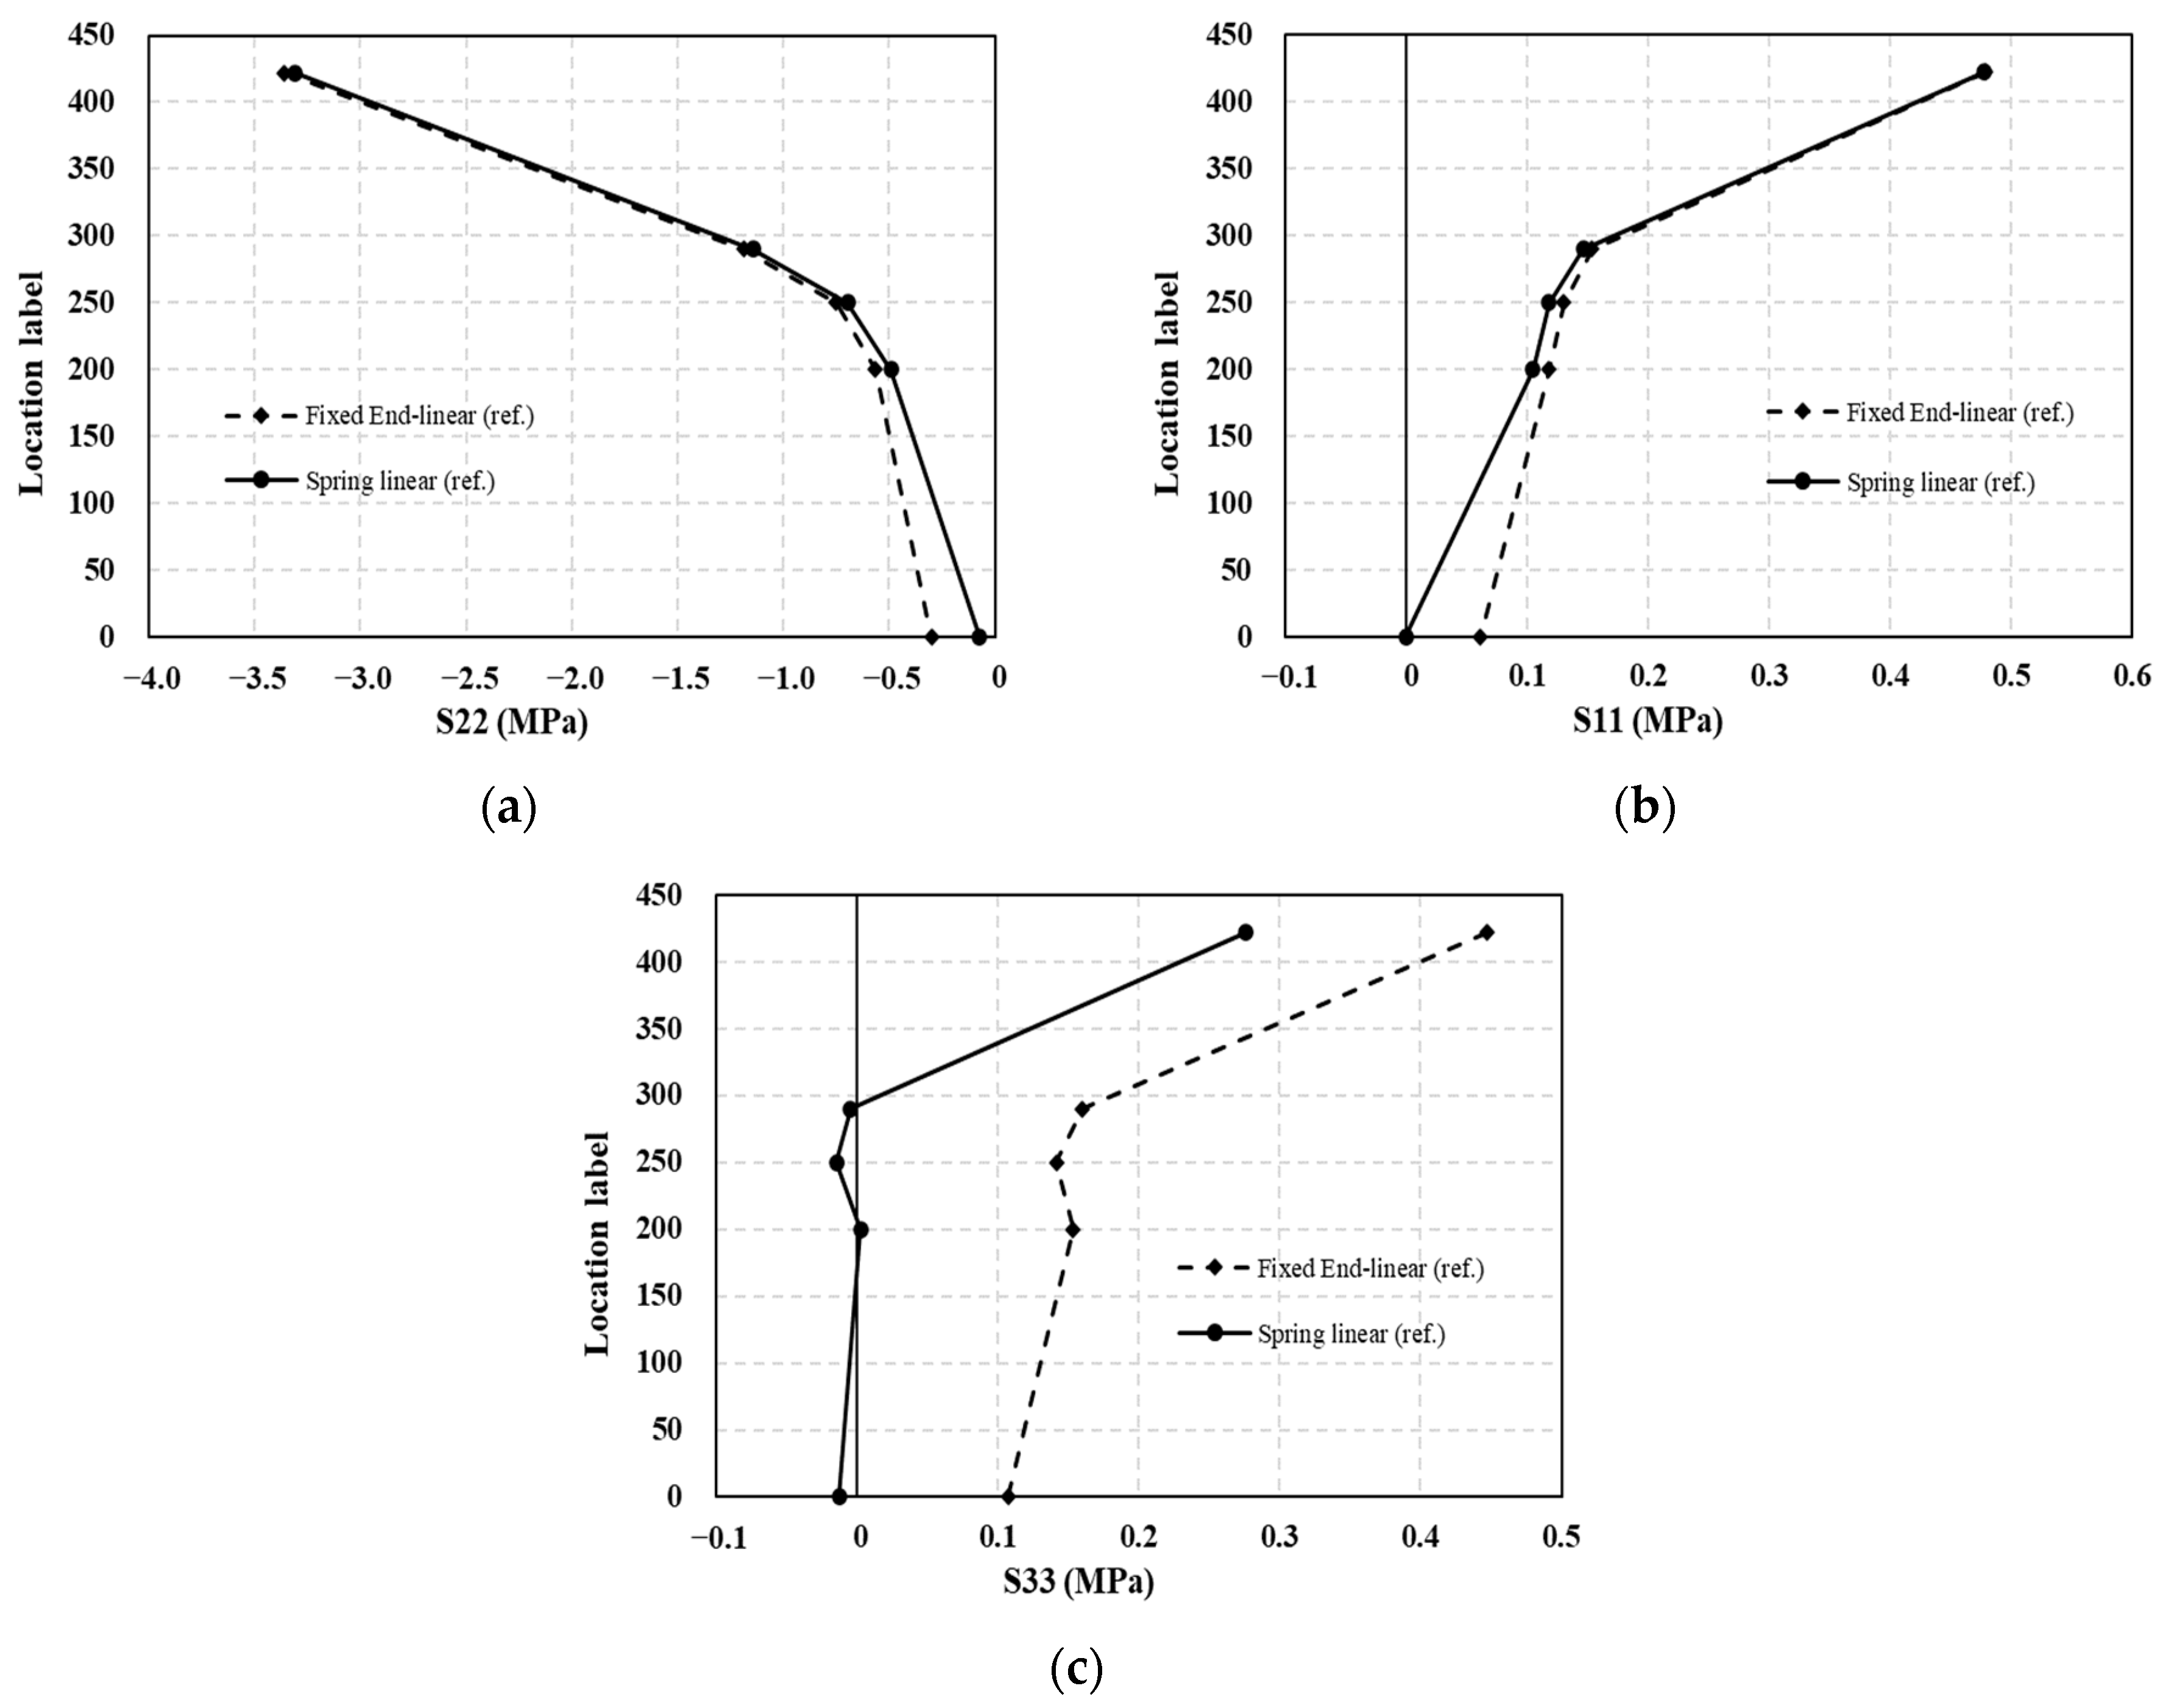
3.3. Influences of Different Boundary Conditions on the Analyzed Results
4. Analytical Investigation of the Behavioral Characteristics of the Mountain-ERS Track System
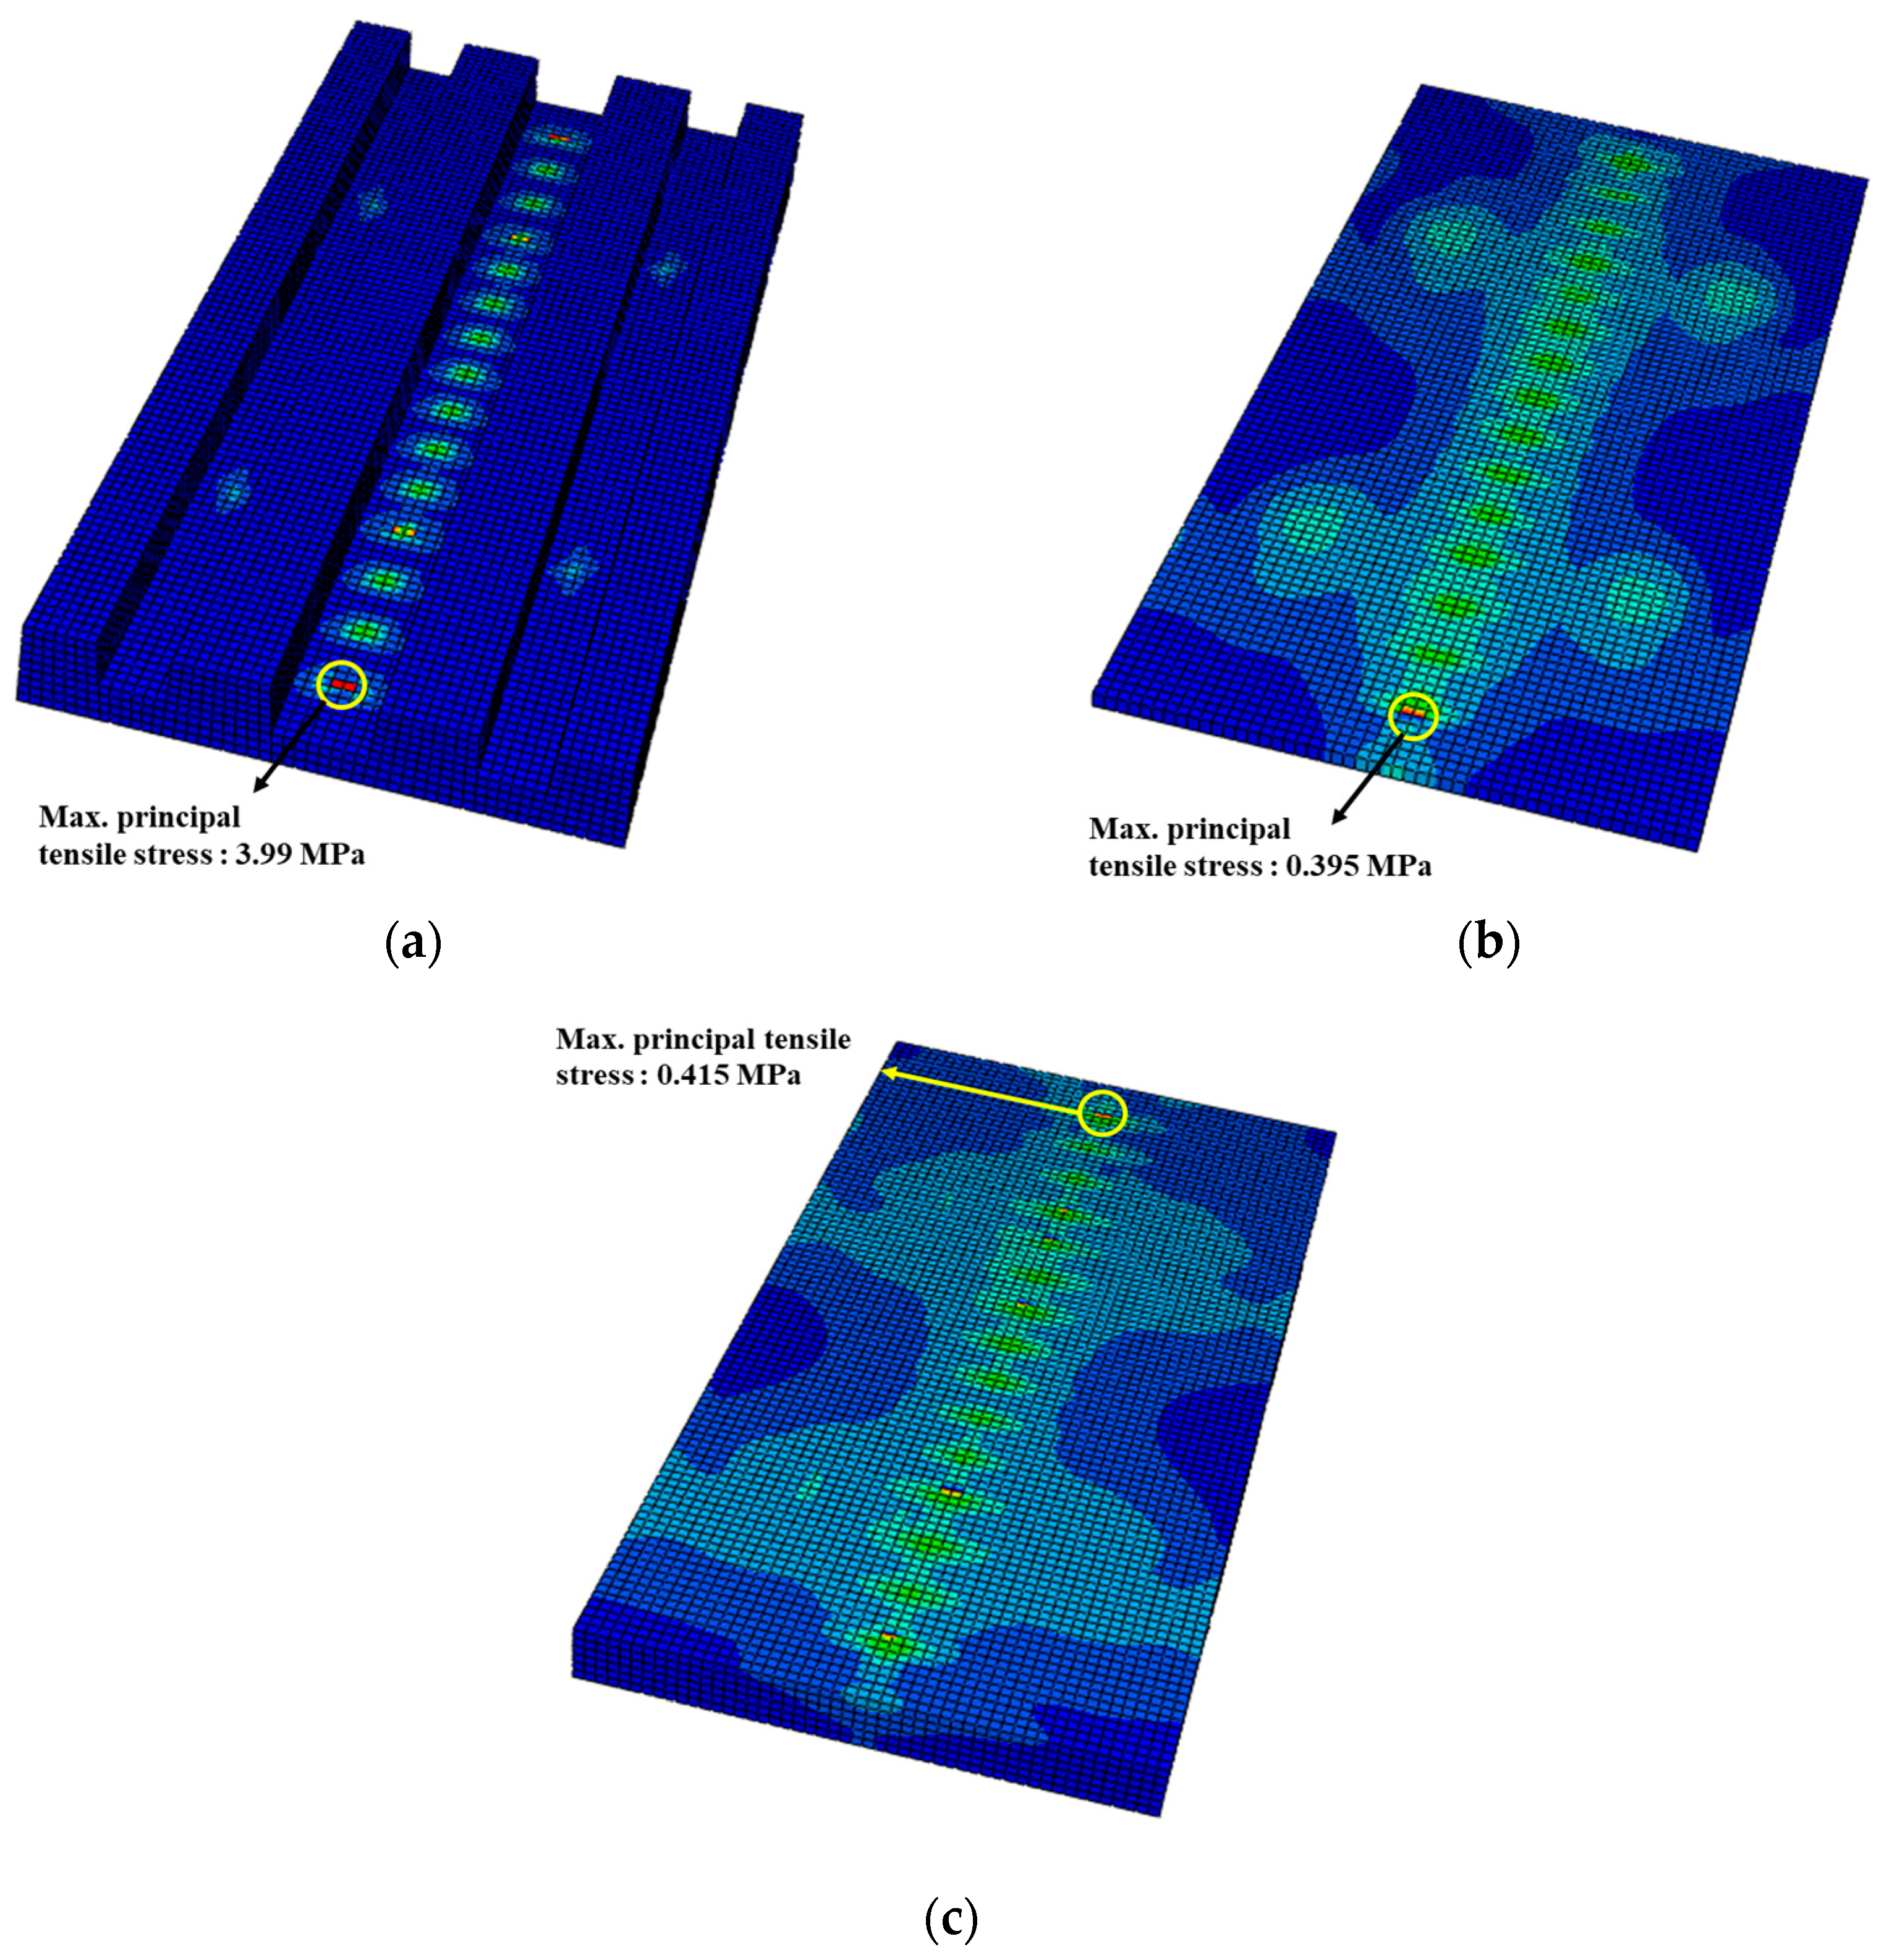
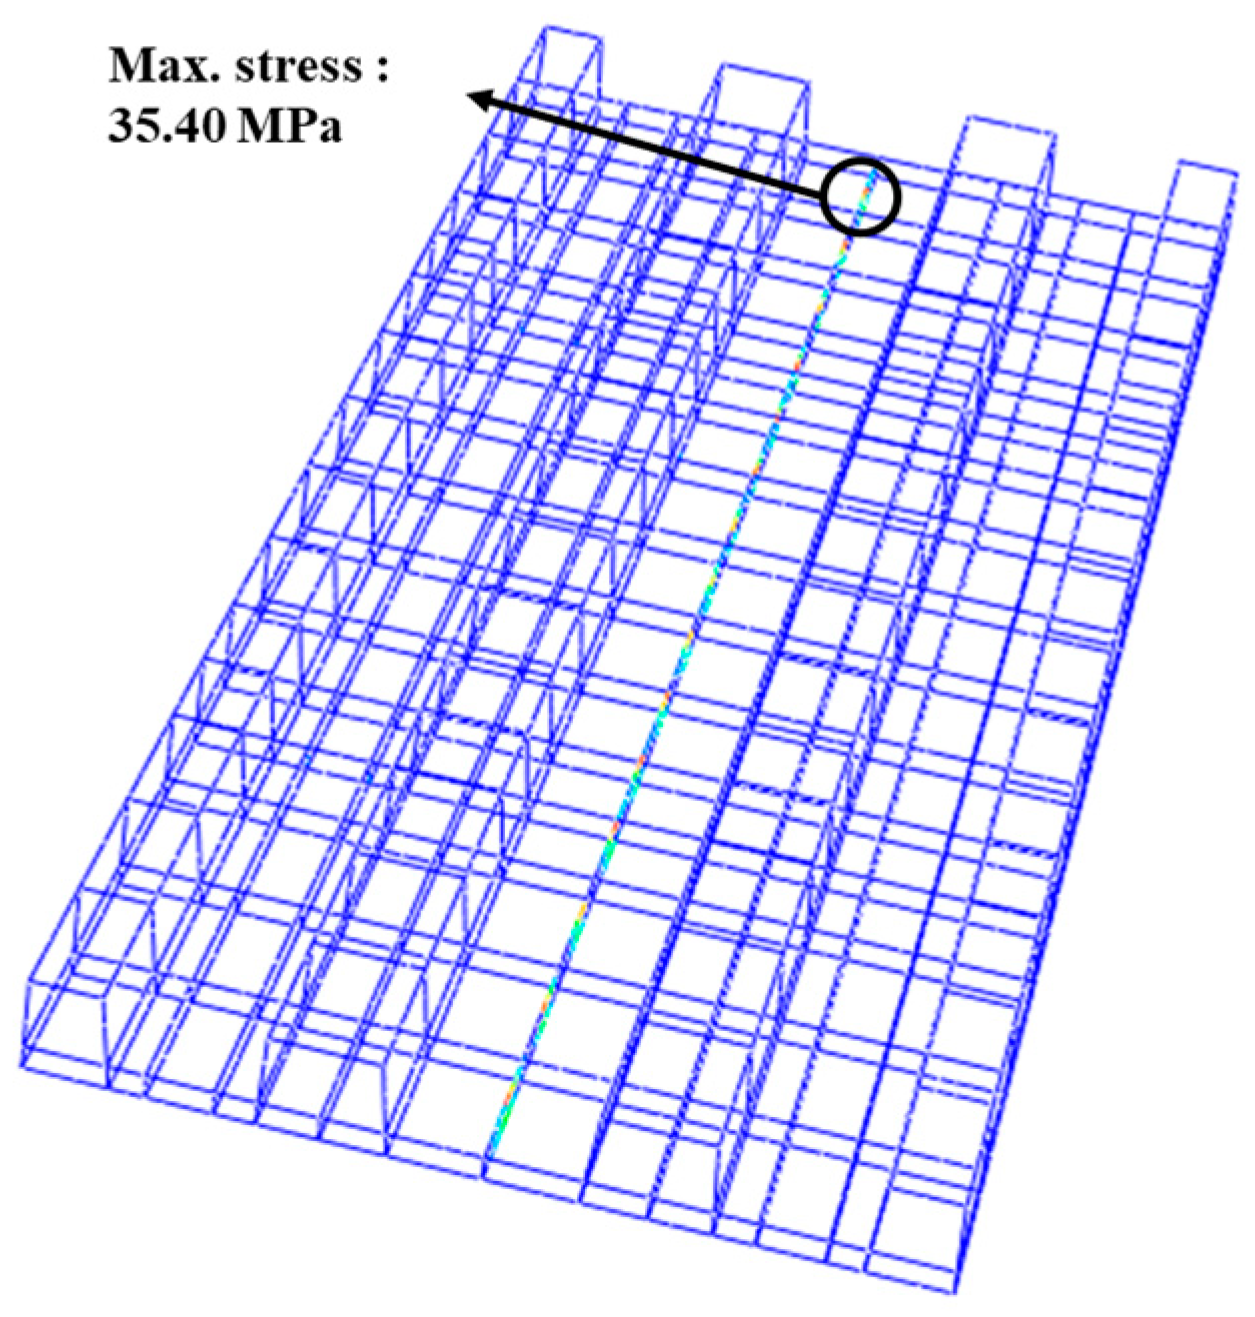
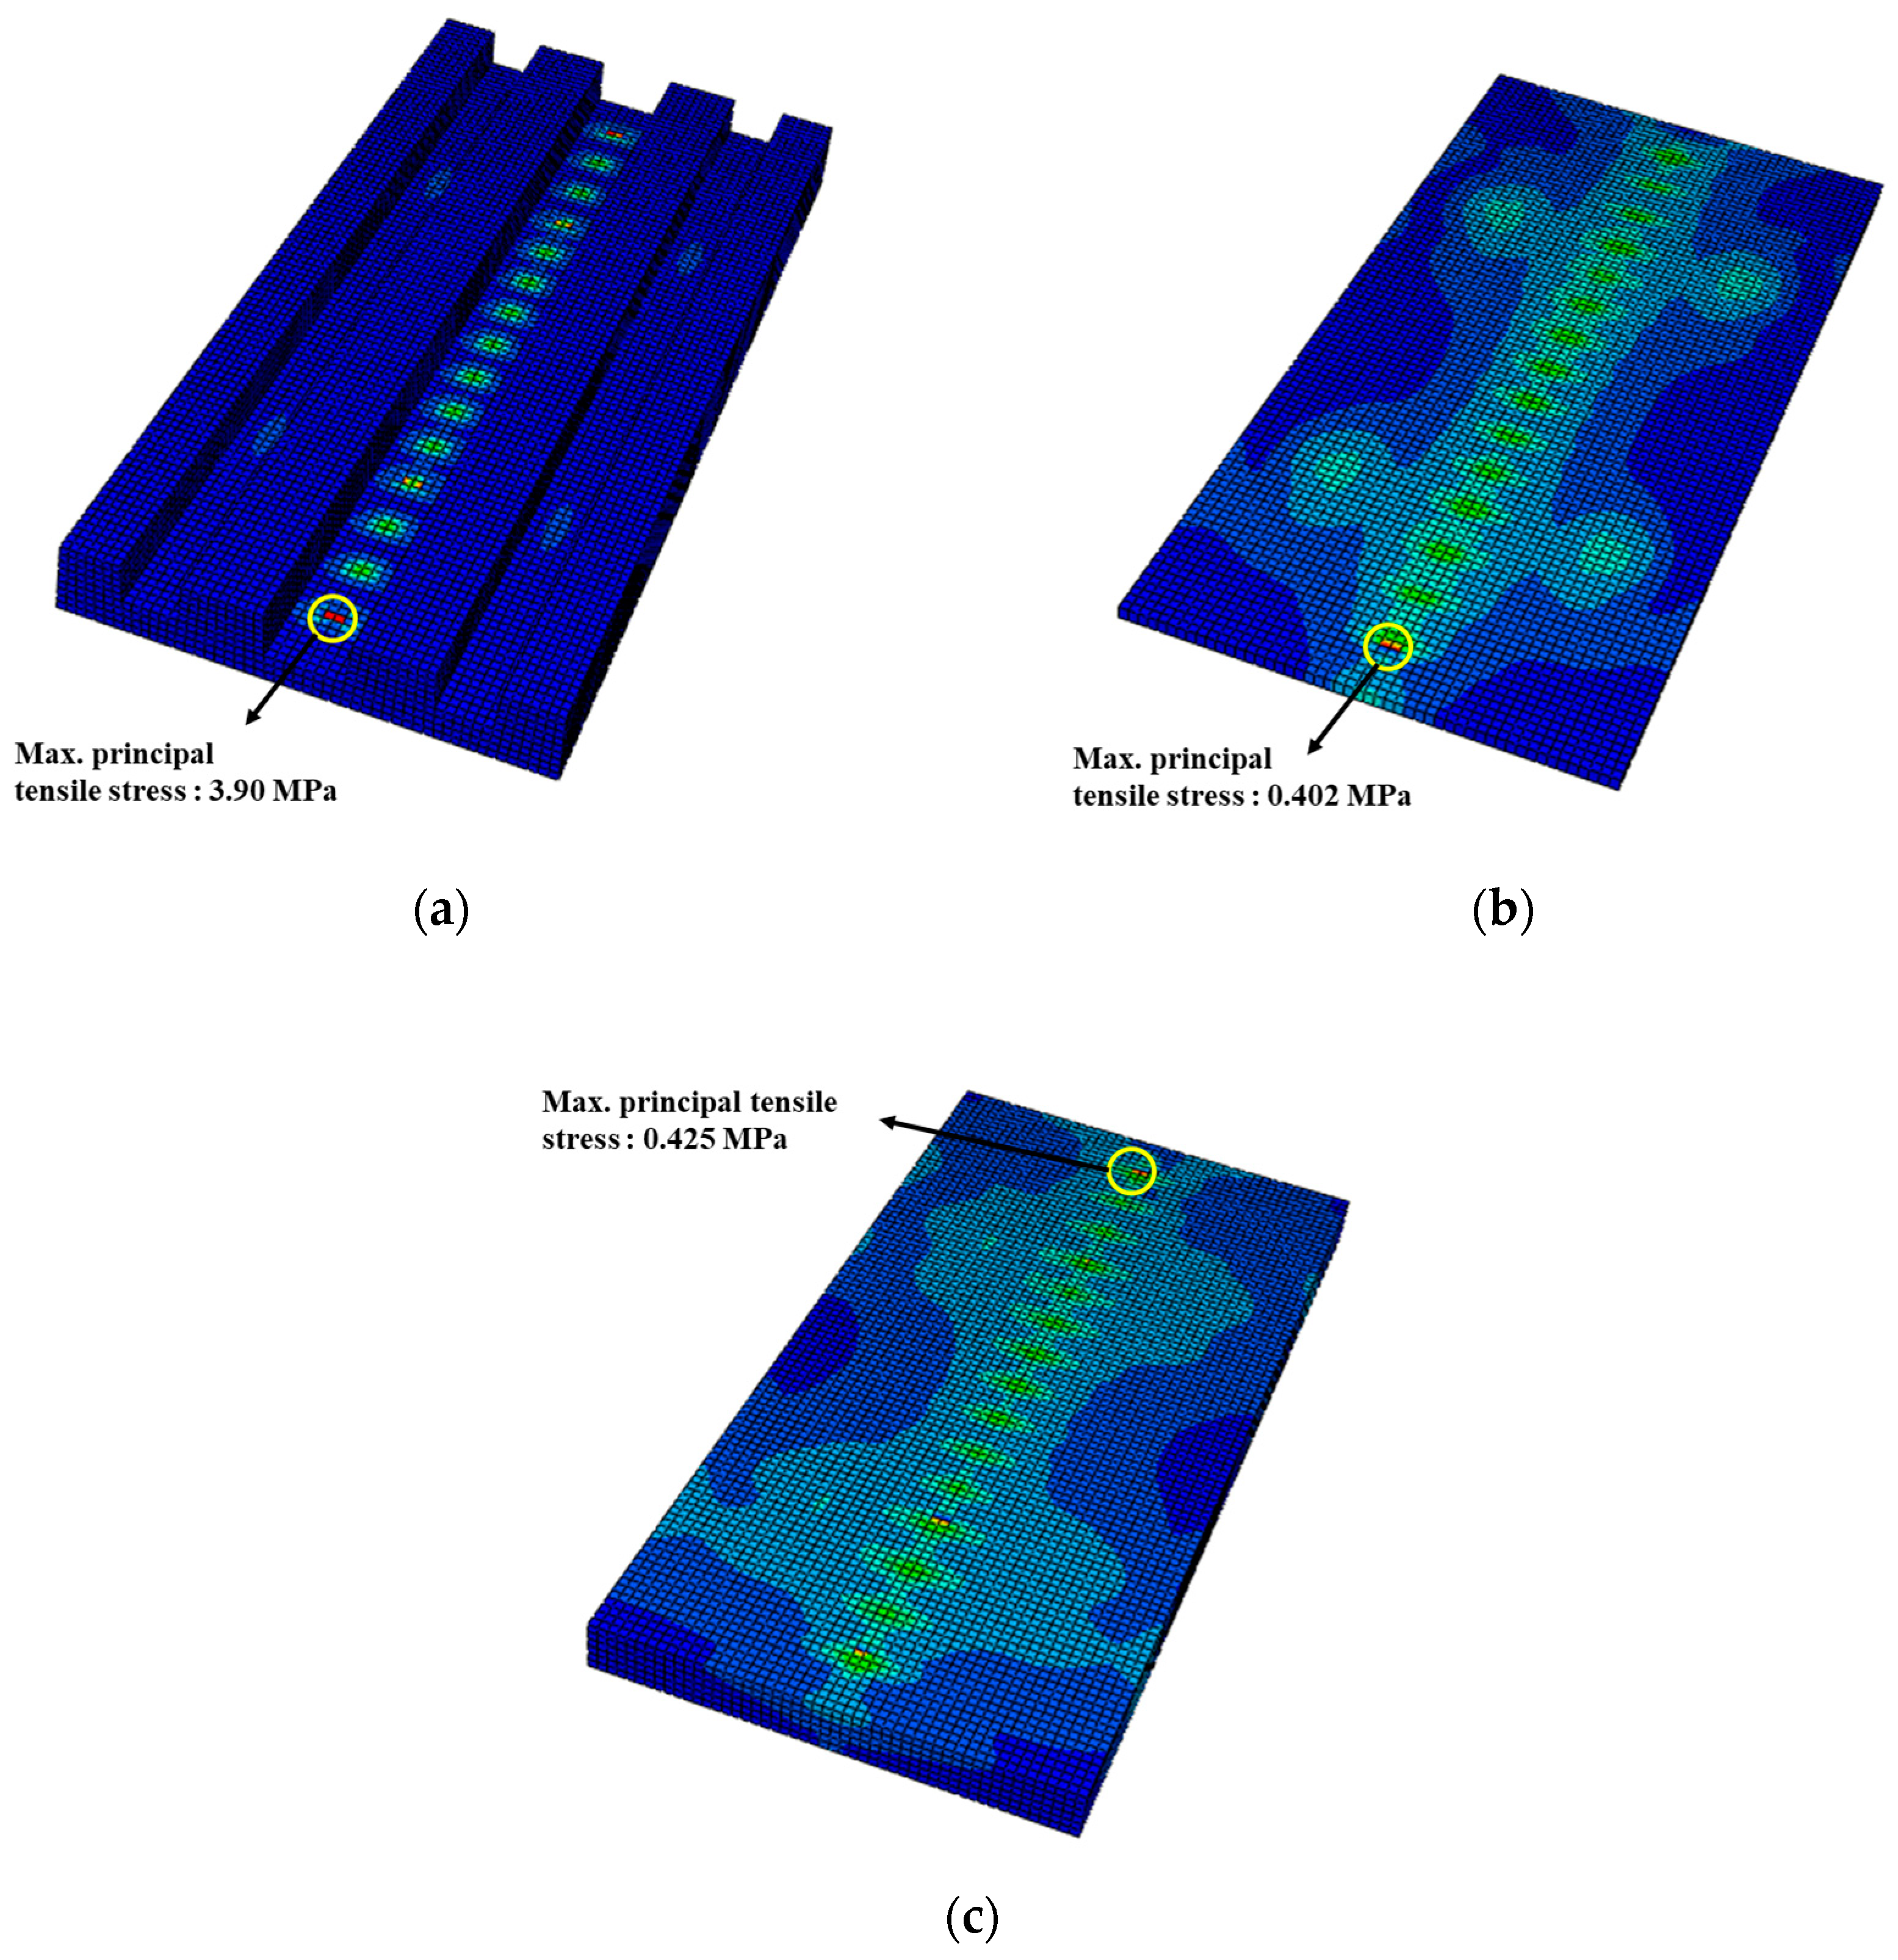
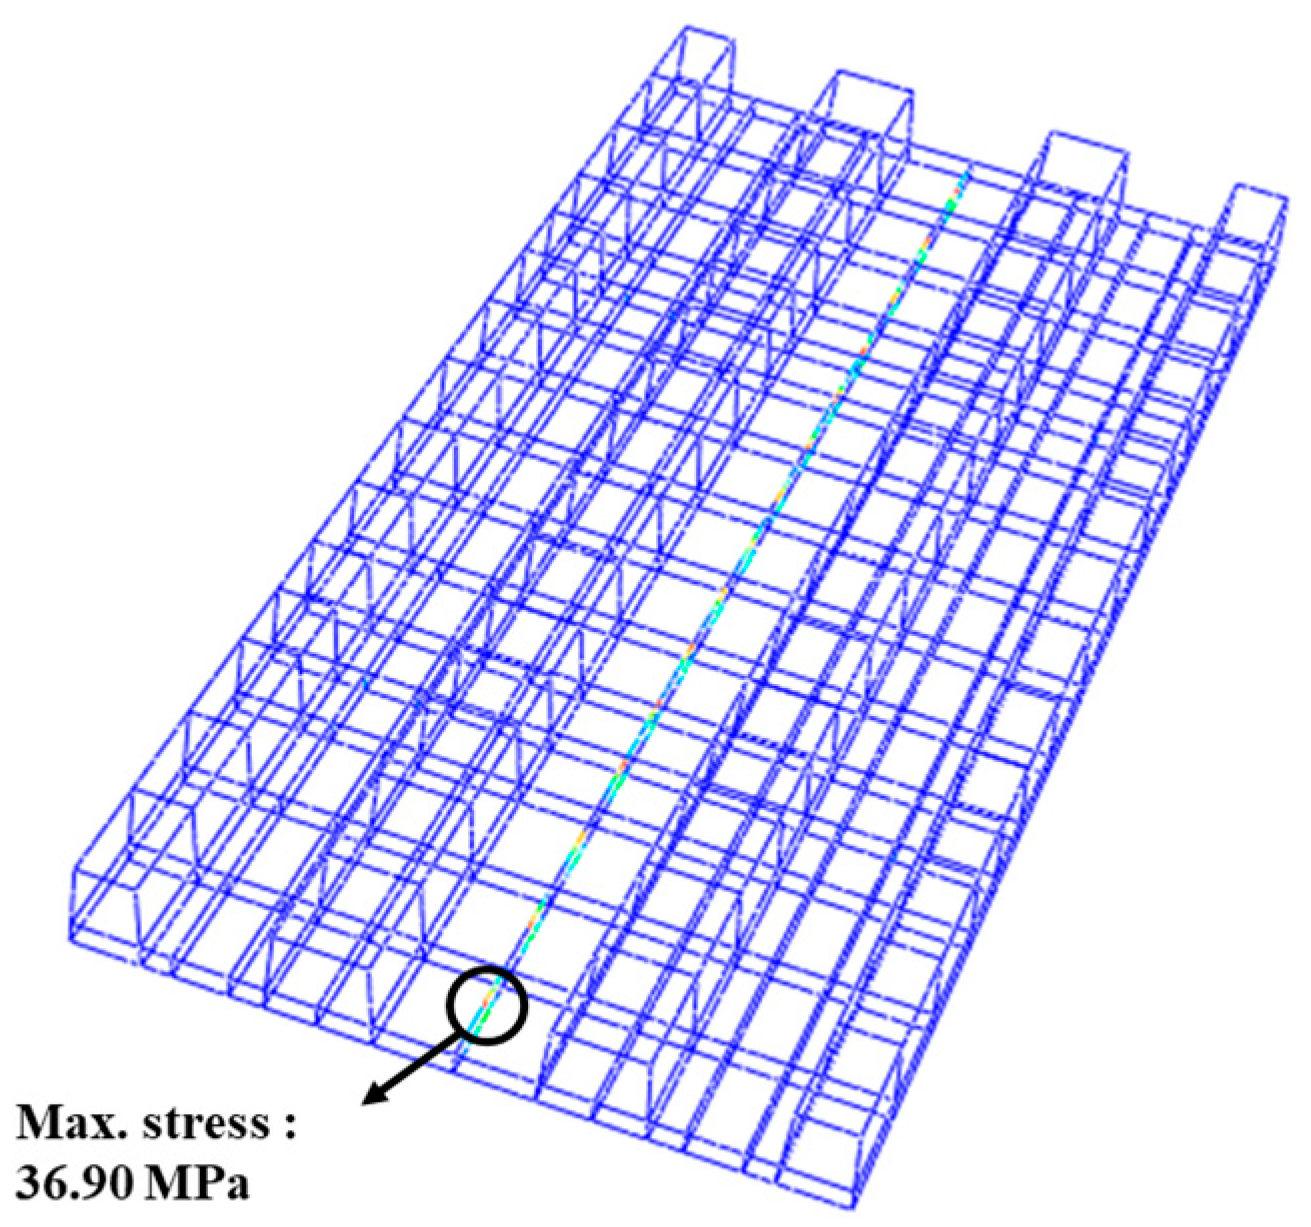
4.1. Structural Safety Evaluation of the Mountain-ERS under Factored Service Loading Conditions
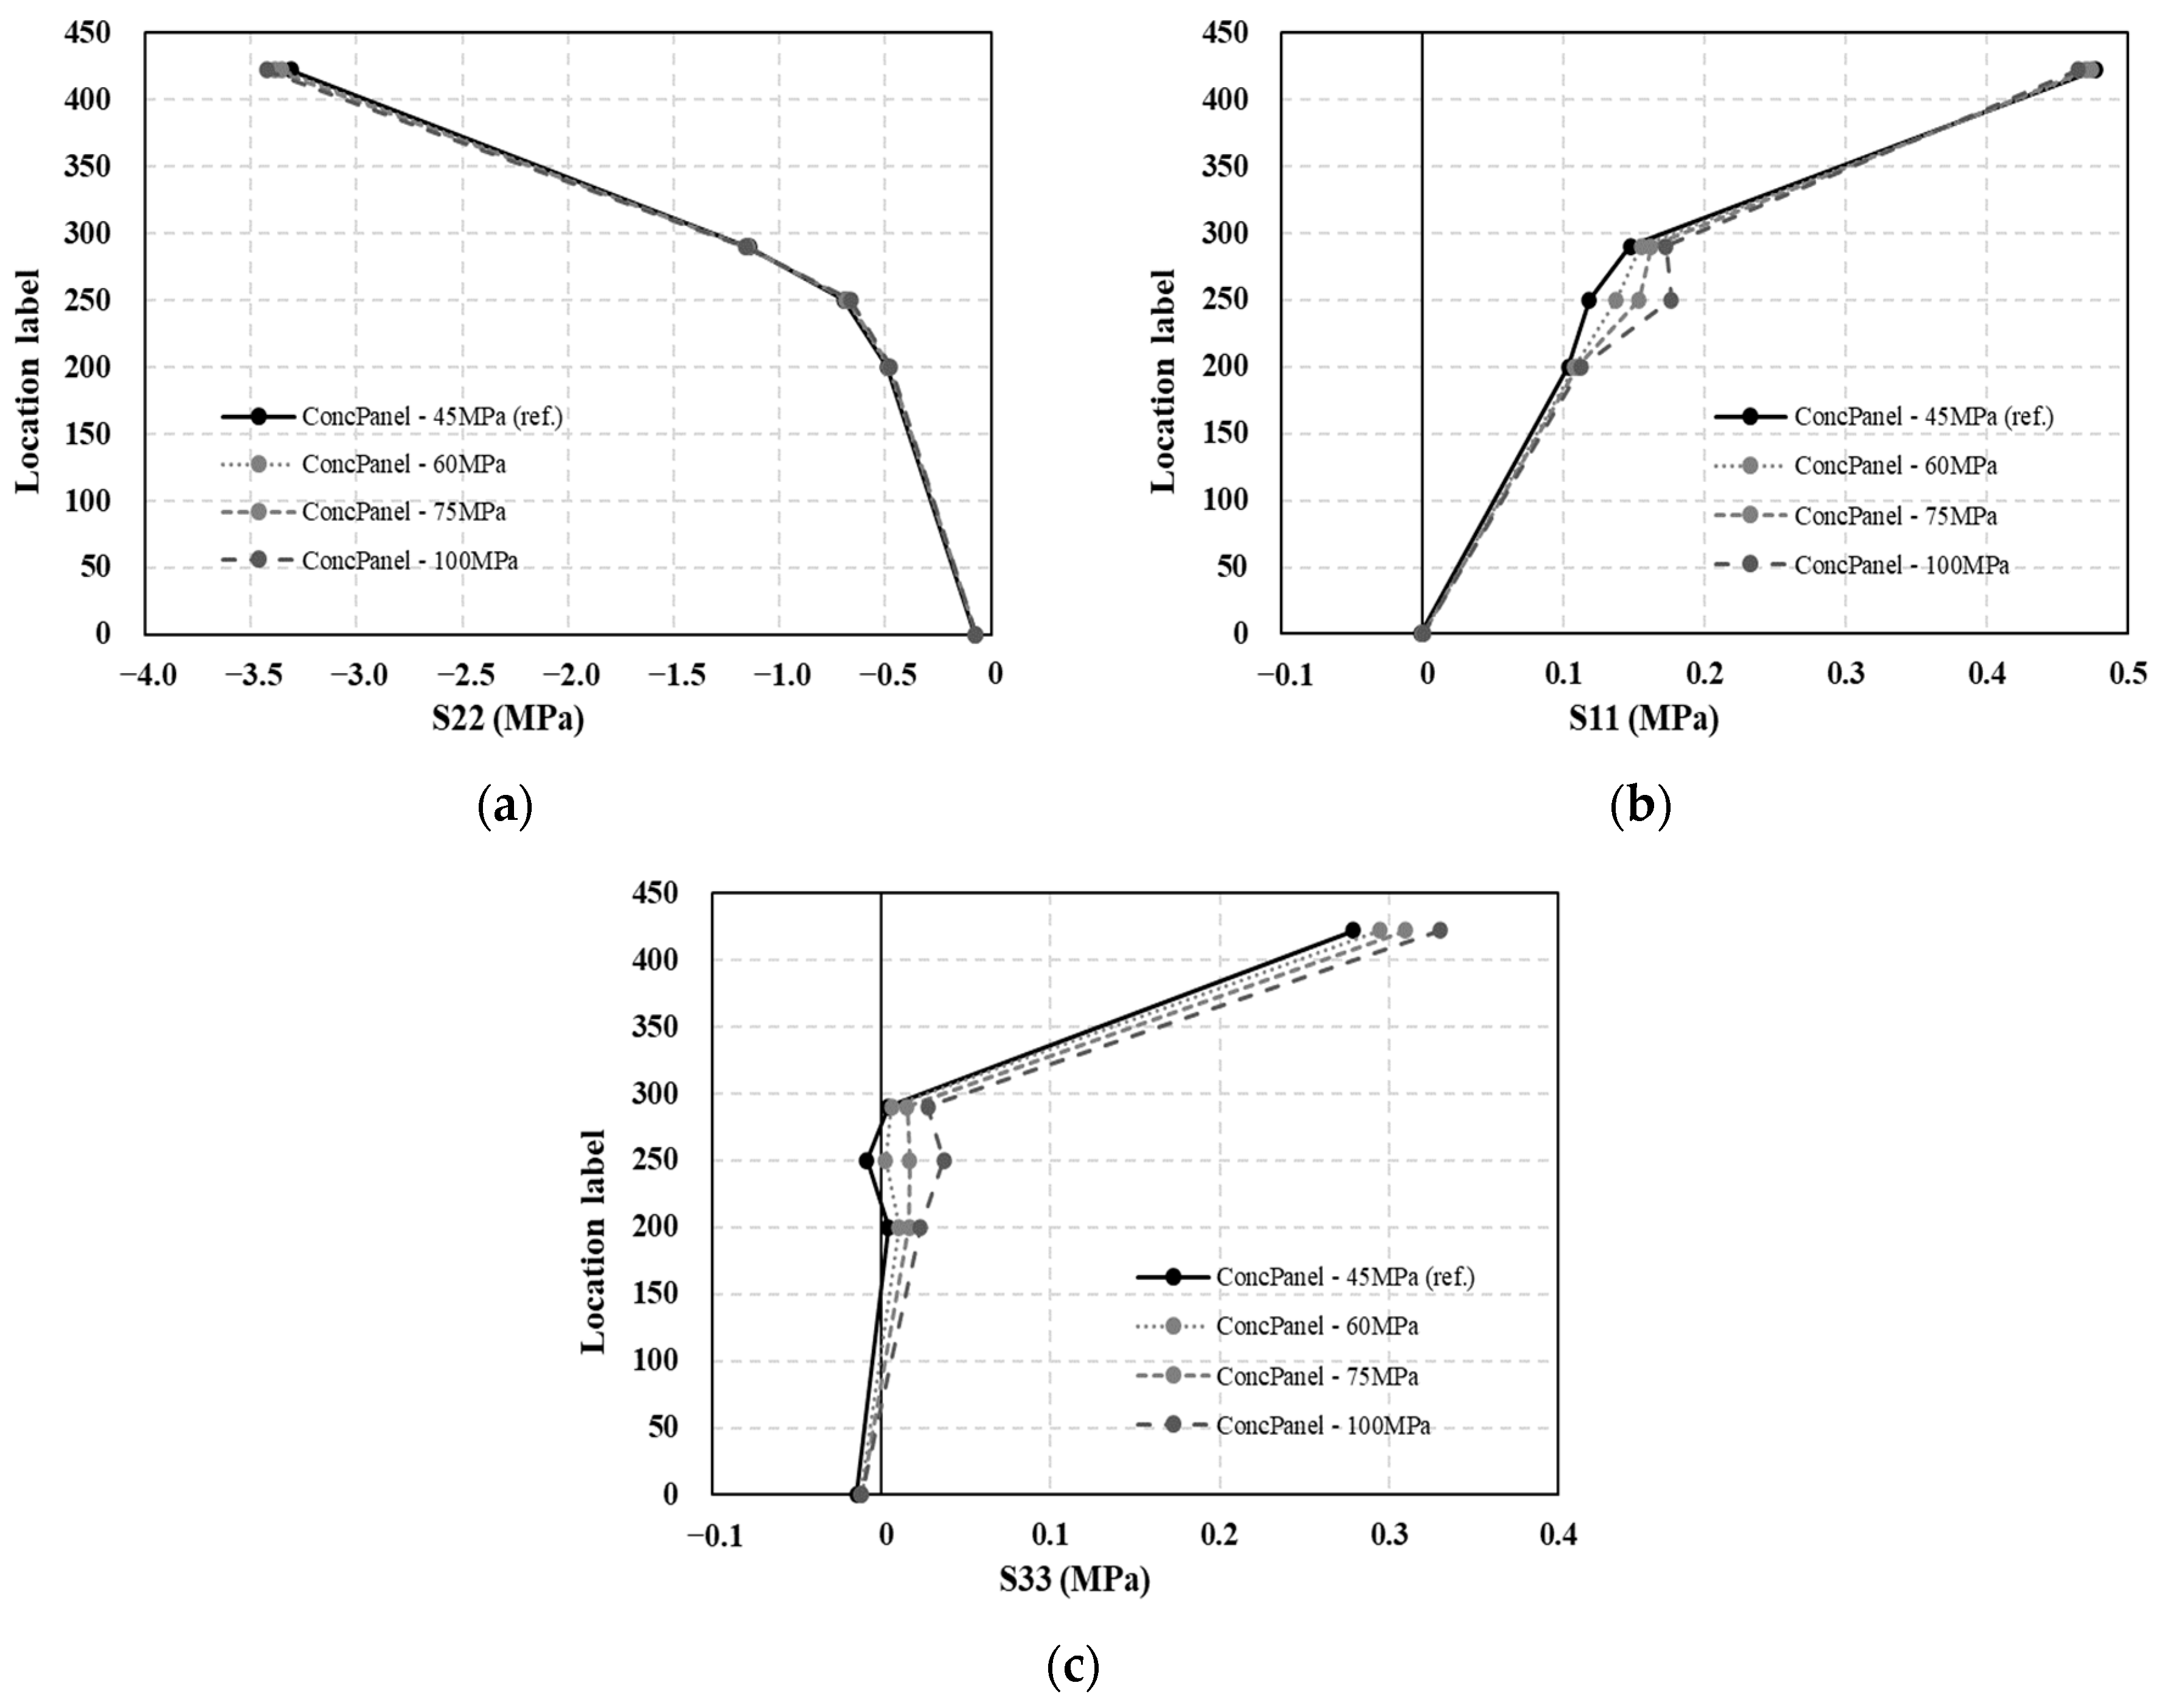
4.2. Feasibility Study of High-Strength Concrete Material for Enhancing the Structural Safety of the Mountain-ERS Track
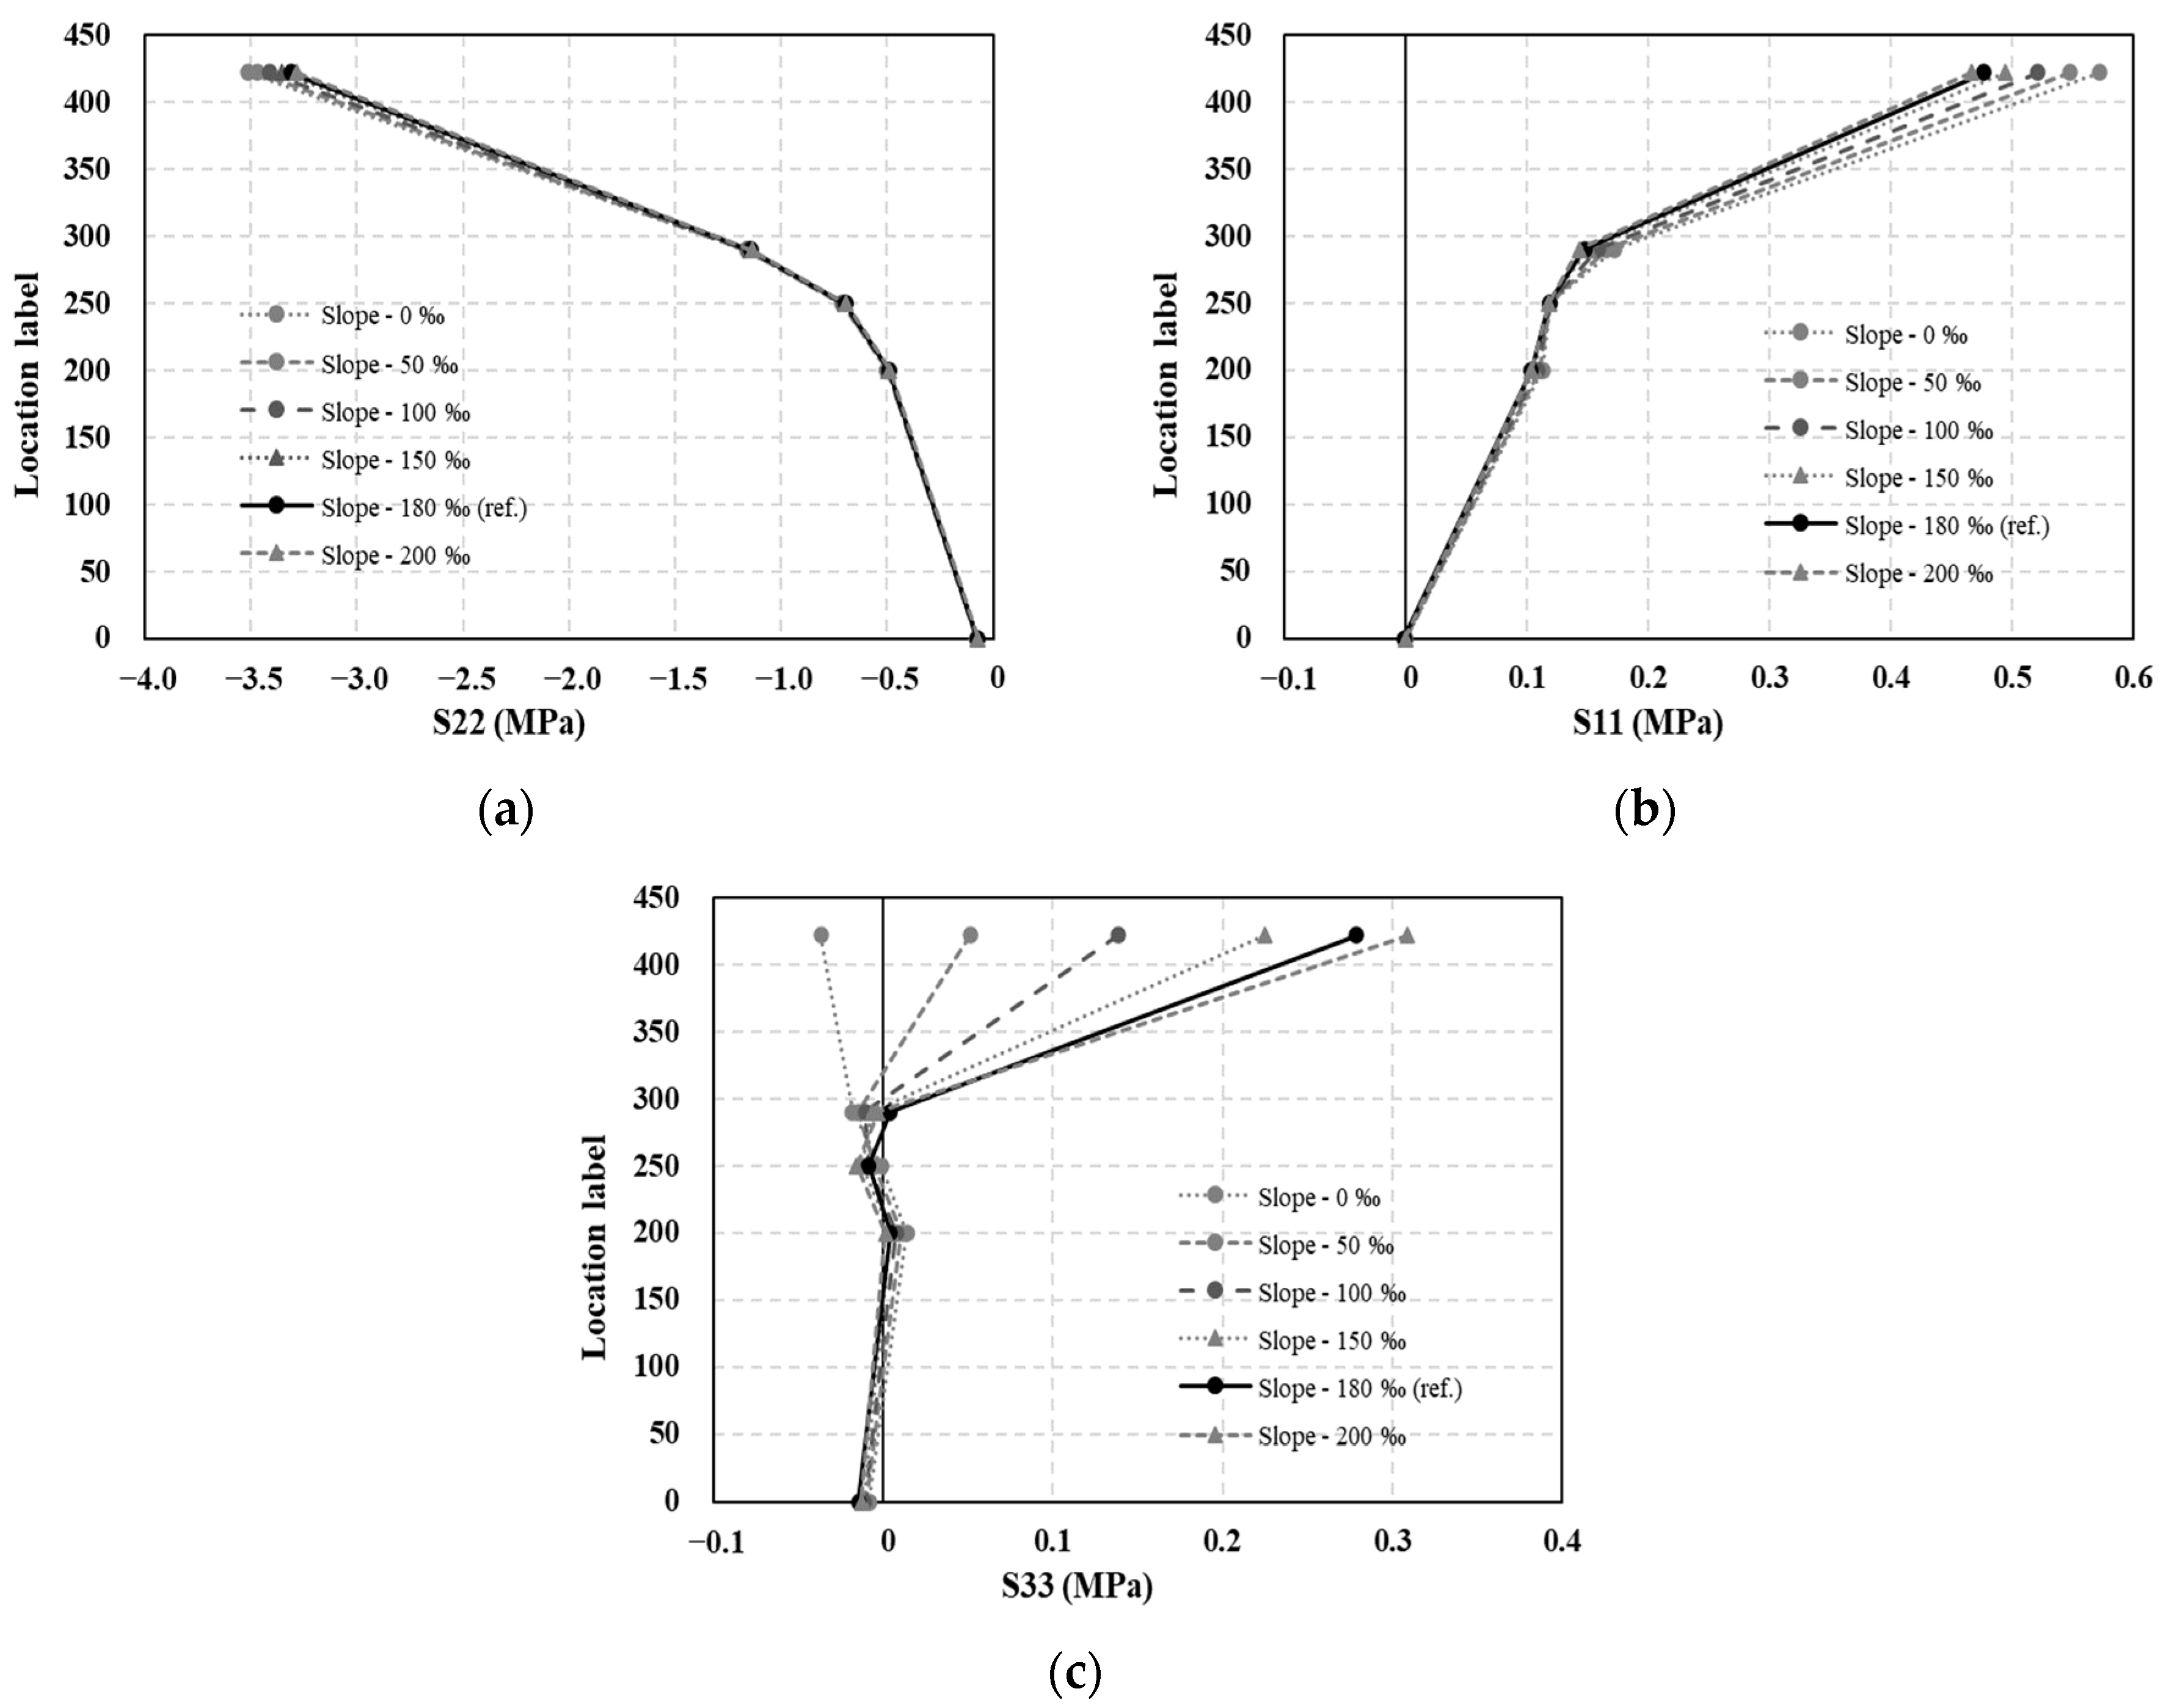
4.3. Effects of the Gradient Variation on the Stress of the Mountain-ERS Track
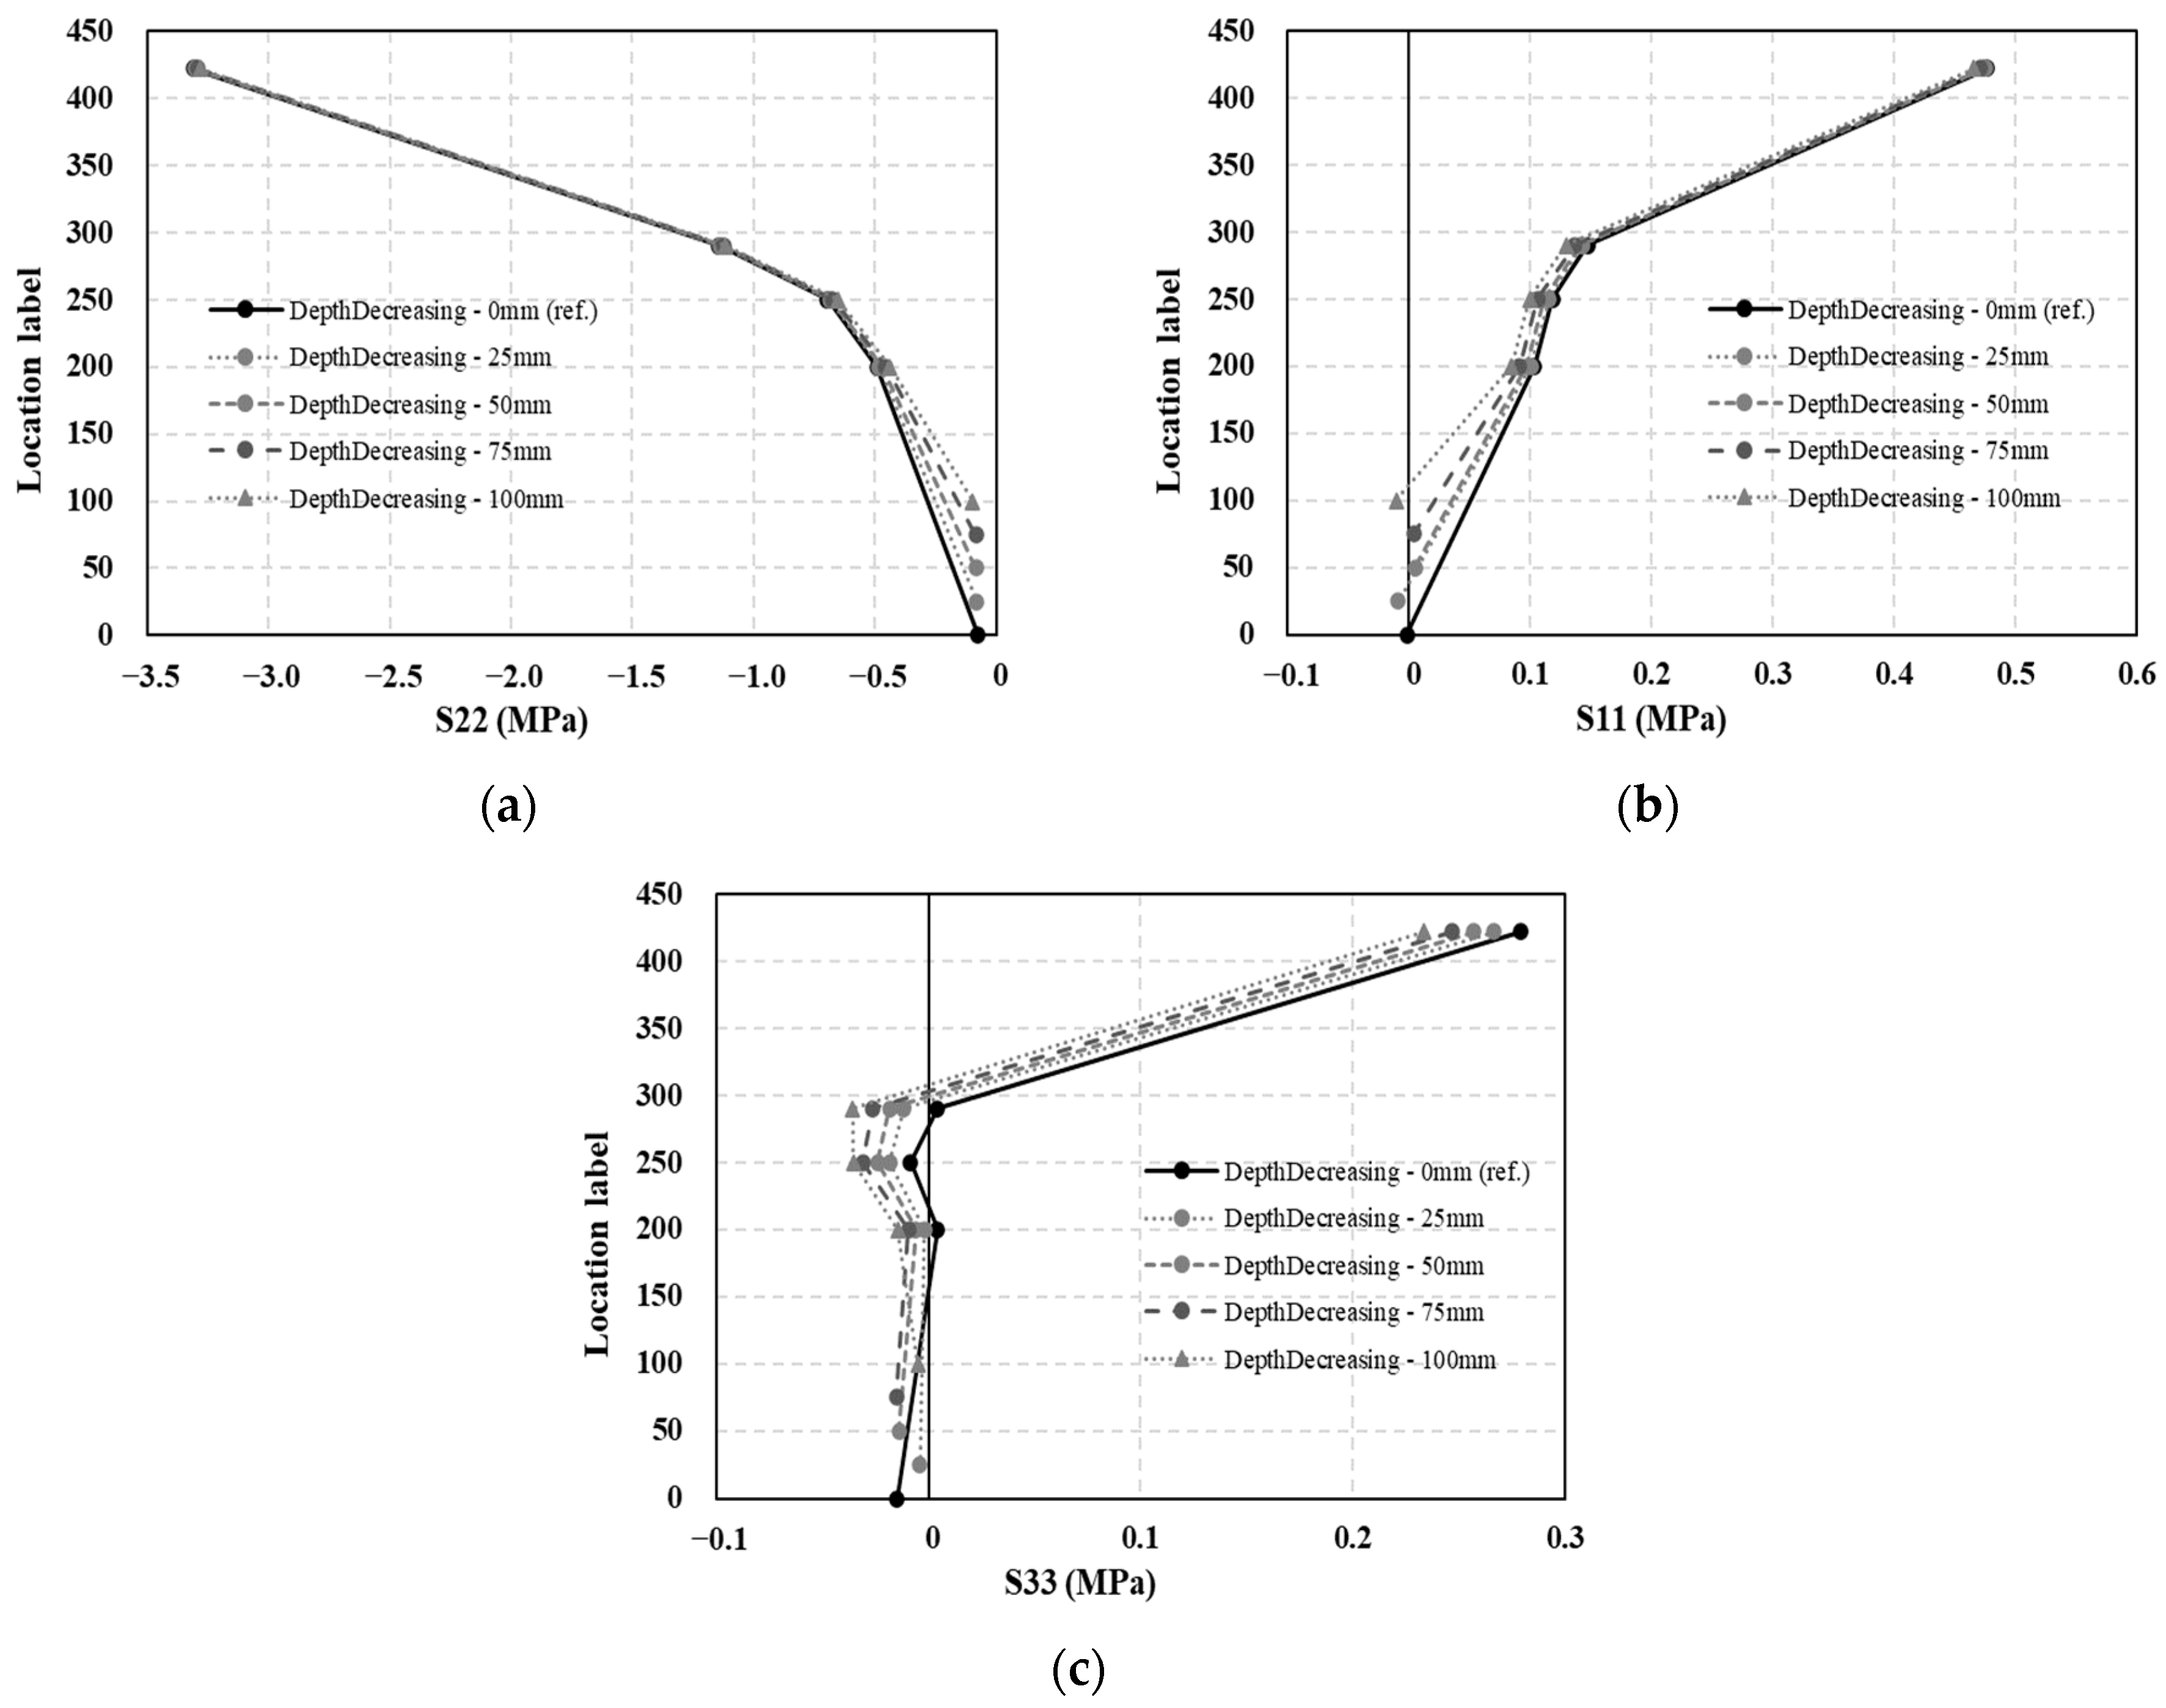
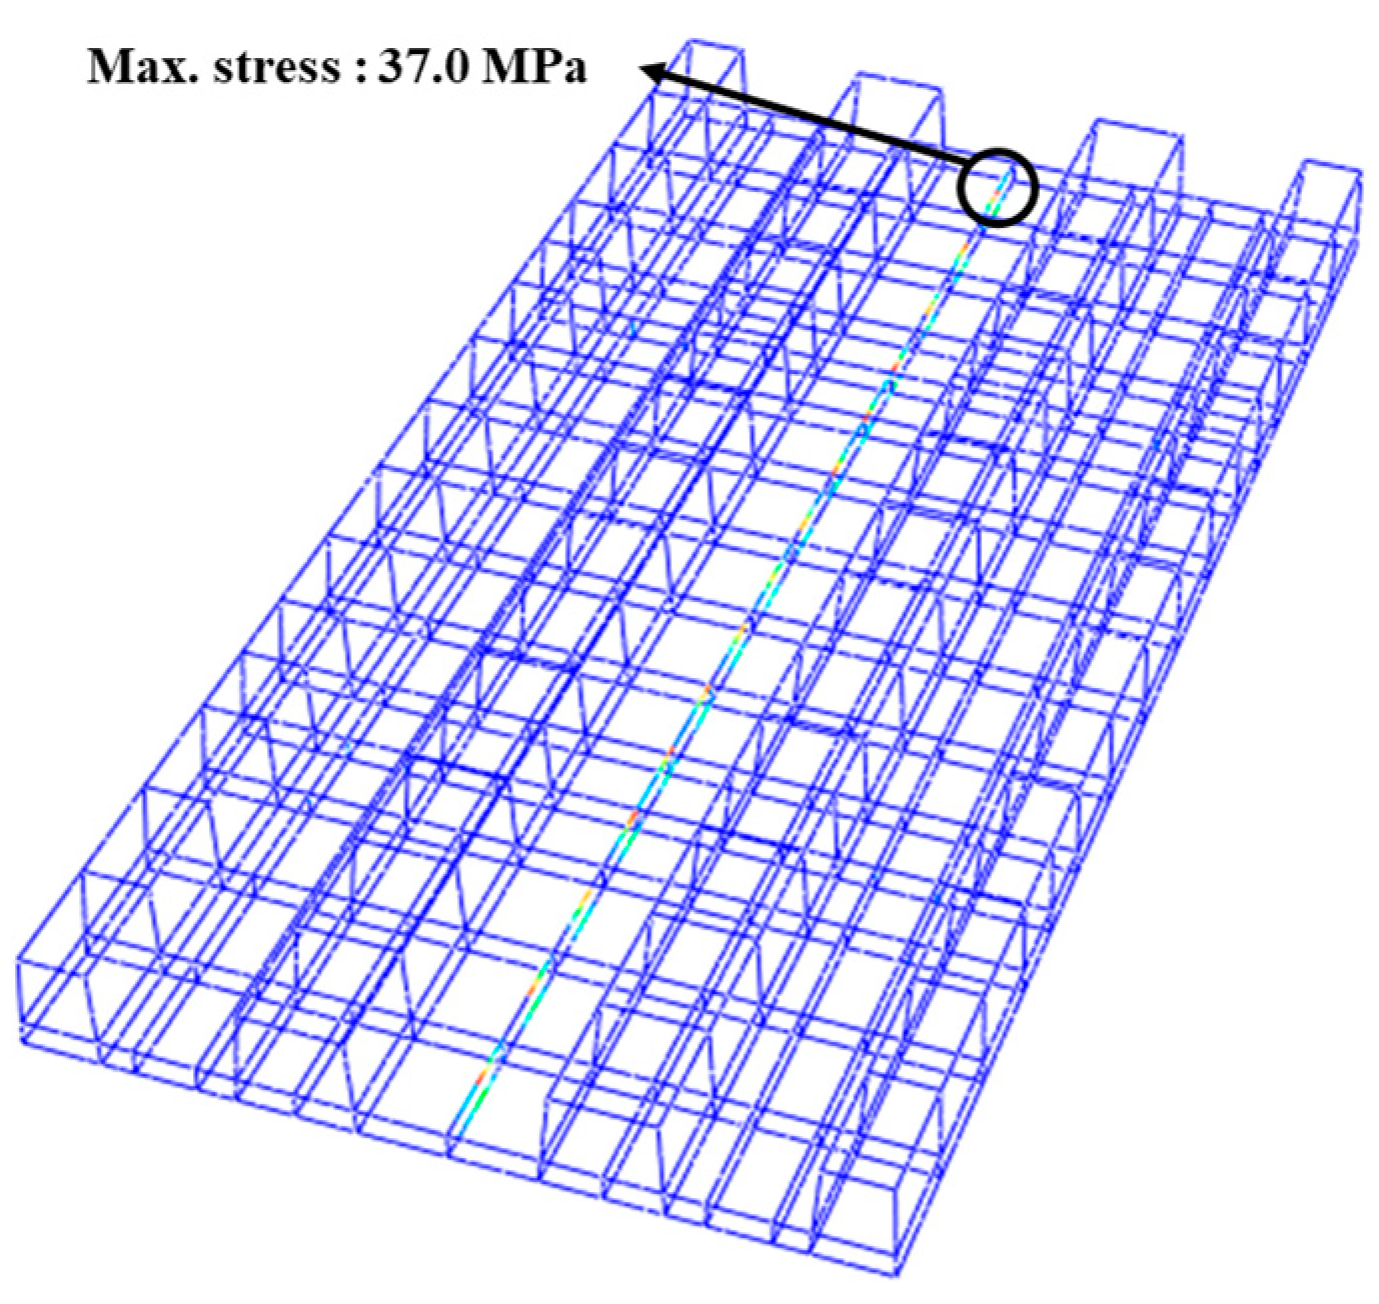
4.4. Effects of Thickness of the Subgrade Layer on the Stress of the Mountain-ERS Track
5. Conclusions
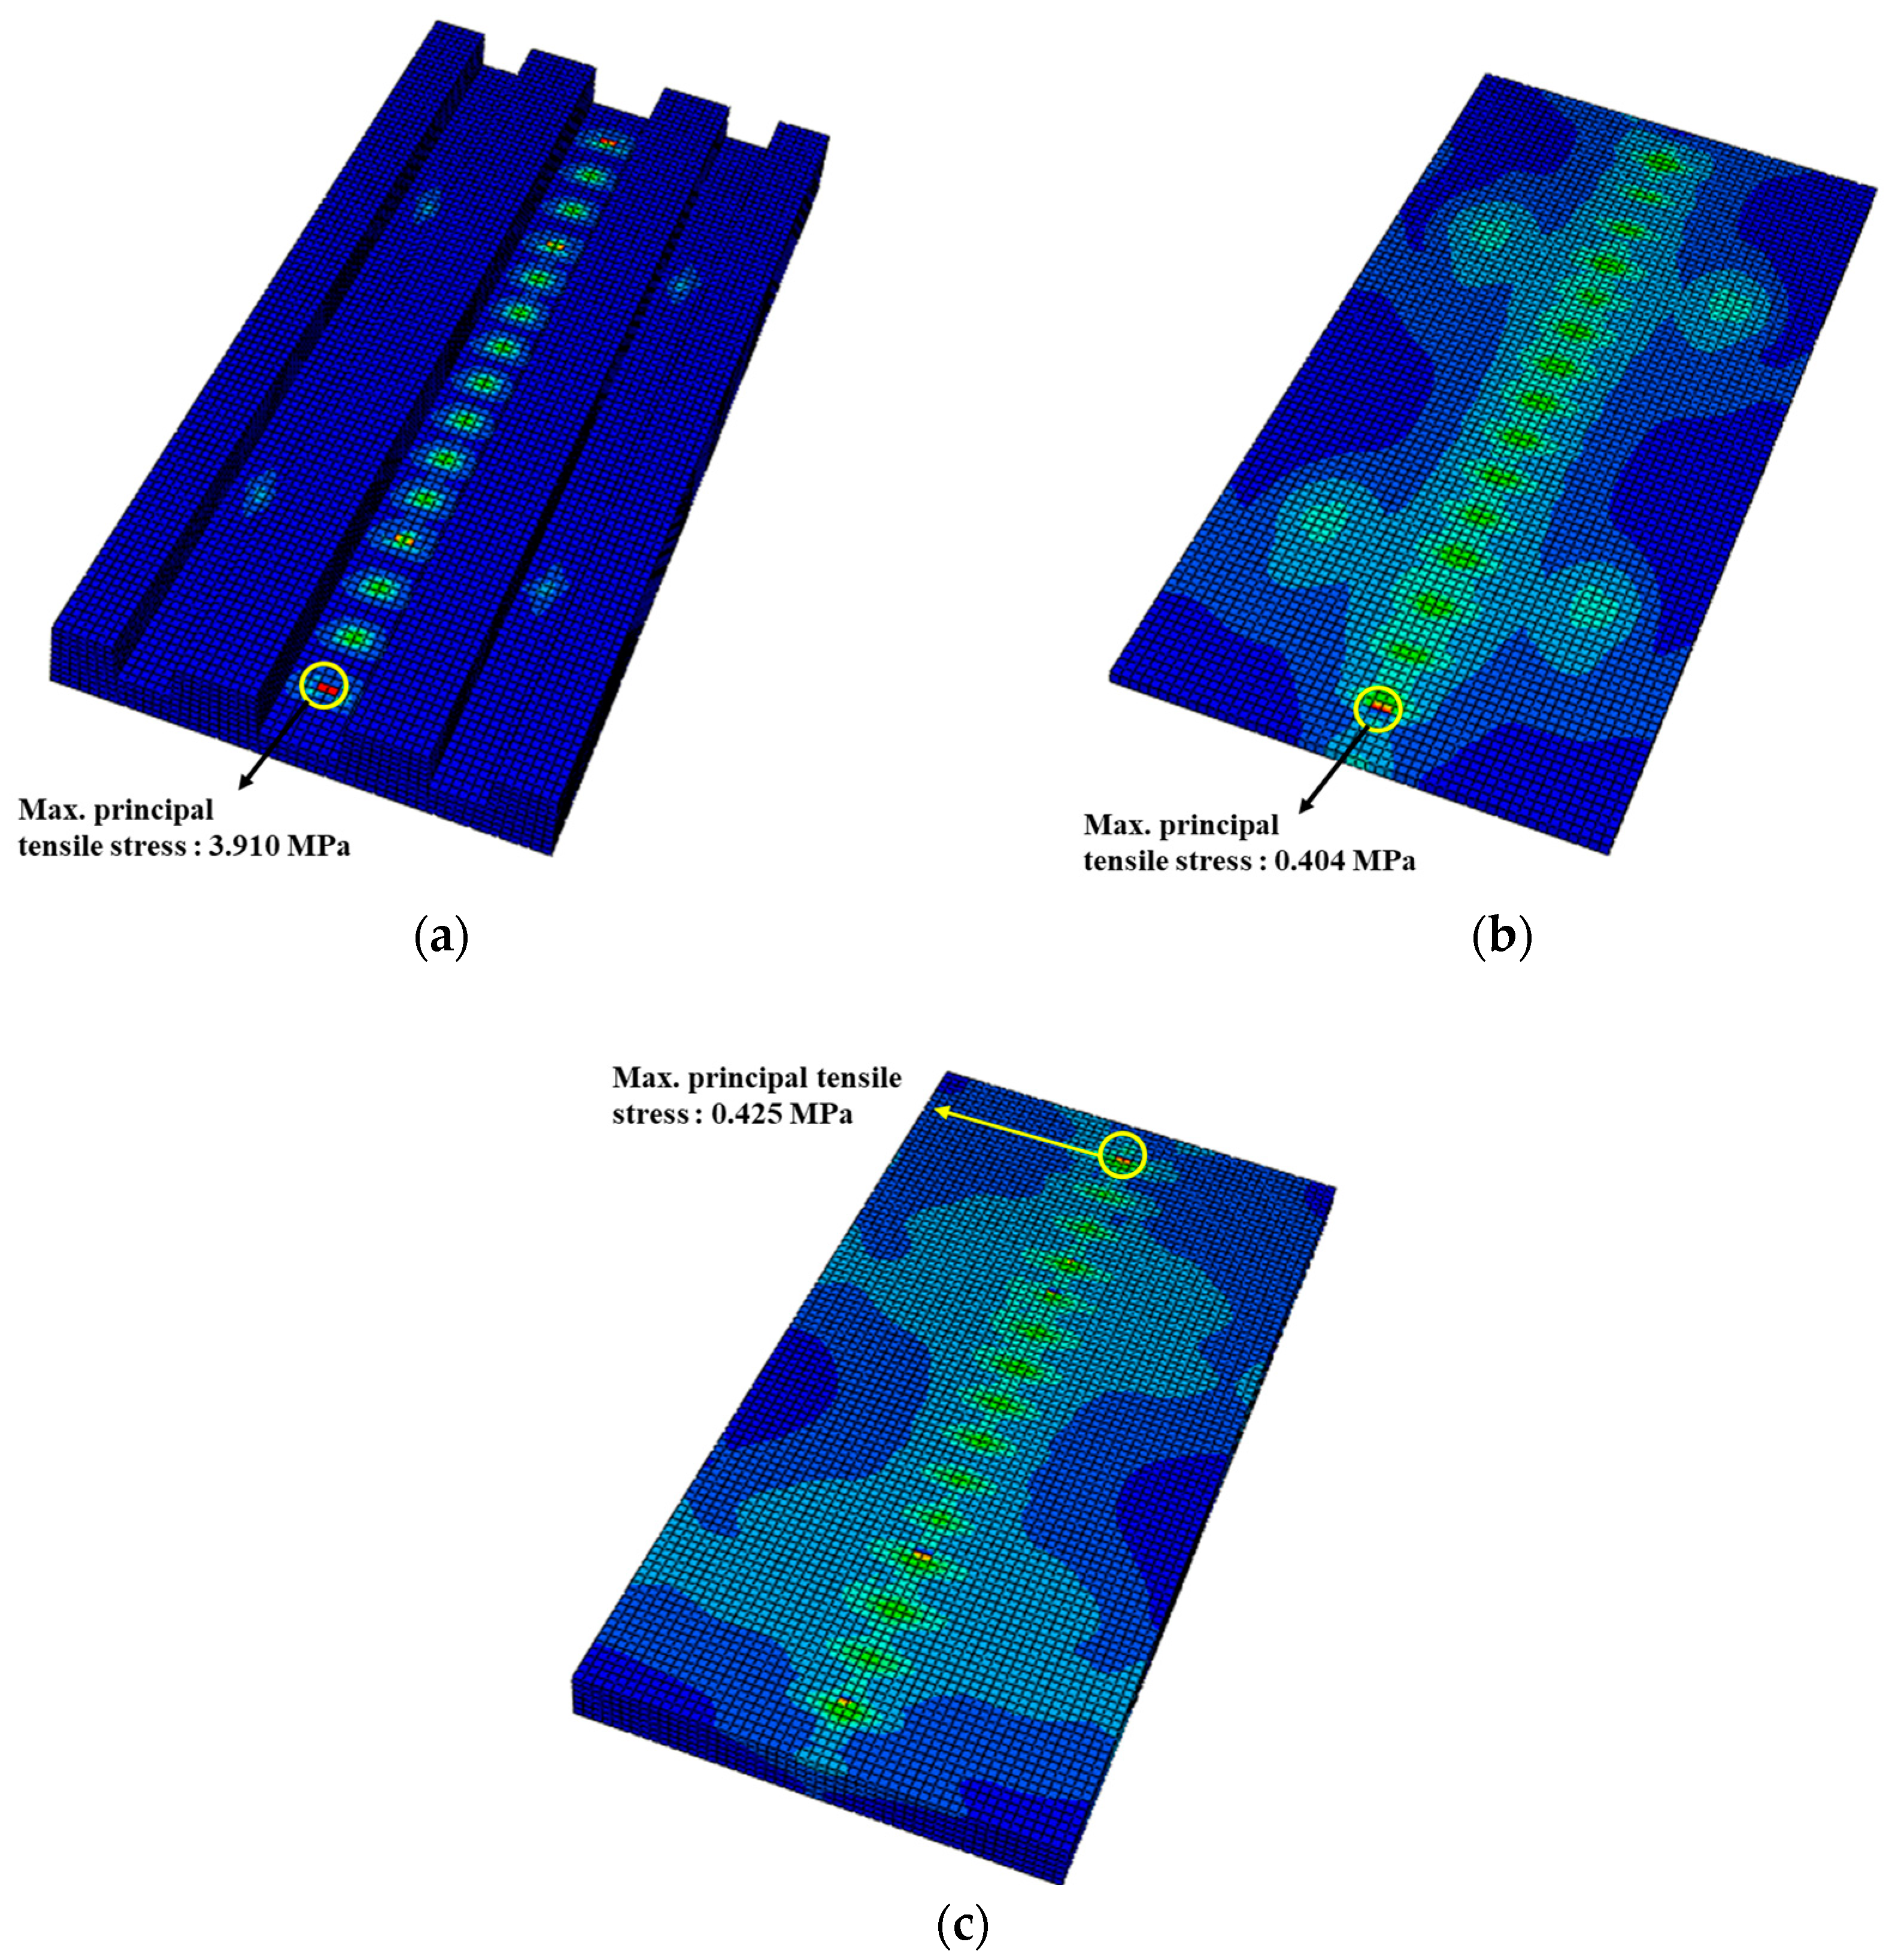
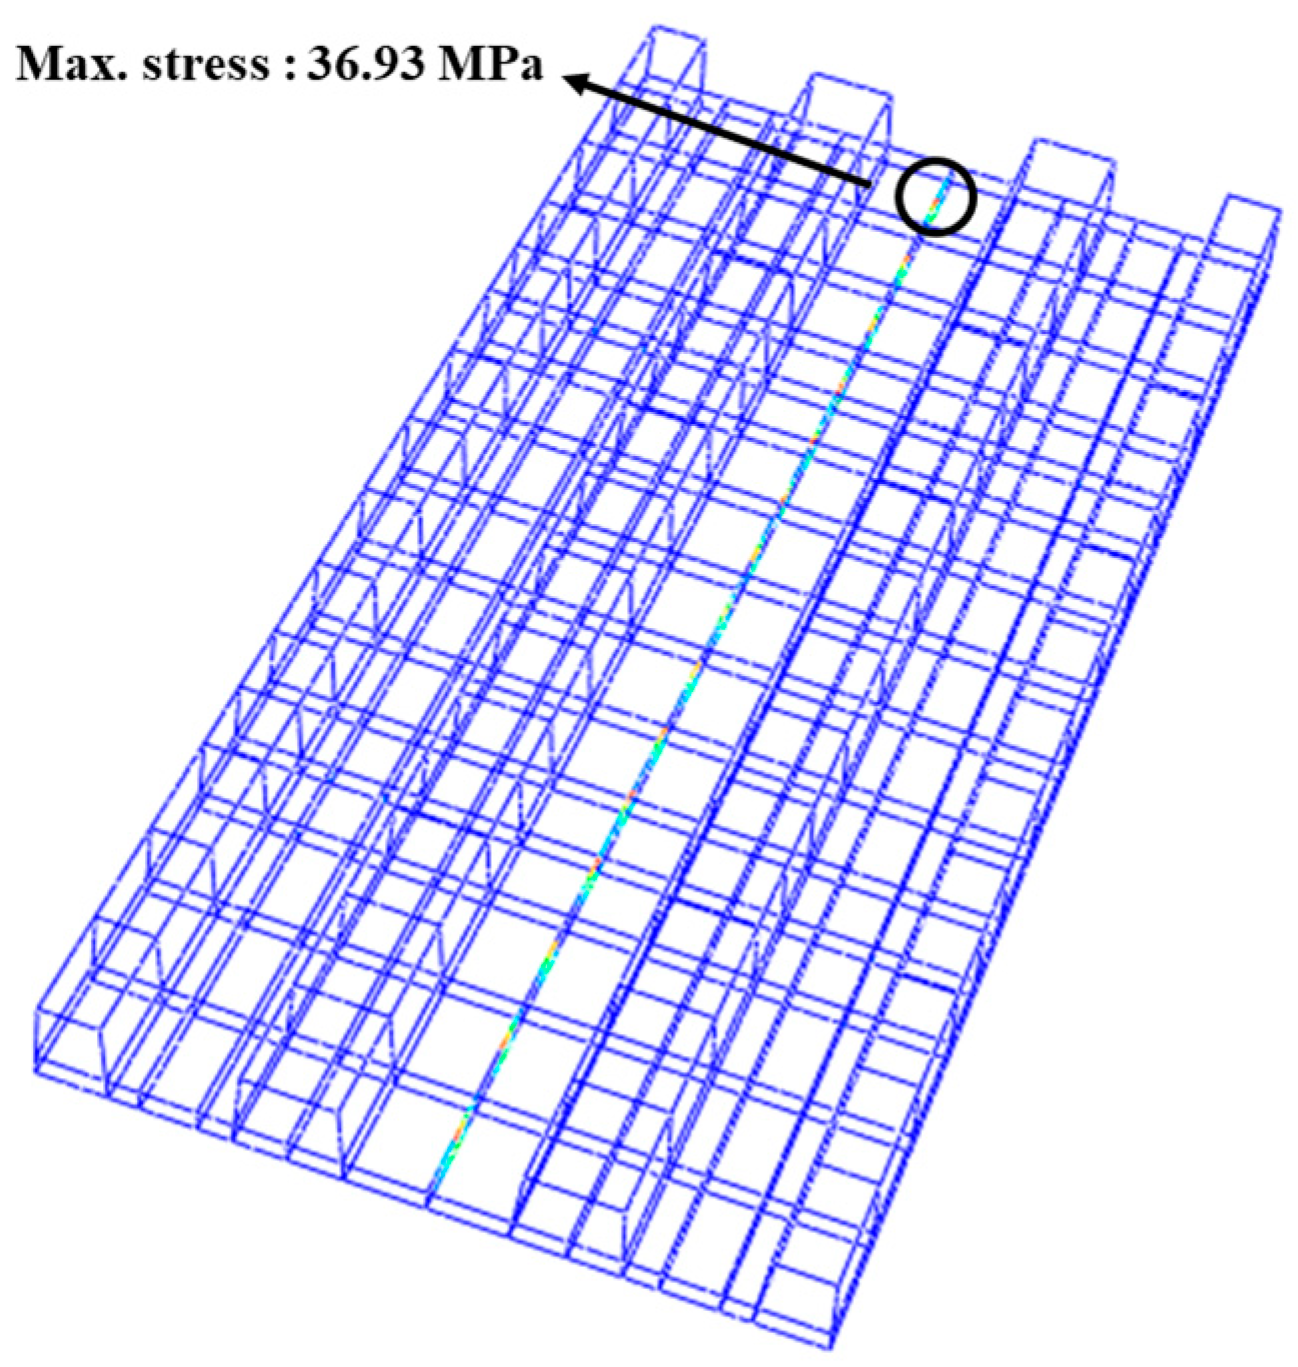
- The safety assessment revealed that the maximum principal tensile stress in the precast concrete panel, bedding layer, and subgrade layer of the mountain-ERS did not exceed the tensile strength of the concrete under the applied factored loading conditions. The stress values inside the concrete elements did not exceed their linear elastic limits. The mountain-ERS did not exhibit overall flexural deformation, and localized behavior was observed in the sections where the train load was applied to the rails.
- With respect to the application of high-strength concrete materials for precast concrete panels, the maximum principal tensile stresses of the concrete elements increased as the elasticity modulus of the concrete increased, whereas those of the bedding and subgrade layers decreased. Applying a high-strength concrete material to the reinforcing bars inside the precast concrete panel reduced the von Mises stresses. The variations in S11 and S33 in the lower part of the concrete panel (close to the bedding layer) were attributed to the differences in the elasticity modulus. Under the load conditions considered in this structural analysis, the application of high-strength concrete material to the precast concrete panel resulted in a slight increase in the internal stresses within the concrete components, although this effect was not prominent.
- The trends in the occurrence of S22 (vertical direction) and S11 (transverse direction) were similar when the gradient was varied. However, they induced a considerable variation in S33 (in the longitudinal direction). As the gradient of the mountain-ERS changed, the magnitude of the longitudinal component of the train load transmitted from the rail also changed considerably, indicating a difference in S33 in the uppermost part (Point A) of the precast concrete panel. The stress trends in the bedding and subgrade layers were similar. For each variable, the magnitude of the maximum principal tensile stress inside the concrete member did not exceed its tensile strength.
- No significant differences were observed in the occurrence of S22 (in the vertical direction) when the thickness of the subgrade layer of the mountain-ERS track decreased. However, noticeable changes were observed at sites S11 and S33 in the lowest part of the subgrade layer. Even with a reduced subgrade layer thickness (compared with the initial thickness), the maximum principal tensile stresses within each concrete member did not exceed the tensile strength of the concrete material when service loads with factors were applied in the structural analysis model of this study. Based on the above results, it was concluded that the precast concrete panels of the mountain-ERS exhibited sufficient robustness against factored service loads.
- The analysis methods applied in the structural analysis model and the results derived in this research can be utilized as basic research data for the analysis of the behavior of mountain-ERS and the optimization of sections of mountain-ERS tracks.
Author Contributions
Funding
Institutional Review Board Statement
Informed Consent Statement
Data Availability Statement
Conflicts of Interest
References
- Park, S.H.; Moon, J.H.; Cheon, J.N.; Lee, C.J. A study on the design application of precast concrete panel slab on high gradient mountain railway. J. Korean Soc. Railw. 2015, 82–91. [Google Scholar] [CrossRef]
- Park, S.H.; Moon, J.H.; Jung, H.S. A study on proposal of rail alignment design criteria for Korean mountain railway. J. Korean Soc. Railw. 2018, 21, 396–405. [Google Scholar] [CrossRef]
- Park, J.; Eum, K.; Lim, N. Evaluation of the applicability of 50 N rails to sharp curves on mountain railway tracks. J. Korean Soc. Hazard. Mitig. 2022, 22, 149–153. [Google Scholar] [CrossRef]
- Yang, Z.; Zhang, P.; Wang, L. Wheel-rail impact at an insulated rail joint in an embedded rail system. Eng. Struct. 2021, 113026, 246. [Google Scholar] [CrossRef]
- Zou, J.H.; Feng, W.X.; Jiang, H.B. Dynamic response of an embedded railway track subjected to a moving load. J. Vibroeng. 2011, 13, 544–551. [Google Scholar]
- Ling, L.; Han, J.; Xiao, X.; Jin, X. Dynamic behavior of an embedded rail track coupled with a tram vehicle. J. Vib. Control 2017, 23, 2355–2372. [Google Scholar] [CrossRef]
- Hwang, M.H.; Yun, K.M.; Kim, S.C.; Lim, N.H. A study on the optimized cross-section of embedded rail system. J. Korea Acad.-Ind. Coop. Soc. 2014, 15, 2511–2518. [Google Scholar] [CrossRef]
- Li, Q.; Corradi, R.; Di Gialleonardo, E.; Bionda, S.; Collina, A. Testing and modelling of elastomeric element for an embedded rail system. Materials 2021, 14, 6968. [Google Scholar] [CrossRef]
- Wang, L.; Li, S.; Wang, P.; Chen, R.; Li, Z. Rational hyperelastic modelling of elastic poured compound for the failure analysis of embedded rail system. Int. J. Rail Transp. 2022, 1–22. [Google Scholar] [CrossRef]
- DIN-Fachbericht 101: Einwirkungen auf Brucken; DIN Technical Report 101, Actions on Bridges; Deutsches Institut fuer Normung, Beuth Verlag GmbH: Berlin, Germany, 2003.
- Simulia. ABAQUS-Computer Software and Online Documentation, version 6.14; Dassault Systems: Johnston, RI, USA, 2023. [Google Scholar]
- EN1992-1-1; Eurocode 2: Design of Concrete Structures, Part 1—General Rules and Rules for Buildings. The European Committee for Standardization: Brussels, Belgium; The Concrete Centre: Camberley, UK, 2005.
- Hognestad, E. Study of Combined Bending and Axial Load in Reinforced Concrete Members; Engineering Experiment Station Bulletin No. 399; University of Illinois: Urbana, IL, USA, 1951. [Google Scholar]
- Wang, T.; Hsu, T.T. Nonlinear finite element analysis of concrete structures using new constitutive models. Comput. Struct. 2001, 79, 2781–2791. [Google Scholar] [CrossRef]
- Comite Euro-International du Béton. CEB-FIP Model Code 1990: Design Code; Thomas Telford Publishing: London, UK, 1993. [Google Scholar]
- Load (KR C-08020) Korea Rail Network Authority. 2014. Available online: https://www.kr.or.kr/boardCnts/view.do?boardID=1000009&srch1=130&srch2=13002&srch1NM=COL1_CNTS&srch2NM=COL2_CNTS&page=5&boardSeq=1108361 (accessed on 24 September 2023).
- Korea Railroad Research Institute. Commercialization of Technologies for Environment-Friendly Mountain Transportation System, 2nd Year Interim Report; Ministry of Land, Infrastructure and Transport: Sejong, Republic of Korea, 2022. [Google Scholar]


| No | Component | Materials | Compressive Strength (Concrete) /Tensile Strength (Steel) | Poisson’s Ratio |
|---|---|---|---|---|
| 1 | 50-kg rails | steel | 800 MPa | 0.3 |
| 2 | precast concrete panel | concrete | 45 MPa | 0.18 |
| 3 | mortar filler layer (bedding layer) | mortar | 45 MPa | 0.18 |
| 4 | subgrade layer | concrete | 24 MPa | 0.18 |
| 5 | shear anchor | steel | 400 MPa | 0.3 |
| 6 | synthetic resin | synthetic resin | 23 MPa | 0.33–0.35 |
| Concrete Component | Compressive Strength | Elastic Modulus | Poisson’s Ratio |
|---|---|---|---|
| precast concrete panel | 45 MPa | 35,684 GPa | 0.18 |
| bedding layer | 45 MPa | 35,684 GPa | 0.18 |
| subgrade layer | 24 MPa | 30,160 GPa | 0.18 |
| Loads | Partial Safety Factor | Combination Coefficient | |||
|---|---|---|---|---|---|
| ULS 1 | SLS 2 | ||||
| dead load (self-wights) | 1.35 | 1.00 | 1.00 | ||
| live load (train loads) | applied at rails | 1.45 | 1.00 | 1.00 | |
| starting/braking load | applied at rack rails | 1.50 | 1.00 | 1.00 | |
| load owing to gradient | 1.35 | 1.00 | 1.00 | ||
| snake load (hunting oscillation) | applied at rails | 1.50 | 1.00 | 1.00 | |
| wind load | applied at rails | applied with train loads simultaneously | 1.50 | 1.00 | 1.00 |
| loads owing to drying shrinkage | 1.00 | 1.00 | 1.00 | ||
| Load | Calculated Load Value | Applied Load Value |
|---|---|---|
| starting load (180‰) | 44.899 kN | 89.798 kN |
| braking load (180‰) | 38.150 kN |
| Points | Nonlinear and Linear Analyses | |||||||||
|---|---|---|---|---|---|---|---|---|---|---|
| S11 | S22 | S33 | ||||||||
| Nonlinear Analysis | Linear Analysis | Error | Nonlinear Analysis | Linear Analysis | Error | Nonlinear Analysis | Linear Analysis | Error | ||
| left rail | A | 4.77 × 10⁻¹ | 4.77 × 10⁻¹ | 0.00% | −3.31038 | −3.31038 | 0.00% | 2.76 × 10⁻¹ | 2.76 × 10⁻¹ | 0.00% |
| B | 1.46 × 10⁻¹ | 1.46 × 10⁻¹ | 0.00% | −1.14192 | −1.14192 | 0.00% | −4.34 × 10⁻³ | −4.34 × 10⁻³ | 0.08% | |
| C | 1.18 × 10⁻¹ | 1.18 × 10⁻¹ | 0.00% | −6.96 × 10⁻¹ | −6.96 × 10⁻¹ | 0.00% | −1.44 × 10⁻² | −1.44 × 10⁻² | 0.02% | |
| F | 1.04 × 10⁻¹ | 1.04 × 10⁻¹ | 0.00% | −4.90 × 10⁻¹ | −4.90 × 10⁻¹ | 0.00% | 2.72 × 10⁻³ | 2.71 × 10⁻³ | −0.11% | |
| H | −6.38 × 10⁻⁴ | −6.38 × 10⁻⁴ | 0.00% | −7.19 × 10⁻² | −7.19 × 10⁻² | 0.00% | −1.24 × 10⁻² | −1.24 × 10⁻² | 0.00% | |
| right rail | D | 4.31 × 10⁻¹ | 4.31 × 10⁻¹ | 0.00% | −3.34144 | −3.34144 | 0.00% | 2.66 × 10⁻¹ | 2.66 × 10⁻¹ | 0.00% |
| E | 1.47 × 10⁻¹ | 1.47 × 10⁻¹ | 0.00% | −1.13637 | −1.13637 | 0.00% | −3.13 × 10⁻³ | −3.12 × 10⁻³ | −0.09% | |
| F | 1.28 × 10⁻¹ | 1.28 × 10⁻¹ | 0.00% | −7.05 × 10⁻¹ | −7.05 × 10⁻¹ | 0.00% | −1.41 × 10⁻² | −1.41 × 10⁻² | −0.02% | |
| G | 1.06 × 10⁻¹ | 1.06 × 10⁻¹ | 0.00% | −4.85 × 10⁻¹ | −4.85 × 10⁻¹ | 0.00% | 5.59 × 10⁻³ | 5.60 × 10⁻³ | −0.04% | |
| I | −3.61 × 10⁻³ | −3.61 × 10⁻³ | 0.00% | −7.60 × 10⁻² | −7.60 × 10⁻² | 0.00% | −1.25 × 10⁻² | −1.25 × 10⁻² | 0.00% | |
| Compressive Strength of the Precast Concrete Panel (Elastic Modulus) (Tensile Strength) | 45 MPa (35,685 GPa) (3.82 MPa) (Reference) | 60 MPa (38,776 GPa) (4.62 MPa) | 75 MPa (41,440 GPa) (5.36 MPa) | 100 MPa (45,241 GPa) (6.50 MPa) |
|---|---|---|---|---|
| concrete panel | 3.91 | 3.99 | 4.04 | 4.12 |
| bedding layer | 4.04 × 10⁻¹ | 3.95 × 10⁻¹ | 3.87 × 10⁻¹ | 3.77 × 10⁻¹ |
| subgrade layer | 4.25 × 10⁻¹ | 4.15 × 10⁻¹ | 4.07 × 10⁻¹ | 3.96 × 10⁻¹ |
| reinforcing bars | 3.69 × 101 | 3.54 × 101 | 3.41 × 10⁻¹ | 3.25 × 101 |
| Gradient (‰) | 0 | 50 | 100 | 150 | 180 | 200 |
|---|---|---|---|---|---|---|
| concrete panel | 3.90 | 3.91 | 3.91 | 3.91 | 3.91 | 3.91 |
| bedding layer | 4.02 × 10⁻¹ | 4.03 × 10⁻¹ | 4.04 × 10⁻¹ | 4.04 × 10⁻¹ | 4.04 × 10⁻¹ | 4.04 × 10⁻¹ |
| subgrade layer | 4.25 × 10⁻¹ | 4.25 × 10⁻¹ | 4.25 × 10⁻¹ | 4.25 × 10⁻¹ | 4.25 × 10⁻¹ | 4.25 × 10⁻¹ |
| reinforcing bars | 3.69 × 101 | 3.69 × 101 | 3.69 × 101 | 3.69 × 101 | 3.69 × 101 | 3.69 × 101 |
| Thickness Decrease in the Subgrade Layer | 0 mm (Reference) | −25 mm | −50 mm | −75 mm | −100 mm |
|---|---|---|---|---|---|
| concrete panel | 3.91 | 3.91 | 3.91 | 3.92 | 3.92 |
| bedding layer | 4.04 × 10⁻¹ | 4.16 × 10⁻¹ | 4.34 × 10⁻¹ | 4.39 × 10⁻¹ | 4.44 × 10⁻¹ |
| subgrade layer | 4.25 × 10⁻¹ | 4.26 × 10⁻¹ | 4.33 × 10⁻¹ | 4.79 × 10⁻¹ | 5.03 × 10⁻¹ |
| reinforcing bars | 3.69 × 101 | 3.70 × 101 | 3.70 × 101 | 3.71 × 101 | 3.71 × 101 |
Disclaimer/Publisher’s Note: The statements, opinions and data contained in all publications are solely those of the individual author(s) and contributor(s) and not of MDPI and/or the editor(s). MDPI and/or the editor(s) disclaim responsibility for any injury to people or property resulting from any ideas, methods, instructions or products referred to in the content. |
© 2023 by the authors. Licensee MDPI, Basel, Switzerland. This article is an open access article distributed under the terms and conditions of the Creative Commons Attribution (CC BY) license (https://creativecommons.org/licenses/by/4.0/).
Share and Cite
Lee, H.; Han, S.-y.; Lim, J.; Eum, K.; Kim, S.; Kang, Y.J. Evaluation of Structural Stresses of Mountain-Embedded Railway Systems. Appl. Sci. 2023, 13, 11469. https://doi.org/10.3390/app132011469
Lee H, Han S-y, Lim J, Eum K, Kim S, Kang YJ. Evaluation of Structural Stresses of Mountain-Embedded Railway Systems. Applied Sciences. 2023; 13(20):11469. https://doi.org/10.3390/app132011469
Chicago/Turabian StyleLee, Hochan, Sang-yun Han, Jeonghyeon Lim, Kiyoung Eum, Seungjun Kim, and Young Jong Kang. 2023. "Evaluation of Structural Stresses of Mountain-Embedded Railway Systems" Applied Sciences 13, no. 20: 11469. https://doi.org/10.3390/app132011469
APA StyleLee, H., Han, S.-y., Lim, J., Eum, K., Kim, S., & Kang, Y. J. (2023). Evaluation of Structural Stresses of Mountain-Embedded Railway Systems. Applied Sciences, 13(20), 11469. https://doi.org/10.3390/app132011469