Article

A Multi-Depth Deflectometer/Global Navigation Satellite System Method for Measuring Concrete Slab Track Deformation

Department of Civil and Railroad Engineering, PaiChai University, Daejeon 35345, Republic of Korea
*
Author to whom correspondence should be addressed.
Appl. Sci. 2024, 14(1), 82; https://doi.org/10.3390/app14010082
Submission received: 5 October 2023 / Revised: 29 November 2023 / Accepted: 12 December 2023 / Published: 21 December 2023
(This article belongs to the Special Issue Railway Infrastructures Engineering: Latest Advances and Prospects)

Abstract

:
This study introduces a Multi-Depth Deflectometer (MDD) combined with a Global Navigation Satellite System (GNSS) which was developed for measuring the deformation of railway slab track layers. We newly designed the MDD with the addition of laser sensor modules for increasing precision in which the MDD head is fixed at the top of the track slab. The MDD/GNSS system can measure the relative deflection between each track layer as well as the total deflection at the top of the track slab, which makes it possible to evade the fixed condition problem of classical MDD. The new MDD/GNSS system was installed at the transition zone between a tunnel entrance and its embankment, which experienced high settlement levels prior to repair. The system was used to monitor whether the repaired concrete track foundation with pressurized cement grouting was stabilized effectively and what track layer position was most unstable so that it had the most influence. The GNSS system was designed and built for computing net settlement at each track layer even when the MDD could not be fixed firmly at the end point, which is a major drawback of classical MDD. The results obtained from MDD and GNSS measurements indicated significant potential in aiding railway track settlement measurements.

1. Introduction

As the use of slab track systems in high-speed rail infrastructure increases, it is important to understand and characterize the settlement in the slab track foundation that can occur due to repeated train loads [1]. The settlement creates track irregularities, alters frequency characteristics of wheel–rail interactions into abnormal condition, and changes in the mechanical properties of track structures, which can impact ride smoothness and stability of the railways. Accurately estimating and monitoring settlement change with time of track foundation is critical for analyzing the state of tracks and providing proper maintenance in time [2,3].
There are many useful tools and devices for measuring and monitoring settlement in the track layers or ground soil for such things as the Multi-Depth Deflectometer (MDD), settlement pins/plates with the total station, vibrating wire-type measurement system, a liquid level sensor, inclinometer, GPS, etc.
The state of the art of optical fiber sensing technologies and their application in railway infrastructures including transition zones were recently introduced [4,5,6,7].
However, most settlement monitoring systems are designed so that they are adaptable to surface settlement in soils and different types of earth structures, such as embankments and earth dams. These systems mostly consist of a mechanical sensing part and a data acquisition and transferring unit. Among these, one useful tool that can be used for tracking settlement with time is the MDD, a device designed to measure the mechanical response and deformation of soil layers [8,9]. MDD has been used in various construction fields, such as road pavement and railway track sites, to evaluate the stiffness and condition of the soil. Generally, MDD has been used as a device for accurately measuring the permanent deformation of each layer in a pavement system [10]. Effective elastic moduli of multilayered pavement structures can be back calculated from the measurements [8,9]. Cary et al. [11] used MDDs to measure pavement deflections under static loads. Suh et al. [12] used MDDs to develop a mechanistic–empirical design method for an asphalt pavement rutting model and to calibrate a laboratory rutting model. In a special case, MDDs were used as dynamic gauges to measure pavement deflection under a Heavy Vehicle Simulator (HVS) wheel load and as online gauges to measure induced displacements [13]. They are also used to measure track settlement and assess track stability. This is helpful in identifying areas of the track such as rail transition zone, which may be prone to settlement or failure, and in designing appropriate remediation measures [14].
A Global Navigation Satellite System (GNSS) is a system that uses satellite signals to determine the location of an object on Earth. There are several GNSS systems in operation around the world, including the Global Positioning System (GPS) used by the United States, the GLONASS system used by Russia, the Galileo system used by the European Union, and the BeiDou system used by China [15]. These systems use a network of satellites orbiting the Earth to transmit signals to receivers on the ground, which can then use the timing and strength of the signals to calculate the receiver’s position and other information, such as altitude and velocity [16]. The GNSS is utilized in a wide range of applications, including navigation, mapping, surveying, and precision agriculture. Dai et al. [17] developed a GPS technology to monitor the settlement of railway tracks by continuously observing real-time data to better understand the changes in railway track foundations at different stages and to ensure the safety of the railway. Shimizu and his team proposed a method for monitoring rock displacements using the GPS [18]. Ma et al. [19] used Kalman filtering techniques to achieve positioning accuracy of 2 to 3 mm for monitoring frost heave in railway track foundations using GPS technology.
Despite the recent developments of the MDD for checking residual displacements in road pavement, subgrade layers and ballasted railway [14,20,21,22], the characterization of concrete slab track layer deformation using the MDD has not been clearly analyzed yet and is still a challenging problem.
In this study, the Global Navigation Satellite System (GNSS) and a Multi-Depth Deflectometer (MDD) were combined to introduce a new system that can be used to assess and monitor the slab track settlement accurately in the transition zone of railways. To achieve this, GNSS receivers were placed along the track: one for the base station placed beside the track and the other for the rover station placed on top of the slab track. The MDD was installed exactly below the rover station position on the track. The MDD was designed to measure the deflection of the track at various depths which was loaded by railway cars. This combined GNSS/MDD system provided data on the track foundation layers beneath the track with top displacement of the track at the rover station position.
The most notable concept of the new system is that the MDD head is fixed at the top of the slab track, not at the bottom of the MDD as usual (Figure 1). Since the MDD head is fixed at the rover position, the MDD/GNSS system can measure the relative deflection between each track layer and the slab surface, but also the total deflection at the top of the track slab by the GNSS’ rover receiver, which can evade the fixed condition problem of classic MDD. As shown in Figure 1, it is evident that the integration of MDD with GNSS technology offers greater advantages than the classic MDD measurement system. Generally, the classic MDD system is fixed at the bottom end point for measuring displacement at the surface layers of the track or the pavement layers; however, if the bottom end point moves together with the surrounding soil, the measured soil deflections become meaningless. In contrast, the new system can overcome this fatal drawback of classic MDD. In the new MDD/GNSS system, a fixed reference point is established at the slab surface for the MDD while the net settlement increase is measured by the GNSS.
This combination of the MDD with GNSS enhances the capacity to assess vertical displacements within each layer of the system and provides a more comprehensive perspective on the track monitored system.
The new MDD/GNSS system is installed at the transition zone between a tunnel entrance and its embankment, which experienced high settlement levels prior to repair (Figure 2). The system is used to monitor whether the repaired concrete track foundation with pressurized cement grouting is stabilized effectively and what track layer position is most unstable and contributes most to the total deflection.
Since the obtained measured data from the MDD/GNSS are somehow scattered, it is necessary to process the obtained time series settlement data using the Locally Weighted Scatterplot Smoothing (LOESS) trend model, which is a non-parametric regression method used for modeling and smoothing the relationship between two variables. This method fits a smooth curve to the data points in a scatter plot and offers more weight to the points that are close to the target value being estimated, which makes it useful in cases where the data may contain outliers or other types of noise [23].
Furthermore, OriginPro® 2018, a data analysis and graphing software developed by OriginLab [24], is adapted to propose prediction models for the MDD position data, which is calibrated using GNSS data.
The results of this study demonstrate an optimistic potential for using a combination of redesigned MDD and GNSS technology for monitoring and predicting settlement in concrete track systems.

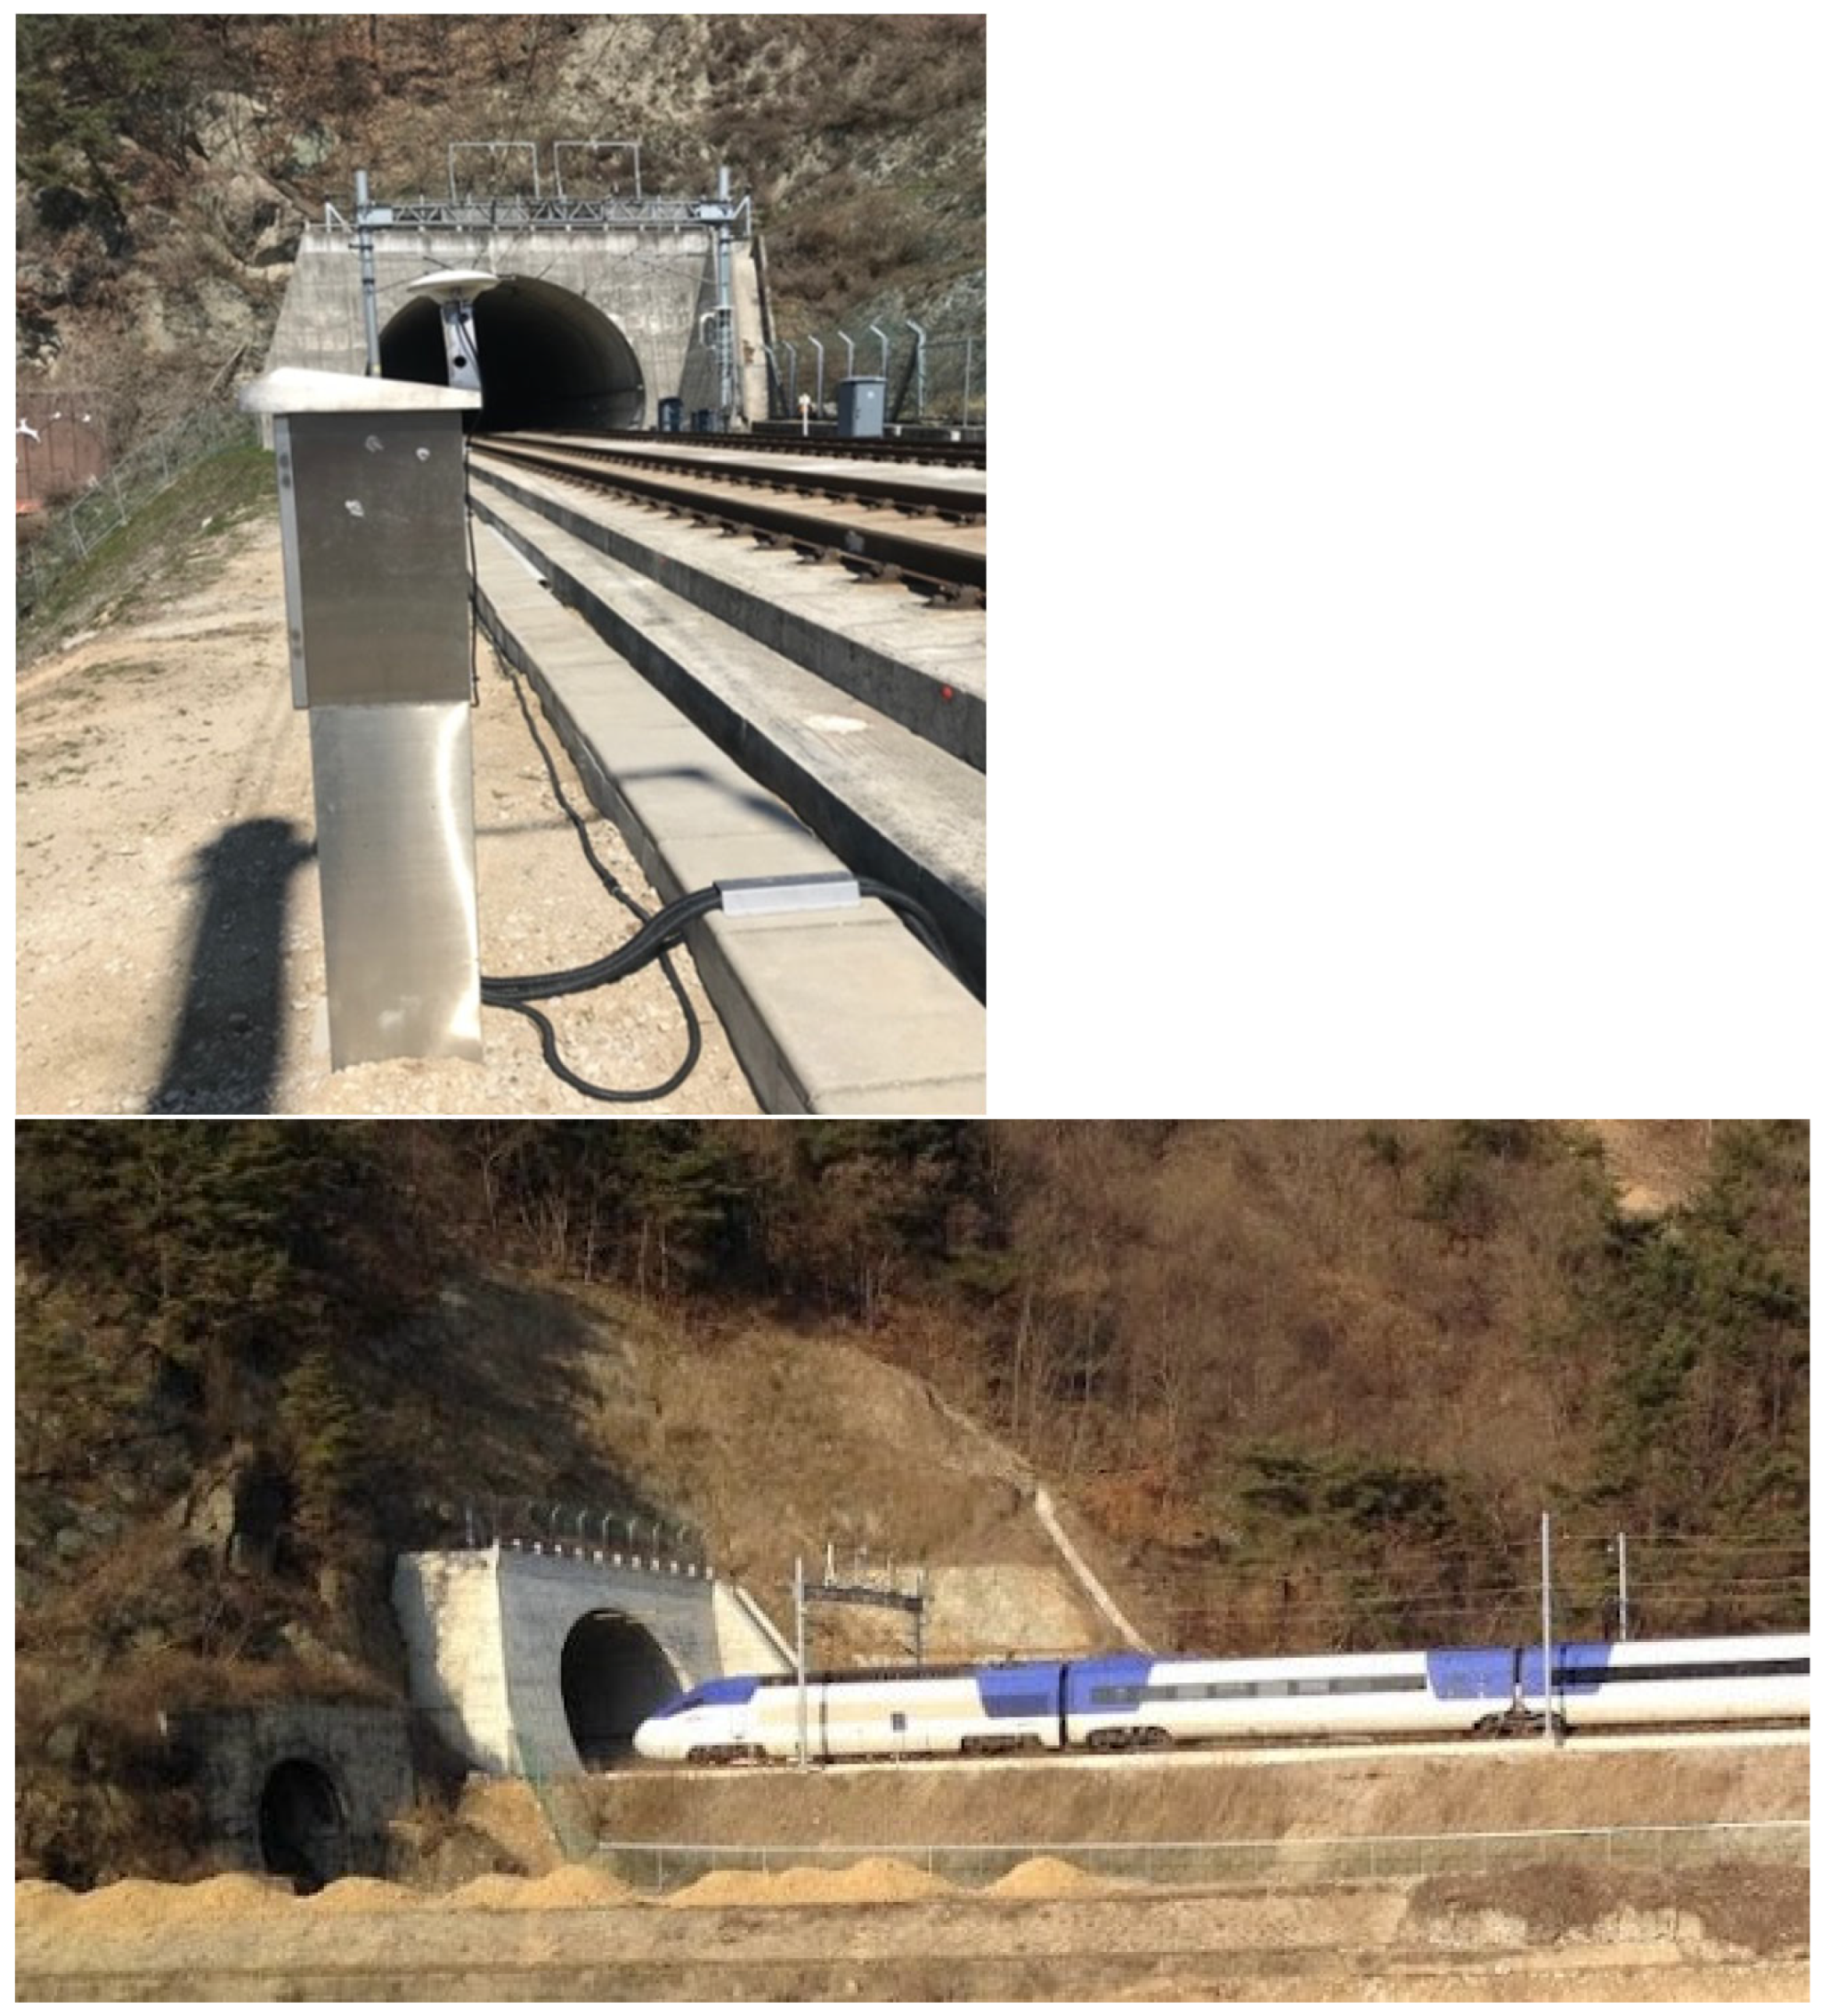
2. MDD/GNSS Installations and Measurement Methods

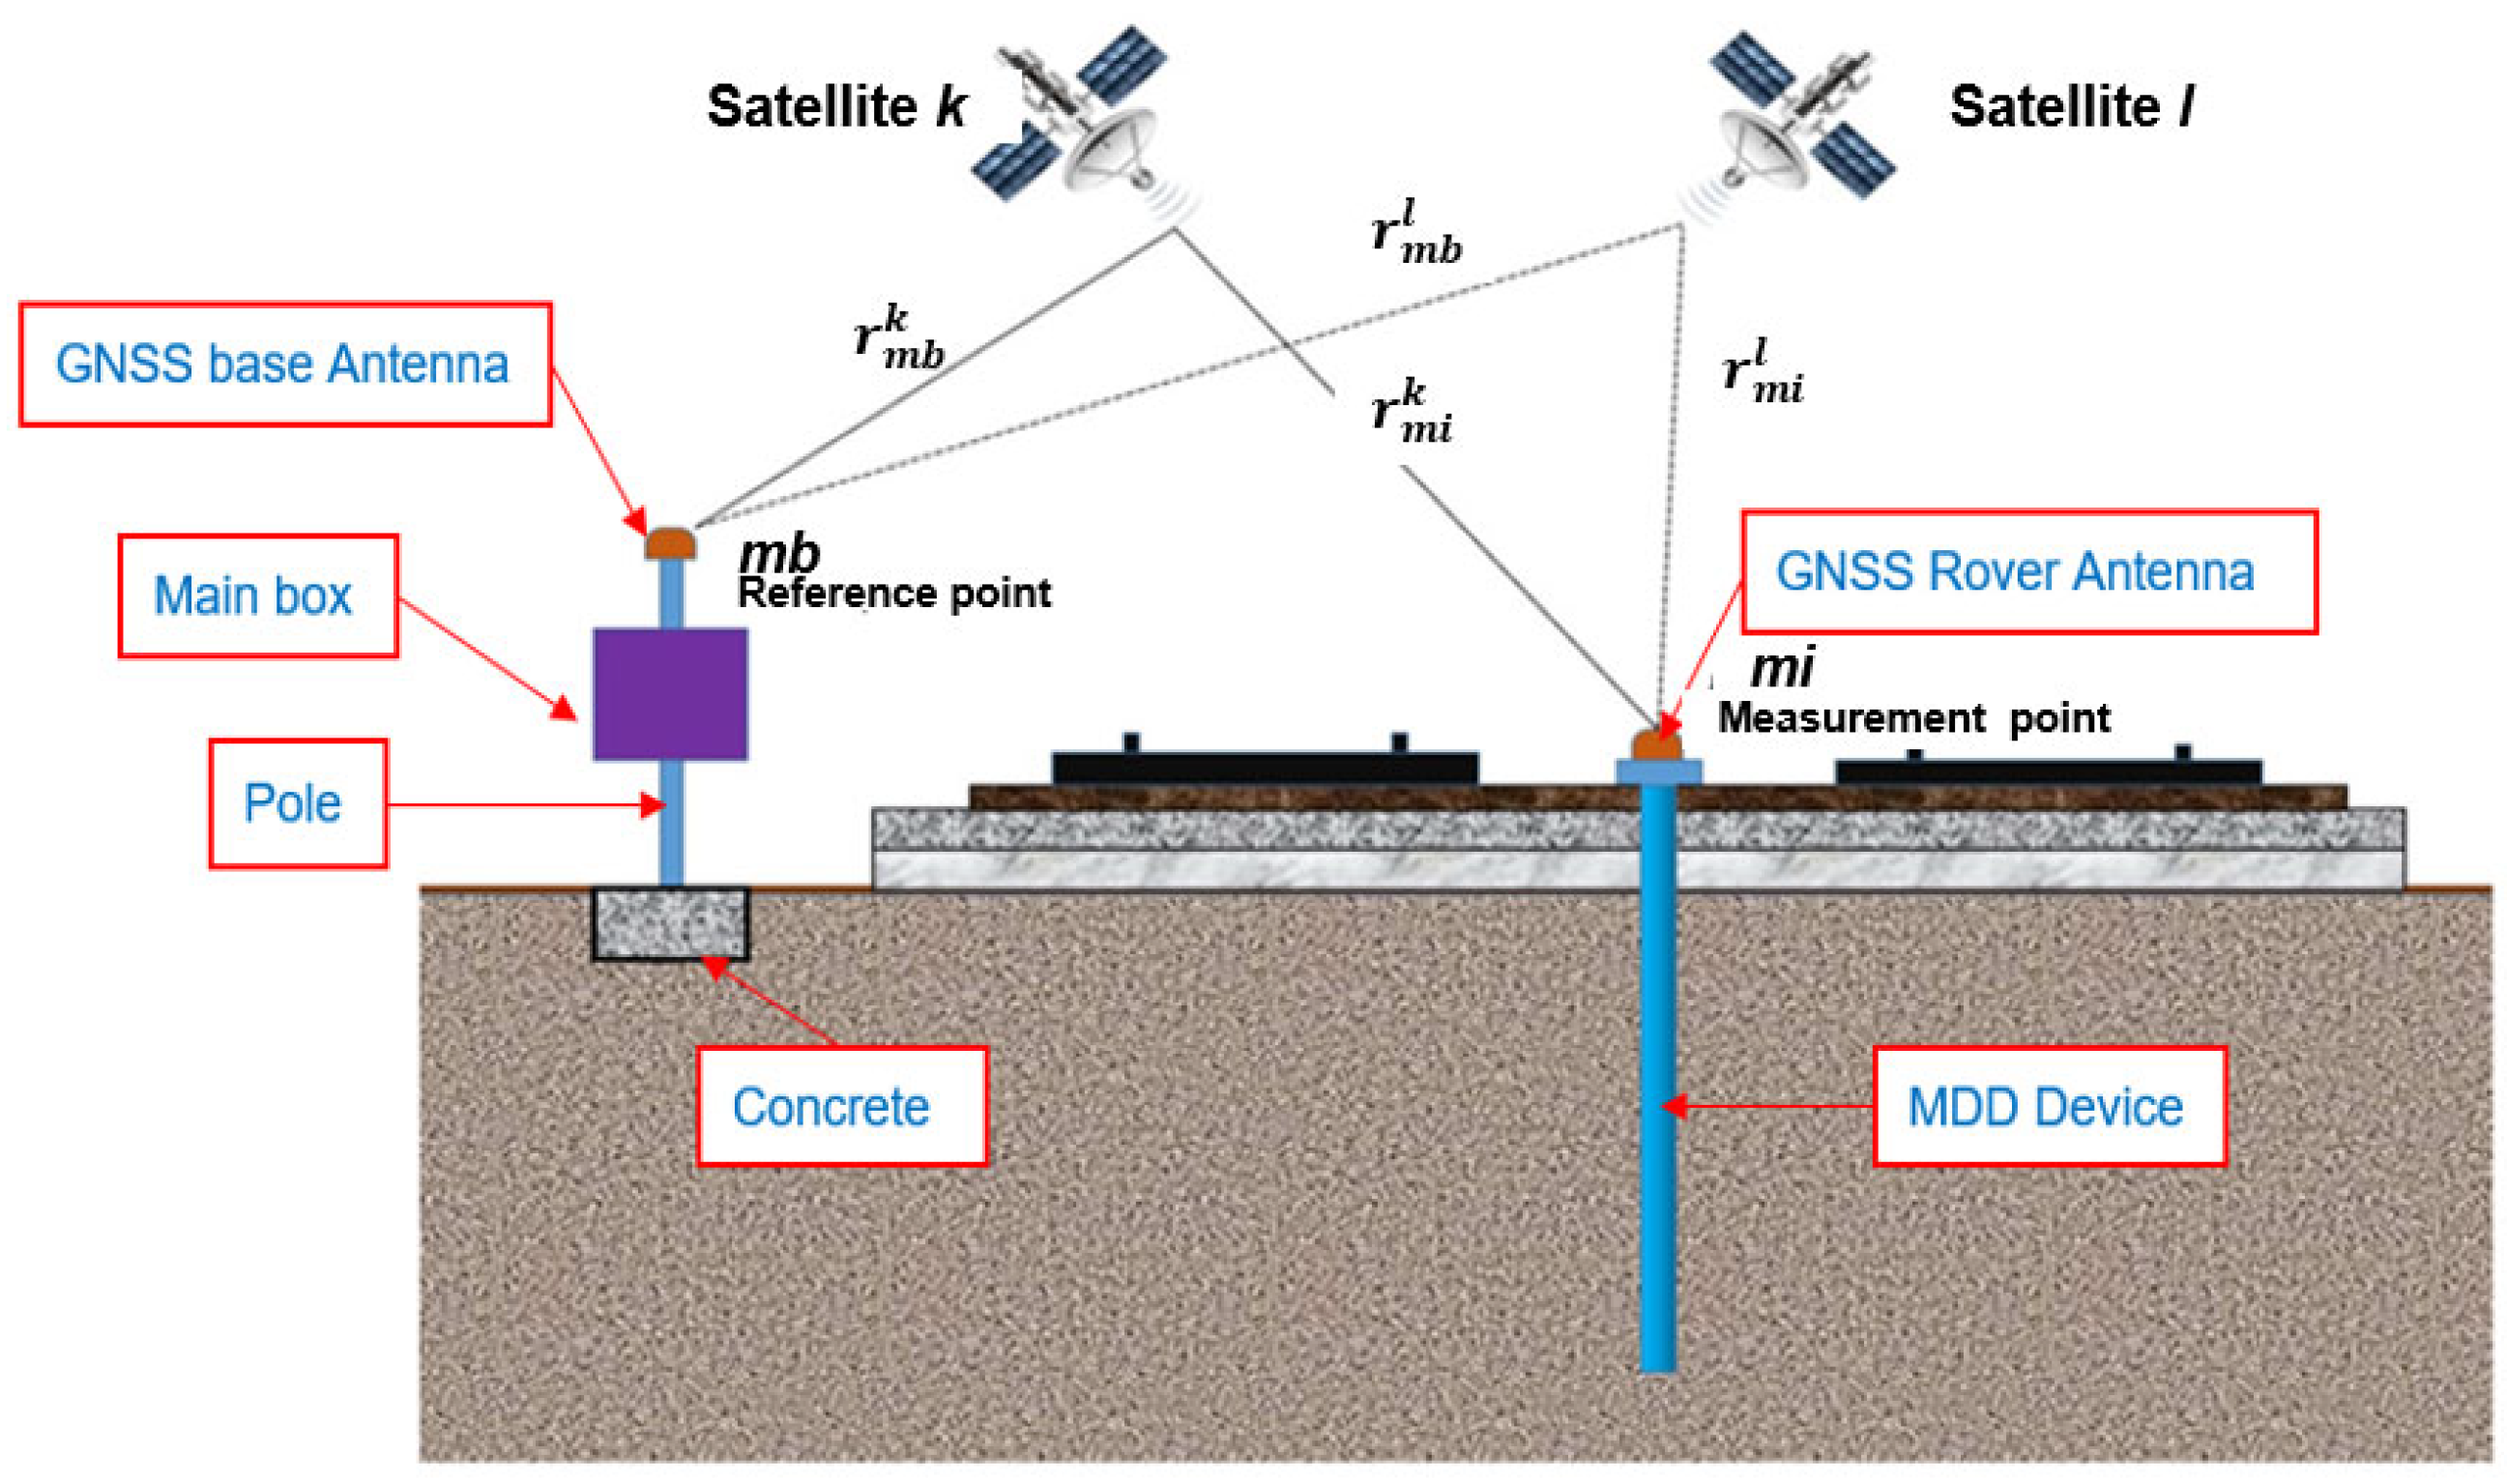
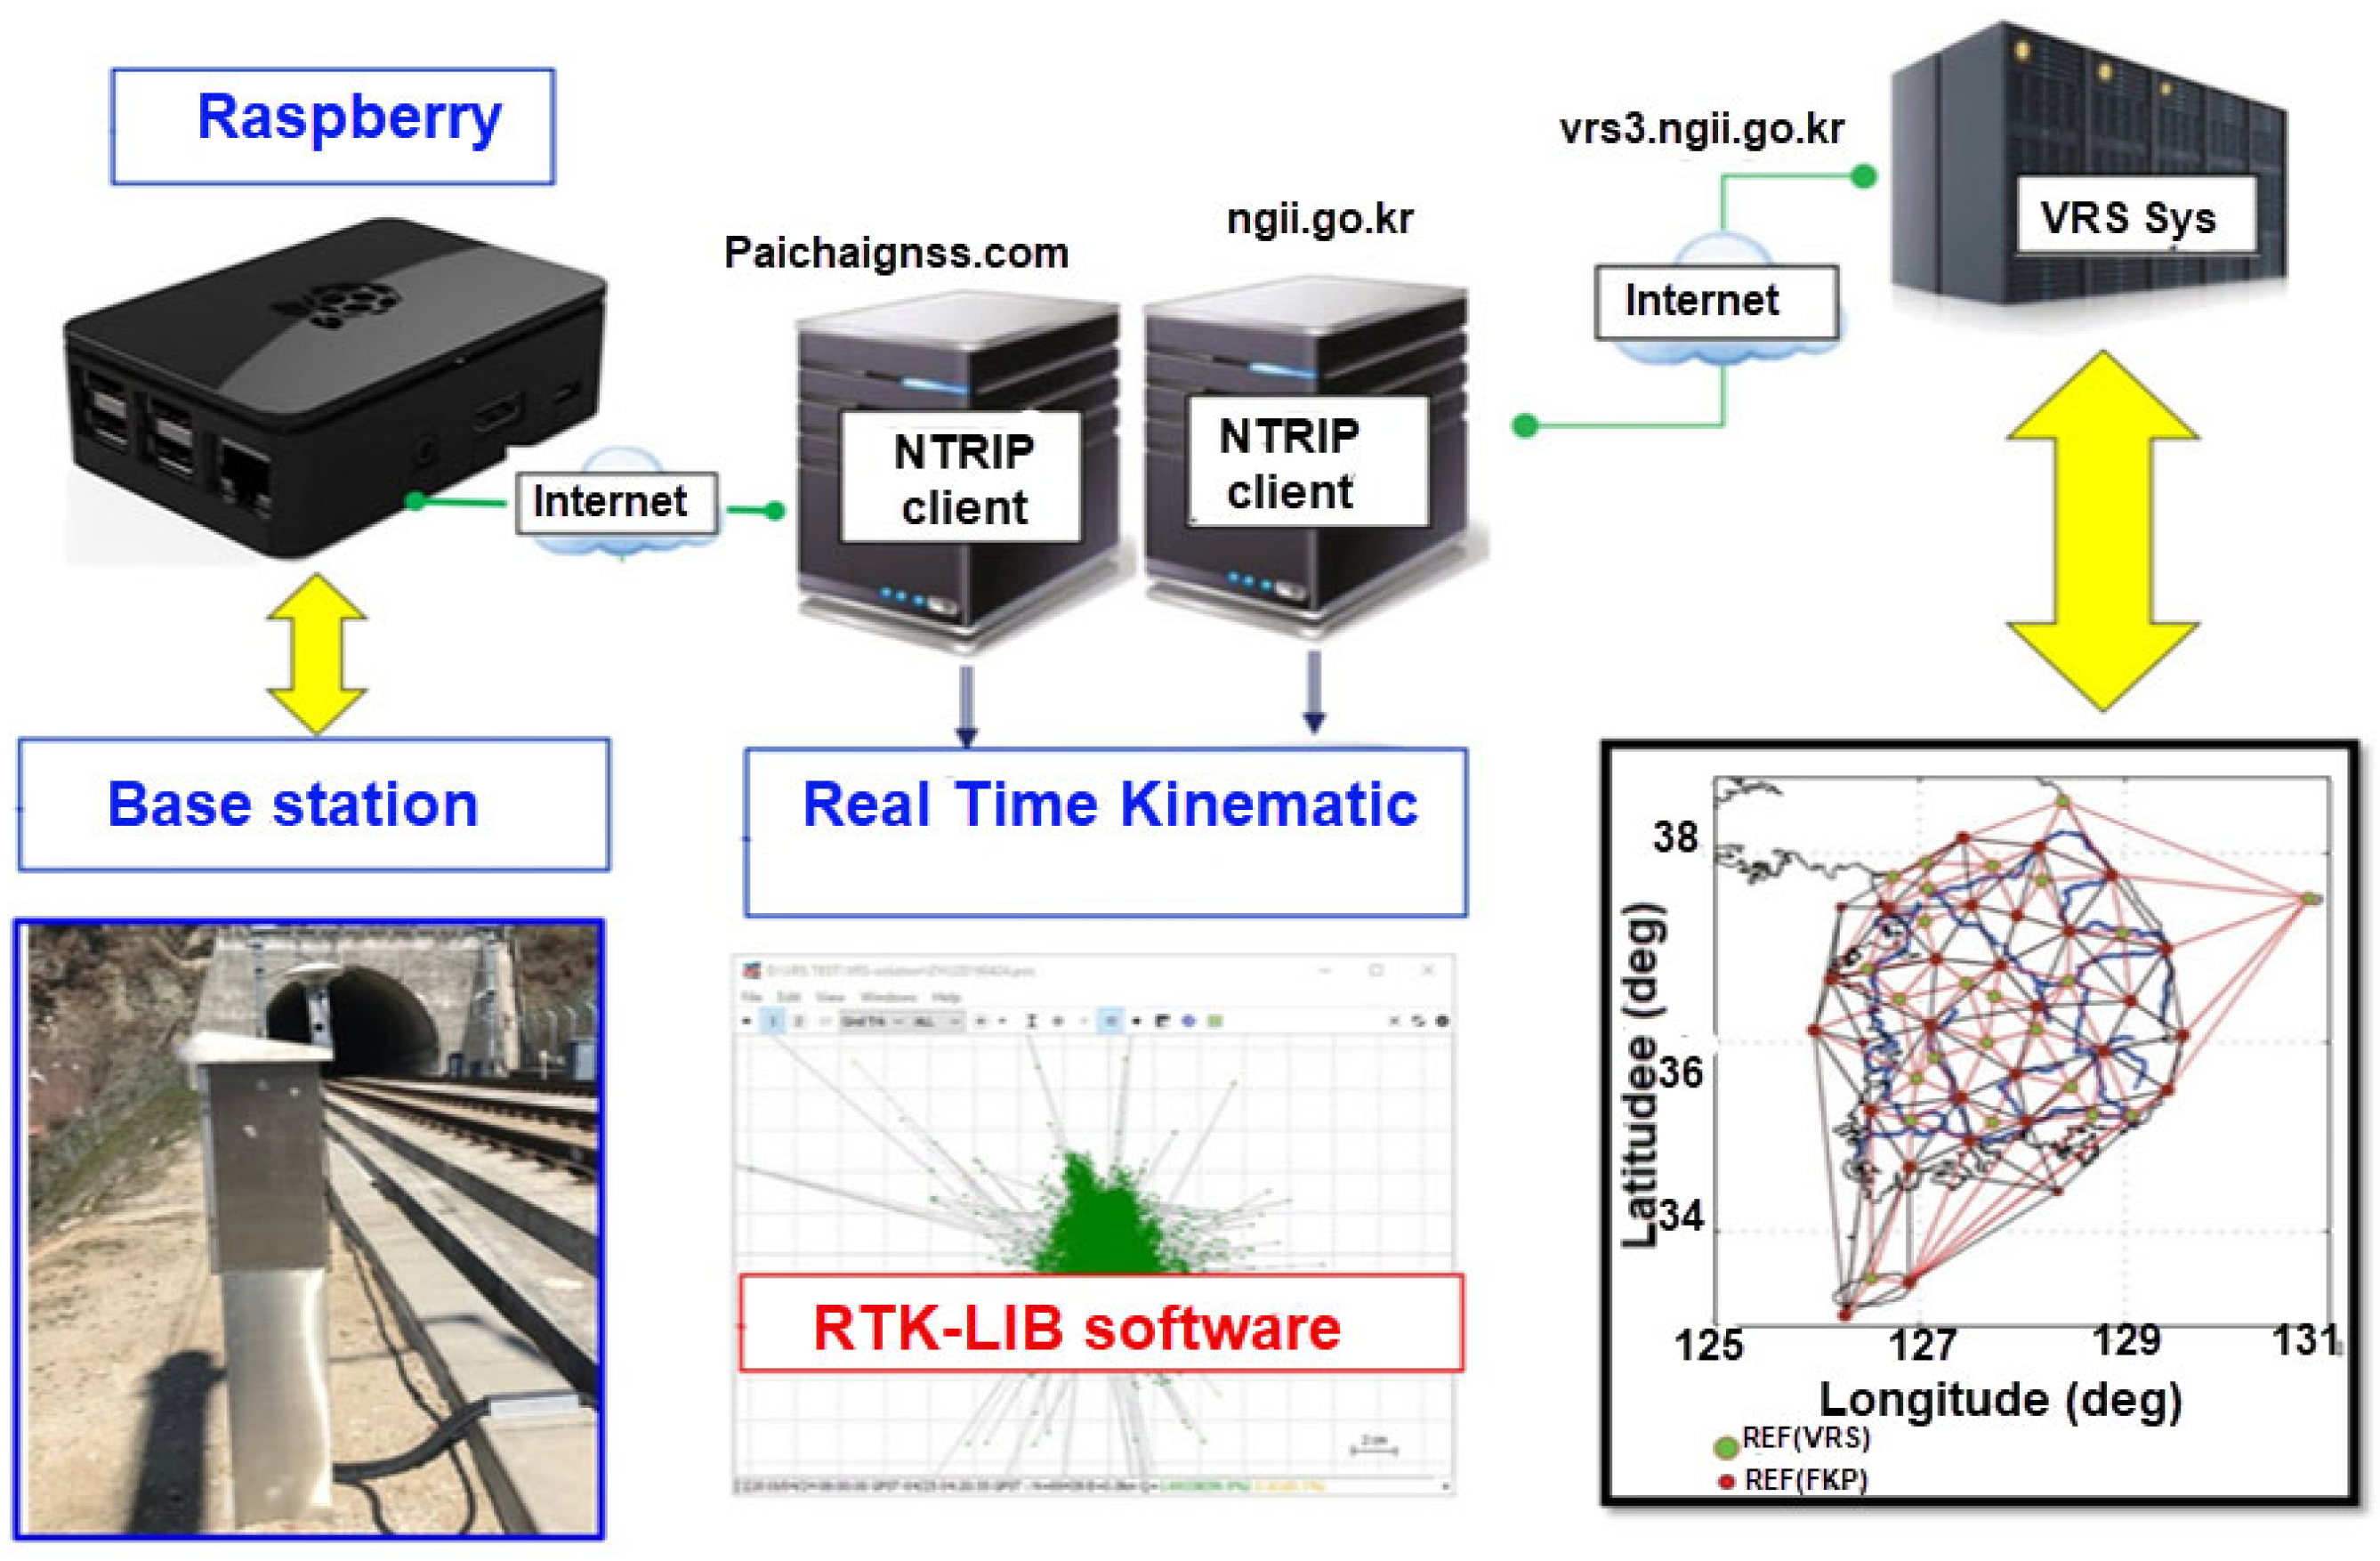
2.1. GNSS Configuration and Principle

In this study, a Multi-Depth Deflectometer (MDD) and the Global Navigation Satellite System (GNSS) were employed as field instrumentation to measure the vertical deformation induced at different layers for periodic time monitoring (Figure 3). The MDD/GNSS system measures the deflection in track foundation soil at various depths in a vertical direction caused by the passing wheel load of railway cars. By analyzing the measured deflections at various depths, a vertical deflection profile can be obtained. The MDD can also measure the relative elastic deflection due to wheel load or the total permanent deformation of each layer in the slab track structure.
To improve the MDD instrument, a laser sensor equipped with MDD was designed and used in this study. Four MDD laser sensing modules (KEYENCE® laser sensor IL-600 model, Keyence Corporation, Osaka, Japan) were installed in a single 15 cm diameter hole casing at a field site located between a tunnel entrance and the embankment. This place is a typical transition zone with many occurrences of track settlement reported before repair. The laser sensing modules were clamped against the sides of the hole casing at the designed depths. The head of the MDD casing was anchored at the top Track Concrete Layer (TCL) so that the MDD modules could measure net vertical deflections at various depths by assuming that the anchored fixing head and the casing move together with rail track TCL. This means that the net measured deflection at each depth of the installed module provides soil displacement only at the location itself.
There are two ways to make the GNSS measurement: (1) point positioning for navigation, which obtains the three-dimensional absolute coordinates of latitude, longitude, and height of a measurement point with an accuracy of a few meters to ten meters or more, and (2) relative positioning using carrier phase measurements, which provides the three-dimensional relative coordinates between two points with an accuracy of millimeters to centimeters. The latter method was adapted in this study and has been used by many researchers to monitor displacement in different areas [18].
Referring to Figure 3, the carrier phase of the signals transmitted from satellite k at measurement point mi is obtained as follows [18]:
ϕ m i k = r m i k + I ϕ + T ϕ λ + c δ t m i + δ t k λ + N m i k + ε ϕ m i k
where r m i k is the distance between measurement point mi and satellite k as follows:
r m i k = x m i X k 2 + y m i Y k 2 + z m i Z k 2
x m i , y m i , z m i and X k , Y k , Z k are the measurement coordinates at point mi and satellite k, respectively, I ϕ is the ionospheric delay, T ϕ is the tropospheric delay, and λ is the wavelength of the signal; δ t m i and δ t k are the biases of the receiver clock and the satellite clock, respectively, c is the velocity of the light, N m i k is the unknown integer ambiguity of the carrier phase, and ε ϕ m i k is an observation error.
On the other hand, the carrier phase of the signals transmitted from satellite k at reference point (base station) mb is also obtained similarly. Then, the single-phase ϕ m i k ϕ m b k difference between measurement point mi and reference point mb for satellite k is obtained. In the same process, another single-phase ϕ m i l ϕ m b l between measurement point mi and reference point mb for satellite l is also taken. The double-phase difference, ϕ m i k ϕ m b k ϕ m i l ϕ m b l , is obtained based on both two single-phase differences as follows:
ϕ m i m b k l = r m i m b k l λ + N m i m b k l + ε m i m b k l + T ϕ m i m b k l λ
Therefore, Equation (2) is called the fundamental equation for relative positioning. According to Equation (2), the observation solution for relative positioning is obtained based on the left side which is observed by a GPS sensor. This means that the three-dimensional coordinates of the measurement point shown in r m i m b k l and integer ambiguity N m i m b k l are determined by means of the least squares method for residual ε m i m b k l .
Thus, we used the relative positioning method with static measurement of two points to monitor slab track displacements because it yields the most reliable and precise measurement results in GNSS positioning at the top point of the track TCL layer. Thus, the top displacement of the TCL surface with time can be monitored after installation of GNSS receivers.

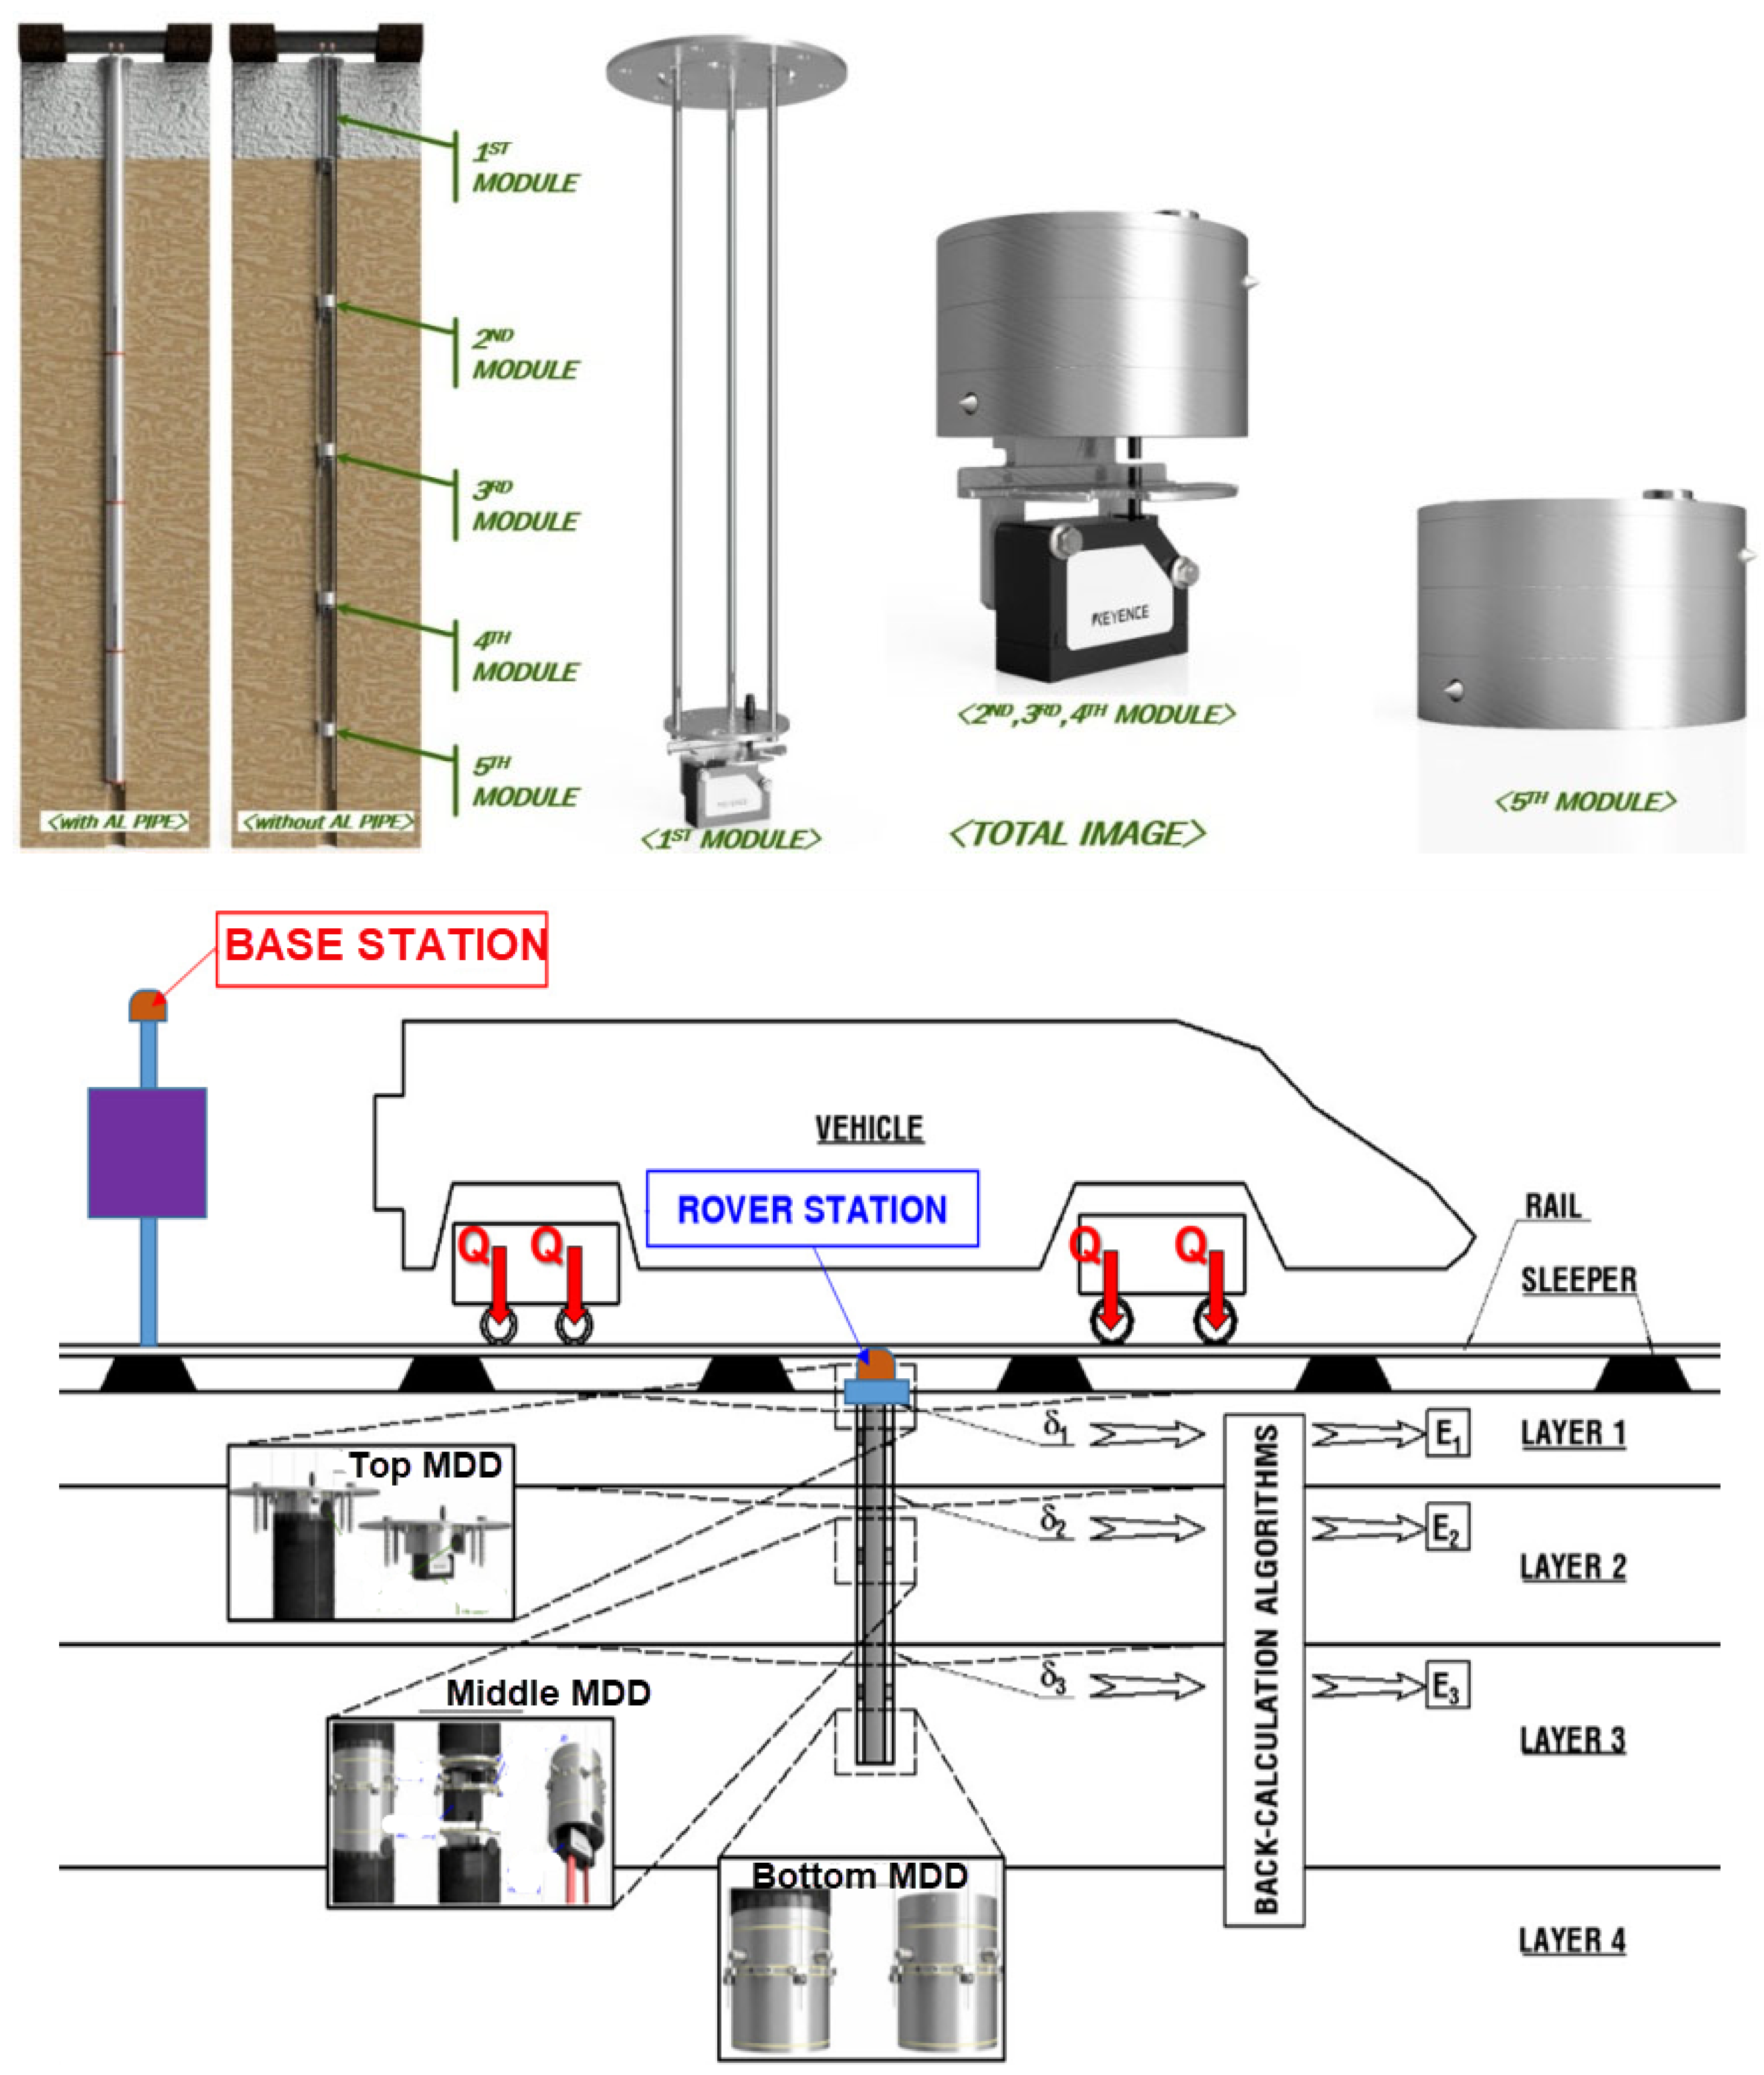
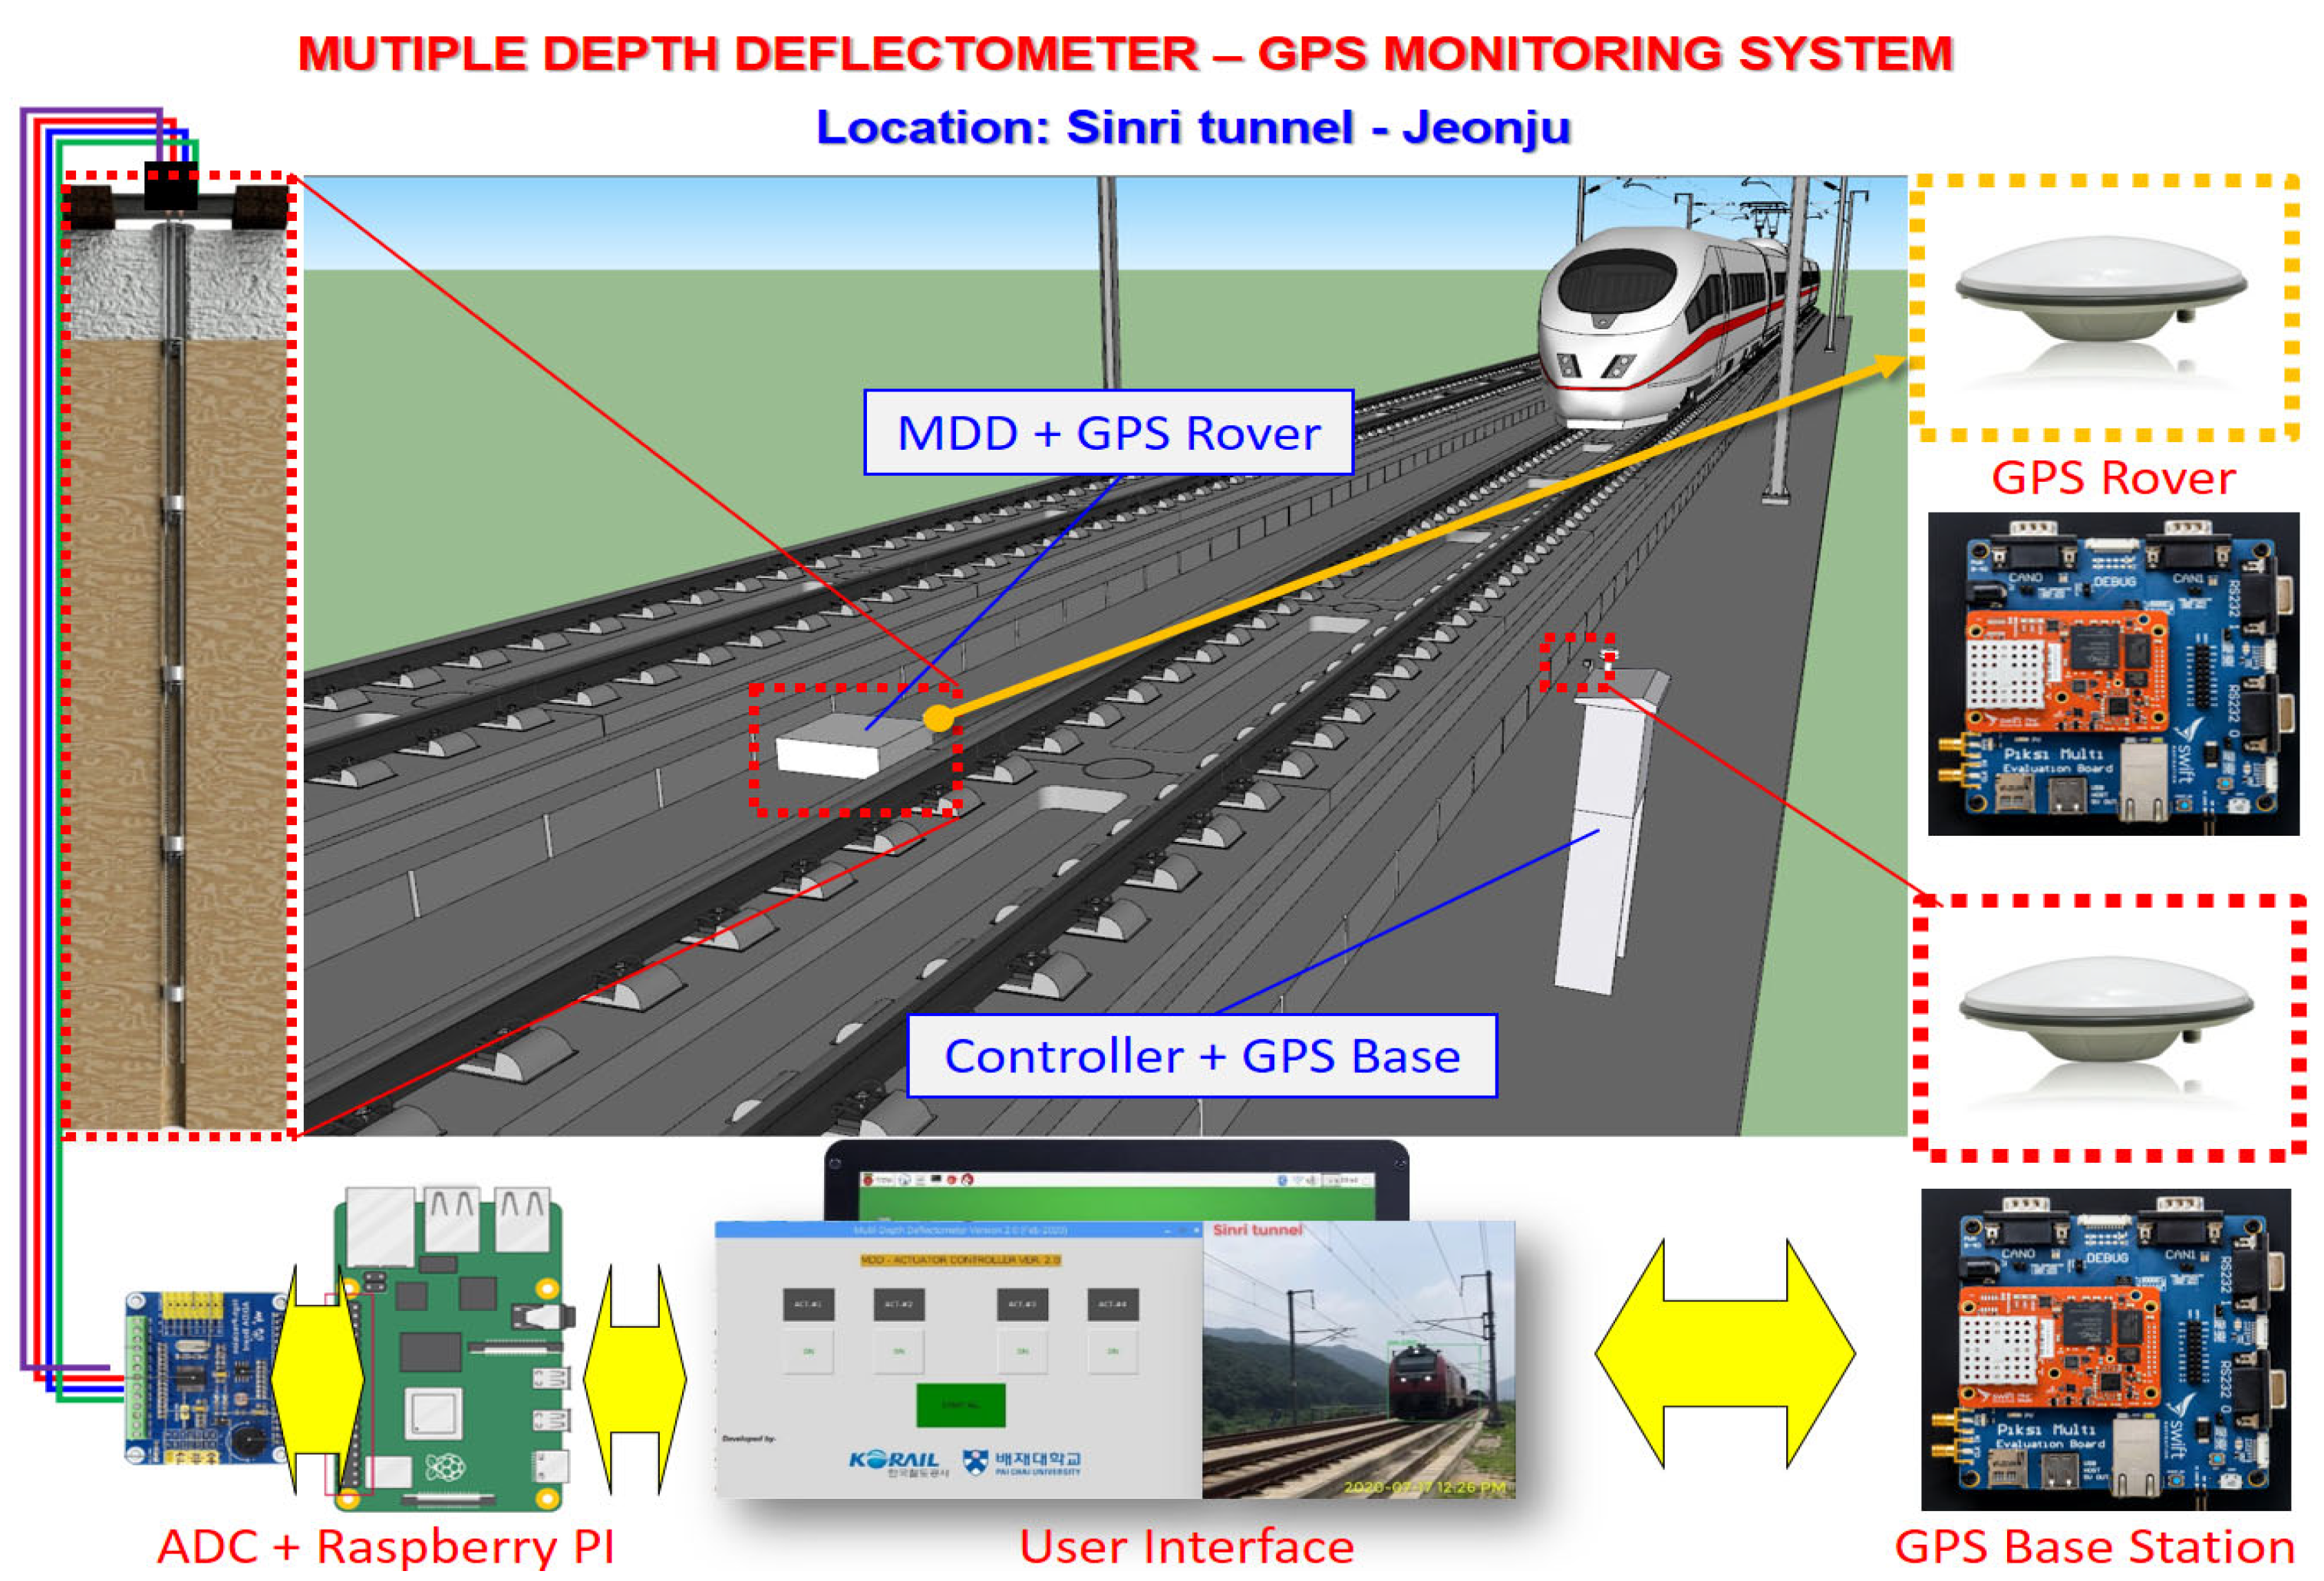
2.2. Multiple Depth Deflectometer Measuring System

Four MDD laser sensing modules tied securely with aluminum anchor trunks were installed within a single hole casing which had three long slits along the casing. The aluminum anchor trunks were securely anchored to the surrounding soil through slits at specific depths by mechanically controlled extruding nail-type anchors. The top cap plate placed on the top surface of the track slab was hung by the first anchor trunk with aluminum rods. All anchor trunks were bolted to the laser modules. All anchor trunks with the laser modules were positioned vertically in order at the same interval distance set of 1 m at the initial position (Figure 4). Through the long slits along the casing, the anchor trunks with the laser modules can move freely by the generated vertical deformation of the surrounding soil. All laser sensor modules connected with the spring type cables were connected to an external control module. To ensure water resistance, the spring cables and top cap assembly were made waterproof. The anchored MDD casing head facilitated the measurement of net vertical deflections at each depth, enabling localized soil displacement measurements.

2.3. The Global Navigation Satellite System (GNSS) Measuring System

The GNSS antenna at the rover station was positioned above the MDD using the Swift Navigation® (San Fracisco, USA) GNSS receiver (Piksi® multi evaluation kit model), while at the base station, it was placed above the column containing the MDD’s main control unit (see Figure 4 and Figure 5). The GNSS system provided coordinates based on the phase center of the antenna. The precise coordinates of the base station antennas were obtained through the virtual reference station (VRS) technique provided by the Korea National Geographic Information Institute (NGII).
The relative positioning method, specifically the static base line method, has been identified as the most reliable and accurate approach for GPS positioning [19]. According to Shimizu et al. [18], this method entails utilizing the carrier phase of the signal, at least two sets of antennas and receivers, data downloading software, baseline analysis (post-processing) software, and a computer. As a result, the relative positioning method was adapted for monitoring slab-track displacements in this study. Further details on the relative positioning method can be found in the works of Misra and Enge [25] and Shimizu et al. [18].
As can be seen in Figure 6, the processing of GNSS data involved the use of RTKLIB (V. 2.4.2), an open-source software developed by Takasu and Yasuda [26]. This software comprises various programs such as RTKPOST, RTKNAVI, STRSVR, and RTKPLOT. RTKLIB includes tools for converting GNSS observation data to an RINEX format, allowing for the analysis of downloaded GNSS data on a computer. It also facilitates calculations for the Post-Processed Kinematic (PPK) technique, which provides precise calculation of coordinate changes.

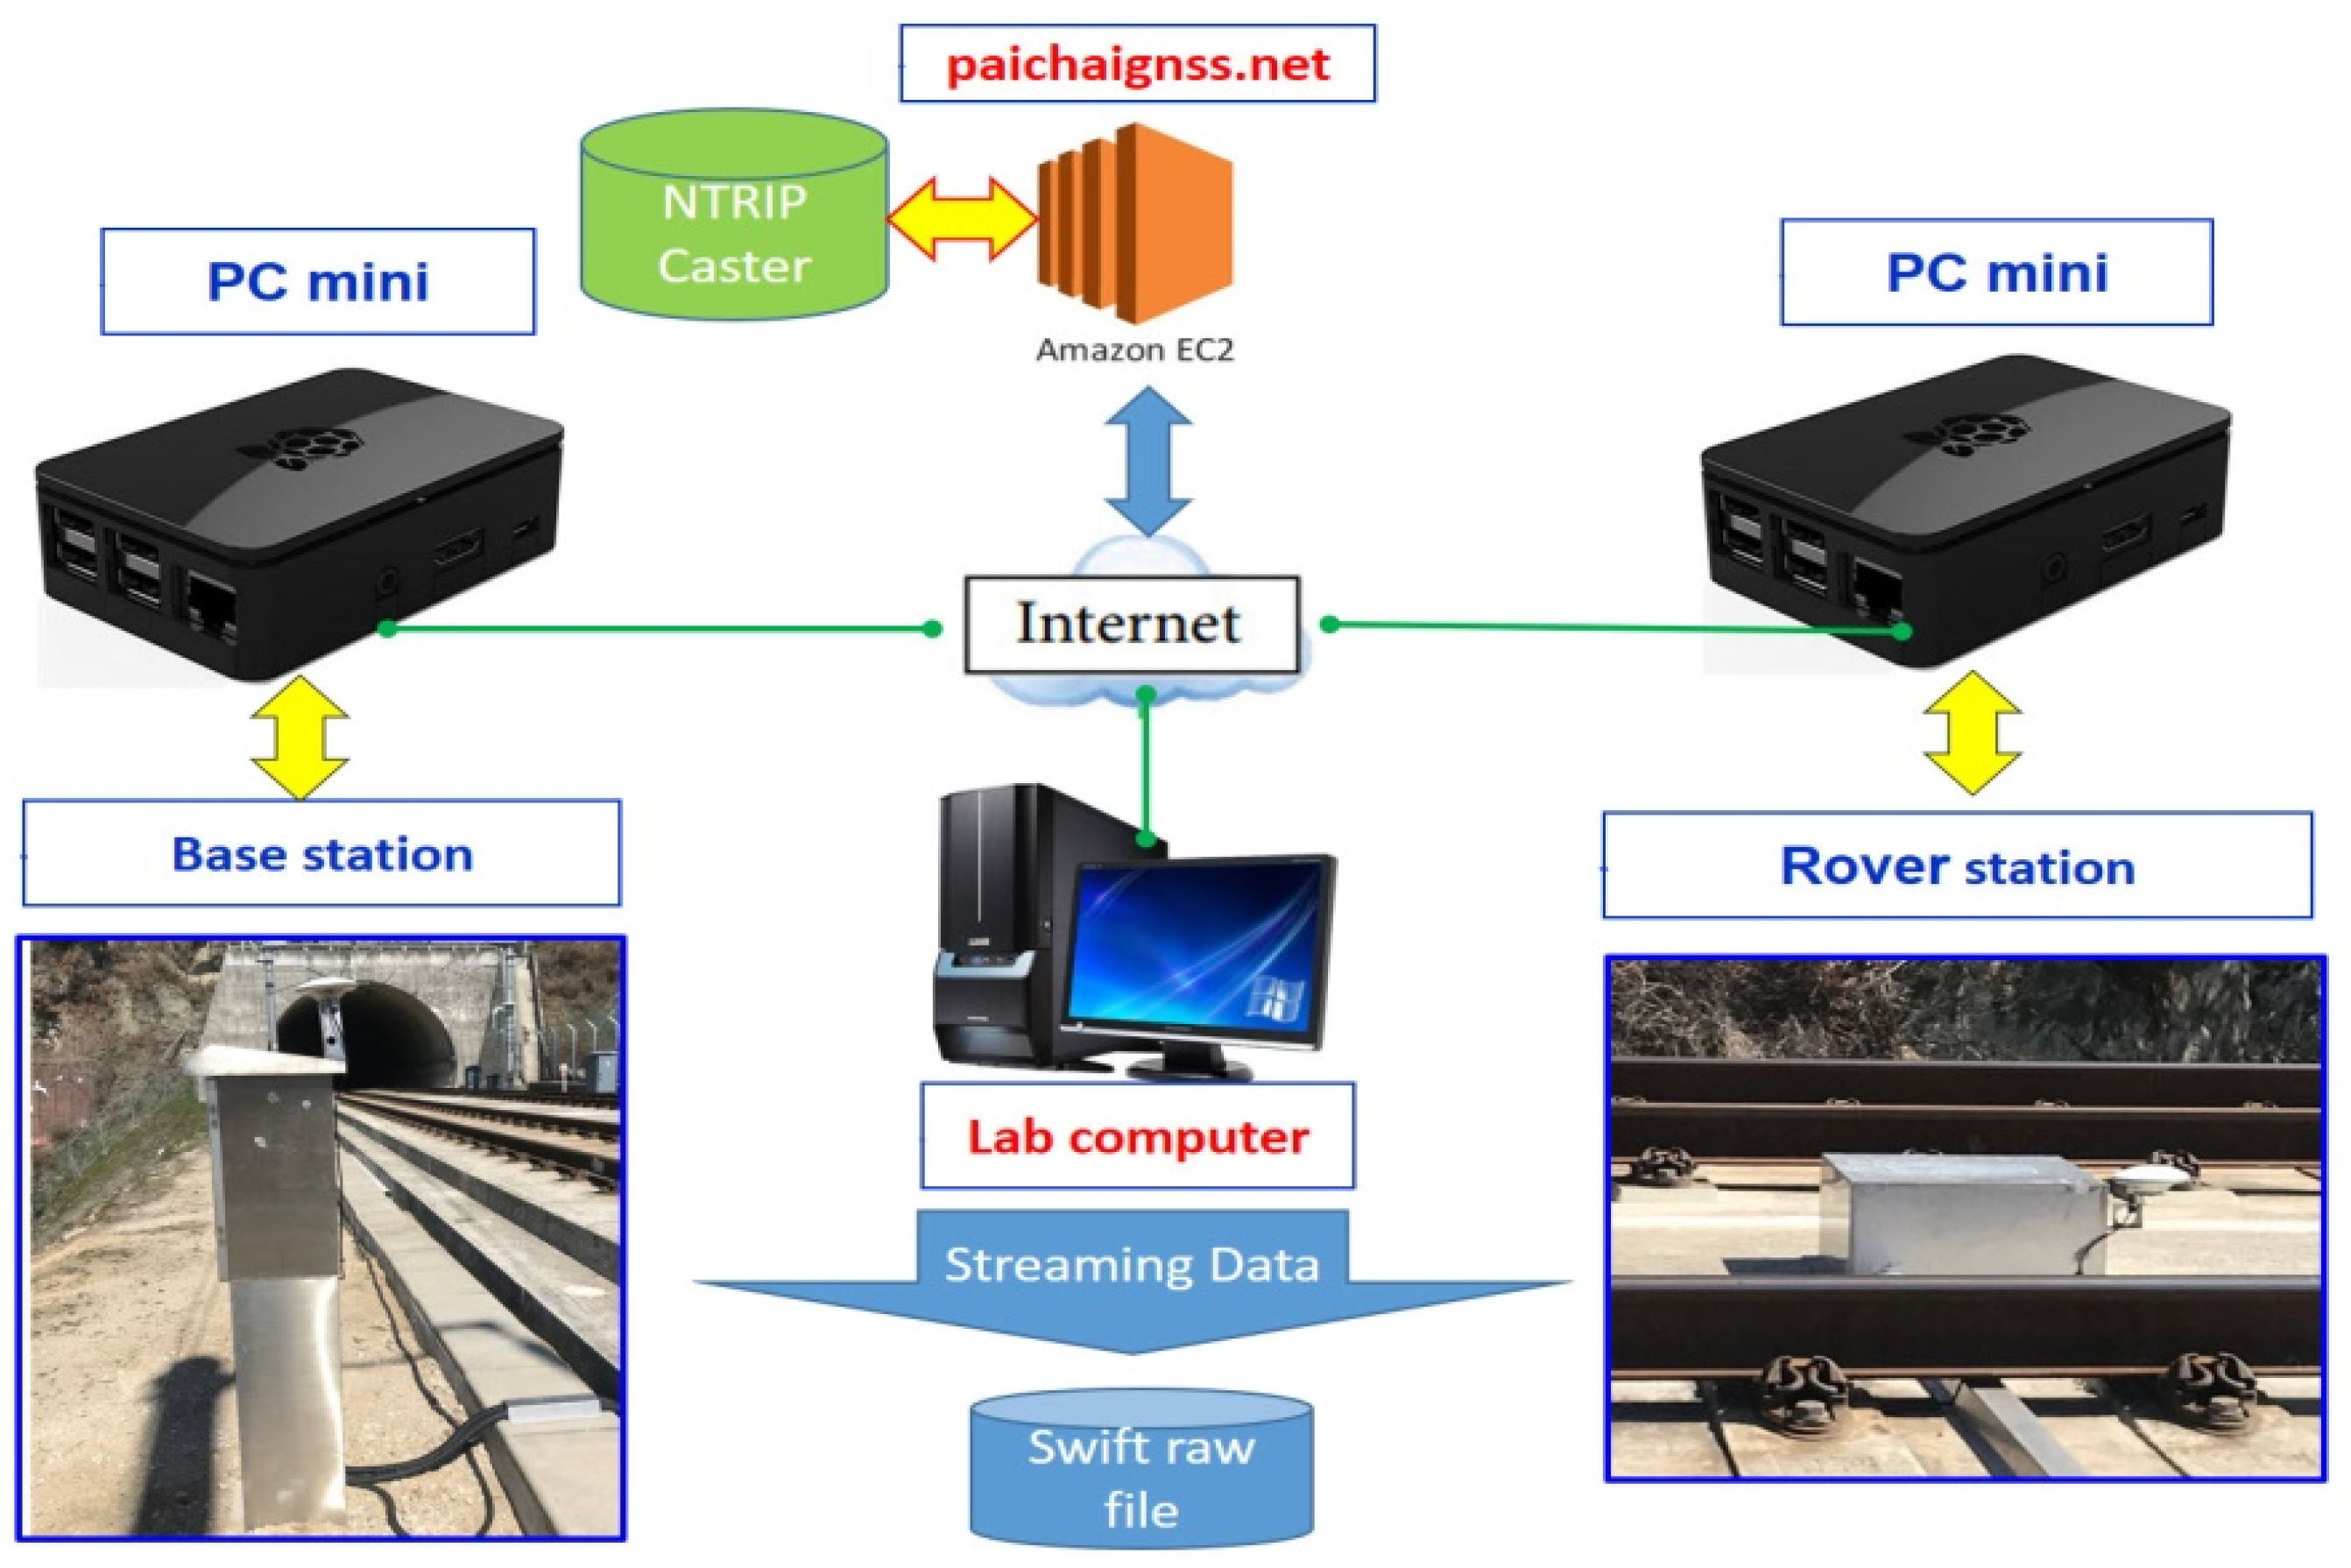
2.4. The MDD/GNSS Data Transferring System

Figure 7 illustrates the MDD/GNSS data transferring system that is composed of GNSS (GPS) antennas and receiver boards (Swift Navigation’s Piksi model), laser module controllers, an ADC/Raspberry Pi® Board and connection wires between them. It also shows the data wiring connection between the MDD and the Raspberry Pi® 4B board where the data are being transmitted to a cloud-based Firebase server. The developed software was employed to receive the data and store them on a computer located at PaiChai University’s laboratory. Figure 8 also depicts 4G wireless communication for the MDD/GNSS monitoring system. Each laser sensor was linked to a channel on an Analog Digital Converter Board (ADC), which then transmitted the data to the Raspberry Pi board. A real-time monitoring program running on the laboratory computer recorded and saved the data on its local hard disk storage for subsequent analysis and processing.
Figure 8 illustrates the complete configuration and functionality of this system, offering a comprehensive overview of its interconnected components. It emphasizes the system’s important components used in track layer displacement monitoring.

2.5. Determination of Reference Point Coordinates

The exact coordinates (WGS84) of the fixed point (base station) were determined by the Virtual Reference Station (VRS) technique supported by the Korea National Geographic Information Institute (NGII) as shown in Table 1. The virtual reference station (VRS) method is an effective way of transmitting correction data through a data link to users for real-time kinematic (RTK) positioning. The Network-based Real Time Kinematic (NRTK) technique was used to determine the coordinates of the base station based on ENU (east-north-up coordinates). This technique consists of Virtual Reference Stations (VRS) and Flächen Korrektur Parameters (FKP) and is operated by the National Geographic Information Institute (NGII) of Korea [27]. Most reference stations in Korea are densely located, with baselines ranging from 30 to 50 km, which provides a robust infrastructure for determining the current position of the base station (fixed point).

3. Settlement Calculation with Error Corrections and Resampling

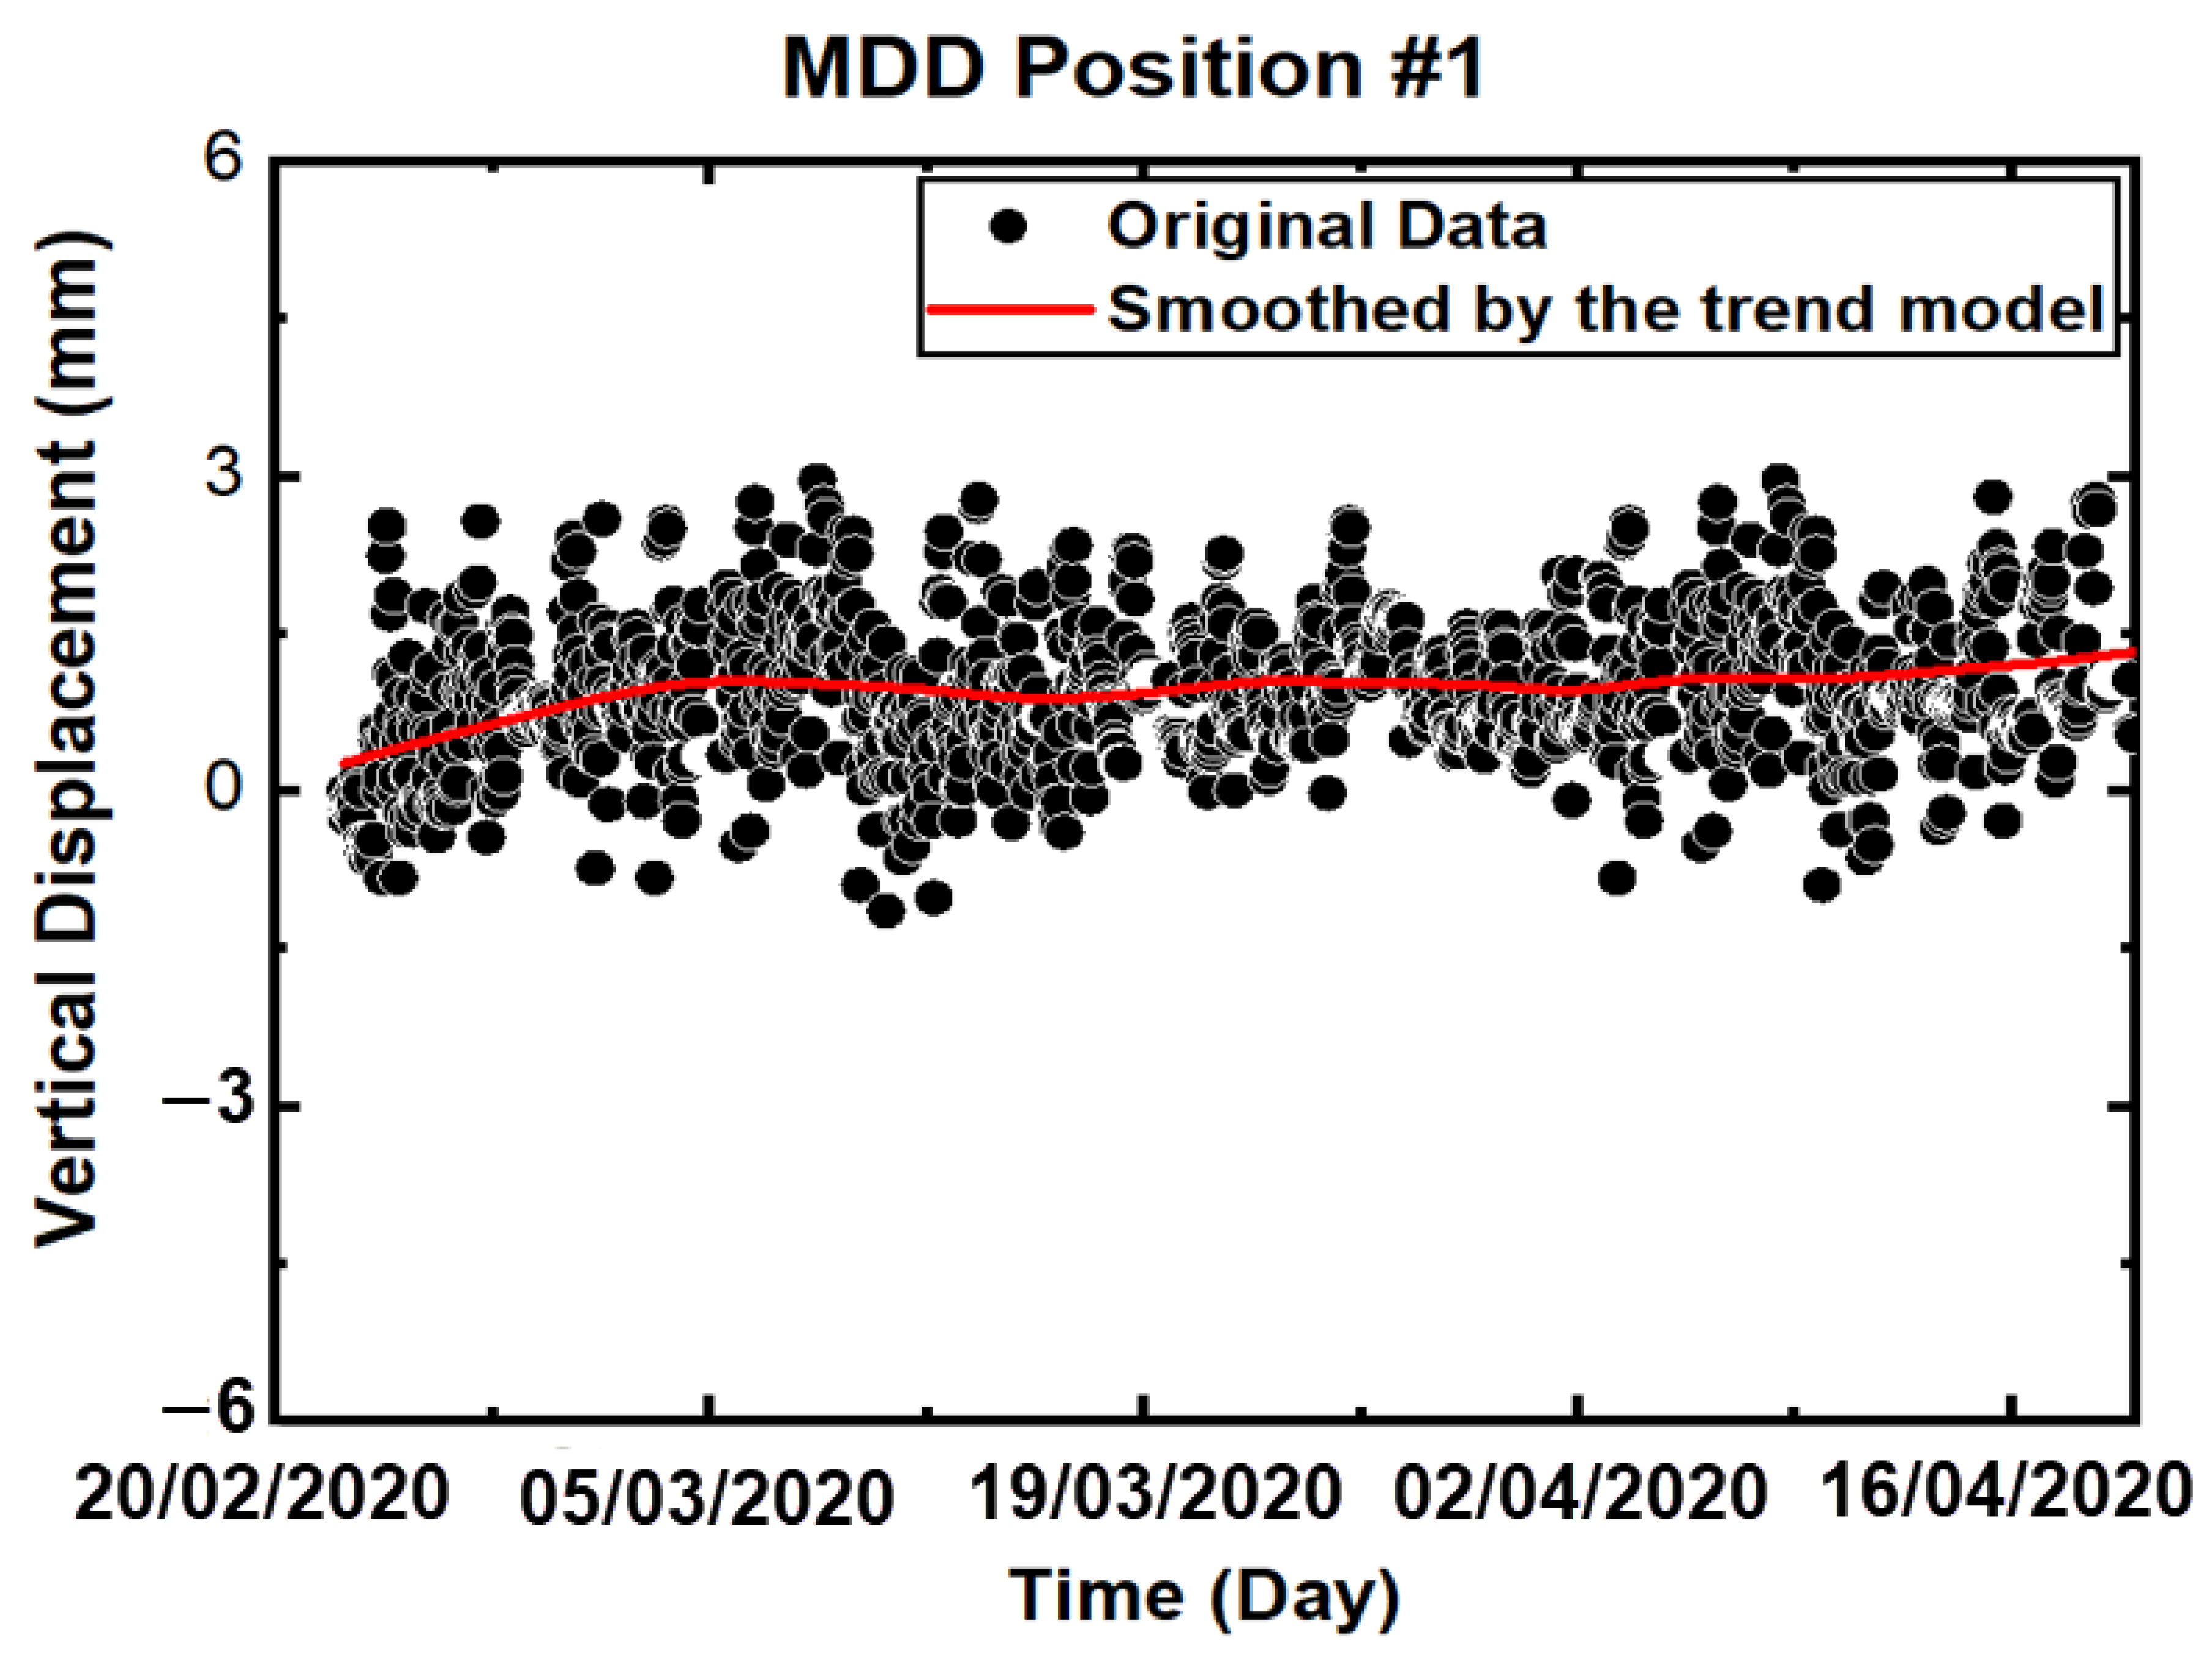
3.1. MDD Settlement Calculation over Time

In this study, the determination of MDD deformation at individual laser sensors was carried out through a systematic calculation procedure. To track the deformation over time, we conducted periodic measurements of the sensor displacement and subsequently compared them to the sensor’s initial position. The computation of the actual MDD settlement was performed using the following equation:
SMDD(t) = DtD0,
in which SMDD is the computed deformation for each MDD laser sensor position; D0 is the initial distance from the anchored head position, and Dt is the current distance from the anchored head position.

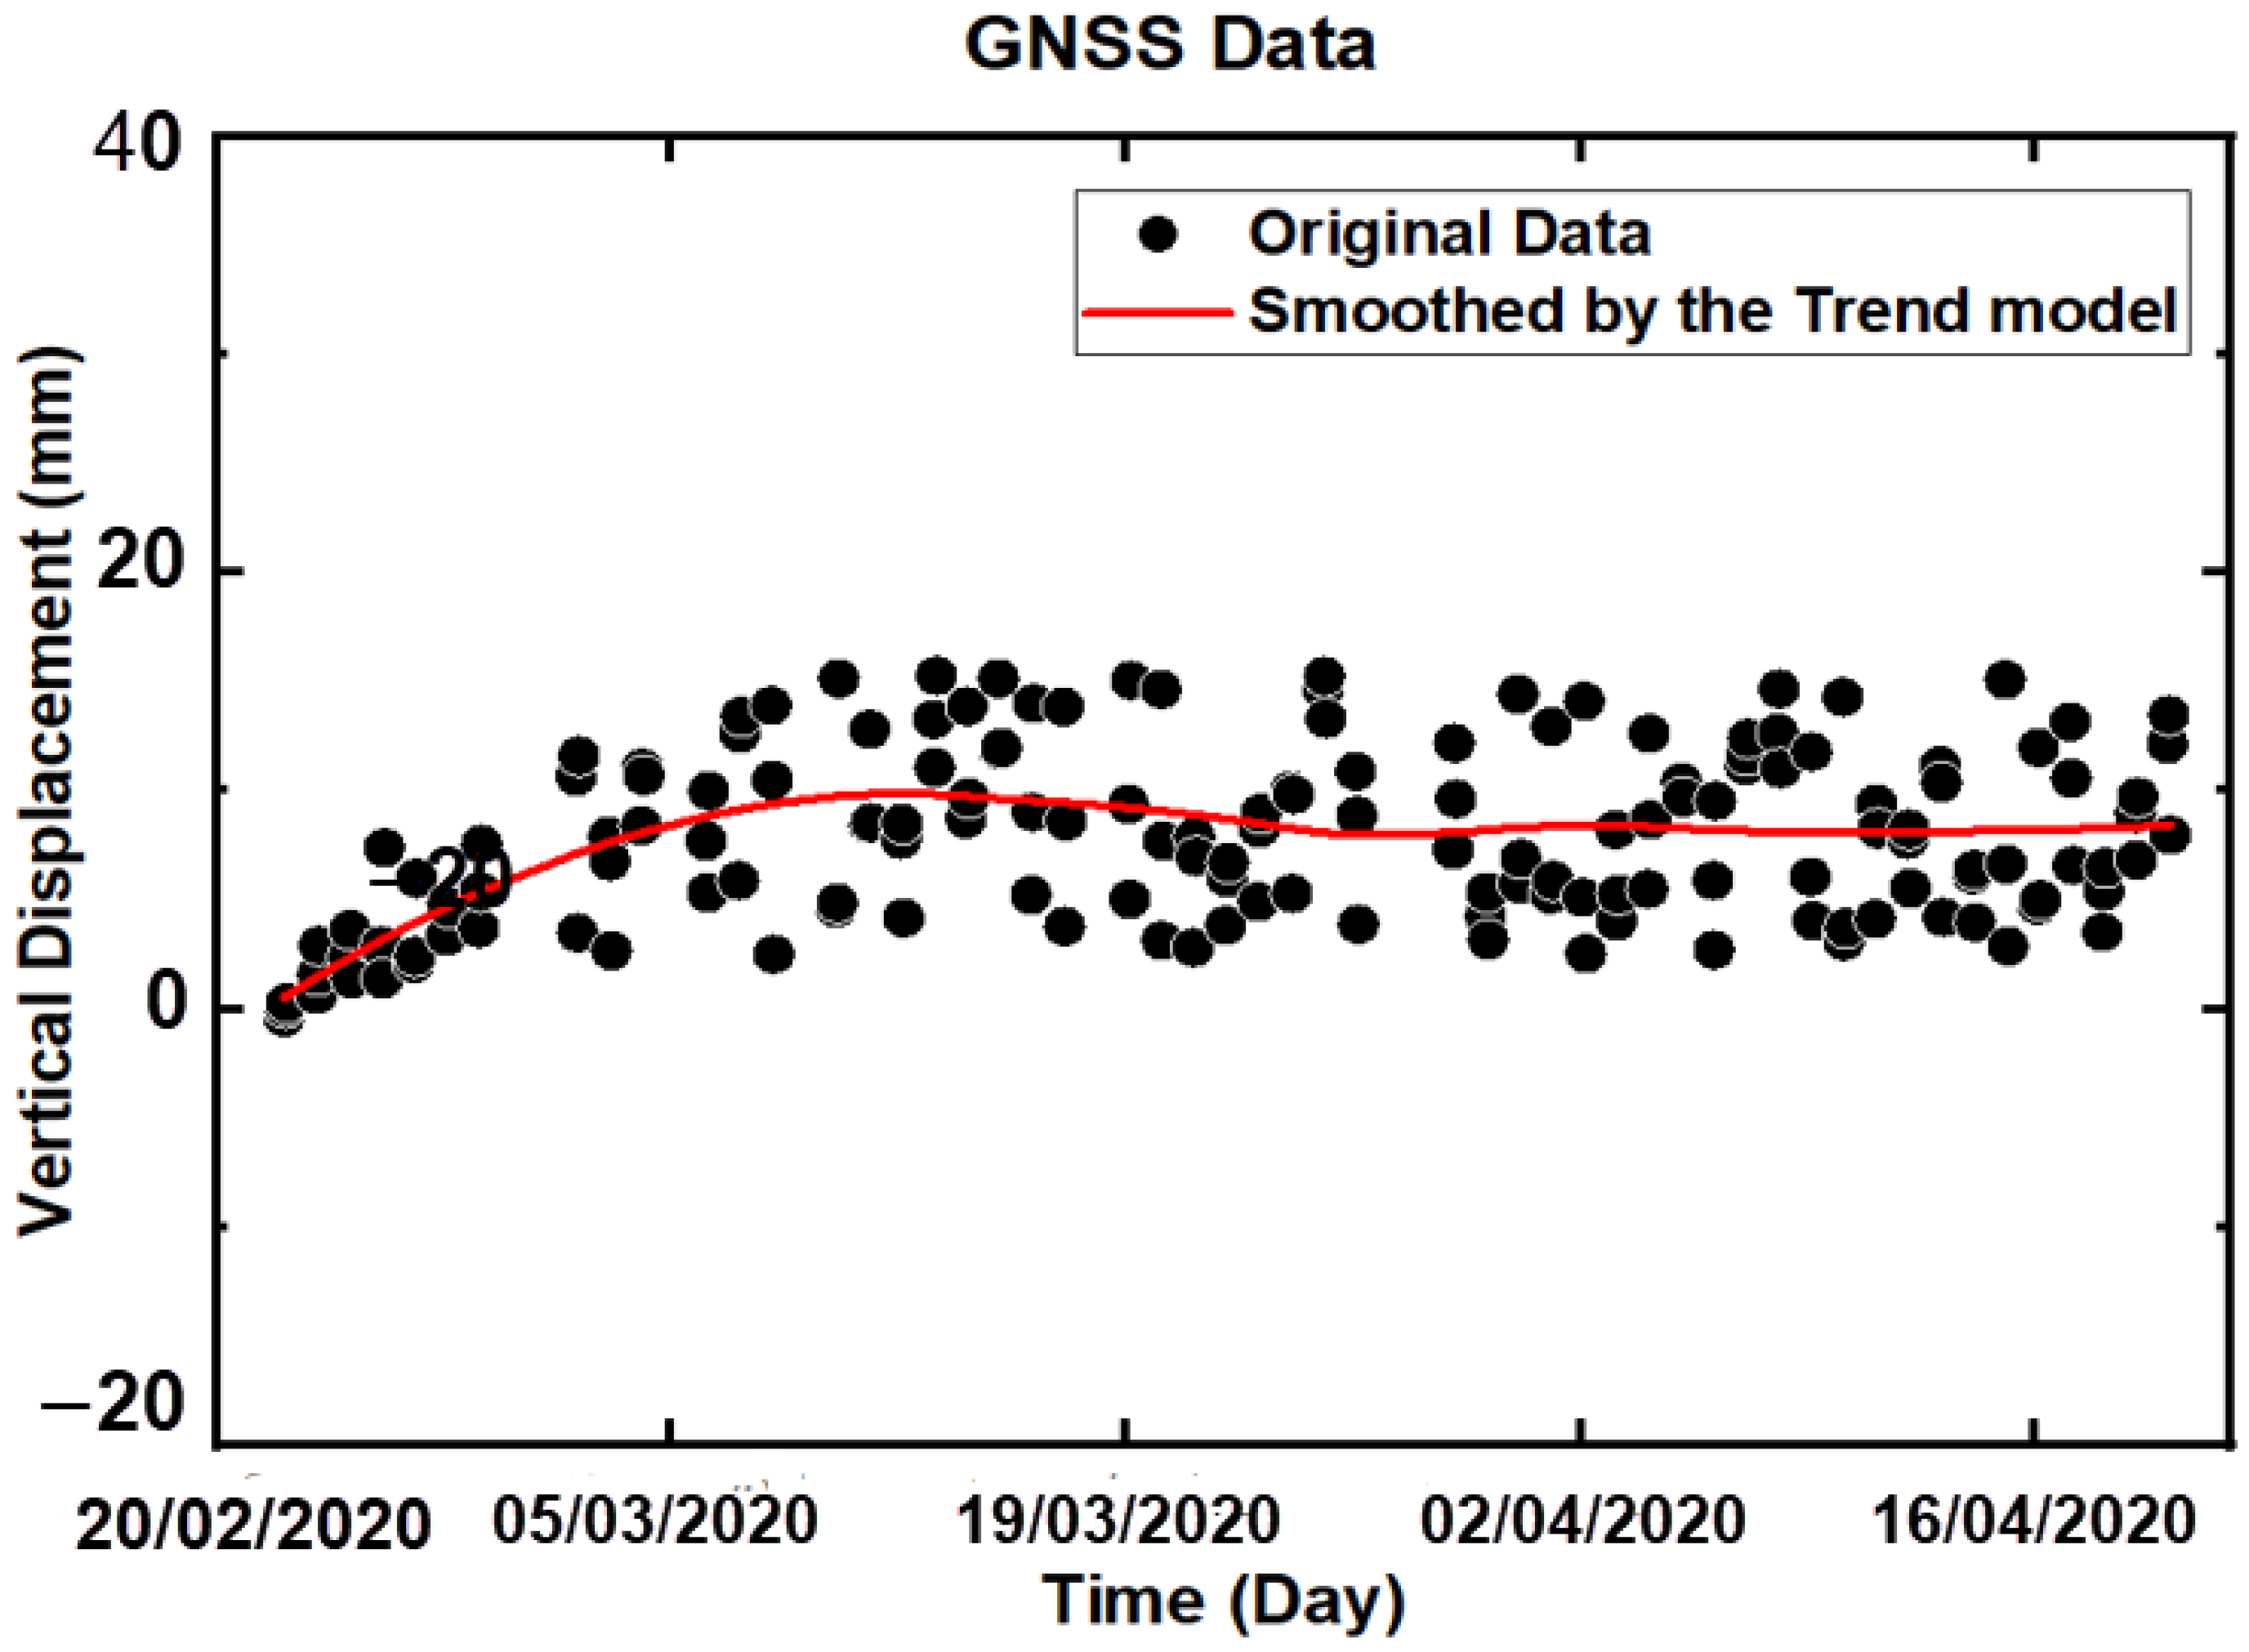
3.2. GNSS Absolute Settlement Calculation over Time

To accurately assess a slab track’s surface settlement using the GNSS system, the initial position of the GNSS rover was taken into consideration. By utilizing the GNSS rover’s initial position as a reference point, this approach facilitated the determination of track settlement based on the GNSS system with enhanced precision and reliability. The calculation method employed for the slab track settlement system was as follows:
SGNSS(t) = |UtU0|,
where SGNSS is the absolute settlement observed by GNSS rover, U0 and Ut are the initial z-position and the current z-position on the ENU coordinate of GNSS rover, respectively.

3.3. Total Settlement Calculation Overtime

By combining the absolute GNSS rover settlement and the MDD settlement, an accurate estimation of the total settlement in the concrete slab track layers was obtained.
STotal(t) = SGNSS(t) + SMDD(t),
where STotal is the total deformation of each layer, SGNSS is the GNSS settlement and SMDD is the computed deformation for each MDD laser position.

3.4. MDD/GNSS Data Error Correction

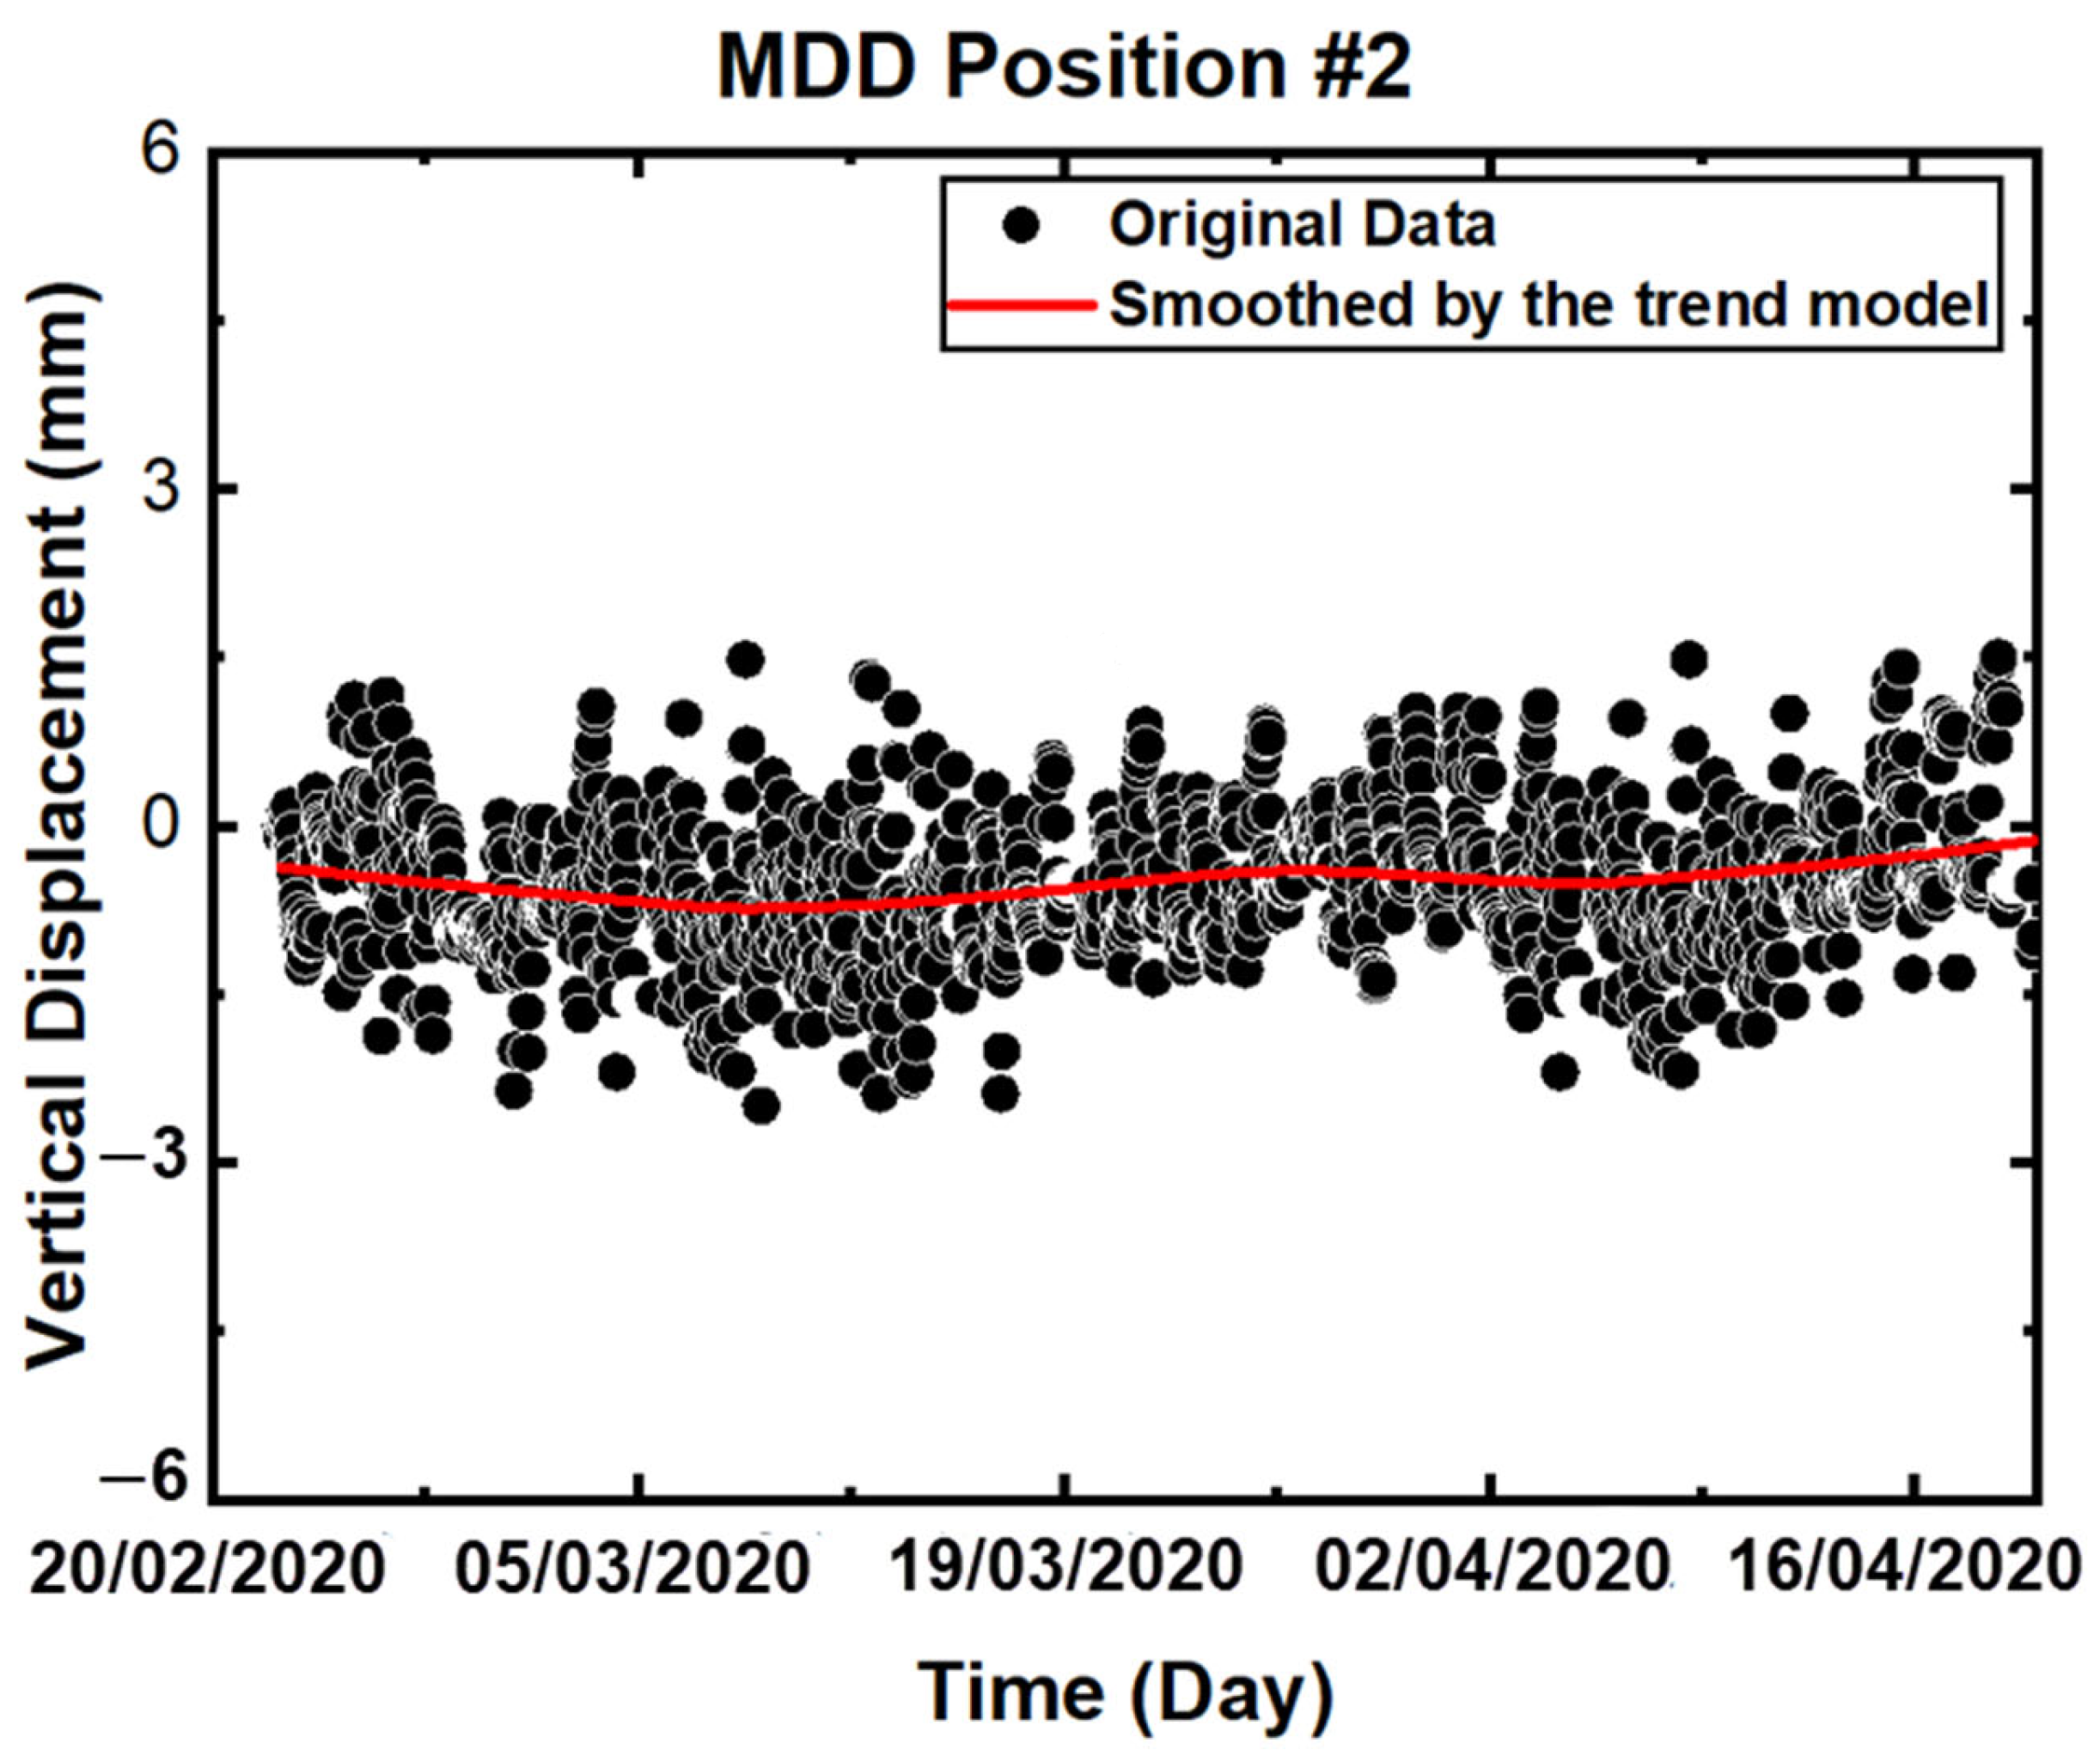
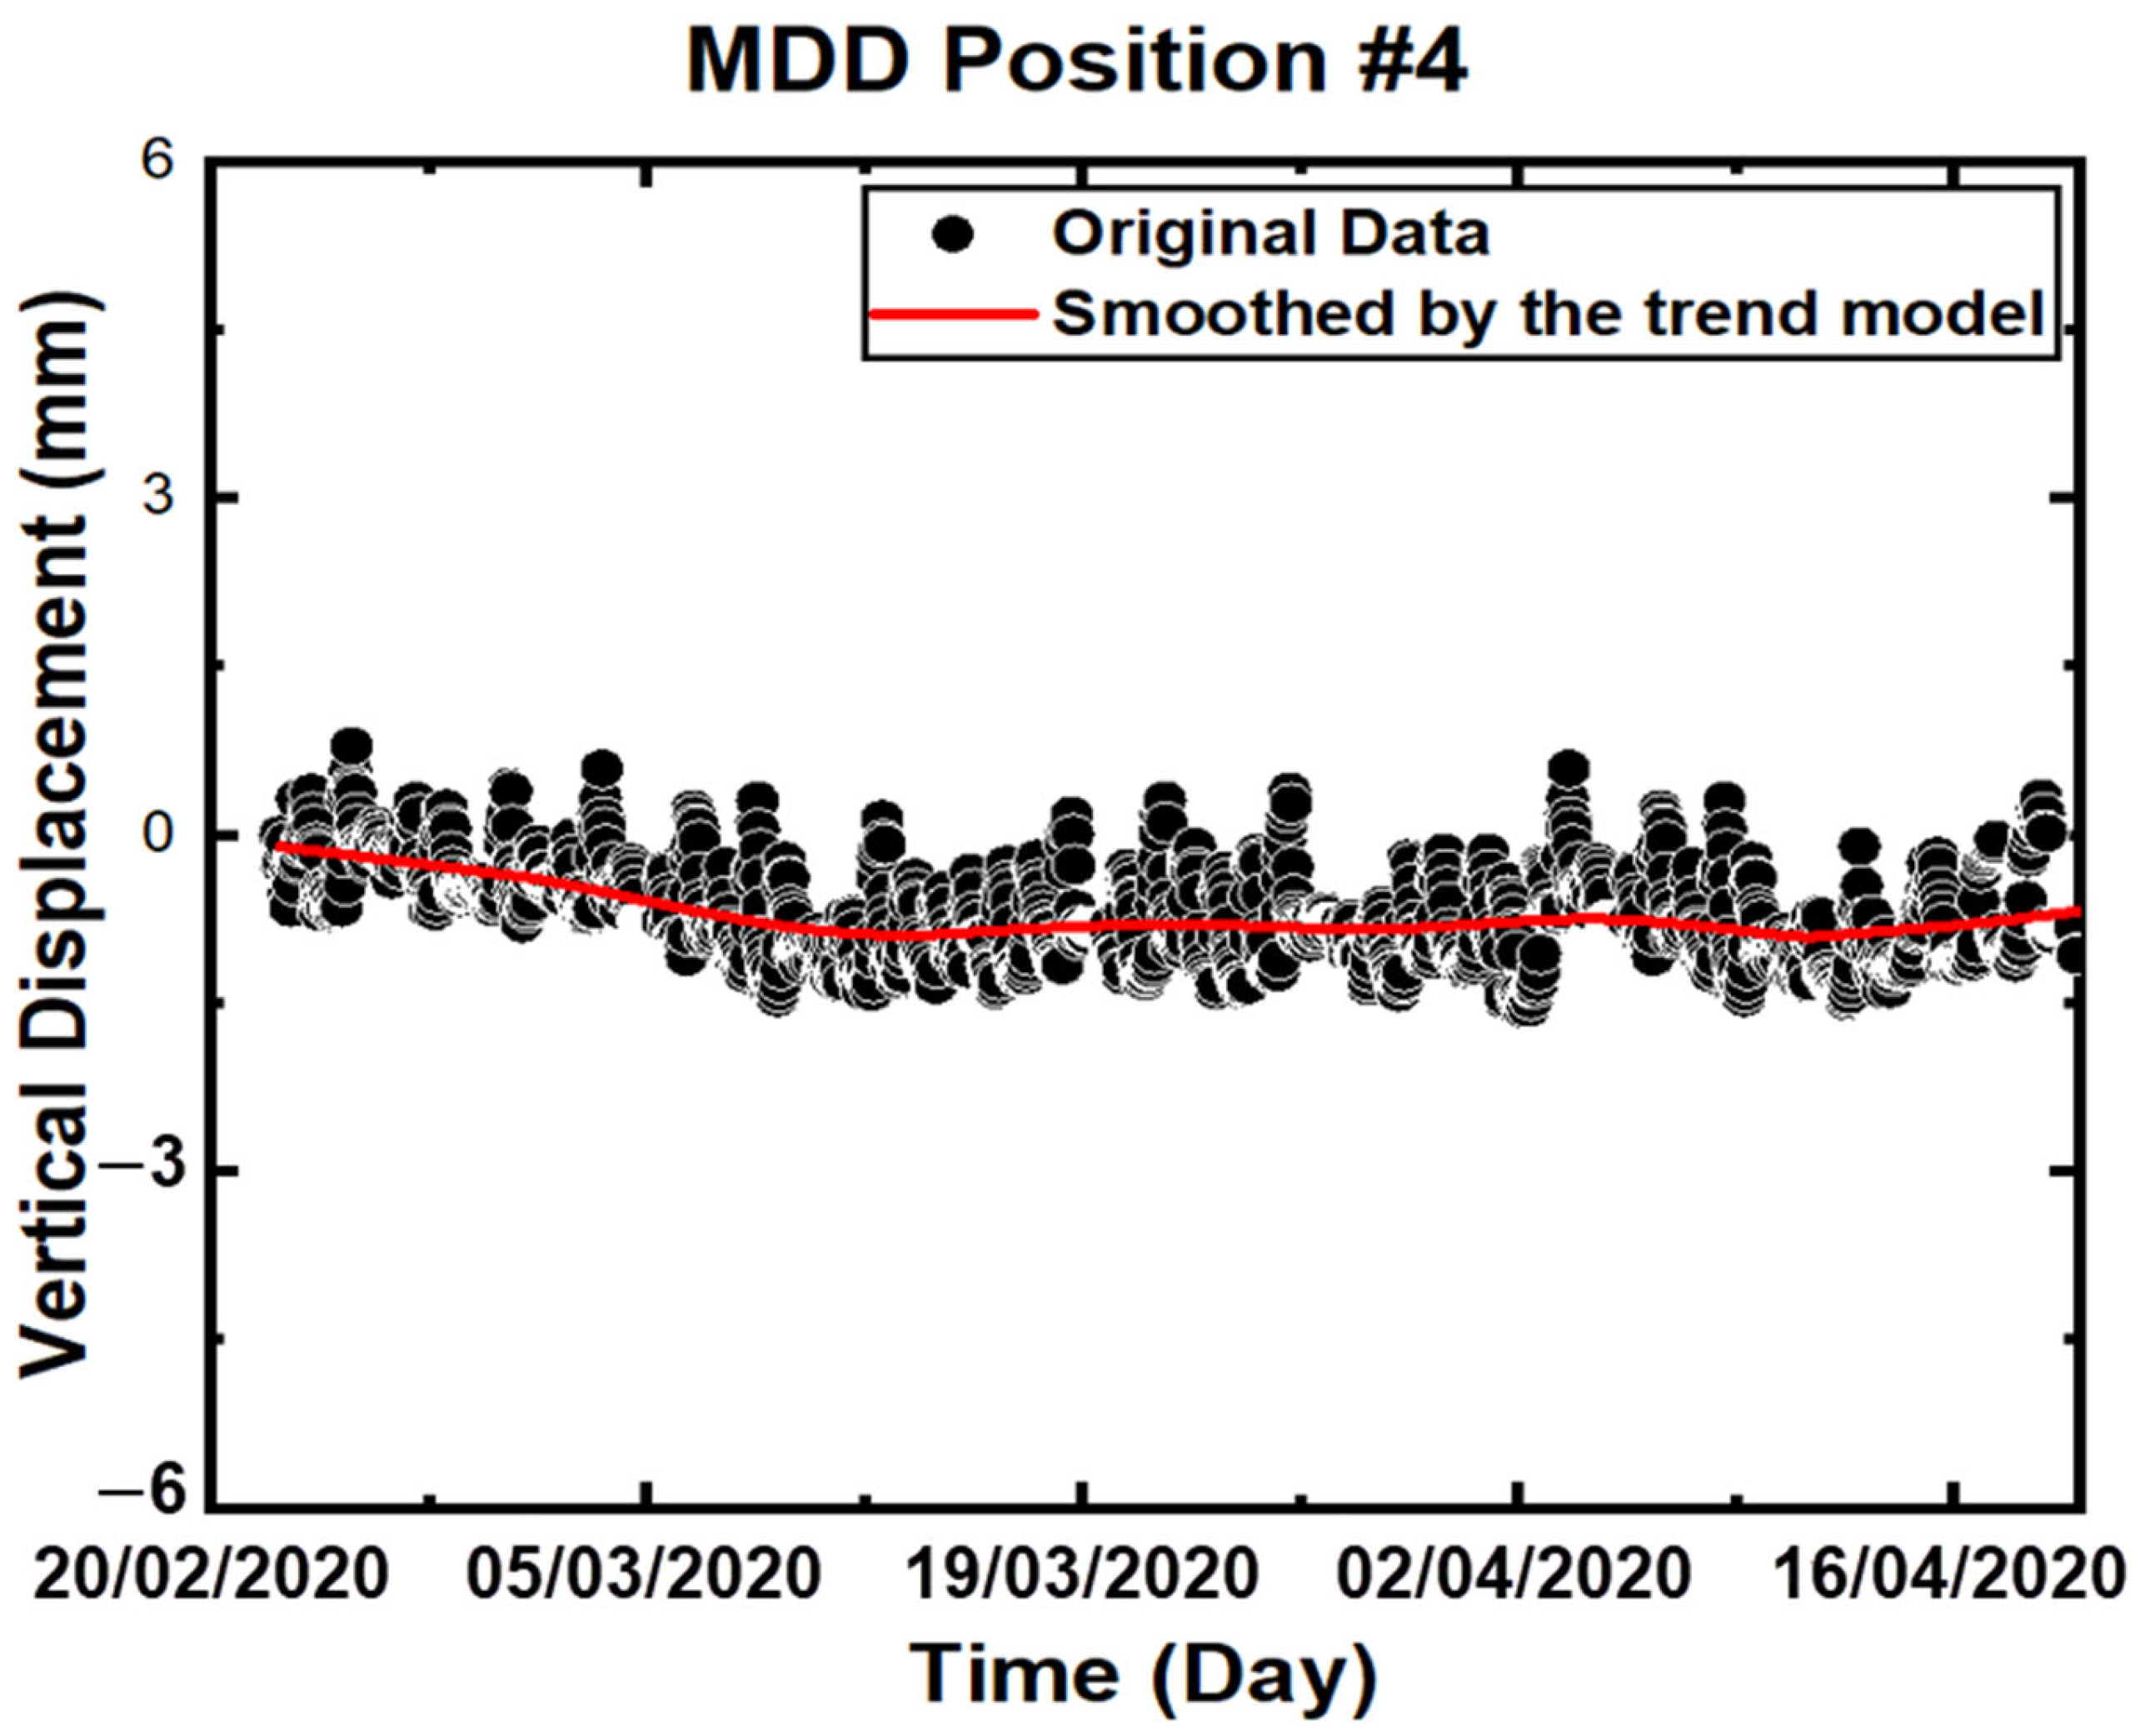
3.4.1. MDD/GNSS Data Analysis by the LOESS Trend Model

It should be emphasized that the presence of random errors and bias errors in the measurement results is noticeable, particularly in GNSS monitoring. Random errors are caused by fluctuations in measurements, while bias errors include factors like tropospheric delays and multipath effects. To ensure accurate monitoring, we adapted an error-correction method that effectively reduces both random and bias errors.
The utilization of a trend model has shown promising results in estimating measurements and reducing random errors. The trend model, specifically the LOESS (Locally Weighted Scatterplot Smoothing) trend model, is a statistical tool capable of identifying patterns and trends in data over time [23]. We used it in this study in analyzing Multi-Depth Deflectometer (MDD) and GNSS measurement data for slab tracks to aid in the detection of deformation changes. The LOESS trend model utilizes a locally weighted average to fit a smooth curve to the data, making it advantageous for handling non-linear relationships and outliers. It is a flexible approach for capturing underlying patterns in the data and exploring variable relationships [24]. The LOESS trend model was employed to smooth time series data from GNSS and MDD vertical displacement measurements in railway tracks, utilizing similar calculation equations as the general LOESS trend model for time series data smoothing. The LOESS regression model is defined as follows [23]:
y ^ = f x , t = w i , t y i ,
where y ^ is the predicted value of the response variable (vertical displacement), x is the predictor variable, t is the time index, yi is the observed value of the response variable, and w(i, t) is the weight assigned to the ith data point at time t.

3.4.2. MDD/GNSS Data Analysis by a Resampling Method

Resampling methods are statistical techniques used to estimate the properties of a population or to validate the performance of a statistical model. These methods involve repeatedly drawing samples from the available data, often with the goal of obtaining more accurate estimates or assessing the variability of statistical measures [28]. This study adopted the bootstrapping resampling method. Bootstrapping is a resampling method in statistics that involves creating multiple new datasets by sampling observations from the original dataset with replacement. It is commonly used for estimating the sampling distribution of a statistic, constructing confidence intervals, and assessing the variability of estimates [29]. The application of bootstrapping to GNSS and MDD smoothed data obtained from slab track settlement measurements based on time (days) is evident from Figure 9 and Figure 10. To accomplish this, bootstrap samples were generated by randomly selecting days from the available data with replacement. It is important to note that each bootstrap sample for both MDD and GNSS should contain the same number of days as the original dataset. The process of resampling with replacement allows for the possibility of selecting certain days multiple times in a bootstrap sample while excluding others entirely. A comprehensive explanation of the resampling method utilized in this context can be found in the work of Lahiri and Zhu [30].
Figure 9 displays the original data of the total track settlement acquired through the GNSS, accompanied by the smoothed curve determined using the LOESS trend model. Figure 10, on the other hand, depicts the original data of total track settlement obtained from the GNSS estimated through the resampling method. The trend model’s standard deviation error was calculated to be σ = 3.275 mm.

4. Analysis of Settlement Data and Discussion

4.1. GNSS Settlement Analysis Compared with Total Station Measurement

With careful analysis of GNSS monitoring results, it becomes apparent that there was a notable and substantial increase in settlement during the initial days leading up to March 7th. This increase can be attributed to the unfinished settlement trend and initial setting and curing age of cement grout used for repairing the settling zone which was experienced by our MDD/GNSS system during that specific period.
For comparison and validation of GNSS results, we compared the GNSS monitoring data with the total station (Figure 11) monitoring results obtained from a location near the MDD/GNSS box controller on the side of the slab track. As shown in Figure 12, there is a notable difference between GNSS and total station monitoring results. This disparity is mainly due to differences in the locations where the total station monitoring points were taken as shown in Figure 11. We confirmed that the track foundation soil exactly underneath the GNSS rover position was repaired by using the cement grout to prevent further settlement before installing the MDD/GNSS system. The results in Figure 10 reveal that there was still a trend of generating ongoing settlement during the initial days in this zone. However, the total station was used to monitor the settlement along the sideline of the track slab which was located some distance away from the grouted zone of the track. The side of the track slab was displaced vertically lower than that of the GNSS rover position.
Even though the comparison shows some similarity in the trends of settlement measurements between GNSS and total station monitoring, it reveals that better predictable results of measurements for this kind of repaired zone using cement grouting could be obtained through the GNSS system adapted in this study.

4.2. MDD Settlement Analysis

The analysis of Multiple-Depth Deflectometer (MDD) data and their comparison with original data and smoothed curve generated by the LOESS trend model is presented in Figure 13, Figure 14, Figure 15 and Figure 16. All MDD measurements for each laser module installed in the track foundation soil after applying the resampling method are presented in Figure 17. Standard deviation errors were calculated for each MDD laser module (#1, 2, 3, and 4) using the trend models, which found values of 0.872 mm, 0.6956 mm, 0.6295 mm, and 0.4327 mm, respectively. These very small errors indicate a close correspondence between MDD laser deformation data and the smoothed trend models. Similar standard deviations of Lasers #2 and #3 suggest their shared location in the similar foundation soil layer, while differences in deformation between Lasers #1 and #4 can be attributed to variations in soil depth and stress level differences. Notably, the higher standard deviation of Laser sensor module #1 implies its position located between the concrete slab layer (HSB; Hydraulically Stabilized Layer) and the existing lower compacted soil layer, potentially leading to increased random deformation due to railway traffic load.
Concerning scattered data in MDD laser sensor recordings, specifically at MDD position #1, we observed that this position experienced a different deformation pattern compared to other positions. Deformation values measured at MDD position #1 deviated significantly from the expected values, indicating an upward trend and divergence in settlement data when compared to lower MDD laser positions that exhibited a downward trend. One potential factor contributing to this difference is the cavity expansion resulting from cement grout pressure during the repair of track foundation soil that was settled and an unexpected void space existing between the slab and the compacted soil surface.
Grouting pressure was applied for restoration of the slab track between the upper subgrade layer and the HSB layer, precisely at the location of MDD position #1. The presence of pressurized cement grout and subsequent cavity expansion introduced non-uniform settlement patterns contributing to the observed divergence in settlement data at MDD position #1.
It was necessary to consider factors such as non-uniform cavity expansion, weak or unstable subgrade conditions, and the loss of grout and formation of unknown voids as potential contributors to divergence of settlement types. However, cavity expansion resulting from grout pressure can be one of the major potential contributing factors among many others in this kind of repair task for the track slab.

4.3. MDD-GNSS Total Settlement Analysis

The total settlement for all MDD positions was recomputed using Equation (5), which added the calibrated data obtained from the MDD to the absolute GNSS measurements. The comparison of recalculated MDD measurements for each laser module position presented in Figure 18 reveals that the total deformation experienced at Position P1 was larger than those of the other positions. As mentioned previously, this difference can be attributed to the location of P1, which was placed between the concrete slab and compacted soil surface. We postulated in the previous chapter that Position P1 is known to experience the cavity expansion resulting from cement grout pressure and the unexpected void space between the slab and the compacted soil surface (Figure 19).
Before grouting pressure was applied to the weak foundation soil and the void space for restoration of the slab track as shown in Figure 19, the slab might have endured deformation for a while by its strong flexural stiffness even though there was the void space below it. However, some cracks were observed on the surface of the slab externally. This phenomenon was pointed out by some observers [31].
After the restoration of the slab track, it was presumably predicted that a smaller void space might have remained below the track slab as illustrated in Figure 19 since it was observed that a relatively large following settlement was measured by the GNSS rover as described previously (Figure 18). An approximately 2.0 mm difference in total settlement between Position 1 and other positions (2, 3, 4) in the MDD/GNSS system is attributed to one main reason: The bearing capacity in the track foundation soil near the slab was not still sufficient to resist the slab weight and the train load fully after restoration. This lack of bearing capacity came from the existing small void space below the slab even though its size was reduced somewhat by grouting restoration.
To analyze the contribution of the remaining void space to the total settlement difference between Position 1 and other positions, curve fitting was prepared first to construct the most effective model for predicting settlement curves measured by the MDD with the GNSS. This is explained in detail in the following chapter.

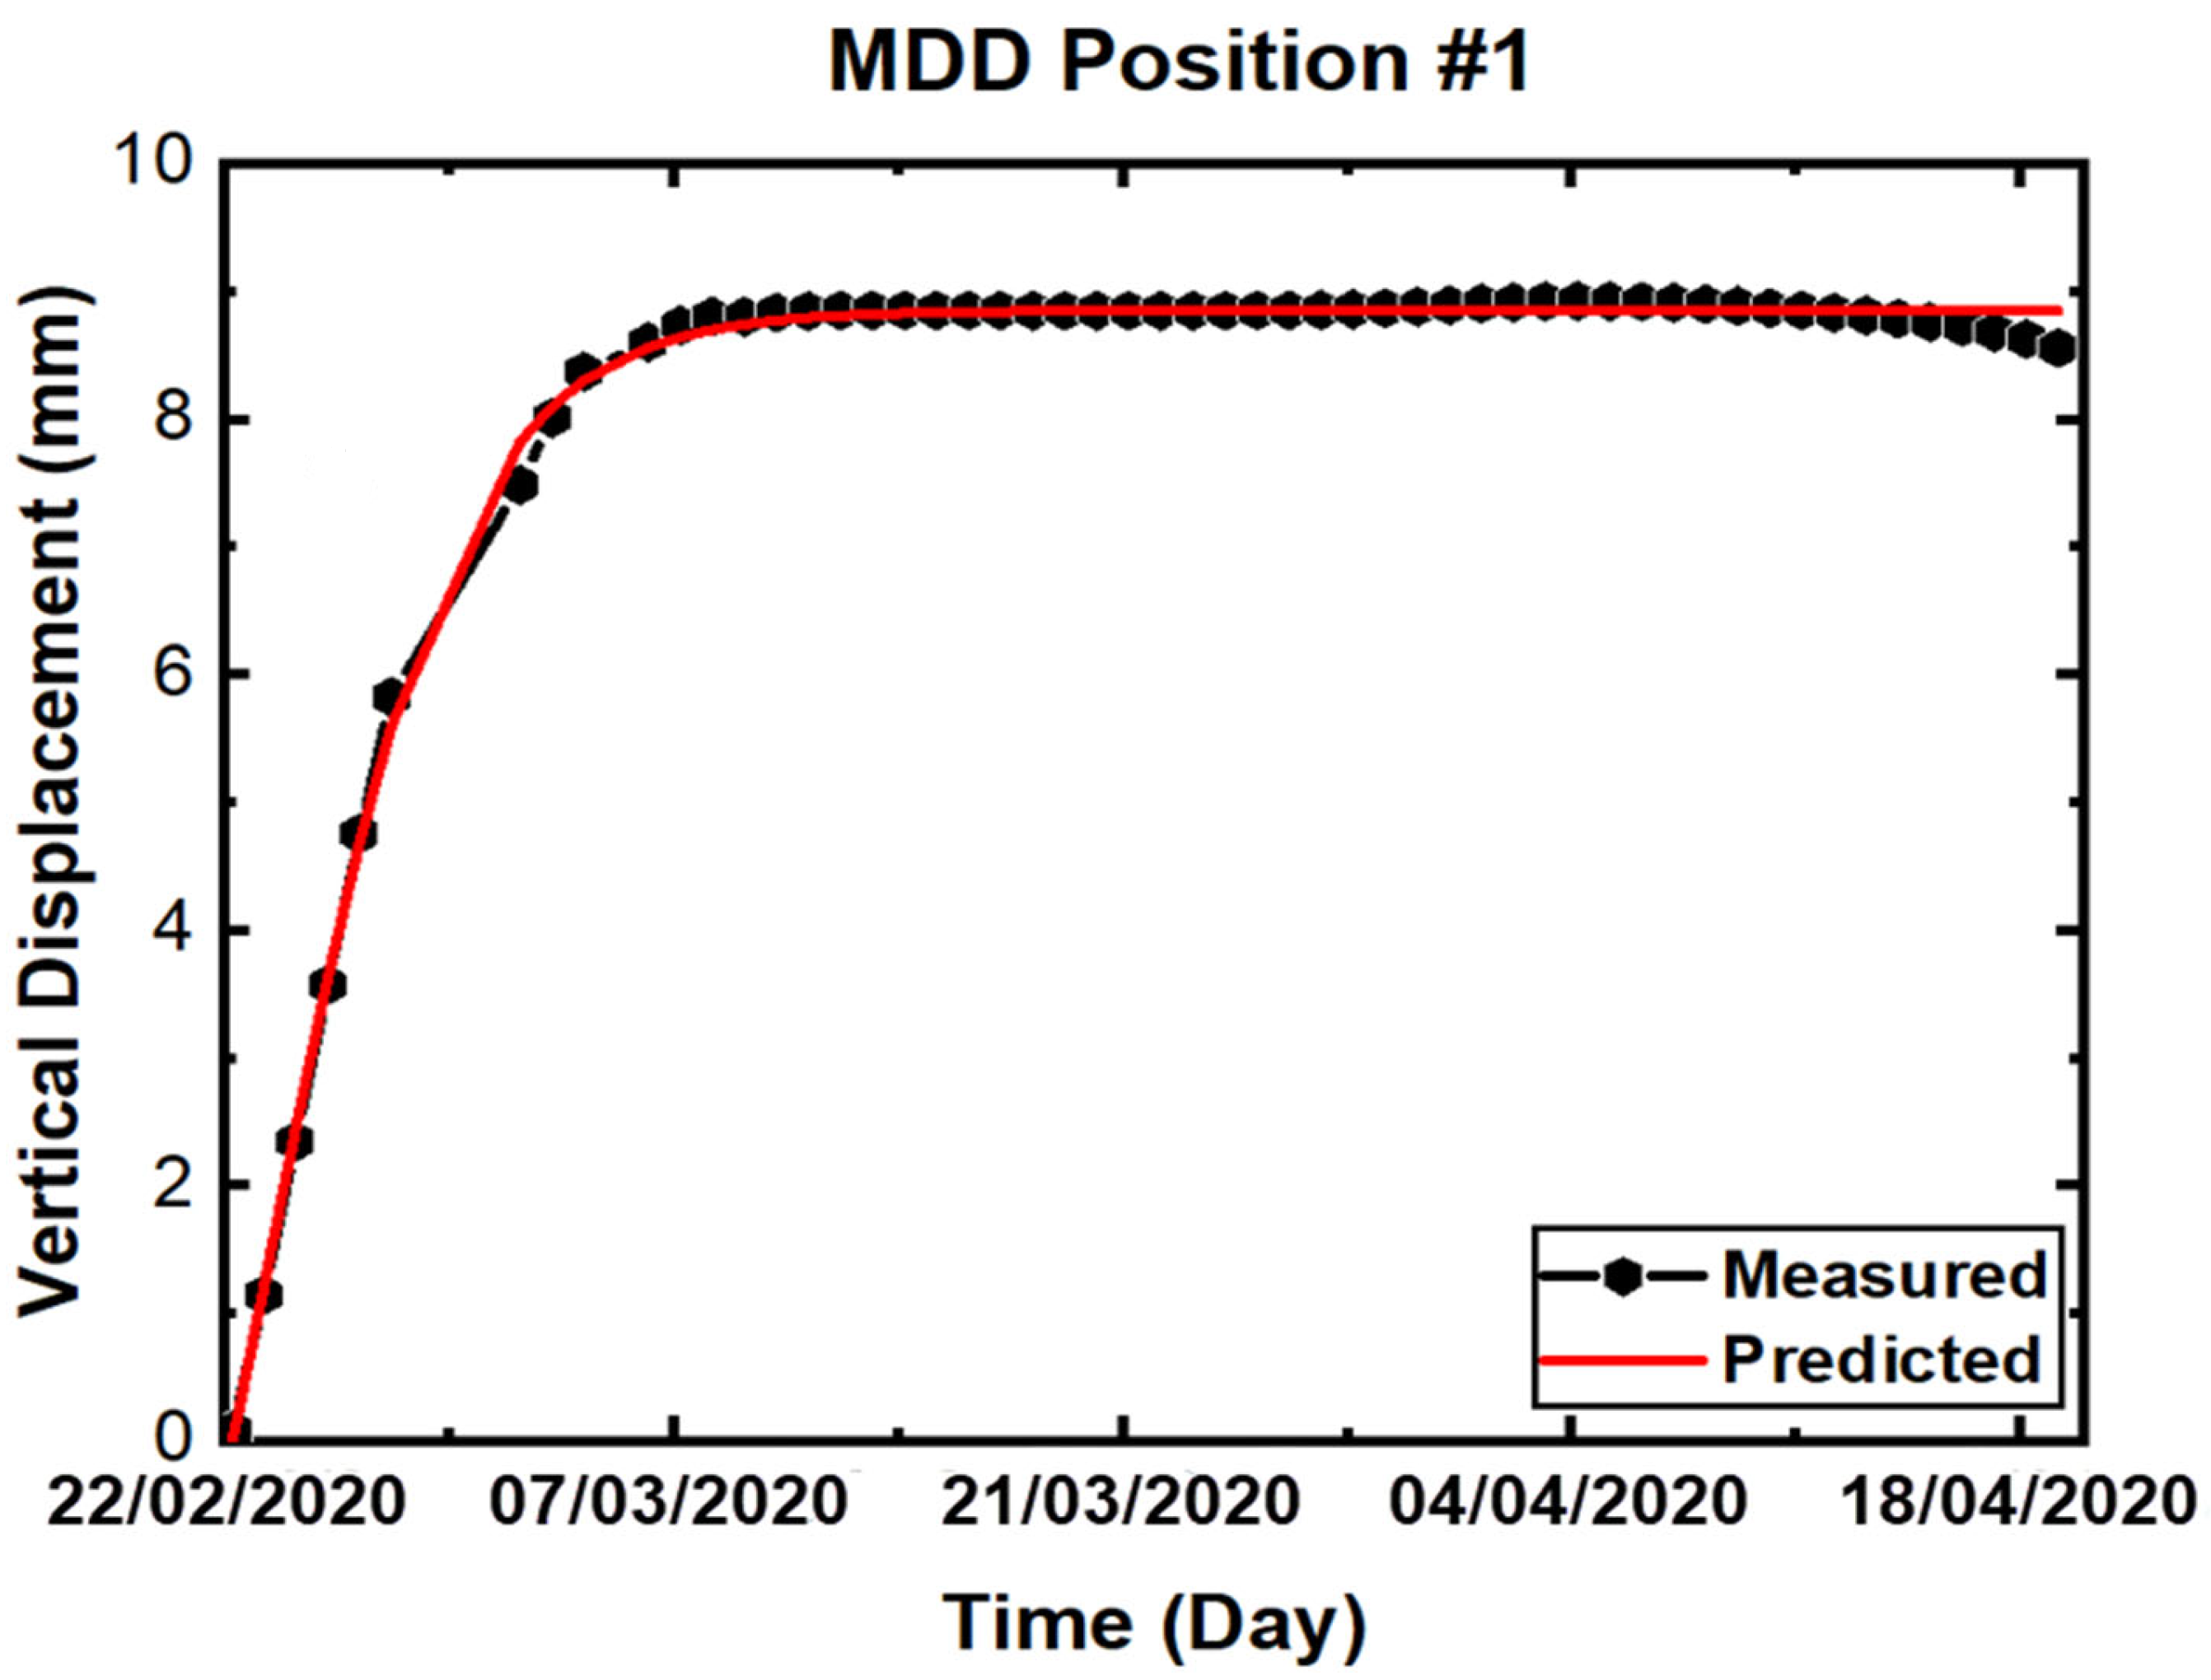
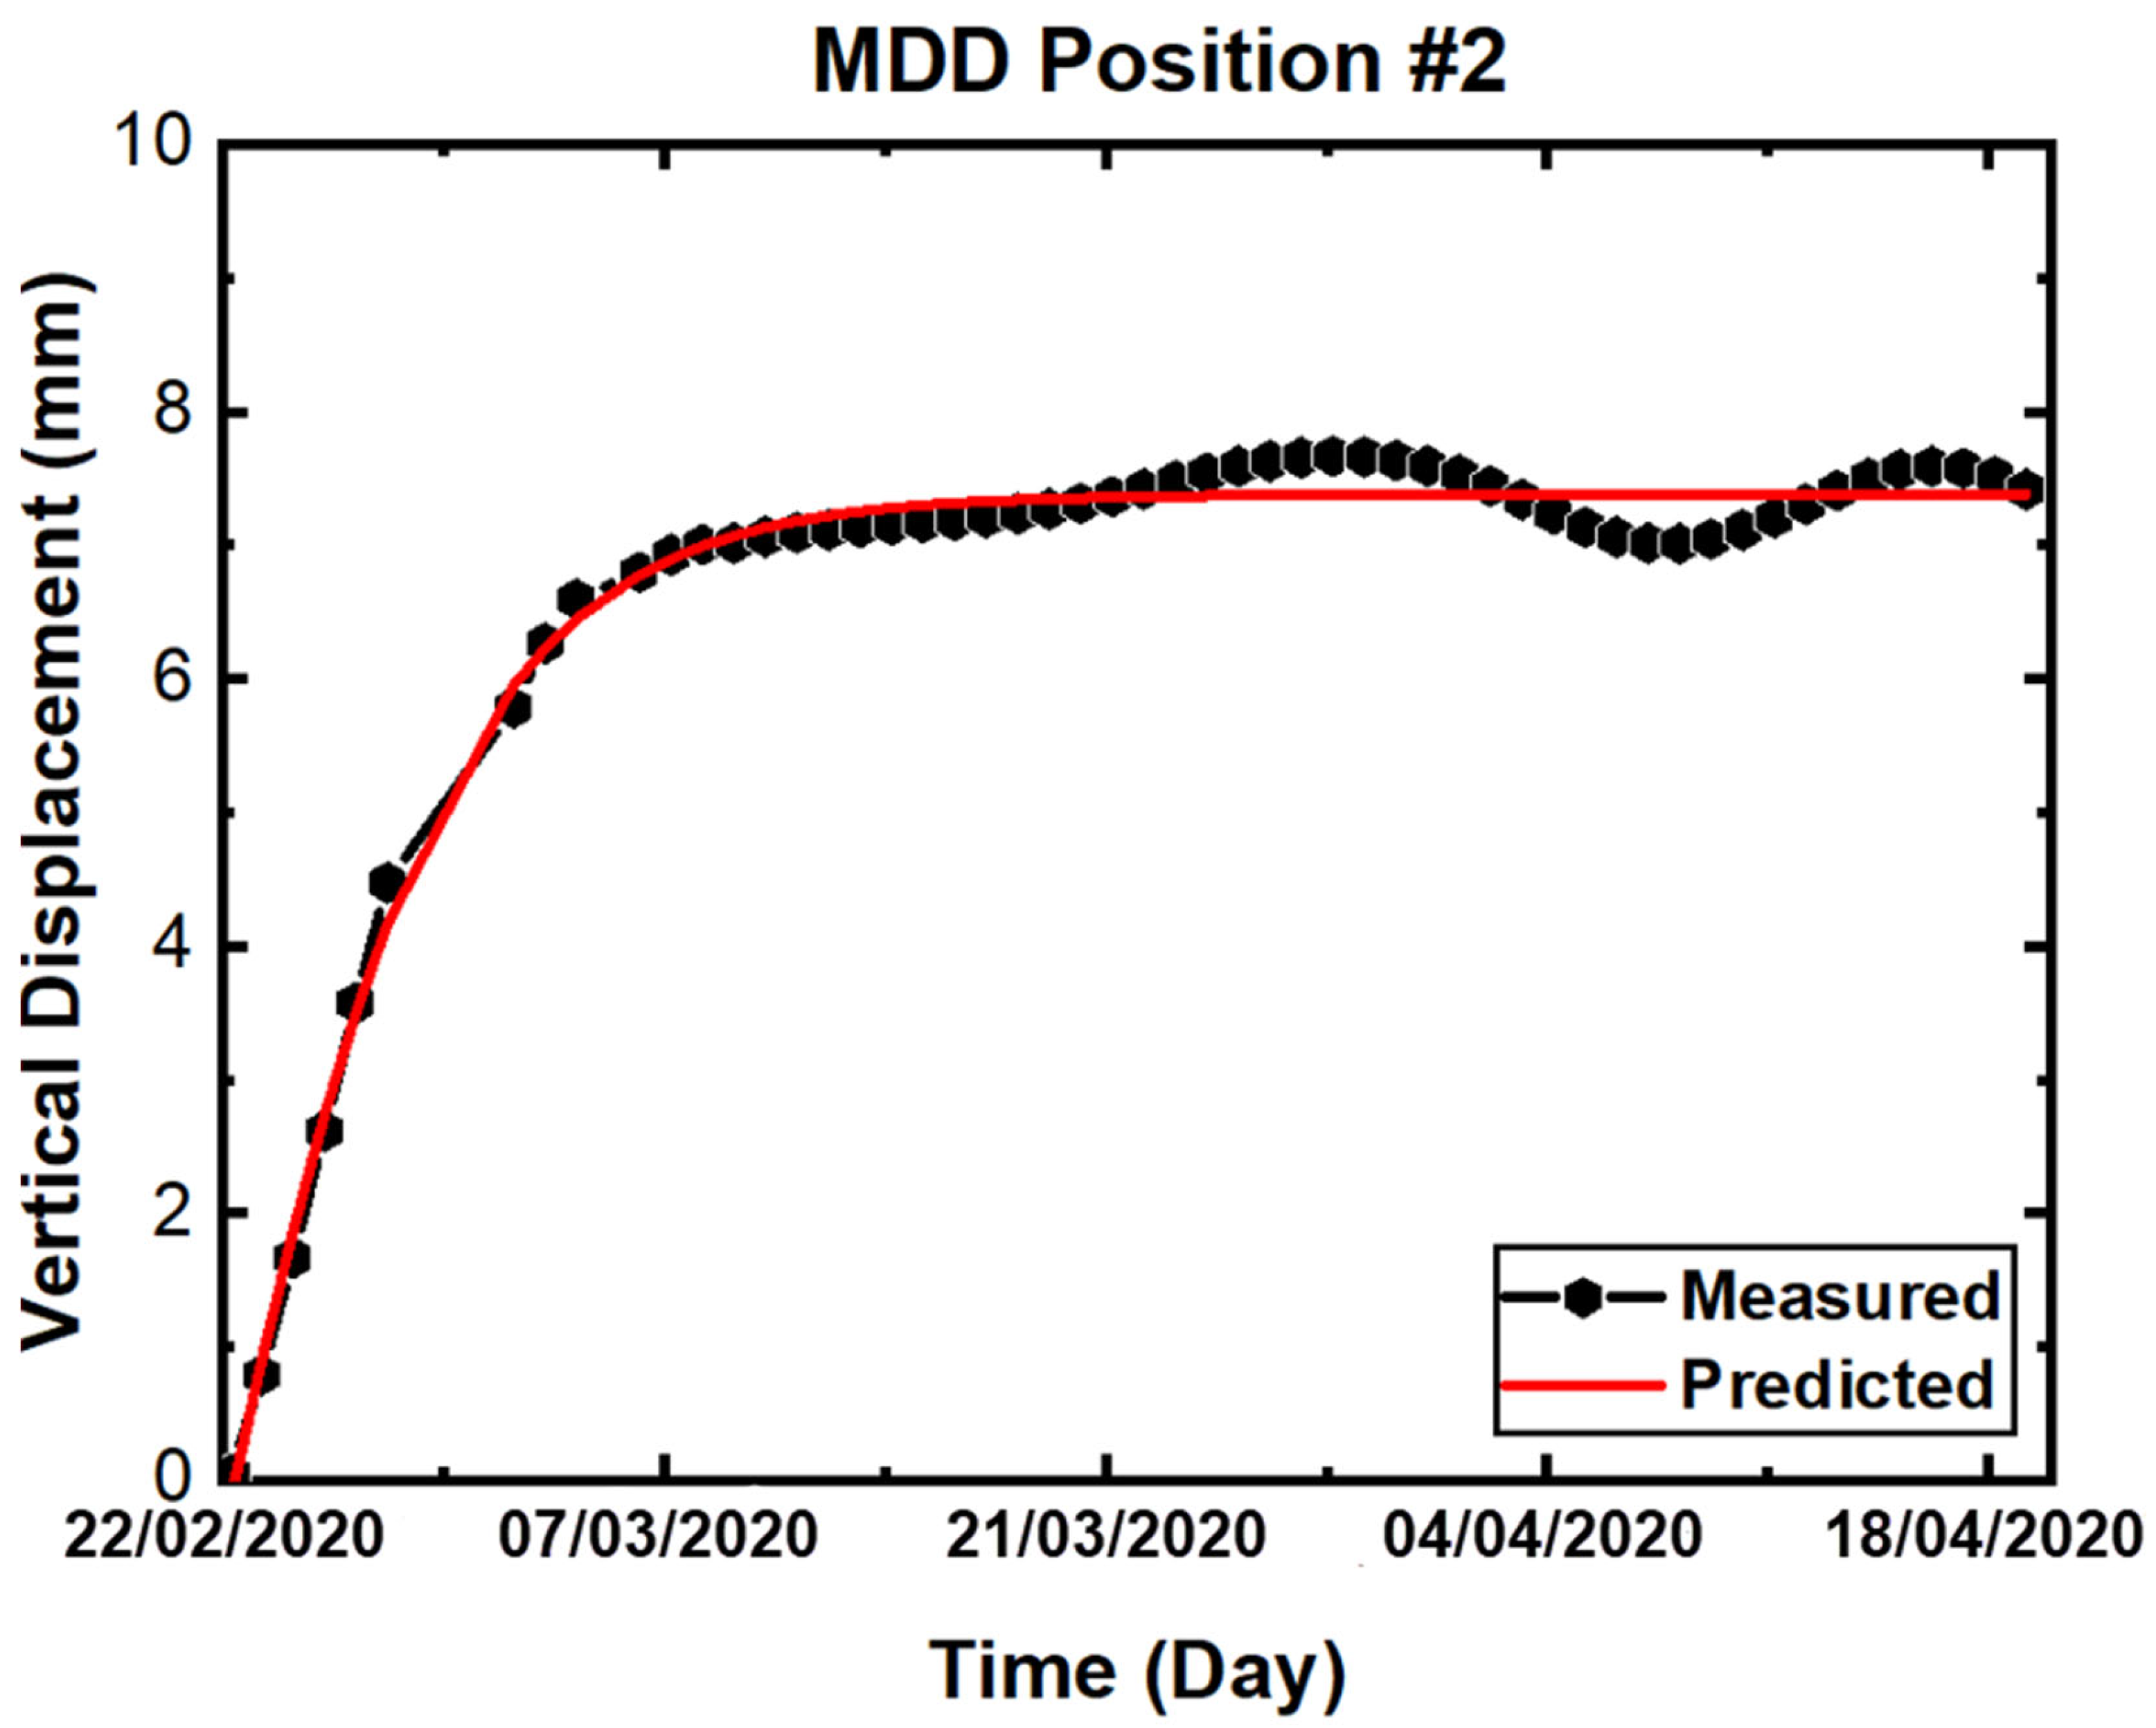
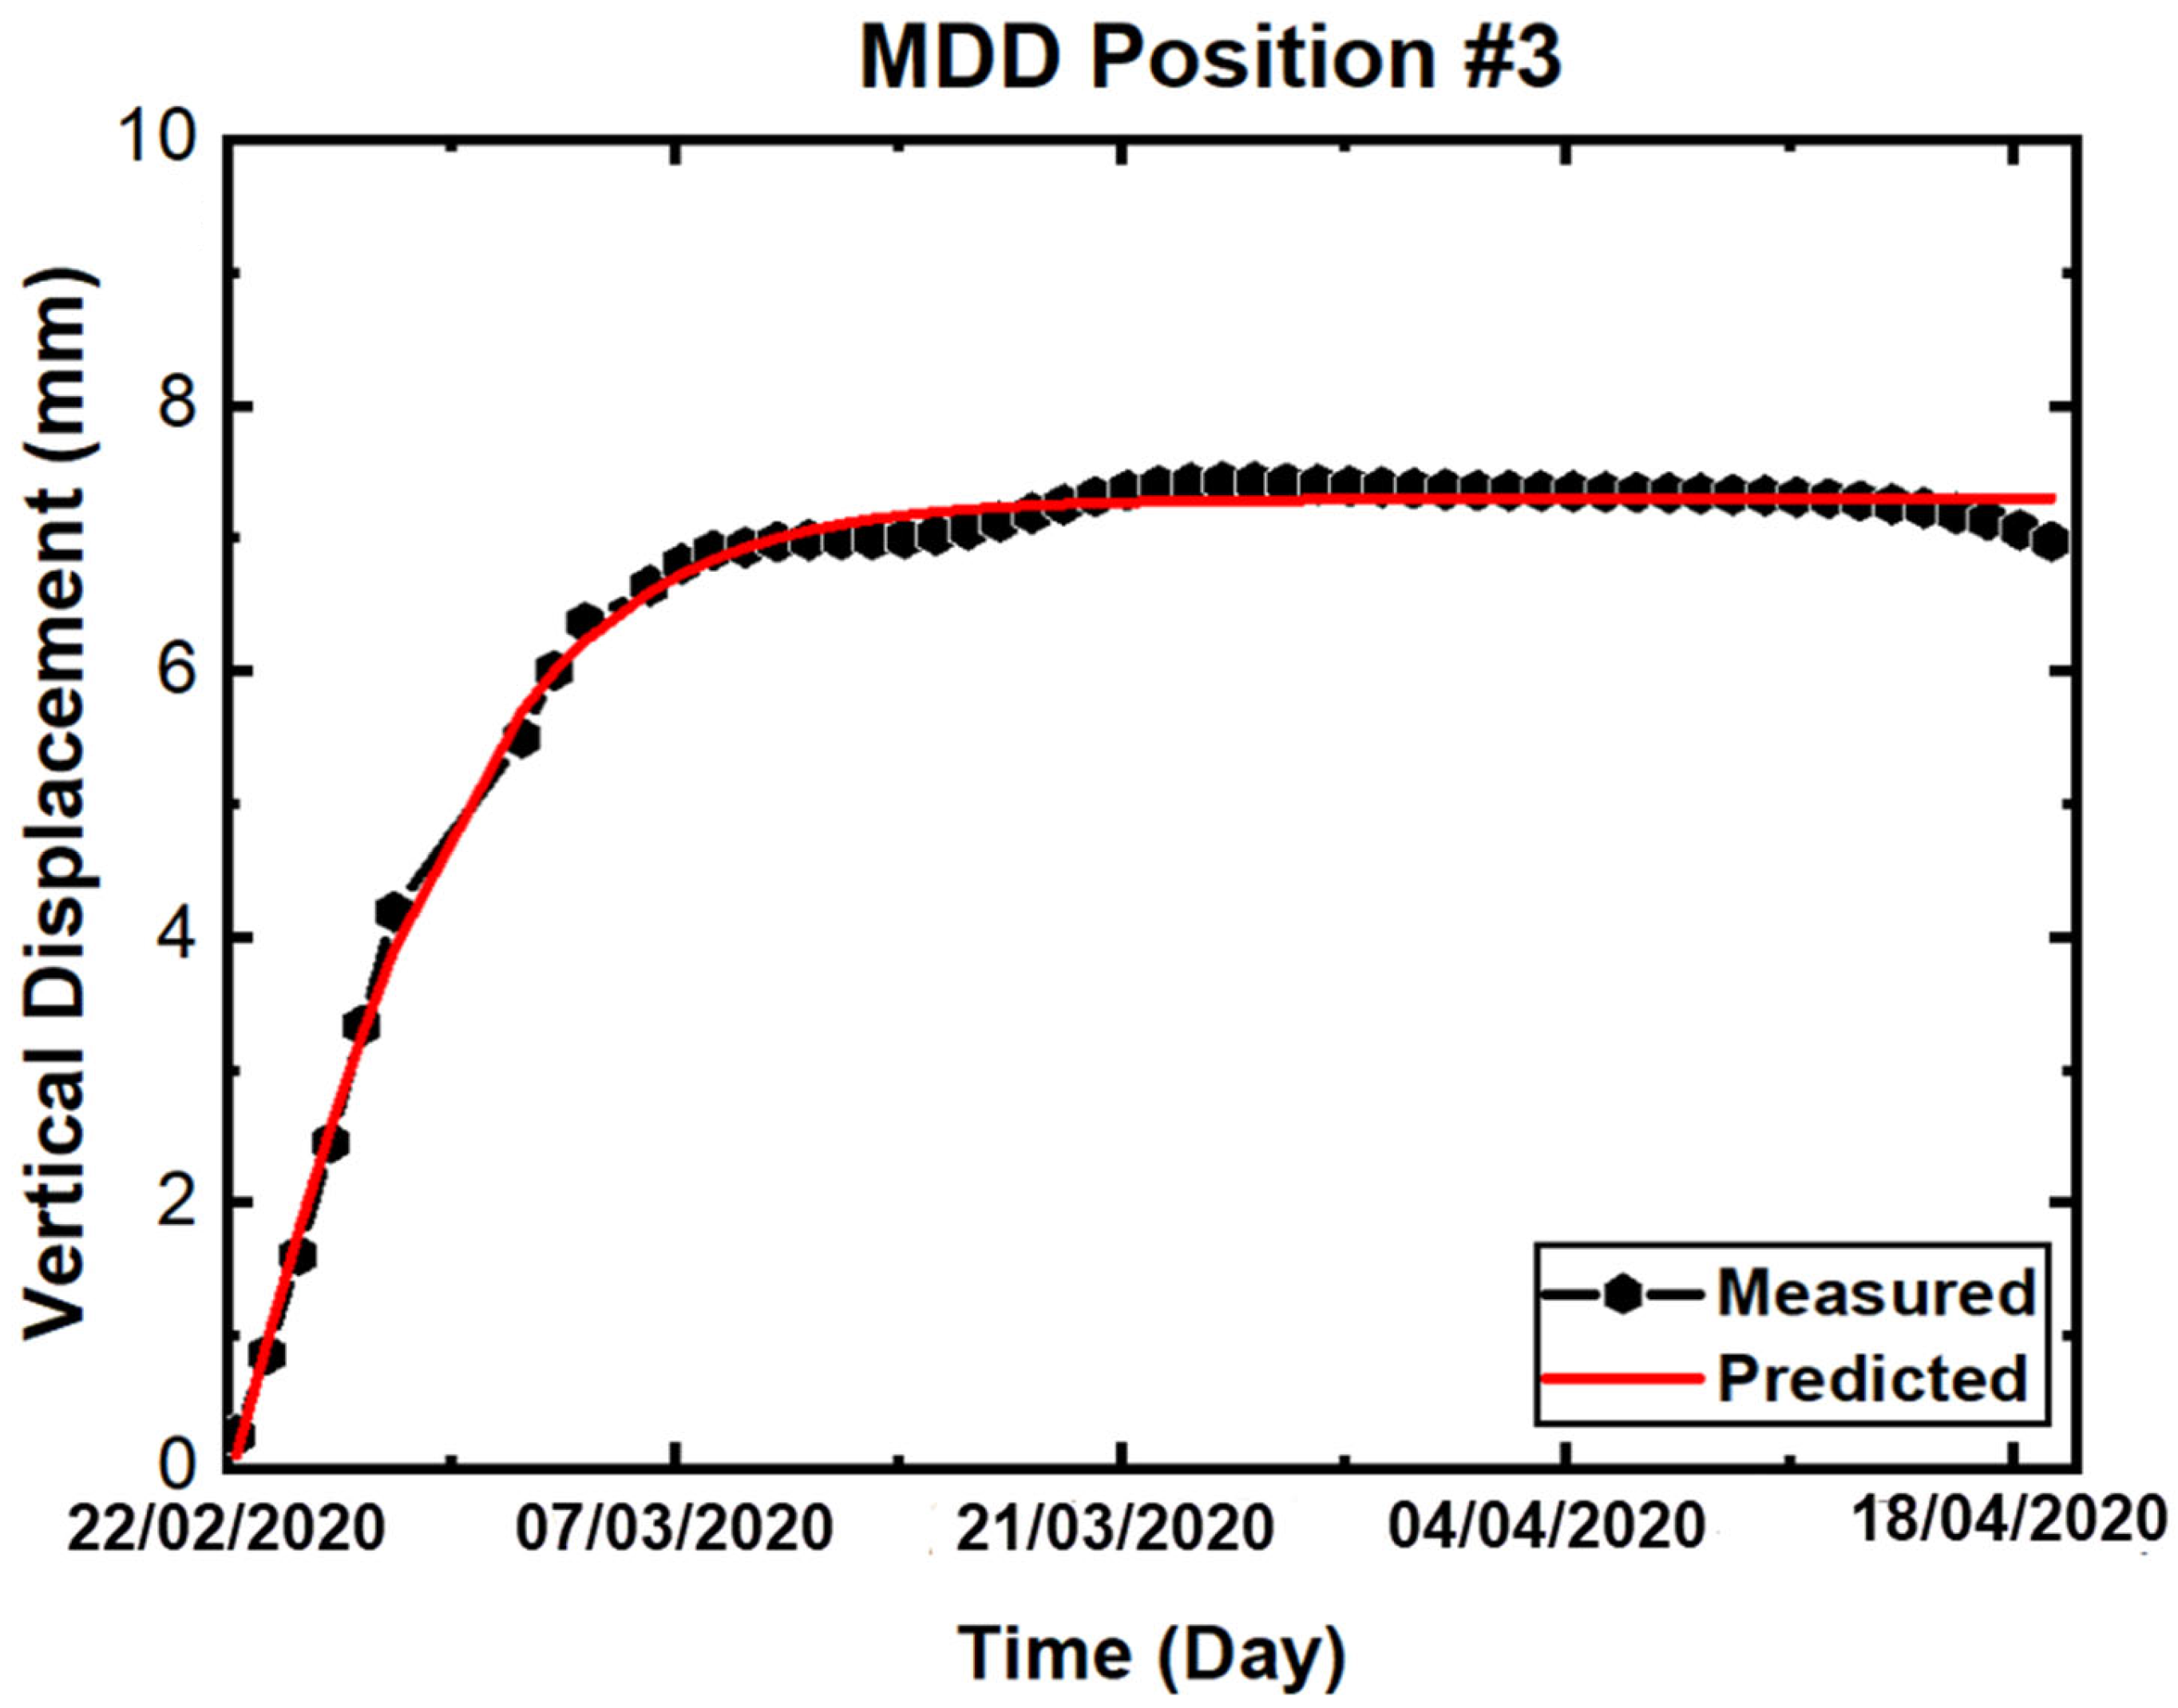
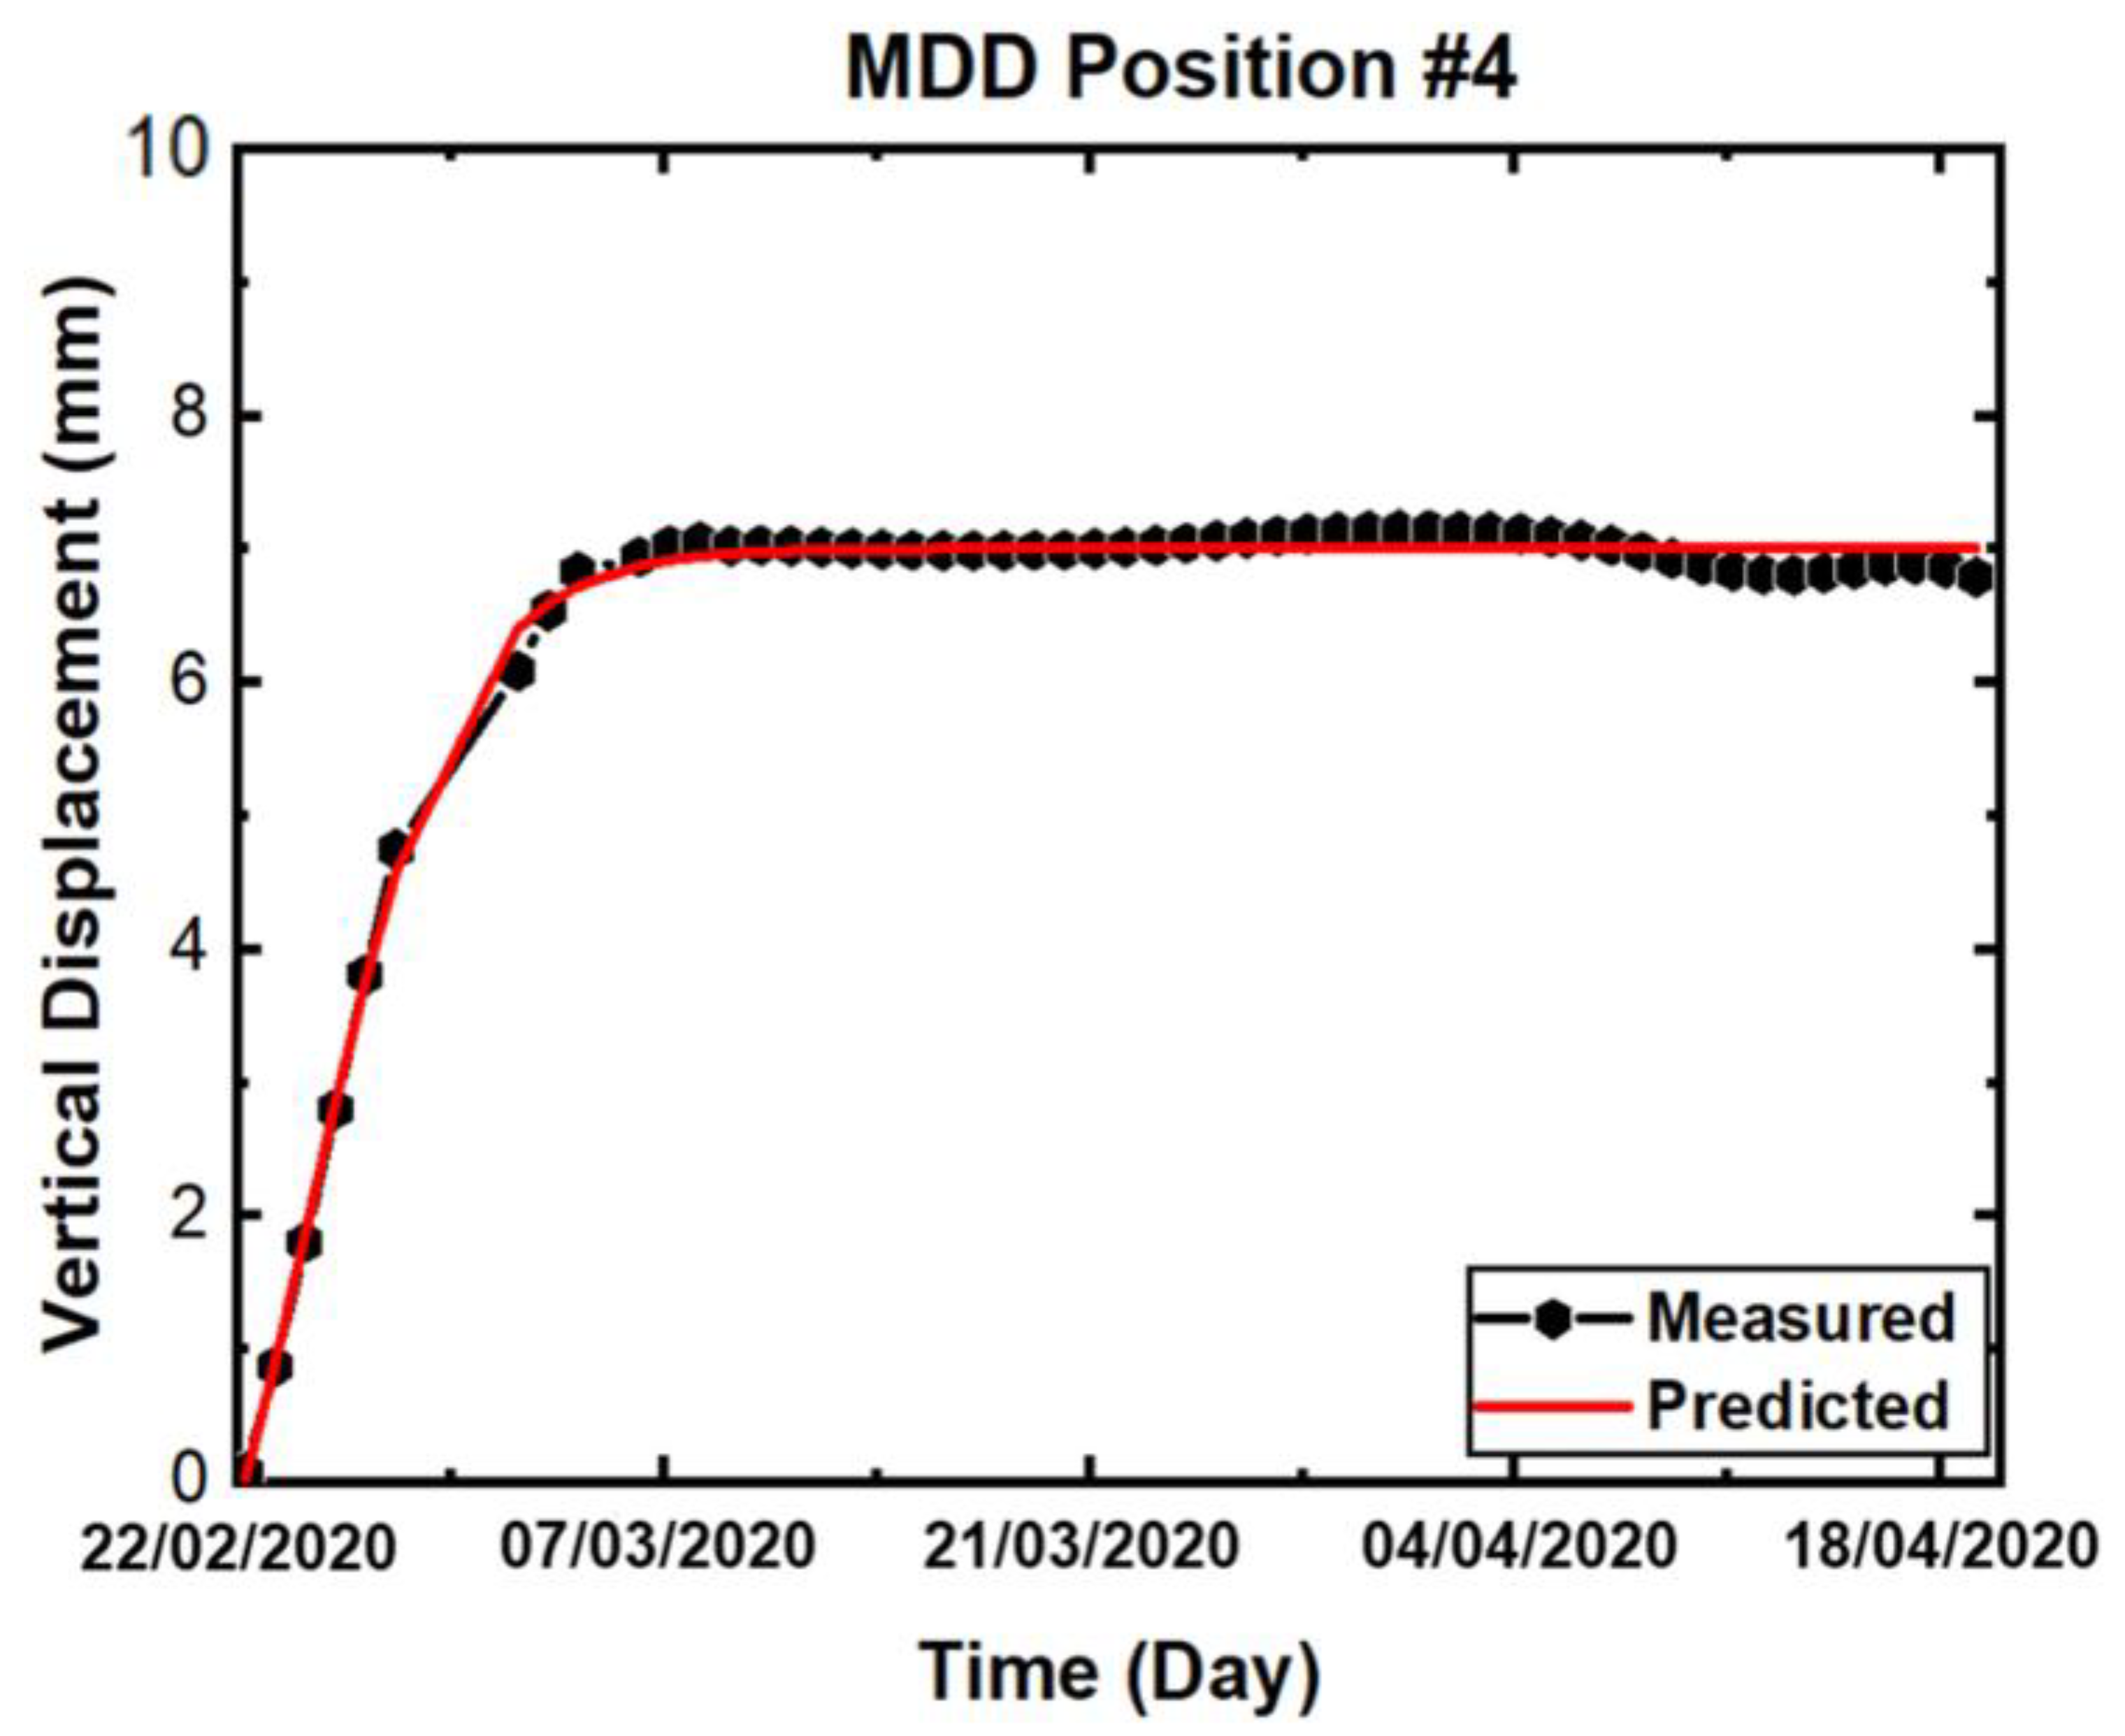
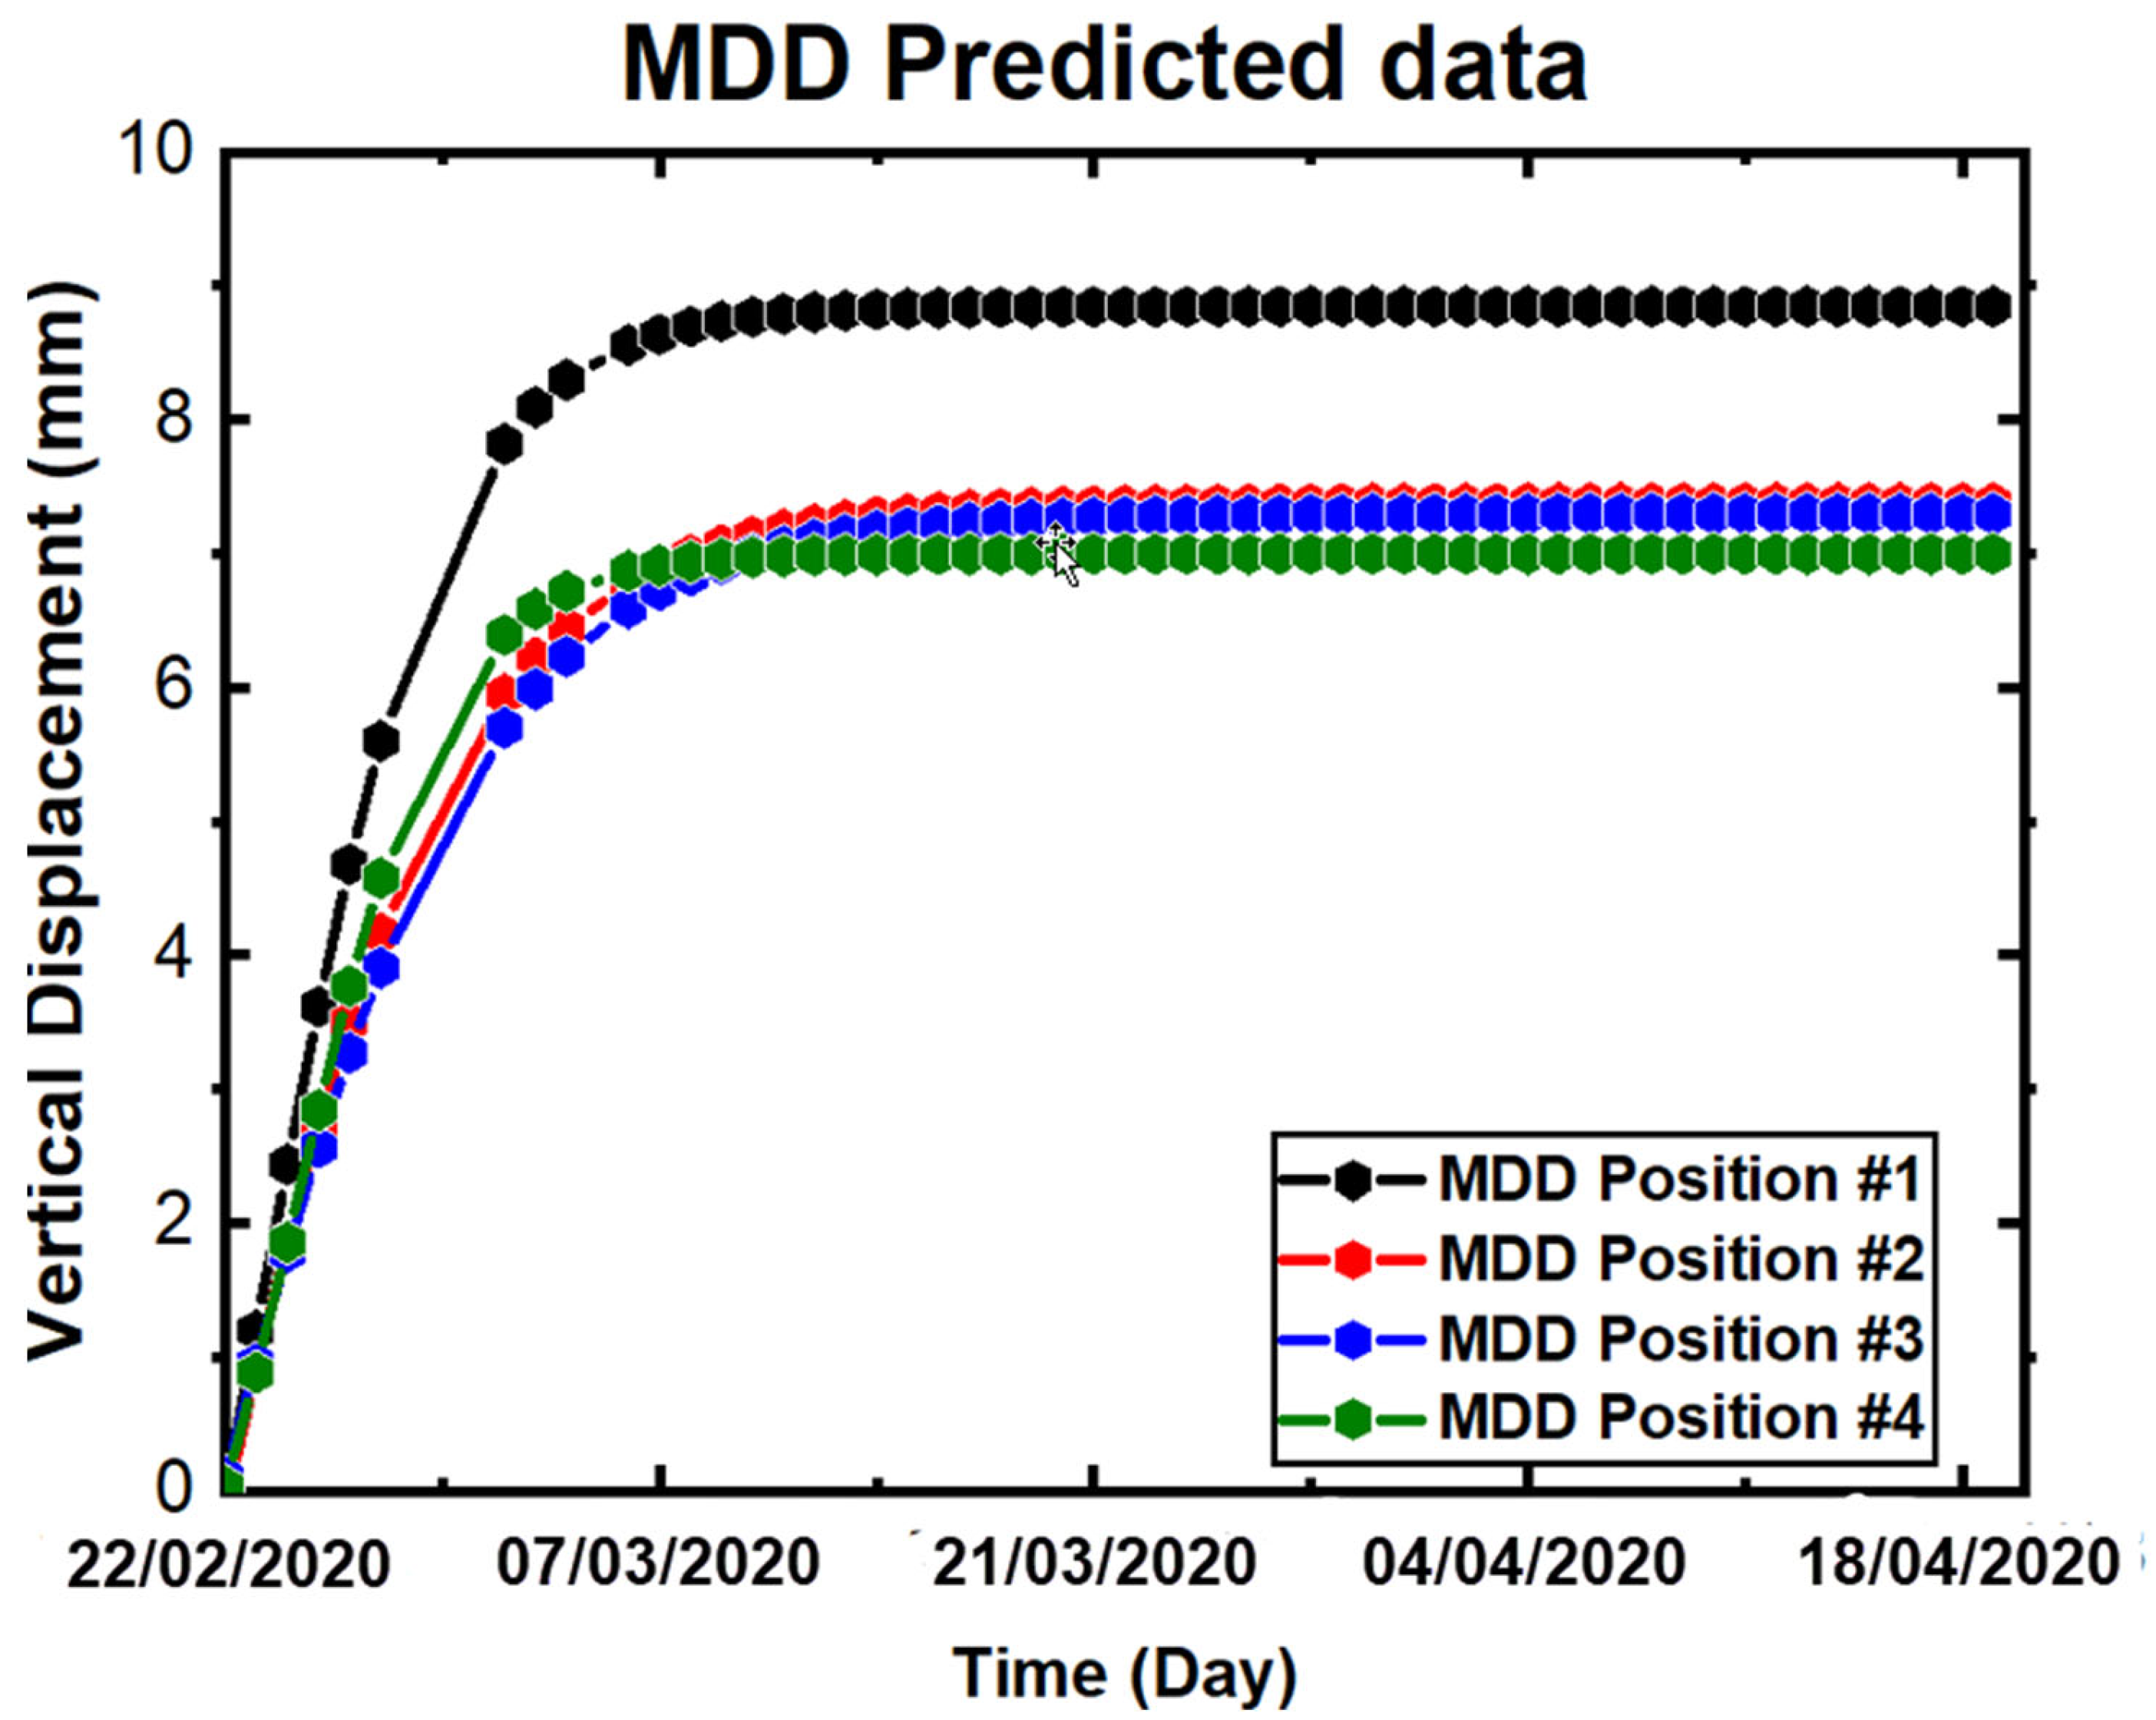
4.4. The MDD/GNSS Settlement Prediction Model

Statistical Analysis for Calculation of Model Coefficients

To develop the settlement prediction model for MDD laser sensor measurements, the settlement of the MDD data obtained for each MDD position was analyzed by OriginPro® 2018, which is a program used for data analysis developed by OriginLab. It provides a range of features for analyzing and presenting data, including curve fitting, etc. [24]. In this study, we utilized a curve fitting method to construct the most effective model for predicting settlement graphs measured by MDD with the GNSS. The exponential model, a non-linear statistical function represented by Equation (8), was chosen for this purpose due to its suitability for analyzing MDD/GNSS data. OriginPro® 2018 software was utilized to perform the curve fitting and regression analysis, as its efficacy for this purpose has been extensively documented in the literature by Moberly [24].
y = y 0 + A e R 0 x ,
where y is the predicted vertical settlement, y0 = offset, A = initial value, R0 = rate, x = MDD measuring time and y0, A, and R0 are the model coefficients that were obtained by curve fitting analysis.
The analysis was performed first to determine the coefficients of the exponential model for variables y0, A, and R0. The results of the analysis are presented in Table 2. The goodness of fit of the model was assessed using the R2 value, which measures the degree of correlation between comparison and predicted values. The R2 value was found to be close to one, indicating a strong relationship between comparison and predicted values. This suggests that the exponential model fits the data well and has a high level of confidence.
Thus, through nonlinear statistical function analysis, the following model equations were derived for the prediction of MDD total settlement for each position.
For MDD position #1:
y = 8.895 10.12 e 0.00897 x
For MDD position #2:
y = 7.42 8.38 e 0.0075 x
For MDD position #3:
y = 7.34 8.162 e 0.007 x
For MDD position #4:
y = 7.04 8.27 e 0.00945 x
Furthermore, we assessed the applicability of the prediction model for MDD positions by comparing the total settlement results obtained from calibrated MDD data measurements to those predicted by the model. This comparison was carried out by plotting the results on a graph, as shown in Figure 20, Figure 21, Figure 22 and Figure 23. The results revealed that the pattern of vertical displacement was highly consistent between MDD total settlement and the predicted results calculated using Equations (9)–(12). This indicates that the prediction model accurately predicted the total settlement behavior at MDD positions.
As described in the previous chapter, it was carefully predicted that there could be a reduced size of the void space remaining below the track slab even after restoration. This prediction was due to the difference in observed total settlement between Position 1 and other positions in the MDD. A 2.0 mm difference in total settlement was assured again by the prediction as shown Figure 24. This settlement difference provides insight into calculation of the void size (L) using the flexural stiffness (EI) of the slab and the equivalent design wheel load of the train (w) using Equation (13). A simple assumption applied for this calculation is that the slab is simply supported and uniformly loaded across its void space length L. In addition, the slab with the void space acts like a two-way slab that is supported on all four sides (Figure 25). Thus, by adapting this assumption, Equation (13) can be used to obtain the maximum deflection (2.0 mm) at the center of the slab.
δ v = 5 w L 5 384 E I .
For simply assumed parametric values of the flexural stiffness (EI) of the slab, the equivalent design wheel load of the rail car (w = 110 kN/m) and the generated deflection (2.0 mm) at the center of the slab due to a void space at the bottom, the void space length (L) of the space was computed as explained in Table 3. We assumed that the initial elastic modulus of 32 GPa of the slab was reduced up to 50% as shown in Table 3 by considering the observed cracks on the surface of the track slab. Then, the void space length (L) was calculated to investigate the influence of reduced flexural stiffness, EI, of the slab. As can be seen in Table 3, the void space length (L) was not sensitively reduced in proportion when the elastic modulus of the slab (E) was reduced drastically to 50% of the initial value. This means, conversely, that even though we observed many cracks on the slab that are evidence indicating reduced flexural stiffness at an amount of the surface settlement on the track slab, the slab may contact the outer rim of the track foundation soil surface due to reduced void space. Reversely, at the small amount of the measured settlement of the track slab with high flexural stiffness that is not broken thoroughly yet, it does not tell us whether it fully contacts the bottom soil; otherwise, it has a relatively wide void space at the bottom. This leads to a meaningful implication that rail authorities need to manage the track slab based not only on the measurement of the settlement of the track slab but also on the number of observed cracks and patterns on it. In addition, the lack of bearing capacity due to the existing small void space can be compensated with the flexural stiffness of the slab and is equivalent to the deflection of a 2.0 mm difference between Position 1 and other positions in the MDD (Figure 25). This means that previous repair work was not sufficient, and that new repair needs to be performed in the future even though there was no severe measured settlement using the MDD/GNSS system by the time of 18 April 2020, the end of this study’s observation.

5. Conclusions

The objective of this study was to introduce and evaluate a new technical method for measuring and monitoring track foundation settlement of the concrete slab track on the transition zone between a tunnel and its embankment, which is composed of a Multi-Depth Deflectometer (MDD) combined with a Global Navigation Satellite System (GNSS). The MDD was newly designed with the addition of laser sensor modules for increasing precision and the MDD head was fixed at the top of the track slab. The MDD/GNSS system measures the relative deflection between each track layer as well as the total deflection at the top of the track slab, which may evade the fixed condition problem of the classical MDD. The new MDD/GNSS system was installed at the transition zone between a tunnel entrance and its embankment, which experienced high settlement levels prior to repair. The system was built to monitor whether the repaired concrete track foundation with pressurized cement grouting was stabilized effectively and what track layer position was the most unstable so that it had the most influence. The GNSS system was designed and built for computing the net settlement at each track layer even when the MDD could not be fixed firmly at the end point, which is a major drawback of the classical MDD. The results obtained from the MDD and GNSS measurements indicated significant potential in aiding railway track settlement measurements.
The main advantages of the new MDD/GNSS system and observation results are summarized as follows:
  • The monitoring results verified that the combination of MDD with GNSS enhances the capacity to assess effective measurement of the track foundation, providing a more comprehensive perspective on the track monitored system.
  • Since the MDD head is fixed at the rover position on the track slab, the MDD/GNSS system can measure the relative deflection between each track layer and the slab surface as well as the total deflection at the top of the track slab by a GNSS rover receiver simultaneously, which can evade the fixity condition problem of the classic MDD.
  • An effective data collection and data transferring system for MDD/GNSS was designed; it works systematically. A real-time monitoring program runs effectively for data storing and for subsequent analysis and processing. By combining the absolute GNSS rover settlement and MDD settlement, an accurate estimation of the total settlement in the concrete slab track layers can be obtained.
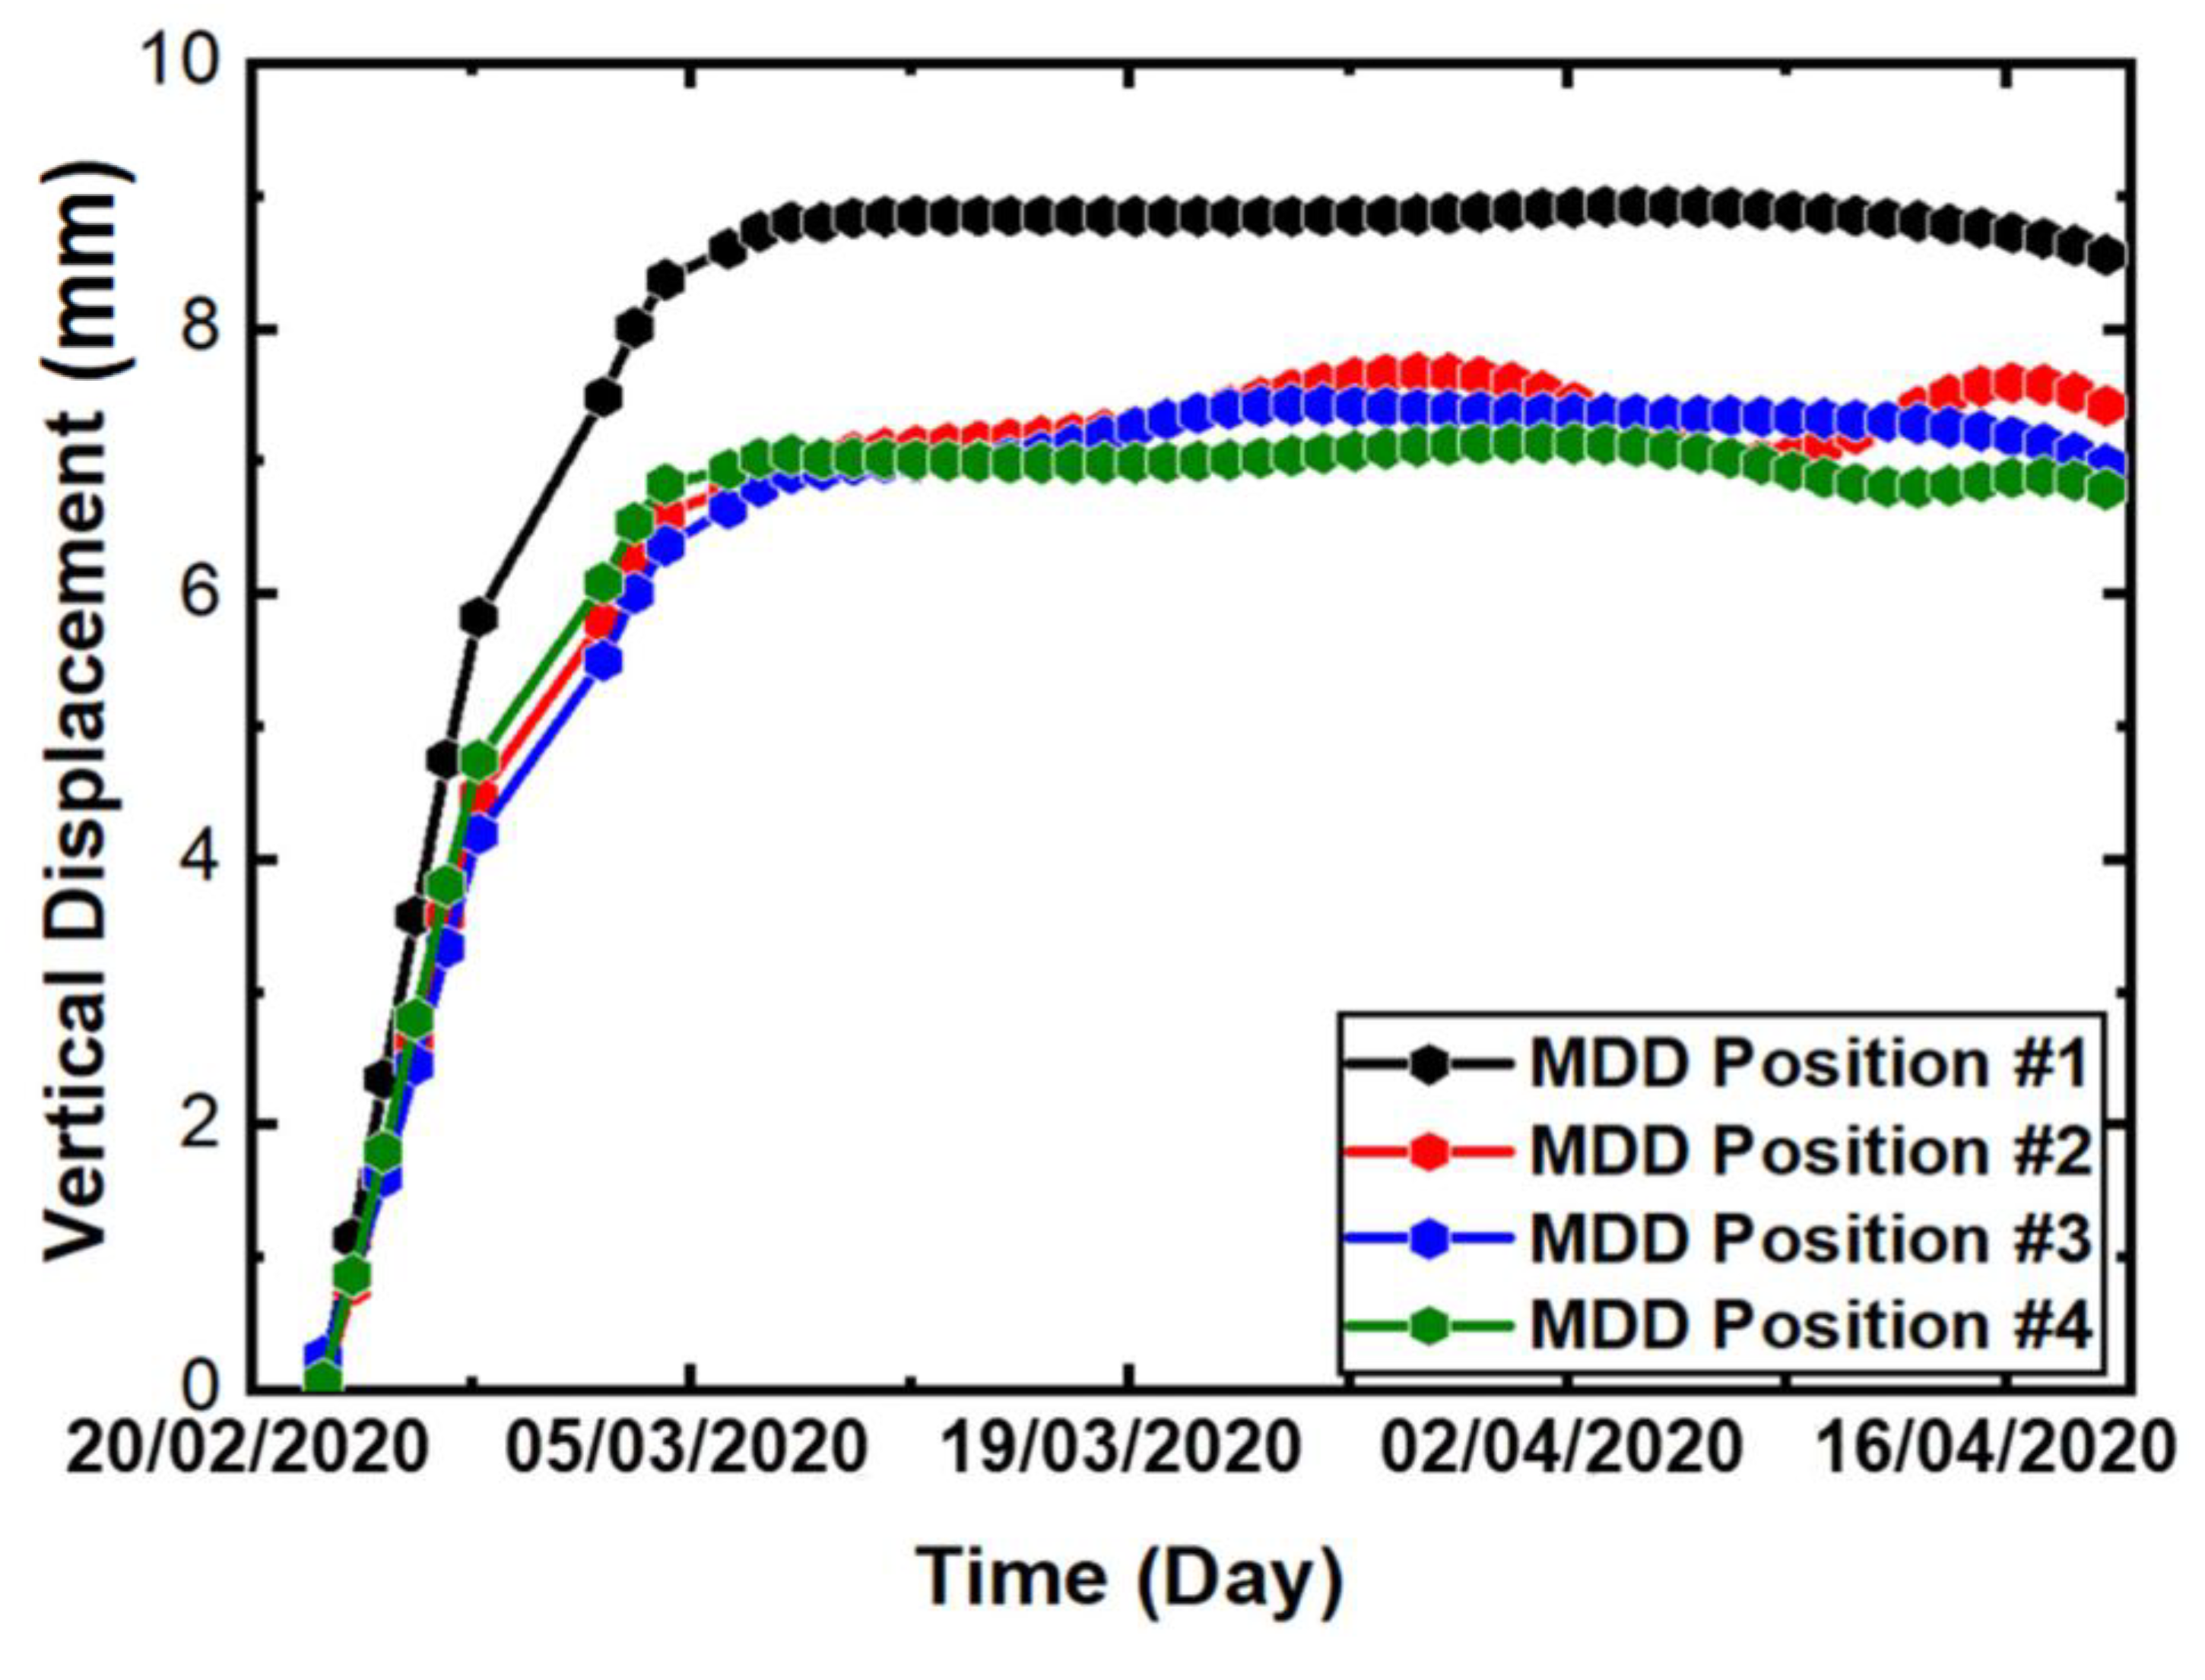
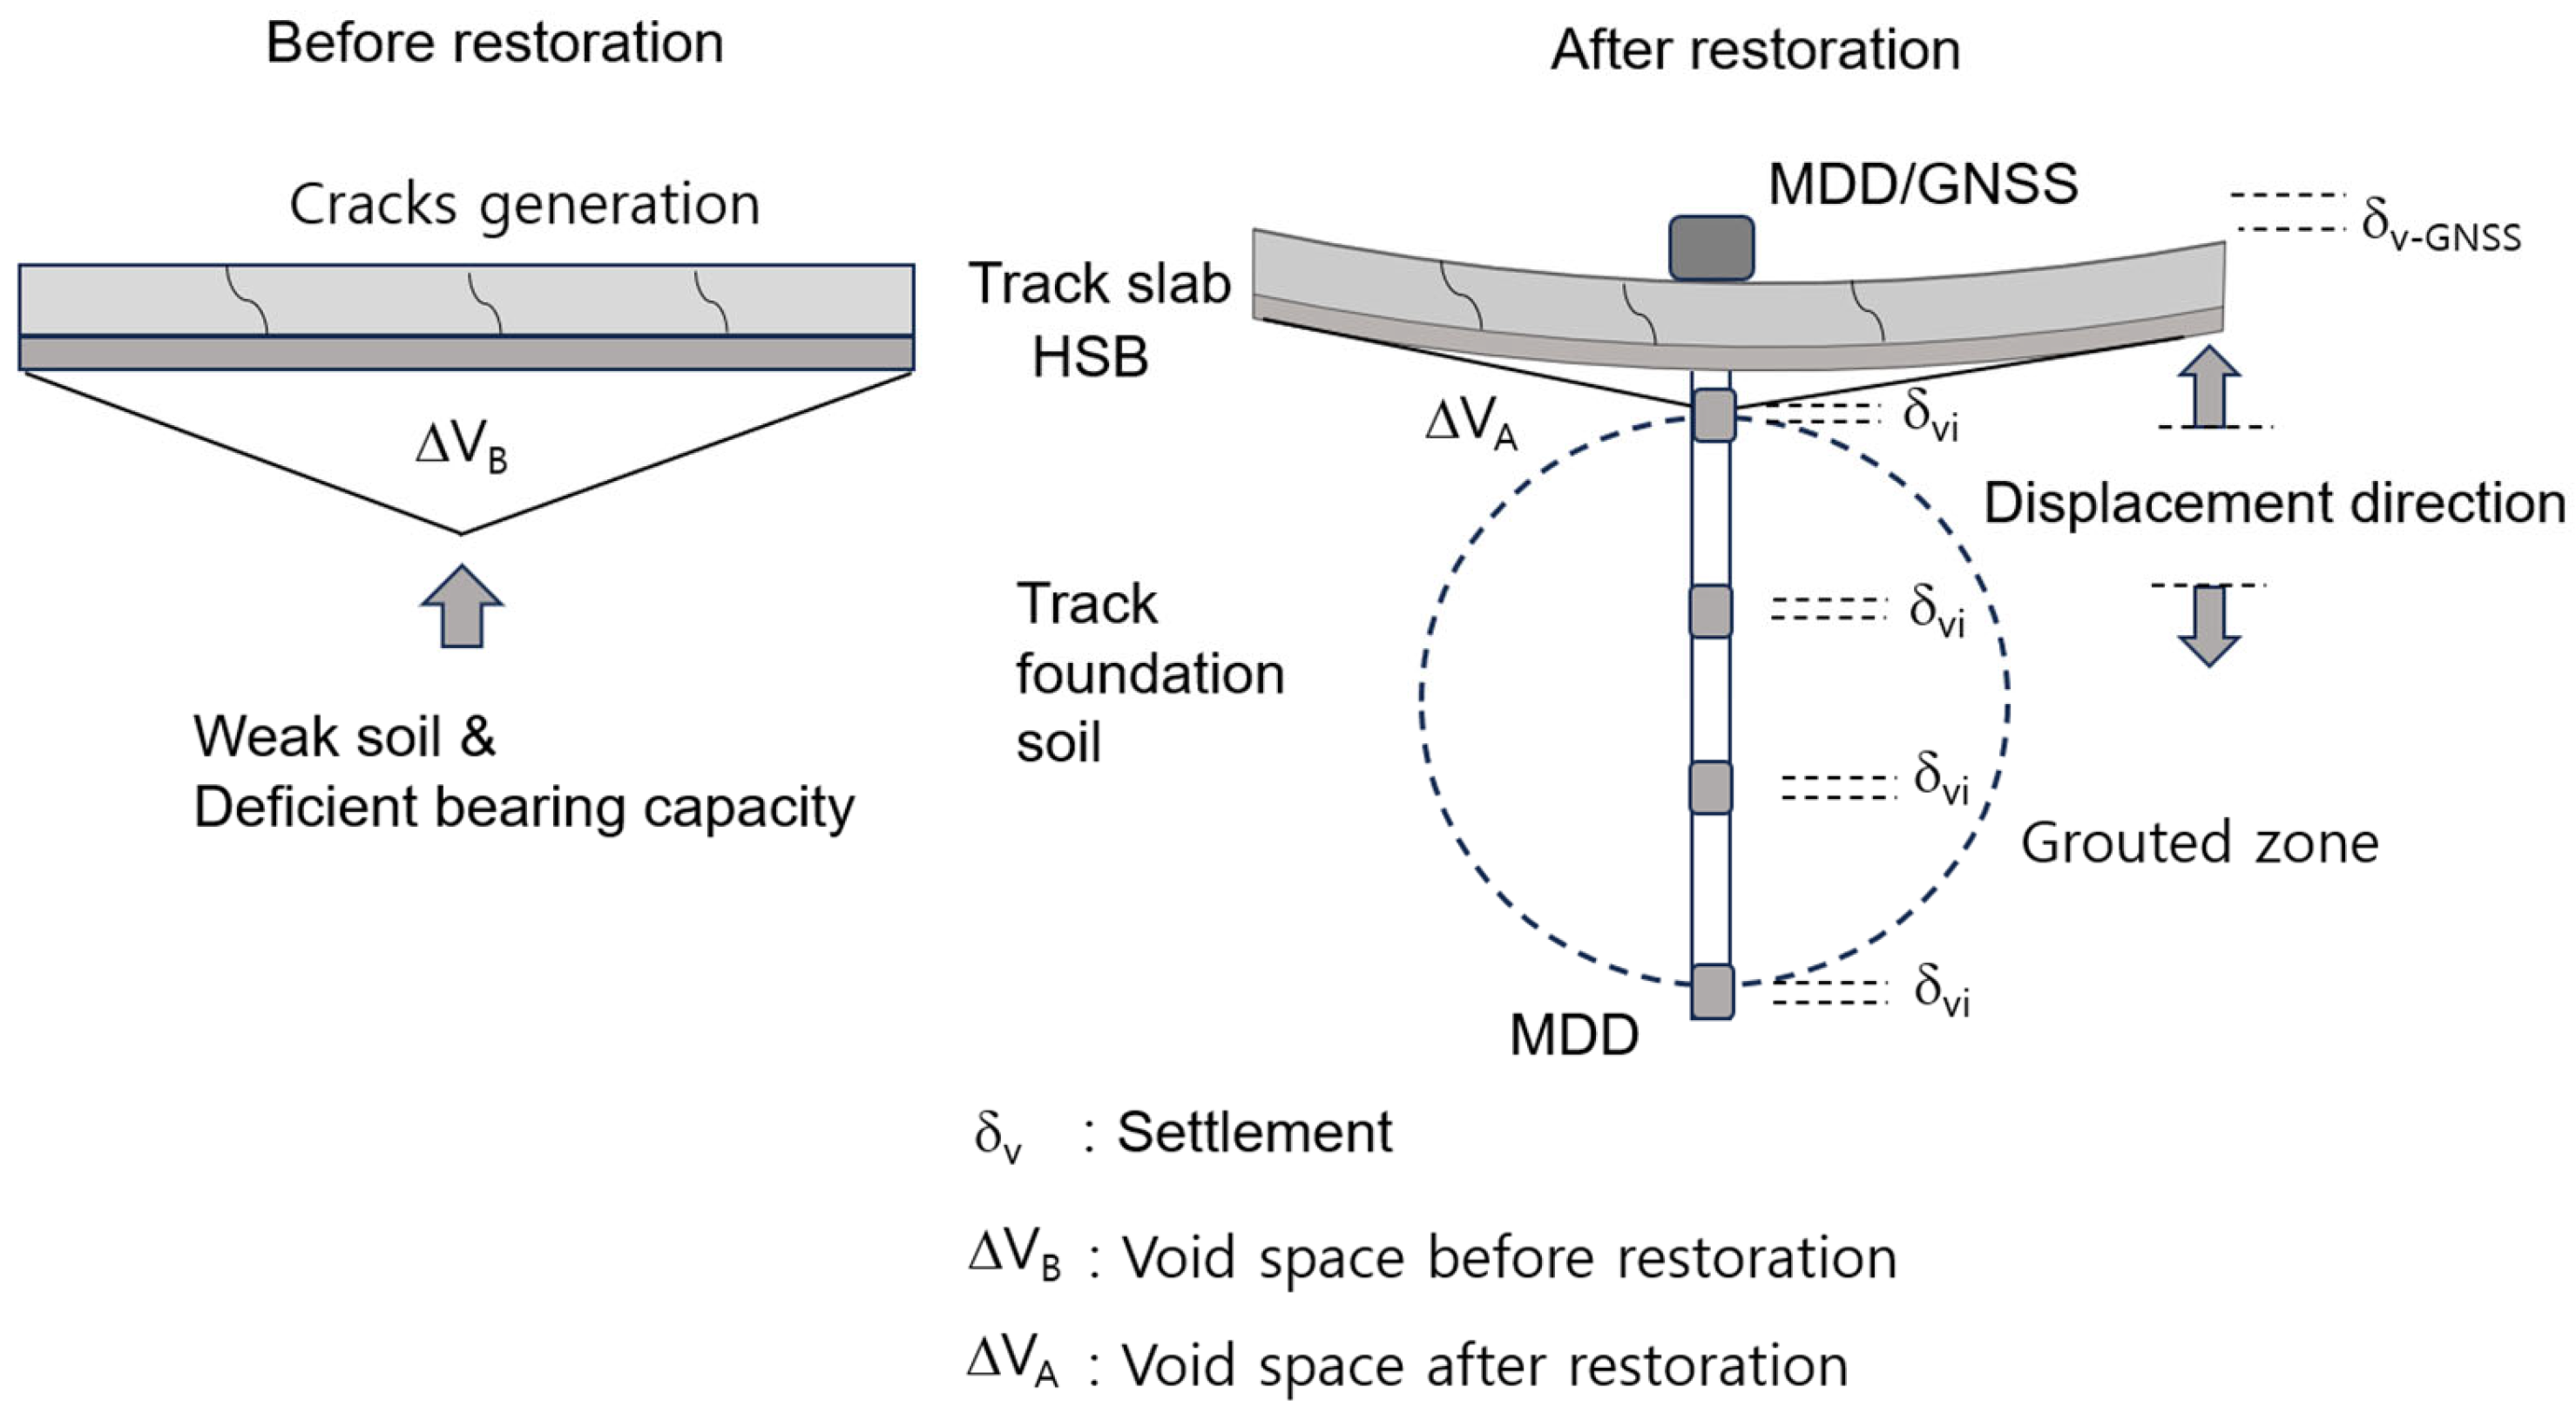
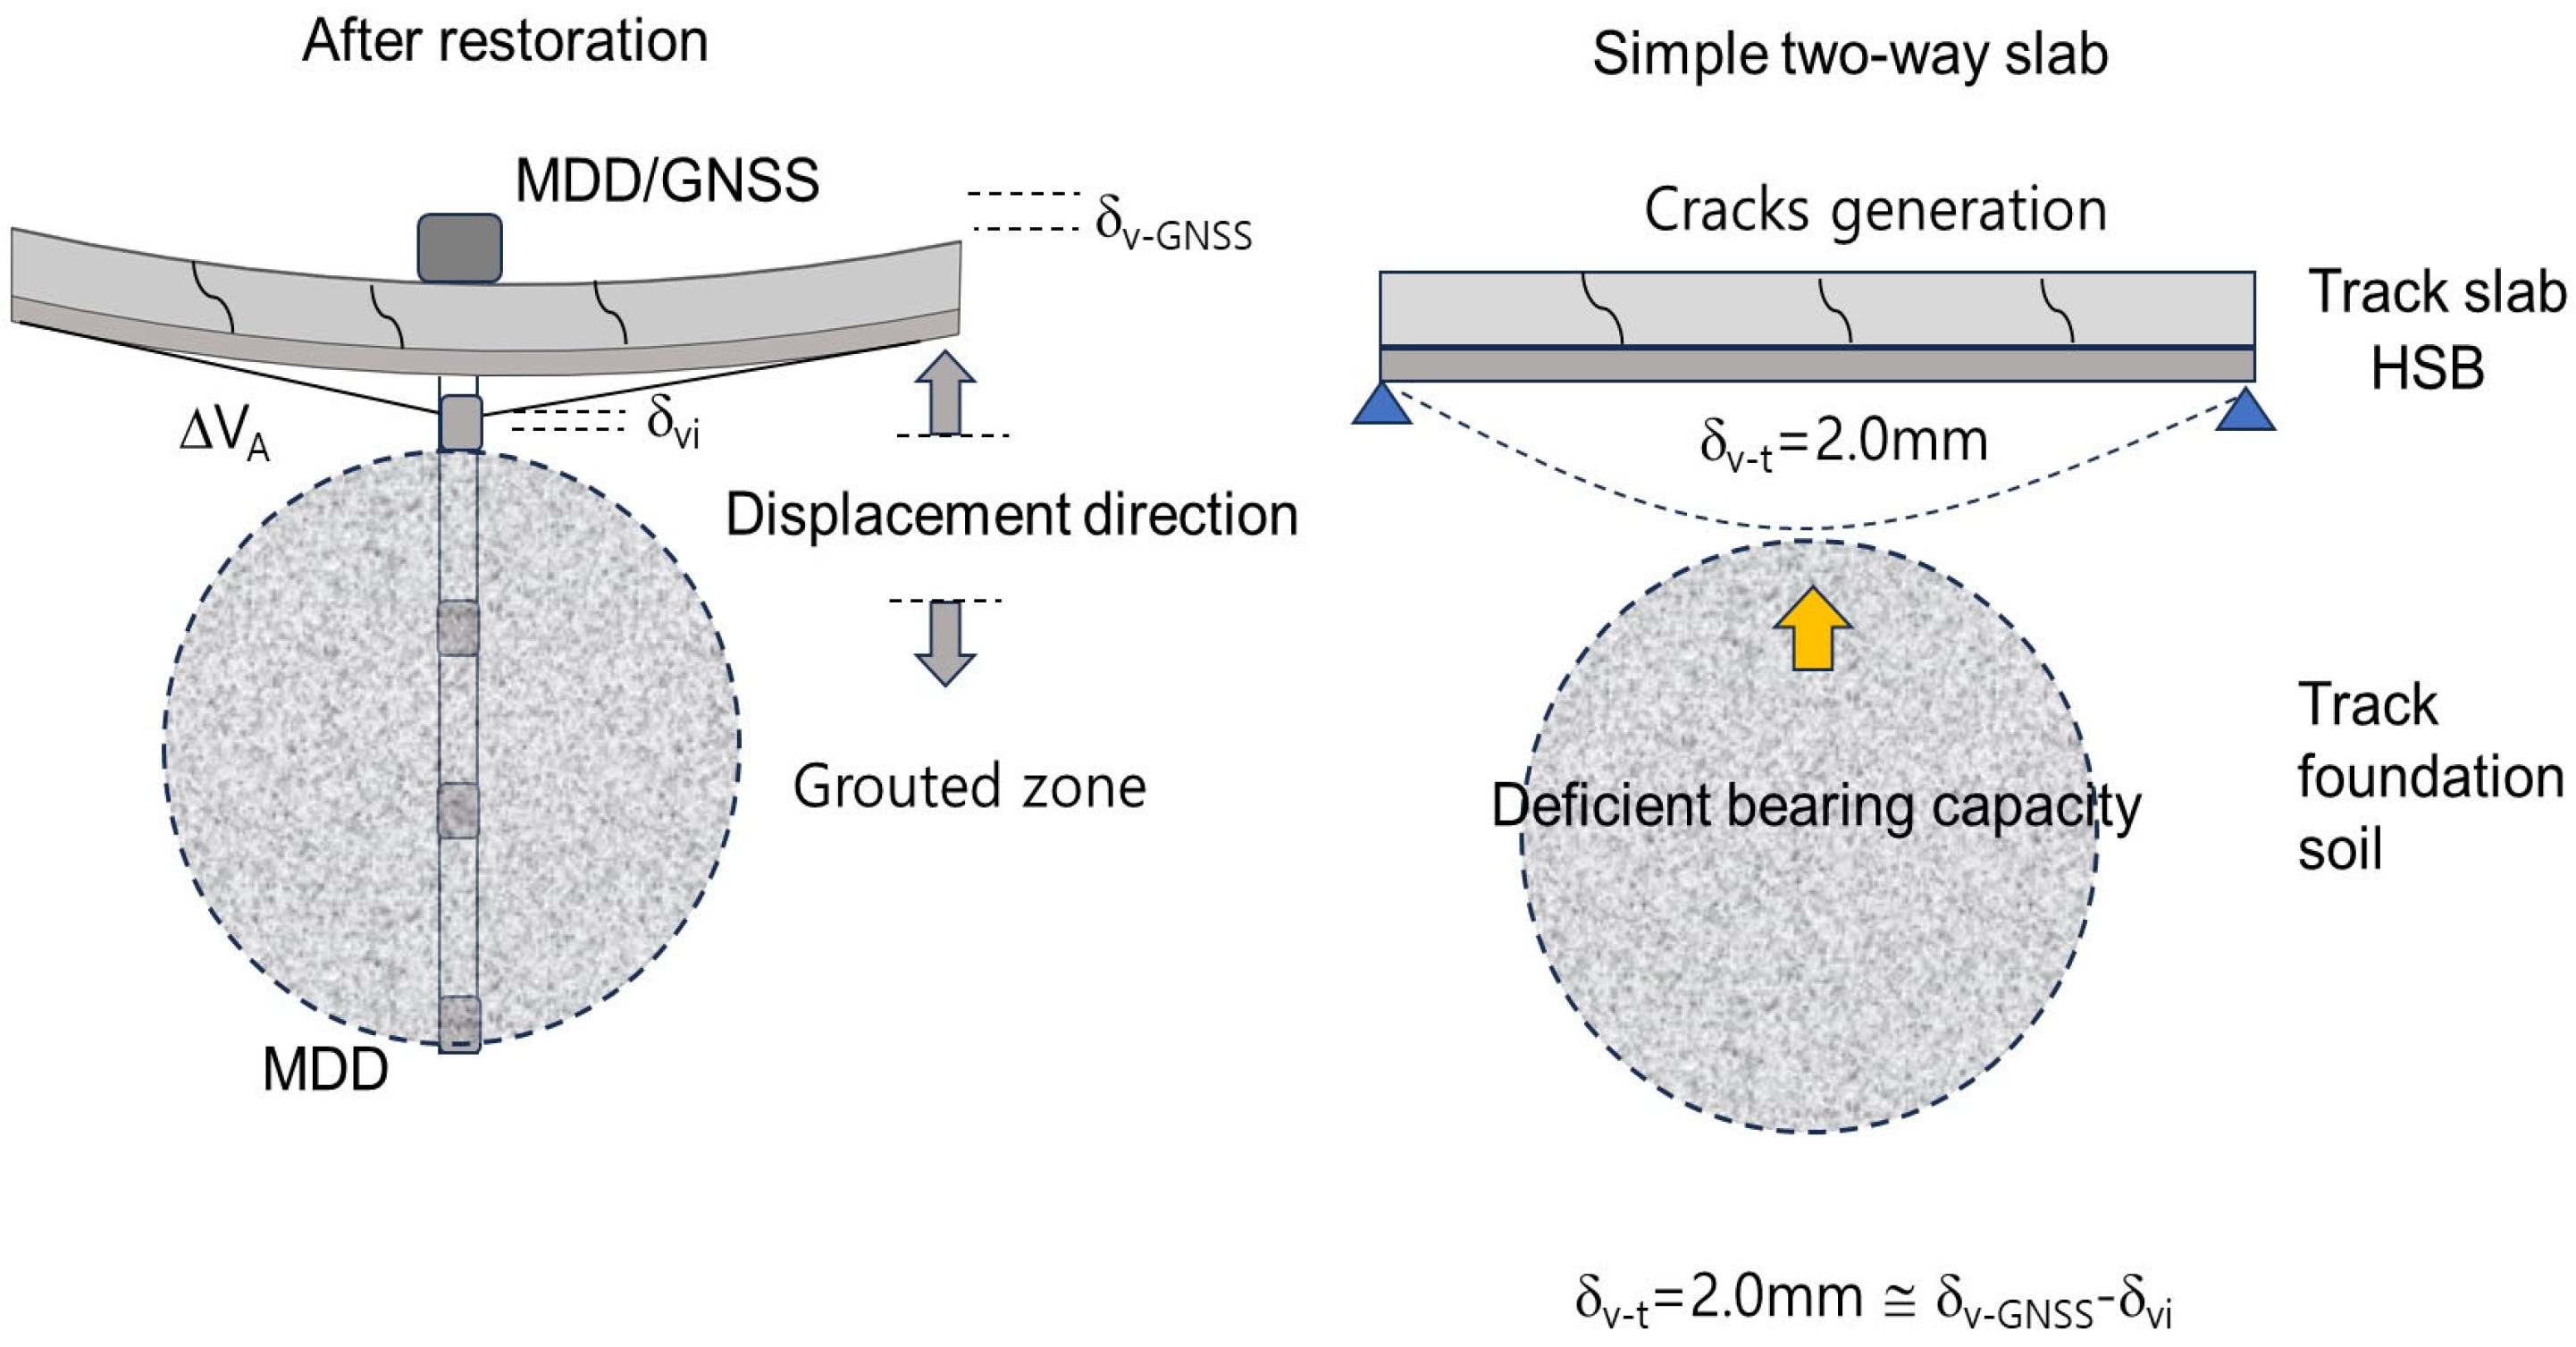
  • Deformation values measured at each MDD position, which are calibrated with GNSS measurement at the top of the track slab, providing meaningful details for analyzing repair performance of track foundation soil under track slabs. This study revealed that there may be a reduced size of the void space remaining below the track slab even after restoration at the site. For example, the 2.0 mm difference in total settlement between Position 1 and other positions (2, 3, 4) in the MDD/GNSS system was due to one main reason: The bearing capacity in the track foundation soil near the slab was still not sufficient to resist the slab weight and the train load fully after restoration. This lack of bearing capacity came from the existing small void space below the slab even though its size was reduced somewhat by grouting restoration.
  • Analyzing the maximum deflection difference (2.0 mm) at the center of the slab verified that the lack of bearing capacity due to the reduced-size small void space can be compensated for with the flexural stiffness of the slab. The maximum deflection difference measured between the MDD positions using the MDD/GNSS system can be used as evidence for checking performance of previous repair work for track foundation soil.

Author Contributions

Conceptualization, P.A.B.; Data curation P.A.B. and V.D.L. Methodology P.A.B.; Software V.D.L.; Visualization V.D.L.; writing—original draft preparation, P.A.B.; writing—review and editing, Y.L.; Supervision, Y.L. All authors have read and agreed to the published version of the manuscript.

Funding

This research was funded by Korea Railway Corporation: RTRP-B137848-04, a Korea Agency for Infrastructure Technology Advancement (KAIA) grant.

Institutional Review Board Statement

Not applicable.

Informed Consent Statement

Not applicable.

Data Availability Statement

The data used to support the findings of this work are available from the Pai Chai University upon request. The data are not publicly available due to privacy.

Conflicts of Interest

The funders had no role in the design of the study; in the collection, analyses, or interpretation of data; in the writing of the manuscript; or in the decision to publish the results.

References

  1. Matias, S.R.; Ferreira, P.A. Railway slab track systems: Review and research potentials. Struct. Infrastruct. Eng. 2020, 16, 1635–1653. [Google Scholar] [CrossRef]
  2. Ren, J.; Deng, S.; Zhang, K.; Du, W.; Wu, Q. Design theories and maintenance technologies of slab tracks for high-speed railways in China: A review. Transp. Saf. Environ. 2021, 3, tdab024. [Google Scholar] [CrossRef]
  3. Park, J.B.; Lim, Y. Development of a settlement prediction model for upper subgrade layers of ballasted tracks. Proc. Inst. Mech. Eng. Part F J. Rail Rapid Transit. 2021, 235, 801–814. [Google Scholar] [CrossRef]
  4. Lai, C.C.; Au, H.Y.; Liu, M.S.Y.; Ho, S.L.; Tam, H.Y. Development of level sensors based on fiber bragg grating for railway track differential settlement measurement. IEEE Sens. J. 2016, 16, 6346–6350. [Google Scholar] [CrossRef]
  5. Nasrollahi, K.; Dijkstra, J.; Nielsen, C.O.J. Towards real-time condition monitoring of a transition zone in a railway structure using Fibre Bragg Grating sensors. Transp. Geotech. 2023, 44, 101166. [Google Scholar] [CrossRef]
  6. Sasy Chan, Y.W.; Wang, H.-P.; Xiang, P. Optical fiber sensors for monitoring railway infrastructures: A review towards smart concept. Symmetry 2021, 13, 2251. [Google Scholar] [CrossRef]
  7. Wang, H.; Xiang, P.; Jiang, L. Strain transfer theory of industrialized optical fiber-based sensors in civil engineering: A review on measurement accuracy, design and calibration. Sens. Actuators A Phys. 2019, 285, 414–426. [Google Scholar] [CrossRef]
  8. De Beer, M.; Horak, E.; Visser, A.T. The Multidepth deflectometer (MDD) system for determining the Effective elastic moduli of pavement layers. In Nondestructive Testing of Pavements and Backcalculation of Moduli; Albert, J., Bush, A.J., III, Gilbert, Y., Baladi, G.Y., Eds.; STP1026-EB; ASTM: West Conshohocken, PA, USA, 1989; pp. 70–89. [Google Scholar] [CrossRef]
  9. Scullion, T.; Briggs, R.C.; Lytton, R.L. Using the Multidepth Deflectometer to Verify Modulus Backcalculation Procedures. In Nondestructive Testing of Pavements and Backcalculation of Moduli; Albert, J., Bush, A.J., III, Gilbert, Y., Baladi, G.Y., Eds.; STP1026-EB; ASTM International: West Conshohocken, PA, USA, 1989; pp. 90–101. [Google Scholar] [CrossRef]
  10. Xue, W.; Flintsch, G.W.; Diefenderfer, B.K. Measuring pavement permanent deformation in accelerated pavement testing. Transp. Res. Rec. 2020, 2674, 340–348. [Google Scholar] [CrossRef]
  11. Cary, C.E.; Wang, Z.; Yin, H.; Garg, N.; Rutter, R. Effect of pavement structure on the mechanical response and performance of perpetual pavements at the national airport pavement test facility. Transp. Res. Rec. 2018, 2672, 31–39. [Google Scholar] [CrossRef]
  12. Suh, Y.C.; Park, D.W.; Jo, N.H.; Kwon, S.A. Prediction of permanent deformation in full-scale accelerated pavement testing. KSCE J. Civ. Eng. 2012, 16, 579–585. [Google Scholar] [CrossRef]
  13. Roesler, J.R.; Scheffy, C.W.; Ali, A.; Bush, D. Construction, Instrumentation, and Testing of Fast-Setting Hydraulic Cement Concrete in Palmdale, California; University of California: Berkeley, CA, USA, 2000. [Google Scholar]
  14. Mishra, D.; Tutumluer, E.; Boler, H.; Hyslip, J.P.; Sussmann, T.R. Railroad Track Transitions with Multidepth Deflectometers and Strain Gauges. Transp. Res. Rec. 2014, 2448, 105–114. [Google Scholar] [CrossRef]
  15. Johnston, G.; Anna, R.; Grant, H. The international GNSS service. In Springer Handbook of Global Navigation Satellite Systems; Springer: Berlin/Heidelberg, Germany, 2017; pp. 967–982. [Google Scholar]
  16. Abulude, F.; Akinnusotu, A.; Adeyemi, A. Global Positioning System and It’s Wide Applications. Cont. J. Inf. Technol. 2015, 9, 22–32. [Google Scholar]
  17. Dai, W.; Huang, D.; Cai, C. Multipath mitigation via component analysis methods for GPS dynamic deformation monitoring. GPS Solut. 2014, 18, 417–428. [Google Scholar] [CrossRef]
  18. Shimizu, N.; Nakashima, S.; Masunari, T. ISRM suggested method for monitoring rock displacements using the global positioning system (GPS). Rock Mech. Rock Eng. 2014, 47, 313–328. [Google Scholar] [CrossRef]
  19. Ma, F.; Xi, R.; Xu, N. Analysis of railway subgrade frost heave deformation based on GPS. Geod Geodyn. 2016, 7, 143–147. [Google Scholar] [CrossRef]
  20. Ngamkhanong, C.; Kaewunruen, S.; Costa, B.J.A. State-of-the-art review of railway track resilience monitoring. Infrastructures 2018, 3, 3. [Google Scholar] [CrossRef]
  21. Leiva, F.; Pérez, E.; Aguiar, J.; Loría, L. Permanent deformation model for pavement condition assessment Modelo de deformación permanente para la evaluación de la condición del pavimento. Rev. Ing. Construcción 2017, 32, 37–46. [Google Scholar] [CrossRef]
  22. Kim, N. Evaluation of rutting performance of asphalt concrete layers using multi-depth deflectometers (MDD). KSCE J. Civ Eng 2004, 8, 411–416. [Google Scholar] [CrossRef]
  23. Rojo, J.; Rivero, R.; Romero-Morte, J.; Fernández-González, F.; Pérez-Badia, R. Modeling pollen time series using seasonal-trend decomposition procedure based on LOESS smoothing. Int. J. Biometeorol. 2017, 61, 335–348. [Google Scholar] [CrossRef]
  24. Moberly, J.G.; Bernards, M.T.; Waynant, K.V. Key features and updates for origin 2018. J. Cheminformatics 2018, 10, 5. [Google Scholar] [CrossRef]
  25. Misra, P.; Enge, P. Global Positioning System: Signals, Measurements, and Performance, 2nd ed.; Ganga-Jumana Press: Lincoln, MA, USA, 2012. [Google Scholar]
  26. Takasu, T.; Yasuda, A. Development of the low-cost RTK-GPS receiver with an open-source program package RTKLIB. In Proceedings of the International Symposium on GPS/GNSS, Seogwipo-si, Republic of Korea, 4–6 November 2009; Volume 1, pp. 1–6. [Google Scholar]
  27. Kim, H.I.; Yu, G.S.; Park, K.D.; Ha, J.H. Accuracy evaluation of VRS RTK surveys inside the GPS CORS network operated by National Geographic Information Institute. JKSGPC 2008, 26, 139–147. [Google Scholar]
  28. James, G.; Witten, D.; Hastie, T.; Tibshirani, R.; Taylor, J. Resampling methods. In An Introduction to Statistical Learning: With Applications in Python; Springer International Publishing: Cham, Switzerland, 2023; pp. 201–228. [Google Scholar]
  29. Chernick, M.R.; LaBudde, R.A. An Introduction to Bootstrap Methods with Applications to R; John Wiley & Sons: Hoboken, NJ, USA, 2014. [Google Scholar]
  30. Lahiri, S.N.; Zhu, J. Resampling methods for spatial regression models under a class of stochastic designs. Ann. Statist. 2006, 34, 1774–1813. [Google Scholar] [CrossRef]
  31. Lee, I.W. Suggestion of requirement for settlement restoration method considering running stability and track Serviceability. JKSR 2020, 23, 395–406. [Google Scholar] [CrossRef]
Figure 1. Comparison of the new MDD/GNSS system with classic MDD.
Applsci 14 00082 g001
Figure 2. The MDD/GNSS monitored site of the transition zone near the Sinri Tunnel in Jeonju district, Republic of Korea.
Applsci 14 00082 g002
Figure 3. The concept of obtaining track deformation based on a GNNS baseline analysis method with carrier phase measurements.
Applsci 14 00082 g003
Figure 4. Details of MDD modules and schematic after installation of MDD and GNSS receivers.
Applsci 14 00082 g004
Figure 5. GNSS observation streaming system.
Applsci 14 00082 g005
Figure 6. The GNSS Monitoring System: VRS application for determining base station coordinates.
Applsci 14 00082 g006
Figure 7. The MDD/GNSS data transferring system: (a) MDD data wire connection, (b) MDD/GNSS wireless data transferring.
Applsci 14 00082 g007
Figure 8. The whole system of MDD-GNSS for measurement of track layer displacement.
Applsci 14 00082 g008
Figure 9. GNSS original monitoring results and estimated displacement using the LOESS trend model.
Applsci 14 00082 g009
Figure 10. GNSS original monitoring results and estimated displacement using the resampling method.
Applsci 14 00082 g010
Figure 11. Total station measurement along the track side.
Applsci 14 00082 g011
Figure 12. Comparison of GNSS and total station monitoring results.
Applsci 14 00082 g012
Figure 13. Original deformation monitoring results and estimated displacement using the trend model at Laser module #1.
Applsci 14 00082 g013
Figure 14. Original deformation monitoring results and estimated displacement using the trend model at Laser module #2.
Applsci 14 00082 g014
Figure 15. Original deformation monitoring results and estimated displacement using the trend model at Laser module #3.
Applsci 14 00082 g015
Figure 16. Original deformation monitoring results and estimated displacement using the trend model at Laser module #4.
Applsci 14 00082 g016
Figure 17. Estimated displacement of MDD positions using the trend model and resampling method.
Applsci 14 00082 g017
Figure 18. MDD displacements recalculated using the absolute GNSS settlement.
Applsci 14 00082 g018
Figure 19. MDD displacement recalculated using the absolute GNSS settlement.
Applsci 14 00082 g019
Figure 20. Comparison of vertical settlement for measured and predicted MDD data (Position #1).
Applsci 14 00082 g020
Figure 21. Comparison of vertical settlement for measured and predicted MDD data (Position #2).
Applsci 14 00082 g021
Figure 22. Comparison of vertical settlement for measured and predicted MDD data (Position #3).
Applsci 14 00082 g022
Figure 23. Comparison of vertical settlement for measured and predicted MDD data (Position #4).
Applsci 14 00082 g023
Figure 24. Comparison of vertical settlement for all MDD predicted results.
Applsci 14 00082 g024
Figure 25. Settlement simulation with assumption of a simple supporting slab.
Applsci 14 00082 g025
Table 1. Reference point coordinates (WGS84) of the site.
CoordinateValue
Latitude35°47′11.5474″
Longitude127°12′00.3094″
Height (m)104.090
Table 2. The results of a nonlinear statistical function analysis.
MDDParameter ValueStandard ErrorR2
Position #1y08.8950.006450.98868
A−10.120.03786
R0−0.008975.25641 × 10−5
Position #2y07.41660.0000.99999
A−8.379130.000
R0−0.00750.000
Position #3y07.343310.006420.98797
A−8.162070.03057
R0−0.006924.25569 × 10−5
Position #4y07.042420.006680.9808
A−8.270550.04067
R0−0.009457.22496 × 10−5
Table 3. Parametric calculations of void space length.
E (×107, kPa)I (m4) B (m)H (m)EI (kNm2)L (m)
0.80.00368643.20.2429,491.22.53
1.60.00368643.20.2458,982.43.01
2.40.00368643.20.2488,473.63.33
3.20.00368643.20.24117,964.83.58
Disclaimer/Publisher’s Note: The statements, opinions and data contained in all publications are solely those of the individual author(s) and contributor(s) and not of MDPI and/or the editor(s). MDPI and/or the editor(s) disclaim responsibility for any injury to people or property resulting from any ideas, methods, instructions or products referred to in the content.

