1. Introduction
Cranial bone measurements have a fundamental role in the analysis of skeletal variation [
1]. Several studies have found that skeletal measures are a combination of a continuous interaction between the genotype and the environment [
2,
3], with a coefficient of heritability around 0.50–0.70 [
4,
5] in twins. In spite of this low level of heritability, measurements of the skull are essential for physical anthropology, and also have several clinical applications, i.e., orthodontic diagnostic procedures [
6].
Morphologic differentiation is linked to genetics [
7], and genetic variation in different geographic groups of
Homo sapiens is quite small, making up only 10% of the total [
8,
9].
The level of differentiation regarding craniometric variables between the world’s geographic areas was assessed, underlying a substantial agreement between craniometric and genetic data [
3,
4,
10,
11,
12].
A very evocative hypothesis suggests that some morphometric characteristics, like the width of the bizygomatic and the maxillary, might be the result of a particular behaviors and cultural attitudes, like the use of the “mouth-like third hand” in order to work skins and other instruments. These habits would have produced excessive masticatory stresses, inducing modifications in the maxillo-facial anatomy [
13].
Geographic isolation might eventually have also contributed to maintaining such characteristics, as the morphologic model may be a consequence of climatic and biomechanical adaptations [
14]. The population of Sardinia is particularly well suited to genetic studies, as demonstrated by the numerous successes in mapping complex traits and diseases (like beta thalassemia and type 1 diabetes) [
15,
16]. Several aspects of the morphological results are related to the geographic isolation, inbreeding, and genetic drift, and the selection induced by specific environmental factors (e.g., endemic malaria) has probably contributed to the genetic diversification of Sardinians from mainland Italians and other populations [
15]. One of the most well-known genetic features of the Sardinian population is the high prevalence of β-thalassemia [
16], a hereditary disease of the erythropoietic system with specific maxillo-facial features (
facies thalassemica), which is particularly widespread and has been extensively studied in recent decades [
17,
18].
For example, early studies illuminated the genetic basis of thalassemia. Understanding how and why these conditions reached their frequencies in Sardinia would provide valuable insights to the dynamics of complex trait evolution. Yet, to empower such studies, a detailed background population history of Sardinia is needed.
European cranial samples have been evaluated in several studies since the last decades of the 20th century [
3,
19,
20,
21], with an overrepresentation of Central and Eastern Europe populations; meanwhile, Sardinia is underrepresented [
22].
The most comprehensive work about the somatic features of the ancient Sardinian populations considers eight human skulls from different periods, from the Neolithic (4700–4000 BC) until the Bronze Age (1300–1150 BC) [
23]. Evidence signals that a Sardinian-specific pattern relative to the cranium morphology may therefore be determined from the Neolithic to the Bronze Age, in which the genetic distances between the Sardinian population and other European populations were linked directly to the Neolithic and Bronze ages, before the arrival of Romans and other invaders [
24].
Based on this assumption, an observational study was designed to assess the cranial affinity of Sardinian populations from different chronological periods, using a standard index to evaluate its benefits for orthodontic purposes.
2. Materials and Methods
2.1. Study Planning
The study was planned in collaboration with the Soprintendenza Archeologia, Belle Arti e Paesaggio for the provinces of Sassari, Olbia-Tempio, and Nuoro. The latter contributed to the location of the archaeological sites to be included and also provided the skulls, as the objects of the study.
The present study did not require ethical approval for its observational design according to Italian law (Gazzetta Ufficiale n. 76 dated 31 March 2008).
All methods were carried out in accordance with the relevant Italian guidelines and regulations (
https://www.gazzettaufficiale.it/eli/gu/2008/03/31/76/sg/pdf; accessed on 10 October 2023). The study proposal was submitted to the ethics committee, according to Italian legislation; the experimental protocol may start after 60 days, even without a proper response from the ethical committee, as the study was designed as a cross-sectional evaluation.
2.2. Study Setting
The study was conducted in Sardinia, the second-largest island in the Mediterranean. It is well known that Sardinia was probably the first Mediterranean island to be populated (with a pre-Neolithic date around 9100 years BC), and it developed a unique megalithic culture, the Nuragic culture, which lasted on the island from the Middle Bronze Age up to Roman colonization (1500–400 BC) [
25].
After the Phoenicians, Sardinia was partially conquered or visited by the Romans, the Vandals, the Byzantines, the Arabs, the Catalans, the Spaniards, and the Italians. As evidence, there are several sites of archaeological interest scattered throughout the entire region [
26].
Moreover, owing to its insularity, the region lends itself very well to observational investigations, and represents an excellent test case in relation to the reported dynamics. In particular, the island has already been shown to be well suited to epidemiological studies, as it protects the region from interference caused by territorial contiguity. As such, it can serve as an excellent training ground for the reported genetics and epidemiological dynamics.
2.3. Selection of the Sample
The population investigated covers different chronological eras represented by historical and prehistoric periods (the best represented being the middle-age and modern times), accounting for about 4000 years of Sardinian history. Within this period, there have been several invasions and movements of people from Africa and other parts of Europe. Only undamaged skulls from burials in cemeteries were considered. All the skulls belonged to adult humans. Typically, intraspecific variation related to sexual dimorphism is included in this area of research [
27]. As no report is available on the variation between the populations studied, the sexes of the populations studied were balanced wherever possible to avoid this source of variation between groups. Otherwise, it is likely that the natural adult gender ratio was close to one-to-one, so the observed variation in analysis can be attributed essentially to a group-related interspecific source. Some 72 units were considered. In particular, 42 skulls cleaned up and classified using the methods suggested by Parzianello [
28] were included.
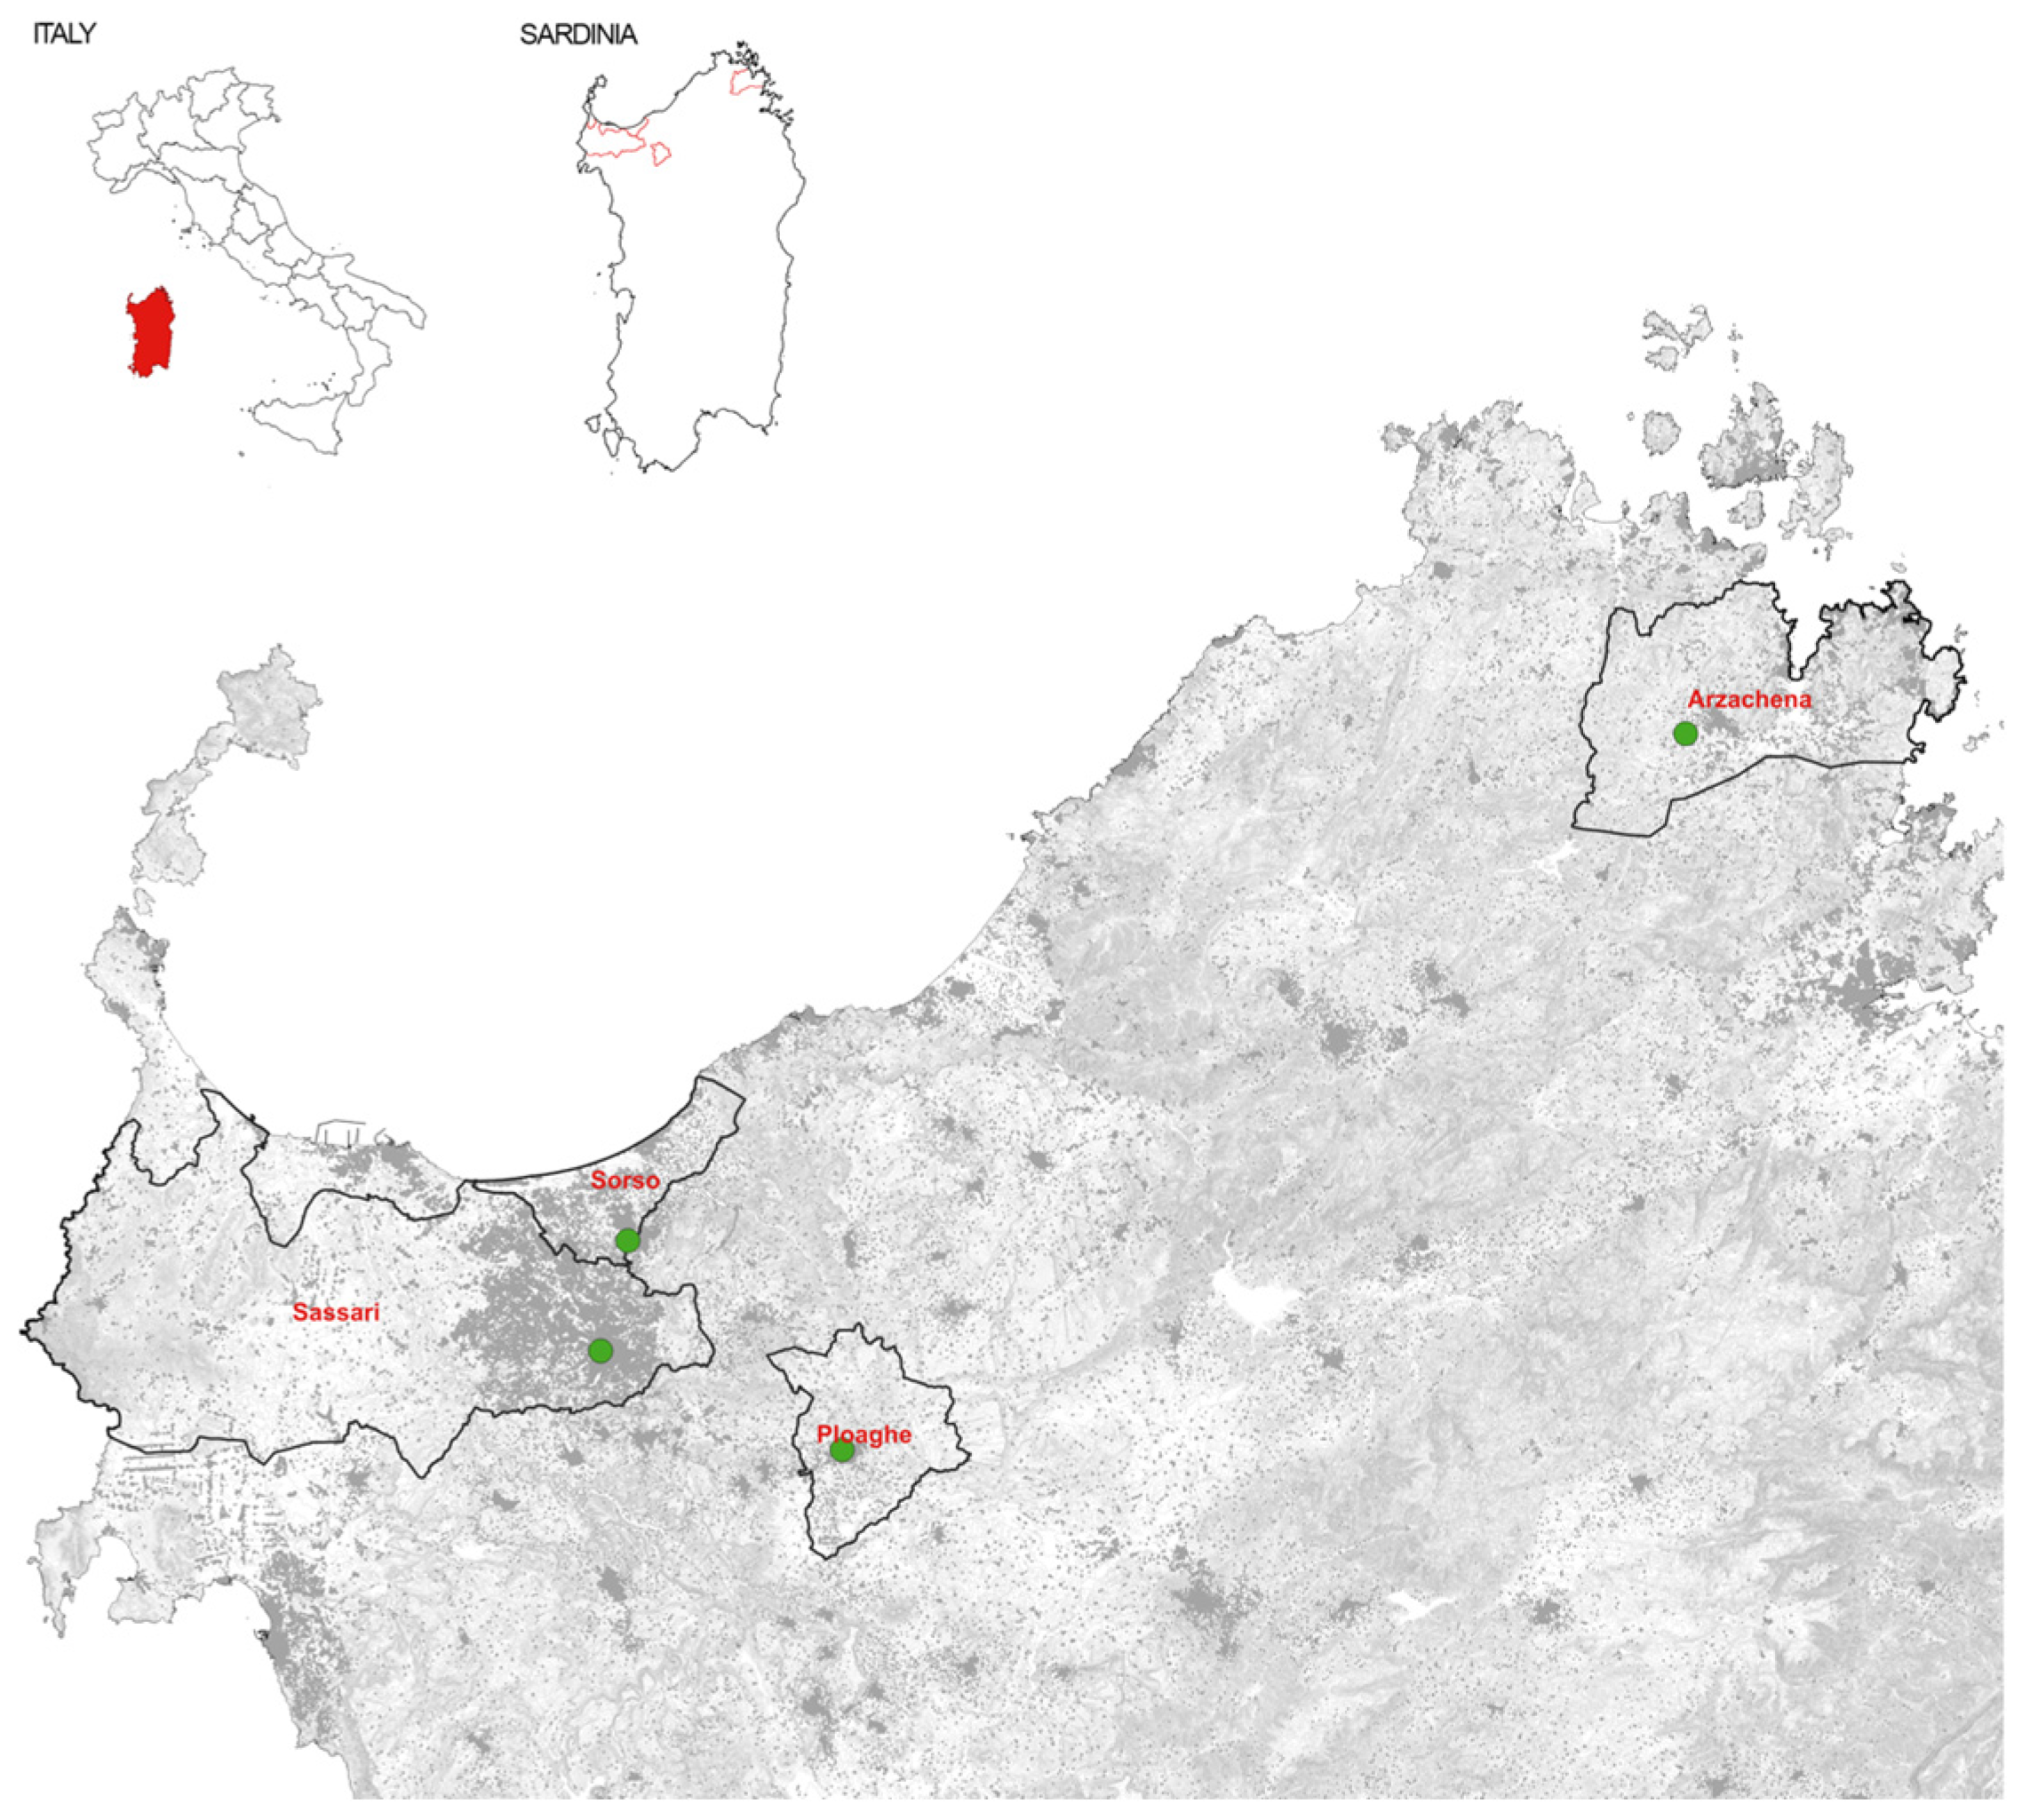
Figure 1 reports the geography of the cemeteries wherein skulls were excavated:
- -
Some 12 skulls of pre-historical populations: 8 crania found in the Domus de Janas (estimated age: III millennium BC), and 4 crania found in Tomba dei Giganti of the nuragic culture (estimated age: II millennium BC);
- -
Some 30 skulls of the late-Medieval population were found in the cemetery of the village of Geridu (estimated age: X–XI century).
2.4. Craniometric Measurements
Finally, craniometric measurements of the Modern Sardinian population were carried out on 30 subjects (age range 25–45 y, with a male/female ratio of 1:1) with no severe malocclusion at the X-ray service of the Dental Institute of the University of Sassari.
Two cephalograms (anterior and lateral) were obtained for each skull, following the technique described by Broadbent [
29] and using radiographic equipment (Orthophos SL 3D Orthophos 5/plus
®, Sirona, Charlotte, NY, USA, Germany machine code D3297). The measurements were carried out following Munich international conventions.
For all the sample, 15 craniometric variables were measured following the method of Howells [
30]; another 6 craniometric measures of specific orthodontic interest were also obtained.
Furthermore, in order to conduct cephalometric analysis, the images obtained from the dataset were exported in the DICOM file format and subsequently imported into the CephNinja Cloud (Cyncronus LLC, Bothell, WA, USA) software program. All cephalometric measurements were carried out by a well-trained dentist. To quantify the bias of the method, two repeated measurements were made on eight variables over a 72 h period, and the reliability of the mean values of three random craniometric measurements obtained from lateral radiographs was evaluated for percent agreement (
Table 1).
Bolton’s standard values were used as a reference [
31]. The selection of undamaged skulls allowed us to have no missing data.
2.5. Statistical Analysis
Data were tabulated in a Microsoft Excel worksheet and the analysis of the data was performed using SPSS software version 28:0 for Mac. The results of the craniometric measurements are given as means and standard deviations. An ANOVA was used for means comparison among the four populations. The statistically significant level was set up at α = 0.01. Hierarchical cluster analysis was performed with a squared Euclidean distance matrix via the unweighted pair group method using the arithmetic average (UPGMA) in R version 4.1.3. The reliability of the dendrograms was investigated using the bootstrap technique [
32] via re-sampling with a replacement procedure from an already-drawn sample. Another cluster analysis (UPGMA) using the mean values of the bootstrapped variables (500 iterations) was also computed. A principal components analysis (PCA) was also carried out.
3. Results
Length data pointed out statistically significant differences among groups (
p < 0.01); the Medieval population usually showed higher mean values in comparison to other groups. Data referring to heights revealed statistical significance for the nasion–prosthion height (NPH) and nasal height (NLH) variables, with lower mean values being observed in the Domus population. As regards the breadth measurements, statistically significant differences were observed for the variables minimum cranial breadth (WCB), biorbital breadth (EKB), orbital breadth (OBB), and nasal breadth (NLB). A progressive increment in WCB was detected through chronological ages. The NLB showed an unusual result: the Nuragici, Medieval, and Modern groups showed similar values, and only Domus significantly differed from the others (
p < 0.01), showing the lowest values (
Table 2).
The Domus sample showed high values of distance to the Medieval population (544.7) and to the Modern one (330.6). The Modern population showed no similarity to prehistoric populations nor to Bolton’s standard. Similar results were obtained using the bootstrap technique on the original data set, without Bolton’s standard, allowing us to build up the means and standard errors after 500 iterations for each variable (
Table 3).
Similar results of UPGMA were obtained using the bootstrap technique on the original data set, without Bolton’s standard, allowing us to build up the means and standard errors after 500 iterations for each variable (
Table 3 and
Table 4).
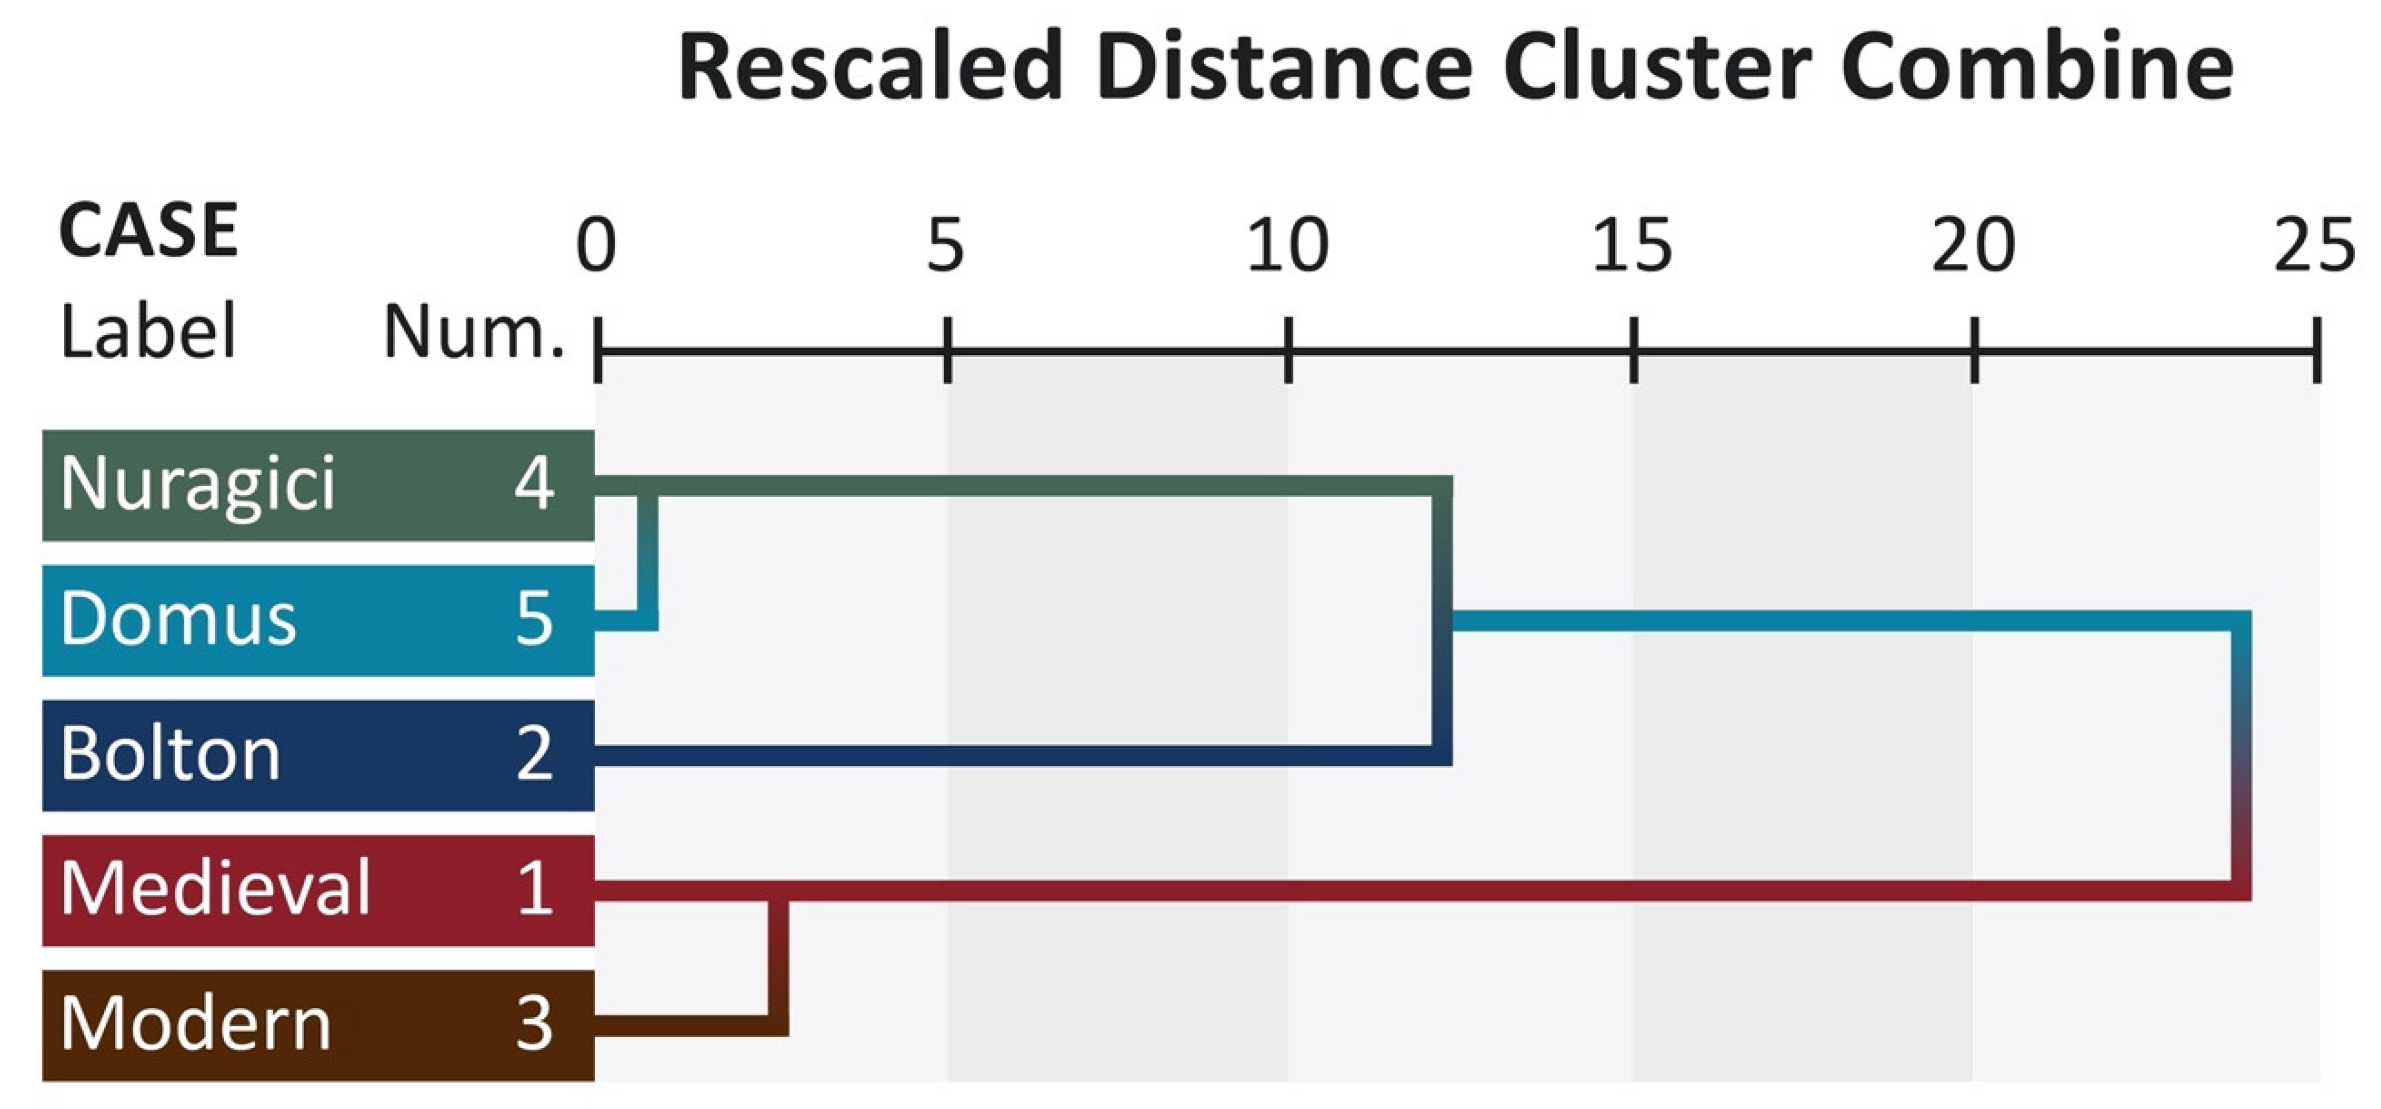
The similarity among populations is immediately appreciable from the dendrogram (
Figure 2).
A head emerging from the view tree is the clear differentiation in two clusters separated by Bolton’s standard; Nuragici and Domus at the top, and Medieval and Modern at the bottom.
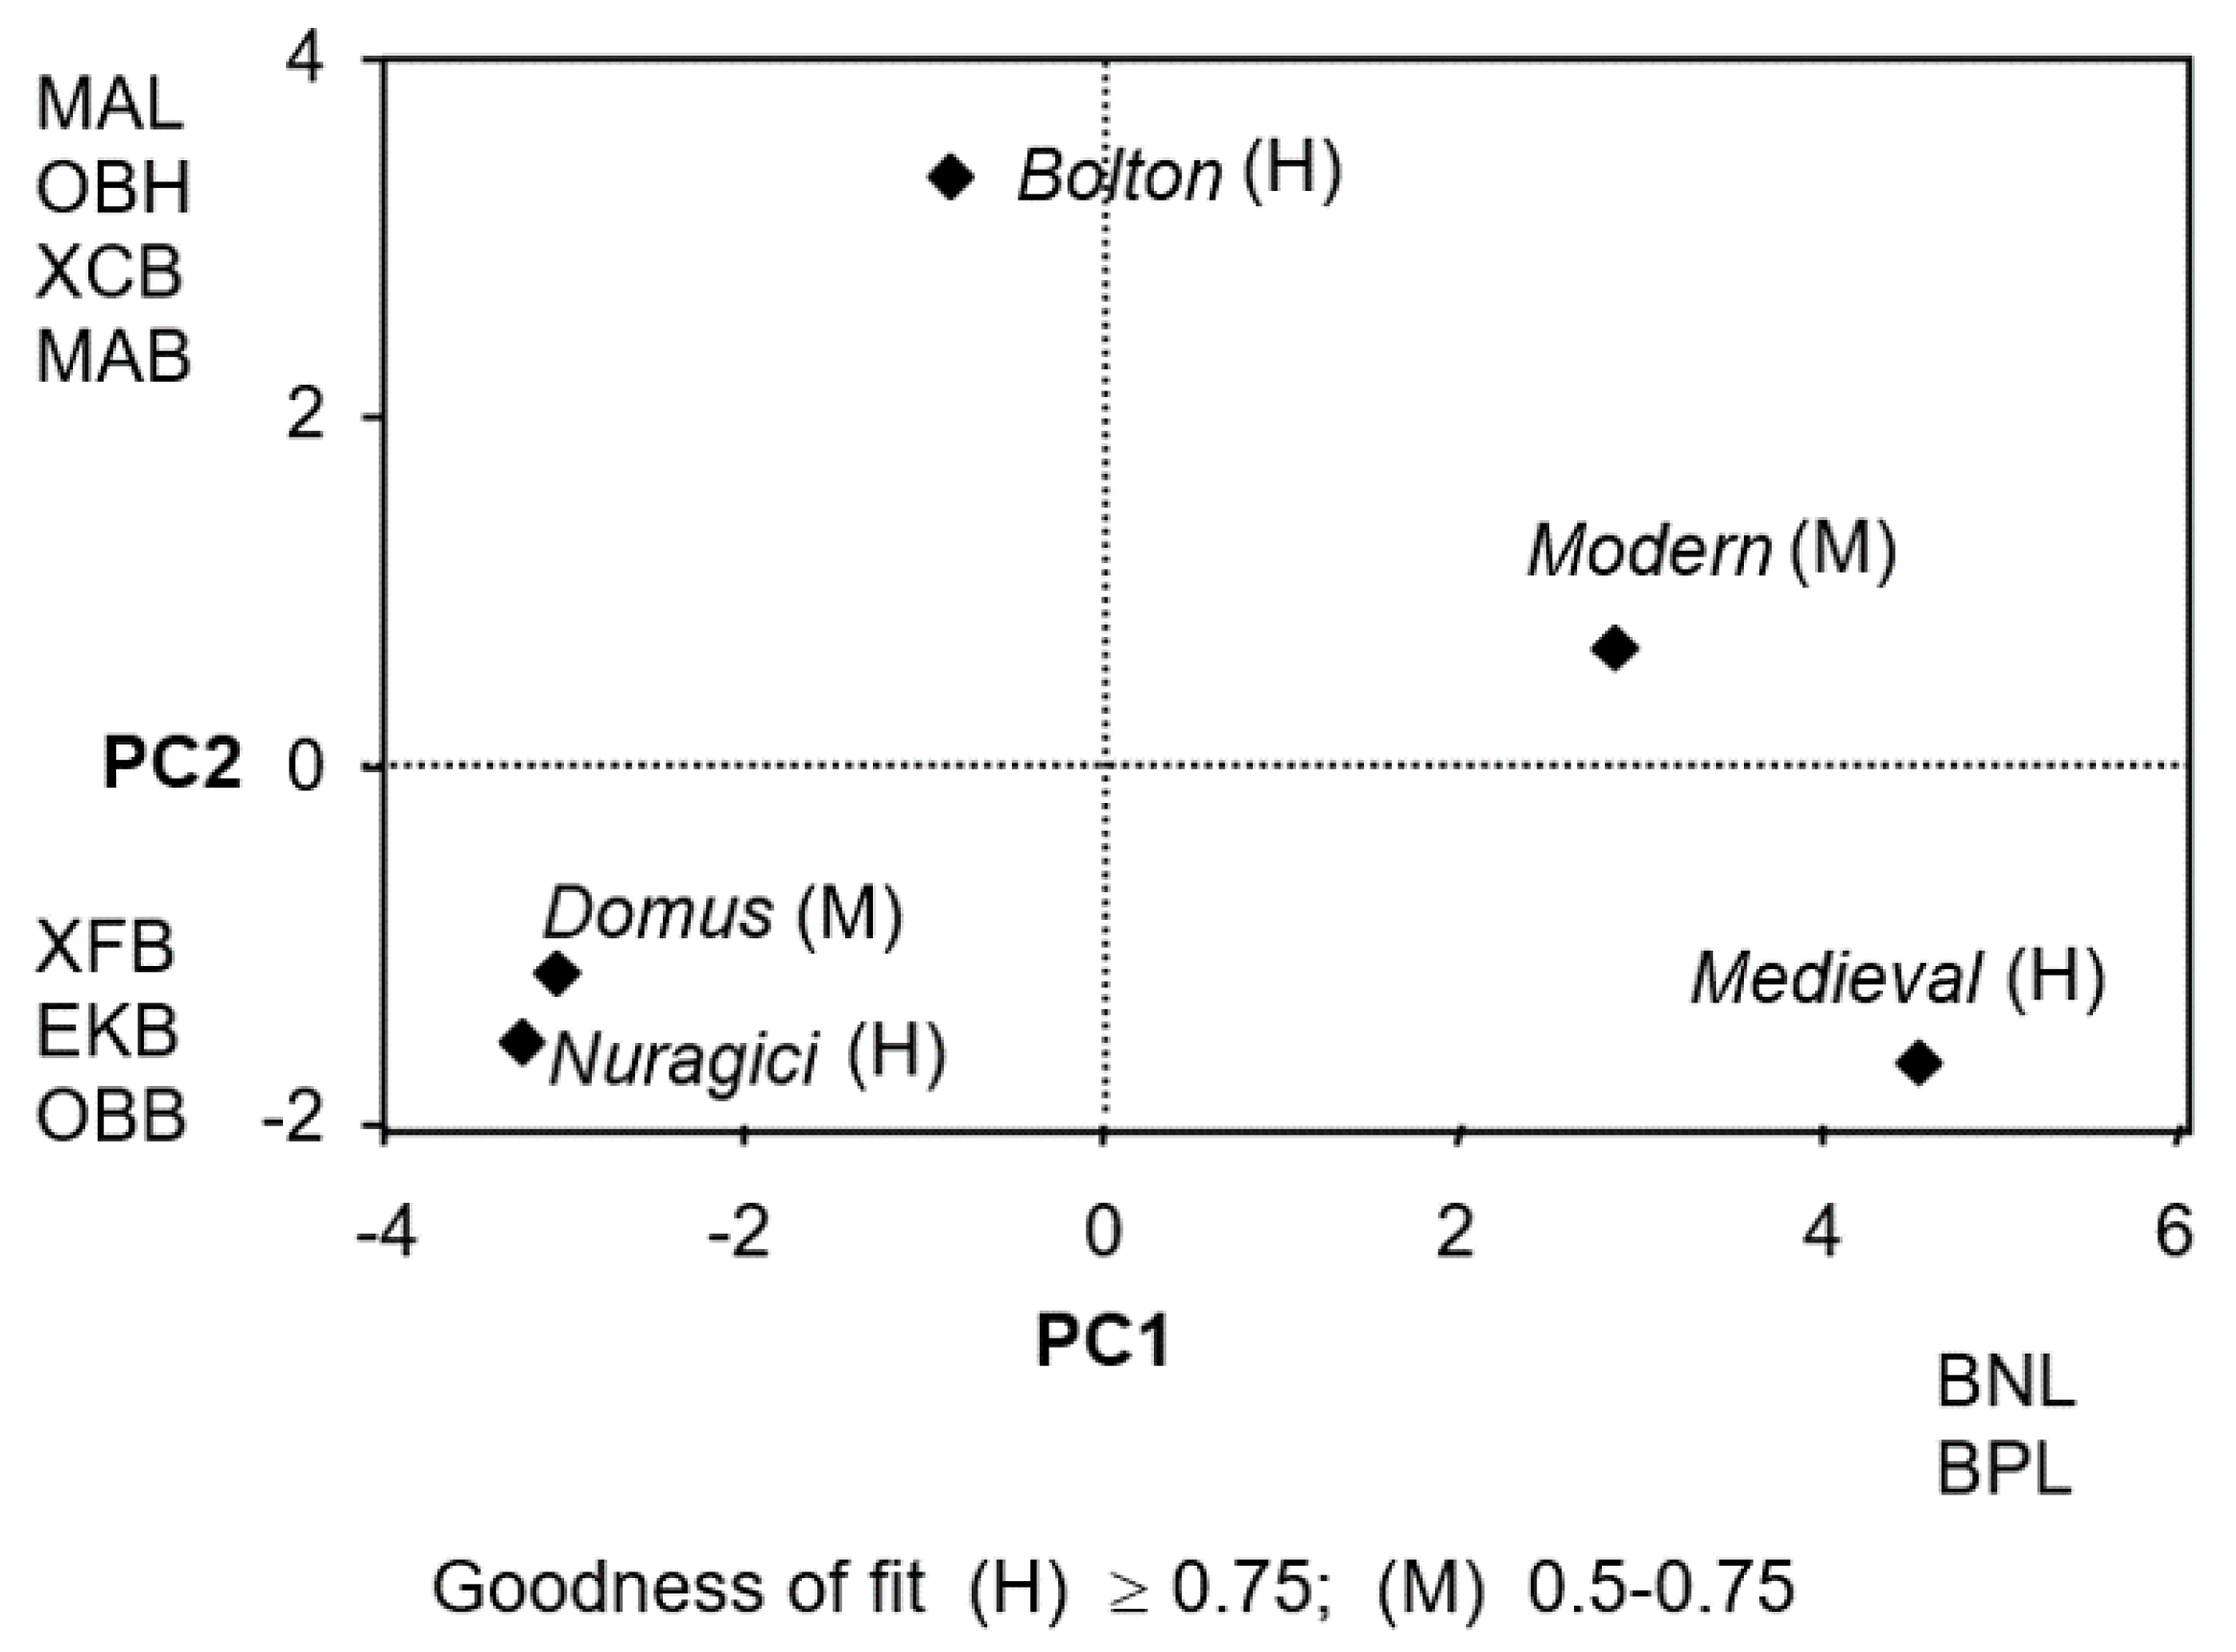
Figure 3 displays the D-plot of the first two principal coordinates derived from the principal component analysis (PCA). The first two eigenvalues collectively account for 80.9% of the total variance (59.1% and 21.8%, respectively).
Clearly, Domus and Nuragici populations tend to form separate clusters. The goodness of fit was high (≥0.75) for Bolton, Medieval and Nuragici, and medium-high (0.5–0.75) for the other groups.
The length and the breadth of the neurocranium, basion–nasion length (BNL) and basion–prosthion length (BPL) highly contribute to the first principal component. The variance along the second axis was principally generated using maxillary-–lveolar length (MAL), orbital height (OBH), maximum cranial breadth (XCB), external palate breadth (MAB) positive sense, and maximum frontal breadth (XFB), EKB and OBB, negative sense. BNL, BPL and XFB clearly differ between groups (Domus and Nuragici versus Modern and Medieval), the former having a large frontal, biorbital and orbital breadth, and the latter having a longer and narrower skull pattern (BNL and BPL).
The first component places the Domus close to the Nuragici population (negative sense) and separates them from Modern basically due to BNL, MAL, OBH, XCB, WCB, EKB, ZMB, and MAB.
4. Discussion
Craniometric data in biological anthropology have a long tradition and have been utilized in a variety of studies, particularly in recent decades of the 20th century. The majority of the studies focus on the reconstruction of prehistoric human populations [
21,
33,
34,
35] or on the diversity of the human species with regard to the evolution of modern humans, developing the idea that the patterns of variation seen in human cranial data can be generalized to patterns of genetic variation. In other words, cranial data are often utilized as a proxy to understand genetic similarity or dissimilarity between human groups, past and present.
The skulls of the different Sardinian populations exhibit several specific morphological phenotypes, and prehistoric skulls show peculiar morphological features, such as a minimum cranial width and an orbital width lower than those of other Sardinian populations. The multivariate analysis allows us to partition the amount of phenotypic variation acting on the four populations studied. The distinctive features of the Domus sample have probably been diluted by historical and population exchange. This differentiation can be described as the contribution of foreign genes and morphologies in the last two groups (Medieval and Modern). Both the cluster view and PCA showed that Bolton’s standard is exactly opposite to the Sardinian figure [
36].
The cluster of prehistoric populations (Domus and Nuragici), and the observed morphometric boundary between neighboring populations also suggest a sharp genetic boundary between these two groups. The remaining populations are grouped separately from each other. In UPGMA analysis of the bootstrapped values, Modern and Medieval samples are far away. This may be the consequence of the cultural development and evolution of the two populations. The isolation of Sardinia, even during the Roman, Visigoth, Arabian, Catalan, and Italian conquests, could have preserved morphological characteristics arising during the Neolithic and pre-Neolithic ages. The results indicate that the differences observed in craniometric data and the dissimilarities are all part of the general range of variation among Mediterranean populations [
37], although Sardinian samples should be included in the gracile Mediterranean type [
3].
The cranial evolution of Sardinians from Neolithic to modern times seems to show some kind of temporal continuity with the Neolithic groups [
24]. Furthermore, our results evidence that Bolton’s indices are not a good standard for the Sardinian population, and so are not helpful in clinical practice or in orthodontic diagnosis. One possible explanation why Bolton’s standards do not belong to Sardinian figures is the genetic variability within the Sardinian population itself when the distributions of various markers in different historical/geographical areas are studied [
23].
In the literature, it seems that Bolton’s standards apply to patients with ideal occlusion standards that could be similar for different populations, but various ethnic groups may be characterized by a different prevalence of Bolton discrepancy [
38].
Although skull morphology is affected to some extent by environmental factors and is under lower genetic control, it is accepted that craniometric traits are phylogenetically informative.
These results improve our ability to make inferences for the assessment of cranial variation in the Sardinian population, even if the analysis included a small cranial sample. Combining quantitative genetic methods with geometric morphometric tools [
39], it is possible to construct a Sardinian version of Bolton’s standards for the different craniofacial characteristics of the island population. These differences should be taken into account when developing individualized orthodontic treatment plans.
5. Conclusions
Taking into account the study limitations, this paper analyses the cranial affinity among chronological populations in Sardinia in a comprehensive way, underlining the peculiar features of the Sardinian population and how these features need to be considered in the planning of an orthodontic treatment.
Author Contributions
G.C., G.S. and P.C. designed the study and analyzed the data. M.D. and A.A. contributed to collecting and organizing the data. All the authors drafted the manuscript, discussed the results, and contributed to the final version of the manuscript. All authors have read and agreed to the published version of the manuscript.
Funding
This research received no external funding.
Institutional Review Board Statement
Not applicable.
Informed Consent Statement
The present study did not require ethical approval for its observational design according to Italian law (Gazzetta Ufficiale n. 76 dated 31 March 2008).
Data Availability Statement
The datasets generated during and/or analyzed during the current study are available from the corresponding author upon reasonable request.
Acknowledgments
The authors would like to thank the Soprintendenza Archeologia, Belle Arti e Paesaggio, the provinces of Sassari, Olbia-Tempio and Nuoro for their collaboration, and Mario Mandras for the graphic representation.
Conflicts of Interest
The authors declare no conflict of interest.
References
- Ulcay, T.; Kamaşak, B. Evaluation of craniometric measurements in human skulls. J. Health Sci. Med. 2021, 4, 38–44. [Google Scholar] [CrossRef]
- Susanne, C. Genetic and environmental influences on morphological characteristics. Ann. Hum. Biol. 1975, 2, 279–287. [Google Scholar] [CrossRef]
- Lalueza Fox, C.; Gonzalez, M.A.; Vives, C.S. Cranial Variation in the Iberian Peninsula and the Balearic Islands: Inferences about the History of the Population. Am. J. Phys. Anthropol. 1996, 99, 413–428. [Google Scholar] [CrossRef]
- Relethford, J.H. Craniometric variation among modern human population. Am. J. Phys. Anthropol. 1994, 95, 53–62. [Google Scholar] [CrossRef] [PubMed]
- Konigsberg, L.W. Quantitative variation and genetics. In An Evolutionary and Biocultural Perspective; Wiley-Liss: New York, NY, USA, 2000; pp. 135–162. [Google Scholar]
- Yan, Z.B.; Wan, Y.D.; Xiao, C.Q.; Li, Y.Q.; Zhang, Y.Y.; An, Y.; Xiong, X. Craniofacial Morphology of Orthodontic Patients with and without Temporomandibular Disorders: A Cross-Sectional Study. Pain Res. Manag. 2022, 2022, 9344028. [Google Scholar] [CrossRef]
- Martínez-Abadías, N.; Esparza, M.; Sjøvold, T.; González-José, R.; Santos, M.; Hernández, M. Heritability of human cranial dimensions: Comparing the evolvability of different cranial regions. J. Anat. 2009, 214, 19–35. [Google Scholar] [CrossRef]
- Nei, M.; Roychoudhury, A.K. Genetic relationship and evolution of human races. J. Evol. Biol. 1982, 14, 341–369. [Google Scholar] [CrossRef]
- Howells, W.W. Introduction. In Multivariate Statistical Methods in Physical Anthropology; Vark, G.N., Howells, W.W., Eds.; Springer: Dordrecht, NL, USA, 1989; pp. 1–11. [Google Scholar] [CrossRef]
- Bertranpetit, J.; Cavalli-Sforza, L.L. 1991 A genetic reconstruction of the history of the population of the Iberian Peninsula. Ann. Hum. Genet. 1991, 55, 51–67. [Google Scholar] [CrossRef]
- Cavalli Sforza, L.L.; Menozzi, P.; Piazza, A. History and Geography of Human Genes; Princeton University Press: Princeton, NJ, USA, 1994. [Google Scholar] [CrossRef]
- Hernàndez, M.C.; Lalueza Fox, C.; Garcia Moro, C. Fuegian cranial morphology. The adaption cold harsh environment. Am. J. Phys. Anthropol. 1997, 103, 103–117. [Google Scholar] [CrossRef]
- Pacey, L. Mouth used as third hand by cavemen. Br. Dent. J. 2012, 213, 336. [Google Scholar] [CrossRef]
- von Cramon-Taubadel, N. Evolutionary insights into global patterns of human cranial diversity: Population history, climatic and dietary effects. J. Anthropol. Sci. 2014, 92, 43–77. [Google Scholar] [CrossRef] [PubMed]
- Chiang, C.W.; Marcus, J.H.; Sidore, C.; Biddanda, A.; Al-Asadi, H.; Zoledziewska, M.; Pitzalis, M.; Busonero, F.; Maschio, A.; Pistis, G.; et al. Genomic history of the Sardinian population. Nat. Genet. 2018, 50, 1426–1434. [Google Scholar] [CrossRef]
- Sardinia Council. L’incidenza Delle Talassemie. Available online: https://www.sardegnasalute.it/index.php?xsl=313&s=36635&v=2&c=2942#:~:text=In%20Italia%20le%20regioni%20pi%C3%B9,ed%20in%20Sardegna%20circa%201.000 (accessed on 11 July 2023).
- Martini, M.; Tornali, C.; Bragazzi, N.L.; Paluan, F.; Vardeu, M.F. The History of Beta Thalassaemia in Sardinia: The Contribution of the Italian Schools of Pediatrics. Acta Med. Hist. Adriat. 2019, 17, 65–90. [Google Scholar] [CrossRef] [PubMed]
- Rösing, F.W.; Schwidetzky, I. Vergleichend-statistiche Untersuchungen zur Anthropologie des frühen Mittelalters (500–1000 n.d.Z.). Homo 1977, 28, 65–115. [Google Scholar]
- Rösing, F.W.; Schwidetzky, I. Vergleichend-statistiche Untersuchungen zur Anthropologie des frühen Mittelalters (500–1000 n.d.Z.). Homo 1981, 132, 211–251. [Google Scholar]
- Schwidetzky, I.; Rösing, F.W. Vergleichend-statistiche Untersuchungen zur Anthropologie der Neuzeit (nach 1500). Homo 1984, 35, 1–49. [Google Scholar]
- Sokal, R.R.; Uytterschaut, H. Cranial variation in European populations: A spatial autocorrelation study at three time periods. Am. J. Phys. Anthropol. 1987, 74, 21–38. [Google Scholar] [CrossRef]
- D’Amore, G.; Di Marco, S.; Floris, G.; Pacciani, E.; Sanna, E. Craniofacial morphometric variation and the biological history of the peopling of Sardinia. Homo 2010, 61, 385–412. [Google Scholar] [CrossRef]
- Vona, G. The peopling of Sardinia (Italy): History and effects. Int. J. Anthropol. 1997, 12, 71–87. [Google Scholar] [CrossRef]
- Marcus, J.H.; Posth, C.; Ringbauer, H.; Lai, L.; Skeates, R.; Sidore, C.; Beckett, J.; Furtwängler, A.; Olivieri, A.; Chiang, C.W.; et al. Genetic history from the Middle Neolithic to present on the Mediterranean island of Sardinia. Nat. Commun. 2020, 11, 939. [Google Scholar] [CrossRef]
- Unesco. Nuragic Monuments of Sardinia. Available online: https://whc.unesco.org/en/tentativelists/6557/ (accessed on 11 July 2023).
- Geo Portale Nurnet. Available online: http://nurnet.crs4.it/nurnetgeo/ (accessed on 11 July 2023).
- Pan, R.; Oxnard, C.E. Craniodental variation among Macaques (Macaca), nonhuman primates. BMC Evol. Biol. 2002, 2, 10. [Google Scholar] [CrossRef]
- Parzianello, L.C.; Machado Da Silveira, M.A.; Furuie, S.S.; Palhares, F.A.B. Automatic detection of the Craniometric Points for Craniofacial Identification. An. Do IX SIBGRAPI 1996, 96, 189–196. [Google Scholar]
- Broadbent, H.B. A new x-ray technique and its application to orthodontia. Angle Orthod. 1931, 1, 45–66. [Google Scholar]
- Howells, W.W. Cranial variation in man: A study of multivariate analysis of patterns of difference among recent human populations. Peabody Mus. Pap. 1973, 67, 1–259. [Google Scholar]
- Broadbent, H.B.; Broadbent, H.B.; Golden, W.H. Bolton Standards of Dentofacial Developmental Growth; The C.V. Mosby Company: Saint Luis, MO, USA, 1975. [Google Scholar]
- Efron, B. CBMS-NSF Regional Conference Series in Applied Mathematics. In The Jackknife, the Bootstrap and Other Resampling Plans; SIAM Philadelphia: Philadelphia, PA, USA, 1982. [Google Scholar] [CrossRef]
- Carlson, D.S. Temporal variation in prehistoric Nubian crania. Am. J. Phys. Anthropol. 1976, 45, 467–484. [Google Scholar] [CrossRef] [PubMed]
- Key, P.; Jantz, R.L. A multivariate analysis of temporal change in Arikara craniometrics: A methodological approach. Am. J. Phys. Anthropol. 1981, 55, 247–259. [Google Scholar] [CrossRef]
- Jantz, R.L.; Owsley, D.W. Variation among early North American crania. Am. J. Phys. Anthropol. 2001, 114, 146–155. [Google Scholar] [CrossRef]
- Hussein, F.A.; Mohamed, R.E.; El-Awady, A.A.; Ali, M.M.; Al-Khalifa, H.N.; Abdallah, K.F.; Abouelnour, A.M. Digital evaluation of Bolton’s tooth size discrepancies among different malocclusions categories of Egyptian adolescent orthodontic population: A retrospective study. Int. Orthod. 2022, 20, 100660. [Google Scholar] [CrossRef]
- Relethford, J.H. Global analysis of regional differences in craniometric diversity and population substructure. Hum. Biol. 2001, 73, 629–636. [Google Scholar] [CrossRef] [PubMed]
- Kansal, A.; Kittur, N.; Kanhoba Mahabaleshwar, K. Analysis of Bolton’s ratio among different malocclusion groups: A hospital based study. Ind. J. Dent. 2012, 3, 139–144. [Google Scholar] [CrossRef]
- Klingenberg, C.; Leamy, L.; Routman, E.; Cheverud, J. Genetic architecture of mandible shape in mice: Effects of quantitative trait loci analyzed by geometric morphometrics. Genetics 2001, 157, 785–802. [Google Scholar] [CrossRef] [PubMed]
| Disclaimer/Publisher’s Note: The statements, opinions and data contained in all publications are solely those of the individual author(s) and contributor(s) and not of MDPI and/or the editor(s). MDPI and/or the editor(s) disclaim responsibility for any injury to people or property resulting from any ideas, methods, instructions or products referred to in the content. |
© 2023 by the authors. Licensee MDPI, Basel, Switzerland. This article is an open access article distributed under the terms and conditions of the Creative Commons Attribution (CC BY) license (https://creativecommons.org/licenses/by/4.0/).


 ,
, 


