Abstract
Seed coat hardness and water permeability, which are determined by the accumulation of tannins through the phenylpropanoid pathway in the seed, are important lentil quality characteristics. The impact of seeds’ developmental stage and phosphorus (P) fertilization levels on tannin accumulation is still under research. Through RNA sequencing, this study explored the effect of three P treatments (P0, 6 mg kg−1; P1, 15 mg kg−1; and P2, 21 mg kg−1) and three seed maturity stages (S1, immature 2 mm seed in a flat pod; S2, fully developed seed within the pod; and S3, mature seed at the beginning of the pod’s discoloration) on lentil gene expression. The key findings highlighted a significant influence of the seed maturity stage on phenylpropanoid genes, with S1 displaying the highest expression levels, and on phosphorus-related Gene Ontology (GO) terms that presented the highest number of downregulated genes in the S3 to S1 comparison. P exhibited a targeted effect on the flavanone 3-hydroxylase (F3H) and flavonol synthase (FLS) genes and specific gene clusters, as shown by the differential gene expression analysis. This study investigates the molecular mechanisms related to phosphorus fertilization and seed maturity stages that influence tannin accumulation, offering valuable information for the enhancement of lentil product quality through breeding programs.
1. Introduction
Lentil (Lens culinaris Medik.) which belongs to the Fabaceae family, is among the earliest domesticated plant species. Lentil is one of the most important legumes for human and animal nutrition [1] and is also useful for soil enrichment with nitrogen as it enhances nitrogen fixation [2]. Despite lentils’ high nutritional value and positive health benefits, their content in certain antinutritional factors such as phytic acid, oxalates, antitrypsin inhibitors, and polyphenols can significantly affect the absorbance of mineral elements by the human body. These compounds can create complexes with essential mineral elements, significantly diminishing their solubility within the intestinal lumen and, consequently, impeding their absorption by the human body [3,4]. Effective approaches to drastically limit these antinutritional factors and improve the overall taste of pulses are cooking, which promotes water uptake from the seeds, and dehulling [5]. Cooking time is determined by the seed’s hardness, which controls the seed’s ability to absorb water. Reduced seed hardness leads to faster water uptake which ensures less cooking time [6]. The hard seed coat of lentils is a feature of domestication, and it is attributed to environmental and genetic factors [7]. Despite similarities to other legumes’ seed coats, lentils’ seed coat microstructure tends to lead to less hard seed coats [8]. Lentil’s transparent and thin seed coat is controlled by a recessive gene (tan) which moderates the tannin precursors that are responsible for seed darkening during cooking and the preservation period [9]. It is worth noting that both findings of our research group [10,11,12,13] and those of other research teams (for a review see Polidoros et al. [1]) indicate that the genetic diversity present within and among lentil populations is rich enough to provide material for genetic studies and manipulation of this trait. Phenolic acids, stilbenes and flavonoids such as flavanones, flavones, dihydroflavonols, flavonols, flavan-3-ols, anthocyanidins and proanthocyanidins, also known as condensed tannins, are some of the derivatives of polyphenolic compounds that play an important role in the properties of the seed coat [14]. The biosynthesis of tannins begins with the conversion of L-phenylalanine to trans-cinnamic acid, which is catalyzed by phenylalanine ammonia-lyase (PAL). Chalcone synthase (CHS) is the key enzyme that catalyzes the first step in the branch that leads to the flavonoid pathway [15]. Chalcone isomerase (CHI) then speeds up the chemical reaction that converts the yellow-colored chalcone into the colorless naringenin. Following this isomerization, flavanone 3-hydroxylase (F3H) transforms naringenin into dihydrokaempferol (DHK) which is hydroxylated by flavonoid 3’-hydroxylase (F3′H) to form dihydromyricetin (DHM) [16]. Transcription factors, such as basic helix-loop helix (bHLH), that interfere with the pathway determine the regulation of several biosynthetic enzymes such us, F3H, F3′H, flavonoid-3′-5′-hydroxylase (F3′5′H), flavonol synthase (FLS), dihydroflavonol 4-reductase (DFR), anthocyanidin synthase (ANS), anthocyanidin reductase (ANR) and leucoanthocyanidin reductase (LAR) that are considered to affect the pigmentation in the lentil seed coat. These enzymes are reported as key enzymes for the biosynthesis of flavan-3-ols, which are attributed as the monomers of polymerized proanthocyanidins [15,16,17,18].
While the impact of tannin content on seed coat hardness is recognized, there is a limited understanding of the factors influencing their accumulation. Feedback from local farmers underscores the substantial influence of environmental variables. Their observations reveal that for certain lentil varieties, within the same variety and field, the percentage of hard seeds that are resistant to boiling can vary from year to year in a seemingly random manner. This prompts a worthwhile investigation into the role of diverse field factors that may influence tannin accumulation during lentil seed development. One such factor, susceptible to fluctuations due to environmental conditions, is the availability of phosphorus (P) in the soil. P stands as a vital macronutrient crucial for the growth and development of plants. It plays a pivotal role in essential metabolic processes, including the synthesis of adenosine triphosphate (ATP) and nicotinamide adenine dinucleotide phosphate hydrogen (NADPH), it is involved in the formation of nucleic acids and phospholipids [19]. It is also well known that soil P dynamics are affected by the frequency and intensity of soil drying and rewatering [20]. P deficiency is reported to induce the increase in certain phenolic substances in all the vegetative parts of the lentil plants [21]. However, our knowledge of how P levels, above or below optimal doses, affect transcriptional regulation and gene expression during seed development is limited.
In recent years, next-generation sequencing technologies have facilitated the study of lentil’s genome (~4.3 Gbp), and the most recent effort in developing lentil genome assemblies for both the cultivated lentil (Lens culinaris) and its wild relative (Lens ervoides) was effectuated by Ramsay et al. [22]. Numerous studies utilizing transcriptome sequencing on lentil have investigated topics such as lentil’s response to biotic and abiotic stresses by studying its defense mechanisms against pathogens, drought and heat stress [23,24,25,26,27,28]. Transcriptome analysis offers several advantages, including the discovery of stress-resilient genes and the identification of transcription factors and stress-responsive pathways [26]. In another transcriptomic analysis conducted on both small and large-seeded genotypes, the study examined the involvement of pathways related to hormone biosynthesis and crucial genes encoding kinases, transcription factors (TF) and enzymes responsible for cell wall formation. These findings suggest that the control of seed size in lentils operates through the regulation of cell division, involving both cell expansion and the overall seed growth [29]. In a recent transcriptomic analysis of lentil embryos, seed coats and whole seeds, specific genes and co-expressed gene sets were found to be prevalent in distinct tissues and developmental stages, distinguishing the expression patterns of the embryo from those of the seed coat [30].The availability of the current lentil’s genome assemblies that include the cultivated lentil (Lens culinaris) and the wild relative (Lens ervoides) has facilitated the potential to gain knowledge regarding mechanisms regulating even complex traits [22].
Evidence supporting the significance of seed coat hardness in the quality of lentil products and, consequently, their market value [31] underscores the critical need to explore the factors governing tannin accumulation in lentil seeds, as tannins are the primary determinants of seed coat hardness [9,32]. As hard seed coat appears to be determined both by genetic and environmental factors [7], to gain a better understanding of this phenomenon, it is crucial to examine the lentil’s innate molecular mechanisms that control tannin production, such as the seed maturity stage, but also the effect of environmental features such as P, a principal nutrient involved in many metabolic processes. This study examined the impact of P and the seed maturity stage on both the overall gene expression patterns and those of the phenylpropanoid genes in lentil, the pathway responsible for tannin biosynthesis. Insights derived from this study may have the potential to provide a plausible explanation for differences in seed coat hardness within the same lentil variety stemming from differences in P fertilization levels. These findings can inform innovative agricultural strategies designed to enhance lentil product quality.
2. Materials and Methods
2.1. Plant Material
The experiment was established in a greenhouse located at the Farm of Aristotle University of Thessaloniki, Greece. In this work, the studied Greek cultivated variety “SAMOS” was retrieved from a germplasm collection from the Institute of Plant Breeding and Genetic Resources (IPBGR), Thermi, Thessaloniki, Greece. “SAMOS’’ is a variety that reportedly exhibits variation in seed coat hardness, which presents inconsistency from one growing season to another. The experiment was established in a glass greenhouse heated by a natural gas air heater to maintain the temperature at a stable 25 °C (±1 °C). The relative humidity was 55–60%, while the greenhouse ventilation was maintained by three air circulation fans. No technical light was applied, therefore the daylight duration varied depending on the season. The sowing was conducted in the early days of January and the lentil plants fulfilled their circle of life by the middle of July. Three pots with six plants per pot were used for sowing, containing 10 L of peat and perlite in a 3:1 ratio. Granular P fertilizer (P2O5) was incorporated into the pots prior to sowing. In the first treatment (P0), which was used as the control, 6 mg kg−1 of P fertilizer was added, in the second treatment (P1) 15 mg kg−1 was added and in the third treatment 21 mg kg−1 of P fertilizer was applied (P2). More specifically, in the P2 treatment, the 15 mg kg−1 was incorporated before sowing, while the remaining 6 mg kg−1 of P fertilizer was applied at the beginning of the flowering days. Lentil pod samples were collected in three successive maturity stages of the seed. Sampling of lentil plant tissue (pods including the seed) was carried out according to three different seed maturity stages and three samples (replicates) from each stage were taken. The first stage (S1) was while the seed was immature and flat inside the pod at approximately 2 mm in size and barely visible, the second stage (S2) was while the seed was at its full size and completely mature inside the pod, and the third stage (S3) was when the seed was completely mature during the pod’s discoloration from green to brown, meaning a few days before the harvesting time and threshing of the seeds.
2.2. RNA Sequencing Procedure and Data Analysis
2.2.1. Total Ribonucleic Acid (RNA) Extraction and Library Construction for RNA Sequencing
Total ribonucleic acid (RNA) was extracted from the 27 samples (1 genotype × 3 P treatments × 3 maturity stages × 3 biological replicates) using the Monarch® Total RNA Miniprep Kit (NEB #T2010), and the concentration was evaluated by Qubit 4.0 Fluorometer instrument and the RNA BR Assay Kit reagent (Invitrogen, Carlsbad, CA, USA). The Nucleic acid integrity and the ratio of 25 S/18 S ribosomal molecules (rRNA) were determined by the Fragment analyzer system, Agilent (Reagent code DNF-471). The accepted-to-proceed samples were within acceptable qualification limits according to the literature (plants > 6.5 RIN). Library preparation was performed with NEBNext® Ultra™ II RNA Library Prep Kit for Illumina (NEB#7770 and 7775 mRNA selection) according to the manufacturer’s instructions, with an approximate fragment size of 420 base pairs (bp) as input in the final library. The 5400 Fragment Analyzer (Agilent, DNF-91, Santa Clara, CA, USA) was used to estimate the size of the libraries through capillary electrophoresis, and it was established that the fragment size of the two pooled sample groups was on average 419 bp and 448 bp, respectively. Finally, the libraries were quantified with qPCR using the KAPA Library Quantification Kit for Illumina® sequencing platforms (#KK4824, Roche, Basel, Switzerland) on a Rotor-Gene Q thermocycler (Qiagen, Hilden, Germany). The constructed Libraries were eventually sequenced on the Illumina® NextSeq® platform using the NextSeqR 500/550 v2.5 High Output Kit (300 cycles) (#20024908, Illumina, San Diego, CA, USA). The sequencing procedure for the NextSeq™ 500 Sequencing System (Illumina, San Diego, CA, USA) includes the high Output Flow Cell with a capacity of up to 400 M reads, a Read Length of 2 × 150 base pairs, and a final Output of 150–200 Gb.
2.2.2. Data Preprocessing and Quality Control
Raw sequencing data in FASTQ format were subjected to initial quality control using FASTQC v0.11.9 and MULTIQC v1.12 [33]. Trimmomatic [34] was employed to remove adapter sequences, ambiguous bases and low-quality sequences (q-score < 30). After this preprocessing, the remaining high-quality reads were used for downstream analysis.
2.2.3. Read Alignment and Quantification of Gene Expression
The preprocessed reads were aligned to the reference genome of Lens culinaris (Lcu.2RBY v.2.0) available in Phytozome v.13. STAR software [35] was employed for this purpose, encompassing read alignment, splice junction identification and merging of overlapping reads (the threshold for multiple alignments allowed for a read was set to 10). Gene expression levels were quantified using FeatureCounts [36], which tallied the number of paired-end reads mapped to gene-level meta-feature. The multi-mapping and multi-overlapping reads were excluded. This resulted in a count matrix, which served as the basis for subsequent analyses.
2.2.4. Differential Expression Analysis
Differential expression analysis was carried out using the DESeq2 package (v1.39.5) from Bioconductor [37], applying negative binomial generalized linear models and Wald test for p-values. A pre-filtering step was performed to keep only genes that had a count of at least 10 (default value for bulk RNA-seq) for 3 samples (the smallest group size). Significantly differentially expressed genes (DEGs) were identified based on the following specific criteria: (A) adjusted p-value ≤ 0.05 and log2(fold-change) ≥ 1 (upregulated genes) and (B) adjusted p-value ≤ 0.05 and log2(fold-change) ≤ −1 (downregulated genes). This stringent analysis enabled the identification of genes with significant expression changes under the experimental conditions compared to the control.
2.2.5. Gene Set Enrichment Analysis (GSEA)
To gain deeper insights into the biological implications of DEGs, we performed Gene Set Enrichment Analysis (GSEA) for both Gene Ontology (GO) and Kyoto Encyclopedia of Genes and Genomes (KEGG) pathway analysis. Oryza sativa (ssp. japonica) was used as the background organism for GSEA. Enriched GO terms and KEGG pathways were identified using the Plant GeneSet Annotation Database’s GSEA tools using the hypergeometric statistical test method and the Benjamini–Hochberg multi-test adjustment method with a significance level of 0.05. (http://systemsbiology.cau.edu.cn/PlantGSEAv2/analysis.php (accessed on 9 September 2023)).
2.3. Quantitative Reverse-Transcriptase PCR for RNA Sequencing Results Validation (RT-qPCR)
To validate the RNA sequencing results of the DEGs, quantitative RT-qPCR was performed. The primers for RT-qPCR were designed with the PrimerQuest Tool by Integrated DNA Technologies (https://www.idtdna.com/PrimerQuest/Home/Index (accessed on 2 September 2023)) [38], and the eligibility of primers was tested with the NetPrimer tool by PREMIER Biosoft (http://www.premierbiosoft.com/NetPrimer/AnalyzePrimer.jsp (accessed on 2 September 2023)) to avoid the formation of unwanted structures like hairpins and self and cross dimers in the designed product, while ensuring melting temperatures with a difference of up to 5 degrees Celsius for both forward and reverse primers. The designed primer pairs were the following: for F’3H forward 5′GAGCATCTCCAATTCCTTCC3′ and reverse 5′TTTGGCGTGGATTTGAGG3′, for DFR forward 5′TCAGCATACACCAATTCAAGTTTC3′ and reverse 5′CTCATTACGAGCCACGATCC3′, for bHLH forward 5′AACCATGTCCTCGCTGA3′ and reverse 5′CTCTATCGTGTCGCCTAAGA3′ and for actin forward 5′GAACTGGGTGTTCTTCTGGG3′ and reverse 5′GCTGGATTTGCTGGAGATGA3′. Samples were diluted with nuclease-free water and 2 μL of the diluted RNA was used per reaction in RT-qPCR which was performed using the Luna® Universal One-Step RT-qPCR Kit (NEB #E3005). Three biological replicates and three technical replicates were used, and the conditions for the RT-PCR were 1 cycle of 55 °C for 10 min, 1 cycle for the initial denaturation of 95 °C for 1 min, 40 cycles of 95 °C for 10 s for denaturation, 58 °C for 30 s for extension, with an additional stage of High-Resolution Melting to generate the melting curves according to LighCycler96® (Roche) Instrument 95 °C for 60 °C s, 40 °C for 60 s, 65 °C for 1 s and 95 °C for 1 s. Relative quantification analysis was conducted and the results were analyzed using the built-in tools of the LighCycler96® instrument (software version v 1.1). Actin was used as a reference gene and the Ct values obtained from RT-qPCR revealed the relative expression of each gene compared to actin’s levels of expression by the Livak Method (2−ΔΔCT) [39].
3. Results
3.1. RNA Sequencing Data Analysis
Approximately 599 million pair-end reads were generated from the RNA sequencing procedure. To ensure data quality, we filtered out nearly 397 thousand reads, and subsequently, 450 million reads in total were aligned, among which about 346 million reads were unique. The read quantification procedure resulted in a count table, in which an average of 75% of total aligned reads were assigned to gene level meta-features. Unassigned read counts due to ambiguity, multi-mapping, multi-overlapping or not matching any gene feature were close to 225 million. The average GC percentage was 43% and the number of the overall produced sequences was 2,098,494,262 sequences (Table 1 and Figure 1).

Table 1.
Summarized report for all the samples per seed maturity stage (S1, S2 and S3) in each P treatment (P0, P1 and P2) from data obtained from the MultiQC report following RNA sequencing procedure.
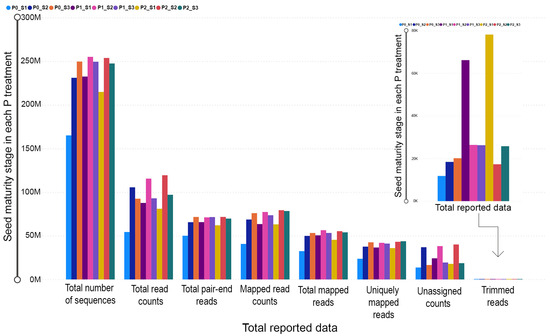
Figure 1.
The bar chart indicates the differences among the pod maturity stages (S1, S2 and S3) in each P treatment (P0, P1 and P2) from the summarized data obtained from the MultiQC report following RNA sequencing procedure.
3.2. Differential Gene Expression Analysis
To investigate the P impact on the gene expression across the different seed maturity stages, the following comparisons were conducted; S1–S2, S1–S3 and S2–S3. Regarding the P treatments, when comparisons were made, the P0 was used as the control treatment. Analysis of differential gene expression unveiled a grand total of 83,840 DEGs (DEGs) across all three P treatments, with 19,894 of these being unique. Within each P treatment group, we identified the following numbers of total DEGs and unique DEGs: the P0 treatment had 29,388 total DEGs and 15,680 unique DEGs; the P1 treatment had 28,313 total DEGs, with 15,218 unique DEGs; and the P2 treatment had 26,139 total DEGs, of which 14,385 were unique (Table 2).
Table 2.
The table represents the number of genes and the number of unique genes that were found in each P treatment.
Of the total 19,894 unique genes, 2432 were only identified in the P0 treatment, 1375 were found in P1, and 1099 in P2, while all three treatments shared a common 10,401 DEGs (Figure 2). The comparison between the S1 and S3 in the P0 treatment (S1–S3) retained the highest numbers of upregulated and downregulated DEGs, having 8044 downregulated and 4680 upregulated, while the lowest in-rank DEGs were revealed in P2 treatment between the first seed maturity stage and the second (S1–S2), with 3074 down-regulated and 1943 up-regulated DEGs (Figure 3 and Table 3).
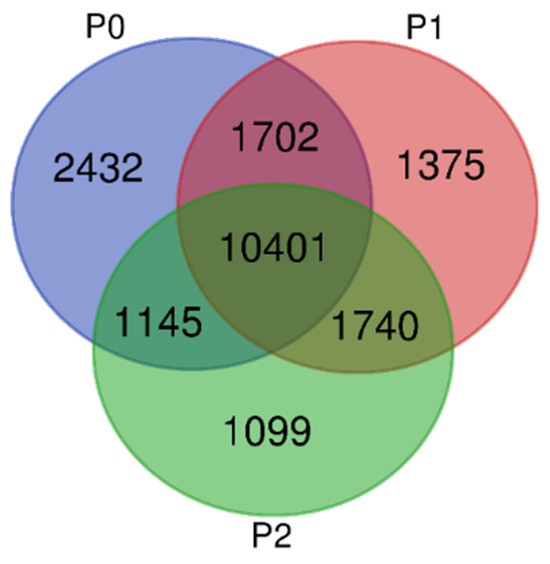
Figure 2.
Venn diagram depicting the total and the unique genes that were found among the three P comparisons.
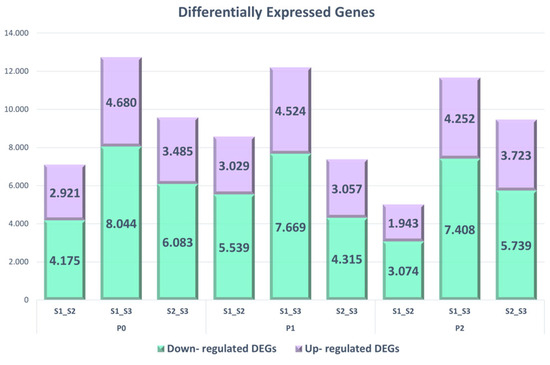
Figure 3.
The bar chart indicates the upregulated and downregulated genes that were found to be differentially expressed with |log2(fold-change)| ≥ 1 and adjusted p-values < 0.05.
Table 3.
Total upregulated and downregulated genes were found to be significantly differentially expressed (|log2(fold-change)| > 1, adjusted p-values < 0.05).
3.3. Expression Dynamics under Different P Treatments and Different Seed Maturity Stages
The differential gene expression analysis was conducted by implementing hierarchical clustering with Euclidean distance metric on DEGs with expression levels of −1 ≥ log2(fold-change) ≥ 1, while also ensuring their significance using an adjusted p-value ≤ 0.05; this was visualized using heatmaps of their expression levels. Firstly, the differential expression of significant genes was analyzed for each P treatment separately, showcasing the DEGs’ expression patterns among the three seed maturity stages (Figure 4). The expression patterns of the DEGs appear to be similar in the P0 and P2 treatments, while the expression patterns in the P1 treatment differ. This observation suggests that an intermediate P dosage may have a more substantial impact than a higher dosage. Based on the individual P treatment heatmaps, in all three treatments, it is observed that the seed maturity stage is an important factor that affects DEG expression. Secondly, the differential expression of the significant genes was analyzed in all three P treatments and seed maturity stages simultaneously. According to the overall heatmap, there is no particular clustering pattern of DEGs. The effect of the seed maturity stage on DEGs’ patterns implies that this factor plays an essential role in lentil genes’ expression.
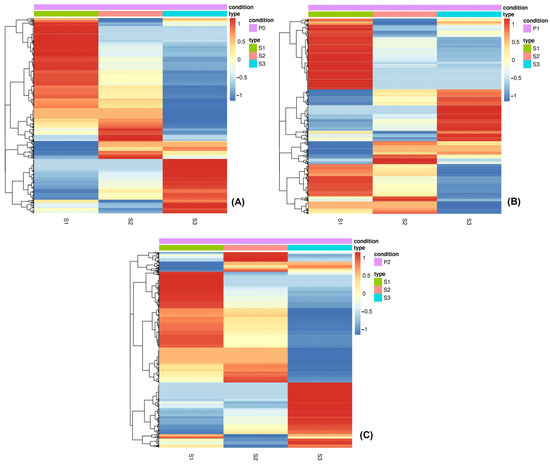
Figure 4.
Individual heatmaps outlining the DEGs (DEGs) in P0 (A), P1 (B) and P2 (C) conditions. The expression is reported in log2(fold change) with z-score normalization. The hierarchical clustering was performed utilizing the Euclidean distance metric, and the clustering method includes the DEGs with expression levels in terms of −1 ≥ log2(fold-change) ≥ 1, while also ensuring their significance using a cut-off of an adjusted p-value ≤ 0.05. DEGs were clustered together according to seed maturity stage (S1, S2 and S3), and the z-scores from 1 to −1 indicate the intensity linked with normalized expression. The darker the red color is, the more upregulated the genes are, and the darker the blue, the more downregulated the genes are.
There are some areas (Elements 1–5 Figure 5) on the heatmap though, regarding the comparisons S1–S3 and S2–S3, that showcase the influence of the P treatment on the expression of certain groups of DEGs. Ιn Element 1 in P0, the DEGs were mainly downregulated, but in P1 and P2, their expression levels increased. In Element 2, DEGs were mostly upregulated in P0, but their expression in P1 decreased while in P2 there were significantly more downregulated DEGs. In Elements 3 and 4, the DEGs appeared to be mostly upregulated in P0, with a gradual decline in their expression in P1 and P2. Element 5 exhibited either a downregulation or non-significant expression in P0 that increased in P1 and P2 with a notable upregulation in P1 in comparison to S2–S3. The expression patterns observed in both the overall heatmap and the individual heatmaps demonstrate that the seed maturity stage plays a significant role in influencing gene expression.
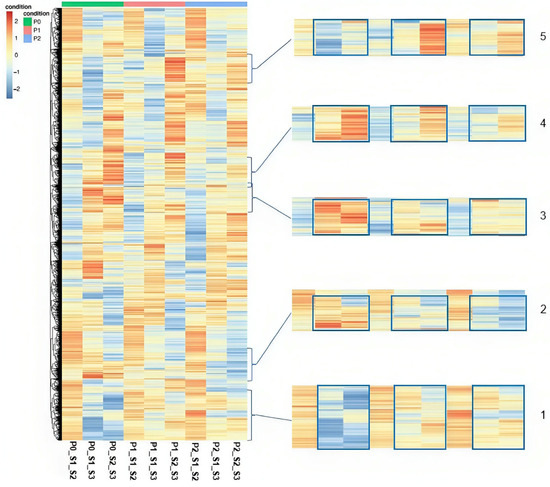
Figure 5.
Overall Heatmap illustrates the DEGs (DEGs) in all comparisons among the seed maturity stages in all three P treatments. Hierarchical clustering with Euclidean distance and normalized counts with z-scores. DEGs are considered the genes with −1 ≥ log2(fold-change) ≥ 1 and adjusted p-value ≤ 0.05.
3.4. Functional Analysis of DEGs, GSEA and KEGG Pathways Analysis
In GO analysis a total of 37,653 DEGs were enriched, among which 14,393 DEGs were upregulated and 23,260 DEGs were downregulated. As far as P treatments are concerned, 5297 upregulated and 1471 downregulated DEGS were found in the P0 treatment, 4689 upregulated and 2242 downregulated DEGs were found in the P1 treatment, and 4407 upregulated and 792 downregulated DEGs were found in P2. The number of GO terms for each comparison made among the different seed maturity stages is shown in Table 4. GO analysis indicated the top 15 enriched GO terms according to the 3 GO domains: molecular function, biological process and cellular component (Figure 6, Table 4 and Table S1).
Table 4.
Total GO terms found for the upregulated and downregulated genes in each condition.
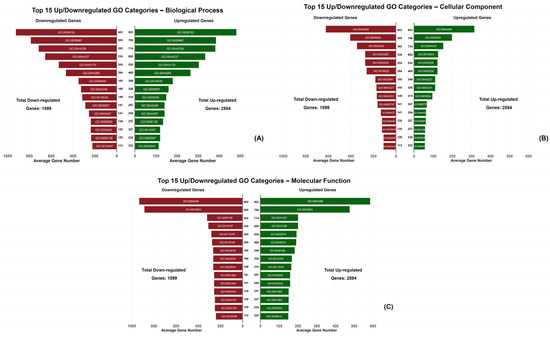
Figure 6.
The butterfly charts indicate the number of upregulated and downregulated DEGs corresponding to the top 15 GO terms in each GO category (biological process (A), cellular component (B) and molecular function (C)).
GO terms and annotations were investigated to identify changes in enriched DEGs that are related to processes that are either determined or affected by P. These changes were studied in the comparisons among the seed maturity stages in each P treatment. A notable finding is that the most enriched DEGs in the GO terms related to P were mainly downregulated and, in most annotations, the highest number of DEGs belonged to the S1–S3 comparison. For instance, in “phosphorus metabolic process” (GO:0006793) and “phosphate-containing compound metabolic process” (GO:0006796) the number of both upregulated and downregulated enriched DEGs appeared to be perceptibly higher in S1–S3 comparison in all three treatments. Similarly, within the categories of “organophosphate metabolic process” (GO:0019637), “phosphorylation process” (GO:0016310) and “phospholipid metabolic process” (GO:0006644), all of which fall under the broader “phosphorus metabolic process”, a notable trend emerged with a significant predominance of downregulated DEGs, which was particularly evident in the S1–S3 comparison. In “phosphorus metabolic process”, “phosphate-containing compound metabolic process” and “phosphorylation”, a progressive decrease was observed in the total number of downregulated DEGs from P0 to P2, while in “organophosphate metabolic process” and “phospholipid metabolic process” a fluctuation was observed and the most DEGs were found in the P1 treatment. GO enrichment analysis was implemented to further investigate the biological processes, molecular functions and metabolic pathways associated with the genes found within the highlighted regions (Elements 1–5) in Figure 5’s heatmap. The results of GO enrichment analysis unveiled significant gene associations across various areas of the heatmap. In the biological process domain, predominant gene categories encompassed “macromolecule metabolic process” (GO:0043170), “nitrogen compound metabolic process” (GO:0006807) and “biological regulation” (GO:0065007). Additionally, “localization” (GO:0051179) featured prominently across all heatmap areas except Element 3, while “phosphorylation” (GO:0016310) was detected specifically in Elements 1 and 5. Within the molecular function domain, genes were primarily classified into “nucleotide binding” (GO:0000166), “hydrolase activity” (GO:0016787) and “protein binding” (GO:0005515). Noteworthy categories included “transferase activity” (GO:0016740) in Elements 1, 3 and 4, “oxidoreductase activity” (GO:0016491) in Elements 1, 4 and 5, “transporter activity” (GO:0005215) in Elements 2 and 5, and “ion binding” (GO:0043167) across all Elements except Element 2. While delving into more specific GOs, several intriguing terms emerged. “Methyltransferase activity” (GO:0008168) was evident in Elements 1, 3 and 4, while “heat shock protein binding” (GO:0031072) was selectively identified in Elements 1 and 3. “GTP binding” (GO:0005525) exhibited widespread representation across Elements 1, 2, 3 and 5, while “pyrophosphatase activity” (GO:0016462) spanned Elements 2, 3, 4 and 5. Elements 2 and 3 prominently featured “cellular response to stress” (GO:0033554), Elements 1 and 5 displayed “signal transduction” (GO:0007165) and “pigment biosynthesis process” (GO:0046148) was notably associated with Element 1. These findings hold significance for potential inclusion in further research.
The KEGG pathway analysis showed the top 30 pathways under the different P treatments (Figure 7). Among the upregulated DEGs, the pathways that demonstrated the highest number of enriched DEGs were the spliceosome pathway in the P0 treatment, protein processing in the endoplasmic reticulum pathway in the P1 treatment, and the ribosome pathway in the P2 treatment. The pathways with the highest enrichment factor were the ribosome biogenesis in the eukaryotic pathway for the P0 treatment, and the alpha linolenic acid metabolism in the P1 and P2 treatments. Among downregulated DEGs, the ribosome pathway consistently exhibited the highest number of DEGs. The pathways with the highest enrichment factor were the photosynthesis pathway in the P0 treatment, the DNA replication pathway in the P1 treatment, and the photosynthesis-antenna protein pathway in the P2 treatment.
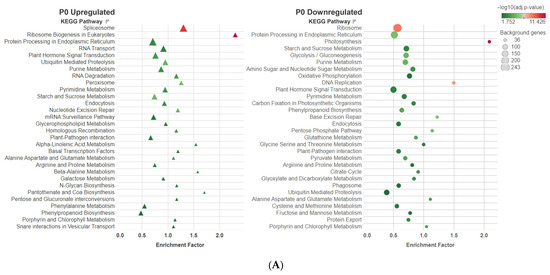
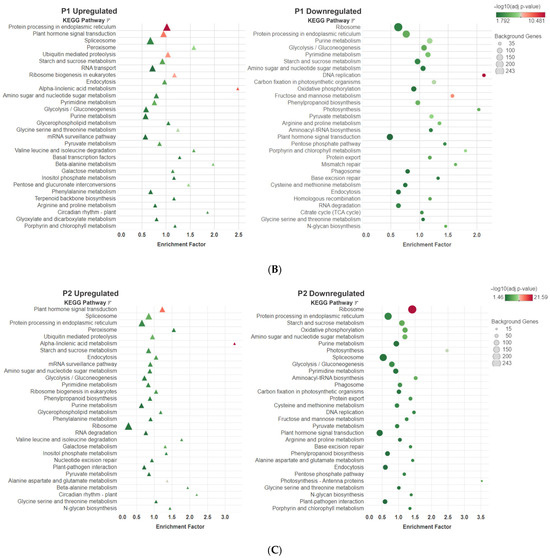
Figure 7.
The bubble plots represent the KEGG pathways in each P treatment ((A) P0, (B) P1 and (C) P2) where the upregulated and downregulated DEGs were found. The X-axis represents the enrichment factor (DEGs enriched in a pathway/genes of all genes in the background gene set). The Y-axis represents the biosynthetic pathway, the size of the bubble indicates the amount of the DEGs and the color depends on the significance of the enrichment expressed in the −log10(q-value).
KEGG pathway analysis was also carried out to investigate the DEGs found within the highlighted regions (Elements 1–5) in Figure 5’s heatmap. The analysis unveiled the most enriched pathways associated with the genes of interest. Notable among these pathways is the ribosome, which prominently emerged in Elements 1, 2 and 4. Elements 1 and 5 displayed enriched activity in the starch and sucrose metabolism pathway. Meanwhile, Element 3 exhibited distinct enrichment in the spliceosome pathway and Element 1 showcased involvement in the photosynthesis pathway.
Among the most significant findings, was that in the P0 treatment, 6 upregulated and 16 downregulated DEGs were found to be related to the phenylpropanoid biosynthesis pathway, while 3 upregulated and 5 downregulated DEGs to were related to flavonoid biosynthesis. In the P1 treatment, 18 downregulated DEGs were identified in the phenylpropanoid pathway while 3 upregulated and 7 downregulated DEGs were detected in the flavonoid biosynthesis pathway. In the P2 treatment, 9 upregulated and 13 downregulated DEGs belonged to the phenylpropanoid pathway and 4 upregulated and 7 downregulated DEGs belonged to flavonoid biosynthesis (Table S2).
3.5. Transcriptional Regulation of Phenylpropanoid Pathway and Tannin Metabolism Regulation Genes
Further analysis was conducted, focusing on the genes (Table 5) of interest in the phenylpropanoid biochemical pathway as summarized in Figure 8, in order to explore the relationship between their expression patterns.
Table 5.
The table represents the genes that are expressed in key positions in the phenylpropanoid pathway, and they were studied further for their role in the pathway and their impact on tannin biosynthesis. The Lcu ID represents the identification code for each gene retrieved from Phytozome v.13 from the Lens culinaris reference genome (Lcu.2RBY v.2.0).
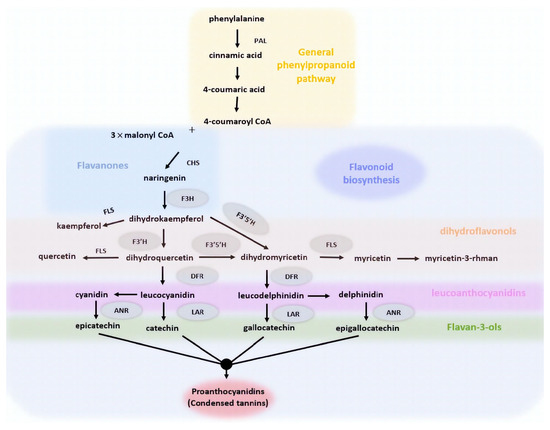
Figure 8.
Schematic illustration of the phenylpropanoid pathway leading to tannin formation in the lentil seed coat. The pathway demonstrates all the intermediate interventions of the enzymes contributing to proanthocyanidins biosynthesis. Abbreviations: PAL, phenylalanine ammonia lyase; CHS, chalcone synthase; F3H, flavanone-3-hydroxylase; F3′5′H, flavonoid-3′,5′-hydroxylase; FLS, flavonol synthase; DFR, dihydroflavonol 4-reductase; ANR, anthocyanidin reductase; and LAR, leucoanthocyanidin reductase.
The expression levels of the selected genes belonging to the phenylpropanoid pathway were further studied. F3H expression was upregulated in S1–S2 and S1–S3 but downregulated in S2–S3. Statistically, it was significant only in the P0 treatment. F3′H expression showed a downregulation in all P treatments except for the S2–S3 comparison in P1 and P2 treatments where it was not statistically significant. A similar pattern was observed for F3′5′H expression levels. DHM expression was downregulated and statistically significant only in S1–S3 and S2–S3 of the P0 treatment. DFR expression was downregulated in all conditions except for the S2–S3 comparison in P0 and P1 treatments where it was not statistically significant. bHLH expression was downregulated in all comparisons except for the S2–S3 comparison in P1 and P2 treatments where significance was not observed. FLS expression was upregulated in all comparisons except for the S1–S2 in both P1 and P2 treatments where it was not statistically significant. Notably, LAR and ANR expressions were significantly downregulated in all P treatments when comparing S1–S3. As indicated in the volcano plots (Figure 9), the majority of the genes of the phenylpropanoid pathway are downregulated. The comparison S1–S3 reveals genes with the most pronounced downregulated expression, followed by the S1–S2 comparison and then the S2–S3 comparison, in descending order of downregulation intensity (Table S3). The top five downregulated genes in the phenylpropanoid pathway are F3′H, bHLH, F3′5′H and DFR, all of which belong in the P0 treatment and S1–S3 comparison, and F3′H that belongs in the P1 treatment and S1–S3 comparison (Figure 9).
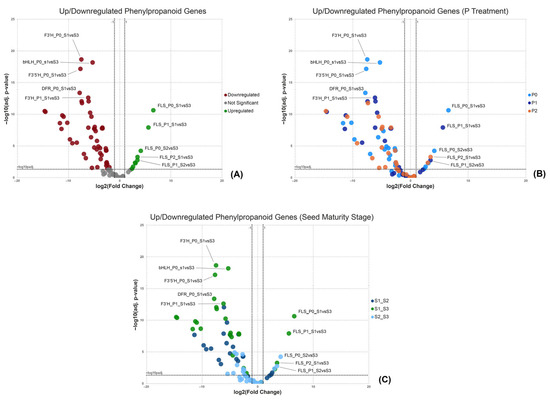
Figure 9.
Volcano plots demonstrate the upregulated and downregulated DEGs related to the phenylpropanoid pathway. (A) Total DEGs related to the phenylpropanoid pathway, (B) DEGs among the P treatments considering the P0 as the control condition and (C) DEGs among the pod maturity stages in each P treatment considering the S1 as the control stage. X-axis: −log10(q-value) and Y-axis: −log10(0.05).
Hierarchical clustering, employing Pearson correlation, was applied to normalized count data in order to create a heatmap visualizing the expression patterns of selected phenylpropanoid pathway genes across the samples. In S1, all the studied genes were highly expressed, except for F3H, FLS and DHM. FLS displayed the lowest expression, followed by F3H. Meanwhile, DHM’s expression, at least in this seed maturity stage, seemed to be influenced by the P treatment, with a decrease observed in the P1 and P2 treatments compared to P0. In S2, the expression of all genes was generally low across all three P treatments, except for F3H, which exhibited higher expression levels in all three P treatments, with the most notable expression observed in P0. In S3, a low expression pattern was evident in both P0 and P1 for most genes, with the exception of the FLS gene, which displayed a significantly increased expression. In P2, the expression of FLS decreased to moderate levels, while an increase in F3H expression was observed. The seed maturity stage had a substantial influence on the expression of the phenylpropanoid pathway genes, as the majority of these genes were found to be highly expressed in S1 but not in S2 or S3. In contrast, P levels in the treatments appeared to affect only specific genes within the pathway (Figure 10).
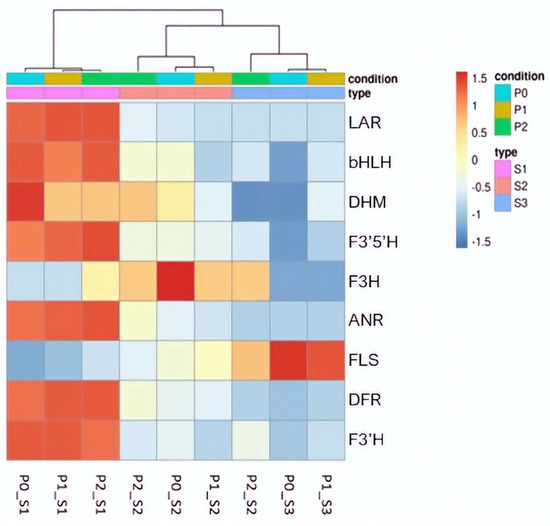
Figure 10.
Heatmap illustrating the DEGs of the phenylpropanoid pathway that were found in key positions in the pathway, and the alterations in their expression determine the proanthocyanins accumulation in the seed. Hierarchical clustering with Pearson correlation and normalized counts indicates the impact of seed maturity stage and P treatment in these genes of the pathway.
3.6. Validation of the Key Genes in the Phenylpropanoid Pathway by RT-qPCR Analysis
RNA sequencing expression data were validated through RT-qPCR for four selected genes that seem to have a key role in the phenylpropanoid biochemical pathway. The log2(fold-change) expression values of the selected genes (bHLH, F3′H, DFR and DHM) when compared to the log2(fold-change) expression data derived from RNA sequencing, were found to be in accordance (Figure 11). The expression of the majority of the selected genes demonstrates a downregulation pattern across all treatments, with the most pronounced downregulation observed in the S1–S3 treatment. Regarding the bHLH TF, the most substantial downregulation is in the S1–S3 comparison in the P0 treatment and in the S1–S2 in the P1 and P2 treatment. The expression of F3′H is remarkably downregulated in the S1–S2 in the P0 and P1 treatments and in the S1–S3 in the P2 treatment. The expression of DFR in the S2–S3 is upregulated in all three treatments, while the most prominent downregulation is observed in S1–S2 in the P2 treatment. The DHM gene exhibited its most substantial downregulation peak in the S1–S3 treatment.
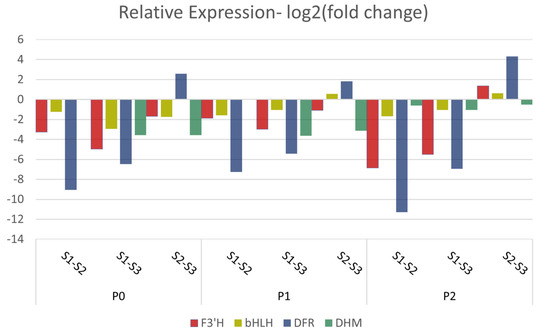
Figure 11.
RT-qPCR showing the relative expression of F3′H, bHLH, DFR and DHM between the S1 and S2 and the S1 and S3 stages, using S1 as control, and between the S2 and S3 stages, using S2 as the control, in all three P treatments.
4. Discussion
Lentil is one of the earliest domesticated species and one of the most consumed pulses, especially in the Mediterranean territory. One of the key elements in enhancing lentil crop productivity and ensuring its successful adaptation is optimal P fertilization. As reported in other studies, low soil productivity in cultivated areas is frequently linked to P deficiency. Unlike nitrogen, which can be introduced into the soil through nitrogen-fixing bacteria in the roots of leguminous plants like lentil [40], atmospheric microbes cannot augment P availability. The incorporation of P in the soil has been noted to enhance the microbial population, biomass and the activity of certain enzymes in the soil, collectively contributing to an increase in soil respiration, which is a desirable soil trait for improving the overall soil productivity [41]. In the context of lentils, the addition of P in the right doses is essential to achieve the anticipated crop yield [42]. Vital biological activities such as nodulation, nitrogen fixation and nutrient absorbance from the soil and the environment of the rhizosphere all require P sufficiency [19]. Adequate P in soil promotes the lateral root length and the total root mass. This is one of the mechanisms that ensures lentil plants’ adaptation to P deficiency conditions since the plants are forced to search for water and nutrients in deeper soil layers [43].
In this study, the lower P treatment (P0) presented the highest number of unique and total DEGs. The differential expression analysis of genes did not demonstrate any particular clustering pattern in the different P treatments but revealed some groups of DEGs within noted areas in Figure 5’s heatmap (Elements 1–5) that appear to be influenced by the level of P fertilization. The utilization of GO enrichment analysis and KEGG pathway analysis facilitated a comprehensive examination of these DEGs, and their expression patterns appear to be influenced by the different levels of P fertilization. Through the analysis, the involvement of the DEGs in specific biological processes and molecular functions was elucidated, thereby enhancing the scientific understanding of their functional roles. The genes of interest that were found within the highlighted regions (Elements 1–5) in Figure 5’s heatmap, primarily fall within biological processes associated with macromolecule metabolism, nitrogen compound metabolism, biological regulation and localization. Their molecular functions encompass enzyme activities such as hydrolases, transferases and oxidoreductases, as well as roles such as transporter proteins and binding-associated functions.
The analysis of DEGs possibly influenced by P levels yielded intriguing findings within more specific GOs, revealing genes closely associated with stress signaling, abiotic and biotic stress resistance, and gene and protein regulation. Terms that evidently support the genes’ connection to stress signaling are “signal transduction” (GO:0007165), “response to biotic stimuli” (GO:0009607), “cellular response to stress” (GO:0033554), and “heat shock protein binding” (GO:0031072). Plant heat shock proteins are widely recognized for their crucial role in enhancing abiotic and biotic stress tolerance, which constitutes an integral part of the plant’s defense mechanism [44]. According to the bibliography, in low P conditions, plants activate certain signaling and stress-related pathways that include the expression of phosphatases, MAP kinase, protein kinases, purple acid phosphatases (PAPs), S-glutathione transferases and the PHT1 family, which is comprised of phosphate transporters in order to improve P transport and utilization [45].
The term “pyrophosphatase activity” (GO:0016462) is linked to plant growth, development and stress tolerance. Pyrophosphatases, a class of enzymes, play a vital role in catalyzing the degradation of pyrophosphate. This enzymatic process provides plants with essential energy, particularly in low-oxygen conditions when ATP synthesis is not feasible [46]. The data exhibited a decrease in the expression of genes linked to “cellular response to stress”, and “pyrophosphatase activity” as the levels of P fertilization increased. This observation implies that lower P levels may serve as a stressor, leading to the activation of stress-related genes.
The term “GTP binding” (GO:0005525) is also pertinent to signaling, as GTP-binding proteins, particularly the Rop GTPase family, participate in the regulation of numerous biological processes by utilizing an on/off mechanism. These processes include signal transduction, cell polarity, cell shape, hormone responses and pathogen defense [47].
The terms “methylation” (GO:0032259) and “methyltransferase activity” (GO:0008168) are linked to the regulation of gene activity while “phosphorylation” (GO:0016310) is connected to the regulation of protein activity. Notably, DNA methylation, an epigenetic mechanism mediated by methyltransferases, plays a pivotal role in controlling gene expression, thereby influencing processes related to growth, development and stress tolerance in plants [48]. In accordance with the study of Chu et al., where it was observed that in soybean that low P conditions increased the level of DNA methylation [49], the results showed that the expression levels of genes that belong to the ”methyltransferase activity” function decreased in higher P treatments. An elevated expression of these genes under low phosphorus (P) conditions may indicate increased methylation levels, which are associated with broader gene regulatory processes. Over the past decade, the concept of “epitranscriptomics” has gained prominence, drawing significant attention from the scientific community. Researchers have increasingly focused on post-translational modifications of RNA, particularly RNA methyl modifications, which exhibit a strong correlation with plant survival and fitness [50].
Meanwhile, phosphorylation serves as a fundamental reversible mechanism for post-translational modifications that govern protein activity and its interactions with other molecules. This biological process is mediated by kinases that introduce phosphate groups to proteins, while phosphatases control dephosphorylation by removing these phosphate groups. This reversible system functions as a signal transduction mechanism and has been conclusively demonstrated to hold significant importance in the regulation of phytohormones and the enhancement of cold stress tolerance [51].
Through the analysis, several genes have been uncovered and identified that are associated with GO terms such as “GTPase activity” (GO:0003924), “small GTPase regulator activity” (GO:0005083), “methyltransferase activity” (GO:0008168), “heat shock protein binding” (GO:0031072), “pyrophosphatase activity” (GO:0016462), “kinase activity” (GO:0016301) and “phosphatase activity” (GO:0016791). In the current context of climate change, genes linked to stress signaling and stress tolerance, and in this case genes whose expression correlates with the extent of P fertilization, hold significant potential as promising candidates for further investigation. Such research endeavors may yield valuable outcomes that can be applied to breeding programs and the development of effective cultivation techniques.
Moreover, P fertilization seems to affect the seed coat properties, without causing any anatomic alterations in the seed [52]. One of the most decisive traits for the market value of lentils is their seeds’ physical properties. Seed coat hardness is considered a limiting factor for farmers and consumers. Hardness is attributed to the pigment and, mainly, tannin (proanthocyanidins) accumulation that happens from the embryo development in the seed right after fertilization [53].
The results from the differential expression analysis showed that the expression patterns observed in both the overall heatmap and the individual heatmaps demonstrate that the seed maturity stage plays a significant role in influencing gene expression. GO enrichment analysis highlighted that the S1–S3 comparison exhibited, in most cases, the greatest number of upregulated and downregulated genes in GO terms associated with phosphorus metabolic processes. More precisely, this is confirmed in annotations like “phosphorus metabolic process” (GO:0006793) and “phosphate-containing compound metabolic process” (GO:0006796) in all three P treatments. An additional noteworthy observation from the GO analysis, particularly within the annotations related to the “phosphorus metabolic process”, is that the majority of enriched DEGs were found to be in a downregulated state.
Functional analysis of the DEGs by GO analysis revealed that the majority of DEGs related to P metabolic processes mainly consist of downregulated genes in all three P treatments. The influence of P in the downregulated DEGs was observed in the annotations “phosphorus metabolic process”, “phosphate-containing compound metabolic process” and “phosphorylation” as the total number of downregulated DEGs decreased while the level of P fertilization increased. According to studies, lentils’, faba beans’ and peas’ increased yield has been ascribed to higher P fertilization [54]. On the other hand, P deficiency induces the increase in certain phenolic substances in all the vegetative parts of the lentil plants [21]. Lentil, like other legumes, has a high demand for P for both seed quality and plant growth [43], and unpublished data from our team certainly confirms this statement.
Through KEGG pathway analysis it was observed that among the upregulated DEGs, the following pathways exhibited the highest number of enriched DEGs: the spliceosome pathway for the P0 treatment, the protein processing in the endoplasmic reticulum pathway for the P1 treatment, and the ribosome pathway for the P2 treatment. In the case of downregulated DEGs, it was consistently observed that the ribosome pathway had the highest number of DEGs across all treatments.
RNA sequencing results were investigated further to reveal how the P treatment and the seed maturity stage inside the pod influence the expression levels of specific genes in the phenylpropanoid pathway. The selected genes seem to be highly expressed in S1, slightly less expressed in S2 and even less expressed in S3. This indicates that the gene expression decreases as the seed matures, while the expression levels remain unaffected by P treatments. The developmental stage appears to be a crucial factor affecting the gene expression at pivotal points within the pathway. A specific step in the phenylpropanoid pathway is blocked in low-tannin lentils at the stage of formation of anthocyanidins and proanthocyanidins from dihydromyrecitin, whereas a slighter blockage in this step has been found in gray genotypes. Additionally, in low-tannin seeds a lack of dihydroflavonols is observed, which are precursors for anthocyanidin and proanthocyanidin generation [55]. The FLS and F3H genes’ expression, though, does not follow the same pattern as the rest of the studied genes of the phenylpropanoid pathway. The expression levels of the FLS gene appear to decrease as the P level increases. The F3H expression seems to be influenced by the P level when considering each seed maturity stage separately. The pattern of the P influence, though, is not consistent among the P treatments, which may suggest the existence of additional factors regulating the expression of F3H. Yu et al. reported that two genes in the FLS family, FLS1 and FLS2, are highly expressed in the early stages of seed development, while another gene in the FLS family, FLS3, is highly expressed in the later stages of seed development, suggesting that the FLS genes may play different roles in regulating seed development [30]. In the study conducted by Jia et al. in tobacco leaves, it was observed that in higher P treatment there was a reduction in the transcript levels of NtCHS (chalcone synthase), NtCHI (chalcone isomerase), NtF3H (flavanone 3-hydroxylase), NtF30H (flavanone 30-hydroxylase) and NtFLS (flavonol synthase), while NtFLS transcript levels were increased in both juvenile and mature leaves in the lower P treatment. Pi (inorganic P) deficiency led to a lack of bHLH transcription factor and negatively affected the key gene for anthocyanidin biosynthesis (NtDFR) [56]. In Arabidopsis, a mutation in the regulator of the flavonol biosynthesis AtMYB12, which encodes the R2R3-MYB TF and influences the expression of CHS, CHI, F3H and FLS, causes remarkable downregulation of these genes. In maize, the P1 regulator, which encodes the R2R3-MYB TF, induces the expression of these genes in a similar way except for the F3H and genes that are only found in the anthocyanidin branch of the phenylpropanoid pathway [57,58]. The bHLH transcription factor and F3′H are identified among the genes occupying pivotal positions in the phenylpropanoid pathway. The expression of the bHLH gene exhibited a significant reduction, particularly in the S3 maturity stage of P0. In general, the results suggest that the maturity stage played a central role in the downregulation of bHLH, with a similar expression pattern observed in the variations of F3′H expression. Plant responses to P alterations often involve changes in gene expression at the post-transcriptional level. In Arabidopsis, rice and soybean for example, the miRNA339 is induced by P stress and regulates phosphate homeostasis by suppressing the activity of the PHO2 enzyme; additionally, P stresses can activate genes due to alterations in transcription factor expression, such as TF of the bHLH families [59]. Alterations in F3′H expression in common bean seeds affected the concentration of dihydroquercetin-related compounds and proanthocyanidins [60]. In tobacco leaves, P treatments in both low and high concentrations affected the regulation of the transcripts involved in the flavonoid pathway, which is a branch of the phenylpropanoid.
KEGG pathway analysis indicated an increase in the upregulated genes in P2 treatment in comparison with P0, while the downregulated genes showcased a decrease only in P2 treatment. On the other hand, the upregulated genes in the flavonoid biosynthesis pathway exhibited a one-gene increase in P2, whereas the downregulated genes rose in both P1 and P2 treatments. The alterations observed in enriched DEGs as a result of changes in P levels do not align with the selected genes within the pathway, except for F3′H and FLS. Consequently, the results of the KEGG analysis may be associated with other genes expressed in the broader phenylpropanoid pathway. In a comparative transcriptomic study conducted on apple seedlings under different P treatments, DEG analysis revealed significant changes in flavonoids and anthocyanidin concentration in the treatments, while the KEGG enrichment analysis showed that the flavonoid and phenylpropanoid biosynthesis pathways were highly enhanced in different P treatments [61]. In tobacco leaves, P treatments of both low and high concentrations, affected the regulation of the transcripts involved in the flavonoid pathway, which is a branch of the phenylpropanoid [56]. Excess P (P2) increased the DFR expression, but the seed maturity stage negatively affected the expression since in every P treatment there was a remarkable reduction in the expression in S3 compared to S2. The downregulation of the genes of the phenylpropanoid pathway and the consistent even lower expression in most cases in P1 and P2 treatments suggest that excess P is a limiting factor for proanthocyanidin (tannin) formation.
Ongoing research aims to determine if the transcriptional downregulation of phenylpropanoid gene expression correlates with lower seed tannin accumulation. This may explain the observed variability in lentil seed coat hardness from year to year in the same field, as P availability—affected by soil drying and rewatering fluctuations—influences the genes responsible for tannin accumulation in the phenylpropanoid pathway. Future studies involving a broader range of genotypes will provide clearer insights into the role of P levels in tannin biosynthesis and help elucidate why periodic seed hardness occurs in specific genotypes rather than across all lentil varieties.
5. Conclusions
Seed coat hardness, a crucial quality attribute for lentil products, is governed by a combination of genetic and environmental factors that are closely tied to tannin accumulation. This study underscored the significance of seed maturity in shaping both the overall gene expression in lentils and the specific expression patterns of genes within the phenylpropanoid pathway responsible for tannin production in seeds, showing that these genes exhibit heightened expression during early seed development. Furthermore, P levels were found to significantly impact the expression of F3H and FLS genes within the phenylpropanoid pathway, as well as genes associated with stress resistance, stress signaling and gene regulation. These findings have potential implications for the development of innovative agricultural strategies aimed at enhancing the quality and consistency of lentil products. Future research, incorporating a wider range of lentil genotypes, will provide a more comprehensive understanding of the intricate interplay between genotype and phosphate levels, further elucidating their effects on tannin accumulation and seed coat properties and thereby advancing lentil cultivation and breeding programs.
Supplementary Materials
The following supporting information can be downloaded at: https://www.mdpi.com/article/10.3390/app132011403/s1. Table S1: The tables display the top 15 upregulated and the top 15 downregulated Gene Ontology terms that were determined by Gene Set Enrichment Analysis and the three Ontology domains; Table S2: The top 30 enriched pathways determined by KEGG analysis and numbers of enriched upregulated and downregulated DEGs in the three phosphorus treatments; Table S3: The table shows the differential expression of phenylpropanoid pathway genes in all three phosphorus treatments and comparisons among seed maturity stages within each treatment. The log2FC, p-values, and adjusted p-values are displayed.
Author Contributions
Conceptualization, A.N.P.; data curation, E.K., A.P., M.T., G.T., C.N. and A.K. (Athanasios Karanikolas); formal analysis, E.K., A.P., M.T., G.T. and C.N.; funding acquisition, A.N.P.; investigation, E.K., E.M. and T.K.; methodology, A.A., I.N.-O., P.V.M. and A.N.P.; project administration, A.N.P.; resources, A.A., P.V.M. and A.N.P.; software, E.K., A.P., M.T., G.T., C.N. and A.K. (Athanasios Kouras); supervision, A.N.P.; validation, E.K., A.P. and T.K.; visualization, E.K., A.P., M.T. and A.K. (Athanasios Kouras); writing—original draft, E.K. and A.P.; writing—review and editing, E.K., A.P., P.V.M. and A.N.P. All authors have read and agreed to the published version of the manuscript.
Funding
This research has been co-financed by the European Union and Greek national funds through the Operational Program Competitiveness, Entrepreneurship and Innovation, under the call RESEARCH–CREATE–INNOVATE (Project code: T1EDK-04633, LENSBREED, http://www.lensbreed.gr/ (accessed on 5 October 2023)).
Institutional Review Board Statement
Not applicable.
Informed Consent Statement
Not applicable.
Data Availability Statement
RNA sequencing datasets are deposited in the GEO database of the National Center for Biotechnology Information, NCBI, under the accession number “GSE244747”.
Acknowledgments
We thank the graduate students of the Genetics and Plant Breeding laboratory, Faculty of Agriculture, Aristotle Univ. of Thessaloniki, for their help in the lab work. We also thank Dimitrios Vlachostergios for the excellent management and coordination of the Lensbreed project funding this research.
Conflicts of Interest
The authors declare no conflict of interest.
Abbreviations
| chalcone synthase | CHS |
| chalcone isomerase | CHI |
| flavanone 3-hydroxylase | F3H |
| flavonoid 3′-hydroxylase | F3′H |
| dihydroflavonol reductase | DFR |
| leucoanthocyanidin dioxygenase | LDOX |
| basic helix-loop-helix | bHLH |
| transcription factors | TF |
| phenylalanine ammonia-lyase | PAL |
| dihydrokaempferol | DHK |
| dihydromyricetin | DHM |
| flavonoid-3′-5′-hydroxylase | F3′5′H |
| anthocyanidin synthase | ANS |
| anthocyanidin reductase | ANR |
| leucoanthocyanidin reductase | LAR |
| flavonol synthase | FLS |
References
- Polidoros, A.N.; Avdikos, I.D.; Gleridou, A.; Kostoula, S.D.; Koura, E.; Sakellariou, M.A.; Stavridou, E.; Gerasopoulos, D.; Lagopodi, A.; Mavromatis, A.; et al. Lentil Gene Pool for Breeding. In Cash Crops; Springer: Cham, Switzerland, 2021; pp. 407–475. [Google Scholar]
- Erskine, W.; Muehlbauer, F.J.; Sarker, A.; Sharma, B. The Lentil: Botany, Production and Uses; CABI: Wallingford, UK, 2009; pp. 1–457. [Google Scholar]
- Göncü, A.; Çelik, İ. Investigation of Some Properties of Gluten-Free Tarhanas Produced by Red, Green and Yellow Lentil Whole Flour. Food Sci. Technol. 2020, 40, 574–581. [Google Scholar] [CrossRef]
- Romano, A.; Gallo, V.; Ferranti, P.; Masi, P. Lentil Flour: Nutritional and Technological Properties, in Vitro Digestibility and Perspectives for Use in the Food Industry. Curr. Opin. Food Sci. 2021, 40, 157–167. [Google Scholar] [CrossRef]
- Wang, N.; Hatcher, D.W.; Toews, R.; Gawalko, E.J. Influence of Cooking and Dehulling on Nutritional Composition of Several Varieties of Lentils (Lens culinaris). LWT 2009, 42, 842–848. [Google Scholar] [CrossRef]
- Joshi, M.; Adhikari, B.; Panozzo, J.; Aldred, P. Water Uptake and Its Impact on the Texture of Lentils (Lens culinaris). J. Food Eng. 2010, 100, 61–69. [Google Scholar] [CrossRef]
- Ladizinsky, G. The Genetics of Hard Seed Coat in the Genus Lens. Euphytica 1985, 34, 539–543. [Google Scholar] [CrossRef]
- Hughes, J.; Swanson, B. Microstructure of Lentil Seeds (Lens culinaris). Food Struct. 1986, 5, 8. [Google Scholar]
- Muehlbauer, F.; Sarker, A. Tannin Free Lentils: A Promising Development for Specialty Use and Increased Value. Grain Legum. 2011, 57, 27–28. [Google Scholar]
- Tsanakas, G.F.; Mylona, P.V.; Koura, K.; Gleridou, A.; Polidoros, A.N. Genetic Diversity Analysis of the Greek Lentil (Lens culinaris) Landrace “Eglouvis” Using Morphological and Molecular Markers. Plant Genet. Resour. Characterisation Util. 2018, 16, 469–477. [Google Scholar] [CrossRef]
- Gleridou, A.; Tokatlidis, I.; Polidoros, A. Genetic Variation of a Lentil (Lens culinaris) Landrace during Three Generations of Breeding. Appl. Sci. 2022, 12, 450. [Google Scholar] [CrossRef]
- Kargiotidou, A.; Vlachostergios, D.N.; Tzantarmas, C.; Mylonas, I.; Foti, C.; Menexes, G.; Polidoros, A.; Tokatlidis, I.S. Addressing Huge Spatial Heterogeneity Induced by Virus Infections in Lentil Breeding Trials. J. Biol. Res. 2016, 23, 2. [Google Scholar] [CrossRef]
- Zafeiriou, I.; Ntoanidou, S.; Baira, E.; Kasiotis, K.M.; Barmpouni, T.; Machera, K.; Mylona, P.V. Ingenious Characterization and Assessment of Lentil Germplasm Collection to Aphid Acyrthosiphon pisum Stress Unveils Distinct Responses. Front. Plant Sci. 2022, 13, 1011026. [Google Scholar] [CrossRef] [PubMed]
- Dueñas, M.; Hernández, T.; Estrella, I. Phenolic Composition of the Cotyledon and the Seed Coat of Lentils (Lens culinaris L.). Eur. Food Res. Technol. 2002, 215, 478–483. [Google Scholar] [CrossRef]
- Weng, J.K.; Noel, J.P. Structure–Function Analyses of Plant Type III Polyketide Synthases. Methods Enzymol. 2012, 515, 317–335. [Google Scholar] [PubMed]
- Lo Piero, A.R.; Puglisi, I.; Rapisarda, P.; Petrone, G. Anthocyanins Accumulation and Related Gene Expression in Red Orange Fruit Induced by Low Temperature Storage. J. Agric. Food Chem. 2005, 53, 9083–9088. [Google Scholar] [CrossRef] [PubMed]
- Sharma, A.; Shahzad, B.; Rehman, A.; Bhardwaj, R.; Landi, M.; Zheng, B. Response of Phenylpropanoid Pathway and the Role of Polyphenols in Plants under Abiotic Stress. Molecules 2019, 24, 2452. [Google Scholar] [CrossRef] [PubMed]
- Winkel-Shirley, B. Biosynthesis of Flavonoids and Effects of Stress. Curr. Opin. Plant Biol. 2002, 5, 218–223. [Google Scholar] [CrossRef] [PubMed]
- Kayoumu, M.; Iqbal, A.; Muhammad, N.; Li, X.; Li, L.; Wang, X.; Gui, H.; Qi, Q.; Ruan, S.; Guo, R.; et al. Phosphorus Availability Affects the Photosynthesis and Antioxidant System of Contrasting Low-P-Tolerant Cotton Genotypes. Antioxidants 2023, 12, 466. [Google Scholar] [CrossRef]
- Dodd, I.C.; Puértolas, J.; Huber, K.; Pérez-Pérez, J.G.; Wright, H.R.; Blackwell, M.S.A. The Importance of Soil Drying and Re-Wetting in Crop Phytohormonal and Nutritional Responses to Deficit Irrigation. J. Exp. Bot. 2015, 66, 2239–2252. [Google Scholar] [CrossRef]
- Sarker, B.C.; Karmoker, J.L. Effects of Phosphorus Deficiency on Accumulation of Biochemical Compounds in Lentil (Lens culinaris Medik). Bangladesh J. Bot. 2011, 40, 23–27. [Google Scholar] [CrossRef]
- Ramsay, L.; Koh, C.S.; Kagale, S.; Gao, D.; Kaur, S.; Haile, T.; Gela, T.S.; Chen, L.-A.; Cao, Z.; Konkin, D.J.; et al. Genomic Rearrangements Have Consequences for Introgression Breeding as Revealed by Genome Assemblies of Wild and Cultivated Lentil Species. bioRxiv 2021. bioRxiv:2021.07.23.453237. [Google Scholar]
- Song, J.; Mavraganis, I.; Shen, W.; Yang, H.; Cram, D.; Xiang, D.; Patterson, N.; Zou, J. Transcriptome Dissection of Candidate Genes Associated with Lentil Seed Quality Traits. Plant Biol. 2022, 24, 815–826. [Google Scholar] [CrossRef] [PubMed]
- Singh, D.; Singh, C.K.; Taunk, J.; Tomar, R.S.S.; Chaturvedi, A.K.; Gaikwad, K.; Pal, M. Transcriptome Analysis of Lentil (Lens culinaris Medikus) in Response to Seedling Drought Stress. BMC Genom. 2017, 18, 206. [Google Scholar] [CrossRef] [PubMed]
- Singh, D.; Singh, C.K.; Taunk, J.; Sharma, S.; Gaikwad, K.; Singh, V.; Sanwal, S.K.; Singh, D.; Sharma, P.; Pal, M. Transcriptome Skimming of Lentil (Lens culinaris Medikus) Cultivars with Contrast Reaction to Salt Stress. Funct. Integr. Genom. 2021, 21, 139–156. [Google Scholar] [CrossRef] [PubMed]
- Singh, D.; Taunk, J.; Singh, C.K.; Chaudhary, P.; Gaikwad, K.; Yadav, R.K.; Singh, D.; Pal, M. Comparative RNA Sequencing for Deciphering Nodes of Multiple Abiotic Stress Tolerance in Lentil (Lens culinaris Medikus). Plant Gene 2022, 31, 100373. [Google Scholar] [CrossRef]
- Hosseini, S.Z.; Ismaili, A.; Nazarian-Firouzabadi, F.; Fallahi, H.; Rezaei Nejad, A.; Sohrabi, S.S. Dissecting the Molecular Responses of Lentil to Individual and Combined Drought and Heat Stresses by Comparative Transcriptomic Analysis. Genomics 2021, 113, 693–705. [Google Scholar] [CrossRef]
- Morgil, H.; Tardu, M.; Cevahir, G.; Kavakli, İ.H. Comparative RNA-Seq Analysis of the Drought-Sensitive Lentil (Lens culinaris) Root and Leaf under Short- and Long-Term Water Deficits. Funct. Integr. Genom. 2019, 19, 715–727. [Google Scholar] [CrossRef] [PubMed]
- Dutta, H.; Mishra, G.P.; Aski, M.S.; Bosamia, T.C.; Mishra, D.C.; Bhati, J.; Sinha, S.K.; Vijay, D.; Manjunath, M.P.; Das, S.; et al. Comparative Transcriptome Analysis, Unfolding the Pathways Regulating the Seed-Size Trait in Cultivated Lentil (Lens culinaris Medik.). Front. Genet. 2022, 13, 942079. [Google Scholar] [CrossRef]
- Yu, B.; Gao, P.; Song, J.; Yang, H.; Qin, L.; Yu, X.; Song, H.; Coulson, J.; Bekkaoui, Y.; Akhov, L.; et al. Spatiotemporal Transcriptomics and Metabolic Profiling Provide Insights into Gene Regulatory Networks during Lentil Seed Development. Plant J. 2023, 115, 253–274. [Google Scholar] [CrossRef]
- Bhatty, R.S. Comparisons of Good- and Poor-cooking Lentils. J. Sci. Food Agric. 1995, 68, 489–496. [Google Scholar] [CrossRef]
- Mirali, M.; Purves, R.W.; Stonehouse, R.; Song, R.; Bett, K.; Vandenberg, A. Genetics and Biochemistry of Zero-Tannin Lentils. PLoS ONE 2016, 11, e0164624. [Google Scholar] [CrossRef]
- Ewels, P.; Magnusson, M.; Lundin, S.; Käller, M. MultiQC: Summarize Analysis Results for Multiple Tools and Samples in a Single Report. Bioinformatics 2016, 32, 3047–3048. [Google Scholar] [CrossRef]
- Bolger, A.M.; Lohse, M.; Usadel, B. Trimmomatic: A Flexible Trimmer for Illumina Sequence Data. Bioinformatics 2014, 30, 2114–2120. [Google Scholar] [CrossRef] [PubMed]
- Dobin, A.; Davis, C.A.; Schlesinger, F.; Drenkow, J.; Zaleski, C.; Jha, S.; Batut, P.; Chaisson, M.; Gingeras, T.R. STAR: Ultrafast Universal RNA-Seq Aligner. Bioinformatics 2013, 29, 15–21. [Google Scholar] [CrossRef] [PubMed]
- Liao, Y.; Smyth, G.K.; Shi, W. FeatureCounts: An Efficient General Purpose Program for Assigning Sequence Reads to Genomic Features. Bioinformatics 2014, 30, 923–930. [Google Scholar] [CrossRef] [PubMed]
- Love, M.I.; Huber, W.; Anders, S. Moderated Estimation of Fold Change and Dispersion for RNA-Seq Data with DESeq2. Genome Biol. 2014, 15, 550. [Google Scholar] [CrossRef] [PubMed]
- Harshitha, R.; Arunraj, D.R. Real-Time Quantitative PCR: A Tool for Absolute and Relative Quantification. Biochem. Mol. Biol. Educ. 2021, 49, 800–812. [Google Scholar] [CrossRef] [PubMed]
- Livak, K.J.; Schmittgen, T.D. Analysis of Relative Gene Expression Data Using Real-Time Quantitative PCR and the 2−ΔΔCT Method. Methods 2001, 25, 402–408. [Google Scholar] [CrossRef] [PubMed]
- Baber, K.; Jones, C.; Miller, P.; Lamb, P.; Atencio, S. Lentil Nitrogen Fixation Response to Fertilizer and Inoculant in the Northern Great Plains. Agron. J. 2023, 115, 2614–2630. [Google Scholar] [CrossRef]
- Adnan, M.; Fahad, S.; Khan, I.A.; Saeed, M.; Ihsan, M.Z.; Saud, S.; Riaz, M.; Wang, D.; Wu, C. Integration of Poultry Manure and Phosphate Solubilizing Bacteria Improved Availability of Ca Bound P in Calcareous Soils. 3 Biotech. 2019, 9, 368. [Google Scholar] [CrossRef]
- Stigter, K.A.; Plaxton, W.C. Molecular Mechanisms of Phosphorus Metabolism and Transport during Leaf Senescence. Plants 2015, 4, 773–798. [Google Scholar] [CrossRef]
- Singh, N.; Singh, G. Response of Lentil (Lens culinarismedikus) to Phosphorus—A Review. Agric. Rev. 2016, 37, 27–34. [Google Scholar]
- Ul Haq, S.; Khan, A.; Ali, M.; Khattak, A.M.; Gai, W.X.; Zhang, H.X.; Wei, A.M.; Gong, Z.H. Heat Shock Proteins: Dynamic Biomolecules to Counter Plant Biotic and Abiotic Stresses. Int. J. Mol. Sci. 2019, 20, 5321. [Google Scholar] [CrossRef] [PubMed]
- Veneklaas, E.J.; Lambers, H.; Bragg, J.; Finnegan, P.M.; Lovelock, C.E.; Plaxton, W.C.; Price, C.A.; Scheible, W.R.; Shane, M.W.; White, P.J.; et al. Opportunities for Improving Phosphorus-Use Efficiency in Crop Plants. New Phytol. 2012, 195, 306–320. [Google Scholar] [CrossRef] [PubMed]
- Igamberdiev, A.U.; Kleczkowski, L.A. Pyrophosphate as an Alternative Energy Currency in Plants. Biochem. J. 2021, 478, 1515–1524. [Google Scholar] [CrossRef] [PubMed]
- Nielsen, E. The Small GTPase Superfamily in Plants: A Conserved Regulatory Module with Novel Functions. Annu. Rev. Plant Biol. 2020, 71, 247–272. [Google Scholar] [CrossRef] [PubMed]
- Kumar, S.; Mohapatra, T. Dynamics of DNA Methylation and Its Functions in Plant Growth and Development. Front. Plant Sci. 2021, 12, 596236. [Google Scholar] [CrossRef] [PubMed]
- Chu, S.; Zhang, X.; Yu, K.; Lv, L.; Sun, C.; Liu, X.; Zhang, J.; Jiao, Y.; Zhang, D. Genome-Wide Analysis Reveals Dynamic Epigenomic Differences in Soybean Response to Low-Phosphorus Stress. Int. J. Mol. Sci. 2020, 21, 6817. [Google Scholar] [CrossRef] [PubMed]
- Ferraz, R.; Coimbra, S.; Correia, S.; Canhoto, J. RNA Methyltransferases in Plants: Breakthroughs in Function and Evolution. Plant Physiol. Biochem. 2023, 194, 449–460. [Google Scholar] [CrossRef]
- Xu, X.; Zhu, T.; Nikonorova, N.; De Smet, I. Phosphorylation-Mediated Signalling in Plants. Annu. Plant Rev. Online 2019, 2, 909–932. [Google Scholar]
- Theologidou, G.S.; Lazaridou, A.; Zorić, L.; Tsialtas, I.T. Cooking Quality of Lentils Produced under Mediterranean Conditions. Crop Sci. 2018, 58, 2121–2130. [Google Scholar] [CrossRef]
- Moi, J.A.; Moïse, J.A.; Han, S.; Gudynaitȩ-Savitch, L.; Johnson, D.A.; Miki, B.L.A. Seed Coats: Structure, Development, Composition, and Biotechnology. Vitr. Cell. Dev. Biol.—Plant 2005, 41, 620–644. [Google Scholar]
- Wen, G.; Chen, C.; Neill, K.; Wichman, D.; Jackson, G. Yield Response of Pea, Lentil and Chickpea to Phosphorus Addition in a Clay Loam Soil of Central Montana. Arch. Agron. Soil. Sci. 2008, 54, 69–82. [Google Scholar] [CrossRef]
- Elessawy, F.M.; Bazghaleh, N.; Vandenberg, A.; Purves, R.W. Polyphenol Profile Comparisons of Seed Coats of Five Pulse Crops Using a Semi-Quantitative Liquid Chromatography-Mass Spectrometric Method. Phytochem. Anal. 2020, 31, 458–471. [Google Scholar] [CrossRef] [PubMed]
- Jia, H.; Wang, J.; Yang, Y.; Liu, G.; Bao, Y.; Cui, H. Changes in Flavonol Content and Transcript Levels of Genes in the Flavonoid Pathway in Tobacco under Phosphorus Deficiency. Plant Growth Regul. 2015, 76, 225–231. [Google Scholar] [CrossRef]
- Wang, F.; Kong, W.; Wong, G.; Fu, L.; Peng, R.; Li, Z.; Yao, Q. AtMYB12 Regulates Flavonoids Accumulation and Abiotic Stress Tolerance in Transgenic Arabidopsis Thaliana. Mol. Genet. Genom. 2016, 291, 1545–1559. [Google Scholar] [CrossRef] [PubMed]
- Quattrocchio, F.; Baudry, A.; Lepiniec, L.; Grotewold, E. The Regulation of Flavonoid Biosynthesis. In The Science of Flavonoids; Springer: Berlin/Heidelberg, Germany, 2006; pp. 97–122. [Google Scholar]
- Du, Q.; Wang, K.; Xu, C.; Zou, C.; Xie, C.; Xu, Y.; Li, W.X. Strand-Specific RNA-Seq Transcriptome Analysis of Genotypes with and without Low-Phosphorus Tolerance Provides Novel Insights into Phosphorus-Use Efficiency in Maize. BMC Plant Biol. 2016, 16, 222. [Google Scholar] [CrossRef] [PubMed]
- McClean, P.E.; Lee, R.; Howe, K.; Osborne, C.; Grimwood, J.; Levy, S.; Haugrud, A.P.; Plott, C.; Robinson, M.; Skiba, R.M.; et al. The Common Bean V Gene Encodes Flavonoid 3′5′ Hydroxylase: A Major Mutational Target for Flavonoid Diversity in Angiosperms. Front. Plant Sci. 2022, 13, 869582. [Google Scholar] [CrossRef] [PubMed]
- Sun, T.; Zhang, J.; Zhang, Q.; Li, X.; Li, M.; Yang, Y.; Zhou, J.; Wei, Q.; Zhou, B. Transcriptome and Metabolome Analyses Revealed the Response Mechanism of Apple to Different Phosphorus Stresses. Plant Physiol. Biochem. 2021, 167, 639–650. [Google Scholar] [CrossRef]
Disclaimer/Publisher’s Note: The statements, opinions and data contained in all publications are solely those of the individual author(s) and contributor(s) and not of MDPI and/or the editor(s). MDPI and/or the editor(s) disclaim responsibility for any injury to people or property resulting from any ideas, methods, instructions or products referred to in the content. |
© 2023 by the authors. Licensee MDPI, Basel, Switzerland. This article is an open access article distributed under the terms and conditions of the Creative Commons Attribution (CC BY) license (https://creativecommons.org/licenses/by/4.0/).