1. Introduction
With the intensification of coal mining, disasters caused by coal–rock are becoming increasingly severe. Rock bursts pose a significant threat to safe and efficient coal mine production, given its rapid occurrence, high level of harm, and extensive damage caused [
1,
2,
3]. Rock burst is a dynamic event. It is caused by the sudden release of the elastic energy stored in coal and rock formations. Variations influence this phenomenon in coal thickness and the stress state of the coal seam and rock strata in the stopes [
4,
5]. Relevant research shows that the probability of rock burst is related to the change in coal thickness. During mining, the energy accumulation in areas with coal thickness change is high, potentially leading to catastrophic events such as rock bursts [
6,
7].
Rock bursts result from the joint action of coal and rock under the influence of mining. AFRAEI was used to investigate the impact of the mechanical parameters of coal and rock on rock bursts [
8]. By analyzing the mechanical rock parameters of many engineering cases, it was established that the rock stress ratio and the elastic strain energy significantly influence the impact of ground pressure. Several scholars have utilized the coal–rock combination to conduct research, and the impact of changes in coal thickness on the strength and deformation characteristics of coal–rock combinations has been analyzed [
9,
10]. The results demonstrated that the strength of combinations is negatively correlated with changes in coal thickness. References [
11,
12] revealed the relationship between coal thickness changes, parameters at the coal–rock interface, and the strength of the combinations. Zuo et al. [
13] compared the energy accumulation differences of various coal–rock combinations and identified a correlation with coal thickness variations. Chen et al. [
14,
15] placed the key layer where energy for rock bursts accumulates within the coal seam, where the degree of energy accumulation was related to the change in coal thickness. Through case analysis, laboratory experiments, and other methods, the above researchers identified the relationship between the combination’s strength and energy accumulation behavior characteristics and the mechanical parameters of coal and rock, which has significant reference value for understanding rock bursts. Still, the research on the stress and energy evolution law of surrounding rock in coal thickness change is insufficient.
The change in coal thickness has a particular influence on the stress distribution of the surrounding rock, which affects the energy accumulation characteristics of the surrounding rock. To this end, Bai et al. [
16] analyzed the surrounding rock’s stress and energy distribution characteristics in an area with roof thickness changes. They concluded that the greater the roof thickness change, the greater the initial stress in the area of coal seam thinning. Wang et al. [
17] used the theoretical analysis method to study the stress distribution characteristics of the surrounding rock in an extra-thick coal seam. Refs. [
18,
19] used numerical simulation to find that abnormal mining stress in the area where coal thickness changes induces rock bursts. Refs. [
20,
21] used a numerical simulation method to study the elastic strain energy distribution characteristics and influencing factors in an area of changing coal thickness change. Wang et al. [
22] pointed out that high-stress concentrations in coal and rock strata increase the possibility of rock bursts. Zhao et al. [
23] discussed the mechanical mechanism of mining rock bursts in areas with changing coal thickness. The above scholars have taken the coal–rock combination layer as the object. Through indoor experiments and numerical simulation, they have discussed the combined rock strata’s stress and energy distribution laws in areas of changing coal thickness, and it is believed that stress anomalies induce the occurrence of rock bursts. However, the research on the relationship between the change in coal thickness and the stress and energy of the combined rock strata is relatively scarce.
Therefore, this study used the weak impact tendency of the #33 layer coal seam in Jixi Pinggang Coal Mine as the research background. Taking the combined rock strata as the research object, the strata in the area with changing coal thickness were regarded as the change in the coal thickness, and how coal thickness and lithology impact the combination’s strength and energy accumulation characteristics was investigated. Based on our analysis, we established a correlation between the stress and energy of the combined rock strata and the subsequent change in coal thickness, enabling us to identify the areas where stress and energy accumulate in the surrounding rock formations as the coal thickness changes. This valuable insight can serve as a guide to effectively prevent and manage rock bursts in the affected areas.
2. Uniaxial Compression Experiment of Coal–Rock Combination
To thoroughly examine the combined structure’s stress and energy accumulation characteristics within the area with changing coal thickness, the change was regarded as the thickness change of the coal–rock combination. Therefore, in this experiment, different combinations of lithologies and coal thicknesses were made. Then, the uniaxial compression experiment was carried out using an RMT-150 testing machine to obtain the axial stress–axial strain curve of the different combinations.
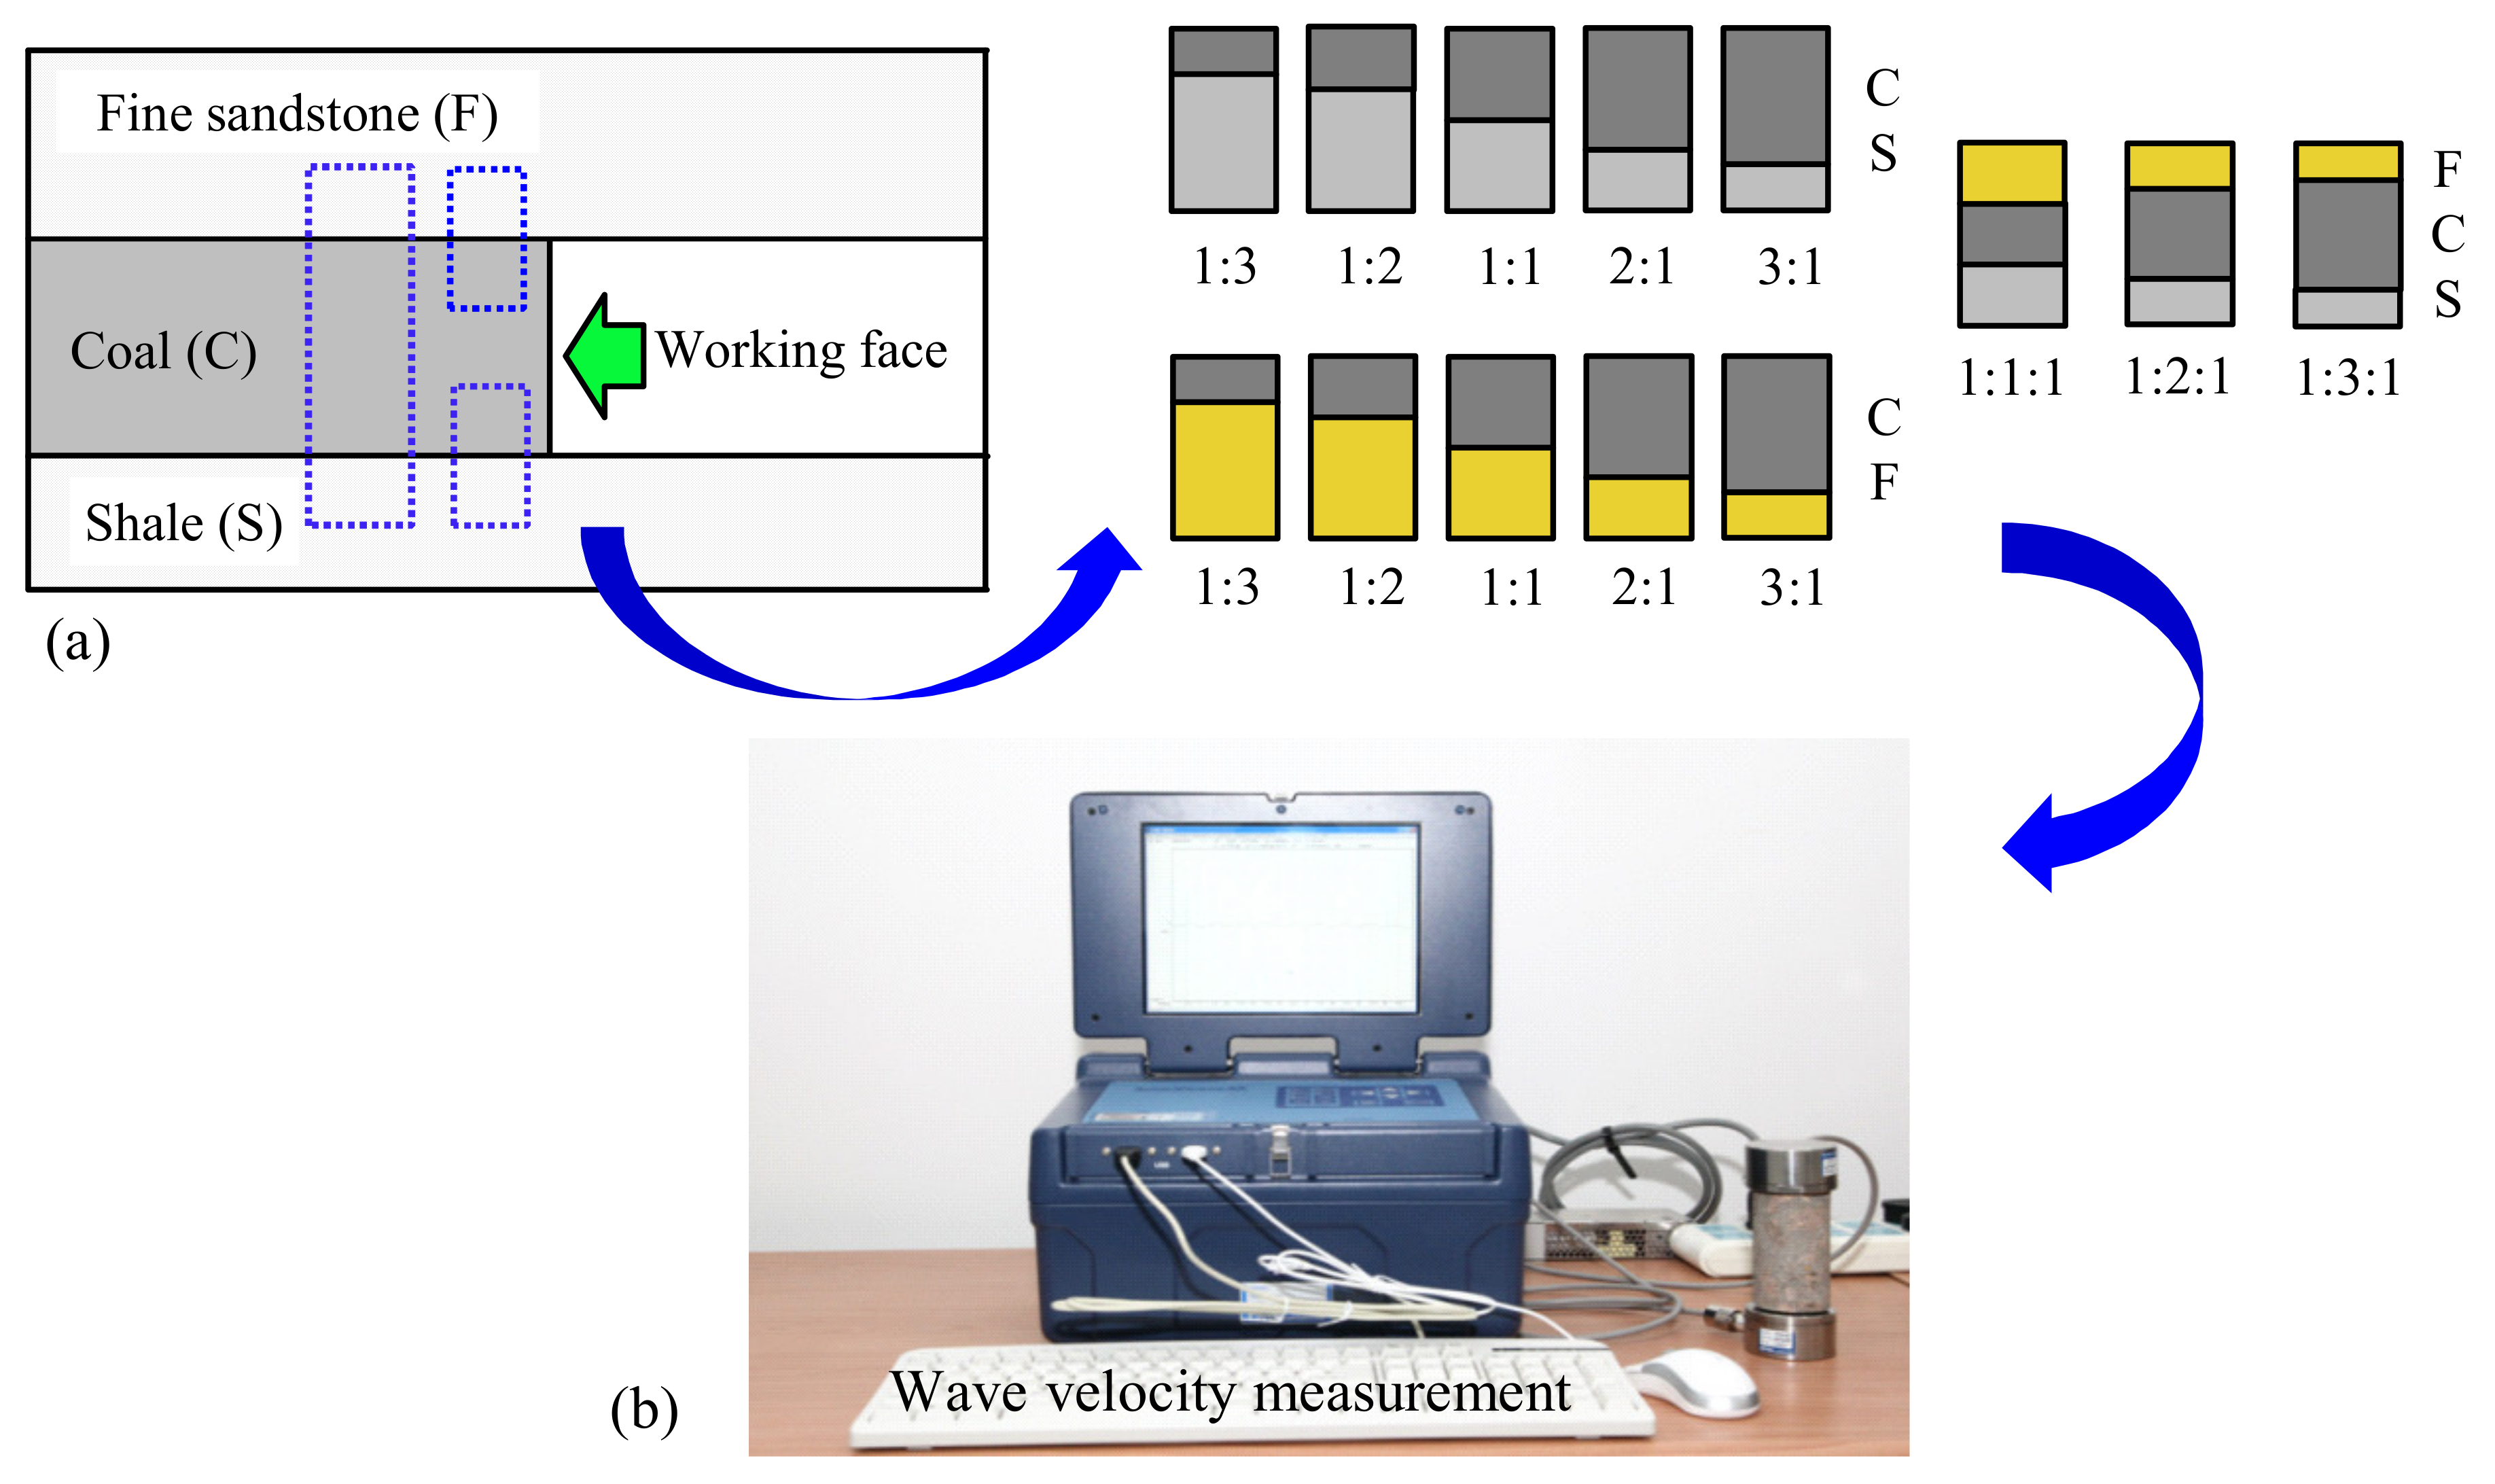
2.1. Research Context
The samples taken in this experiment are from Pinggang Coal Mine in Jixi, Heilongjiang Province. The 33 # coal seam of this coal mine has a weak impact tendency. The right working face of the 33# coal seam in Pinggang Mine has a depth of 650 m~680 m from the surface, with an average dip angle of 3°. The thickness of the coal seam is 1.1 m~3 m, with an average thickness of 2.1 m. The coal seam roof is fine sandstone with a thickness of 9.6 m, and its strength is high, with a uniaxial compressive strength of 74.5 MPa; the floor is shale with a thickness of 0.3 m.
2.2. Samples Making
According to the field conditions, the roof fine sandstone, floor shale, and coal seam of the working face are sampled. The samples are combined according to the experimental requirements, and the combination method is shown in
Figure 1a. Among them are fine sandstone (F), shale (S), and coal (C). The size of coal and rock monomer and combination is a cylinder with a diameter of 50 mm and a height of 100 mm. The binder is used in the test to fix the coal–rock interface. To reduce the impact of the coal–rock interface and the inhomogeneity of the combined sample on the test results, the wave velocity of the combination was measured, and the combination with similar wave velocity was selected for the test. Wave velocity measurement is shown in
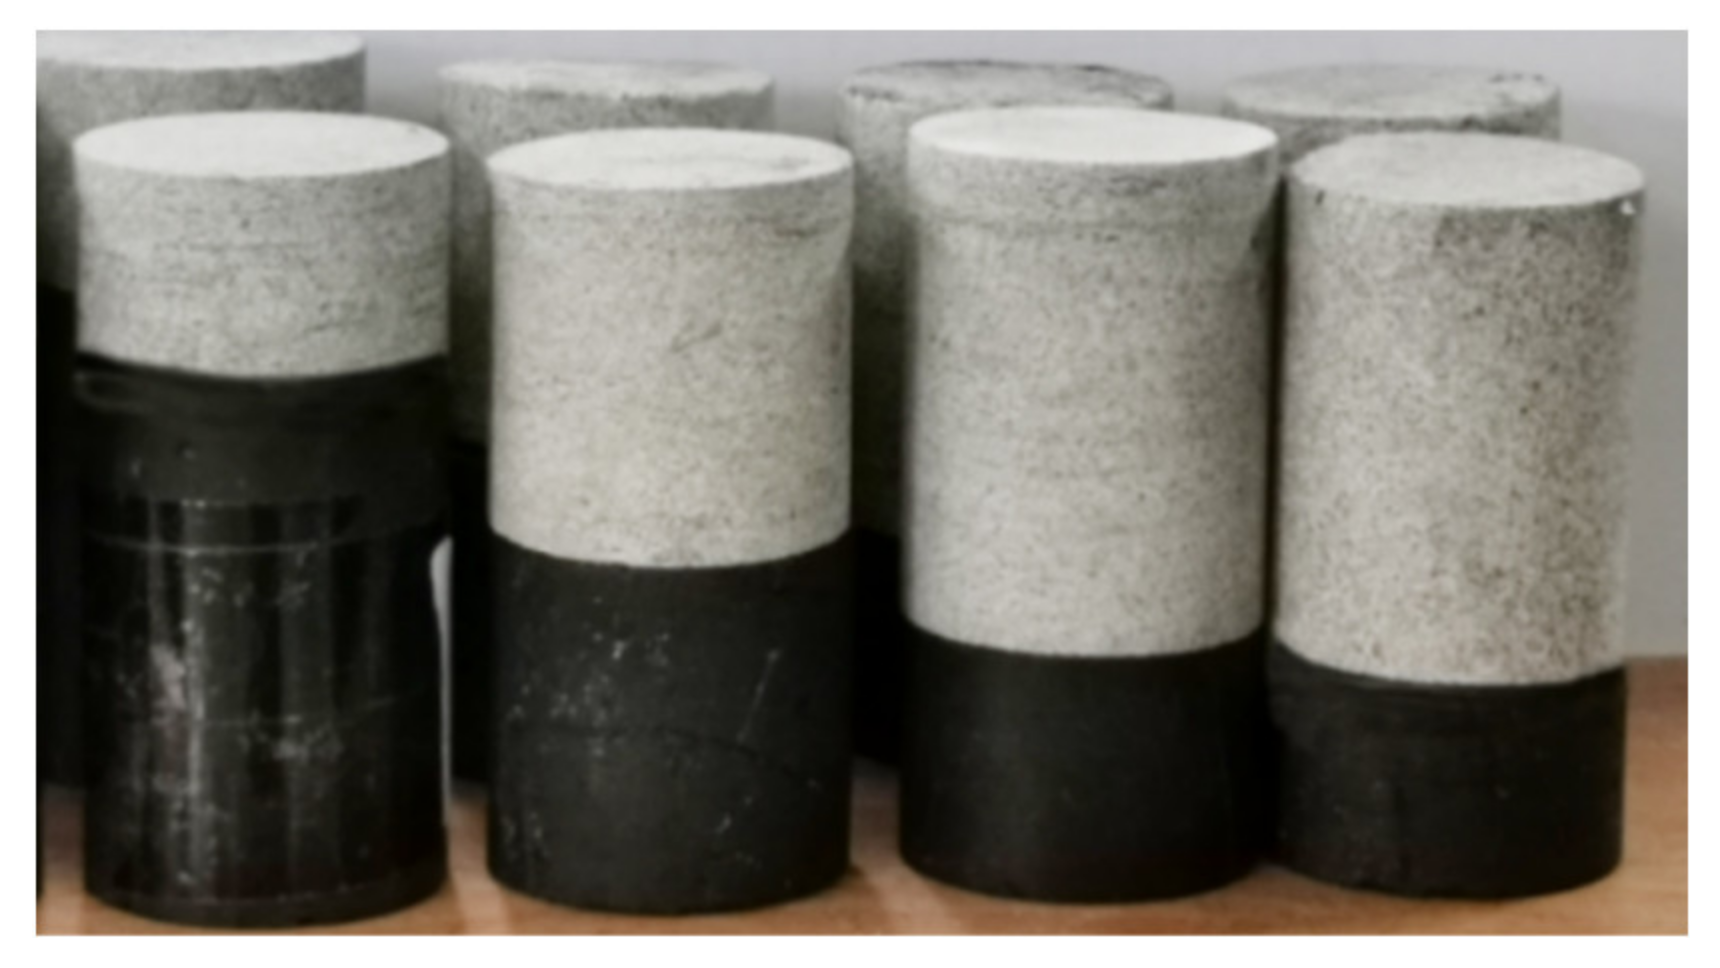
Figure 1b. The physical diagram of some samples is shown in
Figure 2.
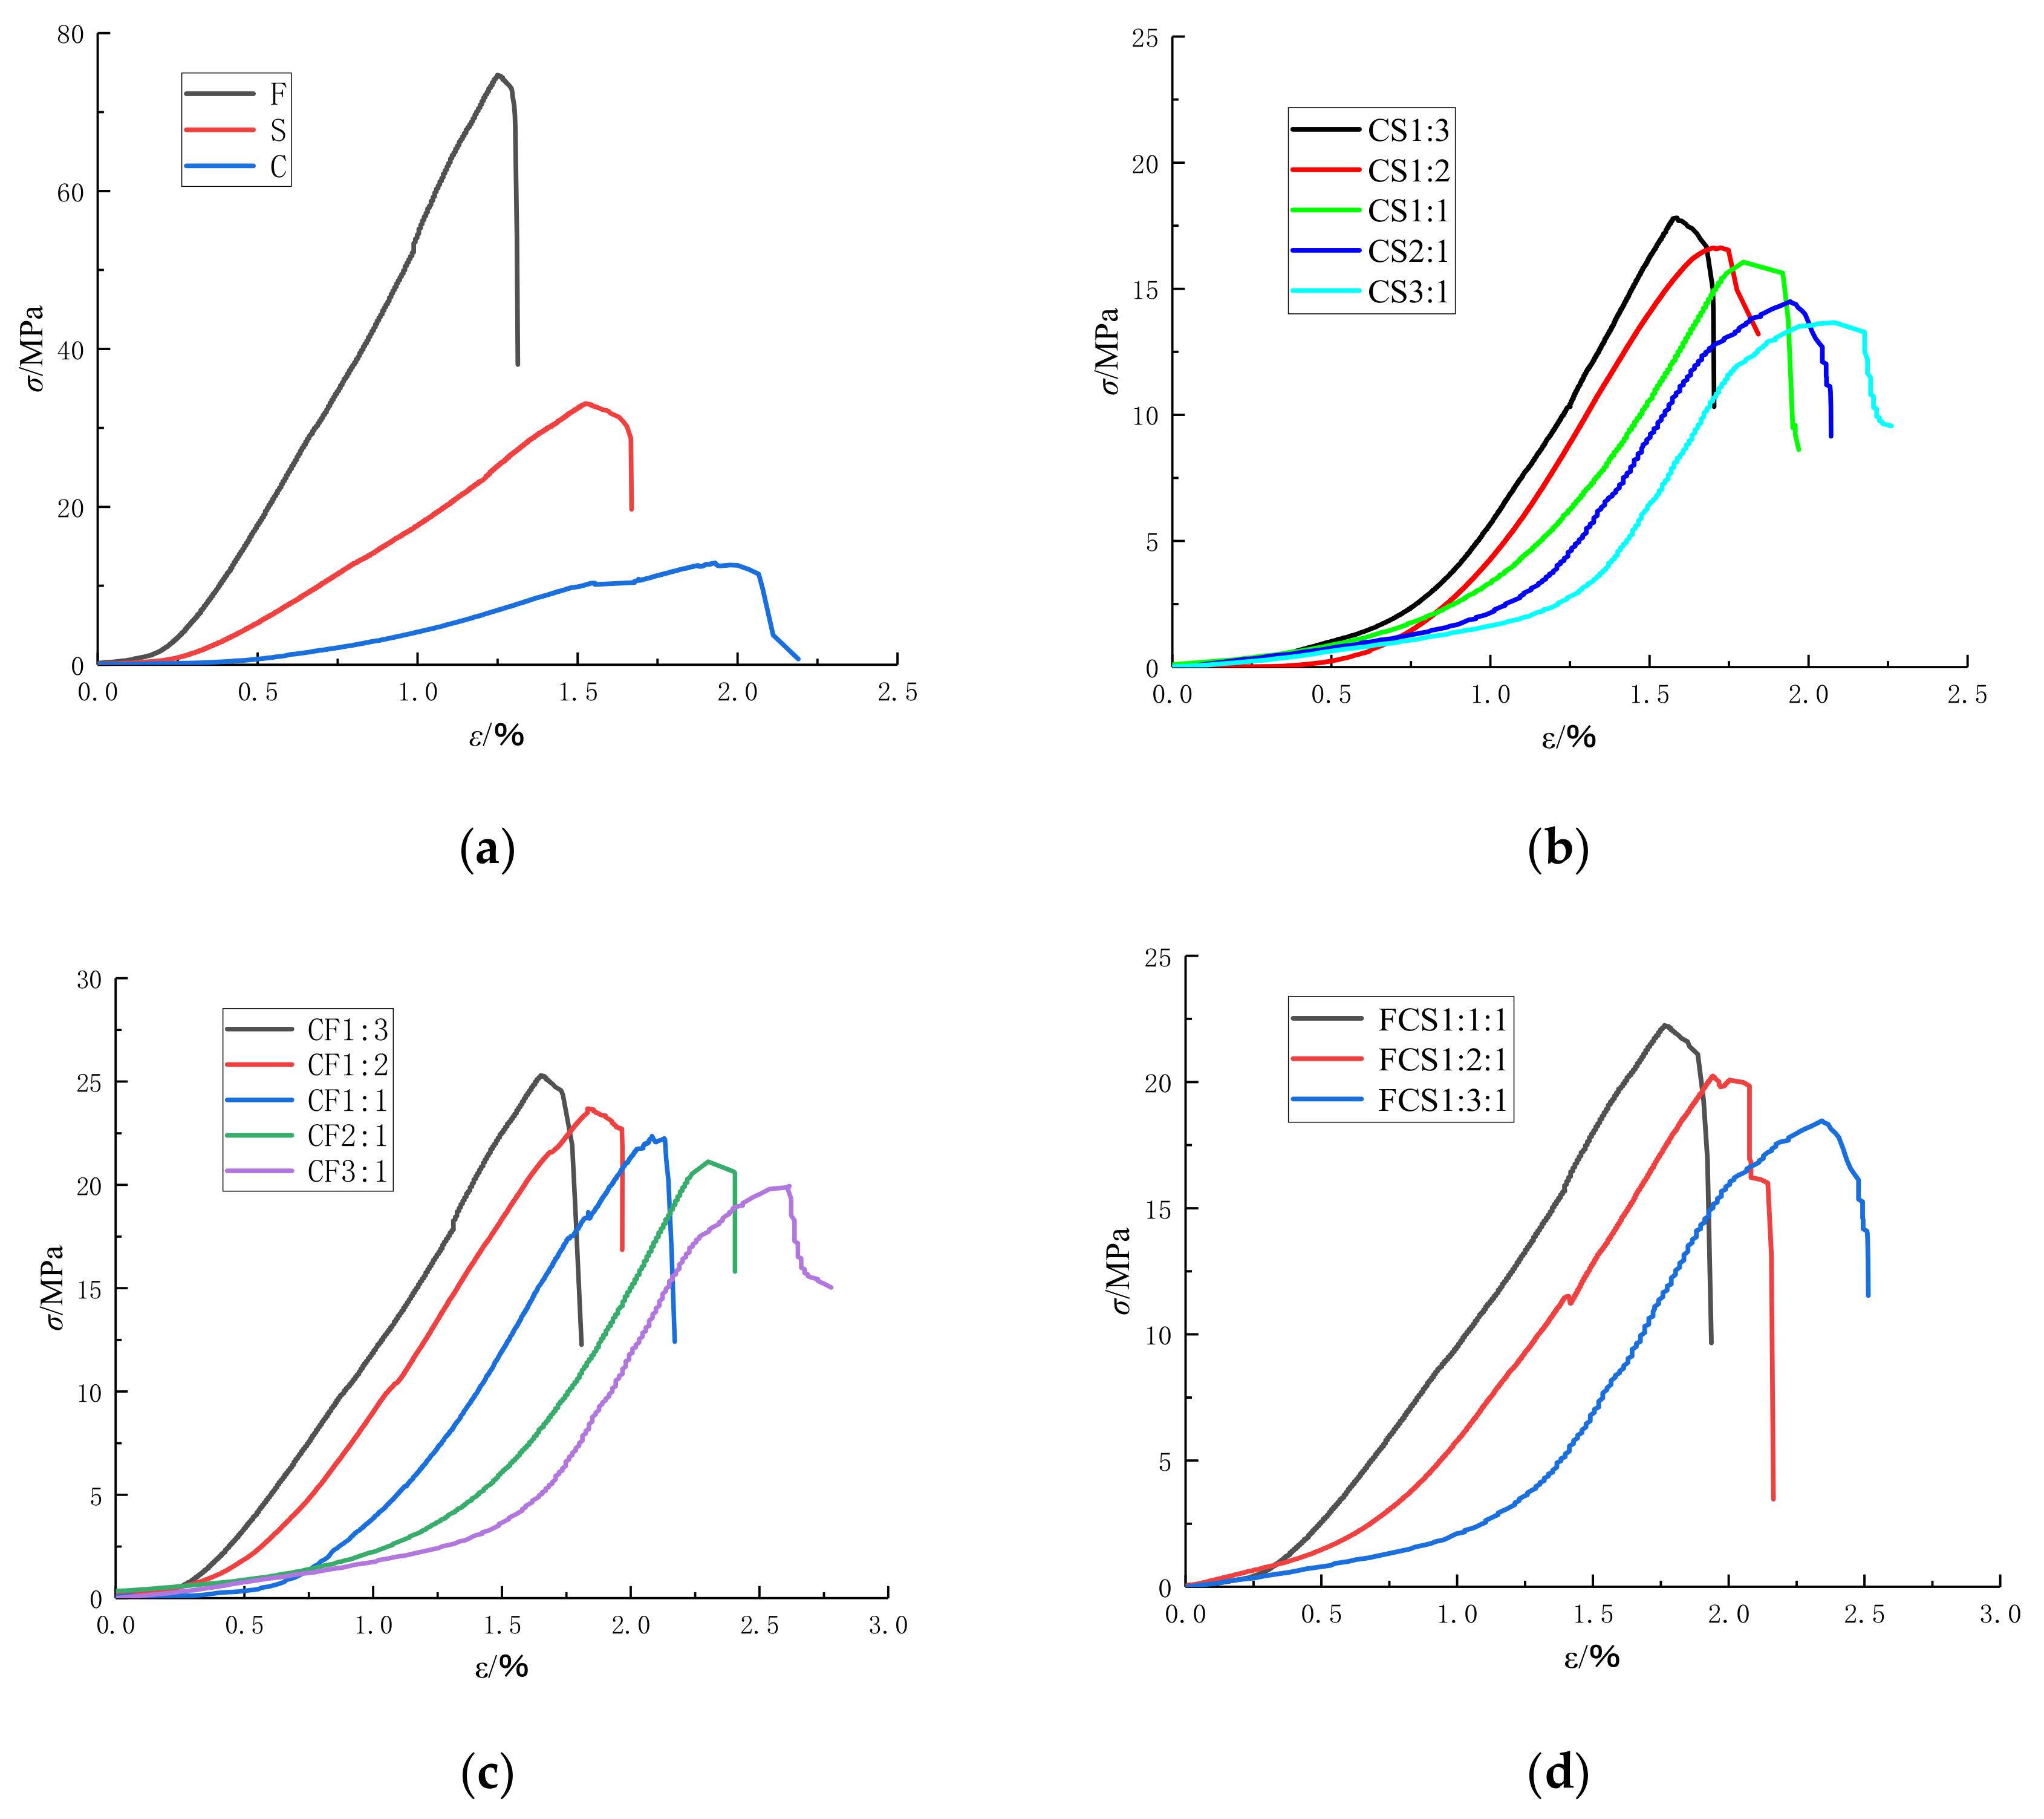
2.3. Stress–Strain Curve of Coal–Rock Combination
After the sample was made, the 0.05 mm/s loading rate was used to experiment, and the corresponding
σ-
ε curves of F, S, C monomers and CS, CF, and FCS combinations were obtained. The
σ-
ε curves for various structures formed from the combination of coal and rock are displayed in
Figure 3. Here,
σ is the axial stress, and
ε is the axial strain.
We extracted and compared the mechanical parameters of the monomer and combination in
Figure 3 and obtained the mechanical parameter data of the combination, as shown in
Table 1.
3. Strength and Elastic Modulus Analysis of Combination
The correlation between the strength and elastic modulus of the coal–rock monomer and combination can be ascertained through the analysis of the mechanical parameters outlined in
Table 1, which allows us to examine the effect of the coal thickness and lithology on the strength and modulus of the combination.
3.1. Relationship between Strength and Elastic Modulus of Coal–Rock Combination and Coal–Rock Monomer
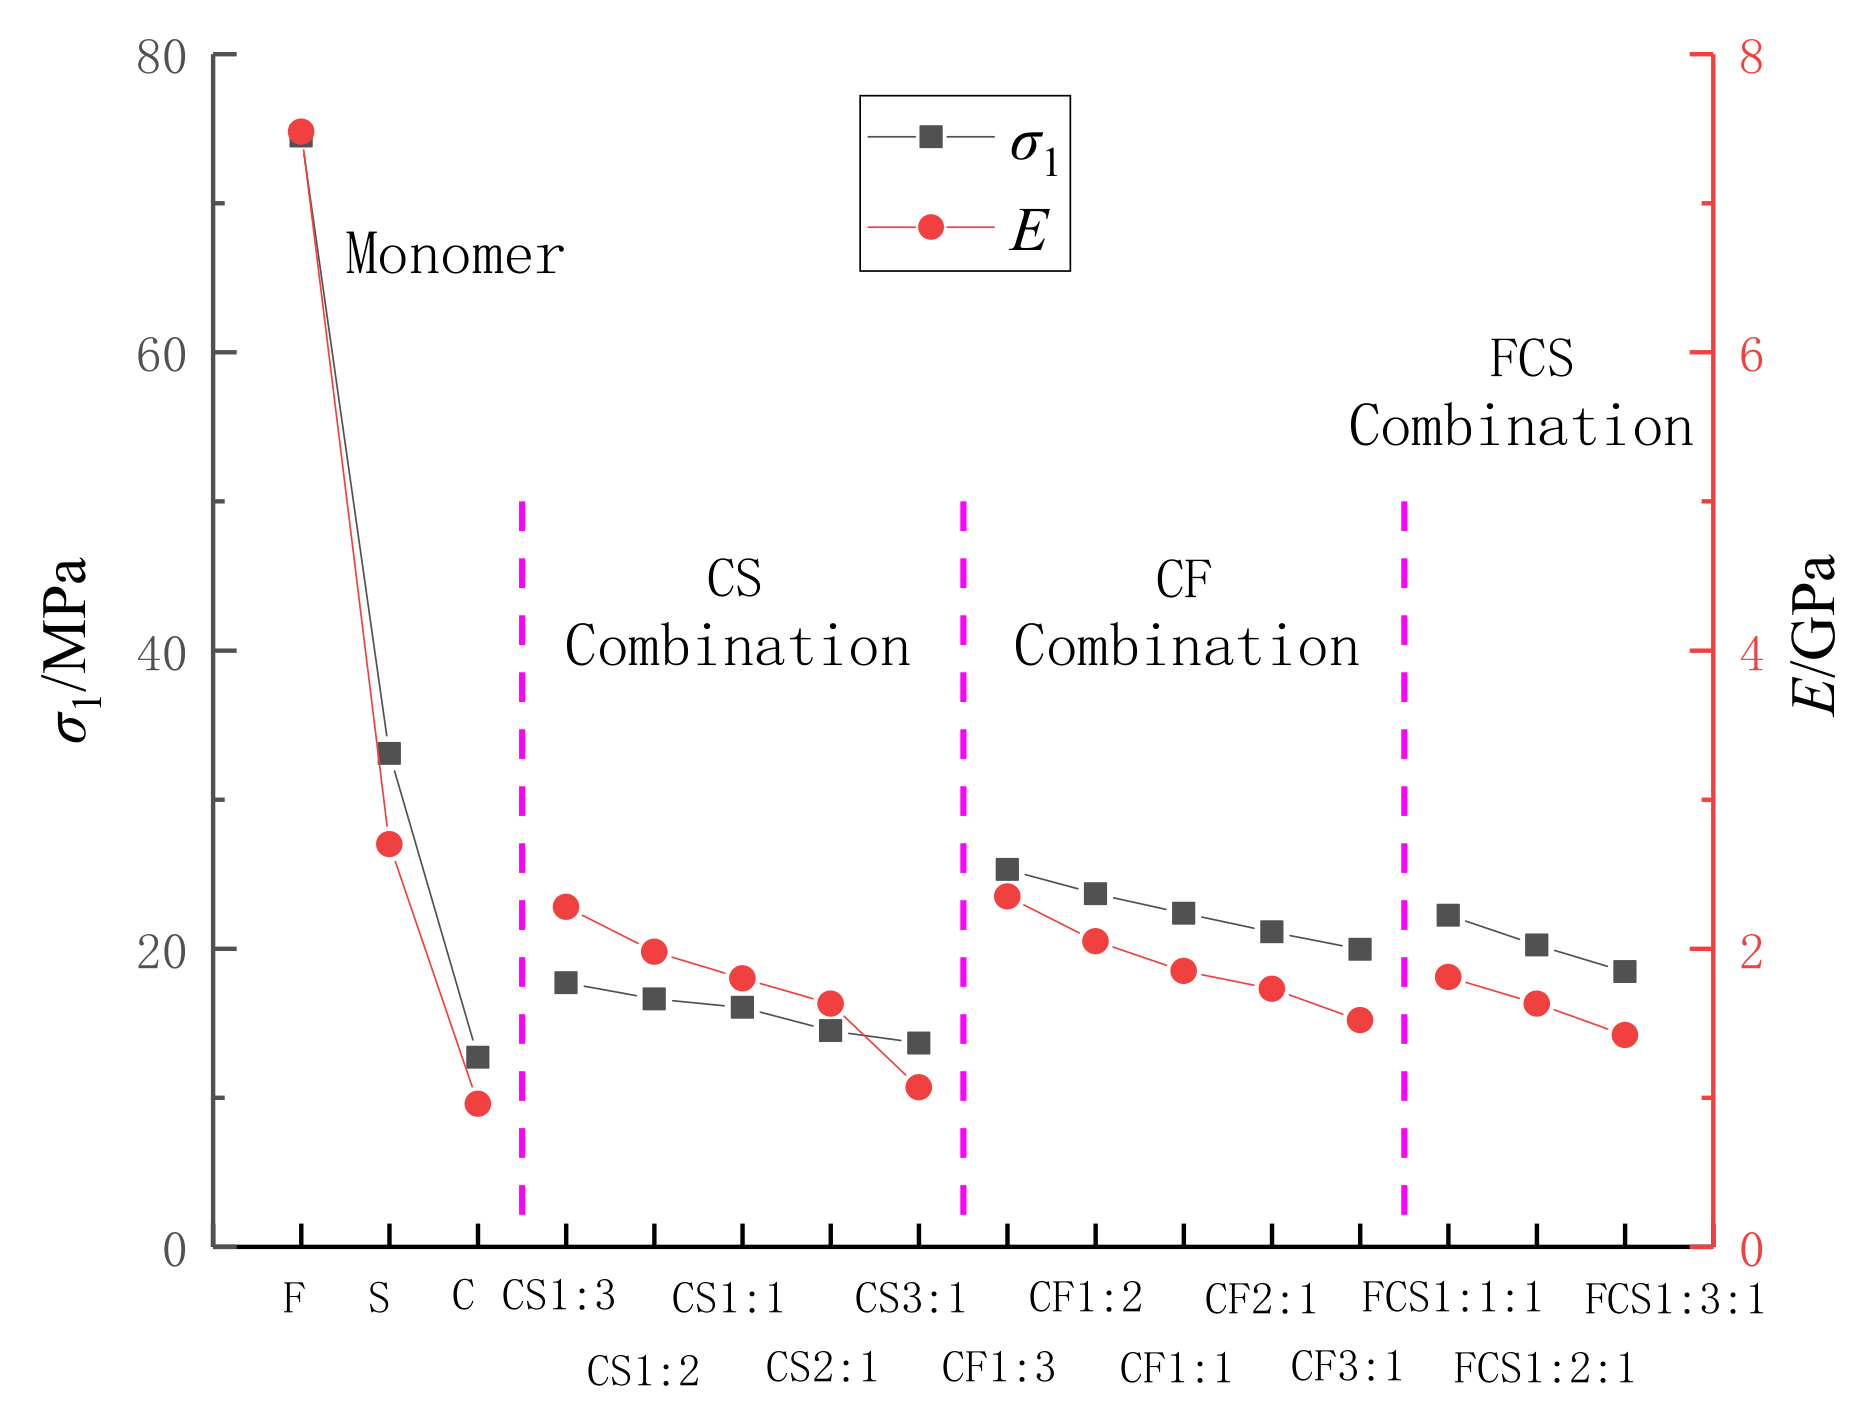
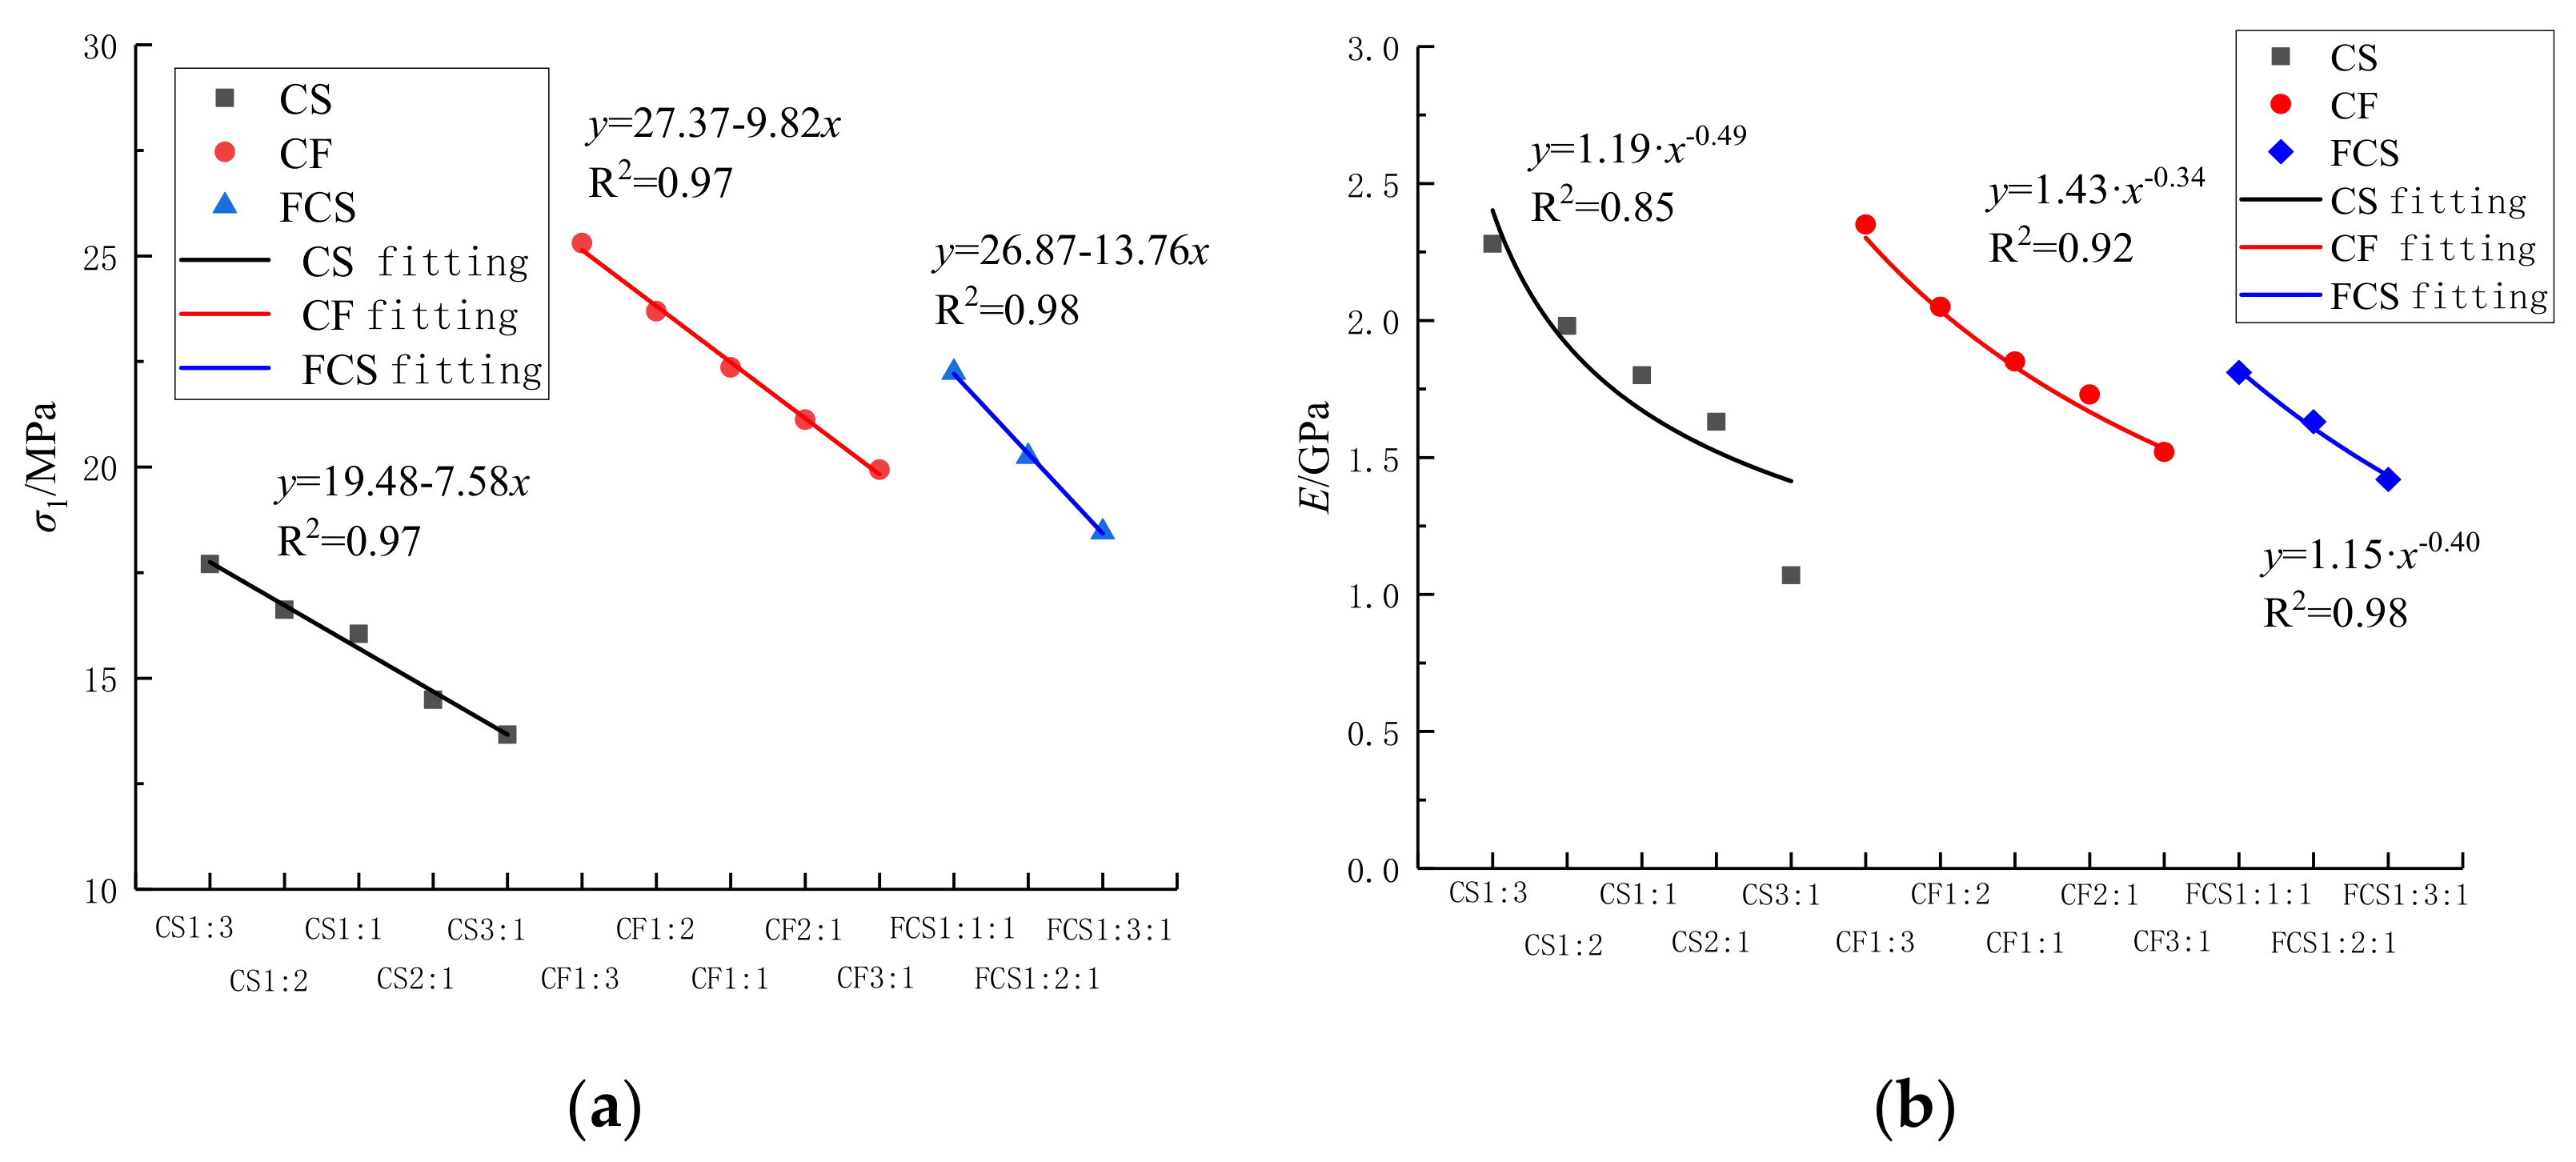
The peak strength and elastic modulus of various coal–rock combinations are displayed in
Figure 4, demonstrating their distribution characteristics. Here,
σ1 denotes the peak strength, and
E represents the elastic modulus.
Table 1 and
Figure 4 demonstrate that the monomer’s peak strength and elastic modulus follow the F > S > C order. The binary combination of peak strength and elastic modulus demonstrates that CS is more significant than C and less than S, and CF is more excellent than C and less than F. The ternary combination FCS peak strength and elastic modulus as a whole is more significant than C and less than F and S. This indicates that the coal–rock combination peak strength and elastic modulus are both between the coal and the rock strengths but are closer to the coal monoliths.
3.2. Influence of Coal Thickness on the Strength of Combinations
To analyze the impact of the coal thickness on the strength of the combination, we extracted the combination’s peak strength and elastic modulus data in
Table 1. We established the correlation between the coal–rock combination’s peak strength, elastic modulus, and height ratio, as illustrated in
Figure 5.
The data presented in
Figure 5 show that as the C thickness ratio increases, the peak strength and elastic modulus of CS, CF, and FCS decrease. The peak strength and C thickness of the combination CS, CF, and FCS are represented by the expressions
y = 19.48 − 7.58
x,
y = 27.37 − 9.82
x, and
y = 26.87 − 13.76
x, respectively, and the elastic modulus of the combination CS, CF, and FCS are represented by the ratios of the thicknesses of the combinations to the thicknesses of the C. The CS, CF, and FCS to the thicknesses of the C are represented by the expressions
y = 1.19
x−0.49,
y = 1.43
x−0.34, and
y = 1.15
x−0.40 expressions; this is mainly because the more significant the proportion of C in the combinations, the smaller the axial pressure required for the combinations to undergo axial deformation, and thus the smaller the peak strength and modulus of elasticity of the combinations. Therefore, it can be concluded that the peak strength of the combination is directly linked to the proportion of coal thickness. At the same time, the elastic modulus exhibits an inverse relationship with the ratio of coal thickness.
3.3. Influence of Lithology on the Strength of Combinations
From
Figure 5, it can be seen that the ratio of CS, CF peak strength, and C thickness of the combination conforms to the expressions of
y = 19.48 − 7.58
x and
y = 27.37 − 9.82
x, respectively; the ratio of CS and CF elastic modulus to C thickness of the composite conforms to the expressions of
y = 1.19
x−0.49 and
y = 1.43
x−0.34, respectively. The variations in peak strength and elastic modulus reduction rate of combinations are primarily due to differing rock strength and elastic modulus of various lithologic combinations. When the coal thickness is constant, the peak strength and elastic modulus of CS and CF combinations are as follows: CF1: 3 > CS1: 3, CF1: 2 > CS1: 2, CF1: 1 > CS1: 1, CF2: 1 > CS2: 1, CF3: 1 > CS3: 1. This demonstrates that the more significant the strength and modulus of elasticity of the rock, the more significant the peak strength and modulus of elasticity of the combination of various combinations of equal coal thickness.
4. Energy Accumulation Law of Coal–Rock Combination Body
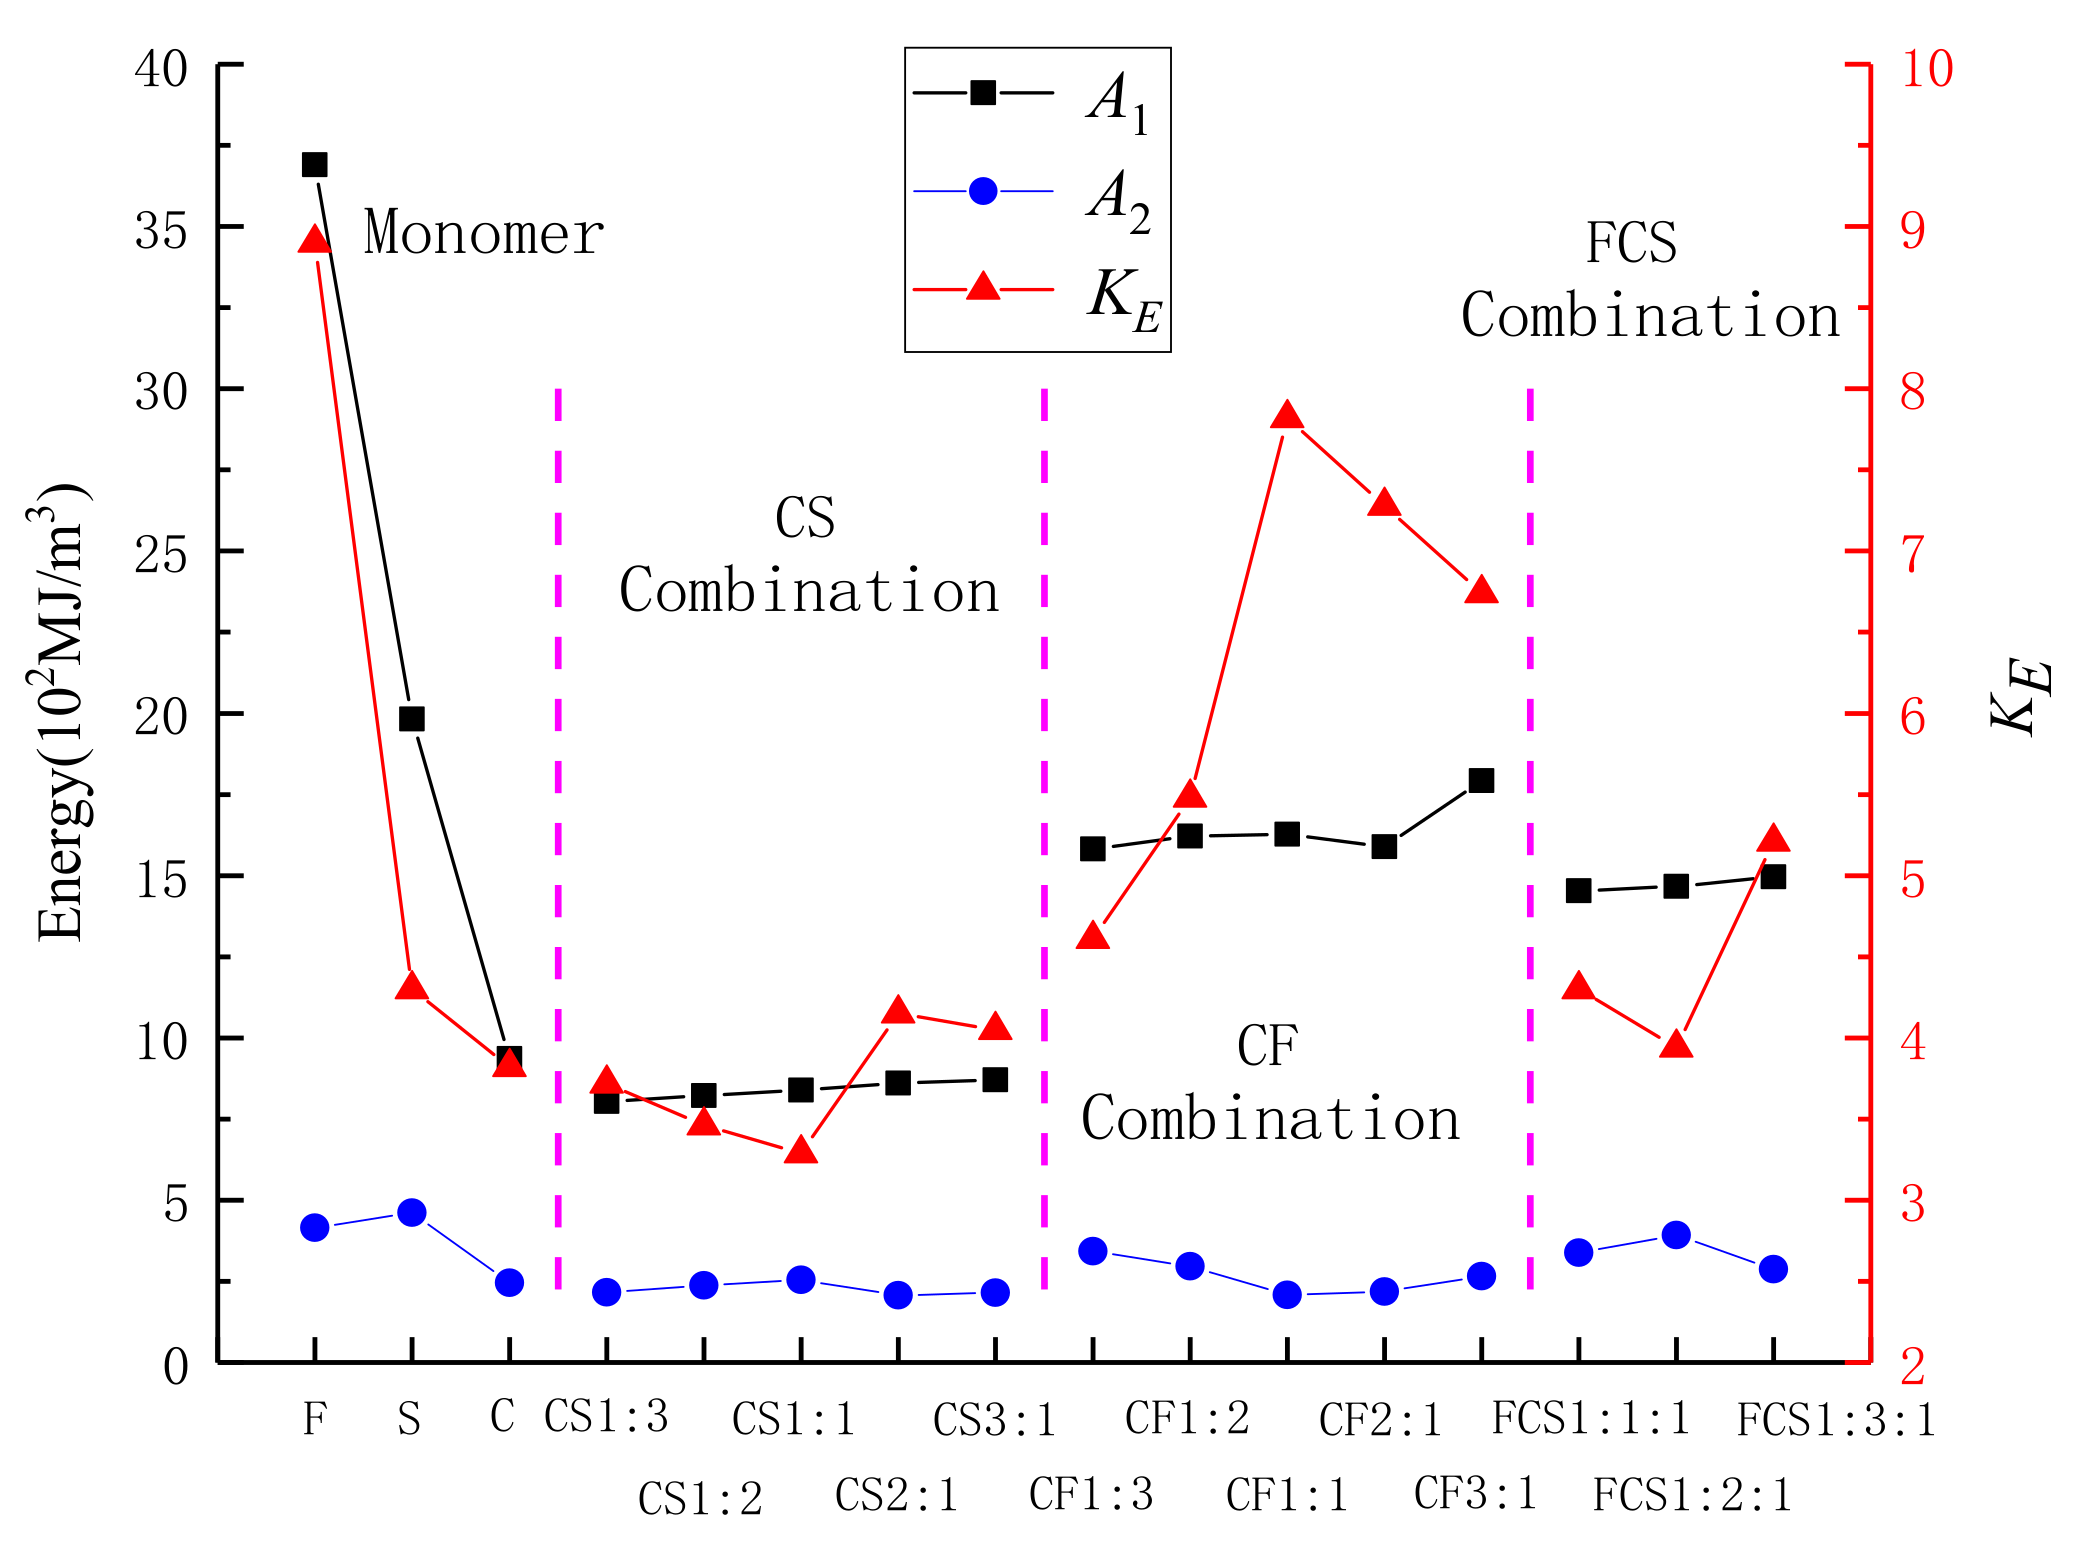
The patterns of variation in pre-peak energy, post-peak energy, and impact energy index were examined to determine the influence of lithology and coal thickness on the energy accumulation behavior of the combination.
4.1. Energy Accumulation Characteristics of Combination Body
The abbreviations used were
A1 for pre-peak energy and
A2 for post-peak energy. The impact energy index is the ratio of the pre-peak accumulated deformation energy to the post-peak consumed deformation energy of the stress–strain curve of the specimen under uniaxial compression, which better reflects the energy accumulation and consumption process. It is expressed by
KE and calculated as follows:
The
A1 and
A2 data are extracted from
Table 1, and then
KE is calculated by Equation (1), leading to the energy distribution law of various combinations. The derived law is illustrated in
Figure 6.
From the data presented in
Figure 6, it is evident that the energy accumulation of the monomers is different from that of the combinations, and the pre-peak energy of the monomers is F > S > C, indicating that the pre-peak energy accumulation of the rock is more significant than that of the coal. The pre-peak energy exhibited by binary combinations suggests that CS exceeds C and is below S, while CF surpasses C and is lower than F. These findings indicate that the lithology significantly impacts the pre-peak energy of the combination. The peak energy of the ternary combination of FCS is greater than that of C but less than that of S and more significant than that of CS. It is slightly less than that of CF, indicating that F has a particular effect on the buildup of pre-peak energy in the ternary combination of FCS. Furthermore, due to F’s significant strength and modulus of elasticity compared to S and C, F can be considered a hard rock layer, suggesting that the hard rock layer plays a role in the buildup of pre-peak energy in the combination.
No apparent pattern is discernible in the post-peak energy of the combinations. The energy impact index of the combinations shows that CF is more significant than CS, and FCS is greater than CS, indicating that the greater the rock strength and elastic modulus, the more significant the energy impact index of the combination.
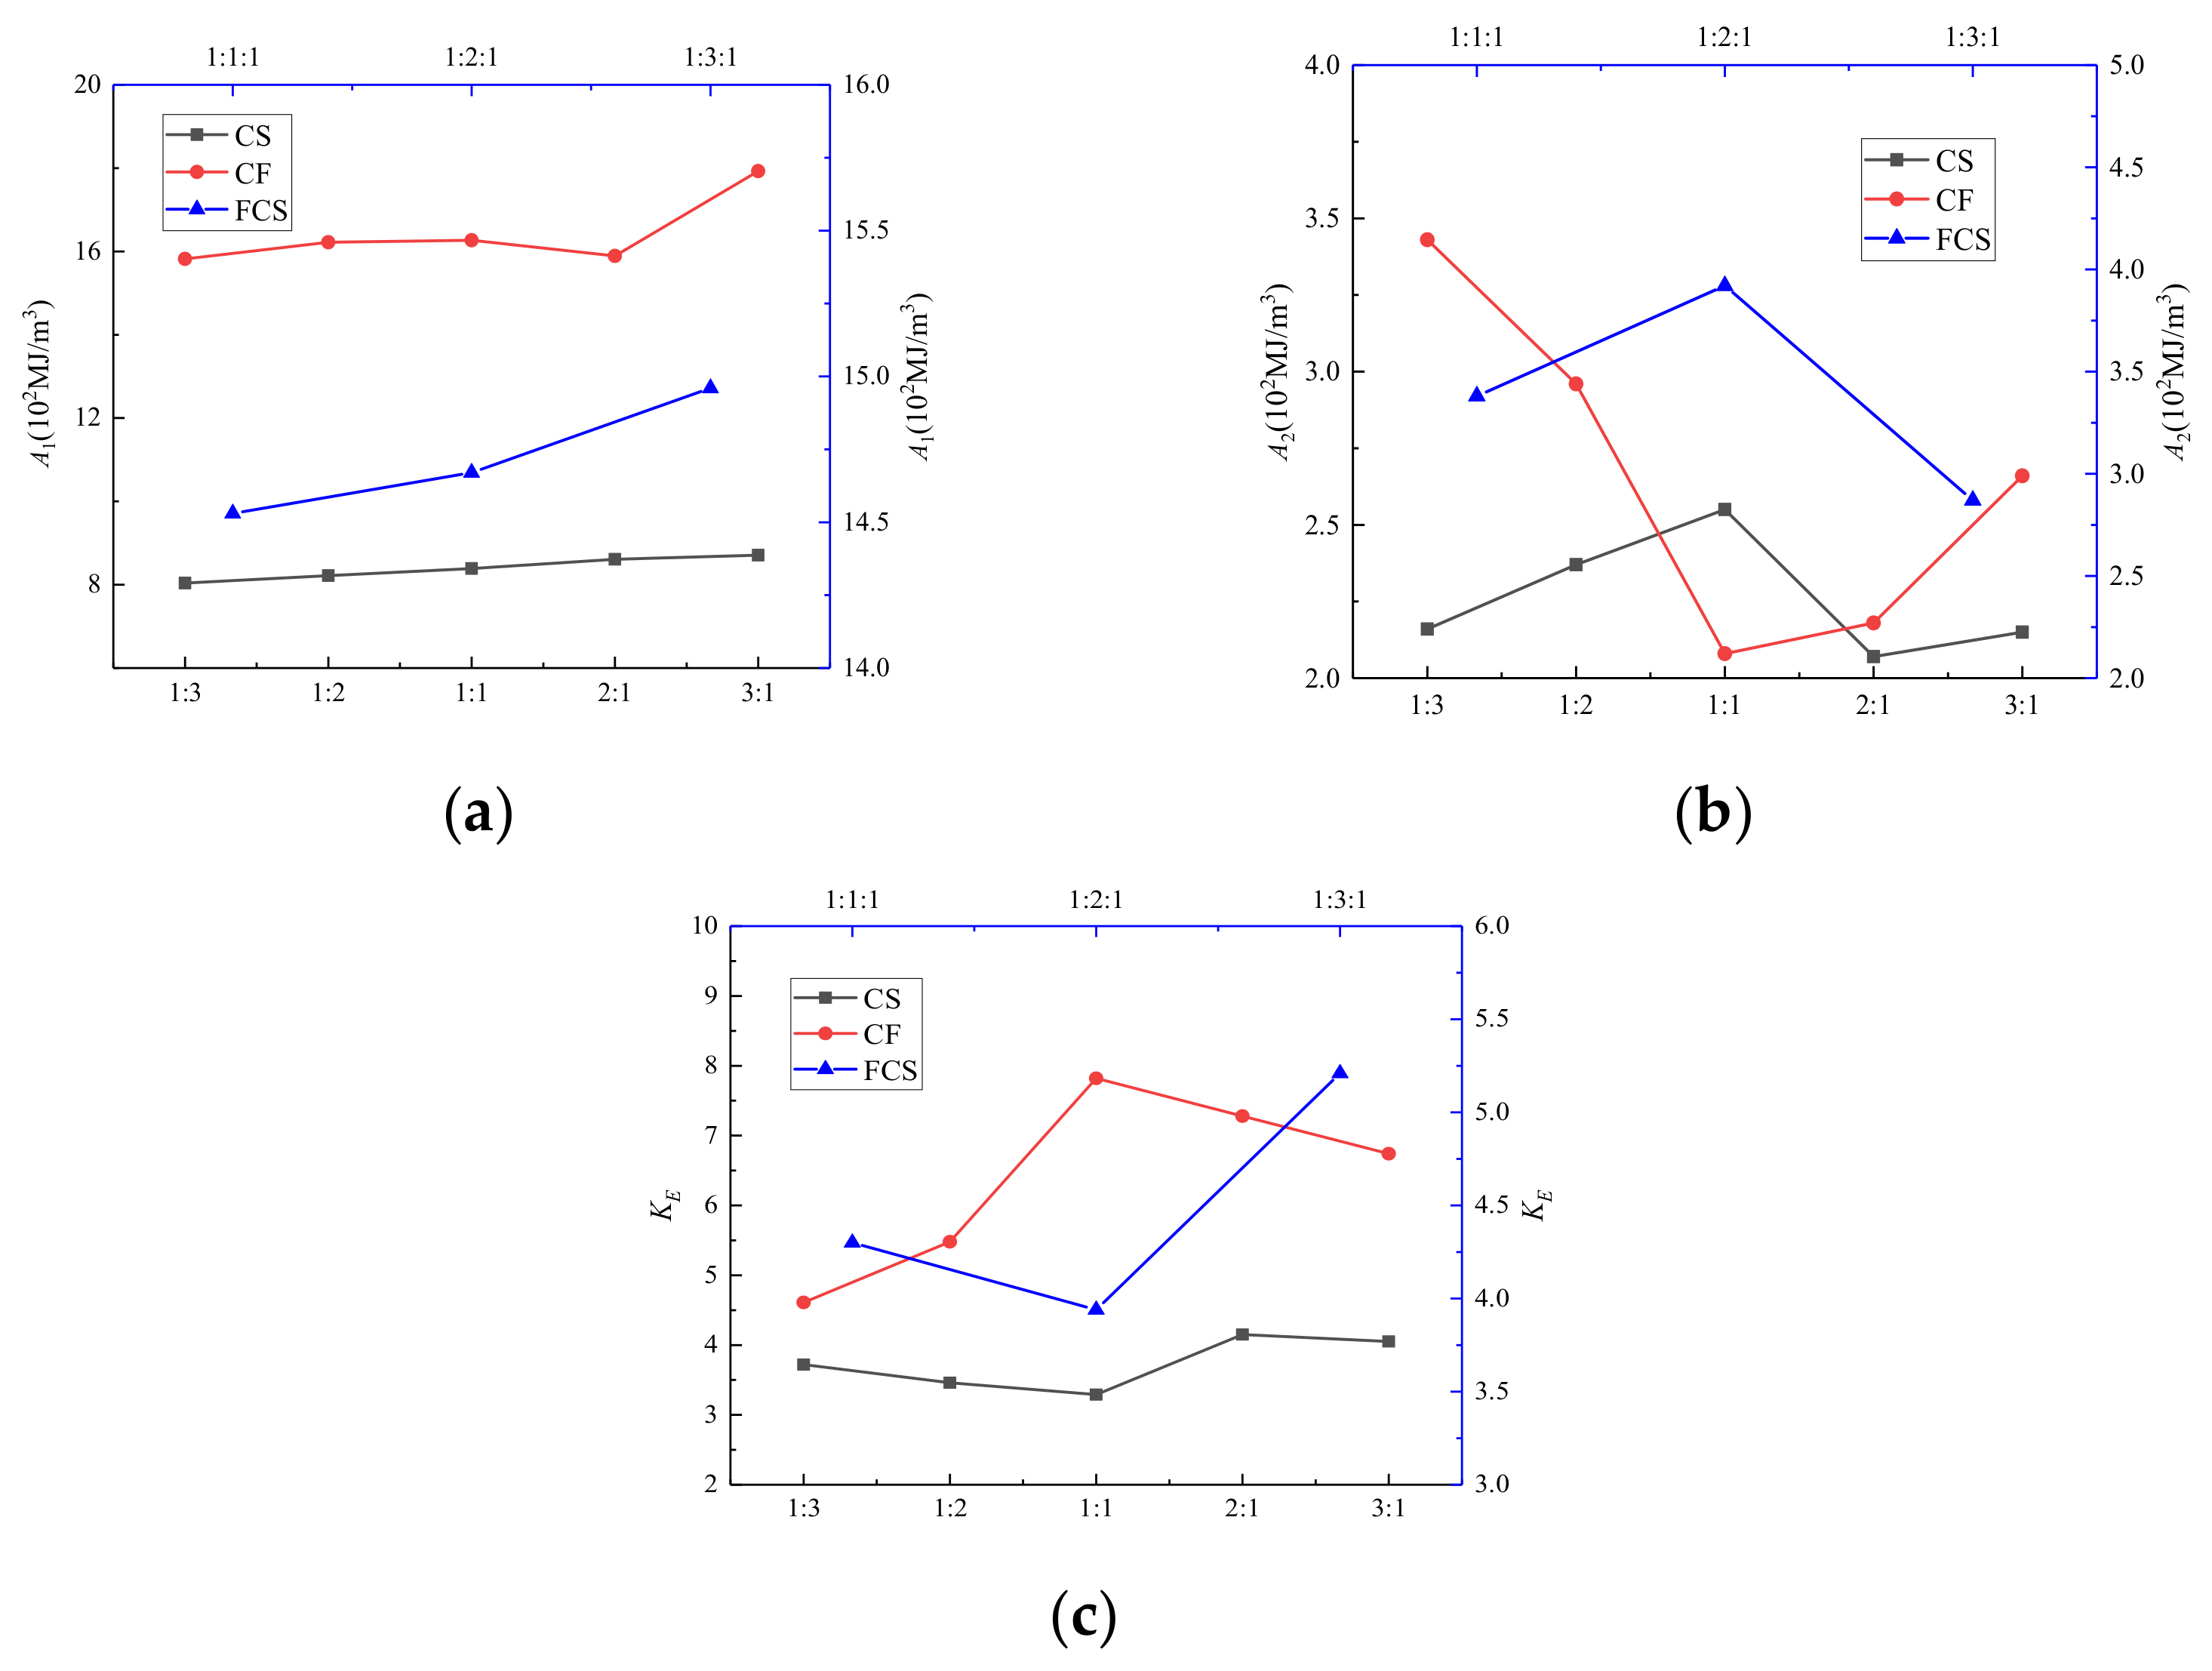
4.2. The Influence of Coal Thickness on the Energy Accumulation Characteristics of the Combination
When the coal thickness varies, we extract the relevant data from
Table 1 and depict the resulting energy change profile for different combinations of coal thickness, as shown in
Figure 7.
Figure 7a demonstrates that the CS and CF pre-peak energy of the binary combinations are arranged in descending order as CS1:3 < CS1:2 < CS1:1 < CS2:1 < CS3:1 and CF1:3 < CF1:2 < CF1:1 < CF2:1 < CF3:1, respectively. In addition, the FCS pre-peak energy of the ternary combination is arranged in descending order as FCS1:1:1 < FCS1:2:1 < FCS1:3.1. This observation suggests a gradual increase in the pre-peak energy of the combination as the percentage of C thickness is augmented.
As indicated in
Figure 7b, as the C thickness percentage increases, the post-peak energy of the combination shows the trend of CS and FCS increasing and then decreasing; on the contrary, CF shows the direction of reducing and then expanding, and the fluctuation range of post-peak energy of the combination CS, CF, and FCS are 2.07~2.55 (10
2 MJ·m
−3), 2.08~3.43 (10
2 MJ·m
−3), and 2.87~3.43 (10
2 MJ·m
−3), respectively. There is no apparent regularity in the post-peak energy of the combination with the more significant coal thickness percentage; the range of post-peak energy fluctuation of the CF combination is more extensive than that of the CS combination, which shows that the larger the rock strength and elastic modulus are, the larger the range of post-peak energy fluctuation of the combination.
According to
Figure 7c, binary combination CS and CF exhibit a fluctuation range of impact energy index between 3.29 and 4.15 and 4.61 and 7.82, respectively. Additionally, ternary combination FCS shows a fluctuation range of impact energy index between 3.94 and 5. 21. The impact energy index of combination is affected by the lithology, with greater peak strength and modulus of elasticity in rocks resulting in the broader fluctuation range. The lithology affects the combination’s impact energy index, with greater peak strength and modulus of elasticity in rocks, resulting in a broader fluctuation range. Generally, an increasing trend in the impact energy index of the combination is observed with a more significant proportion of coal thickness.
The results suggest that a higher percentage of coal thickness in the combination leads to an increase in the pre-peak energy accumulation. The post-peak energy displays no clear patterns, while the impact energy index indicates a rising trend.
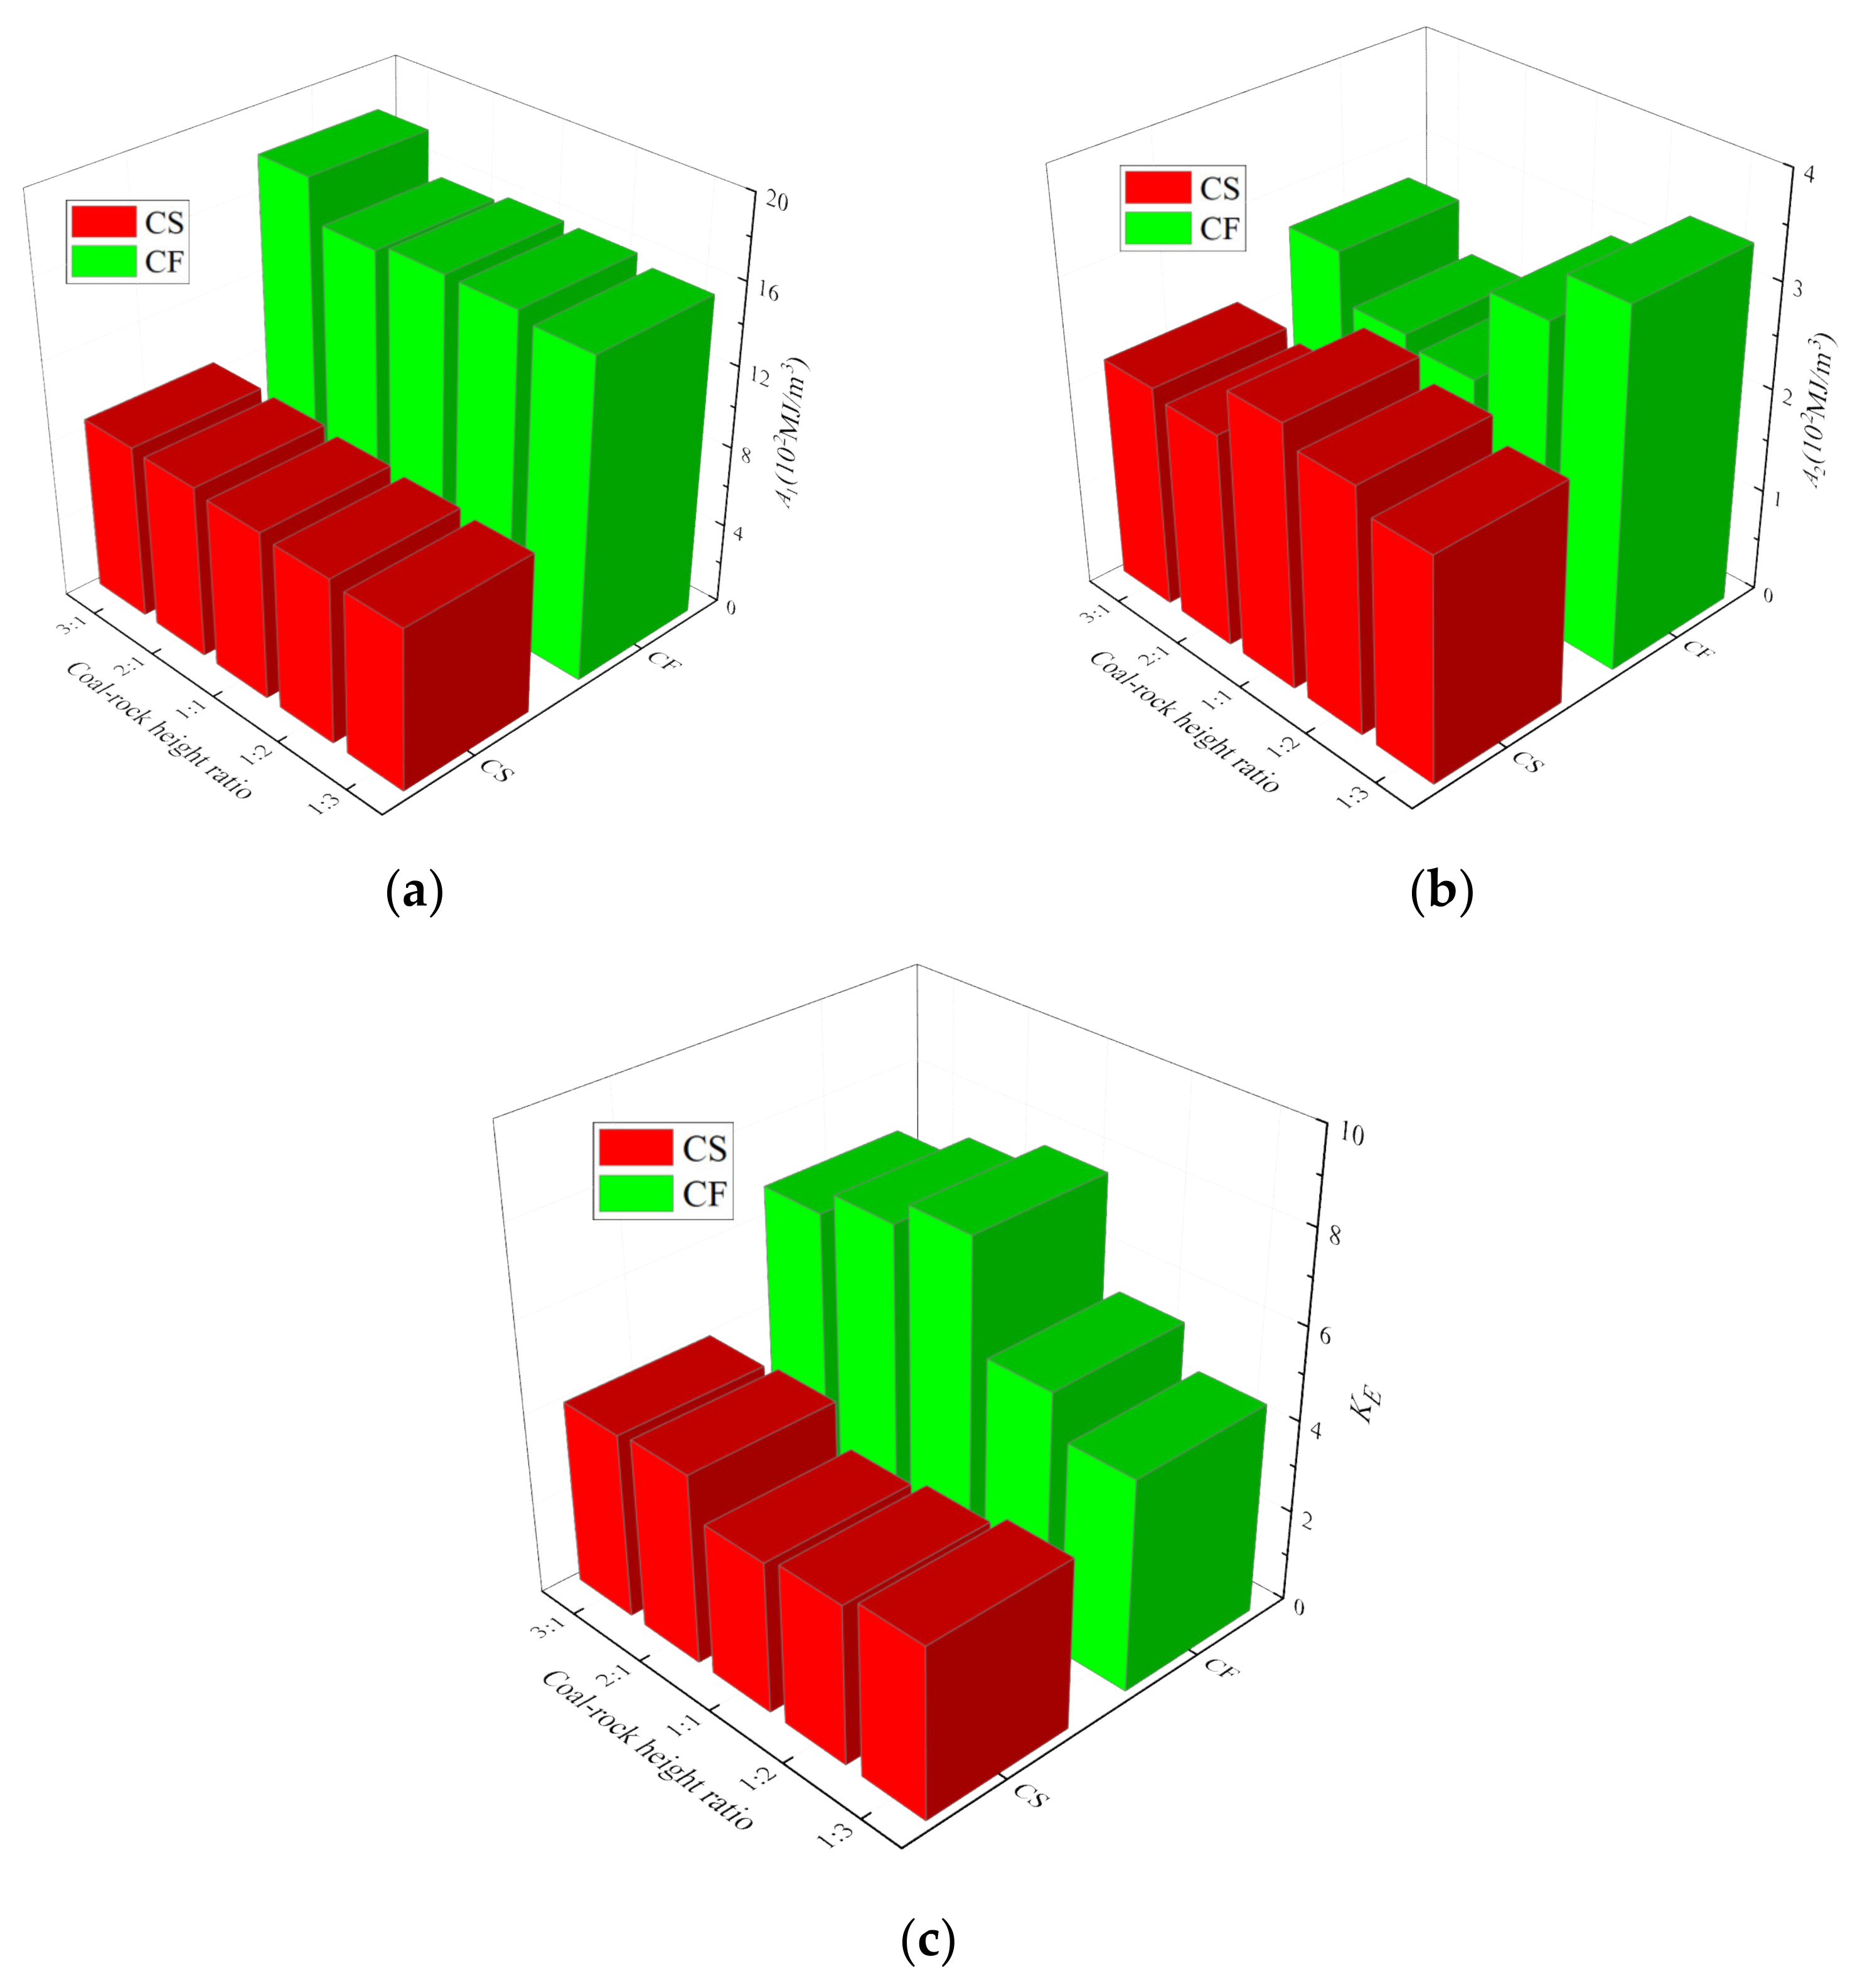
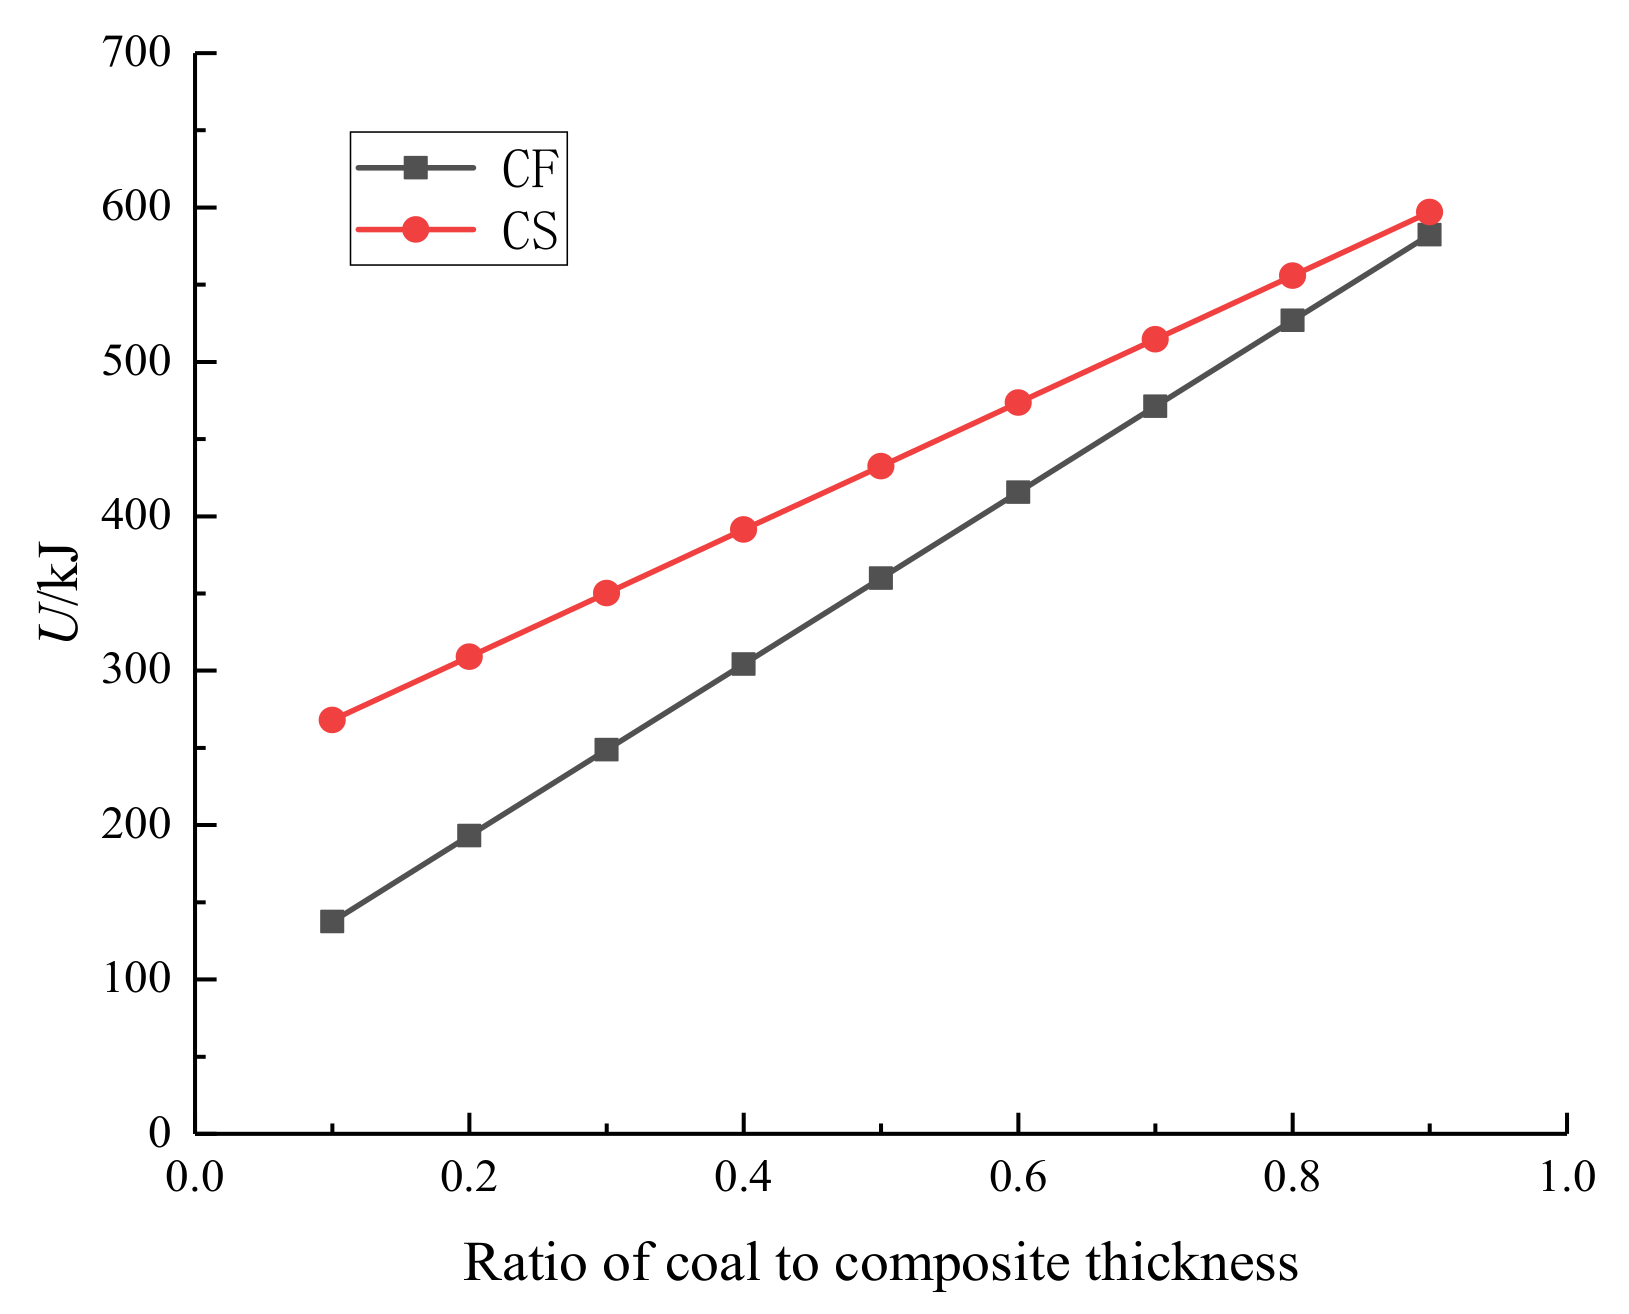
4.3. The Influence of Lithology on the Energy Accumulation Characteristics of the Combination
We extracted energy data from CS and CF combinations of equal coal thickness and plotted different combination energy change curves (
Figure 8).
When the coal thickness is constant,
Figure 8a shows that the pre-peak energy of CS and CF vary as follows: CF1:3 > CS1:3, CF1:2 > CS1:2, CF1:1 > CS1:1, CF2:1 > CS2:1, and CF3:1 > CS3:1. In addition, the pre-peak energy of the CF combination is more significant than that of the CS combination. As the F peak strength and elastic modulus are more significant than the S, the more significant the peak rock strength and elastic modulus, the greater the pre-peak energy buildup of the combination.
Figure 8b shows that the post-peak energy of the combination CS fluctuates in the range of 2.07~2.55 (10
2 MJ · m
−3). The CF post-peak energy of the combination fluctuates in the range of 2.08~3.43 (10
2 MJ · m
−3). The post-peak energy fluctuation range of the CS combination is significantly smaller than that of the CF combination. It shows that the larger the rock monomer’s peak strength and elastic modulus, the more extensive the post-peak energy fluctuation range of the combination.
As shown in
Figure 8c, when the coal thickness is equal, the CS and CF impact energy index of the combinations are CF1:3 > CS1:3, CF1:2 > CS1:2, CF1:1 > CF1:1, CF2:1 > CS2:1 and CF3:1 > CS3:1. The fluctuation range of the CS and CF impact energy index of the assemblage is 3.29~4.15, respectively, 4.61~7.82. In addition, the rock’s peak strength and elastic modulus directly affect the impact energy index, with larger values suggesting a higher impact potential.
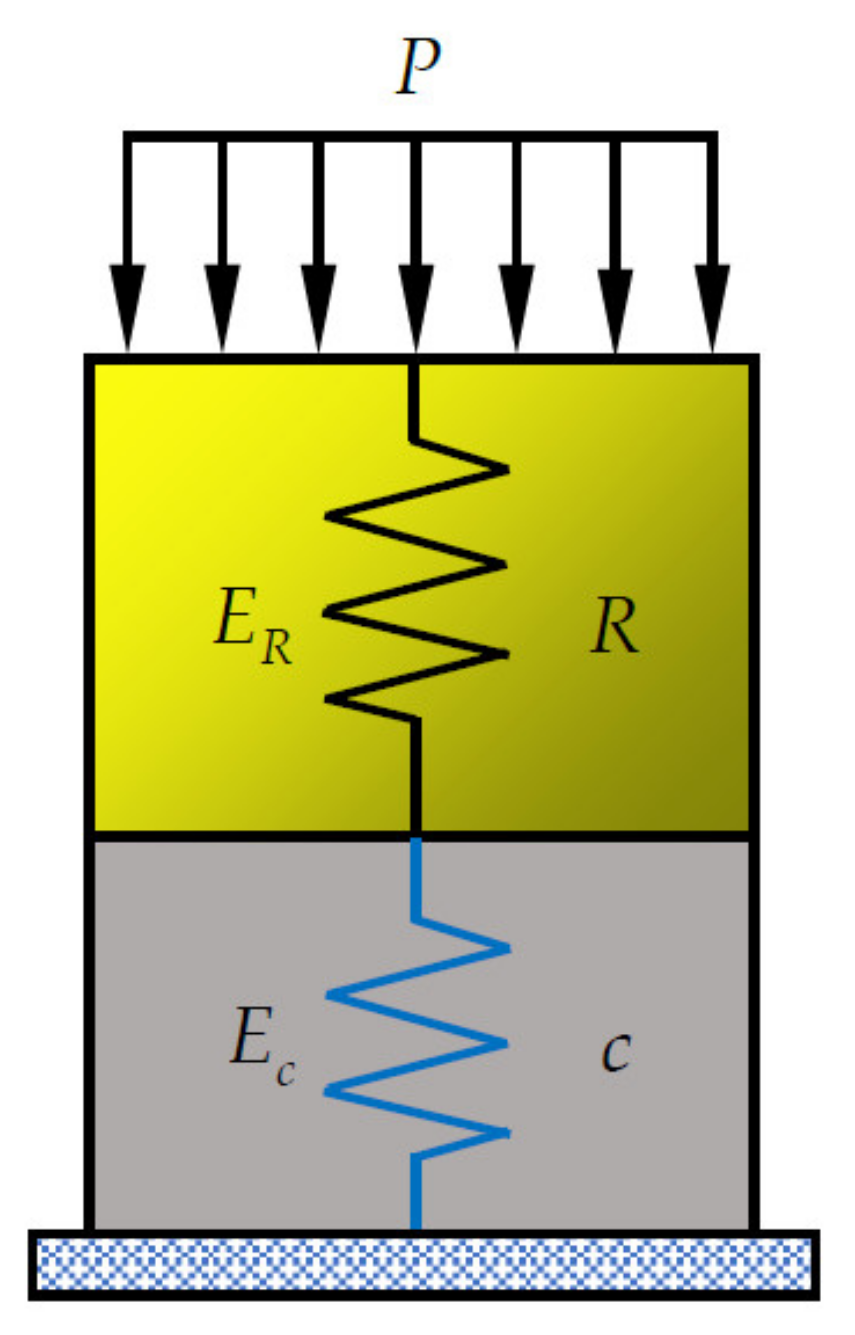
5. Coal–Rock Combination Structure Model
5.1. Mechanical Model of Coal–Rock Combination Structure
Under the assumption that the coal–rock structure is in an elastic state before the damage occurs, the coal–rock structure is represented as a spring structure consisting of two elastic elements connected in series [
15], as the model shown in
Figure 9.
Under mining stress P, coal and rock are subject to deformation to a certain extent, while their stress distribution is equivalent. Assuming that the overall elastic modulus of the combination is E, the height of coal and rock is
hc and
hR, respectively, the deformation is Δ
hc and Δ
hR, respectively, and the elastic modulus is
Ec and
ER, respectively.
Equation (4) can be obtained by substituting Equations (2) and (3) into Equation (4). It can be seen that when the total height of the coal–rock combination remains unchanged, and the elastic modulus of coal and rock remains intact, the overall elastic modulus of the combinations decreases with the increase of coal thickness hc.
5.2. Relationship between Combinations of Stress and Coal Thickness
Assuming that the same strain
ε occurs after the coal and coal–rock structures are stressed, it can be seen from the elasticity [
24]:
The stress of coal–rock structure is compared with that of coal [
16,
25], that is
As can be seen from Equation (8), Ec < ER, Ec/ER < 1, hc/H < 1, Ec/ER+ (1-Ec/ER) hc/H < 1, that is, Pc < PcR. When the coal and rock strain is the same, the stress on the coal–rock structure is more significant than that on coal. Meanwhile, the stress of surrounding rock in the coal thickness thinning region is more significant than that in the coal thickness changing area, and the more significant the proportion of coal thickness, the smaller the stress in the coal thickness changing region.
5.3. Relationship between Combinations of Energy and Coal Thickness
There is a commonly held belief that the coal body is destroyed when mining stress reaches its maximum, and the stress of the coal–rock combination reaches its peak. The minimum energy theory of rock mass failure posits that the energy consumed by coal and rock mass failure is the energy under a unidirectional stress state. The energy expended during coal and rock mass failure is typically associated with a unidirectional stress state [
26,
27,
28].
From the laboratory determination of mechanical parameters and the field test of Pinggang Coal Mine and the results, the elastic modulus of coal, fine sandstone, and shale are 0.96 GPa, 7.48 GPa, and 2.70 GPa, respectively. The stress concentration coefficients under the influence of mining are 2~2.5, corresponding to stresses of 35.0 MPa and 43.75 MPa. The graph in
Figure 10 demonstrates the correlation between energy accumulation and coal thickness.
Equation (9) and
Figure 10 show that for constant coal and rock elastic modulus, the energy accumulated before the destruction of the formation is directly related to the coal thickness hc. In the case of continuous coal and rock thickness, the greater the modulus of elasticity of the rock, the more energy is accumulated and the greater the possibility of impact hazard. These observations corroborate the results of the experiment.
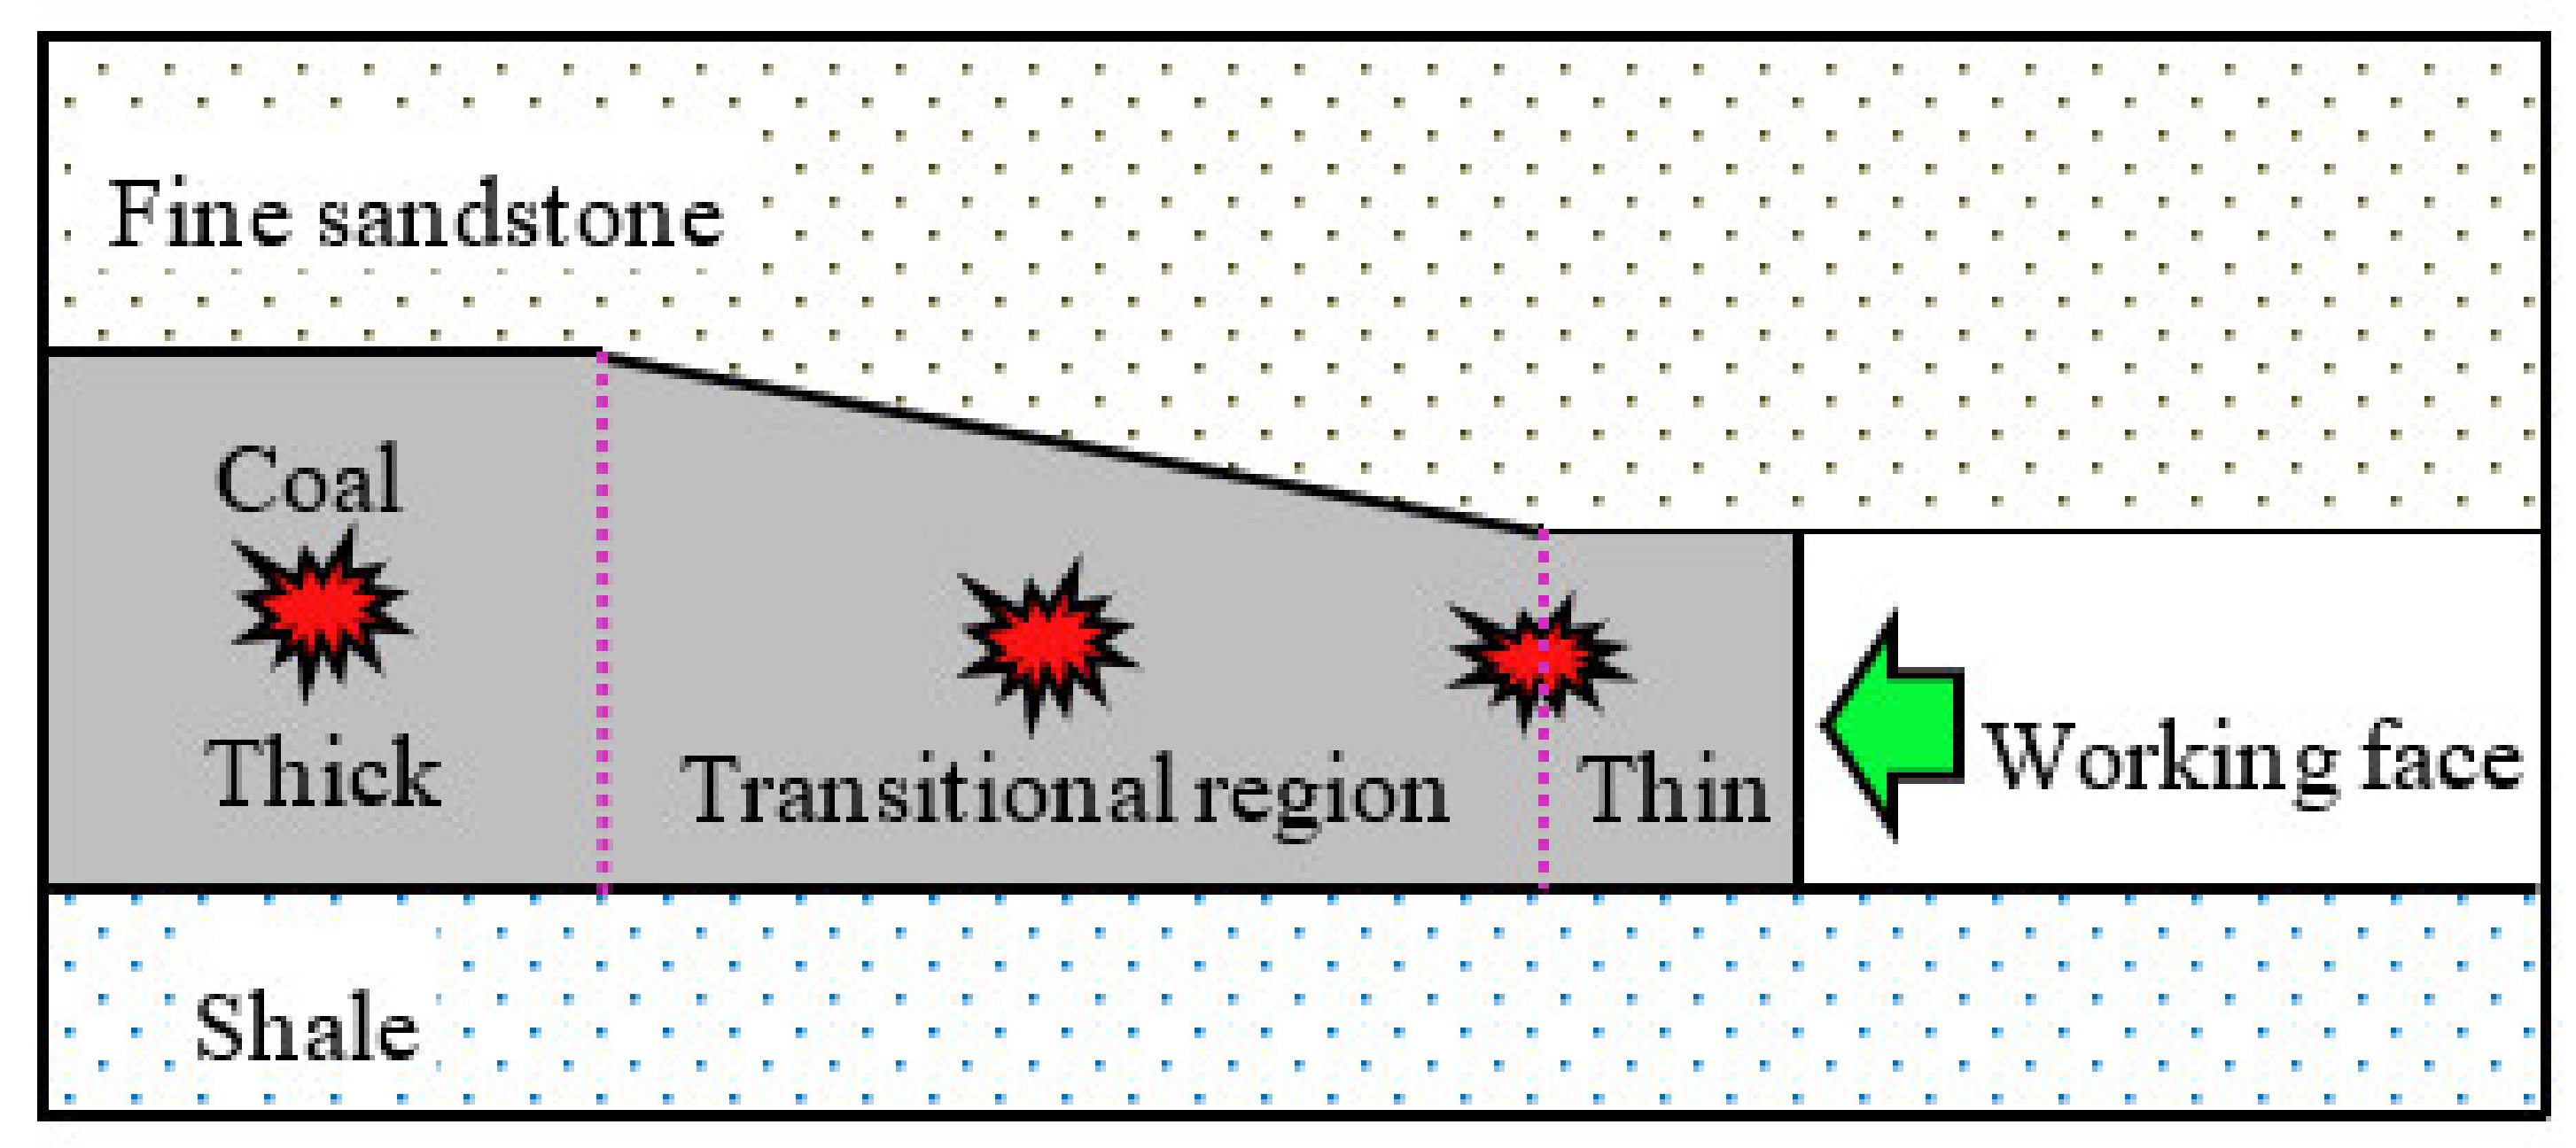
6. Discussion
In coal mining, rock bursts occur due to the stress state of the coal seam and rock stratum and their occurrence conditions. The thickness of the coal seam varies significantly in the local area, and the stress state of the surrounding rock in this area is correlated with the variation in coal thickness and the mechanical properties of the roof and floor.
The above research (
Section 4.2) shows that the surrounding rock stress is negatively correlated with the percentage of coal thickness. The surrounding rock stress is more significant in the area of thinning coal thickness than in the area of thickening, which indicates that during the process of the coal seam changing from thick to thin, the degree of concentration of surrounding rock stress in the area of coal thickness change gradually increases, which is easily induced the rock burst.
The law of energy accumulation in combined strata is influenced by coal thickness, rock strength, and elastic modulus. A higher proportion of coal thickness increases energy accumulation before the combination peak. A thick coal seam area accumulates more energy than a thinner one and thus is more likely to experience rock bursts. The positive correlation between the combined rock strata’s energy accumulation and the rock’s strength and elastic modulus indicates that the bigger the strength of the roof and floor, the more the combined rock strata’s energy accumulation is, and the more prone to rock burst.
In summary, the stress distribution in the area where the thickness of coal changes shows abnormality. There is a significant stress concentration in the region where the coal thickness is thinning. The energy accumulation in thick coal seams is higher than in thin coal seams. Consequently, the surrounding rock where the thickness of the coal changes and in the thick coal seam area is more likely to accumulate energy, leading to dynamic disasters such as rock bursts, as illustrated in
Figure 11.
In this paper, the coal–rock combination is considered a binder, and the coal–rock interface is regarded as a uniform medium, without considering the influence of the coal–rock interface properties on the energy storage and release of the combination. Therefore, the following work will focus on the coal–rock interface properties and the impact of different binders on the energy storage and release of the combination.
7. Conclusions
Rock bursts result from the joint action of coal and rock under the influence of mining. To study the impact of the mechanical properties of coal–rock on rock burst, this paper takes the coal–rock combination as the object, analyzes the effects of different coal thickness and lithology on the mechanical parameters and energy accumulation behavior of the combination, reveals the change of coal thickness and the combination of rock layer stress and energy between, and reaches the following conclusions:
The coal–rock combinations’ peak strength, elastic modulus, and pre-peak energy are between coal and rock. In contrast, the post-peak energy and impact energy indexes show no apparent regularities with coal and rock;
As the coal thickness ratio increases, the peak strength and elastic modulus of combinations gradually decrease, except for strength, which has a clear linear relationship to the coal thickness ratio, and elastic modulus, which has a clear inverse relationship to the coal thickness ratio. The combination’s pre-peak energy and impact energy index shows an apparent positive correlation with coal thickness, while post-peak energy shows no obvious regular pattern;
Coal thickness accounted for the same percentage; the combination’s strength and modulus of elasticity positively correlate with the rock’s strength and elastic modulus. The pre-peak energy of the combination, impact energy index, and rock strength and modulus of elasticity showed a positive correlation, and the hard rock stratum helps the combination pre-peak energy accumulation, the greater the likelihood of its occurrence of impact;
The mechanical model of the coal–rock combination is established. The surrounding rock stress shows a negative correlation with the percentage of coal thickness, and the surrounding rock energy shows a positive correlation with the rate of coal thickness, indicating that surrounding rock stress is more significant in the thinning coal thickness region than in the thickening coal thickness region and surrounding rock energy accumulation is less in the thinning coal thickness region than in the thickening coal thickness region. The abnormal stress distribution and high energy accumulation of surrounding rock in the area of coal thickness change easily induce dynamic disasters such as rock bursts.
Author Contributions
Conceptualization, G.Z.; validation, Z.L.; formal analysis and investigation, Z.L.; data curation, Z.L., Y.L. and W.Z.; writing—original draft preparation, Z.L.; writing—review and editing, Z.L. and Y.L.; supervision, G.L., T.Q. and L.Z. All authors have read and agreed to the published version of the manuscript.
Funding
This work was supported by the Scientific and Technological Key Project of “Revealing the List and Taking Command” in Heilongjiang Province (2021ZXJ02A03, 2021ZXJ02A04) and the National Natural Science Foundation (51774122).
Institutional Review Board Statement
Not applicable.
Informed Consent Statement
Not applicable.
Data Availability Statement
Not applicable.
Conflicts of Interest
The authors declare no conflict of interest.
References
- Wojtecki, Ł.; Iwaszenko, S.; Apel, D.B.; Bukowska, M.; Makówka, J. Use of machine learning algorithms to assess the state of rockburst hazard in underground coal mine openings. J. Rock Mech. Geotech. Eng. 2022, 14, 703–713. [Google Scholar] [CrossRef]
- Dou, L.; Tian, X.; Cao, A.; Gong, S.Y.; He, H.; He, J.; Cai, W.; Li, X.W. Present situation and problems of coal mine rock burst prevention and control in China. J. China Coal Soc. 2022, 47, 152–171. [Google Scholar]
- Cao, J.; Dou, L.; Konietzky, H.; Zhou, K.; Zhang, M. Failure mechanism and control of the coal bursts triggered by mining-induced seismicity: A case study. Environ. Earth Sci. 2023, 82, 168. [Google Scholar] [CrossRef]
- Pan, Y.; Xiao, Y.; Luo, H.; Wang, G.; Shi, T. Study on safety of rockburst mine. J. China Coal Soc. 2023, 48, 1846–1860. [Google Scholar]
- Jiang, F.; Zhang, X.; Zhu, S. Discussion on key problems in prevention and control system of coal mine rock burst. Coal Sci. Technol. 2023, 51, 203–213. [Google Scholar]
- Pan, Y.; Song, Y.; Zhu, C.; Ren, H.; Xu, H. Localization method of coal rock deformation for rock burst prediction. J. China Coal Soc. 2023, 48, 185–198. [Google Scholar]
- Gabov, V.V.; Zadkov, D.A.; Babyr, N.V.; Xie, F. Nonimpact rock pressure regulation with energy recovery into the hydraulic system of the longwall powered support. Eurasian Min. 2021, 36, 55–59. [Google Scholar] [CrossRef]
- Afraei, S.; Shahriar, K.; Madani, S.H. Statistical assessment of rock burst potential and contributions of considered predictor variables in the task. Tunn. Undergr. Space Technol. 2018, 72, 250–271. [Google Scholar] [CrossRef]
- Zuo, J.; Xie, H.; Wu, A.; Liu, J. Investigation on failure mechanisms and mechanical behaviors of deep coal-rock single body and combined body. Chin. J. Rock Mech. Eng. 2011, 30, 84–92. [Google Scholar]
- Pan, B.; Yu, W.; Shen, W. Experimental Study on Energy Evolution and Failure Characteristics of Rock-Coal-Rock Combination with Different Height Ratios. Geotech. Geol. Eng. 2021, 39, 425–435. [Google Scholar] [CrossRef]
- Guo, D.; Zhang, W.; Chen, Q.; Wang, Z. Failure Mechanism and Acoustic Emission Characteristics of Coal-Rock Samples. J. Min. Sci. 2022, 58, 390–397. [Google Scholar] [CrossRef]
- Cheng, Z.; Li, L.H.; Zhang, Y.N. Laboratory investigation of the mechanical properties of coal-rock combined body. Bull. Eng. Geol. Environ. 2020, 79, 1947–1958. [Google Scholar] [CrossRef]
- Zuo, J.; Song, H. Energy evolution law and differential energy instability model of coal-rock combined body. J. China Coal Soc. 2022, 47, 3037–3051. [Google Scholar]
- Chen, G.; Zhang, J.; He, Y.; Zhang, G.H.; Li, T. Derivation of pre-peak energy distribution formula and energy accumulation tests of coal-rock combined body. Rock Soil Mech. 2022, 43 (Suppl. S2), 130–143+154. [Google Scholar]
- Chen, G.; Qin, Z.; Zhang, G.; Li, T.; Li, J. Law of energy distribution before failure of a loaded coal-rock combined body. Rock Soil Mech. 2020, 41, 2021–2033. [Google Scholar]
- Bai, X.; Cao, A.; Cai, W.; Wen, Y.; Liu, Y.; Wang, S.; Li, X. Rock burst mechanism induced by stress anomaly in roof thickness variation zone: A case study. Geomat. Nat. Hazards Risk 2022, 13, 1805–1830. [Google Scholar] [CrossRef]
- Wang, J.; Jiang, F.; Meng, X.; Wang, X.; Zhu, S.; Feng, Y. Mechanism of Rock Burst Occurrence in Specially Thick Coal Seam with Rock Parting. Rock Mech. Rock Eng. 2016, 49, 1953–1965. [Google Scholar] [CrossRef]
- Zhu, G.; Dou, L.; Li, Z.; Cai, W.; Kong, Y.; Li, J. Mining-induced stress changes and rock burst control in a variable-thickness coal seam. Arab. J. Geosci. 2016, 9, 365. [Google Scholar] [CrossRef]
- Wang, Y.; Yang, B.; Deng, C.; Zhang, J.; Lu, M.; Huang, J.; Xie, C.; Huang, X. Numerical Simulation Analysis of Influence of Coal Thickness Change on Rock Burst. Saf. Coal Mines 2017, 48, 198–201. [Google Scholar]
- Shen, T.; Gu, S.; Lei, R.; Xiao, Z. Distribution Laws and Influence Factors of Elastic Strain Energy in Thickness Variation of Coal Seam. Saf. Coal Mines 2015, 46, 187–189. [Google Scholar]
- Ren, Z.; Wang, C.; Jiang, B. Numerical Simulation on Influence of Coal Seam Thickness Variation on Rock Burst Danger. Saf. Coal Mines 2014, 45, 51–53+57. [Google Scholar]
- Wang, C.; Cao, A.; Zhu, G.; Jing, G.; Li, J.; Chen, T. Mechanism of rock burst induced by fault slip in an island coal panel and hazard assessment using seismic tomography: A case study from Xuzhuang colliery, Xuzhou, China. Geosci. J. 2017, 21, 469–481. [Google Scholar] [CrossRef]
- Zhao, T.; Guo, W.; Tan, Y. Mechanics mechanism of rock burst caused by mining in the variable region of coal thickness. J. China Coal Soc. 2016, 41, 1659–1666. [Google Scholar]
- Xu, Z. A Concise Course in Elasticity, 3rd ed.; Advanced Education Press: Beijing, China, 2002. (In Chinese) [Google Scholar]
- Chen, G.; Wang, E.; Wang, W.; Li, T.; Zhang, G. Experimental study on the influence of lithology and rock-coal height ratio on mechanical properties and impact effect of combined body. Energy Sources Part A-Recovery Util. Environ. Eff. 2019, 1–24. [Google Scholar] [CrossRef]
- Zhao, Y.; Feng, Z.; Wan, Z. Least energy priciple of dynamical failure of rock mass. Chin. J. Rock Mech. Eng. 2003, 22, 1781–1783. [Google Scholar]
- Askaripour, M.; Saeidi, A.; Rouleau, A.; Mercier-Langevin, P. Rockburst in underground excavations: A review of mechanism, classification, and prediction methods. Undergr. Space 2022, 7, 577–607. [Google Scholar] [CrossRef]
- Gendler, S.G.; Gabov, V.V.; Babyr, N.; Prokhorova, E. Justification of engineering solutions on reduction of occupational traumatism in coal longwalls. Min. Informational Anal. Bull. 2022, 5–19. [Google Scholar] [CrossRef]
| Disclaimer/Publisher’s Note: The statements, opinions and data contained in all publications are solely those of the individual author(s) and contributor(s) and not of MDPI and/or the editor(s). MDPI and/or the editor(s) disclaim responsibility for any injury to people or property resulting from any ideas, methods, instructions or products referred to in the content. |
© 2023 by the authors. Licensee MDPI, Basel, Switzerland. This article is an open access article distributed under the terms and conditions of the Creative Commons Attribution (CC BY) license (https://creativecommons.org/licenses/by/4.0/).


