Article

Structural Strength Analysis of a Rotary Drum Mower in Transportation Position

1
Department of Agricultural Machinery and Technology Engineering, Akdeniz University, Antalya 07070, Turkey
2
Department of Mechatronics Engineering, Faculty of Engineering, Akdeniz University, Antalya 07070, Turkey
3
School of Engineering, Lancaster University, Lancaster LA1 4YW, UK
*
Authors to whom correspondence should be addressed.
Appl. Sci. 2023, 13(20), 11338; https://doi.org/10.3390/app132011338
Submission received: 22 September 2023 / Revised: 11 October 2023 / Accepted: 12 October 2023 / Published: 16 October 2023

Abstract

:
A rotary drum mower is a tractor-mounted harvester used for harvesting green fodder plants in agricultural fields. During transportation, it experiences significant dynamic road reaction forces that can cause deformation and functional failures. This study focuses on analysing the deformation behaviour of the machine during transportation to test the machine’s failure condition. To conduct the strength analysis, a total work cycle scenario reflecting actual load conditions and design challenges was created. Experimental strain-gauge-based stress analysis and advanced computer-aided engineering (CAE) simulation methods were employed. The study successfully conducted experimental stress analysis, 3D solid modelling, and validated finite element analysis (FEA). A comparison between experimental and simulation results showed an average relative difference of 24.25% with a maximum absolute difference of approximately 5 MPa. No functional failure issues were observed during physical experiments. The study also revealed that the mean dynamic loading value, when compared to the static linkage position, was calculated as 3.65 ± 0.40. Overall, this research provides a valuable approach for future studies on complex stress and deformation evaluations of agricultural machinery and equipment.

Graphical Abstract

1. Introduction

In the international agricultural equipment and machinery sector, especially related to engineering and manufacturing processes, the requirements for appropriate design applications are of significant importance [1]. However, it would be true to say that agricultural machinery manufacturers in many countries cannot sufficiently benefit from advanced design engineering and manufacturing technologies in new product design, design development/improvement and structural optimisation applications. The main reasons for this may be summarised as follows: (1) this subject may not be sufficiently known/promoted within the sector; (2) insufficient importance is given to engineering software investment; (3) insufficient number of trained and experienced staff; (4) insufficient research specific to the sector; (5) family-based non-institutionalised business structures that are resistant to embracing technological change. Additionally, a systematic approach in the sector related to advanced engineering applications for the design of agricultural machinery, one which can be adopted by relevant researchers, has not been fully established or standardised. As a result, the sector’s growth and development are negatively impacted by this condition. This issue is even more important for countries such as Turkey, which has considerable potential for agricultural machinery manufacturing because of its prominent position in agricultural production.
Manufacturing sectors are increasingly focusing on the research of product improvement and iteration in a highly competitive market. Nowadays, more complex and large-scale design engineering and manufacturing applications are being requested by the industry. Nevertheless, due to design resource and systemic limitations, it is not easy to improve customer satisfaction and service in order to optimise product design [2]. There is significant need to optimise mechanisation technologies and machinery to increase the yield with limited energy input and operational time in order to fulfil the world’s growing demand for food [3]. Manufacturing of agricultural machinery and equipment is a sector whose importance is progressively growing and where the essential facilities, machinery, and power sources are created under the heading of “agricultural mechanisation”. Today, numerous forms of agricultural machinery utilised in crop production are divided into categories such as tillage, planting, fertilising and plant protection, harvest, threshing, processing of post-harvest products, irrigation, and other types of machinery. In terms of their structural and functional characteristics, harvesting machines are particularly significant within these machinery categories. In terms of construction and functionality, harvesting machines have a wide variety of different mechanism systems and machine components. Harvesting machines used in current agricultural practices are mostly classified according to plant variety, harvesting method and power source. When classified according to the power source, harvesting machines can be tractor-operated or self-propelled [4].
Tractor-attachable harvesting machines are multi-functional with mowing, collection, transfer, storage, motion transmission, and similar units. They are often driven by tractor power take-off (PTO). In this category of machines, there are various mechanical systems and machine components. According to the working conditions, it is crucial to ascertain the operational design limits of the machine components and to prepare and develop their design specifications within these design limits. The design and structural optimisation of these systems or elements directly affects the functionality and performance of machines. Additionally, it is crucial for manufacturers to have a machine with enhanced functionality and material savings as a result of such optimisation.
In the crop fields, foraging is important as a part of livestock production and requires much input, care and management. Many agricultural enterprises utilise vertical axis mowers for forage harvest operations. By cutting the crop with freely pivoting blades attached to rotating shafts, vertical axis mowers avoid many of the problems associated with reciprocating machinery [5]. The forage crop is unsupported during cutting in all vertical axis rotary mowers, which can be divided into two types: disc and drum. Drum mowers are machines that receive their power from the tractor PTO to cut clover, meadow flowers, grass, and other similar green forage crops with freely rotating blades on the drum before collecting them in a barrel on the field’s surface [5,6,7]. Therefore, the design evaluation of a drum mower should focus on two important perspectives: harvest mechanism and structural strength.
Most especially in a structural strength context, very few studies have been found in the literature that systematically apply experimental and advanced engineering simulation method-based design approaches to the concept of the strength-based design analysis of agricultural harvesters, particularly on rotary drum mowers.
In other research involving rotary drum mowers, Wu et al. (2023) conducted a study wherein they presented a numerical simulation and analysis of the airflow field surrounding the cutting apparatus. They employed computational fluid dynamics (CFD) applications to facilitate the optimisation of operating parameters in the machine’s design procedures [8]. El-Baily (2022) conducted a research study examining the wear of rotary drum mower blades and the resultant impact on forage productivity. The study revealed that the deterioration of blades or the presence of worn knives may lead to a reduction in PTO power [6]. Bartoň (2019) conducted an analysis of the dynamics of drum mower blades, primarily focusing on the influence of these forces on blade behaviour. This analysis specifically considered blade oscillations around a stable state, which were found to be contingent upon the properties of the material being cut [9]. Celik and Akinci (2015, 2016) have presented both visual and numerical findings derived from stress analyses of the components comprising the harvesting mechanism, specifically focusing on the motion transmission gears and axles within a rotary drum mower, during harvesting operations. These analyses were conducted using both analytical and finite element methods [10,11]. Persson (1993) initiated a developmental investigation into a rotary counter shear mower and carried out experimental field testing on the resulting physical prototype. It was underlined that the prototype performed satisfactorily with alfalfa and timothy; nevertheless, design enhancements are required for the prototype [12].
In this study, a systematic strength-based design analysis approach was established, and stress analyses were performed through experimental and advanced engineering simulation methods on a sample tractor-attachable harvester (rotary drum mower) during transportation, which was considered to be the worst loading condition, and all related application steps were thoroughly executed.

2. Materials and Methods

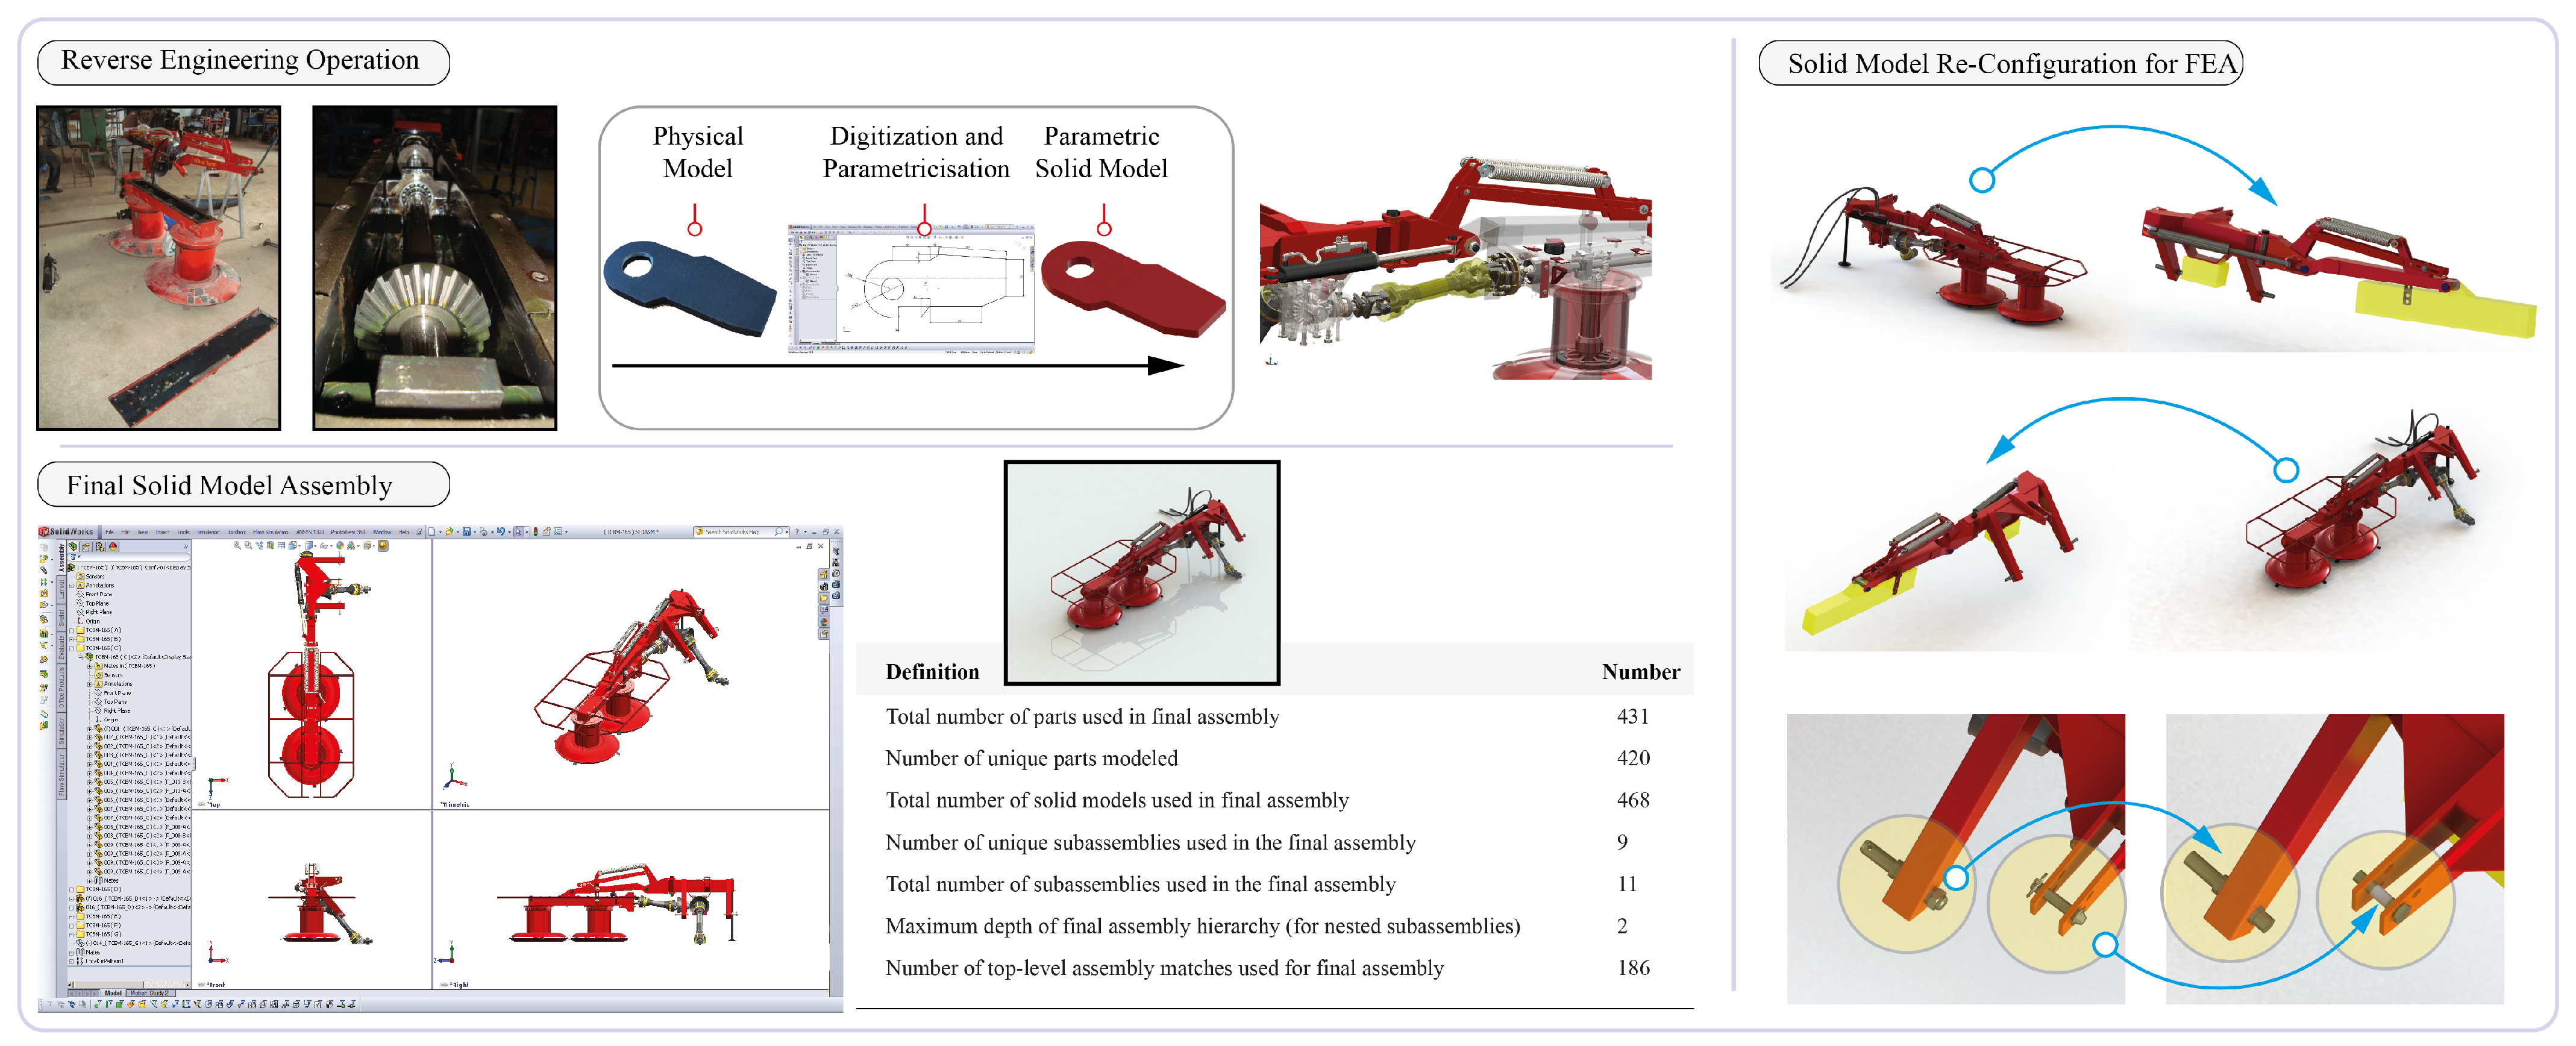
2.1. Rotary Drum Mower

A rotary drum mower (RDM) was used as the basis for this study, which is covered by the applicable patent regulations, and was produced in Turkey by a local agricultural machinery manufacturing company [13]. In terms of construction, the machine is different from commonly used drum mowers. Instead of using the belt–pulley system seen in most mowers, a gearbox is used to transmit the movement from the tractor PTO to the drums. The mower has a cylindrical piston unit on it that the tractor hydraulic system uses to provide the transport (road) and harvest positions. There is a 90° angle between the work position and the direction of tractor movement. Some of the technical and dimensional specifications of the RDM utilised in this study are shown in Figure 1.

2.2. Loading Scenario

Physical loading conditions are assessed throughout a strength-based design analysis process that takes into account the most difficult working conditions for the machine. It is preferred that the machine be able to structurally work damage-free, within the specified design limits, and under the most demanding operating circumstances. In light of this, a total work cycle scenario outlining the RDM’s harvest operational circumstances was created. This scenario states that the machine is retained in an agricultural business (farm garage). When it is time to harvest, a tractor is used to move it to the field where harvesting is undertaken. The machine is then returned to the farm garage after harvesting. In this case, the machine’s physical load conditions can be assessed for three positions: (1) in-garage static linkage position; (2) during transportation; and (3) during harvesting. This paper covers the structural strength analysis of the machine in the in-garage static linkage position and during transportation to the agricultural field. Strength analysis of the machine during harvesting was conducted in another study, which is not in the scope of this paper.
The strength analysis took into account the dynamic loads that occurred throughout the machine’s delivery to the field as the worst loading condition. It is expected that the machine is transported along various roads with the three different types of surface roughness specified in the scenario provided. These are the asphalt road, with the lowest surface roughness; the dirt road, where the surface roughness is increased; and the in-field road, with the highest surface roughness. The prepared total work-cycle scenario is shown schematically in Figure 2.

2.3. Experimental Set Up

2.3.1. Weight Measurement

The machine’s own weight is the primary source of physical loading during static and dynamic transportation conditions in the defined work cycle scenario for the RDM. Therefore, generating an FEA that describes the real-world working conditions of the machine mainly depends on determining the actual weight of the machine.
The weight measurements of the RDM were carried out in two steps in order to measure the functional (drum group and drum transmission elements) and structural element groups of the machine. To do this, the machine’s functional components were first separated from its main connection point and measured independently. In the second step, the total machine weight was determined, and the weight of the structural components was then calculated by eliminating the weight of the functional elements from the total machine weight.
RDM weight measurements were performed at the Agricultural Machinery Research and Application Workshop of Akdeniz University (Turkey). Accurate measurements were made using a computer-aided measurement system and a pre-calibrated ZEMIC H3-C3-5.0t-B6 model 50 kN capacity S-type load cell. The differential pulley system was used to lift and keep related machine groups in a static position during the measurement process. Once the machine reached a stationary state, the weight measurements were recorded in the computer environment for 30 s at a sampling rate of 10 Hz. The machine was suspended for each measurement, and measurements were taken three times. Visuals and the results related to weight measurements are given in Figure 3.

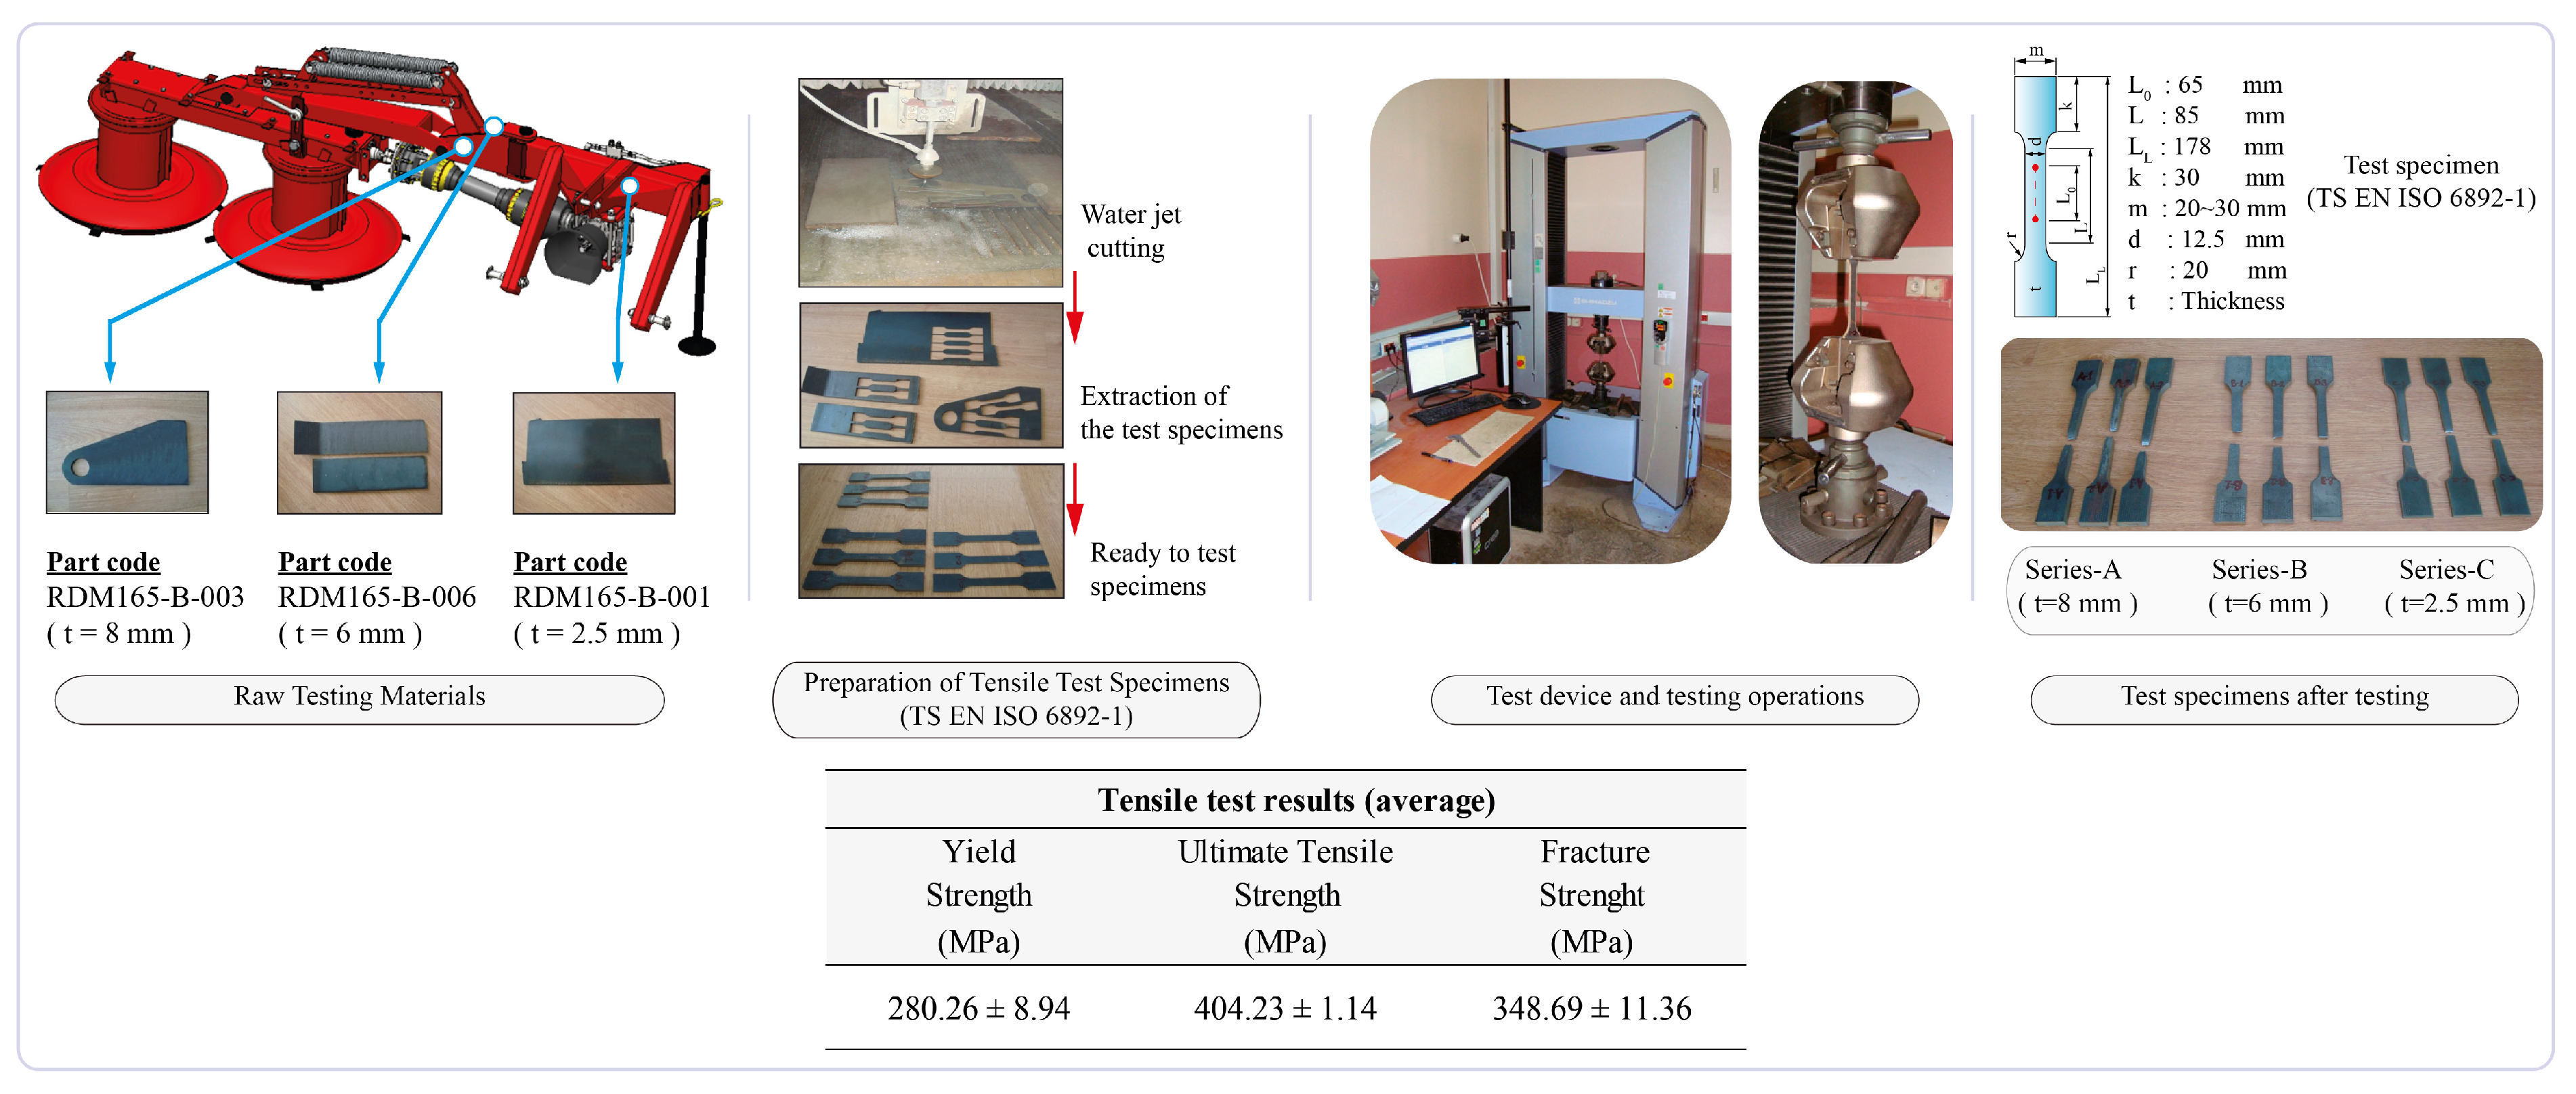
2.3.2. Material Confirmation Tensile Tests

Tensile testing was performed in the Materials Testing Laboratory of the Turkish Ministry of Industry and Trade, KOSGEB Service Centre (Istanbul, Turkey). The “TS EN ISO 6892-1” Metallic Materials Tensile Test Standard was used as a guide for the testing [14]. The components for the test specimens were gathered from the manufacturer’s stock, which were designated for the RDM production. The specimens used for the tensile test were extracted from the components prepared for the production of the machine (thicknesses of 2.5 mm, 6 mm and 8 mm), and were prepared according to the type-2 rectangular specimen (dog bone type) dimensions given in the relevant standard (water jet). Nine specimens were tested in total using the SHIMADZU AG-X (Kyoto, Japan) 100 kN tensile capacity test device.
These tests determined that the average yield, ultimate tensile, and fracture stress points were 280.26 MPa, 404.23 MPa, and 348.69 MPa, respectively. These findings confirmed that the materials used in machine production were appropriate for the standard machine manufacturing (structural) steel form. The yield stress point of the material was taken as the failure criterion in both experimental and simulation-based stress evaluations of the RDM taken into consideration in this study (based on von Mises failure criterion). Processing details related to the tensile tests are given in Figure 4.

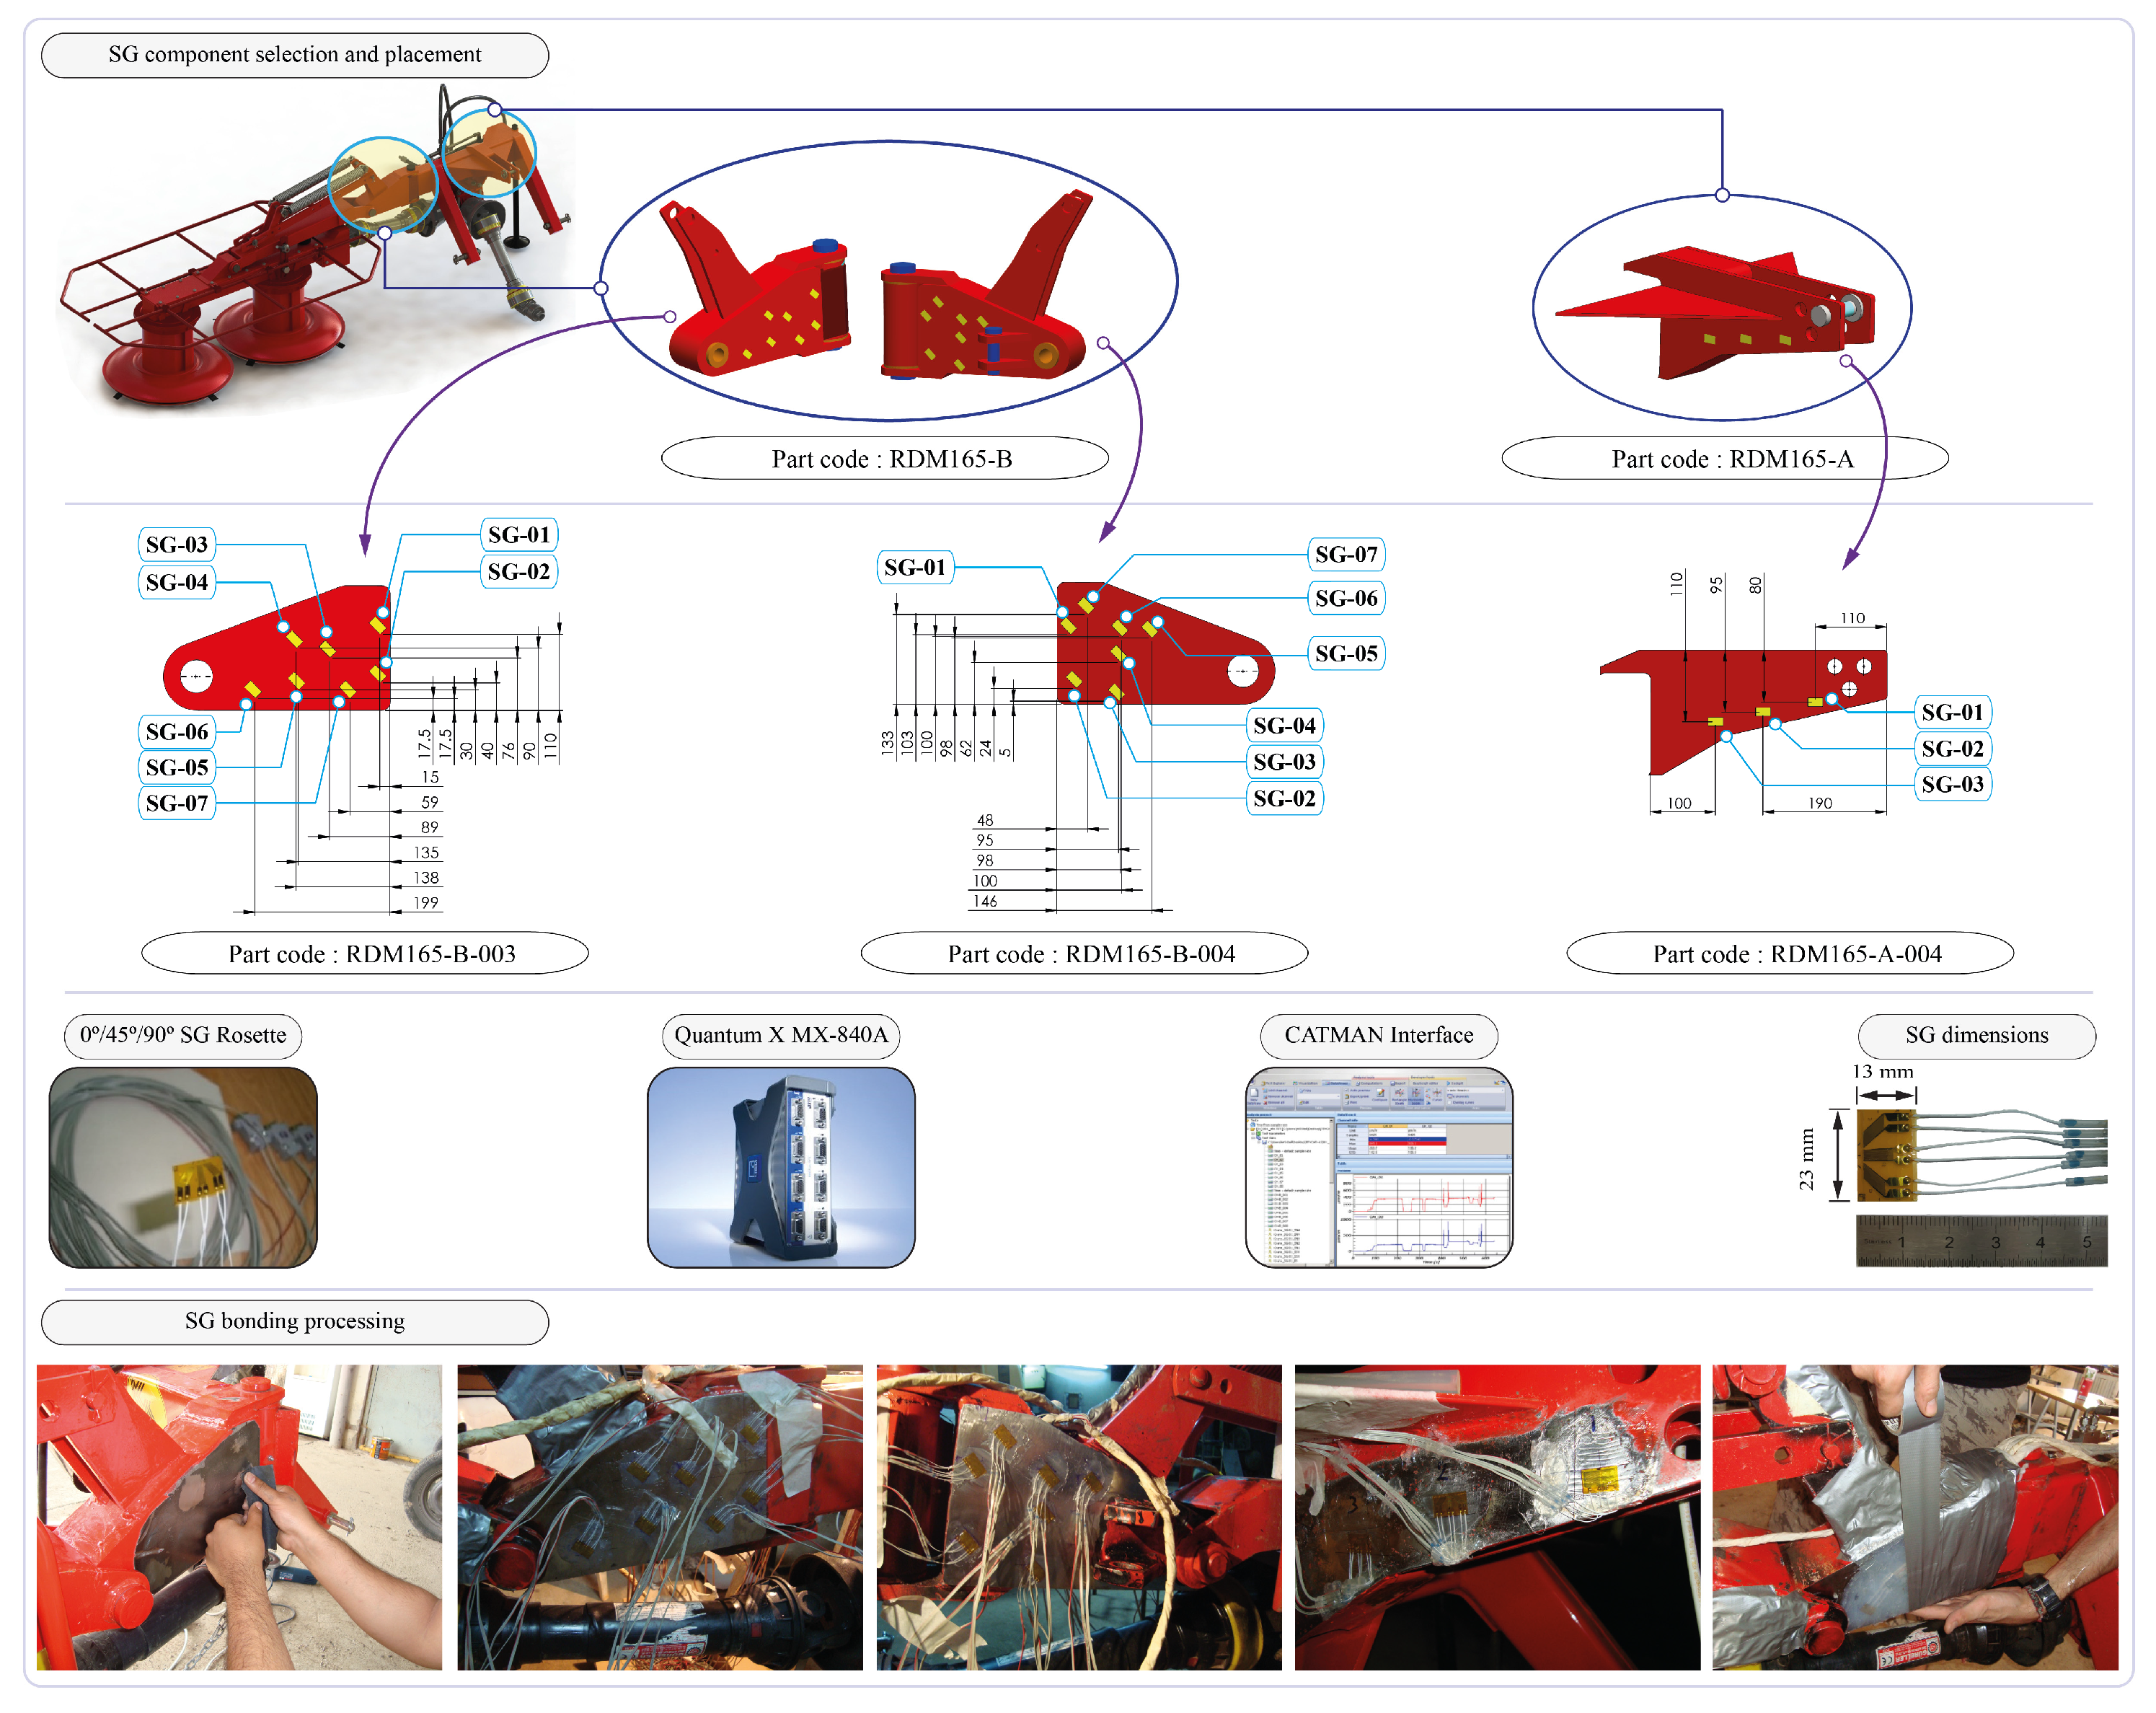
2.3.3. Strain Gauge-Based Strain Measurement

In order to assess the RDM’s deformation behaviour under actual operating conditions and to validate the FEA outputs, physical tests were performed on the machine during static and dynamic transportation. When planning the physical testing, the static linkage and dynamic transportation positions of the RDM in the total work cycle scenario were referred to, and experimental strain measurements were carried out. Equivalent stress calculations for the targeted element groups were performed in accordance with all the strain measurements that were recorded. A universal data acquisition module of HBM-QuantumX MX840A with eight channels, 24-bit resolution capability, and HBM K-RY81-6 series 0°/45°/90° three-elements, 120 ohm rectangular rosette strain gauges (SG) were utilised for the strain measurements [15,16]. All physical testing focused on high measurement precision, and data were recorded at a sample rate of 50 Hz. The CATMAN data monitoring and processing software was utilised to convert the measured strain values into equivalent stress values and to record the outputs [17]. Measurements and data processing were conducted simultaneously in this software.
In the physical tests, strain was measured using SG rosettes that were positioned at various places on the RDM structural members in the associated groups. The critical loading locations and optimisable components of the machine were taken into consideration when choosing the SG points, as well as their capacity to represent the high and low stress distributions that might occur on the elements under the machine’s physical loading circumstances.
Three SG rosettes were used for the component RDM165-A-004, whereas seven SG rosettes were utilised for components of RDM165-B-003 and RDM165-B-004 in consideration of the component dimensional size. In the bonding procedure of each SG, the bonding surfaces were carefully machined, finely polished, and cleaned with a chemical solvent (M-Bond 200 Catalyst), and the application stages were properly executed [18]. In SG bonding procedures, Vishay M-Bond 200 SG adhesive was utilised [19]. A special coating tape and cold silicone were used to isolate SG surfaces from the destructive effect of the surrounding environment. Figure 5 shows the setup in detail.

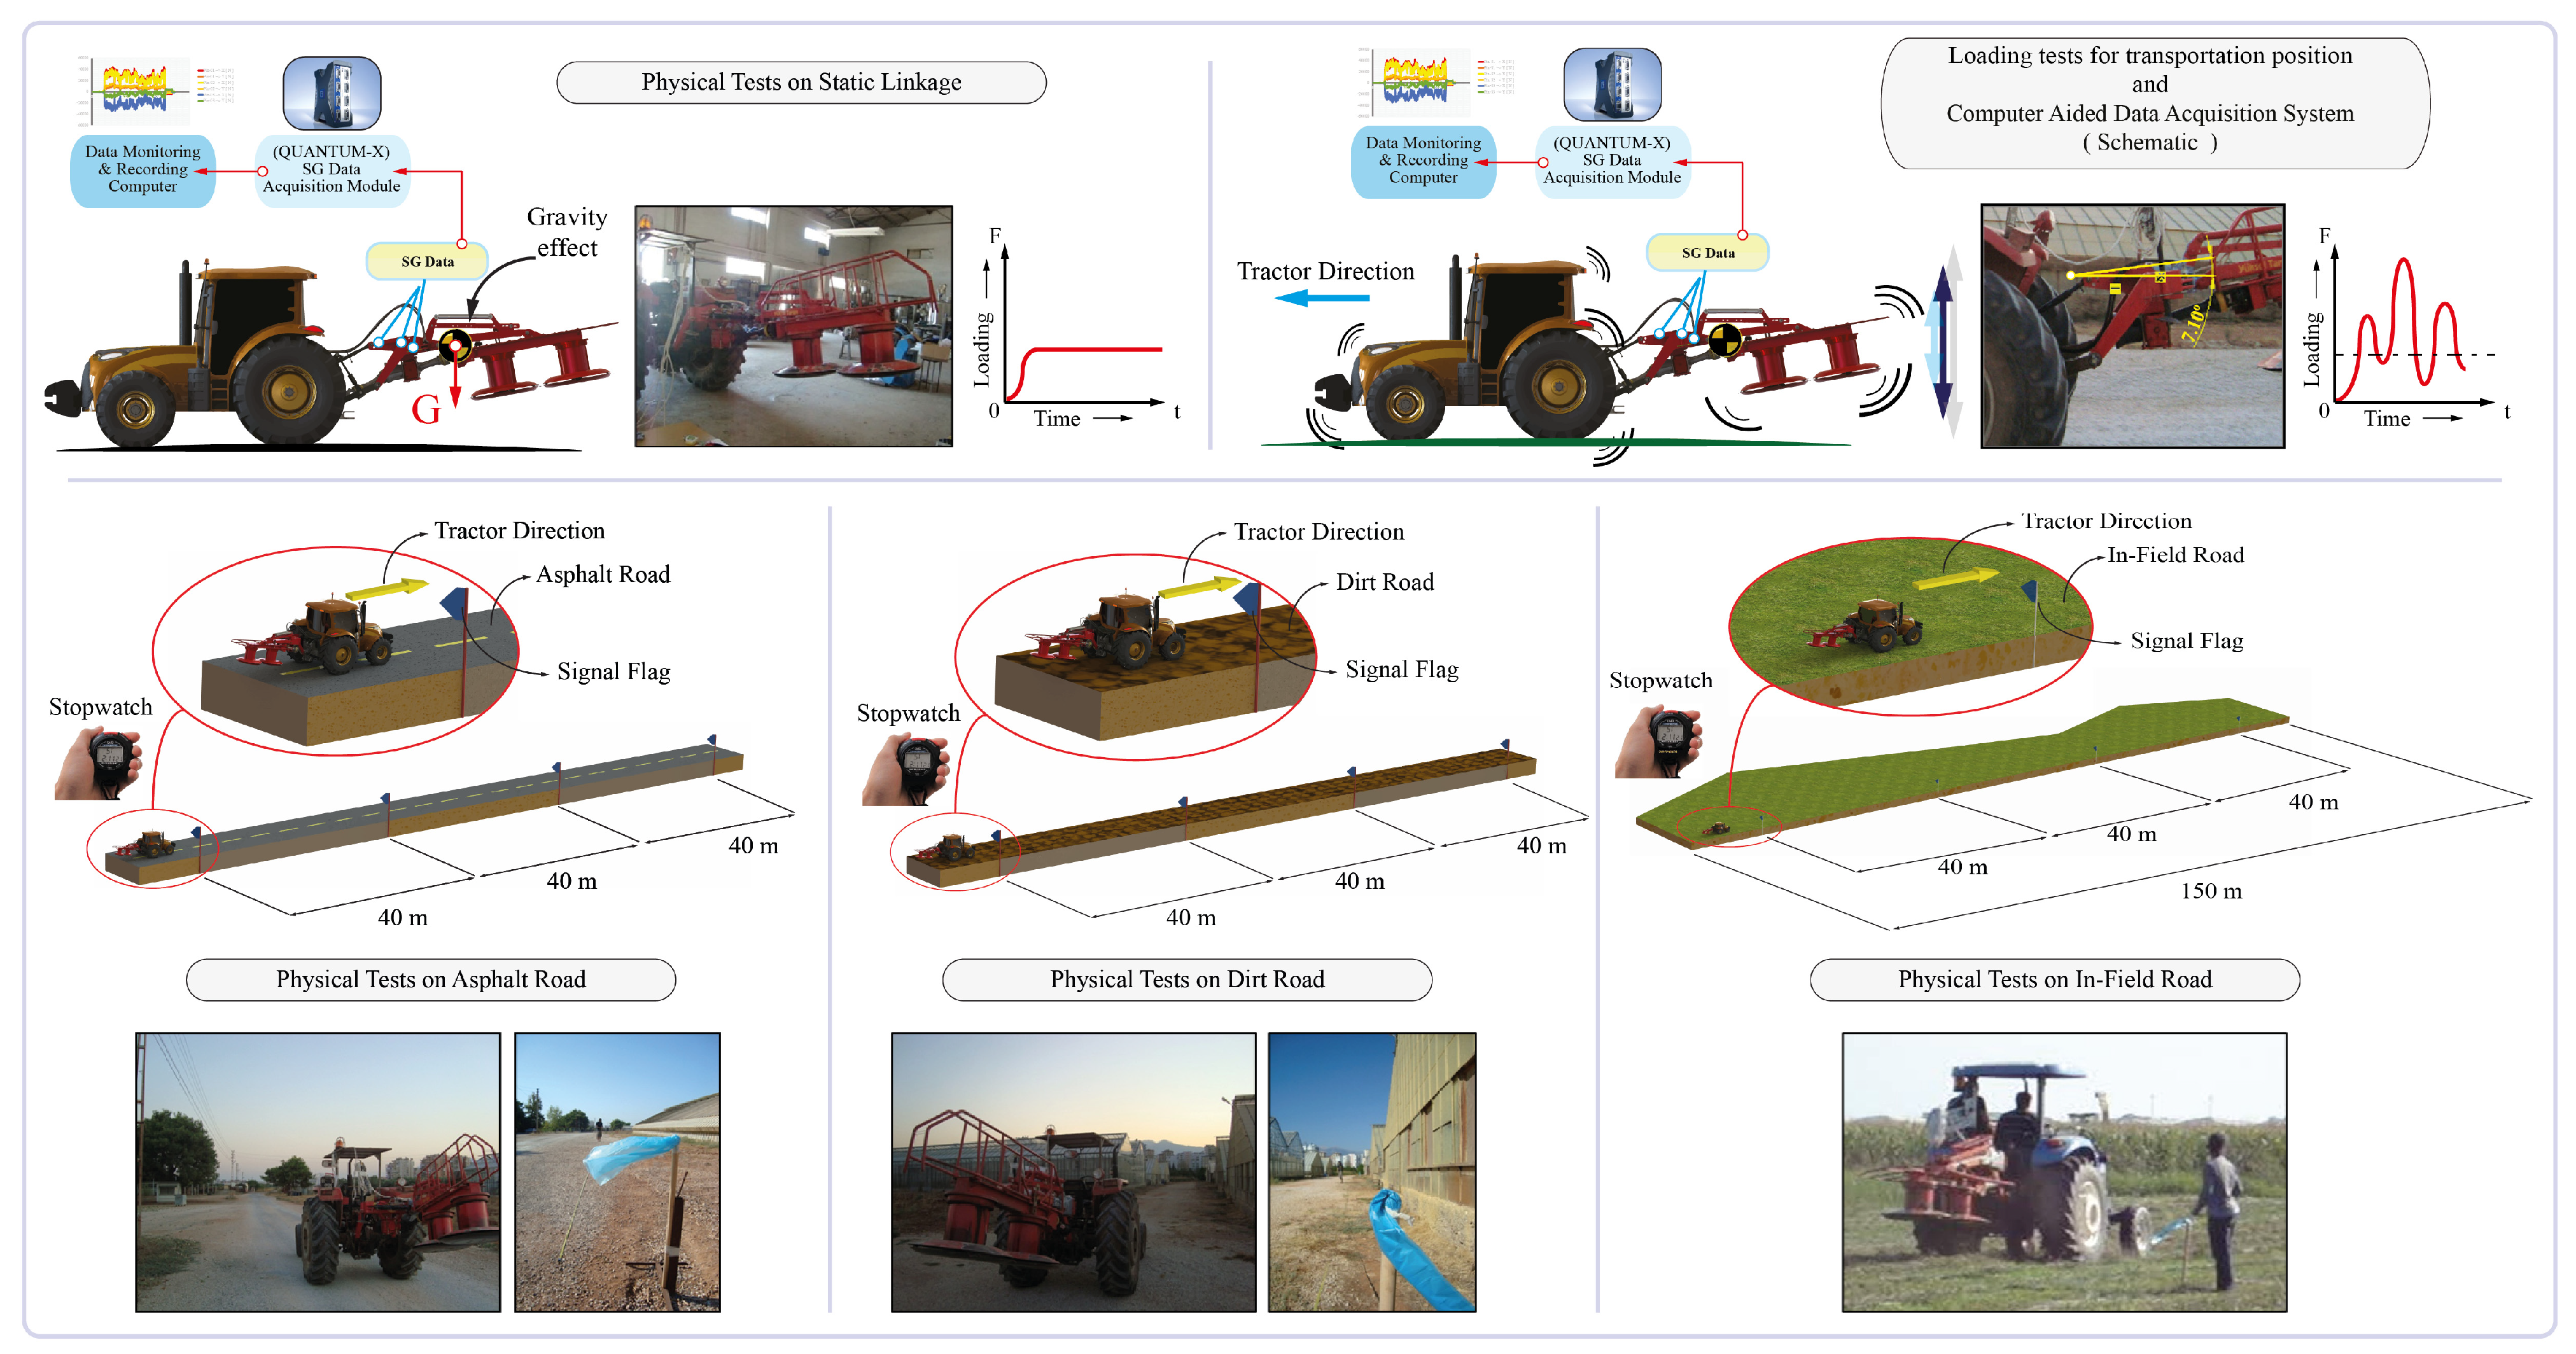
2.3.4. Physical Static Linkage Test

The RDM work cycle scenario states that the machine is lifted to the transportation position before being transported to the field. The RDM was lifted to the transportation (road) position with the aid of the hydraulic piston on it after being linked to the tractor. In this case, the machine was only loaded by its own weight while suspended and subjected to the force of gravity. Experimental strain measurements were performed for the previously chosen element groups, and the loading state of the machine was evaluated by converting these strain measurement data into von Mises equivalent stress values. Each strain measurement was taken for 30 s in the computer environment at the static linkage position. The tests were carried out in triplicate.

2.3.5. Physical Transportation (Road) Tests

An agricultural tractor is positioned on the road for the purpose of transporting the machine to the field. The machine is subject to varying loads in the direction of gravity as a result of the roughness of the roads during transportation. These physical loading scenarios were tested on three different types of roads—asphalt, dirt, and in-field roads—in terms of varying levels of surface roughness. Experimental strain measurements were conducted on previously chosen element groups, and the experimental strain measurement results were then converted into von Mises equivalent stress values in order to evaluate the physical testing carried out during the transportation of the machine to the field.
All road testing was repeated three times, each time at a different tractor speed. On the roads where the tractor was moving, signal flags were spaced 40 m apart. Using a digital stopwatch, how long it took the tractor to travel the distance between the two signal flags during the tests was timed, with Equation (1) used to calculate the tractor’s forward speed separately for each repetition. Visual descriptions of the physical loading tests and computer-aided data acquisition system are demonstrated in Figure 6.
V t = X t
Here, Vt is the tractor’s forward speed (m s−1), X is the distance between two flags (m), and t is the travel time (s).

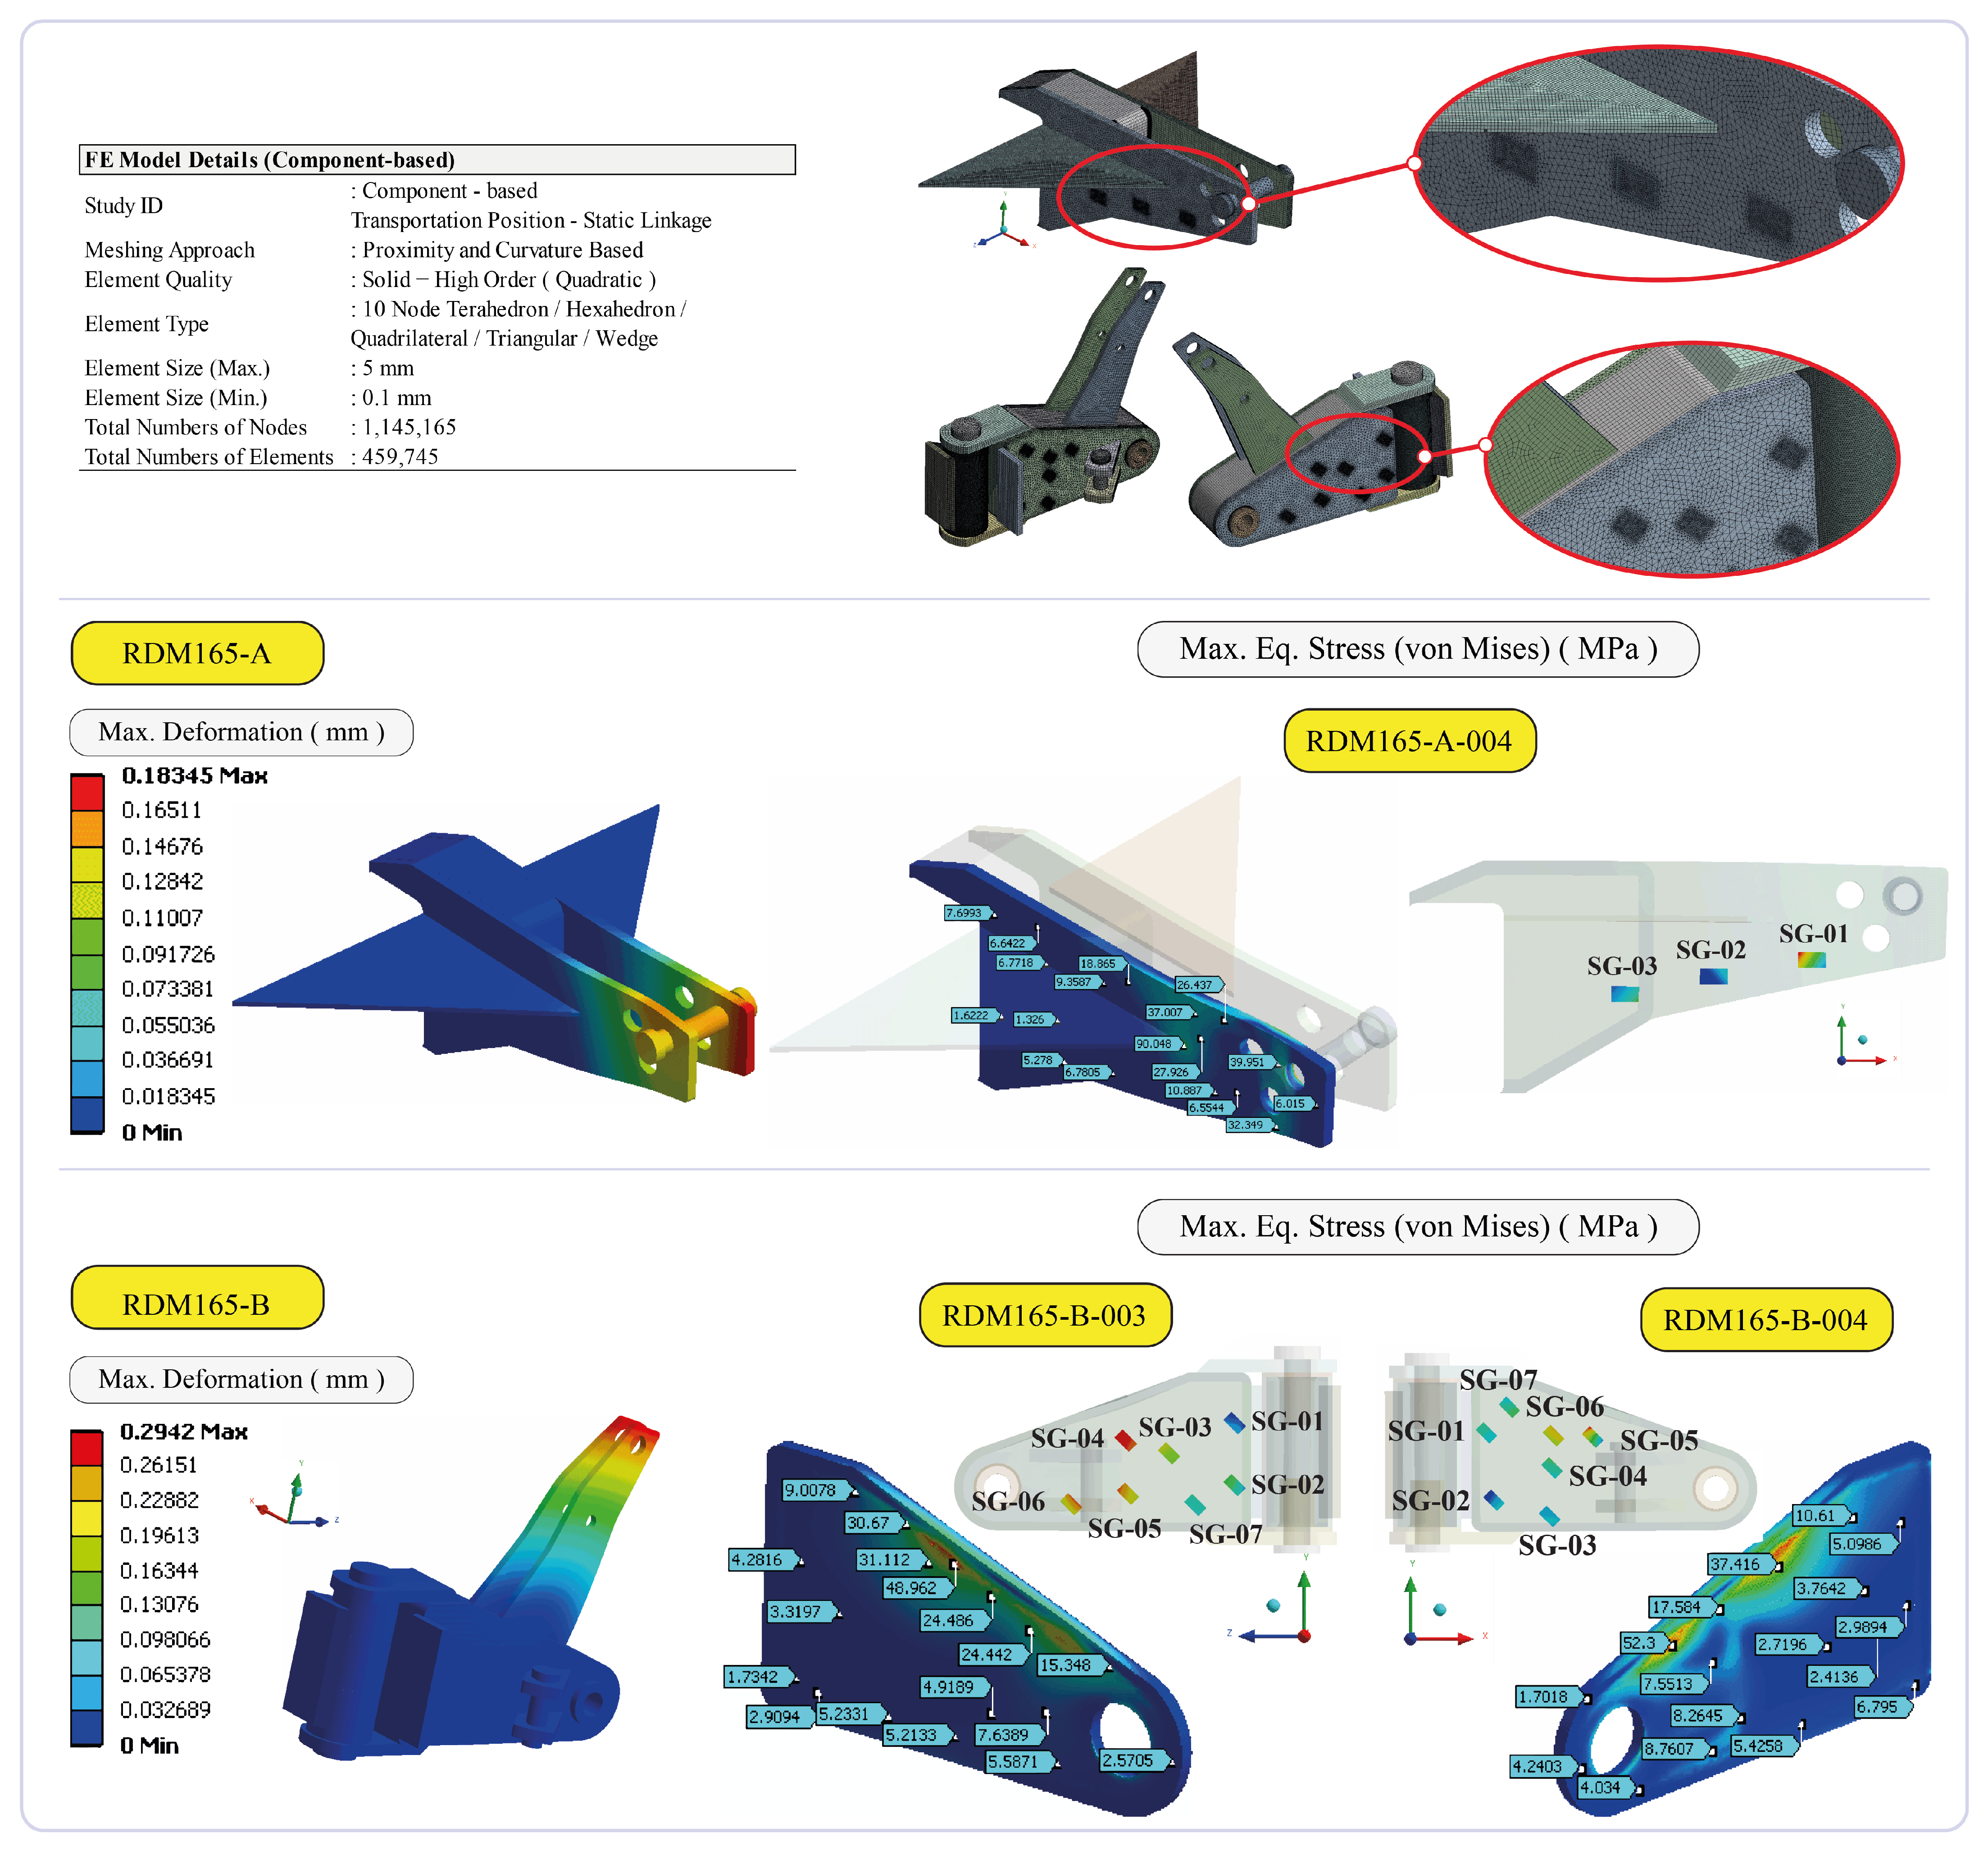
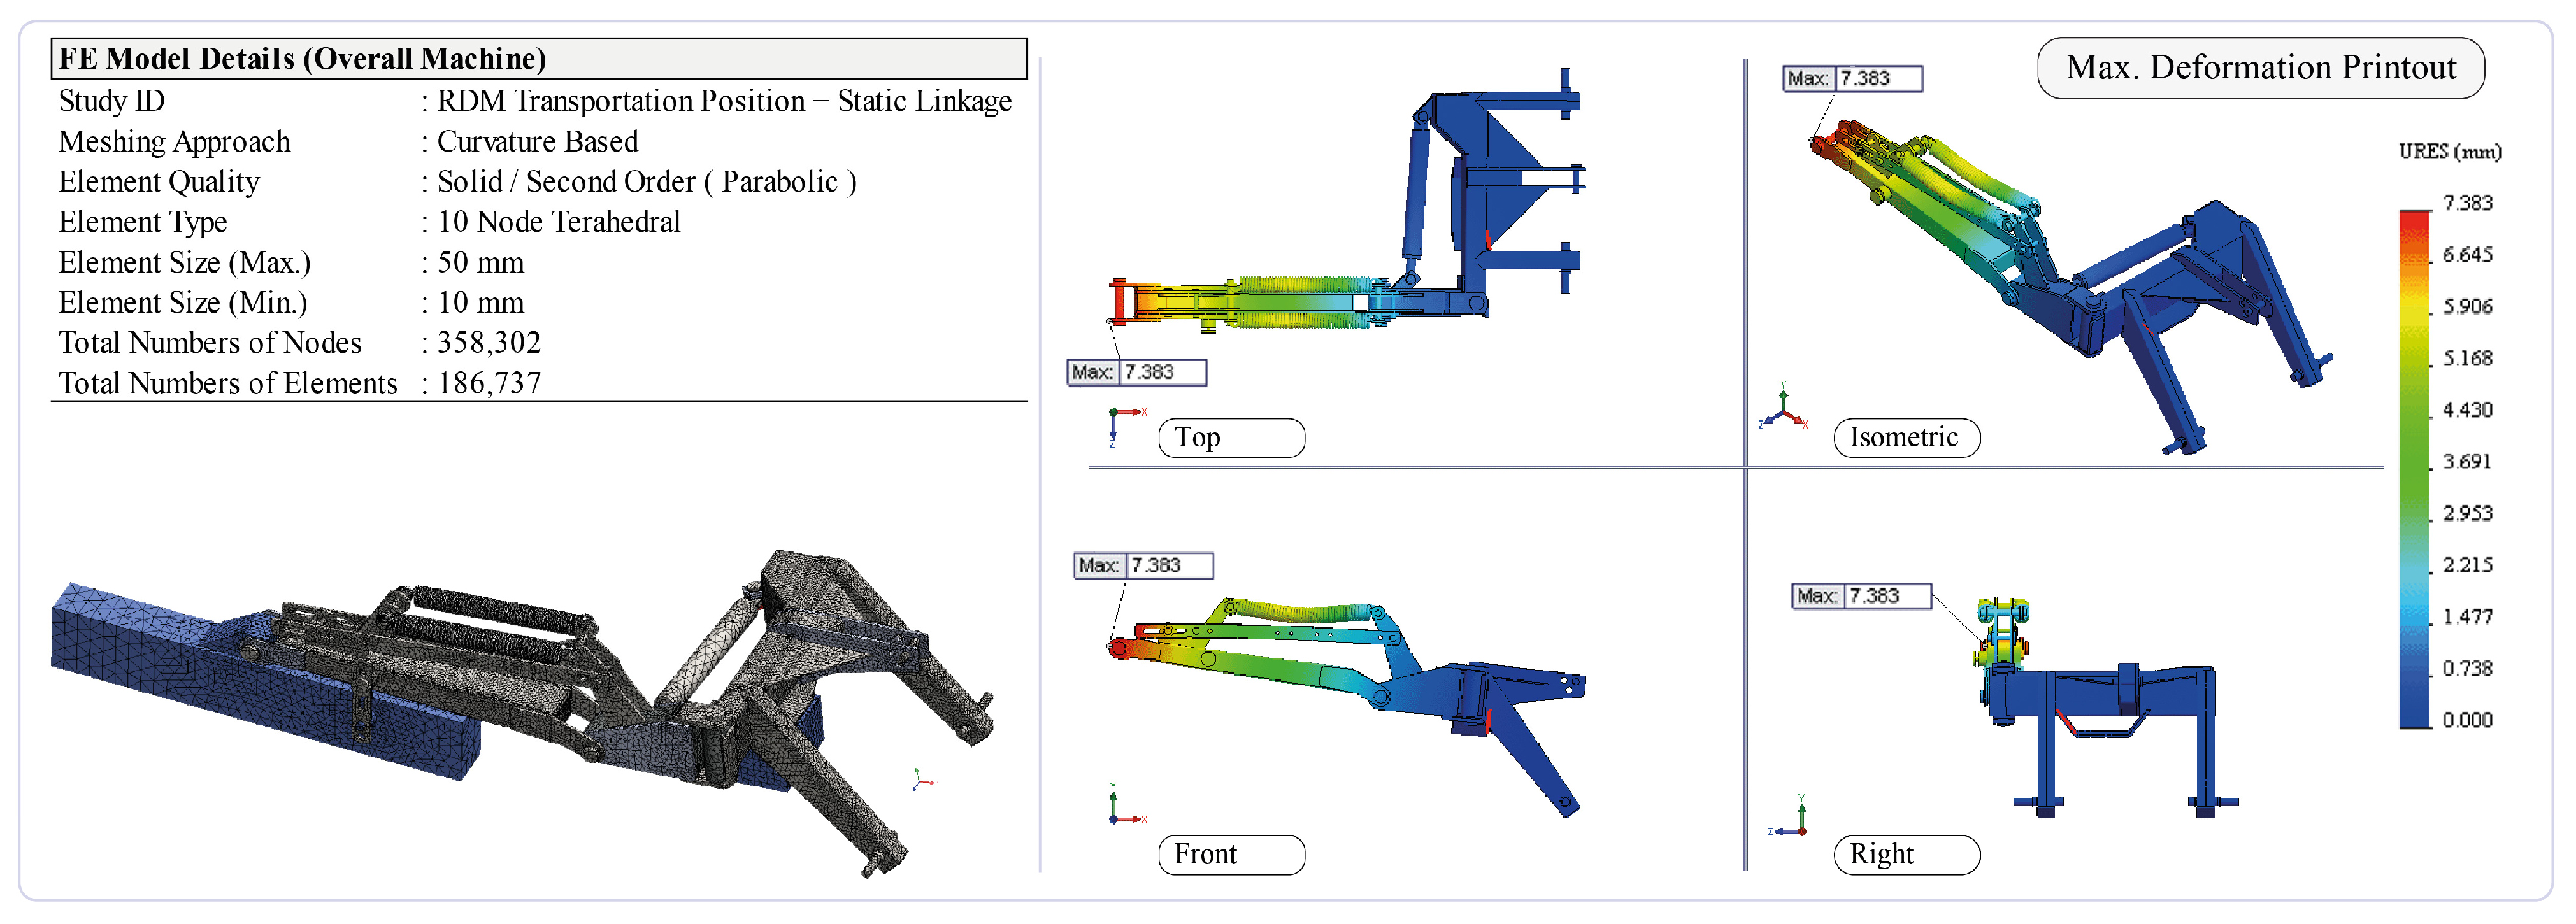
2.4. Finite Element Analysis

A reverse engineering approach was utilised to manage the solid modelling operations for the RDM, as the manufacturer did not have a detailed computer-aided design (CAD) model to be utilised for an FEA. Using this approach, each component of the machine was disassembled, the standard machine components utilised in the machine were identified, and the geometric parameters defining the other components were measured with the aid of tools such as callipers, tape measures, and micrometres, etc. Next, 3D parametric solid models were created using SolidWorks 2011 (SW) 3D parametric solid modelling software. With reference to the original machine assembly, all of the machine’s components were assembled throughout the parametric modelling phase in order to finalise the solid modelling of the entire machine. Steel-based materials are used to manufacture almost all of the machine’s components. Rubber-based materials are utilised as bedding and sealing in motion transmission components. The solid model of the RDM has the mobility that it actually has in real life.
The mass criterion is one of the factors considered in determining whether generated CAD models can accurately represent physical structures. The material property characteristics that were set in the solid modelling software were used to compute the tool’s overall mass. The software determined the overall mass for the RDM CAD assembly to be 424.15 kg (experimental mass measurement value: 423.93 kg).
The parametric CAD model of the RDM was re-configured for the FEA study. The CAD assembly contains a significant number of components; thus, a simplification procedure was performed without affecting the model’s capacity to structurally represent the machine. Some of the standard machine elements and functional element groups’ (drum group and gearbox) geometries have been simplified during this re-configuration of the RDM CAD model. The structural components’ initial geometries were preserved. In the re-configurated CAD model, the drum set and gearbox were re-organised as a solid block with rectangular prism geometry while preserving their original weights. The holes on some of the elements were patched properly. The surfaces which they come into contact with were considered, and the angular geometries of machine components like bolts, nuts, etc., were rounded. The machine’s total weight and the location of its centre of gravity were preserved despite all of the simplifications. In this procedure, the ideal solubility level for the FEA was provided by means of a re-configured CAD model. The solid modelling procedure, final assembly, re-configuration process, and assembly statistics for the RDM CAD model are given in Figure 7.
Standard machine elements including springs, bolts, nuts, pins, shafts, etc., as well as structural components are used in the production of the RDM. In the FEA investigations, the material properties of these components are obtained from the literature given by the applicable standards and previous material testing results of the machine’s structural components. Table 1 provides the material properties for the components utilised in the CAD modelling and the FEA study [20,21,22,23,24,25,26].
The real-life boundary conditions were considered in the FEA study with reference to the position where the machine was linked to the tractor and lifted to the static linkage position with a 7.10° angle (in-garage static linkage position). The main load acting on the machine in the static linkage position is the total weight of the machine under the effect of Earth’s gravity. The gravity acceleration was defined as 9.81 m s−2.
The FEA study was carried out for the transportation position at static linkage in order to provide validation by comparing numerical and experimental analyses results. The FEA study was divided into two stages. First, the whole machine’s deformation behaviour and component-based reaction forces were investigated. The SolidWorks Simulation module was utilised in this procedure. Accordingly, Figure 8 demonstrates the forces acting on the TBM165-A and TBM165-B element groups as well as their directions, the computed numerical values, and the results of the evaluation of the reaction forces against the specified load (machine weight).
Subsequently, a component-based FEA study was realised for the components included in the experimental testing. Validation and evaluation of the experimental road test results were achieved through component-based FEA study results. Here, subassembly solid models corresponding to the previously identified structural element groups were employed instead of the machine model including all of the machine’s components in order to acquire the stress values more precisely and conduct detailed analyses. The stress values to be employed in the validation study were acquired from the SG bonding surfaces located in the physical tests. ANSYS Workbench (v19.0) multi-physics engineering analysis software was employed to conduct the component-based FEA study.
In the production of the machine, some of the machine’s components were joined together through welded joints, while other components were joined using detachable fasteners including bolt–nuts and connecting pins. In the FEA study, bonded contact definitions were assigned for those surfaces where the components were joined by the welding process. The surfaces that the detachable elements come into contact with and some of the element surfaces that move relative to each other were defined as having non-linear frictional contact. The coefficient of friction between these related surfaces was 0.12 [22]. In non-linear FEM-based analyses, non-linearity is investigated in the literature under three categories. These are boundary conditions (contact) nonlinearity, material nonlinearity, and geometric nonlinearity [27,28]. In this FEA study, the boundary conditions consist of geometric and contact non-linearities.
Related meshing functions of the analysis software were employed to construct FE models for the FEA investigations. Proximity- and curvature-based meshing approaches were applied in the meshing processes. In order to choose the correct element size for the FE model, pre-trials were conducted, and skewness metrics were employed for FE model verification. In order to obtain precise results, smaller element sizes were assigned to SG bonding surfaces on related components. As a result, applicable element sizes that can accurately represent the models were defined by taking into account the computing capability of the computer platform on which the FE solution was carried out, the size of the machine assembly, and the model geometry.
After the completion of the pre-FEA steps, solution processes were performed, and the results were recorded. A Dell Precision T3400 model workstation with an Intel X38 microprocessor, 4 cores, 8 GB RAM, and a 1 GB graphics card was utilised in the computer solution processes.

3. Results and Discussion

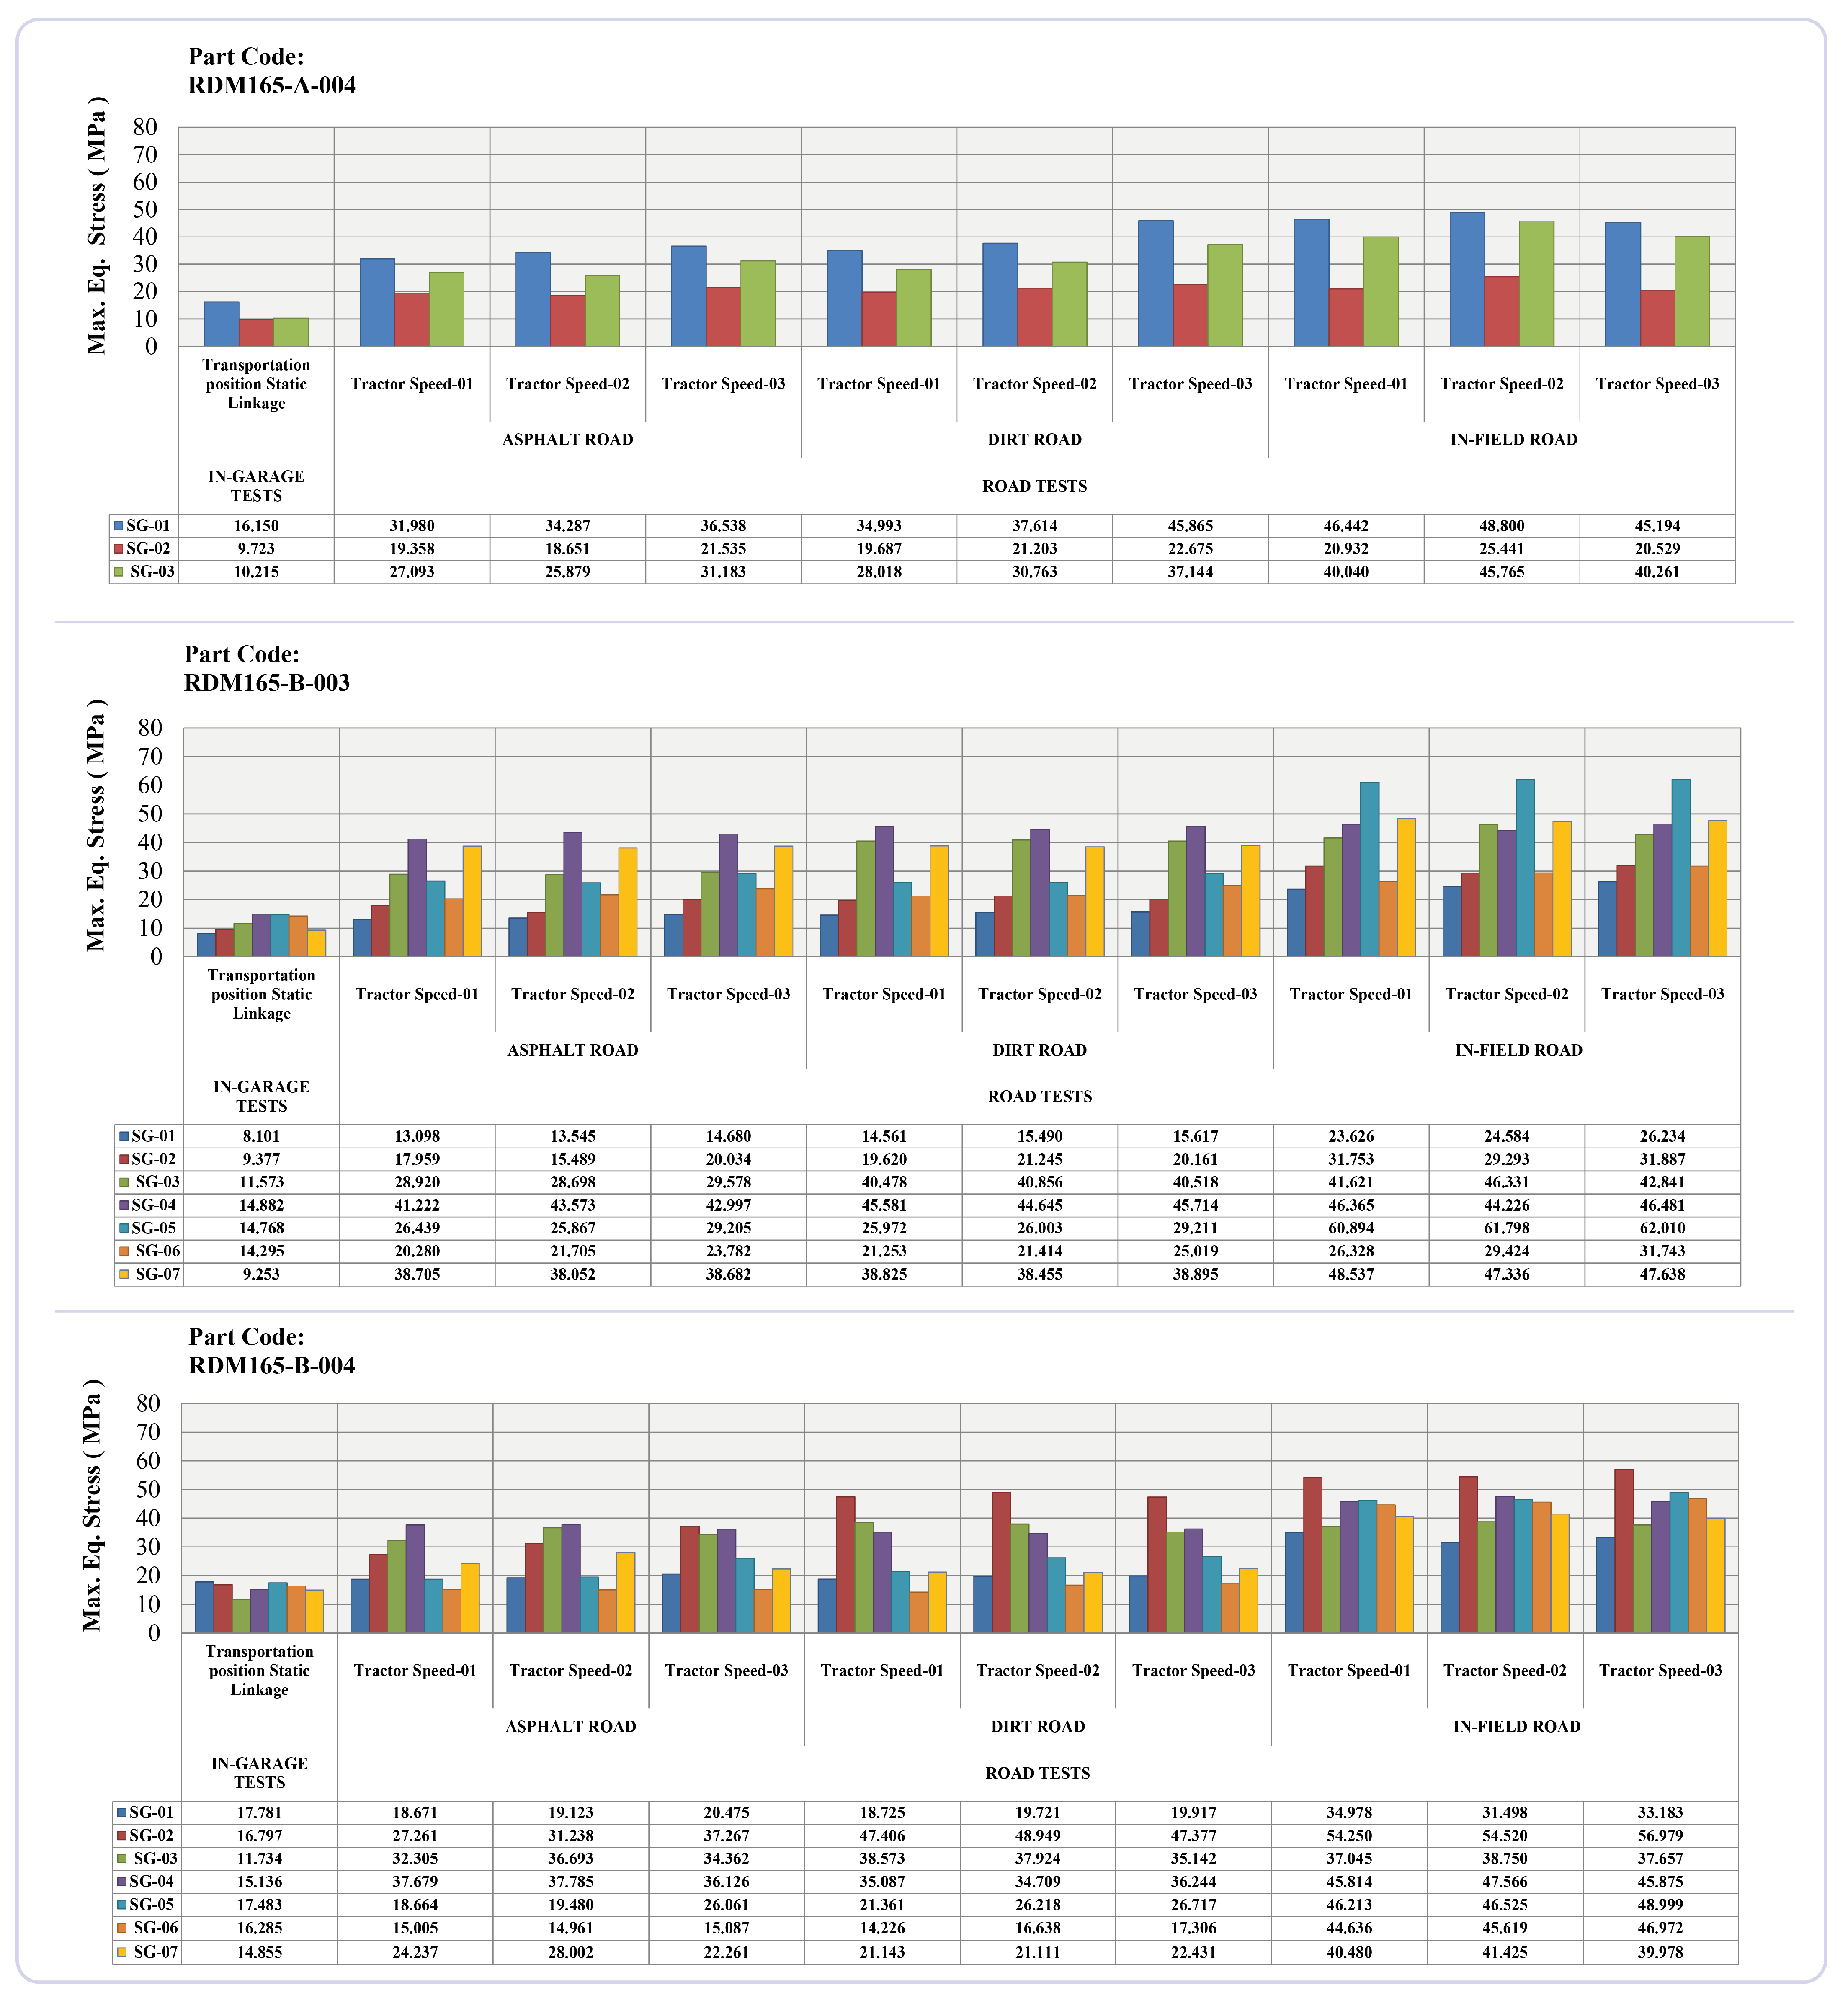
3.1. Evaluation of the Physical Test Results

In order to evaluate the deformation behaviour of the machine under actual physical operating conditions, all data collected from the physical tests were processed. Accordingly, the measured average tractor speeds as well as the maximum, minimum, and average values of the calculated stress values on associated components are given in the supplementary files. The worst conditions that would push the machine to its limits were taken into account in the total work cycle scenario for the RDM in addition to the machine’s typical operating conditions in transportation. The machine was specifically tested for this purpose at three different tractor speeds. The machine was exposed to excessive loads, particularly during the physical tests on the dirt road and in the field. In fact, it was discovered during the machine’s road tests that it was extremely difficult to drive the tractor, especially under dirt road and in-field road conditions at tractor speed-03, that the machine was exposed to excessive loads beyond the specified use, that the tractor movement becomes challenging to handle, and that it may result in dangerous consequences in terms of loss of life and damage to property. Physical tests showed that the tractor speed tests on dirt roads produced the highest tractor speed value. Here, it could be expected that the highest value would have appeared on the asphalt road because of less road roughness; however, experimental data revealed a higher standard deviation for the tests realised on the asphalt road. Additionally, absolute tractor speed values were quite close each other when considering the values obtained on asphalt and dirt roads. This finding does not affect the study’s main aim. Consequently, for the transportation scenario, it can be said that the relevant data obtained, especially in these abnormal operating conditions, may be the maximum loading conditions to be considered in the structural strength-based design of the RDM.
When the stress values obtained from the experimental stress analyses were reviewed, it was not found that any value exceeded the yield strength (280 MPa), which is the threshold for material failure. The transportation position in in-field road tests was the most challenging loading condition for the machine and the highest stress values experienced in this test. The conditions in which the stresses reach their maximum values presented the machine with its highest structural challenges. The highest stress values found in all physical tests demonstrate a considerable rise in the transportation position in-field road tests. For the related components, the maximum stress values are mostly encountered at tractor speed-2 and tractor speed-3 on the in-field road. This could be explained by the fact that the machine was exposed to higher sudden loads at related speeds due to the high roughness of the in-field road surface.
Machine design and structural analysis studies especially consider these types of situations where the structure works under the maximum load. In this regard, in the structural analysis of the RDM, the highest stress values calculated during the machine’s physical tests were considered as a reference benchmark. Accordingly, the tractor speed measurements are given in Table 2, and the maximum stress values obtained from the physical tests are re-organised graphically in Figure 9.
The machine worked under static and dynamic loadings during in-garage linkage and in road tests, respectively, as described in the RDM total work cycle scenario. Certain assumptions are made in many machine design studies when describing actual operating conditions for strength calculations. Particularly, when dynamic loads exist, calculations are made by utilising specific safety coefficients in order to correct the unpredictable and unexpected events that could happen under real-world working conditions. In this regard, in this study, it was quantified the increment in dynamic loading conditions as compared to static loading conditions using a linear approach. This involved dividing the dynamic stress results by the static stress results derived from corresponding components in the physical tests. The calculations for the loading coefficients for dynamic conditions are given in Table 3.
The coefficients calculated on the SG points of related components ranged between 2.33 and 6.59, as indicated in Table 3, which corresponds to dynamic loading coefficients. The average values of the individual components were calculated as 3.19 ± 0.86 (RDM165-A-004), 3.95 ± 1.33 (RDM165-B-003), and 3.80 ± 0.82 (RDM165-B-004), respectively. The overall average value for dynamic loading against the static position was calculated as 3.65 ± 0.40 by averaging the coefficients obtained on the basis of the components.

3.2. Evaluation of the FEA Results

The FEA results for the whole machine revealed that the maximum deformation (displacement) value of the machine in the in-garage static linkage position was 7.383 mm. Around the connecting shaft of the drum group was the location that experiences the highest deformation value under the pre-defined loading condition. The deformation value that was found was very low (relative to the overall machine size). In a linear approach, this value would probably rise over the course of the machine’s transportation along the rough terrain. However, it can be said that the deformation behaviour trend that appears under dynamic loading during transportation of the machine would not exhibit any abnormalities even when considering the maximum loading coefficients calculated in the physical tests. Related to the FEA, the FE model details and deformation printout for the overall machine are given in Figure 10.
The component-based FEA was achieved for the RDM165-A and RDM165-B component groups and revealed maximum deformation values of 0.183 mm and 0.294 mm, respectively. It was interpreted that these values would not be reason enough to present a failure risk for the component groups. Additionally, even in consideration of the dynamic loading coefficient obtained from physical tests, it was observed that the equivalent stress distribution values of the components were significantly below the material’s yield strength (280 MPa), which is the failure threshold. The FE model details and simulation printouts by component are shown in Figure 11. Additionally, the numerical stress values taken at each SG location on the related components included in the FEA are listed in Table 4.

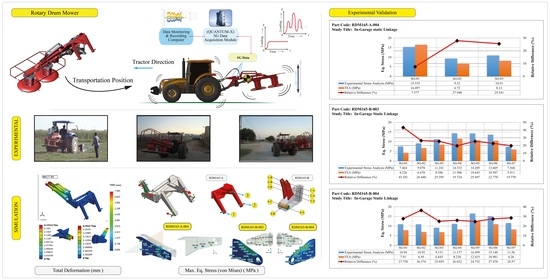
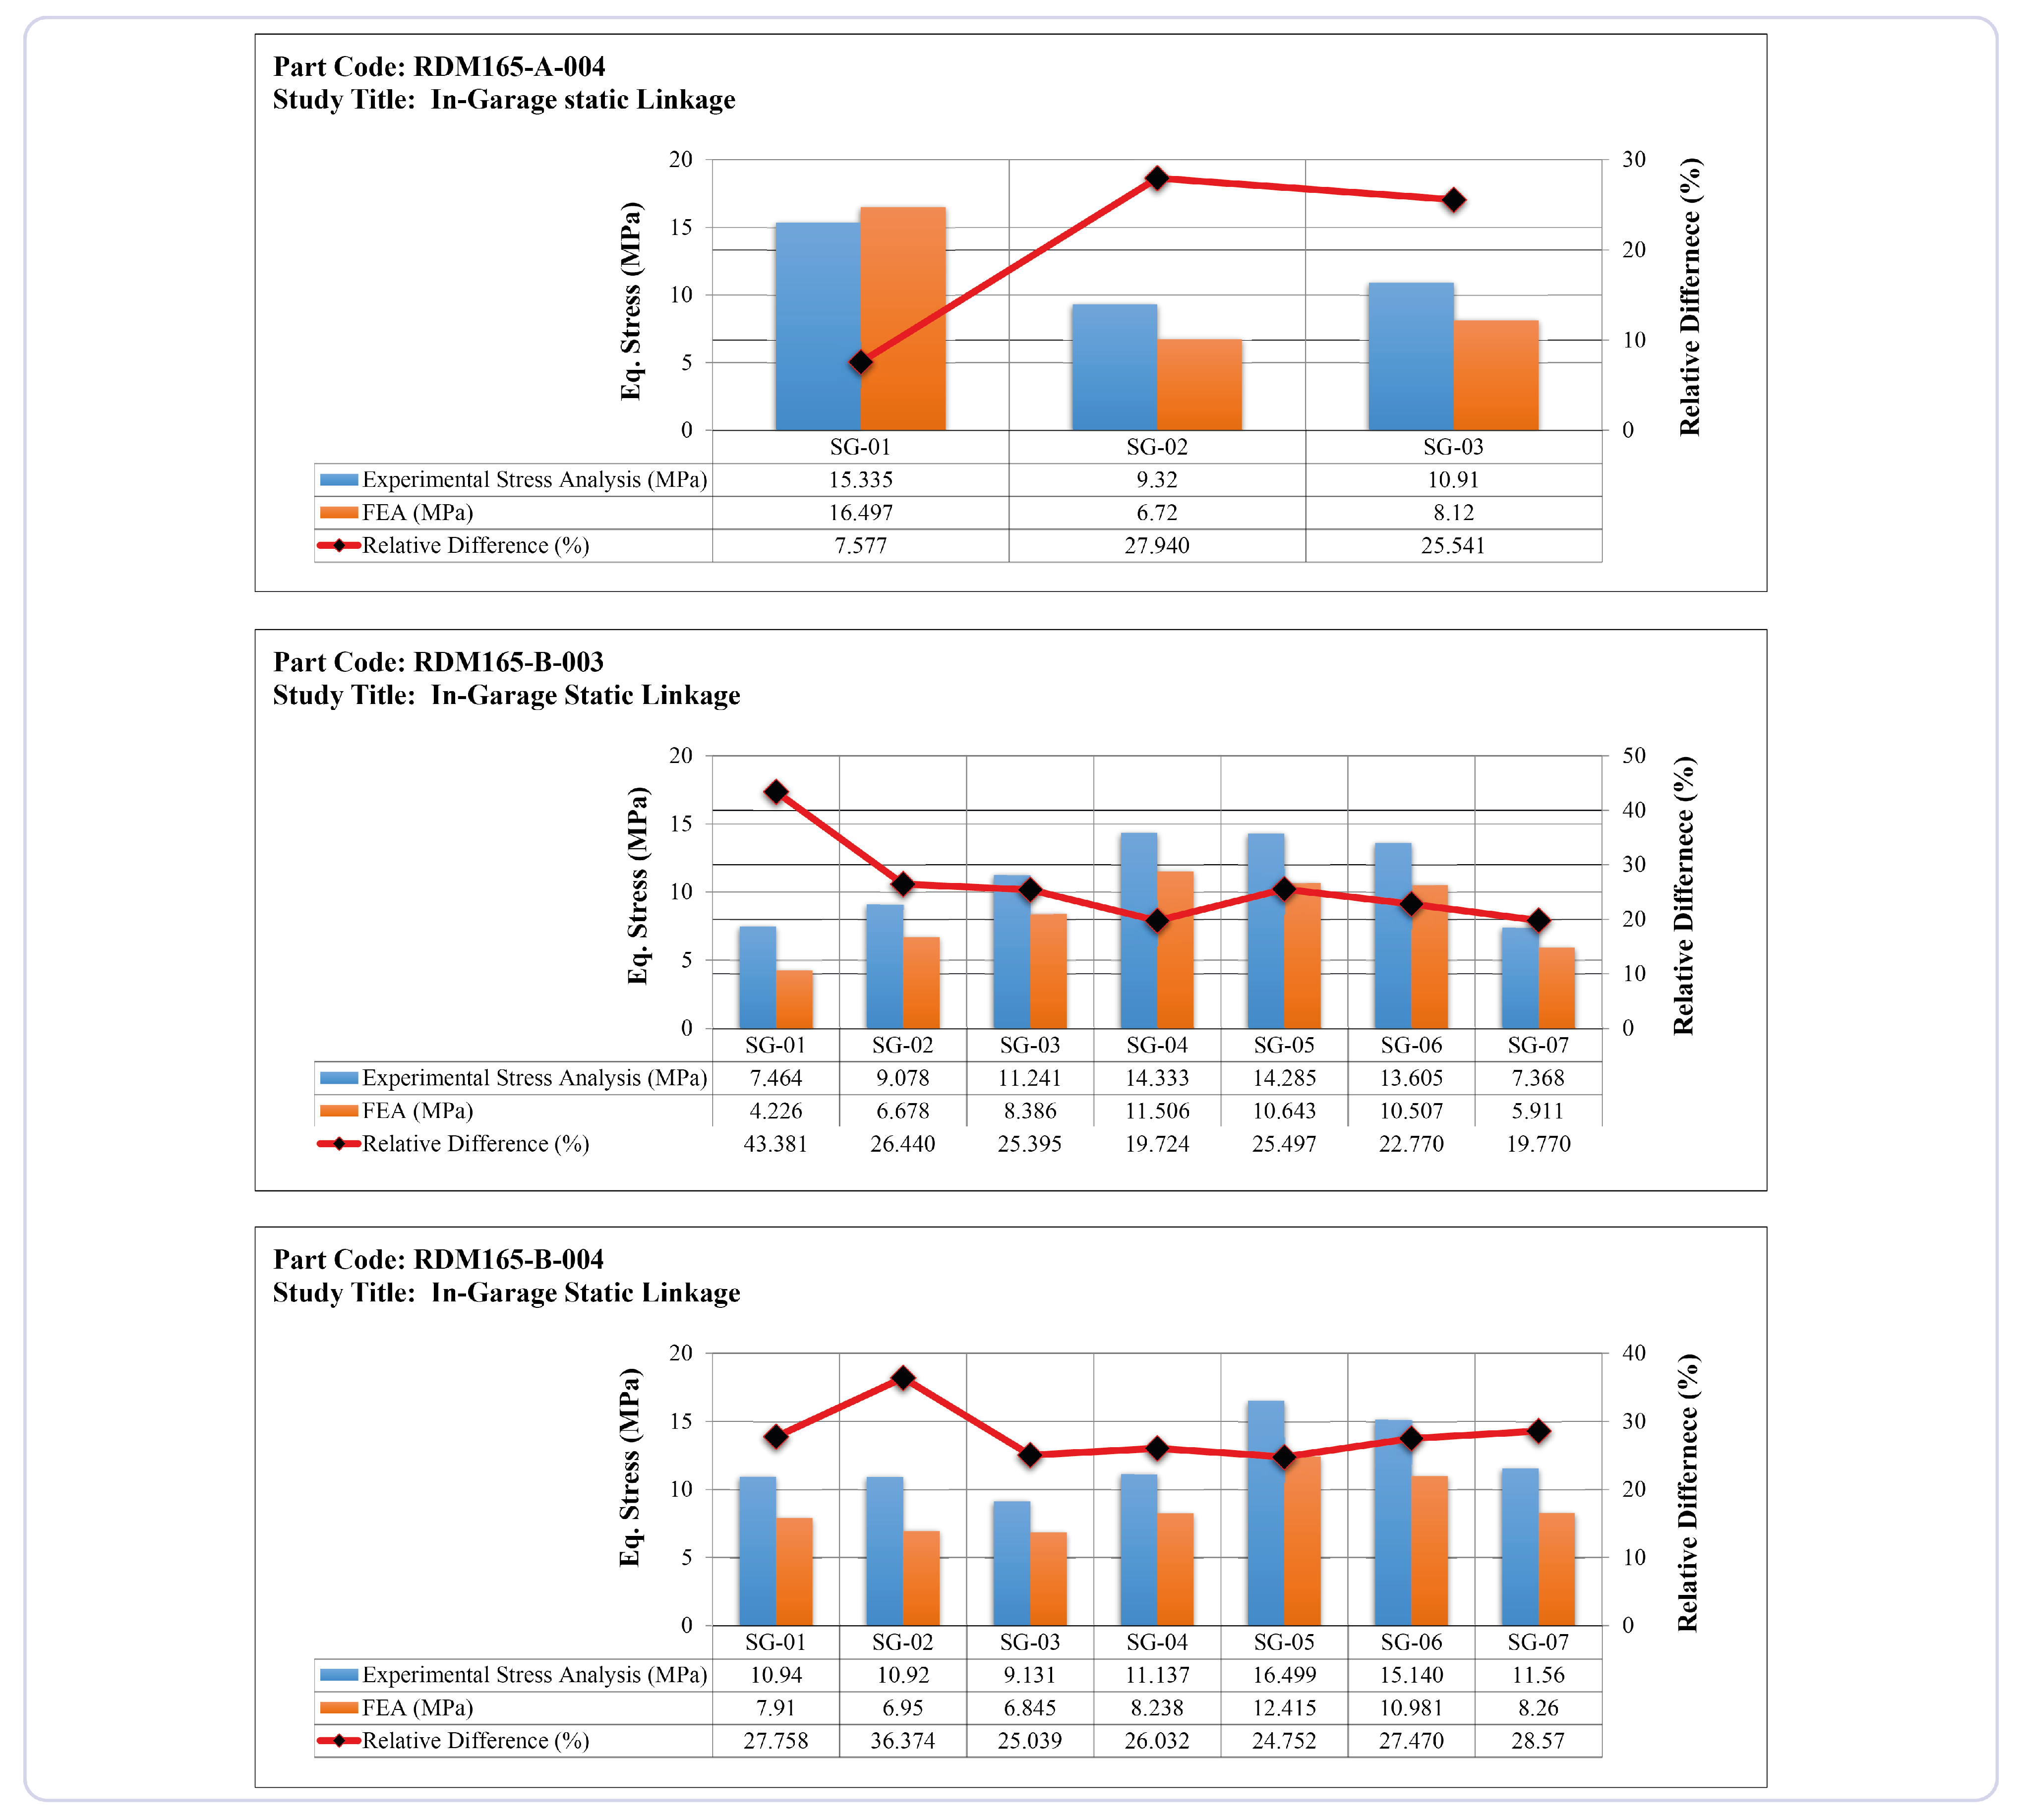
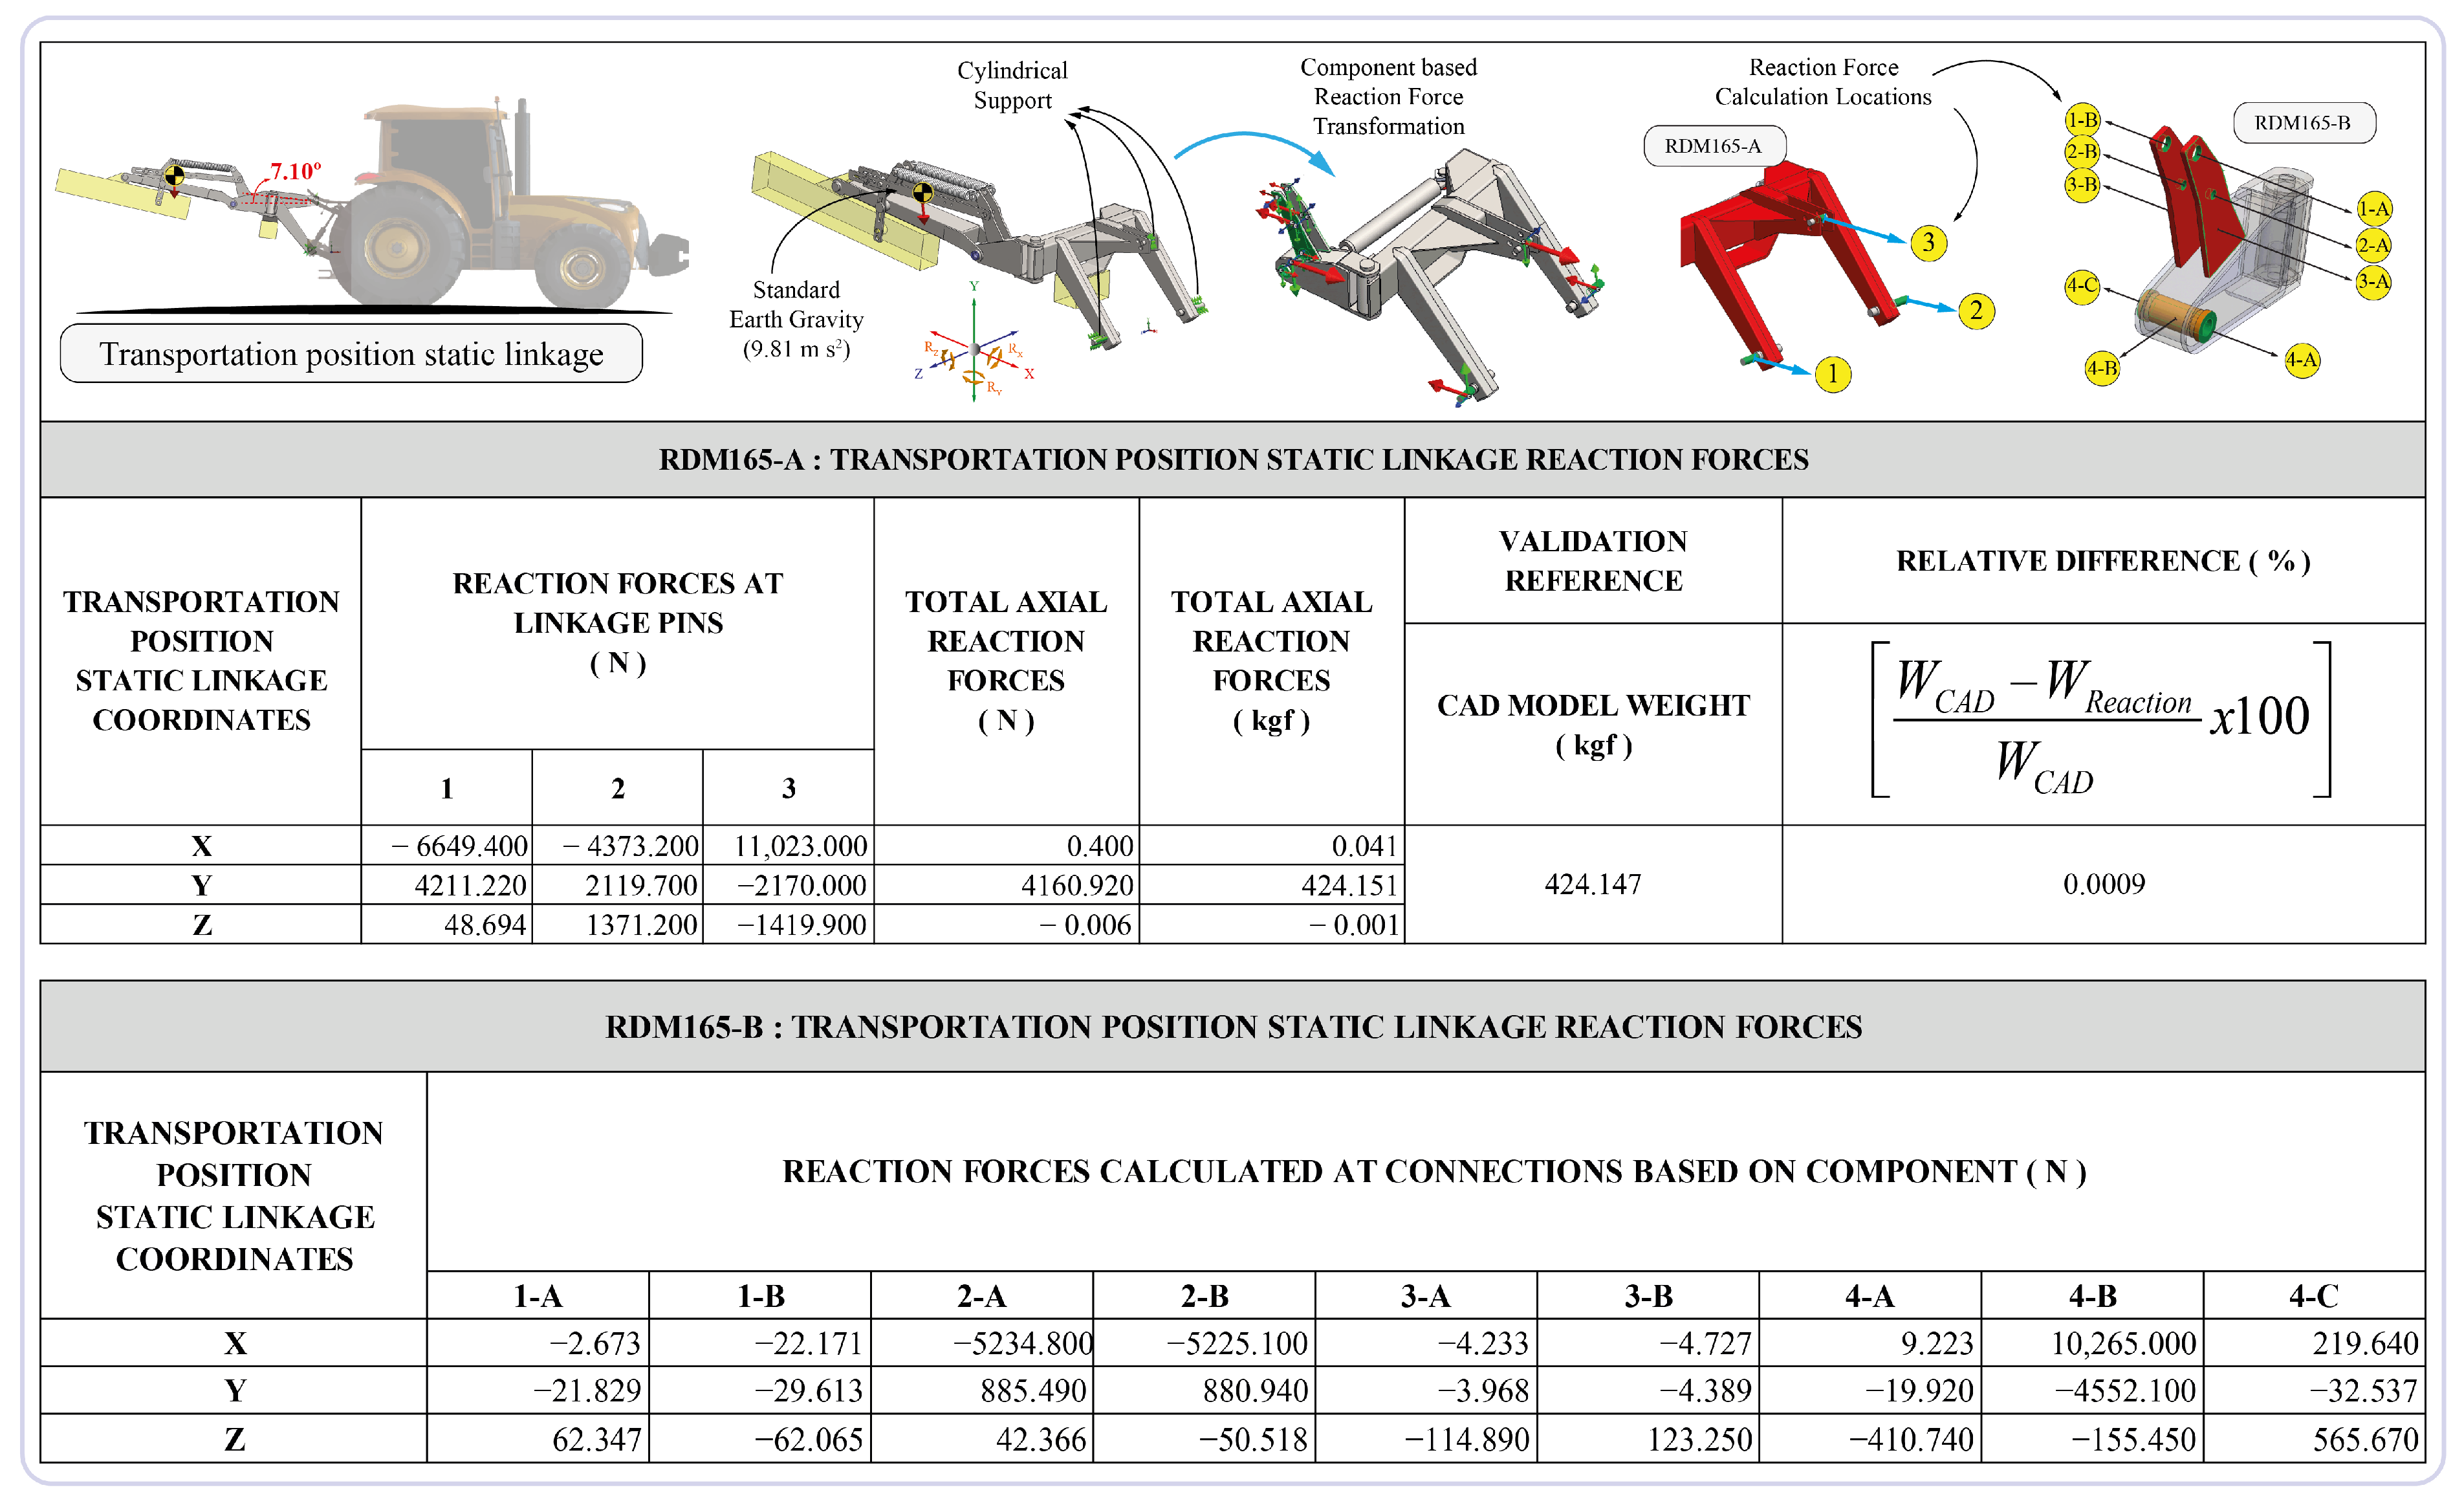
3.3. FEA Verification and Validation

The process for determining that a computational model accurately represents the underlying mathematical model and its solution is known as verification. Validation is the process of determining the degree to which a model is an accurate representation of the real world from the perspective of the intended uses of the model [29].
In order to evaluate the accuracy of the FE model and conduct internal verification, a skewness metric was employed. This metric assesses the deviation of the elements from equilateral cells. A skewness value of 0 indicates perfect cell quality, whereas a value of 1 signifies fully degenerated cells. Specifically, the scale is as follows: 0 (equilateral), >0 to 0.25 (excellent), 0.25 to 0.50 (good), 0.50 to 0.75 (fair), 0.75 to 0.9 (poor), 0.9 to <1 (bad), and 1 (degenerate) [30,31]. Notably, the FE model exhibited an average skewness metric value of 0.210 ± 0.25, which falls within the category of excellent cell quality.
A key component of assessing the validity of the strength-based design analysis process is confirming that the FEA stress values obtained through computer simulations accurately reflect the stress values obtained through the experimental analysis setup for real physical operating conditions. The comparison result was assessed using the calculated relative difference ratios in order to determine how closely the FEA simulations matched the machine’s actual operating circumstances. Equation (2) was employed to calculate the difference ratios [32]. The difference ratios were defined as the relative differences between the experimental and the FEA values.
R e l a t i v e   D i f f e r e n c e   ( % ) = σ E x p e r i m e n t a l σ F E A σ E x p e r i m e n t a l × 100
Here, σExperimental and σFEA are defined as von Mises equivalent stress values (in MPa) obtained as a result of experimental analysis and FEM-based analysis, respectively. Accordingly to this, biaxial graphs of the numerical comparisons of experimental and FEM-based stress analysis results for the components coded RDM165-A-004, RDM165-B-003, and RDM165-B-004 are shown in Figure 12.
It can be noted in the graphs that the relative differences range between 7.577% (RDM165-A-004) and 43.381% (RDM165-B-003) when comparing the equivalent stress values of the analyses carried out for the related components. The average relative difference ratio including all values was calculated as 24.25%.
According to the studies including FEA validation that were presented in various scientific fields, the relative difference ratios obtained by comparing experimental/theoretical analyses with FEA results vary [33,34,35,36,37,38,39,40,41]. However, there are opinions that the relative difference ratio of a well-established FEA approach should be around 10% at most [42,43].
In this context, the determined average relative difference value of 24.25% is just a little bit higher than the consensus of 10%. However, it becomes clear that these values are quite low when the absolute numerical values of the comparisons are properly examined. The maximum absolute difference in numbers is approximately 5 MPa. It could be said that, considering the physical conditions in which the experimental work was carried out and the solution approach specific to FEM, the actual numerical absolute difference is quite small. Although the absolute difference is small, the percentage value of the calculated difference is relatively high compared to the general view, since the compared values are also quite small. The following issues were identified as the conclusion of the final assessment for the FEA validation study: unexpected and unpredictable dynamic conditions of machine elements under real operating conditions, limitations in simulating real working conditions, solution approach specific to FEA, and mandatory assumptions which have to be considered in order to handle the limitations within the context of this numerical technique. Considering the FEA solution platform capacity and the absence of any abnormality in the deformation behaviour examined for the machine elements, it was concluded that all FEA approaches established to simulate the physical conditions for the RDM were set up correctly and were satisfactory for use in structural analysis studies.

4. Conclusions

In agricultural harvester design, there is a noticeable lack of studies systematically employing experimental and advanced engineering simulation methods for strength-based design analysis, especially in the context of rotary drum mowers. The purpose of this study was to realise structural strength analysis utilising experimental and numerical analysis approaches that could be applied to the structural design studies of a new tractor-attachable harvester within the focus of transportation: the worst-case scenario. In the study, physical tests compatible with CAE-based structural strength analysis techniques were performed on the rotary drum mower. The FEA was validated by experimental results, and a reasonable correlation specific to the boundary conditions defined in this study was obtained. Deformation distributions on the machine were clearly exhibited through FEA simulations. No functional disturbance or failure indication in the structural components of the machine was observed during transportation. The experimental study revealed that, under dynamic transportation conditions, the machine was loaded approximately four times higher than static linkage self-loading. Additionally, for future work, structural optimisation indicators and the feasibility of reducing the material weight and total cost of the machine components can be discussed through the lens of the analysis results obtained in this study. As the final conclusion, this study demonstrated that a well-constructed FEA approach can play a significant role in decreasing the number of physical prototype tests as well as the time lost and production costs during the design process of agricultural machinery, and this study provides a useful methodology for informing future studies on complex stress and deformation evaluations of related agricultural machinery and equipment through experimental and sophisticated CAE approaches.

Supplementary Materials

The following supporting information can be downloaded at: https://www.mdpi.com/article/10.3390/app132011338/s1, Supplementary: Experimental stress analysis results by components.

Author Contributions

H.K.C.: project administration, investigation, visualization, formal analysis, and writing—original draft; I.A.: supervision, conceptualisation, methodology, and resources; N.C.: data curation, methodology, and writing—original draft; A.E.W.R.: conceptualisation and writing—review and editing. All authors have read and agreed to the published version of the manuscript.

Funding

This paper is a part of the PhD research presented in the thesis of Dr. H. Kursat Celik, supported financially by the Scientific Research Projects Coordination Unit of Akdeniz University (Turkey) (Project No: 2011.03.0121.006).

Institutional Review Board Statement

Not applicable.

Informed Consent Statement

Not applicable.

Data Availability Statement

The data presented in this study are available in the supplementary file attached to this this article.

Conflicts of Interest

The authors declare no conflict of interest. The funders had no role in the design of the study; in the collection, analyses, or interpretation of data; in the writing of the manuscript; or in the decision to publish the results.

References

  1. Sha, L. An Application of Industrial Design in Large-Scale Agricultural Machinery. In Proceedings of the 2008 9th International Conference on Computer-Aided Industrial Design and Conceptual Design, Beijing, China, 22–25 November 2008; pp. 823–828. [Google Scholar] [CrossRef]
  2. Sun, H.; Guo, W.; Wang, L.; Rong, B. An Analysis Method of Dynamic Requirement Change in Product Design. Comput. Ind. Eng. 2022, 171, 108477. [Google Scholar] [CrossRef]
  3. Akhtar Khan, A.; Sultan, U.; Rudra, R.P.; Ehsan, F.; Kashif, M.; Mohsin Khan, M.; Hashim, S.; Zohaib, M.; Imran Ahmad, S. Structural Analysis of Cotton Stalk Puller and Shredder Machine. Alex. Eng. J. 2022, 64, 335–347. [Google Scholar] [CrossRef]
  4. Guzel, E. Harvest Threshing Principles and Machines-Lecture Notes No:116 (Hasat-Harman İlkeleri ve Makinaları Ders Kitabı), 1st ed.; Publication of Faculty of Agriculture, Cukurova University: Adana, Turkey, 1993. [Google Scholar]
  5. Srivastava, A.K.; Goering, C.E.; Rohrbach, R.P. Engineering Principles of Agricultural Machines; American Society of Agricultural Engineers: St. Joseph, MI, USA, 1993; ISBN 09-293-55334. [Google Scholar]
  6. El-Baily, M.M. A Study of Rotary Drum Mower Blade Wear and Its Effects on Forage Productivity. Poljopr. Teh. 2022, 47, 87–100. [Google Scholar] [CrossRef]
  7. TRMoNE. Green Forage Harvesters (Agricultural Technologies Lecture Notes); TRMoNE, Turkish Republic Ministry of National Education: Ankara, Turkey, 2009. (In Turkish) [Google Scholar]
  8. Wu, B.; Zuo, T.; Li, Z.; Qian, H.; Huang, T.; Xiang, Y. Numerical Simulation and Optimization of the Airflow Field of a Forage Drum Mower. Appl. Sci. 2023, 13, 5910. [Google Scholar] [CrossRef]
  9. Bartoň, S. The Dynamics of the Drum Mower Blade. In Proceedings of the Programs and Algorithms of Numerical Mathematics 19, Institute of Mathematics, Czech Academy of Sciences, Prague, Czech Republic, 20 April 2019; pp. 7–14. [Google Scholar]
  10. Celik, H.K.; Akinci, I. Analytical and Finite Element Method Based Stress Analysis of the Motion Transmission Axels of A Rotary Drum Mower. J. Agric. Mach. Sci. 2015, 11, 247–255. (In Turkish) [Google Scholar]
  11. Celik, H.K.; Akinci, I. Analytical and Finite Element Method Based Stress Analysis of Rotary Elements: Case Study for the Motion Transmission Gears of a Rotary Drum Mower. J. Fail. Anal. Prev. 2016, 16, 293–301. [Google Scholar] [CrossRef]
  12. Persson, S. Development of a Rotary Countershear Mower. Trans. ASAE 1993, 36, 1517–1523. [Google Scholar] [CrossRef]
  13. Yuksel Tarim Inc. YUKSEL TARIM—Agricultural Machinery Inc. Available online: http://www.yukseltarim.com/ (accessed on 4 September 2013).
  14. TS EN ISO 6892-1; Metallic Materials—Tensile Testing—Part 1: Method of Test at Room Temperature (ISO 6892-1:2019). ISO: Geneva, Switzerland, 2020.
  15. HBM Datasheet: QuantumX MX840A. Doc. No: B2924-2.0 En 2011, 16.
  16. HBM Strain Gages and Accessories. Doc. No: S 1265-1.0 En 2011, 100.
  17. HBM Inc. DAQ Software|Data Acquisition Software|Catman|HBM. Available online: https://www.hbm.com/en/2290/catman-data-acquisition-software/?product_type_no=DAQ Software (accessed on 5 November 2022).
  18. Hoffmann, K. An Introduction to Measurements Using Strain Gages; Hottinger Baldwin Messtechnik GmbH: Darmstadt, Germany, 1989. [Google Scholar]
  19. Vishay. M-Bond 200 Adhesive—Material Safety Datasheet (MSDS#MGM007T /.14027); Vishay: Malvern, PA, USA, 2007. [Google Scholar]
  20. MKE. MKE Norm Special Steel Types Catalog, 1st ed.; MKE, Ed.; Machinery and Chemical Industry Corporation (MKE): Ankara, Turkey, 1978. [Google Scholar]
  21. Davis, J.R. Metals Handbook; CRC Press: Boca Raton, FL, USA, 1998; p. 2571. [Google Scholar]
  22. Kutay, G. The Machinist’s Guide, 1st ed.; Birsen Publication: Ankara, Turkey, 2003; ISBN 9799755113424. [Google Scholar]
  23. Rice, R.C.; Jackson, J.L.; Bakuckas, J.; Thompson, S. Metallic Materials Properties Development and Standardization (MMPDS); U.S. Department of Transportation Federal Aviation Administration: Roanoke, VA, USA, 2003; ISBN 6094854004. [Google Scholar]
  24. Kulaksiz, O. Tables in Metal Profession (Metal Mesleğinde Tablolar); Turkish Republic Ministry of National Education: Istanbul, Turkey, 1995; ISBN 9751124123. [Google Scholar]
  25. Bringas, J.E. Handbook of Comparative World Steel Standards, 5th ed.; Bringas, J.E., Ed.; ASTM International: West Conshohocken, PA, USA, 2016; ISBN 978-0-8031-7077-3. [Google Scholar]
  26. Cardarelli, F. Materials Handbook: A Concise Desktop Reference, 2nd ed.; Springer London: London, UK, 2008; ISBN 9781846286681. [Google Scholar]
  27. Wakabayashi, N.; Ona, M.; Suzuki, T.; Igarashi, Y. Nonlinear Finite Element Analyses: Advances and Challenges in Dental Applications. J. Dent. 2008, 36, 463–471. [Google Scholar] [CrossRef] [PubMed]
  28. SolidWorks Doc. SolidWorks Simulation Premium: Nonlinearity Training Manual Document No: 22658021044-ENG0001; 22658021044-ENG0001; SolidWorks Corporation: Waltham, MA, USA, 2010. [Google Scholar]
  29. Schwer, L.E. An Overview of the PTC 60/V&V 10: Guide for Verification and Validation in Computational Solid Mechanics. Eng. Comput. 2007, 23, 245–252. [Google Scholar] [CrossRef]
  30. ANSYS. Product Doc. ANSYS Meshing User’s Guide: Skewness (Release 2019 R2); ANSYS Inc.: San Diego, CA, USA, 2019. [Google Scholar]
  31. Brys, G.; Hubert, M.; Struyf, A. A Robust Measure of Skewness. J. Comput. Graph. Stat. 2004, 13, 996–1017. [Google Scholar] [CrossRef]
  32. Kurowski, P. and Szabo, B. How to Find Errors in Finite-Element Models. Mach. Des. 1997, 1, 93–98. [Google Scholar]
  33. Celik, H.K.; Caglayan, N.; Topakci, M.; Rennie, A.E.W.; Akinci, I. Strength-Based Design Analysis of a Para-Plow Tillage Tool. Comput. Electron. Agric. 2020, 169, 105168. [Google Scholar] [CrossRef]
  34. Celik, H.K.; Rennie, A.E.W.; Akinci, I. Design and Structural Optimisation of a Tractor Mounted Telescopic Boom Crane. J. Brazilian Soc. Mech. Sci. Eng. 2017, 39, 909–924. [Google Scholar] [CrossRef]
  35. Celik, H.K.; Caglayan, N.; Çinar, R.; Ucar, M.; Ersoy, H.; Rennie, A.E.W. Stress Analysis of a Sample Marine Crane’s Boom under Static Loading Condition. In Proceedings of the 5th International Mechanical Engineering Forum 2012, Prague, Czech Republic, 20–22 June 2012; pp. 246–255. [Google Scholar]
  36. Caliskan, K. The Optimisation of Cab Protective Structure with Finite Element Method Simulation Verified with Laboratory Tests. Ph.D. Thesis, Ege University, İzmir, Turkey, 2011. [Google Scholar]
  37. Yurdem, H.; Degirmencioglu, A.; Cakir, E.; Gulsoylu, E. Measurement of Strains Induced on a Three-Bottom Moldboard Plough under Load and Comparisons with Finite Element Simulations. Meas. J. Int. Meas. Confed. 2019, 136, 594–602. [Google Scholar] [CrossRef]
  38. Degirmencioglu, A. Determination of Stress Under Load on a Three-Bottom Moulboard Plough (Research Project: 98 ZRF046); Scientific Research Projects Coordination Unit: Izmir, Turkey, 2003. [Google Scholar]
  39. Ruiz de Galarreta, S.; Jeffers, J.R.T.; Ghouse, S. A Validated Finite Element Analysis Procedure for Porous Structures. Mater. Des. 2020, 189, 108546. [Google Scholar] [CrossRef]
  40. Torre, R.; Brischetto, S. Experimental Characterization and Finite Element Validation of Orthotropic 3D-Printed Polymeric Parts. Int. J. Mech. Sci. 2022, 219, 107095. [Google Scholar] [CrossRef]
  41. Ariza, O.; Gilchrist, S.; Widmer, R.P.; Guy, P.; Ferguson, S.J.; Cripton, P.A.; Helgason, B. Comparison of Explicit Finite Element and Mechanical Simulation of the Proximal Femur during Dynamic Drop-Tower Testing. J. Biomech. 2015, 48, 224–232. [Google Scholar] [CrossRef]
  42. Krutz, G.; Thompson, L.; Claar, P. Design of Agricultural Machinery; John Wiley and Sons: New York, NY, USA, 1984; ISBN 047108672X. [Google Scholar]
  43. Kuna, M. Finite Elements in Fracture Mechanics; Solid Mechanics and Its Applications; Springer Netherlands: Dordrecht, The Netherlands, 2013; Volume 201, ISBN 978-94-007-6679-2. [Google Scholar]
Figure 1. Some of the technical and dimensional specifications of the RDM.
Applsci 13 11338 g001
Figure 2. Total work cycle scenario for the RDM.
Applsci 13 11338 g002
Figure 3. Weight measurement for the RDM.
Applsci 13 11338 g003
Figure 4. Material confirmation tensile tests.
Applsci 13 11338 g004
Figure 5. Strain gauge set up in detail.
Applsci 13 11338 g005
Figure 6. Physical static linkage and transportation tests.
Applsci 13 11338 g006
Figure 7. Solid modelling procedure, final assembly, re-configuration for the FEA, and assembly statistics for the RDM.
Applsci 13 11338 g007
Figure 8. Boundary conditions and the forces acting on the TBM165 A and TBM165 B element groups.
Applsci 13 11338 g008
Figure 9. Graphical representation of the maximum stress values obtained from the physical tests.
Applsci 13 11338 g009
Figure 10. Details of the FE model and FEA deformation printout (overall machine).
Applsci 13 11338 g010
Figure 11. Details of the FE model and FEA printout (component based).
Applsci 13 11338 g011
Figure 12. Numerical comparisons of the experimental and FEM-based stress analysis results by component.
Applsci 13 11338 g012
Table 1. Material properties assigned in the CAD modelling and the FEA study.
Properties *UnitComponents
Structural SteelSpring
(DIN EN 10270-1)
Key/Pin/Shaft
(DIN 1.5755/31NiCr14/
AISI 3330)
Bolt-Nut
Standard: 8.8
Modulus of Elasticity(GPa)210210210210
Poisson’s Ratio(-)0.300.280.300.30
Yield Strength (Max.)(MPa)280 **700550640
Ultimate Tensile Strength (Max.)(MPa)404 **1000750800
Density(kg m−3)7850785078507850
* FEA definitionHomogenous isotropic linear elastic material model. ** Experimental.
Table 2. Results of the tractor speed measurements in road tests.
Tractor Speed
(km h−1)
Test OrderAsphalt RoadDirt RoadIn-Field Road
Tractor Speed-018.50 ± 0.488.81 ± 0.038.55 ± 0.60
Tractor Speed-0213.44 ± 1.2014.01 ± 0.3712.67 ± 0.53
Tractor Speed-0323.40 ± 2.5324.96 ± 0.1017.55 ± 2.18
Table 3. The calculations for loading coefficients by components.
Strain-Gauge NoPart Code
RDM165-A-004RDM165-B-003RDM165-B-004
SG-013.023.513.20
SG-022.433.515.22
SG-034.124.124.24
SG-04-3.244.27
SG-05-4.342.97
SG-06-2.333.10
SG-07-6.593.58
Average3.19 ± 0.863.95 ± 1.333.80 ± 0.82
Overall Average 3.65 ± 0.40
Table 4. Numerical stress values taken from each SG location in the component-based FEA (RDM in-garage static linkage position).
Strain-Gauge NoFEA Equivalent Stress (von Mises) (MPa)
Part Code
RDM165-A-004RDM165-B-003RDM165-B-004
SG-0116.4974.2268.110
SG-026.7166.6786.892
SG-038.1228.3865.379
SG-04-11.50610.329
SG-05-10.64313.247
SG-06-10.50713.354
SG-07-5.9118.112
Disclaimer/Publisher’s Note: The statements, opinions and data contained in all publications are solely those of the individual author(s) and contributor(s) and not of MDPI and/or the editor(s). MDPI and/or the editor(s) disclaim responsibility for any injury to people or property resulting from any ideas, methods, instructions or products referred to in the content.

