1. Introduction
Coal, being one of the primary global energy sources, plays a pivotal role in driving economic and social development. Nevertheless, coal mining induces rock strata deformation and surface ground subsidence, giving rise to an array of environmental and geological challenges that jeopardize the wellbeing and property safety of local inhabitants. As the coal mine backing face advances, a subsidence basin gradually takes shape on the surface, constituting a complex spatial and temporal phenomenon [
1]. Hence, it is imperative to monitor surface deformations within the mining area, investigate subsidence patterns, and forecast mining-induced subsidence. These efforts will yield essential scientific guidance for ensuring safe coal mining practices and effectively mitigating and managing geological hazards in the mining region [
2].
Surface settlement monitoring conventionally entails the establishment of observation stations along the primary strike and dip of the working face. It utilizes traditional measurement methods, including triangulation, wireline measurement, leveling, and GNSS, to monitor distinct mining stages and acquire deformation data for the measurement points via data processing. The conventional monitoring technology exhibits high measurement accuracy and widespread application in mine surface deformation monitoring. Nevertheless, it also presents significant limitations: limited “point-like” data are acquired from surface observation stations, resulting in low spatial resolution; substantial manpower and material resources are consumed; the process is time-consuming, and observation stations are vulnerable to damage.
The rapid advancements in remote sensing technology have significantly facilitated the integration of synthetic aperture radar (InSAR) and unmanned aerial vehicle (UAV) technologies for deformation monitoring. InSAR technology captures the elevation information of a specific area through interferometric processing of two SAR images. Differential synthetic aperture radar interferometry (D-InSAR), an extension of InSAR, incorporates an external digital elevation model (DEM) to monitor ground surface deformation [
3,
4]. D-InSAR offers various advantages, including extensive coverage, high accuracy, and spatial continuity, making it highly sensitive to small ground surface deformations. The theoretical observation accuracy can reach centimeter or even millimeter levels, enabling the detection of subtle deformations at the edges of sedimentation basins in mining areas. However, despite these benefits, D-InSAR has limitations when it comes to monitoring large deformations in the central region of mine subsidence basins due to the presence of decoherence, which results in inaccurate deformation detection. To address this, Gabriel et al. [
5] achieved centimeter-level monitoring of surface deformation using InSAR, marking a significant breakthrough in its application to deformation monitoring. Carnec et al. [
6] demonstrated the potential of the D-InSAR technique by using three ERS-1 images for monitoring mine deformations, especially in mine subsidence monitoring. Consequently, numerous scholars have engaged in research based on conventional InSAR techniques, proposing methods like Persistent Scatterer InSAR (PS-InSAR), Small Baseline Subset InSAR (SBAS-InSAR), and Temporal Coherence Point InSAR (TCP-InSAR), among others [
4,
7,
8,
9,
10,
11,
12], and have applied them to case studies in mining areas, achieving millimeter-level observation accuracy. However, these conventional methods still face challenges in accurately monitoring large-gradient deformations in mining regions.
In recent years, UAV photogrammetry technology has experienced rapid development, with UAVs becoming increasingly lightweight and affordable. Simultaneously, computer performance has greatly improved, leading to enhanced data processing efficiency for UAVs. These advancements create an opportunity for the application of UAVs in surface deformation monitoring within mining areas. Compared with conventional deformation monitoring methods, UAV photogrammetric techniques offer increased flexibility and cost effectiveness, allowing for the acquisition of “face-like” surface settlement information with more intuitive and comprehensive data results [
13,
14,
15]. The accuracy of surface deformation monitoring through UAVs can reach the decimeter level, making it suitable for monitoring large-gradient deformations at the center of mine subsidence basins. However, it may not fully meet the monitoring requirements for deformations at the edges of mine subsidence basins. Chen et al. [
16] utilized UAVs to collect the topographic information of an open-pit mine to create a digital surface model (DSM). Shahbazi et al. [
17] employed UAV photogrammetry to analyze the topographic features of the mining area, rapidly calculate earthwork volumes, and establish a three-dimensional model of the mining area using point cloud data. Ge et al. [
18] applied UAV low-altitude remote sensing on open-pit mines and found that this method effectively estimates mine storage while also offering advantages in monitoring slope stability within the mining area. Xiang et al. [
19] utilized the differential DEM method to analyze changes in the topography and geomorphology of the mining area, allowing for monitoring and analysis of the environmental impact of open-pit mining activities. Lian et al. [
20] utilized unmanned aerial vehicle (UAV) photogrammetry to observe surface subsidence in the mining region of Yangquan, China. Zhang et al. [
21] employed Differential Interferometric Synthetic Aperture Radar (D-InSAR) and UAV photogrammetry to evaluate the subsidence of coal pan 81,403 in the Yangquan coal mine. The fusion points were meticulously selected for the two datasets, and the agreement of the fused data with the leveled data was validated. Zhou et al. [
22] introduced an approach to monitor the dynamic surface subsidence basin caused by underground coal mining using UAV photogrammetry, aiming to promptly acquire the mining subsidence parameters. Wang et al. [
23] applied the probability integration method to process deformation data collected from UAV, D-InSAR, and SBAS-InSAR techniques, with the goal of deriving a comprehensive deformation field. Mishra et al. [
24] offer a comprehensive review of the numerous applications of unmanned aerial systems in various water resource subfields, highlighting the benefits of these systems, including their high spatial and temporal resolution, convenience, and cost effectiveness. Karanam et al. [
25] employed the Sentinel-1 C-band SAR dataset acquired between 2016 and 2021 to assess basin-wide deformation within the Permian Basin. They achieved millimeter-precise time-series deformation measurements through the utilization of the persistent scattering interferometry (PSI) technique. Karanam et al. [
26] conducted a persistent scatterer interferometric analysis on 60 Sentinel-1 C-band images. They adjusted the outcomes for atmospheric errors using General Atmospheric Correction Online Service (GACOS) atmospheric modeling data and then broke down the results into vertical displacement values to quantify the subsidence. Hazard patterns within the coalfield were examined on a zonal basis. In recent years, Alvarez-Vanhard et al. [
27] have conducted extensive reviews of numerous papers, with a particular emphasis on exploring the synergies between UAVs and satellite remote sensing.
Currently, there is limited research on the combination of InSAR technology and UAV for monitoring mining subsidence. This field of research remains in its nascent stage and faces several limitations. The duration of surface subsidence monitored by InSAR and UAV is limited, and the entire monitoring process, from the initial ground movement to the maximum subsidence in the basin, has not been fully implemented. The current research methods for subsidence estimation predominantly rely on probabilistic integral models combined with temporal functions, and there is a lack of research regarding the inversion of static estimation parameters.
In this study, we conducted synergistic monitoring of surface settlement within a mining area using InSAR and UAV technologies. The data obtained from these two methods were integrated, and the accuracy of the fused dataset was subsequently validated to be within a 10 cm margin, as corroborated by precise leveling data. This study also demonstrates that the fused data can effectively support the application of the BFGS algorithm for inverting probabilistic integral model parameters. Furthermore, the prediction results align closely with the observed surface deformation patterns. Thus, it presents a novel approach to globally automated subsidence monitoring in mining areas.
2. Materials and Methods
2.1. Study Area and Data
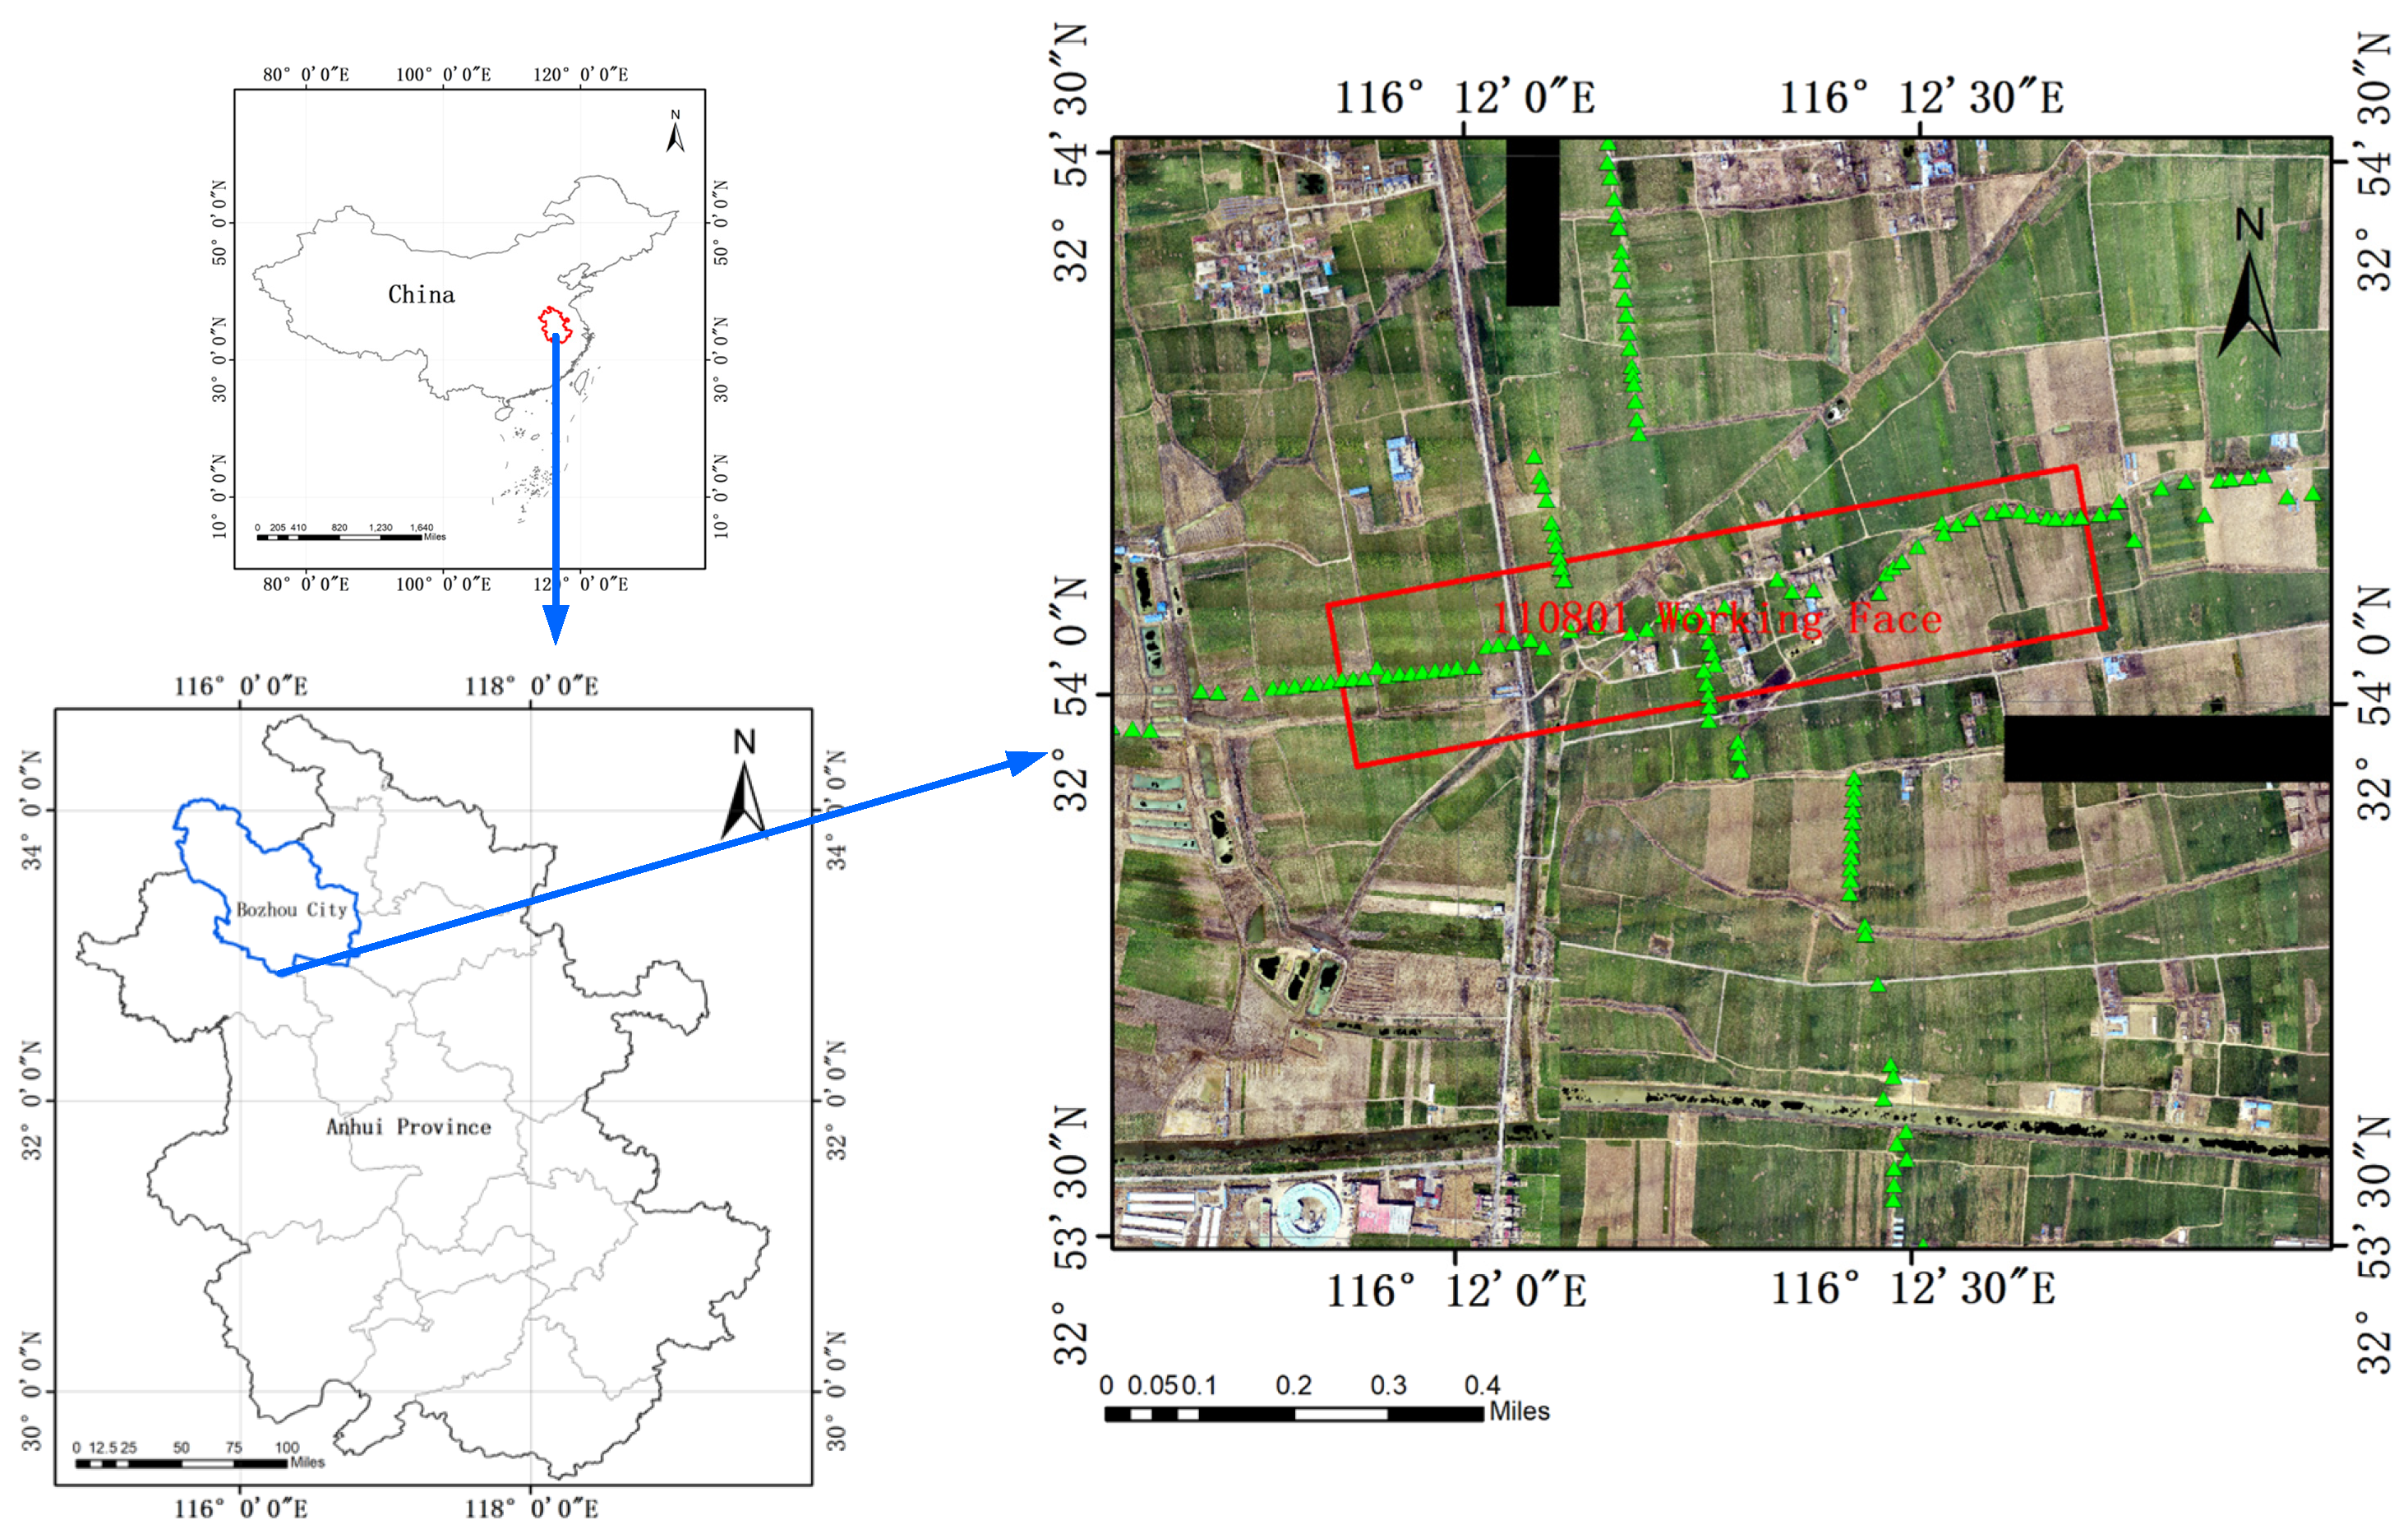
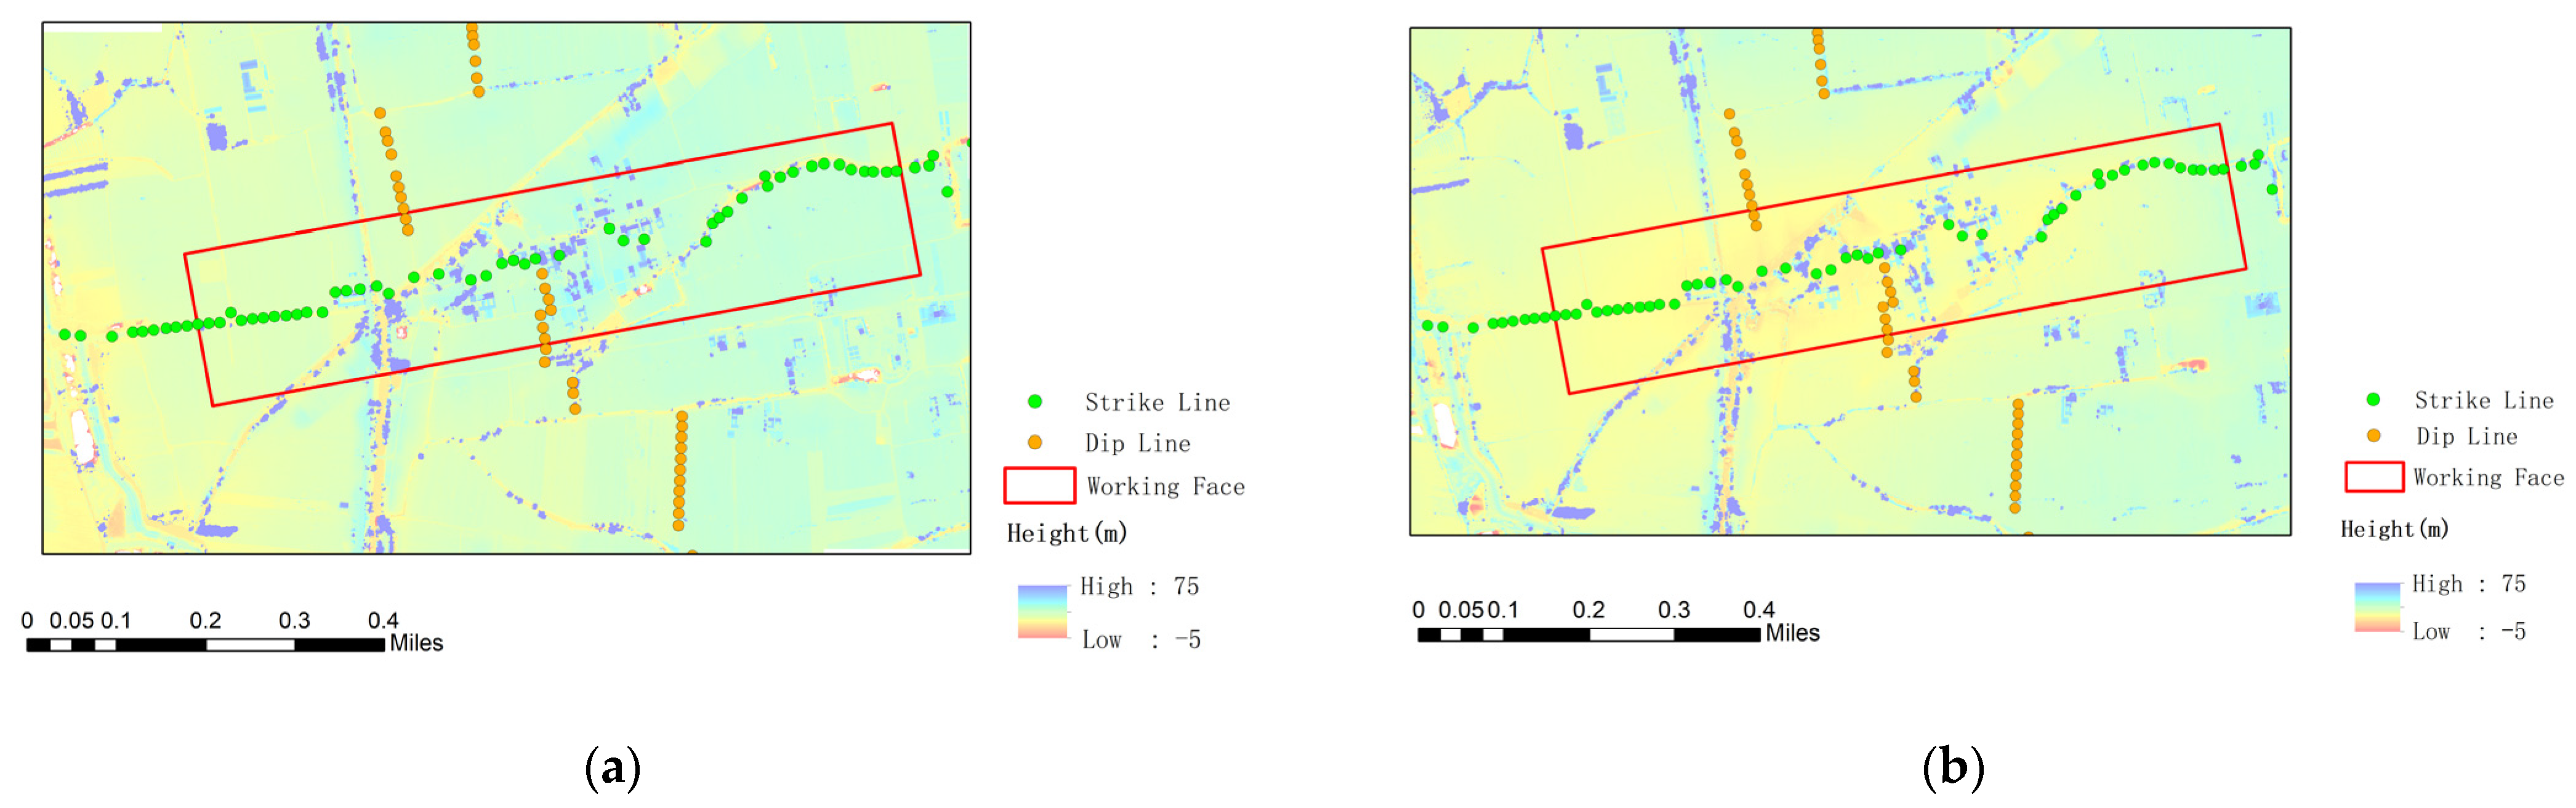
The research domain chosen for this investigation was the initial excavation zone (110,801) situated in East Area 1 of the Banji Coal Mine, Anhui Province. The first mining face 110,801 extends over a strike distance of 1237 m and displays a dip width of 280 m. The angle of inclination of the coal seam varies from 0° to 15°, with an average dip angle of 8°. Additionally, the coal seam manifests a thickness ranging from 1 m to 3.7 m, averaging at 2.5 m. The thickness of the overburden bedrock spans from 30 m to 330 m, with an average thickness of 130 m. The depth of the lower boundary of the coal seam ranges from 650 m to 834 m, with an average depth of 767 m. To enable monitoring of surface deformation, two observation lines, one along the strike and the other along the dip, were established above the surface. The strike observation line accommodated a total of 98 monitoring points, spaced between 20 m and 60 m apart. Similarly, the dip observation line included 92 monitoring points, spaced between 20 m and 40 m apart. The precise geographical location of the research area is illustrated in
Figure 1.
The SAR data utilized in this study were acquired from ESA’s Sentinel-1A satellite, equipped with a C-band microwave sensor that revisits the area every 12 days. A total of 38 SAR images from ascending orbits, spanning the period from 10 April 2021 to 28 June 2022, were carefully chosen for this study. All pertinent parameters related to these SAR images are presented in
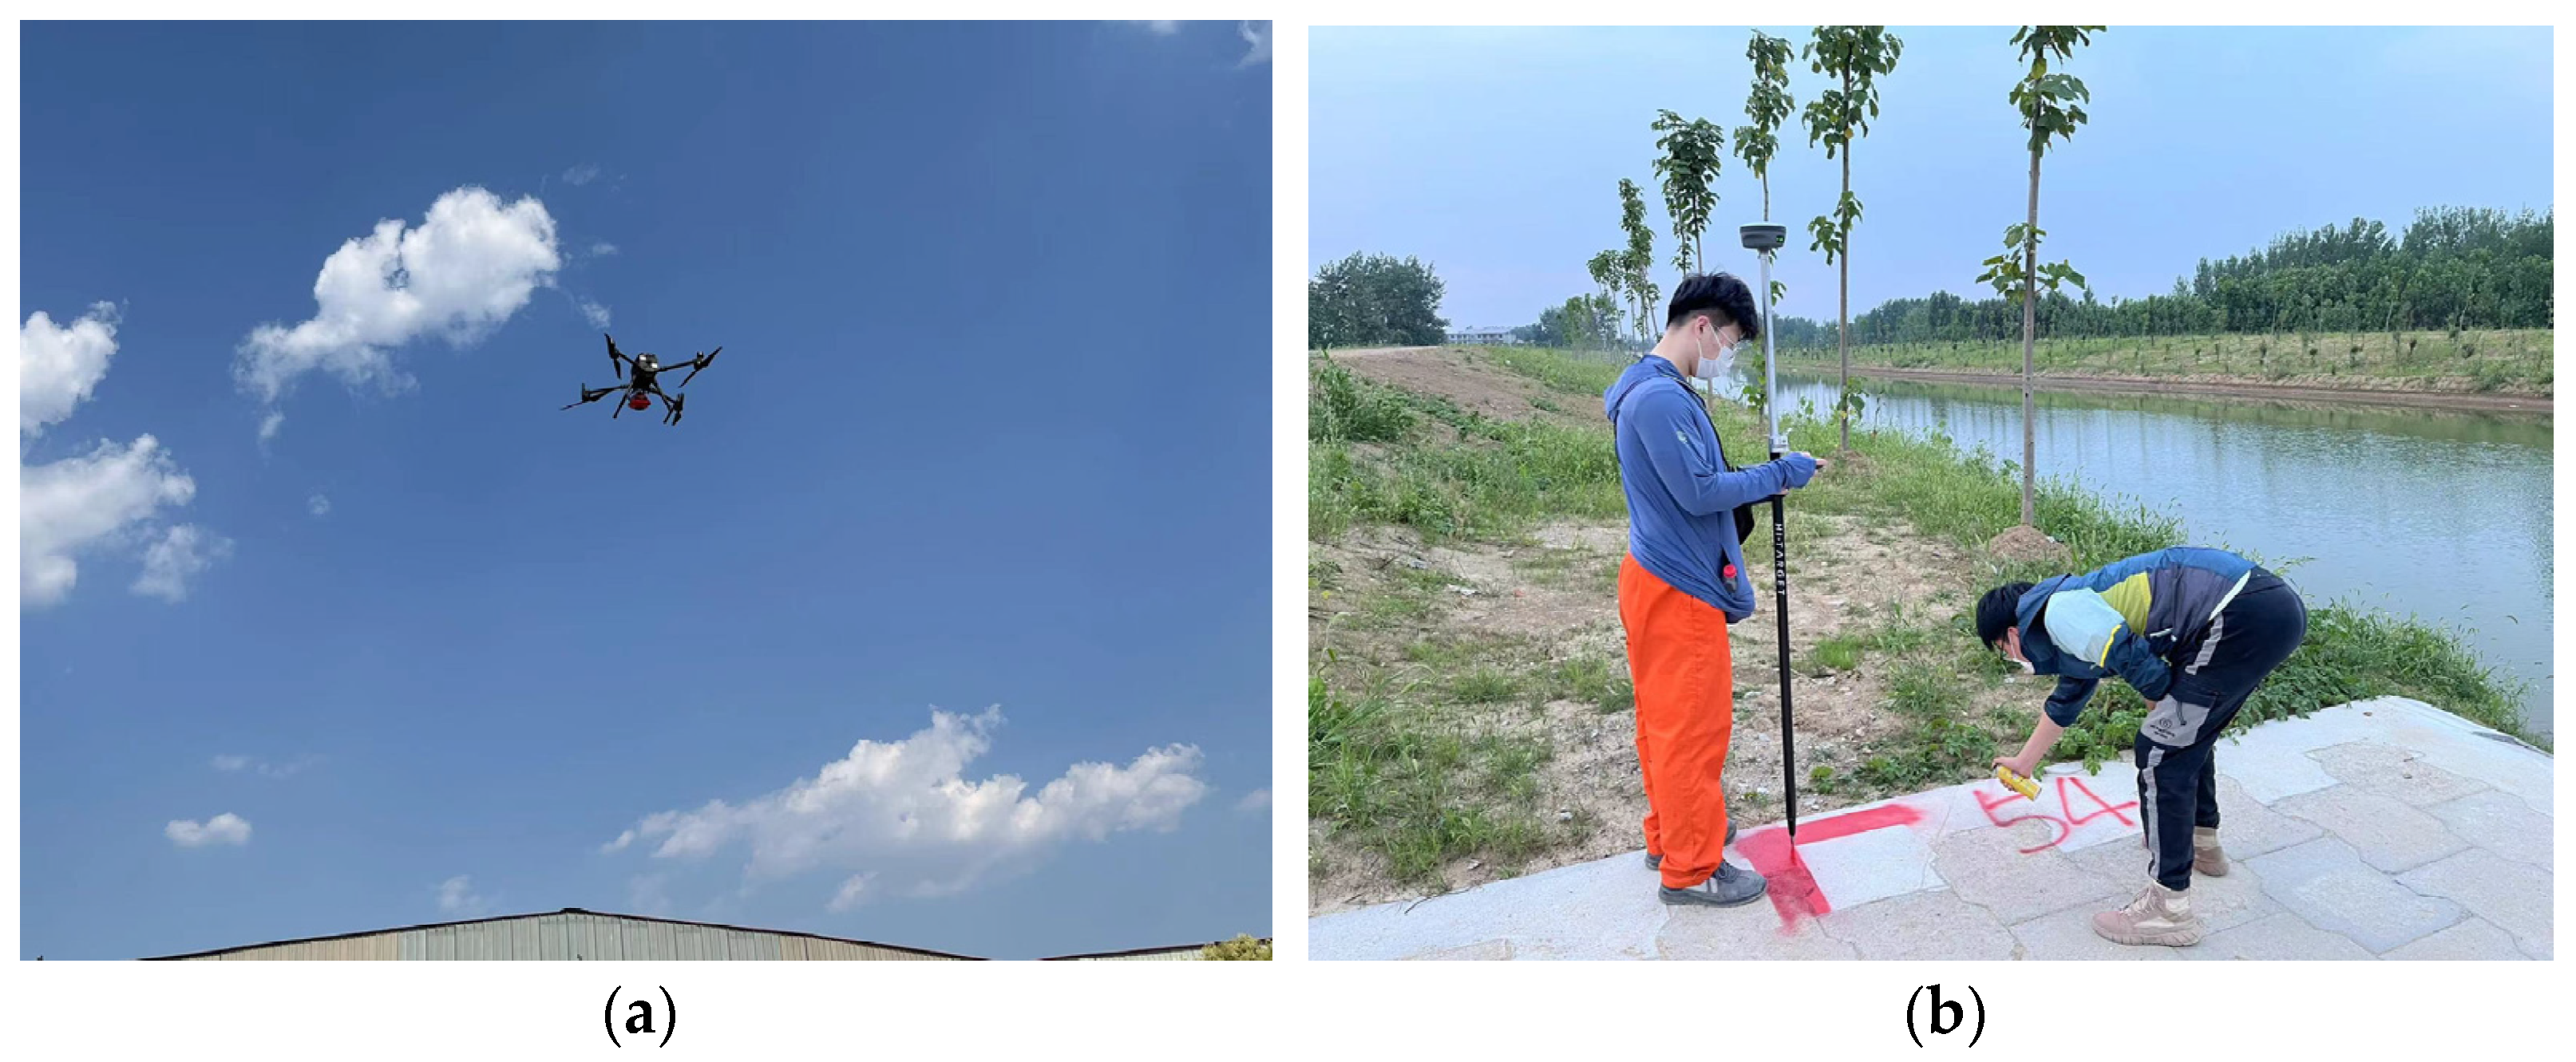
Table 1. Additionally, the external DEM used in this study was selected from the shuttle radar topography mission (SRTM) data, providing a resolution of 30 m. The UAV data were acquired on two specific dates: 10 April 2021 and 28 June 2022, utilizing the DJI Matrice 300 RTK UAV (DJI, Shenzhen, China) equipped with a five-lens V2 tilt camera(SHARE, Shenzhen, China). The outdoor data collection scenario for the drone is shown in
Figure 2. The drone missions were carried out at a skyward elevation of 159.8 m, with a ground resolution of 2.5 cm. During the flights, an 80% heading overlap rate and a 70% side-to-side overlap rate were achieved, ensuring comprehensive coverage of the study area. The main parameters pertinent to the UAV data collection are listed in
Table 2. The monitoring points were subjected to routine surveillance for surface settlement using precise level and GNSS measurement techniques, conducted on the respective dates of 10 April 2021 and 28 June 2022, thus obtaining the plane coordinates and elevations of the monitoring points for both phases. The leveling survey was conducted to meet the precision standards of a third-class leveling survey, ensuring that the average elevation error for each survey did not exceed 3.5 mm. Furthermore, the total error in elevation observations for each kilometer after leveling fell within the specified range of ±6.0 mm, as stipulated by the requirements for a third-class leveling survey. The planar connection measurement was conducted using GNSS technology, with a maximum error in the planar point position not exceeding 2.0 cm and an average error remaining within 1.5 cm. These measurements align with the precision requirements of the subsidence observation project.
2.2. D-InSAR Data Processing
This study utilized the D-InSAR technique for processing SAR images to retrieve radar line-of-sight (LOS) deformations throughout the complete time series [
23]. The methodology involves the computation of separate interferograms using SAR images acquired during contiguous time intervals. In this approach, the secondary image obtained from the initial distinct interferogram is utilized as the primary image for the subsequent interferogram [
28,
29,
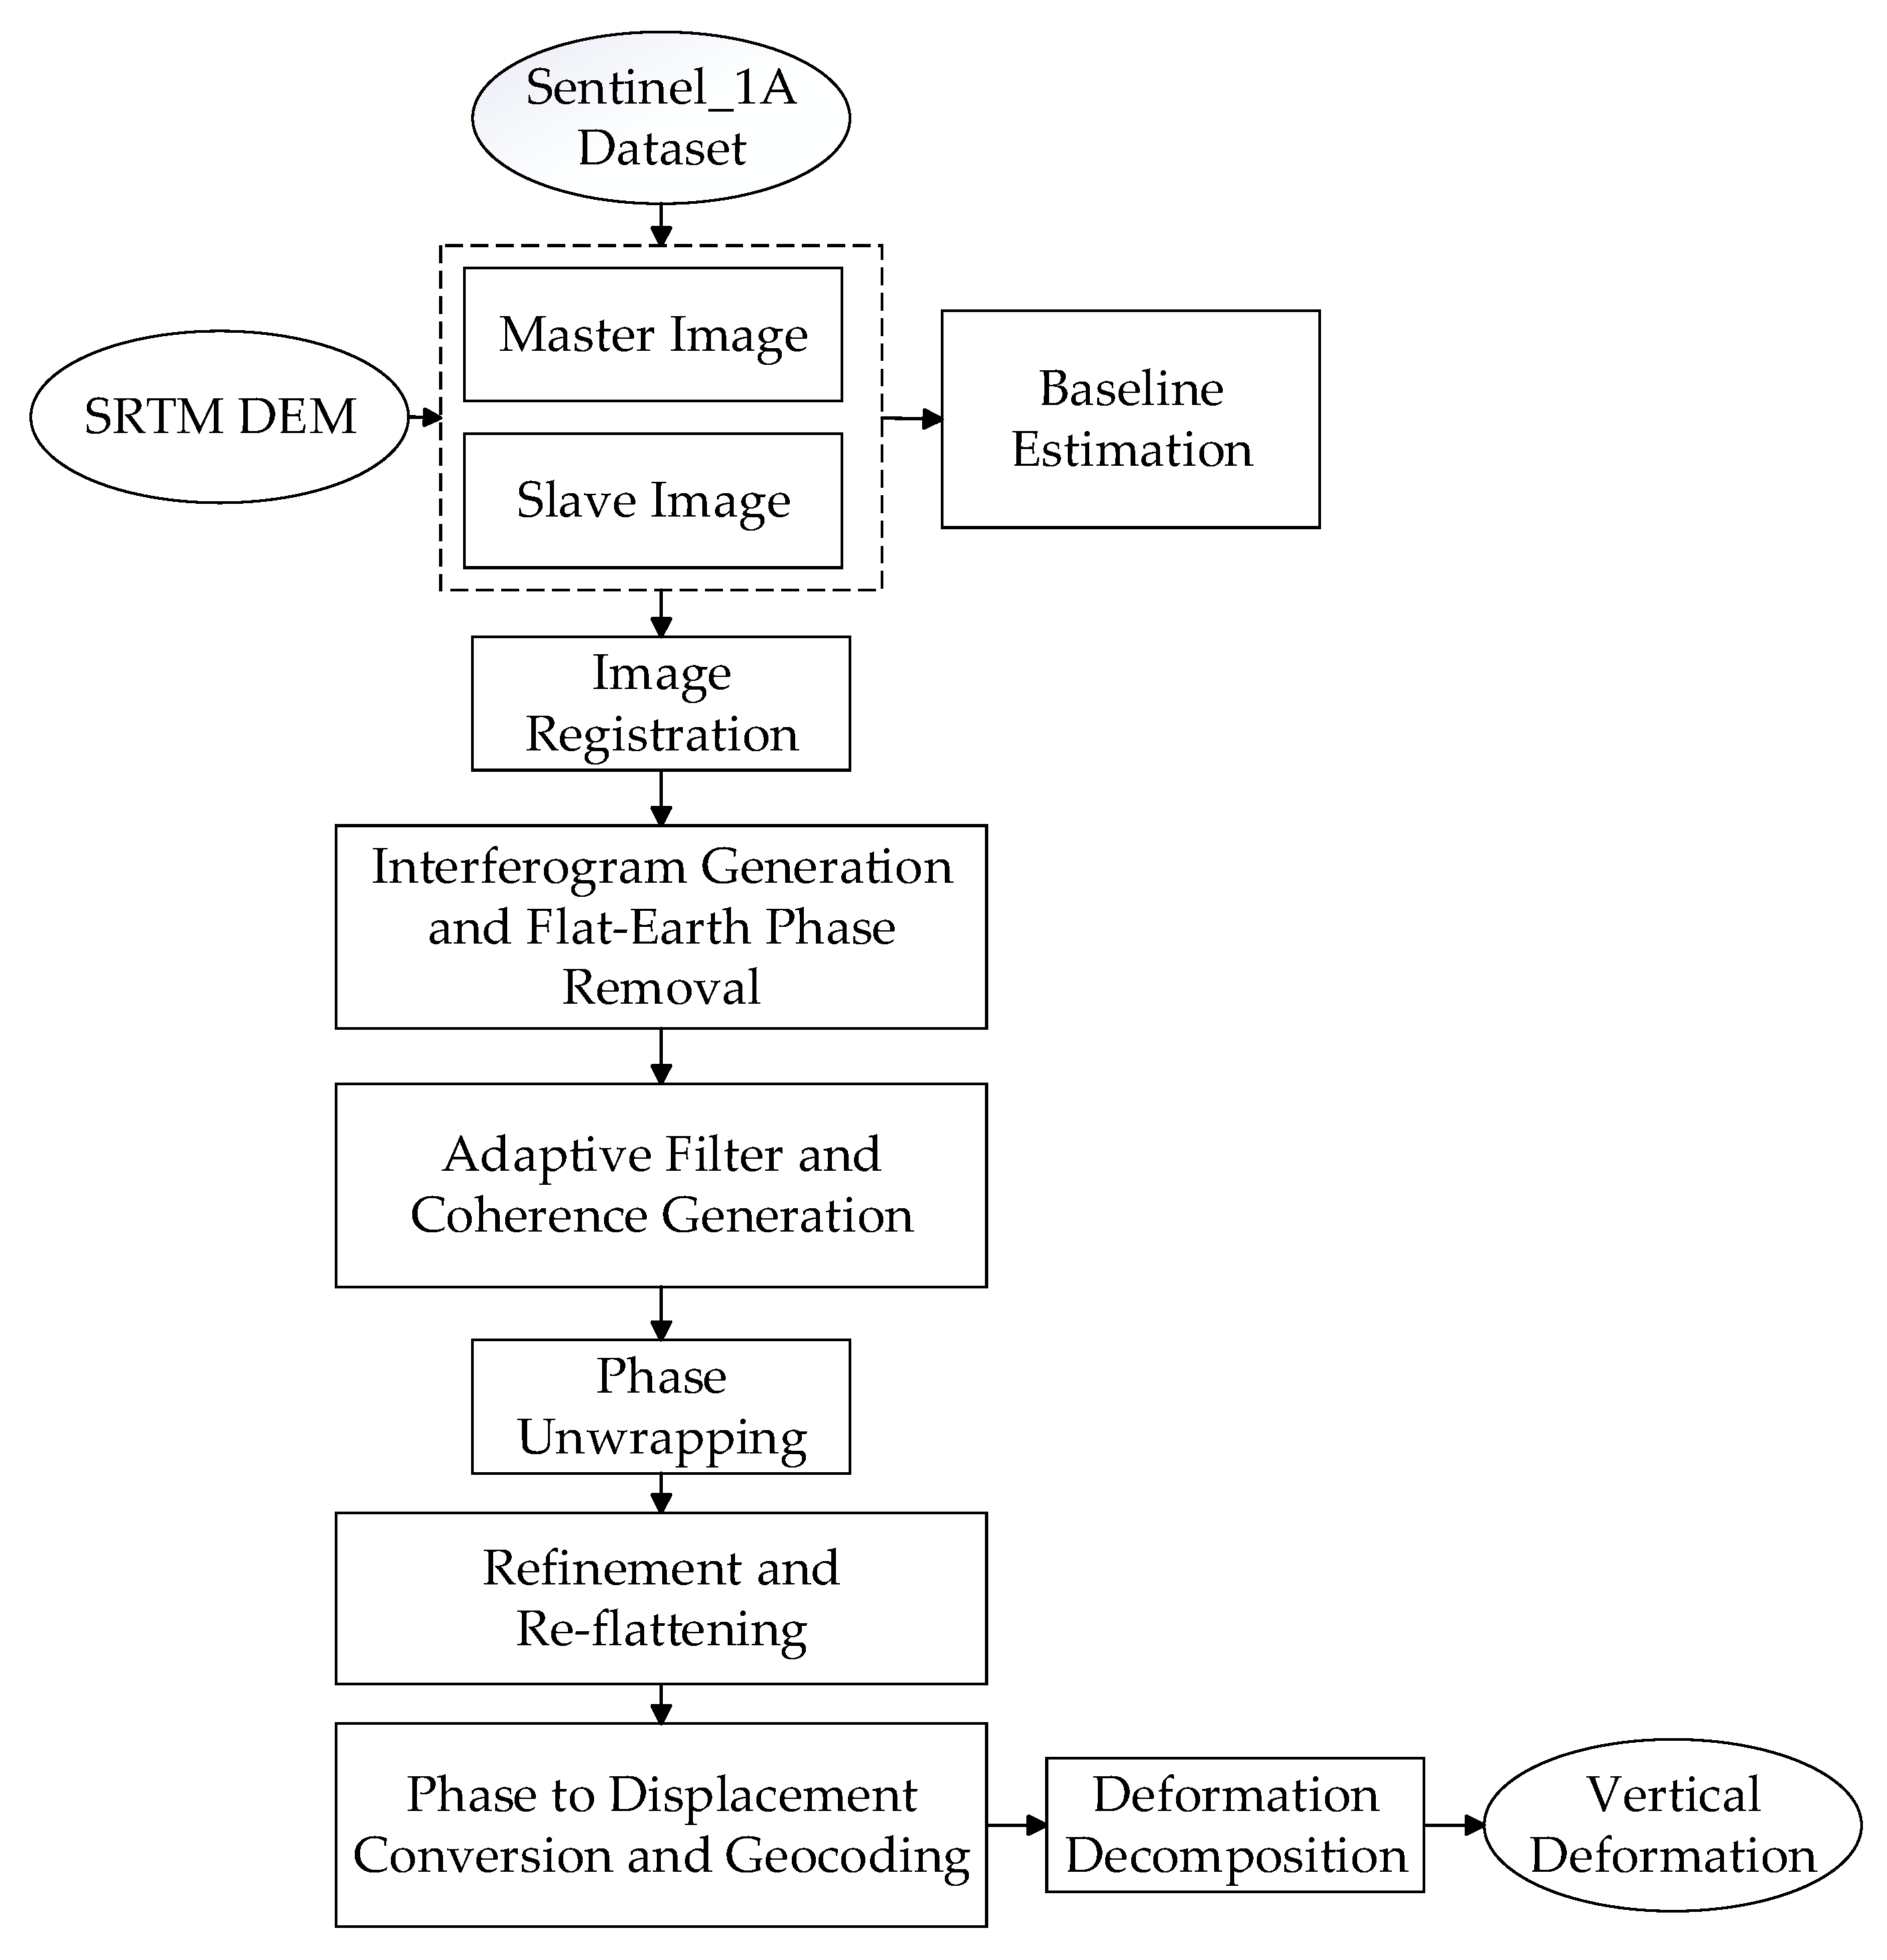
30]. Subsequently, the LOS deformation is converted into vertical displacement. Ultimately, the vertical subsidence of the Earth’s surface is determined for each time interval and superimposed to ascertain the comprehensive subsidence over the entire investigation period. In this study, we aimed to maintain a short time baseline for each interferometric image pair, ideally set at 12 days. However, the time baseline for two pairs, 10 April 2021 to 4 May 2021 and 4 May 2021 to 28 May 2021, extended to 24 days. For data processing, we utilized the SARscape software (version 5.6.2) by SARmap, Caslano, Switzerland, which operates on the ENVI remote sensing image processing platform. The primary stages of D-InSAR data processing are illustrated in
Figure 3. The methodology comprises the following procedural steps: image registration, interferogram generation, flat-Earth phase removal, adaptive filtering, coherence generation, phase unwrapping, refinement and re-flattening, phase to displacement conversion, geocoding, and conversion of Line-of-Sight (LOS) deformation to vertical deformation. To derive subsidence values for each monitoring point throughout the time series, we utilized the “Extract Values to Points” tool in ArcGIS, as shown in
Figure 4. The total subsidence for each monitoring point was determined by aggregating the subsidence values across all time periods.
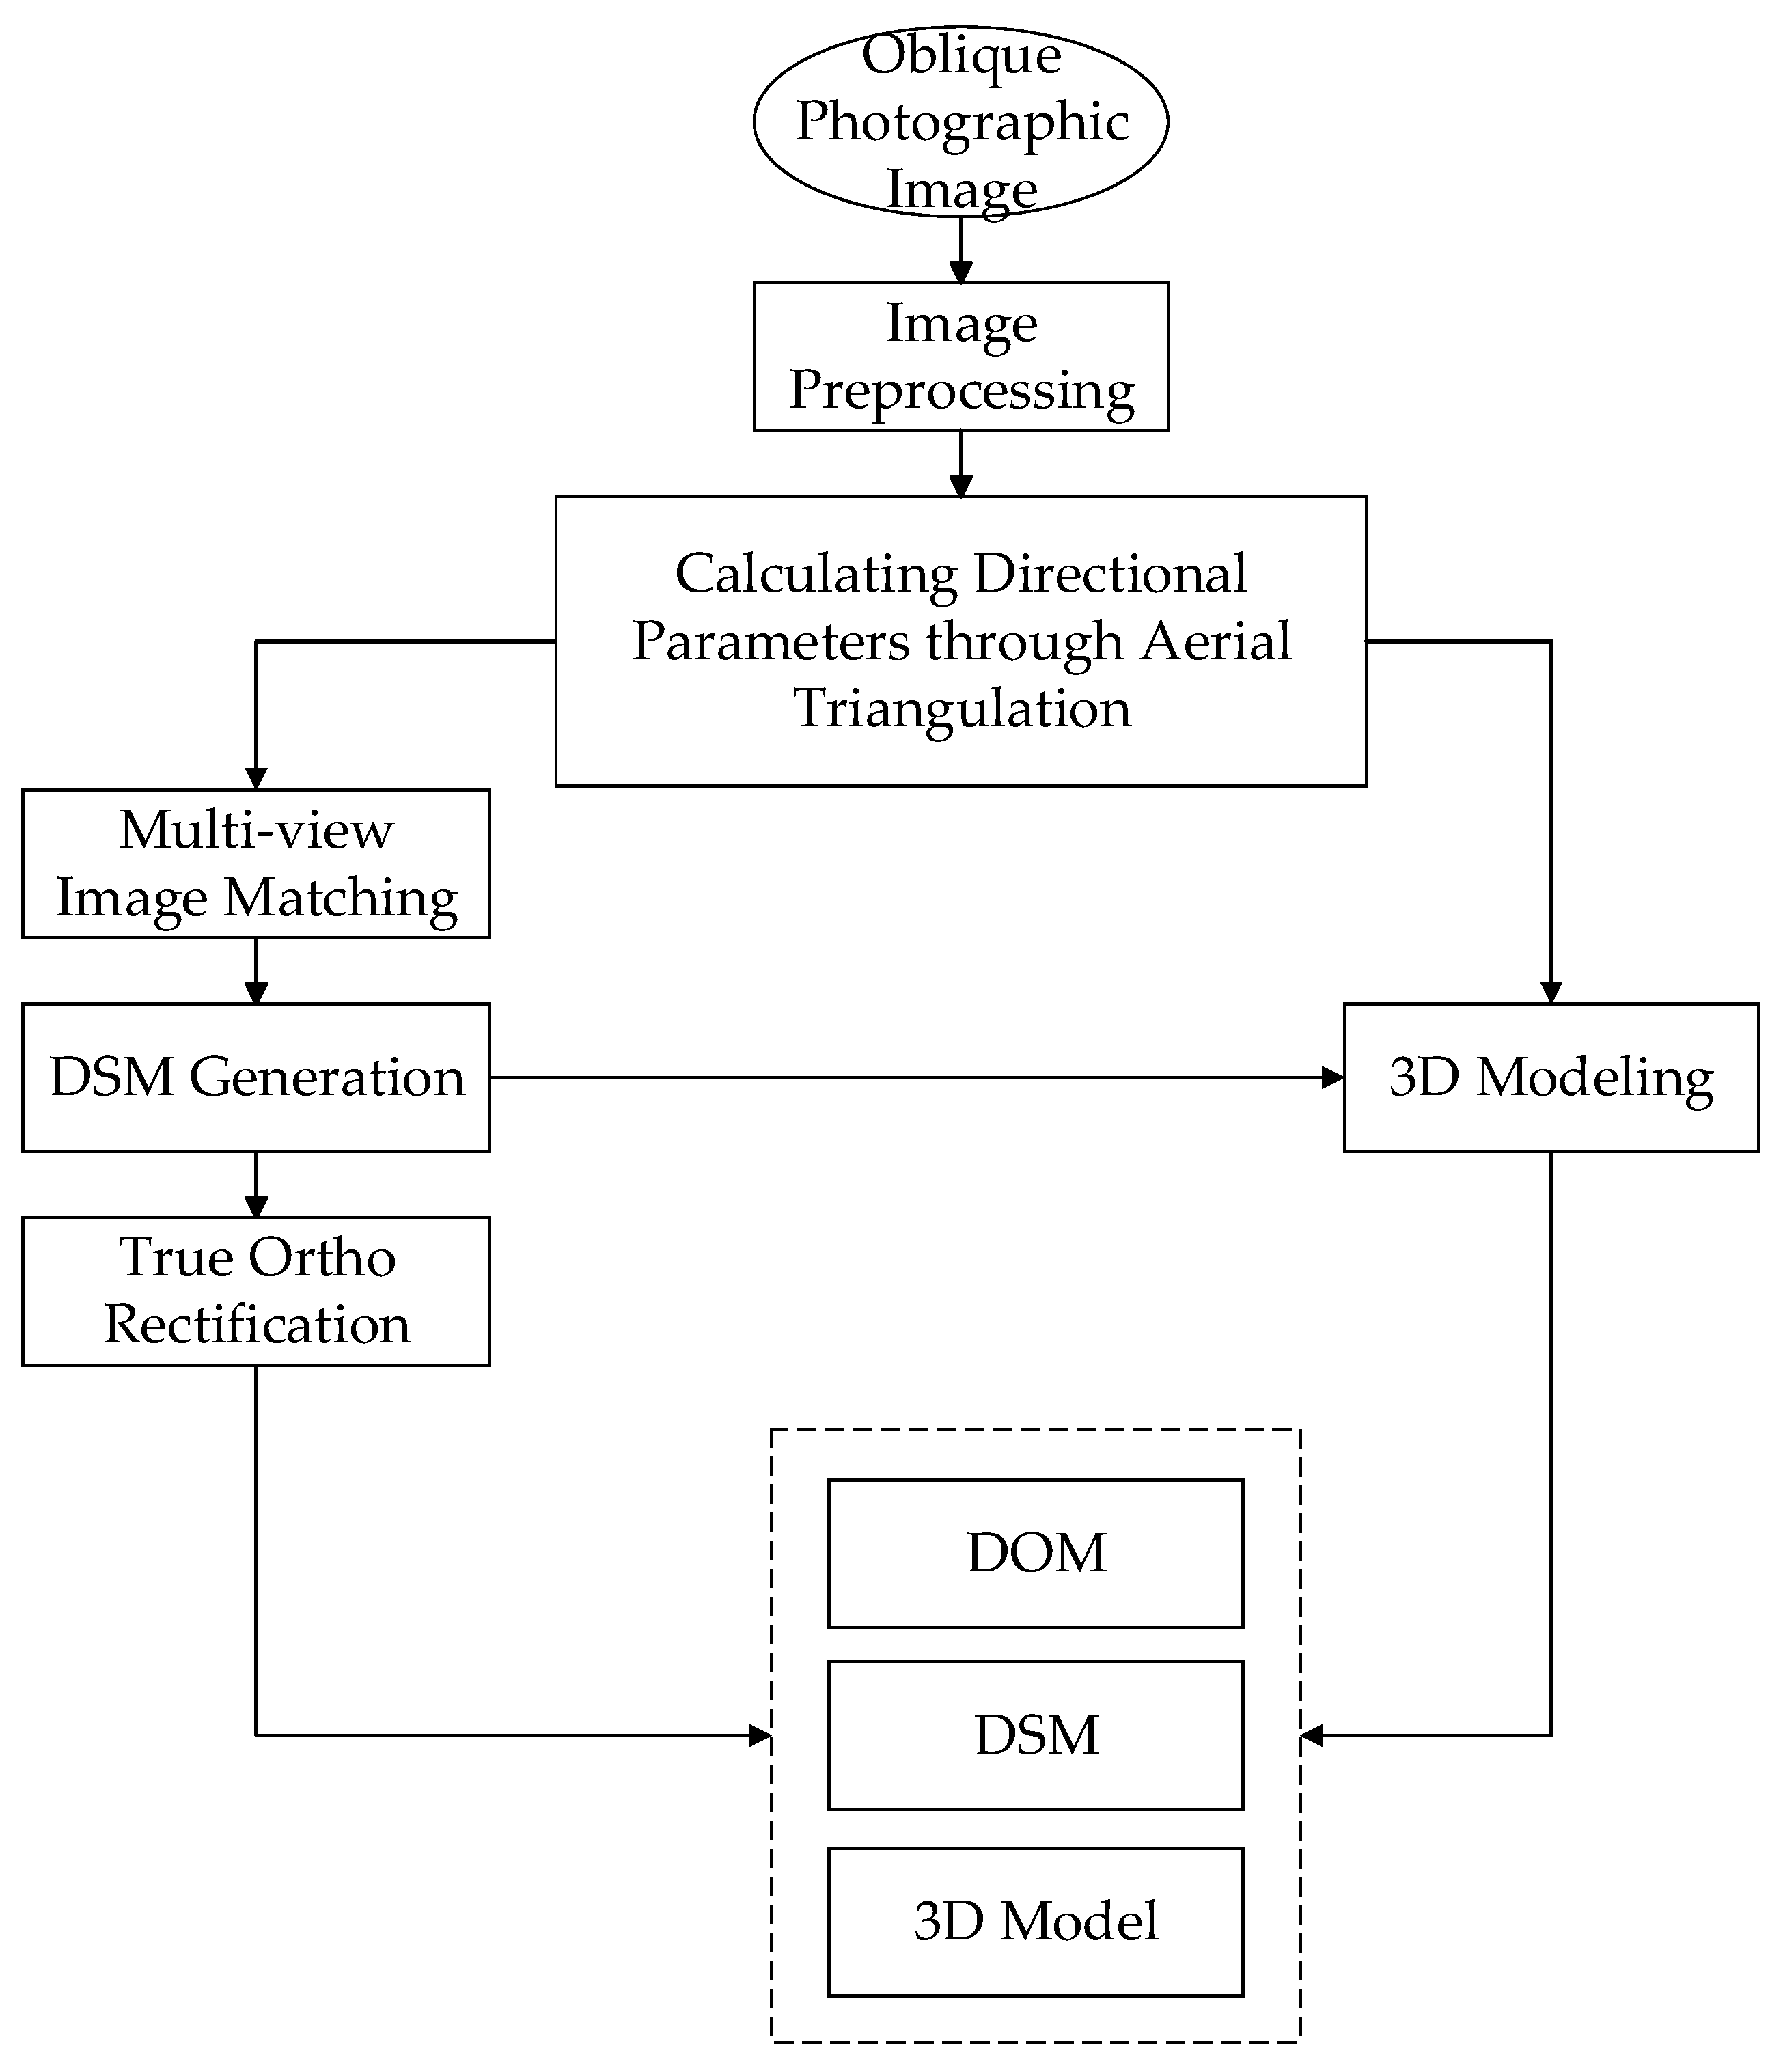
2.3. UAV Oblique Photogrammetry Data Processing
The processing of UAV photogrammetric data primarily involves aerial triangulation, a technique that utilizes consecutive aerial images with sufficient overlap to ascertain the ground coordinates of unknown points within the surveyed area. This computation is based on the coordinates of image points in the measurement images and employs the principle of least squares, while also incorporating a limited number of ground control points as constraints [
31,
32]. In this study, we used the ContextCapture software (version 4.4.10) [
33] developed by Bentley to process the UAV-acquired photos. The data processing procedure mainly comprises data import, photo teaming, air triangulation solution, ground control point extraction, and coordinate system conversion, as depicted in
Figure 5. The results of UAV oblique photogrammetry data processing were a 3D model (
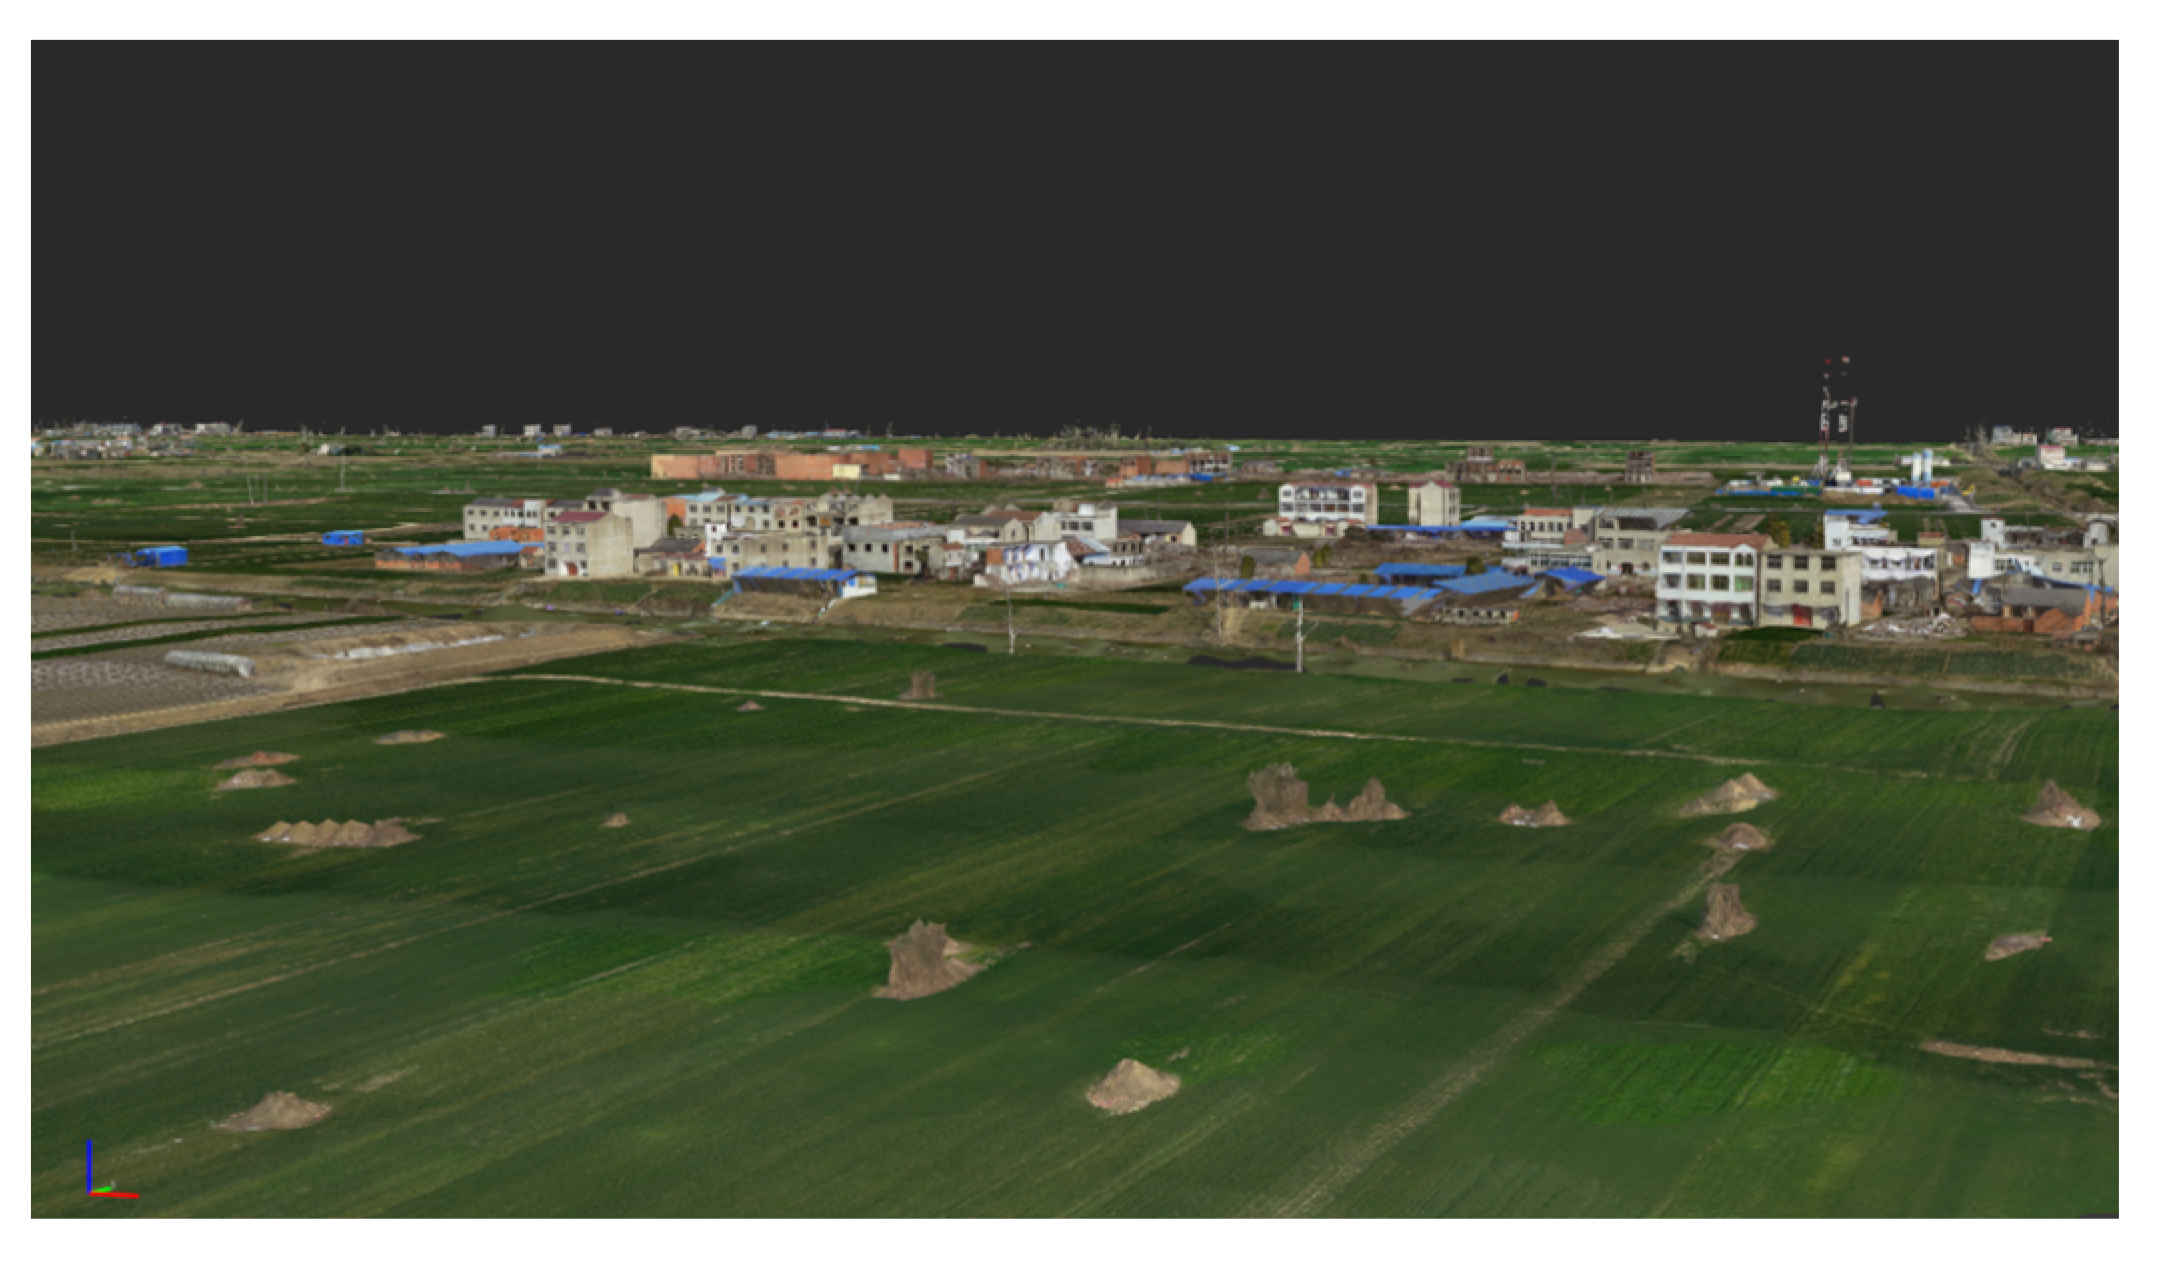
Figure 6), a digital orthophoto map (DOM), and a DSM, and the 3D model and DOM were used to assist the verification of DSM elevation and planimetry accuracy at a later stage. The elevation values of the monitoring points were extracted from the DSM data on 10 April 2021 and 28 June 2022, respectively using, ArcGIS software (version 10.2), as shown in
Figure 7, and the difference between the elevations of the two periods is the amount of settlement at each monitoring point during the time period.
2.4. The InSAR and UAV Collaborative Monitoring Method
The D-InSAR technique is utilized to measure surface deformation by solving the phase, achieving monitoring accuracy at the millimeter level. Consequently, it is well suited for tracking points at the periphery of the subsidence basin. However, this method faces limitations when it comes to accurately monitoring regions with substantial deformation gradients at the center of the subsidence basin. In the relevant literature [
34], it is pointed out that, when the deformation volume of two pixels exceeds half of the radar’s wavelength, computation in the radar’s LOS direction becomes unfeasible. The Sentinel-1A sensor, equipped with C-band, has a wavelength of approximately 0.05 m, resulting in a theoretical maximum detectable deformation of 0.025 m for image-pair interferograms. As such, the maximum deformation observed in the image-pair interferogram is approximately 0.025 m. In this study, a total of 35 interferometric image pairs were analyzed, resulting in a theoretical cumulative maximum detectable deformation of 0.875 m using D-InSAR. However, due to factors such as atmospheric delays and natural scatterer attenuation, the actual detectable deformation with D-InSAR is generally much smaller than the theoretical value. This study utilized Sentinel-1A imagery and the D-InSAR technique to monitor surface subsidence in mine subsidence basins. However, the D-InSAR technique’s effectiveness is limited when the coherence factor falls below 0.3. The coherence coefficient demonstrates a notable decrease in proximity to the central area of the subsidence basin, as observed in the monitoring data. Based on the coherence values of interferometric image pairs, the D-InSAR monitoring results are valid if the cumulative subsidence at a monitoring point is less than 0.42 m. Conversely, for cumulative settlement exceeding 0.42 m at a monitoring point, the UAV technique was employed for monitoring. This study demonstrates the complementary advantages of both techniques. D-InSAR is suitable for monitoring the subsidence basin’s edge area, while UAV oblique photogrammetry effectively monitors regions with significant gradient deformation at the basin’s center. Through the integration of InSAR and UAV approaches, this study achieved comprehensive and synergistic monitoring of surface subsidence in the mining area.
2.5. Subsidence Prediction and Parameter Inversion Methods
The research on mining surface subsidence prediction parameter inversion comprises two main parts: the subsidence prediction model and the parameter inversion method [
35]. The probability integration method stands as the most extensively employed approach for subsidence prediction in China. As its theory is well established, its mathematical model will not be reiterated in this paper. The probability integration method stands out for its simplicity in mathematical modeling and its requirement of fewer parameters [
36,
37]. These parameters include deviation of inflection point (s
1, s
2, s
3, s
4), mining influence propagation angle (θ
0), horizontal movement coefficient (b), subsidence coefficient (q), and tangent of major influence angle (tanβ). The best parameters for the probability integration model in the study area were obtained through a parameter inversion algorithm using the measured monitoring point movement data. The accuracy and reliability of surface movement deformation prediction are directly affected by the appropriateness of parameter selection.
The BFGS algorithm is an iterative algorithm designed to tackle unconstrained optimization problems, serving as an analogue to Newton’s method. It progressively seeks to determine the minima of the objective function by incrementally constructing an estimate of the inverse Hessian matrix of the objective function. This paper utilizes the BFGS algorithm for parameter inversion of the probability integration method, resulting in highly stable inversion outcomes. The accuracy of the BFGS algorithm’s parameter inversion remains consistent even when faced with varying levels of random errors, demonstrating robust parameter estimation performance and strong anti-interference capabilities. Firstly, an objective function model, as depicted in Equation (1), incorporates the probability integration formulation and transforms it into an unconstrained optimization problem.
In Equation (1), N is the number of ground observation points; W0 is the measured subsidence value; U0 is the measured horizontal movement value. The function represents the subsidence value at the position (x, y), where x and y denote the horizontal and vertical coordinates of any point on the surface. Similarly, the function denotes the horizontal shift value at the position (x, y, φ), where x and y refer to the horizontal and vertical coordinates of any point on the surface, and φ represents the counterclockwise angle from the positive x-axis to the specified direction. The functions and encompass the parameters necessary for the probability integration method.
The iterative process of the BFGS algorithm commences by computing a new iterative solution as shown in Equation (2).
In Equation (2),
is the
kth iterative solution of the unknown parameter;
is the search direction for the
kth iteration, which obeys Wolfe’s step rule;
dk is the search direction for the
kth iteration. Moreover,
dk can be expressed as in Equation (3),
In Equation (3),
represents taking partial derivatives of Equation (1) with respect to the eight unknown parameters: s
1, s
2, s
3, s
4, θ
0, b, q, and tanβ;
is the Hessian approximation matrix of the objective function for the
kth iteration, as shown in Equation (4),
In Equation (4), .
The Wolfe step-length rule is shown in Equation (5):
In Equation (5), and are the step-length rule constraints, and 0 < < < 1.
The BFGS algorithm is employed for parameter inversion in the probability integration method, and the procedure involves the following steps:
Step 1: Input the coordinates of the observation points, along with the subsidence value, horizontal movement value, and geological mining conditions. Set the step-limit parameters, and , in the BFGS algorithm (0 < < < 1). Compute the initial value, , for the parameter to be determined in the probabilistic integration method. Define the termination error, ε, and the initial symmetric positive definite matrix, . Set k = 0 to initiate the iteration process.
Step 2: Calculate the gradient of the objective function. If , terminate the iteration and output as an approximate minimum point.
Step 3: Determine the search direction by .
Step 4: Determine the search step length factor that fulfills the Wolfe criteria.
Step 5: Calculate to obtain the approximation matrix of the Hessian matrix.
Step 6: Iterate through the solution until the termination criterion is met, finding , which represents the optimal solution for the inversion parameters of the probability integration method.
2.6. Analysis of the Influence of Data Source Errors on Parameter Inversion
Monitoring subsidence issues in mining areas through drone-based photogrammetric and InSAR techniques yields data with errors compared to leveling data. Consequently, assessing the impact of data source errors on inversion parameters holds significant importance. Herein, the BFGS algorithm is employed to analyze the influence of data source errors on the inversion of parameters in the probabilistic integration method for static prediction.
The simulation experiment was conducted considering the geological mining conditions in the study area. The parameters of the probability integration model were set as follows: subsidence coefficient (q) = 1.2, horizontal movement coefficient (b) = 0.22, tangent of major influence angle (tanβ) = 2.37, mining influence propagation angle (θ₀) = 88. Additionally, the deviation of the inflection points (s1, s2, s3, s4) was set to 50 m.
The subsidence values are initially simulated using the probability integration method. Subsequently, random noises of 3 cm, 5 cm, and 10 cm were added to all the monitoring values of the simulated strike and tendency lines for conducting the simulation experiments.
Table 3 presents the root-mean-square error (RMSE) for each noise inversion parameter, and “Pre” represents the RMSE as a percentage of the initial parameter. Among the different noise levels (3 cm, 5 cm, and 10 cm), the inversion parameters for q, b, tanβ, and θ₀ were minimally affected. These four coefficients exhibited limited sensitivity to noise perturbations. However, with an increase in noise magnitude, the deviation between each parameter and its initial value also increased. In contrast, noise with a magnitude of 10 cm had a more pronounced impact on the deviation of inflection point (s), accounting for approximately 10% of the initial parameter.
To assess the accuracy of the inversion parameters, ten sets of inversion parameters were employed for each type of noise to derive subsidence values, which were then compared with simulated subsidence to calculate the root mean square error (RMSE), as presented in
Table 4. For the case with 10 cm noise, the maximum RMSE among the ten parameter groups was 18.94 mm, with a mean of 9.6 mm. When the noise was reduced to 5 cm, the maximum RMSE reduced to 6.42 mm, and the mean decreased to 4.04 mm. These results indicate a decrease in both the mean and maximum RMSE after noise reduction. Notably, the maximum RMSE of the subsidence inversion, within 10 cm of noise, accounted for only 0.99% of the maximum subsidence value. This finding suggests that the data source error remained within the 10 cm range, meeting the requirements of the parameter inversion for the mining subsidence probability integration method.
3. Results
This study employed the method outlined in
Section 2.2 to utilize D-InSAR technology by processing a dataset comprising 38 SAR images taken between 10 April 2021 and 28 June 2022. This process resulted in the creation of a time-sequence deformation map for the study area, which allowed for the extraction of subsidence measurements at various time points for each monitoring point. The collected data were then superimposed to derive the overall subsidence values for the monitoring points. The analysis of the monitoring results revealed that the maximum subsidence value observed in the study area was −0.7964 m, significantly smaller than the maximum subsidence value of −2.5171 m obtained from the leveling measurements. Consequently, exclusive reliance on the D-InSAR technique proved insufficient for effectively monitoring the substantial gradient deformation in the central sedimentation basin of the mine and accurately determining the predicted parameters.
The study area’s DSM for the two periods, 12 April 2021 and 28 June 2022, was obtained using UAV oblique photogrammetry, as described in
Section 2.3 of this paper. Elevation values of the monitoring points were extracted for each time period. The difference in elevation between the two periods represents the total settlement of the monitoring points. The monitoring results reveal a maximum settlement value of −2.5416 m in the study area, with a negligible difference of only 0.02 m between the results of the level measurements. This observation underscores the advantages of employing UAV oblique photogrammetry technology for monitoring large-gradient deformations in the mining area. The literature analysis and verification [
29] indicate that the elevation error of monitoring points in the study area, obtained through UAV oblique photogrammetry, is approximately 5 cm. This level of accuracy is sufficient for the inversion of mining subsidence parameters.
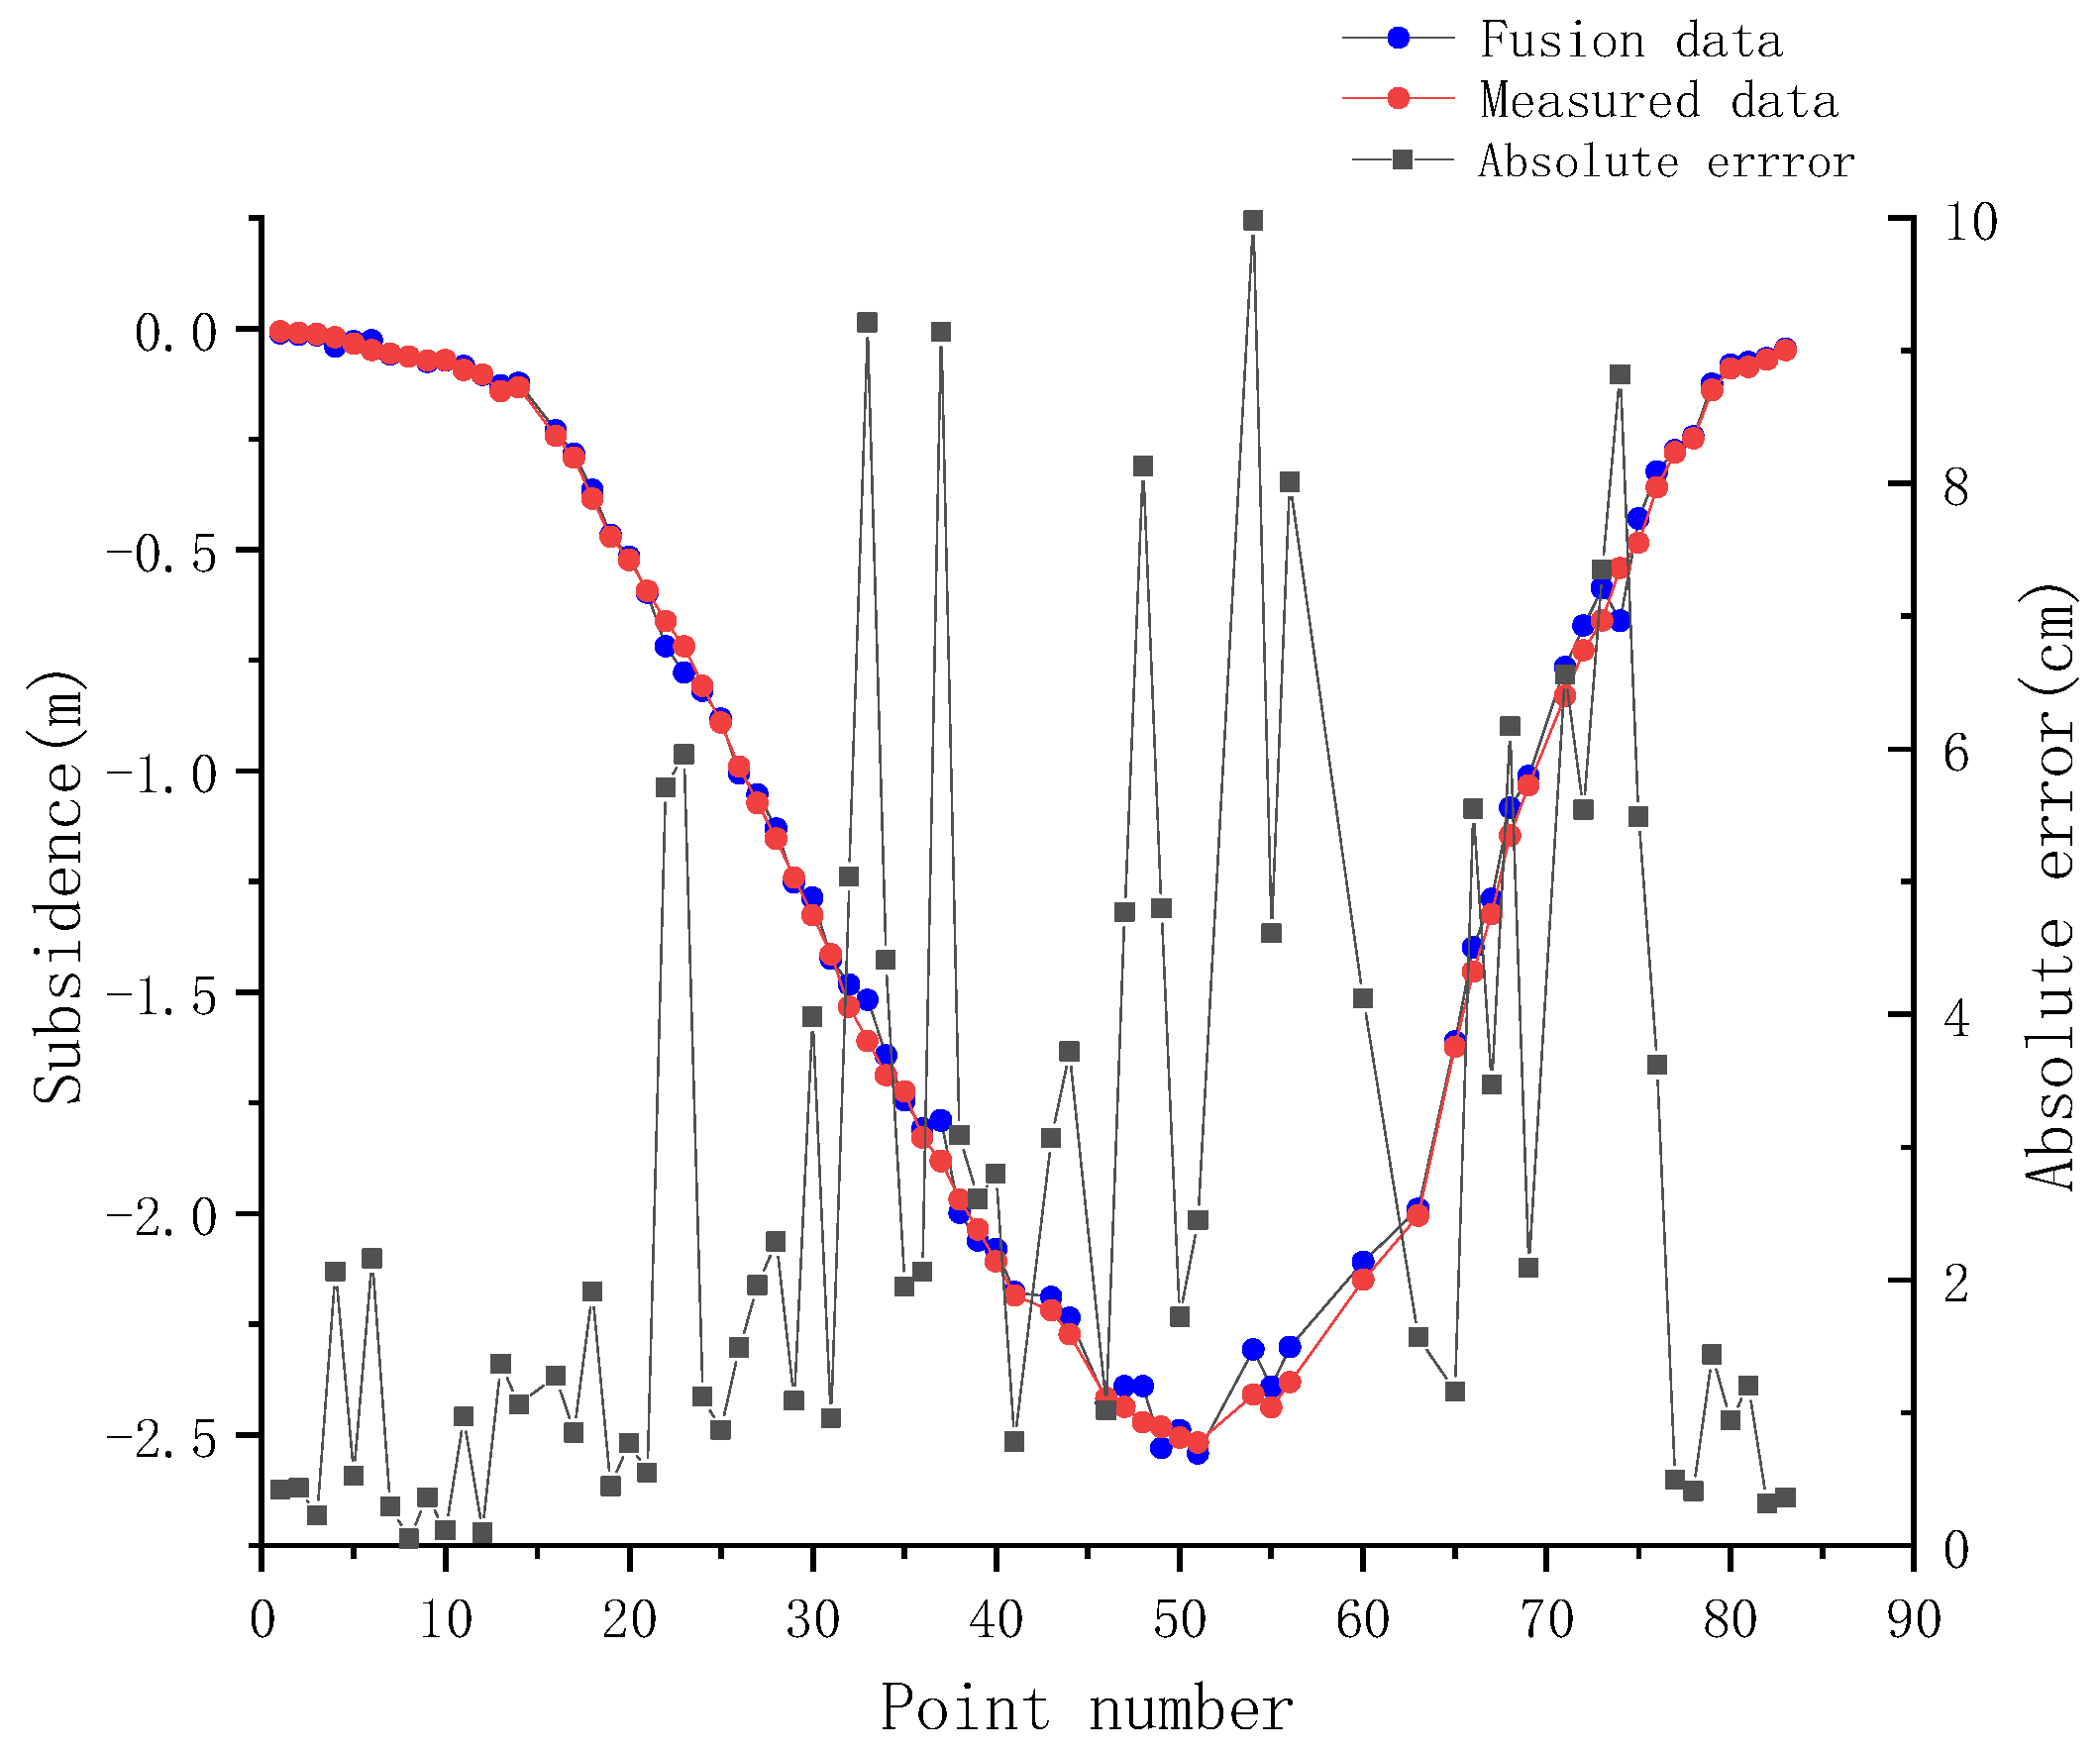
The settlement of the fused monitoring points was determined by integrating the two types of monitoring data, as per the procedure outlined in
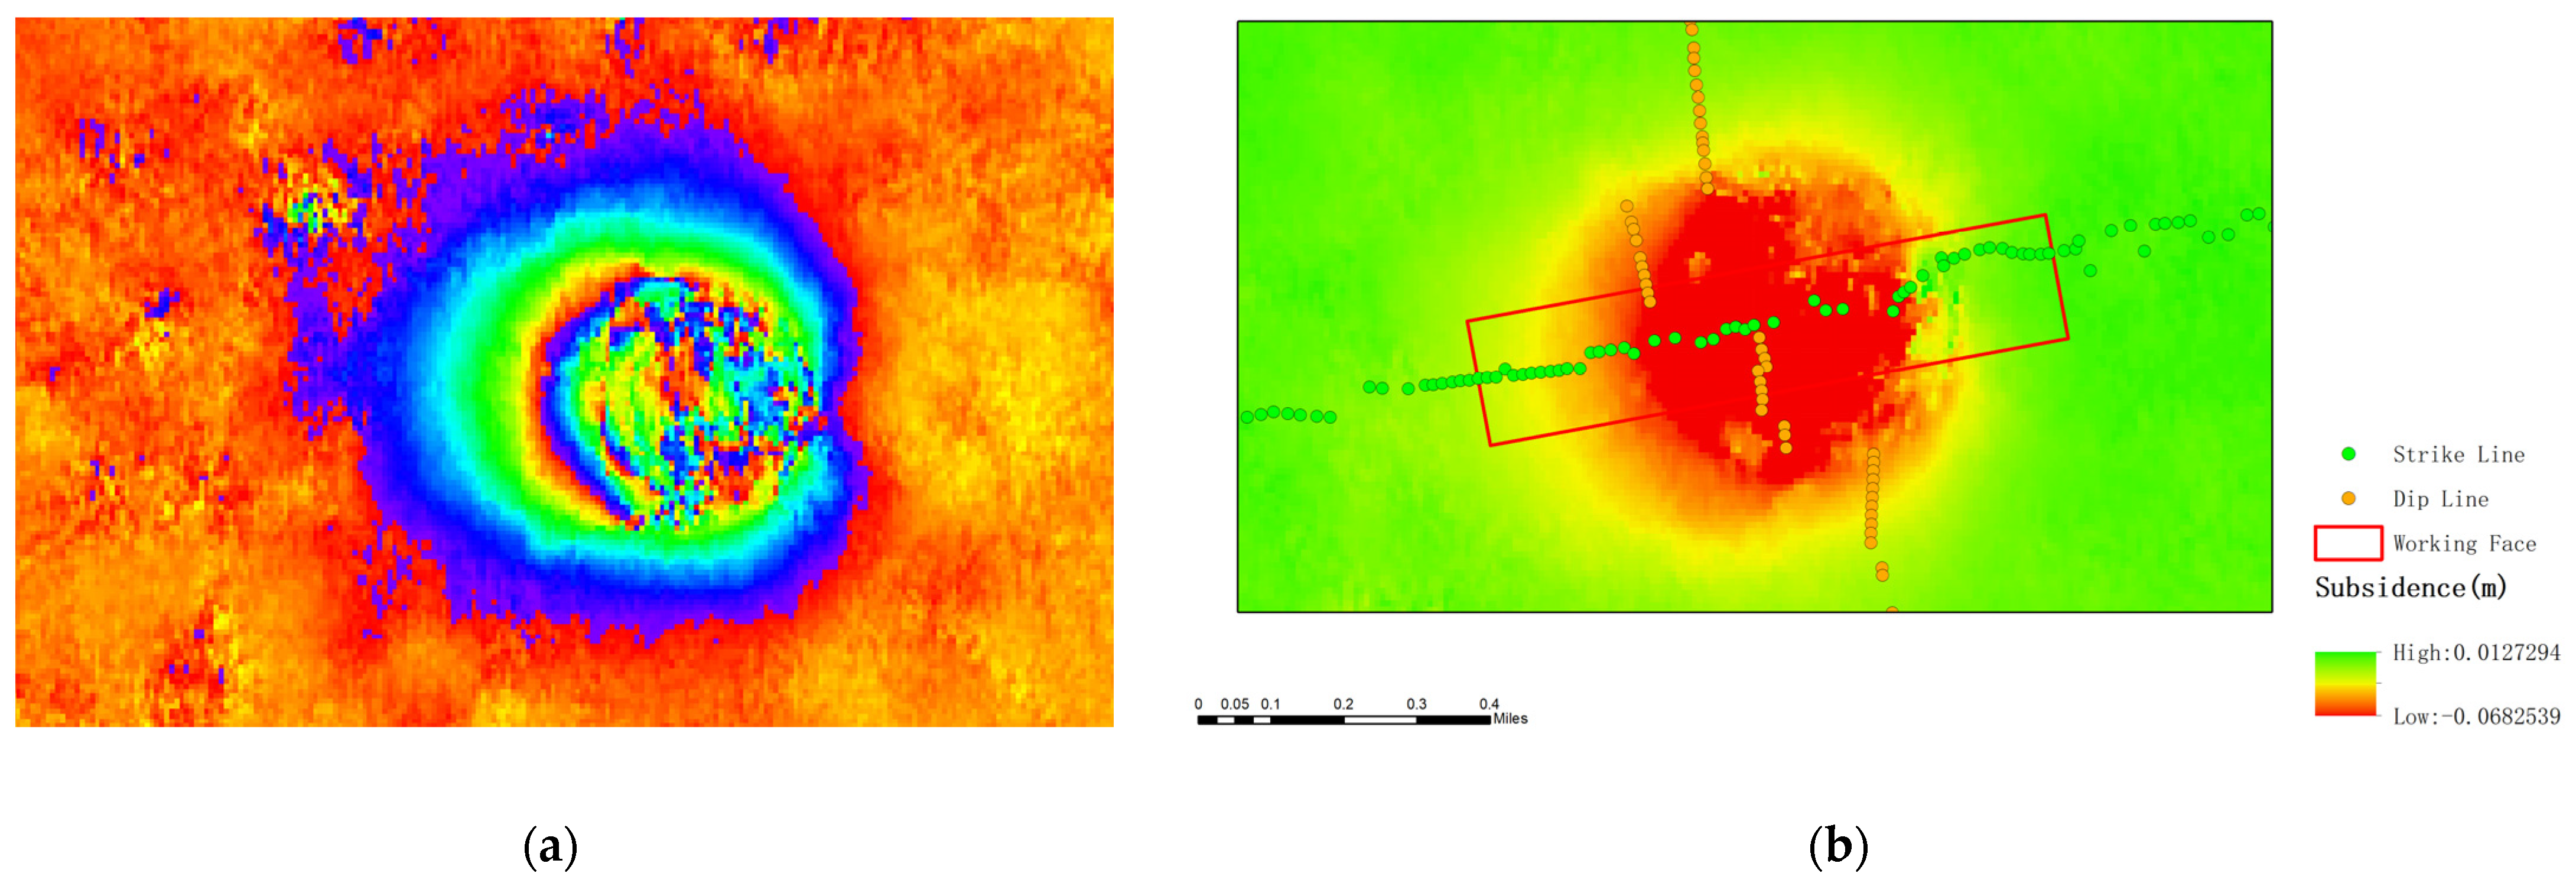
Section 2.4 of this article. Subsequently, the settlement was compared with the leveling data, as depicted in
Figure 8 and
Figure 9. Following the analysis, it was found that the absolute error between the settlement of the fused monitoring points and the measured leveling settlement fell within a range of 10 cm. The simulation experiments conducted in
Section 2.6 of this paper demonstrated that the data source error was within 10 cm, fulfilling the requirements for the parameter inversion in the probability integration method of mining subsidence. Consequently, the fused data were suitable for mining subsidence parameter inversion. When compared with mining subsidence parameter inversion using UAV data alone, the parameter inversion based on fused data showed higher accuracy in monitoring the subsidence basin edge. This improvement is conducive to achieving more accurate parameter inversion.
The combined monitoring approach of InSAR and UAV was utilized to determine the subsidence value at the monitoring point. The BFGS algorithm was employed in conjunction with data fusion results, geological mining conditions of the study area, and the parameters of the working face. The probability integration method was then applied to invert the projected parameters of the working face of Banji 110,801 for ten iterations, and the average value was adopted as the final inversion parameter.
Table 5 presents the final inversion results, encompassing the following parameters: subsidence coefficient (q = 1.18), tangent of major influence angle (tanβ = 2.05), mining influence propagation angle (θ
0 = 87.67), and deviation of inflection point (s
1 = 40.34, s
2 = 79.26, s
3 = 20.17, and s
4 = −70.42). The subsidence prediction at each monitoring point was conducted using the probability integration method, based on the inversion parameters mentioned above. A comparison was made between the predicted results and the outcomes of the leveling survey, as depicted in
Table 5. The analysis revealed a root-mean-square error of 138.74 mm, indicating superior accuracy compared with the results obtained solely through UAV-technology-based monitoring. However, the topography of the mine area introduces a systematic function model error during the fitting process with the probabilistic integral model. Consequently, this leads to a reduction in the accuracy of the fit compared with the simulation experiments.
5. Conclusions
This paper focuses on monitoring the surface settlement of the Banji 110,801 working face from 10 April 2021 to 28 June 2022, utilizing a synergistic monitoring approach combining InSAR and UAV technologies. The reliability of the inversion of the probability integration method parameters was verified using the BFGS algorithm. The results obtained led to the following conclusions:
Under the condition of a 10 cm error, the BFGS algorithm can still effectively invert the parameters of the probability integration method, and the inversion results are relatively stable. The D-InSAR technique is applicable for monitoring small deformations at the edges of subsidence basins. However, it faces challenges when dealing with significant deformation gradients, leading to incoherence in the interferometric image pairs. As a result, it becomes impractical to monitor regions with large-gradient deformations at the center of the subsidence basins. Additionally, relying solely on D-InSAR data for monitoring is insufficient to invert the parameters associated with mining subsidence. UAV oblique photogrammetry technology enables the monitoring of settlement in both the central and the edge areas of subsidence basins, meeting the accuracy requirements for predicting parameter inversion in mining subsidence. However, its accuracy in monitoring the edge of subsidence basins is significantly inferior to that of D-InSAR technology. The two sets of monitoring data were combined using fusion techniques. The fusion data met the error requirements for inverting the parameters of the probability integration method through the BFGS algorithm. As a result, the collaborative monitoring of mine subsidence, utilizing InSAR and UAV technology, and employing the BFGS algorithm for probability integration method parameter inversion, was not only feasible but also superior to the singular application of UAV oblique photogrammetry. This approach introduces a novel idea and method for unmanned mine subsidence monitoring.
In this study, there are certain limitations associated with the inversion of probabilistic integral model parameters using the BFGS algorithm. These include a lack of global convergence; sensitivity to initial guesses; variable convergence rates, particularly when dealing with ill-conditioned functions; and limited applicability to non-smooth or discontinuous objective functions. In future research endeavors, we intend to address and rectify these shortcomings by making improvements to the algorithm.


 and
and 


