Featured Application
This manuscript is part of ongoing research on the strengths and limitations of Wald statistical tests taking into account the incorrect specification of distribution of random effects in generalized linear mixed models.
Abstract
Generalized linear mixed models are commonly used in repeated measurement studies and account for the dependence between observations obtained from the same experimental unit. The designs of repeated measurements in which each experimental unit (e.g., subject) is proven in more than one experimental condition are widespread in psychology, neuroscience, medicine, social sciences and agricultural research. Estimation in generalized linear mixed models is often based on the maximum likelihood theory, which assumes that the assumptions about the underlying probability model are correct. These assumptions include the specification of the distribution of random effects. This research study aimed to identify the impact of the incorrect specification of this distribution on the probability of a type I error and the statistical power of the Wald test. This was achieved through a simulation study where different distributions were considered for random effects in generalized linear mixed models with Poisson and negative binomial responses. Evidence of the impact of the incorrect specification was presented in distributions for random effects different from the normal ones. Lognormal was used for random intercepts and bivariate exponential and Tukey for random intercepts and slopes. Lognormal has positive asymmetry and high kurtosis. Exponential has moderate asymmetry and kurtosis, and Tukey has moderate asymmetry and high kurtosis.
1. Introduction
Self-regressive correlation structures and missing data do not favour the use of the ordinary linear model ANOVA for repeated measurements. Two procedures proposed to address these problems involve the use of generalized linear mixed models (GLMMs) or solving generalized estimating equations (GEEs) [1].
GLMMs expand ordinary regression by allowing non-normal responses and including random effects [2]. An example of this is found in [3], where a GLMM was considered to analyze count data, assuming a Poisson response variable. Furthermore, in GLMMs, it is common to assume a parametric distribution for random effects (e.g., normal, gamma), generally for computational or conventional considerations [4]. However, there is often little information about the form of the joint distribution of random effects. Thus, distribution for these unobserved random effects cannot be directly evaluated [5]. For this reason, a genuine concern in the use of GLMMs is the incorrect specification of the model for random effects [6].
Since it is impossible to observe random effects (latent amounts), the distribution assumption for them cannot be directly evaluated and, according to [7], there is not a consensus on the impact of the random-effects distribution being incorrectly specified. Some authors have addressed the impact of incorrect specification of random-effects distribution in GLMMs [4,8,9,10,11]. Other types of incorrect specification are also possible, including incorrect specification of the link function, or not considering the presence of overdispersion, among others.
Many authors have voiced concern about tests to detect incorrect specifications. For example, ref. [6] proposed a two-stage diagnostic method to detect incorrect specifications of the random-effects model in a GLMM; ref. [12] recommended two diagnostic tests based on the information matrix of the model; ref. [13] stated that, in general, if the model selection for random effects in a GLMM is incorrectly specified, then parameter estimation and inference procedures such as the Wald test may also be affected. Therefore, assessing the results is always recommended.
Wald Z, χ2 and t and F tests for GLMMs evaluate a null non-effect hypothesis by adjusting the parameter estimates or parameter combinations by their estimated standard errors and comparing the resulting test statistic with the zero [14]. Several studies refer to the use of the Wald test for the assessment of statistical significance. For example, [15,16,17,18] used such a test in the context of modelling non-linear mixed effects and evaluating their type I errors and statistical power.
In basic research, analysts often emphasize avoiding type I errors more than avoiding type II errors [19]. On the other hand, the statistical power analysis (i.e., the probability that a test will reject the null hypothesis when the null hypothesis is false, or alternatively, 1 − P(type II error)), has gained wide acceptance among scientists over the last thirty years. The number of searches on the Thomson Reuters science website for ‘sampl * and power analysis’ increased from 115 (1996–2000) to 214 (2001–2005 period) and 265 (2006–2010) [20].
Several studies have assessed type I errors and statistical power related to the inference of the fixed parameters. For example, ref. [21] extensively studied how the incorrect specification of the size of the model’s cluster affects inference in joint modelling, using the Wald test and type I error, as well as the power associated with it. Refs. [4,22] addressed the impact of incorrect specification of random-effects distribution on type I errors and the power of the Wald test for the mean structure in GLMMs.
Wald Z and χ2 tests are only suitable for GLMMs without overdispersion, while Wald t and F tests account for uncertainty in overdispersion estimations. This uncertainty depends on the number of degrees of freedom of the residual, which can be very difficult to calculate because the actual number of parameters used by a random effect ranges between 1 (i.e., a single standard deviation parameter) and N − 1 (i.e., a parameter for each additional level of random effect) [14]. Although a comprehensive performance evaluation for small samples of the asymptotic Wald-type test aimed at evaluating fixed effects on the mixed model has not been reported, there is evidence indicating that a normal or chi-square approximation is unreliable [23].
One strategy that has been suggested for the improvement of Wald-type tests involves the replacement of the asymptotic approximation based on normal and chi-square distributions with approximations based on t and F distributions. Several effective methods have been proposed to define the degrees of freedom in the denominator used in the t and F approximations [23]. The degrees of freedom for random effects, required for Wald t or F tests, must range between 1 and N − 1 (where N is the number of levels of random effects). Software packages vary significantly in their approach to calculating degrees of freedom. The most straightforward approach (the default value in SAS) uses the minimum number of degrees of freedom provided by the random effects that affect the term that is being tested. Satterthwaite and Kenward–Roger (KR) approximations use more complicated rules to approach the degrees of freedom and adjust standard errors. KR, only available in SAS, generally works best (at least for mixed linear models). The Satterthwaite approximation is available in the PROC MIXED of SAS [14].
Another approach is to use the test based on the Wald-type test with the sandwich method. The sandwich procedure for estimating the covariance matrix is valid even if the model is specified incorrectly, provided that the structure of the mean of has been specified correctly. This estimation procedure is therefore referred to as robust estimation [23].
An alternative to the Wald test for fixed effects is the likelihood ratio test (LRT). The likelihood ratio test compares the logarithm of the likelihood of two models where one is nested into the other [24]. The Wald test is less computationally intensive since it can be performed on any analysis without the need to repeat the analysis for the null model. It may bring advantages for some strategies of covariance model building [15]. Ref. [23] proposed a Bartlett-type correction for the likelihood ratio test. The essence of the Bartlett correction is to increase the LRT statistic by a scale factor, resulting in a statistic that has moments closest to a χ2. Additionally, ref. [25] developed modified versions of the likelihood ratio test to infer fixed effects in linear mixed models. Namely, they derived a Bartlett correction into a test of this kind and a test based on a modified profile likelihood function.
According to [26], Wald tests and likelihood ratio (LR) tests, along with Score (another test for evaluating hypotheses), are known for having incorrect type I errors; for this reason, they considered an extension of the results that Rothenberg (1984) achieved for general consistent estimators and tried to derive their own Bartlett-type corrections. In their research, they studied the behaviour of type I errors and the power of the three classical tests mentioned above, as well as that of the adjusted tests with Bartlett-type corrections through a Monte Carlo simulation.
The simulation study presented here allowed us to focus on the possibilities and limitations of Wald tests applied to GLMMs. This manuscript is part of ongoing research on the strengths and limitations of Wald statistical tests taking into account the incorrect specification of distribution of random effects in these models.
1.1. Generalized Linear Mixed Models
When dealing with non-Gaussian data with multiple sources of variation, a commonly used subject-specific model is the generalized linear mixed model [10]. Let be the response of the ith subject at the point of time j. Conditional to a vector of random individual effects , all the response variables are independent and have density functions belonging to the exponential family:
where , is a known inverse link function, is an intercept, and are covariate vectors, is a vector of fixed unknown regression coefficients, is a scale parameter, and is a function that depends only on and . In addition, is a function that satisfies and . Subject-specific effects are generally assumed to be normally distributed with mean 0 and a variance–covariance matrix [4].
The probability distributions that belong to the exponential family include normal distributions, gamma, binomial, Poisson and negative binomial, among others. The last two are used for count data and are the two distributions that are used in this article to conduct the simulation study. The Poisson distribution (2) is the cornerstone for modelling these data [27]. This is a parameter model and its conditional mean is supposed to be equal to the conditional variance [28].
where and , with .
In many real-life applications, the simple Poisson model cannot describe the data, because, generally speaking, the variance of the sample is higher than the mean obtained by the simple Poisson model [23]. For count data with extra Poisson variation (count data with overdispersion and extra zeros), several modifications or extensions to the Poisson model have been proposed, such as the negative binomial distribution (NB) (3).
where and , with and .
NB generalizes the Poisson model through the relaxation of the Poisson assumption of equidispersion (allowing the variance to exceed the mean). This is achieved through the addition of another source of variability, the dispersion parameter, k, beyond which the Poisson process is derived. The added dispersion parameter allows the variance to exceed the mean, and therefore, it allows the NB distribution to account for the overdispersion. The dispersion is expressed as parameter k in some formulations. When this dispersion parameter becomes zero, the NB model is reduced to the Poisson model [24].
1.2. Wald Test
In many situations, data analysts use statistical tests to assess whether or not a drug has a significant influence. Despite the fact that consistency has been studied in the literature to some extent, it seems that there is not a lot of research on the behaviour of test statistics [10]. Therefore, one of the aims of this research consisted in studying the impact of the incorrect specification of the distribution of random effects on the type I error and on the power of the statistical Wald test in generalized linear mixed models, with Poisson and negative binomial responses and a random intercept and a random intercept and slope.
The statistical Wald test, which is used to prove a hypothesis of type vs. , is established as follows [20]:
where is the maximum likelihood estimation of the parameter, β is the value of the real parameter, and is the standard error of . The statistical Wald test has an approximate standard normal distribution [25].
2. Materials and Methods
A simulation study was conducted to identify the impact of incorrectly specifying the distribution of random effects on type I errors and the power in the Wald test for generalized linear mixed models. In the first part, mixed generalized linear models were considered with a random intercept and Poisson and NB response variables. In the second part, mixed generalized linear models were considered with a random intercept and slope and Poisson and NB response variables.
2.1. Poisson and Negative Binomial Models with Random Intercept
For the simulation study of generalized linear mixed models with a Poisson or NB response and random intercept, the same structure featured in the article by [26] was used, which focused on studying the impact on the probability of a type I error when ignoring overdispersion in longitudinal configurations, for which the authors generated Poisson and NB responses with the mean where and denoting the subject and the time of measurement, respectively. In addition, , and is an indicator variable of group treatment taking values of 0/1.
Equation (5) shows the model that was used for the Poisson, and Equation (6) shows the one used for NB:
The were generated based on 4 different distributions , normal, mixture of 2 normal distributions, uniform and lognormal [4,27,28], with media 0 and 4 variance values: = 1, 2, 4 and 8 (Figure 1).
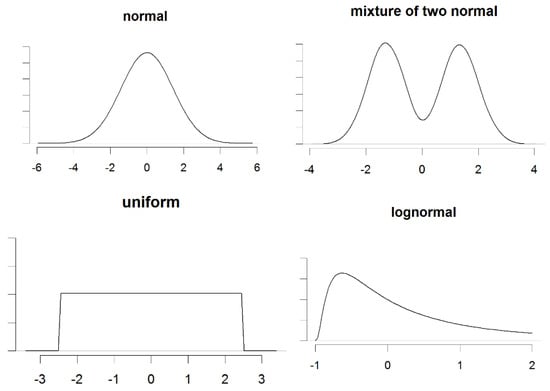
Figure 1.
Distributions for the random intercept: normal, mixture of two normal distributions, uniform and lognormal, with media 0 and variance 2.
To assess the impact of incorrectly specifying the distribution of the random intercept on the type I error and the power of the Wald test, was used as the parameter of interest. This parameter assumed the values of for the Poisson response case and values of for the NB case (Table 1). For the other parameters, the values used in the simulation were fixed as and . In practice, small samples for cluster are often available; for this reason, in this study four different sample sizes, , were considered. The number of conglomerates was fixed at conglomerates.

Table 1.
Hypothesis of interest and values used for the simulations of a GLMM with random intercept.
For each scenario given by the combination of , , and the true distribution of and , 1000 sets of data were simulated with the structure (5) and 1000 with the structure (6) (e.g., 1000 sets of data with = 5, = 1.5, true distribution = uniform, = 2 and structure (5)), and subsequently, the GLMM was adjusted with the function glmer for the Poisson case and with the function glmer.nb for the NB case. These functions can be found in the R package lme4. The ratio of times that an effect of the parameter of interest other than zero could be detected was calculated, i.e., the times that was rejected with a significance level of 5%. When there is no parameter effect (), this ratio corresponds to a type I error, and for other values of , this ratio represents the power of the test being studied [22].
2.2. Poisson and Negative Binomial Models with Random Intercept and Slope
A simulation study was conducted to evaluate the impact of the incorrect specification of the distribution of random effects for the case of generalized linear mixed models with the Poisson response and a random intercept and slope. The following structure, taken from [29], was considered:
where .
Based on the structure proposed by [29], NB response variables were also simulated with the following structure:
with , which has equally spaced values between −1 and 1; , a covariate within conglomerates with values ; and a binary covariate among conglomerates, , which was established to take the value of 0 for half of the conglomerates and 1 for the rest. The three covariates are mutually orthogonal [29]. In addition, four sample sizes, , were considered, as well as conglomerates.
The random intercept and slope, both for the Poisson and for the NB , were generated based on 4 different distributions with , 4 variance values, , and a correlation of 0.5 between the intercept and the random slope:
- bivariate normal.
- bivariate t with 3 degrees of freedom.
- exponential.
- bivariate Tukey , where parameter controls the amount and direction of asymmetry, while parameter controls the amount of elongation (kurtosis) of the bivariate Tukey distribution [30].
Figure 2 shows the contours for the four distributions used to simulate the random intercept and slope.
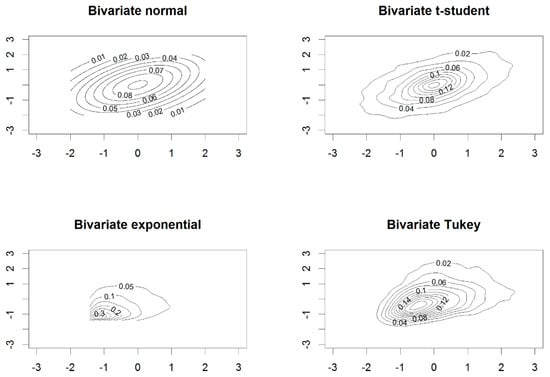
Figure 2.
Contours of the distributions considered for the random intercept and slope: bivariate normal, bivariate t-student, bivariate exponential and bivariate Tukey, with , and .
A total of 1000 repetitions were generated for each combination of , with , the true distribution of , and with structures (7) and (8) adjusting the model with the function glmer for the Poisson case and glmer.nb for the NB case, both of which were incorporated into the R package lme4.
As for generalized linear mixed models with a random intercept, the interest was focused on determining the ratio of times that an effect of the parameter of interest was detected; in this case, there are two: and ; i.e., where was rejected with a significance level of 5%, with this ratio corresponding to a type I error if and for other values of the parameter, this ratio represents the power of the analysis test [22], with . The values used for the parameters and are shown in Table 2. For the other parameters, the values of and were used.

Table 2.
Hypothesis of interest and values of the parameters used in the simulations of a GLMM with random intercept and slope.
3. Results
We studied the impact of the incorrect specification of the distribution of random effects on type I errors and the power of the Wald test in generalized linear mixed models with a random intercept and with a random intercept and slope. Below are the results for the first case.
3.1. Models with Random Intercept
Figure 3 and Figure 4 show the results for type I errors and the power of the statistical Wald test when testing vs. in generalized linear mixed models with Poisson and NB response variables, respectively.
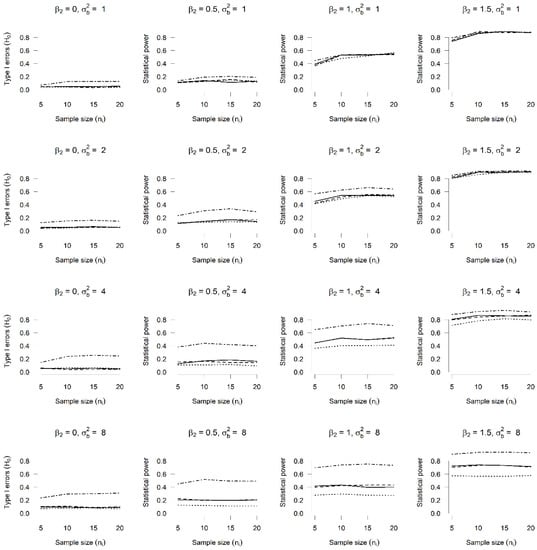
Figure 3.
Type I errors and power ( vs. ) in a Poisson GLMM with a random intercept. Type I errors and power for the Wald test with vs. in a Poisson GLMM with random intercept, with and and four distributions for random intercept: normal (solid line), mixture of two normal distributions (dashed line), uniform (dotted line) and lognormal (dash–dot line).
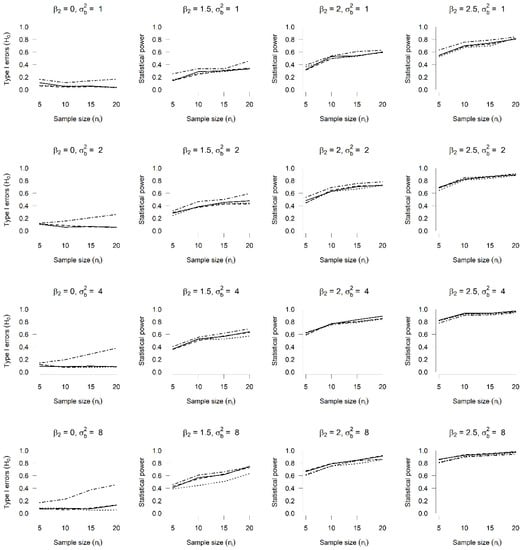
Figure 4.
Type I errors and power vs. ) in a BN GLMM with a random intercept. Type I errors and power for the Wald test with vs. in a BN GLMM with random intercept, with and and four distributions for random intercept: normal (solid line), mixture of two normal distributions (dashed line), uniform (dotted line) and lognormal (dash–dot line).
In the first column of Figure 3, we can observe the rejection rates for the null hypothesis when in fact, . In this case, we expect rejection rates around the significance level of 5%. For the random intercept with lognormal distribution (dash–dot line), we note that rejection rates are the greatest, thus indicating an impact of the incorrect specification of the distribution of the random intercept.
Columns 2, 3 and 4 from Figure 3 correspond to the rejection rates of the hypothesis for , respectively. Here, it is expected that the rejection rates go up to 100% as both the value of and the value of increase. The values of 0.5 and 1.5 for the parameter in the simulation study were selected intentionally because with them we obtained rejection curves that show a gradual increase. From Figure 3, it can be seen that for all cases, except when the true distribution is lognormal, the highest rejection rates correspond to the normal distribution. Moreover, for the uniform distribution, represented by the dotted line, there are rates below the normal distribution, which also indicates an impact of the incorrect specification of the distribution of the random intercept.
Figure 4 exhibits a behaviour similar to that found in Figure 3, as it displays an impact of incorrectly specifying the distribution of the random intercept by assuming it is normal when it actually comes from a lognormal distribution. Similar to the results for a Poisson GLMM, the impact is greater as the variance values increase (higher rejection rates appear, i.e., greater probability of type I error).
3.2. Models with Random Intercept and Slope
The results of type I errors and the power for the statistical Wald test for the hypothesis tests set out in Table 2 in the case of models with Poisson or NB response and random intercept and slope are presented in Figure 5, Figure 6, Figure 7 and Figure 8.
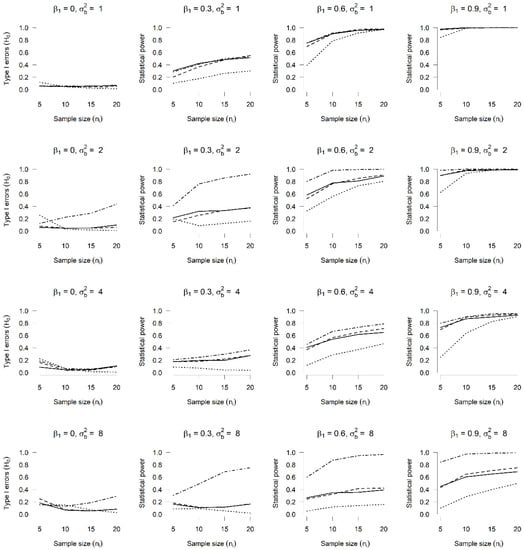
Figure 5.
Type I errors and power ( vs. ) in a Poisson GLMM with random intercept and slope. Type I errors and power for the Wald test for hypothesis test vs. in a Poisson GLMM, with and and four bivariate distributions for the random intercept and slope: bivariate normal (solid line), bivariate t-student (dashed line), bivariate exponential (dotted line) and bivariate Tukey (dash–dot line).
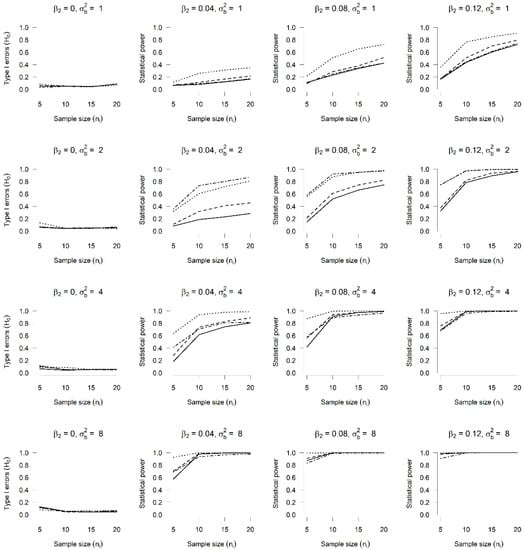
Figure 6.
Type I errors and power ( vs. ) in a Poisson GLMM with random intercept and slope. Type I errors and power for the Wald test for hypothesis test vs. in a Poisson GLMM, with and and four bivariate distributions for the random intercept and slope: bivariate normal (solid line), bivariate t-student (dashed line), bivariate exponential (dotted line) and bivariate Tukey (dash–dot line).
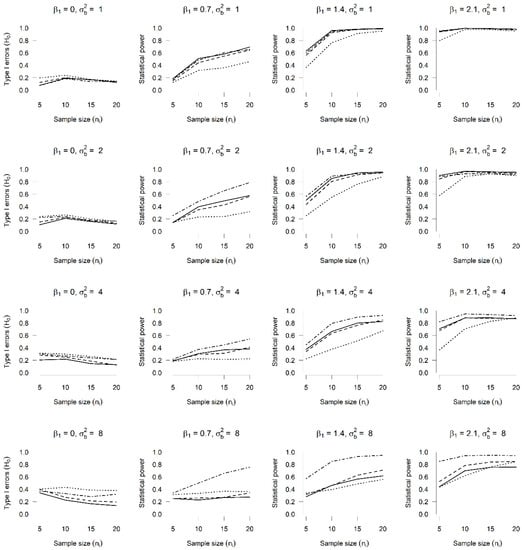
Figure 7.
Type I errors and power ( vs. ) in a BN GLMM with random intercept and slope. Type I errors and power for the Wald test for hypothesis test vs. in a BN GLMM, with and and four bivariate distributions for the random intercept and slope: bivariate normal (solid line), bivariate t-student (dashed line), bivariate exponential (dotted line) and bivariate Tukey (dash–dot line).
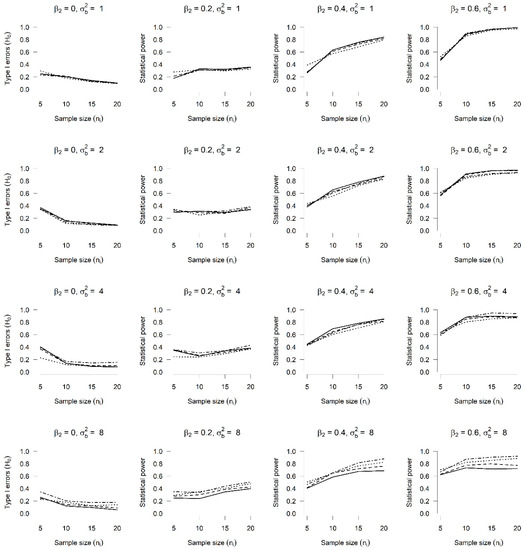
Figure 8.
Type I errors and power ( vs. ) in a BN GLMM with random intercept and slope. Type I errors and power for the Wald test for hypothesis test vs. in a BN GLMM, with and and four bivariate distributions for the random intercept and slope: bivariate normal (solid line), bivariate t-student (dashed line), bivariate exponential (dotted line) and bivariate Tukey (dash–dot line).
Figure 5 shows the type I error and the power of the Wald test for the hypothesis test vs. in a Poisson GLMM, for which four values, , and four different sample sizes, , were considered. The lowest rates of rejection of the null hypothesis (this being true), which are shown in Column 1, correspond to the normal distribution, as was expected. For 2 and 8, the highest rates correspond to the bivariate Tukey distribution (dash–dot line), showing an impact of incorrectly specifying the distribution of random effects, as they have been assumed to be normal instead of Tukey. In terms of the rejection rates when , represented in Columns 2, 3 and 4, it is also possible to see an impact of this specification, as rates lower than the normal distribution were obtained for the bivariate exponential distribution (dotted line).
The results of the type I error and the power of the Wald test when proving hypothesis vs. in a Poisson GLMM with four different values for and four sizes of sample are presented in Figure 6. Opposite to what was found when proving hypothesis vs. , incorrectly specifying the distribution of the random intercept and slope does not seem to have an impact, since there are no differences in the rejection rates when upon comparing the four true distributions for random effects (Column 1). With regard to the rejection rates of the hypothesis when (Columns 2, 3 and 4), no rates below the normal distribution are observed. We can thus conclude that there is no evidence of an impact of incorrectly specifying the distribution of random effects for this case.
Figure 7 and Figure 8, on the other hand, show the rejection rates of the null hypotheses vs. , respectively, and the results of the power of the statistical Wald test assuming values for and , 0.2, 0.4, 0.6 in an NB GLMM with a random intercept and slope.
Figure 7, similar to what was found for the Poisson GLMM with a random intercept and slope, shows evidence that there is indeed an impact of incorrectly specifying the distribution of random effects, since in Column 1, where the rejection rates of hypothesis vs. when (type I error), the highest rates correspond to the exponential and Tukey bivariate distributions, which becomes much more evident as the value of the variance increases and when it has a value of . Additionally, when Columns 2, 3 and 4 are observed, where the power of the Wald test is shown when rejecting the hypotheses of interest (this being false), it can be seen how for some values of and , the rates are lower when the true distribution of the effects is the bivariate exponential, if compared with the results obtained for the bivariate normal distribution, thus indicating an impact of the incorrect specification of the distribution of the random effects.
Finally, Figure 8 shows the rejection rates of the hypothesis test vs. in an NB GLMM with a random intercept and slope, for which it seems that all curves in Column 1 are above 10%, which suggests evidence of the impact of incorrectly specifying the distribution of random effects, especially with greater variances. In the second and third columns, the power seems to be too low, but this is because the intentional choice of the values for the parameters show rejection curves with a gradual increase, as is shown in all columns of the Figure.
4. Conclusions
In this article, the aim was to identify whether there is actually an impact of the incorrect specification of the distribution of random effects on the inferential procedures of Wald-type hypothesis tests. Data sets were simulated with Poisson or NB response variables, which had generalized linear mixed models adjusted, taking into consideration, in some cases, a random intercept, and in others, a random intercept and slope.
The simulation study presented here allows us to conclude that the impact of the incorrect specification appears to depend on the complexity of the structure of the random effects, the variance of the distribution of the underlying random effects and the parameters of interest. Additionally, the results indicate an impact of incorrect specification in the assumed distributions for random effects, which are quite different from the well-known characteristics of normal distribution: lognormal (positive asymmetry and high kurtosis) for random intercepts and bivariate exponential (moderate asymmetry and kurtosis) and bivariate Tukey (moderate asymmetry and high kurtosis) for random intercepts and slopes.
For both cases—Poisson and BN with a random intercept—an impact was found from incorrectly specifying the distribution of said intercept, as greater rejection rates were obtained for hypothesis vs. , where , i.e., higher probabilities of making a type I error when the true distribution of the intercept is lognormal, and also, the impact was greatest as the variance values increased for the random intercept. Moreover, evidence was found of said impact with the lowest rejection rates when the true distribution was uniform when ; i.e., with lower rates for the test power.
In the cases where generalized linear mixed models were adjusted with a Poisson or NB response and a random intercept and slope, and where the interest was focused on the Wald-type hypothesis tests for determining an effect of the parameter or the parameter , an impact was indeed found arising from the incorrect specification of the random effects when proving hypothesis vs. , for the adjustment of both the Poisson and the NB models. This impact was observed with the highest rejection rates when the null hypothesis was true; i.e., the highest probability of making a type I error was found when the real distribution of the random effects was bivariate Tukey, and with the lowest rejection rates when the null hypothesis was false, being related to the statistical power when the true distribution was a bivariate exponential. When testing hypothesis vs. , no evidence was found for the incorrect specification of the distribution of the random effects.
The results presented herein contribute to understanding the implications of an incorrect specification of the distribution of random effects in GLMMs. However, this contribution is limited by the computational behaviour of considering only two functions in the simulation study (glmer, glmer.nb), which are found in the lme4 package of software R. Considerations and comparisons with other packages and software would be ideal; but this would imply a higher computational cost, which is beyond the scope and resources of this research.
5. Future Work
Although this study addressed the problem of the incorrect specification of the distribution of random effects, authors such as [31] identify other aspects of incorrect specification, such as the fact that the distribution of random effects may depend on a covariate or that this may depend on the sample size of the conglomerate. Therefore, for future work, it would be interesting to study the impact on the estimates of the parameters in generalized linear mixed models in these types of specifications, as well as those related to the incorrect specification of the link function or not taking into account the presence of overdispersion, among others.
Another aspect to consider in future works is the performance of the 100(1 − α)% confidence intervals, based on the Wald method, as studied in [2], which found in its simulation study that, in general, coverage rates are associated with the 95% value, with α = 0.05, except for highly skewed configurations. Therefore, a simulation study of this type would be expected to find high probability rates of a type I error with low coverage rates for the different parameters studied because both work with the exact estimates (β and SE(β)).
Finally, as a product of this work, as the distribution of random effects is unknown, a study that identifies the minimum needed to minimize the impact on type I error and statistical power would be desirable.
Author Contributions
Conceptualization, D.A.-B. and F.H.-B.; Methodology, F.H.-B.; Software, D.A.-B. and F.H.-B.; Validation, D.A.-B., F.H.-B. and A.V.-A.; Formal Analysis, D.A.-B., F.H.-B. and A.V.-A.; Investigation, D.A.-B.; Resources, D.A.-B. and A.V.-A.; Data Curation, D.A.-B. and F.H.-B.; Writing—Original Draft Preparation, D.A.-B., F.H.-B. and A.V.-A.; Writing—Review and Editing, D.A.-B., F.H.-B. and A.V.-A.; Visualization, D.A.-B., F.H.-B. and A.V.-A.; Supervision, F.H.-B.; Project Administration, D.A.-B. and F.H.-B.; Funding Acquisition, D.A.-B. and A.V.-A. All authors have read and agreed to the published version of the manuscript.
Funding
The APC was funded by Universidad Señor de Sipán.
Institutional Review Board Statement
Not applicable.
Informed Consent Statement
Not applicable.
Data Availability Statement
The data of the different simulations will be provided upon request to the corresponding author.
Conflicts of Interest
The authors declare no conflict of interest.
References
- Overall, J.E.; Tonidandel, S. Robustness of Generalized Estimating Equation (GEE) Tests of Significance against Misspecification of the Error Structure Model. Biom. J. 2004, 46, 203–213. [Google Scholar] [CrossRef]
- Lin, K.-C. Goodness-of-Fit Tests for Modeling Longitudinal Ordinal Data. Comput. Stat. Data Anal. 2010, 54, 1872–1880. [Google Scholar] [CrossRef]
- Noe, D.A.; Bailer, A.J.; Noble, R.B. Comparing Methods for Analyzing Overdispersed Count Data in Aquatic Toxicology. Environ. Toxicol. Chem. 2010, 29, 212–219. [Google Scholar] [CrossRef]
- Litière, S.; Alonso, A.; Molenberghs, G. Type I and Type II Error under Random-Effects Misspecification in Generalized Linear Mixed Models. Biometrics 2007, 63, 1038–1044. [Google Scholar] [CrossRef]
- Xiang, L.; Yau, K.K.; Lee, A.H. The Robust Estimation Method for a Finite Mixture of Poisson Mixed-Effect Models. Comput. Stat. Data Anal. 2012, 56, 1994–2005. [Google Scholar] [CrossRef]
- Huang, X. Diagnosis of Random-effect Model Misspecification in Generalized Linear Mixed Models for Binary Response. Biometrics 2009, 65, 361–368. [Google Scholar] [CrossRef] [PubMed]
- Verbeke, G.; Molenberghs, G. The Gradient Function as an Exploratory Goodness-of-Fit Assessment of the Random-Effects Distribution in Mixed Models. Biostatistics 2013, 14, 477–490. [Google Scholar] [CrossRef] [PubMed]
- Yu, S.; Huang, X. Random-Intercept Misspecification in Generalized Linear. Stat. Methods Appt. 2017, 26, 333–359. [Google Scholar] [CrossRef]
- Drikvandi, R.; Verbeke, G.; Molenberghs, G. Diagnosing Misspecification of the Random-Effects Distribution in Mixed Models. Biometrics 2017, 73, 63–71. [Google Scholar] [CrossRef] [PubMed]
- Fabio, L.C.; Paula, G.A.; Castro, M. De A Poisson Mixed Model with Nonnormal Random Effect Distribution. Comput. Stat. Data Anal. 2012, 56, 1499–1510. [Google Scholar] [CrossRef]
- Neuhaus, J.M.; Hauck, W.W.; Kalbfleisch, J.D. The Effects of Mixture Distribution Misspecification When Fitting Mixed-Effects Logistic Models. Biometrika 1992, 79, 755–762. [Google Scholar] [CrossRef]
- Alonso, A.; Litière, S.; Molenberghs, G. Testing for Misspecification in Generalized Linear Mixed Models. Biostatistics 2010, 11, 771–786. [Google Scholar] [CrossRef]
- Alonso, A.; Milanzi, E.; Molenberghs, G.; Buyck, C.; Bijnens, L. A New Modeling Approach for Quantifying Expert Opinion in the Drug Discovery Process. Stat. Med. 2015, 34, 1590–1604. [Google Scholar] [CrossRef]
- Bolker, B.M.; Brooks, M.E.; Clark, C.J.; Geange, S.W.; Poulsen, J.R.; Stevens, M.H.H.; White, J.S.S. Generalized Linear Mixed Models: A Practical Guide for Ecology and Evolution. Trends Ecol. Evol. 2009, 24, 127–135. [Google Scholar] [CrossRef] [PubMed]
- Lagishetty, C.V.; Duffull, S.B. Evaluation of Approaches to Deal with Low-Frequency Nuisance Covariates in Population Pharmacokinetic Analyses. AAPS J. 2015, 17, 1388–1394. [Google Scholar] [CrossRef] [PubMed]
- Laouénan, C.; Guedj, J.; Mentré, F. Clinical Trial Simulation to Evaluate Power to Compare the Antiviral Effectiveness of Two Hepatitis C Protease Inhibitors Using Nonlinear Mixed Effect Models: A Viral Kinetic Approach. BMC Med. Res. Methodol. 2013, 13, 60. [Google Scholar] [CrossRef] [PubMed]
- Retout, S.; Comets, E.; Samson, A.; Mentré, F. Design in Nonlinear Mixed Effects Models: Optimization Using the Fedorov–Wynn Algorithm and Power of the Wald Test for Binary Covariates. Stat. Med. 2007, 26, 5162–5179. [Google Scholar] [CrossRef]
- Panhard, X.; Mentré, F. Evaluation by Simulation of Tests Based on Non-Linear Mixed-Effects Models in Pharmacokinetic Interaction and Bioequivalence Cross-over Trials. Stat. Med. 2005, 24, 1509–1524. [Google Scholar] [CrossRef]
- Oberfeld, D.; Franke, T. Evaluating the Robustness of Repeated Measures Analyses: The Case of Small Sample Sizes and Nonnormal Data. Behav. Res. Methods 2013, 45, 792–812. [Google Scholar] [CrossRef]
- Vaudor, L.; Lamouroux, N.; Olivier, J.M.; Forcellini, M. How Sampling Influences the Statistical Power to Detect Changes in Abundance: An Application to River Restoration. Freshw. Biol. 2015, 60, 1192–1207. [Google Scholar] [CrossRef]
- Zhang, B.; Liu, W.; Zhang, H.; Chen, Q.; Zhang, Z. A Note on Misspecification in Joint Modeling of Correlated Data with Informative Cluster Sizes. J. Stat. Plan. Inference 2016, 170, 46–63. [Google Scholar] [CrossRef]
- Litière, S.; Alonso, A.; Molenberghs, G. The Impact of a Misspecified Random-Effects Distribution on the Estimation and the Performance of Inferential Procedures in Generalized Linear Mixed Models. Stat. Med. 2008, 27, 3125–3144. [Google Scholar] [CrossRef]
- Manor, O.; Zucker, D.M. Small Sample Inference for the Fixed Effects in the Mixed Linear Model. Comput. Stat. Data Anal. 2004, 46, 801–817. [Google Scholar] [CrossRef]
- LeBeau, B. Misspecification of the Covariance Matrix in the Linear Mixed Model: A Monte Carlo Simulation. Ph.D. Thesis, University of Minnesota, Minneapolis, MN, USA, 2013. [Google Scholar]
- Melo, T.F.N.; Ferrari, S.L.P.; Cribari-Neto, F. Improved Testing Inference in Mixed Linear Models. Comput. Stat. Data Anal. 2009, 53, 2573–2582. [Google Scholar] [CrossRef]
- Kojima, M.; Kubokawa, T. Bartlett-Type Adjustments for Hypothesis Testing in Linear Models with General Error Covariance Matrices. J. Multivar. Anal. 2013, 122, 162–174. [Google Scholar] [CrossRef]
- Nikoloulopoulos, A.K.; Karlis, D. On Modeling Count Data: A Comparison of Some Well-Known Discrete Distributions. J. Stat. Comput. Simul. 2008, 78, 437–457. [Google Scholar] [CrossRef]
- Xie, H.; Tao, J.; McHugo, G.J.; Drake, R.E. Comparing Statistical Methods for Analyzing Skewed Longitudinal Count Data with Many Zeros: An Example of Smoking Cessation. J. Subst. Abuse Treat. 2013, 45, 99–108. [Google Scholar] [CrossRef]
- Neuhaus, J.M.; Mcculloch, C.E.; Boylan, R. Estimation of Covariate Effects in Generalized Linear Mixed Models with a Misspecified Distribution of Random Intercepts and Slopes. Stat. Med. 2013, 32, 2419–2429. [Google Scholar] [CrossRef]
- Valencia, A.M. El Uso de La Distribución G-h En Riesgo Operativo. Contaduría Adm. 2014, 59, 123–148. [Google Scholar] [CrossRef]
- McCulloch, C.E.; Neuhaus, J.M. Misspecifying the Shape of a Random Effects Distribution: Why Getting It Wrong May Not Matter. Stat. Sci. 2011, 26, 388–402. [Google Scholar] [CrossRef]
Disclaimer/Publisher’s Note: The statements, opinions and data contained in all publications are solely those of the individual author(s) and contributor(s) and not of MDPI and/or the editor(s). MDPI and/or the editor(s) disclaim responsibility for any injury to people or property resulting from any ideas, methods, instructions or products referred to in the content. |
© 2023 by the authors. Licensee MDPI, Basel, Switzerland. This article is an open access article distributed under the terms and conditions of the Creative Commons Attribution (CC BY) license (https://creativecommons.org/licenses/by/4.0/).