Featured Application
Electronic nose can be a simple, portable, solvent free, rapid and relatively inexpensive device to assess the authenticity of “Pasture milk” before its processing. It can be used to protect producers and consumers of milk and dairy products from potential fraud.
Abstract
The nutritional peculiarities of dairy products made with milk from pasture-fed ruminants would require a rapid control to be authenticated and limit the risk of fraud. In the current study, ninety milk samples from two groups of goats were analysed by electronic nose, quantitative descriptive sensory (QDA) and gas chromatography-mass spectrometry analysis with the aim of discriminating between milk produced on grazing and on a confinement feeding system. The raw milk samples were taken at five different times over a period of three months (April, May and June 2021) from eighteen individual Saanen goats divided into two groups, one of which was fed outdoors on a highly biodiverse pasture. Linear discriminant analysis (LDA), carried out on electronic nose data, was able to classify the two types of milk in terms of an animal feeding system (88% correct classification). Pasture milk scored higher for sensory descriptors such as “Grassy” and “Sweet aromatic” odours. Terpene compounds were the chemical class that qualitatively differentiates the pasture milk while volatile fatty acids were the most present quantitatively. Electronic nose has proven to be a rapid, reproducible and simple method for authenticating pasture raw milk in routine control analyses.
1. Introduction
Consumers are increasingly interested to the choice of dairy products produced from milk of ruminants fed on pastures in respect for animal welfare and environmental sustainability, accepting a higher price for these products [1,2]. This can be attributed to consumers’ perception of a more genuine, natural and healthy product. Effectively, several studies have reported that milk and dairy products from pasture-fed ruminants show higher amounts of unsaturated fatty acids, including some essential and healthy compounds such as omega-3 and trans-11 isomers (i.e., vaccenic acid and rumenic acid), which are beneficial to consumer health [3,4,5,6]. Well-managed grazing improves animal welfare and environmental sustainability of the dairy sector [7,8,9,10]. This extensive feeding system is an efficient method that has low competition for the direct production of human food crops [11,12] and allows to take advantage of ruminant metabolism.
The recognition of these benefits, which justifies a higher price, is guaranteed on the market by labels that certify the identity of dairy products. In Italy, the “Metodo Nobile®” proposes specific rules for the breeding of lactating ruminants, such as the prohibition of the use of silage and genetically modified feedstuffs in the livestock feeding system, the use of a high forage:concentrate ratio of at least 70:30 and, depending on the source of forage, it provides two different milk labels. In the “Pasture” milk, the animals must be fed for at least 150 days a year on a high biodiversity pasture. Instead, the “Stall” label contemplates the use of hay in an indoor animal diet [13,14]. Consumers involved in the consumption of premium products have expressed that they can pay a higher price for the purchase of Noble milk from grazing ruminants [15]. However, the reputation as a premium product makes pasture-based dairy products vulnerable to fraud. This implies that the pasture-fed origin must be objectively and rapidly proven to protect consumers against potential frauds.
Since the volatile compounds of milk are qualitatively and quantitatively influenced by the animal feeding regime [3,16], their determination in raw milk could be a decisive analysis to be applied in the discrimination of milk produced by grazing animals compared to that produced by animals fed with conventional indoor diets. While volatile compounds analysis is time-consuming, costly and require skilled personnel, E-nose can be a useful portable device for a quick assessment of milk quality, rapidly evaluating complex and volatile gas mixtures in the sample headspace [17].
Schematically, E-nose is composed of an array of gas sensors with different selectivity, a signal-collecting unit and pattern recognition software. The use of the E-nose has involved different foods (fruits, alcoholic beverages, cooked and raw meat) and has been applied for different objectives [18,19,20,21]. The applications of E-nose in the dairy sector (milk, yogurt and cheese) have recently been reviewed [22]. In fresh milk, E-nose has been used for several purposes such as monitoring microbial growth [23,24], milk discrimination based on the farming system [17], identification of traces of detergent in milk [25,26] and discrimination of milk from cows fed on two different Alpine pastures [27].
As far as we know, no information is available on the use of electronic nose as a useful device for authenticating raw milk from pasture-fed goats. Thus, in this study, we used an electronic nose consisting of ten metal oxide semiconductor (MOS) sensors to differentiate raw milk samples from grazing or confinement-fed goats and authenticate pasture milk. Quantitative descriptive sensory analysis (QDA) and SPME-GC/MS analysis were carried out to evaluate the differences between the samples in terms of human olfactory perception and volatile compounds.
2. Materials and Methods
2.1. Milk Sampling
The study was conducted in the farm “I Moresani” located in Casal Velino (SA) in the period April–June 2021. Eighteen pluriparous Saanen goats, homogeneous for age, body weight, parity and milk yield at the previous lactation were divided in two groups. Table 1 shows the botanical composition of the pasture and the source of forage for the goats fed in the stable for the five time periods considered in the experiment.

Table 1.
Milk samples measured by electronic nose, evaluated by sensory panel and analysed by GC/MS.
Stall milk group (S) consisted of nine goats reared in the stable and fed with hay ad libitum, fresh alexandrine clover and concentrate mixture (400 g/head/day) composed of corn meal, barley, faba bean and pea bean. Pasture milk group (P) consisted of nine goats fed outdoors on permanent pasture, which received the concentrate mixture in the same amount as the S group. Raw milk samples were taken at five different times, with a fortnightly interval, over three months (27 April, 11 May, 25 May, 8 June, 22 June) from individual goats (Table 1). During the time period investigated, the crude protein (%DM) value of pasture vegetation ranged from a minimum of 10.77% (11 May) to a maximum of 19.19% (22 June) while the crude fibre (%DM) value ranged from 30.92 (8 June) to 35.85 (22 June). Regarding the S group, while the hay had constant chemical composition values, the fresh clover had a minimum of crude protein and crude fibre of 18.21% (June) and 25.98 (April), respectively, and a maximum of crude protein and crude fibre of 20.10% (April) and 30.62 (May), respectively. In the five milking periods, the goats produced an average of 1570 mL and 1692 mL of milk for groups S and P, respectively. The milk samples were stored at −20 °C before analysis.
2.2. Electronic Nose Analysis
Individual milk samples, provided by each goat, from the five different milking periods (for a total of forty-five P and forty-five S samples) were used for electronic nose measurements. An aliquot of 2 mL of each milk sample, previously defrosted for 24 h at 4 °C, were transferred into 20 mL glass vial with a Teflon/silicon septum in the screw cap in order to analyse the odour fraction by means of an electronic nose. A portable electronic nose PEN2 (WMA Airsense Analytics GmbH, Schwerin, Germany), operating with 10 Metal Oxide Semiconductor sensors (MOS), was used.
Before the electronic nose acquisition, the vials were incubated in a thermostat-controlled bath at 25 °C for 30 min to allow the equilibrium of volatile compounds in the sample headspace [28]. The headspace odour sampling system consisted of an air injection needle and a sample aspiration needle which extracted and transferred the volatile fraction to the electronic nose sensors at constant velocity (400 mL/min). Data was recorded every second by a computer and the experiment lasted 60 s. Recovery time for the flushing of sensors with reference air was 240 s. The electronic nose was used at 25 °C ± 1 during all experiments. The mean G/G0 values of each sensor response were calculated from measurements in the 55–59 s range (sensors stability) using Winmuster v.1.6 software (Airsense Analytics GmbH, Schwerin, Germany).
2.3. Sensory Analysis
The odour descriptors for the sensory evaluation of raw goat’s milk samples (P and S milk) were developed by eight trained panellists and quantified by Quantitative Descriptive Analysis (QDA) methodology. These descriptors are usually found in raw milk [29,30]. The definition of odour descriptors and the reference standards used for panel training are listed in Table 2.
Table 2.
Definitions and reference standards of odour attributes used in the sensory analysis of raw goat milk samples.
The intensity of each attribute was quantified with a continuous scale, anchored to extremes, from 0 (no perception) to 10 (very intense perception). For each period, the nine samples of pasture milk and nine samples of stall milk were mixed and presented to the assessors as bulk pasture milk and bulk stall milk. A total of five different sessions were conducted, relating to the evaluation of the bulk milk samples of the five milking periods, and panellists were divided into two groups in order to randomise the samples. A total of 40 mL of the sample was poured into 80 mL PLA cups (with blind three-digit codes), capped with the appropriate lid, and presented at 25 °C.
2.4. Analysis of Volatile Organic Compounds
The extraction of volatile organic compounds (VOCs) was carried out, as described by Genovese et al. [31]. A total of 22.5 g of milk, 20 µL of 2-methyl-3-heptanone (99% purity, Sigma-Aldrich, St. Louis, MO, USA) as internal standard (389 mg/L, in water solution) and 2.75 g of sodium phosphate monobasic (NaH2PO4) (Sigma-Aldrich) were added into a 50 mL dark glass bottle. The sample was magnetically stirred for 5 min at 55 °C. SPME fibre was inserted through the Teflon septum in the bottle and exposed to sample headspace for 60 min at 55 °C while stirring. The SPME device (Supelco Co., Bellefonte, PA, USA) was equipped with a 50/30 μm thick divinyl-benzene/carboxen/polydimethylsiloxane (DVB/CAR/PDMS) fibre coated with 2 cm length stationary phase. Then, the VOCs were desorbed directly in the injector port of GC kept at a temperature of 250 °C in split mode with a 4:1 split ratio, for 10 min. Volatile compounds analyses were performed on an Agilent 7890A GC System gas chromatograph coupled to an Agilent 5975C VL MSD with Triple-Axis-Detector mass spectrometer (Agilent Technologies, Inc., Palo Alto, CA, USA). GC was equipped with a Zebron ZB-WAX capillary column (60 m × 0.25 mm i.d. × 0.25 μm film thickness 100% polyethylene glycol; Phenomenex, Torrance, CA, USA). The carrier gas was helium with a flow of 1 mL/min. The temperature program was 40 °C for 10 min, then raised at 5 °C/min to 240 °C and held for 11 min [32]. Mass spectra were recorded at 70 eV. The source temperature was 230 °C, the quadrupole temperature was 150 °C and the interface temperature was 250 °C.
The identification of VOCs was performed by comparing retention times and mass spectra obtained by analysing pure reference compounds in the same conditions. The identification was confirmed by comparing mass spectra with those of the National Institute of Standards and Technology (NIST) database. All chemical standards were supplied by Sigma-Aldrich (St. Louis, MO, USA). The fibre was conditioned at 270 °C for 1 h before the analysis. A blank test was performed before each analysis. The quantitative data of milk volatile compounds was carried out by normalising the peak areas of each compound with respect to the area of the internal standard peak. Peak area data were processed by MSD ChemStation 5975 TAD Data Analysis software (Agilent Technologies, Palo Alto, CA, USA). The analysis of volatile compounds was performed in triplicate on the bulk milk samples for each of the five milking periods.
2.5. Statistical Analysis
The resulting 10-dimensional patterns (data vectors) were processed by linear discriminant analysis (LDA). Tukey test was performed on each sensory attribute and volatile compound in order to discriminate the two types of milk samples based on the animal diet (pasture vs. stall feeding system). Differences of p ≤ 0.05 were considered as statistically significant. VOCs with significant differences between P and S milk were used for cluster heatmap analysis, implementing ascendant hierarchical clustering based on Euclidian distances preceded by the k-means algorithm to permute the data matrix, and for partial least squares regression analysis (PLSR). Partial least squares regression (PLSR) analysis was performed to investigate the correlativity between sensory and instrumental data (VOCs and E-nose data) for the differentiation of milk samples. Cluster heatmap analysis, PLSR and Tukey test were carried out using XLStat (Version 2019 v.2.2), an add-in software package for Microsoft Excel (Addinsoft Corp., Paris, France).
3. Results and Discussion
3.1. Electronic Nose Analysis
Figure 1 shows the LDA plot obtained from the data vectors extrapolated from E-nose measurements in the time interval 55–59 s, when the MOS sensors were stable [28].
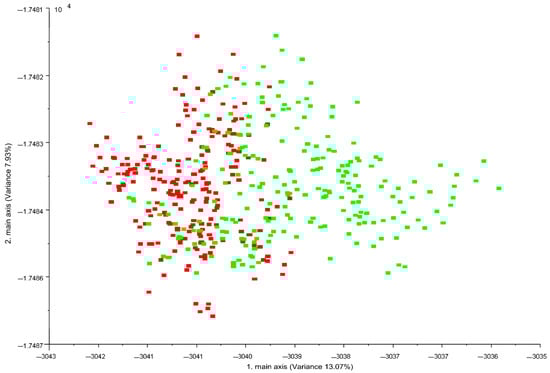
Figure 1.
LDA plot of the resulting 10-dimensional patterns (data vectors) obtained from electronic nose analysis of 45 Pasture (green) and 45 Stall (red) individual milk samples. Data processed with Winmuster v.1.6 software (Airsense Analytics GmbH, Schwerin, Germany).
Electronic nose provided good discrimination of the two milk labels. P milk exhibited greater variability than S milk. Table 3 shows the confusion matrix with classification of milk samples obtained by LDA analysis.
Table 3.
Confusion matrix of the Pasture and Stall goat’s milk samples.
The correct classification of milk samples according to diet and milking period was 80%. On the contrary, considering only the animal diet (pasture vs. stall diet), the correct classification of the samples increased to 88%. By E-nose equipped with 10 MOS sensors, Falchero et al. [27] discriminated the cow’s milk of the summer period according to the type of grazing vegetation. The two groups of cows were fed on two different Alpine vegetation (Trifolium alpinum and Festuca nigrescens as dominant species of the two groups) and received only a supplement of minerals with no integration feeding. The authors reported over 90% correct classification through statistical analysis of the E-nose data, similar to our findings when the milking period effect was not taken into account.
From the ninety E-nose acquisitions, P milk was incorrectly classified as S milk for a total of seven times, while S only three times. Generally, S milk samples obtained a better classification during the investigated periods attributable to a more standard and less variable diet compared to P milk from grazing goats. The more variable responses obtained for P milk could be linked to volatile organic compounds, the presence of which may vary drastically both qualitatively and quantitatively as the grazing period varies and in relation to the type of fresh forage [3]. In fact, Fedele et al. [33] reported both sensory (odour) and chemical differences (VOCs) in goat’s milk according to grazing season (March to July). For example, milk of the summer season was characterised by terpene compounds while the ketones increased from winter to spring. These differences could be those that determine a different response of the E-nose sensors. The lactation stage also influences the variation of the composition of milk and, hence, the response of E-nose sensors. Bergamaschi et al. [34] reported that the lactation stage (days in milk) is one of the most important individual factors contributing to the variation in the flavour profile of milk.
3.2. Sensory Analysis of Milk
A sensory analysis on raw bulk milk of each milking period was carried out to verify the olfactory properties that characterised the two types of milk and which allowed their discrimination. The results of the sensory evaluation of milk samples are shown in Figure 2.
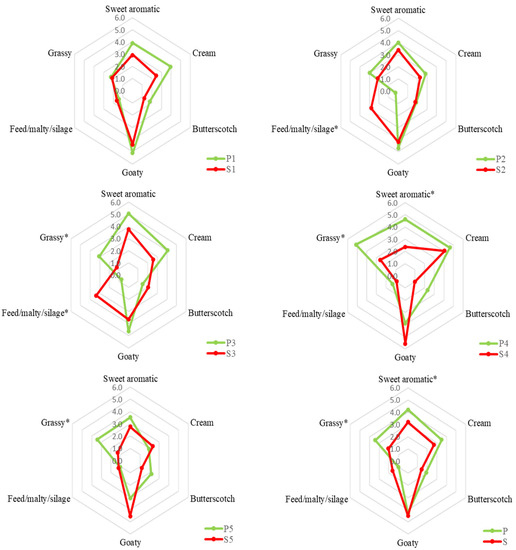
Figure 2.
QDA results of bulk milk from pasture-fed goats (P) and stall-fed goats (S) of each period. The numbers 1 to 5 indicate the milking period (see Table 1 for further details). The asterisk (*) indicates a statistical difference (p ≤ 0.05) between P and S milk samples.
The “grassy” and “sweet aromatic” descriptors showed a higher level in P milk in almost all periods (from 1 to 5). The first descriptor obtained the highest intensity score in P4 while the second in P3. The other descriptors were more variable between the periods. Considering a bulk milk, the P sample showed a significant sensory difference for “grassy” and “sweet aromatic” odour descriptors with an increase of 1.4 and 1, respectively. Previously it was reported that milk from pasture-fed goats had a higher intensity of herbaceous odour [35], compared to milk from goats fed in confinement with hay and concentrate. Villeneuve et al. [36] also reported a higher intensity value of “grass” and “plant” attributes for milk of cows fed with fresh forage than those fed with hay- or silage-based feeding system. On average, the “Feed/malty/silage” descriptor was perceived to be more intense in milk S (+0.6), although the difference was not statistically significant because its level increased only in S2 and S3. Although the chemical composition, and hence the odorous compounds of the milk, undergo changes during lactation [34], one cause of the different perceived intensity of the odour descriptors in the S milk samples of the different periods could be attributed to the diet of stall-fed goats which, in addition to the hay (which had a constant chemical composition during the investigated period), provided for the use of fresh clover that had a variable composition during the three months of the study. Generally, sensory differences related to the odour of preserved feed in milk appear to be greater when comparing a grazing diet versus a diet based on silages [37,38]. Some volatile compounds may impart a malty odour in milk that resembles that of preserved fodder [39].
Manzocchi et al. [40] reported a higher intensity for the “cream” odour attribute in milk from pasture cows compared to those fed with hay. In their study, the “cream” attribute was more related to the pasteurisation of milk than the animal diet. In fact, in our study, the difference for the “Cream” attribute was not statistically significant as the effect of the animal diet on raw milk samples was evaluated. The less variable olfactory descriptor between the two types of milk was “goaty”. Previously, no particular differences in goat’s milk based on the animal diet were reported for “goaty” descriptor [35]. In fact, this descriptor is more species specific, making it distinctive from the milk of other ruminants [41].
3.3. Analysis of Volatile Compounds
The SPME-GC/MS analysis was conducted to understand the volatile compounds that most contributed to discriminate the odour of the two types of milk. Table 4 shows the VOCs identified in the milk samples P and S, as well as their odour descriptors based on the available literature [42,43,44,45,46,47,48].
Table 4.
Quantitative data of volatile organic compounds identified in bulk milk samples obtained from goats fed on a pasture (P) or stall (S)-based diet.
A total of 4 hydrocarbons, 6 terpenes, 12 aldehydes, 5 ketones, 5 alcohols and 9 acids have been identified in milk samples. For the volatile compounds, which had a significant difference between P and S milk samples (p ≤ 0.05), the relative abundance was also reported (Table 4). Hydrocarbons, terpenes, and acids are the chemical classes that most differentiate the two types of milk samples, where terpene compounds qualitatively characterised the P milk samples. Heptanal and nonanal, which can result from lipid oxidation, had a higher intensity in P milk. The greater amount of unsaturated fatty acids, more susceptible to oxidation, increases the amount of aldehydes in pasture milk [36,49]. We found no significant differences in the concentration of alcohols for the two types of milk.
The VOCs most abundant in P milk are, generally, responsible for green, sweet, fragrant and fruity notes [42,45,46,47,48]. On the contrary, [Z]-2-heptenal, maltol and 2,3 pentanedione, reported in higher amount in S milk samples, have biscuit, milky, caramel and buttery odours. According to Sacchi et al. [50], 2,3 pentanedione, with a cheesy odour, was found to be lower in the milk of ruminants fed fresh fodder. Clarke et al. [43] have recently reported higher amounts of maltol in raw milk from indoor-fed animals than in pasture-fed animals. According to the authors, since maltol derives from the Maillard reaction, its presence in raw milk leads to the hypothesis of its microbial origin. However, further investigation would be needed.
A cluster analysis was performed on the significant volatile compounds in order to classify and discriminate the two types of milk based on milking period and diet. The results were plotted into a heatmap (Figure 3).
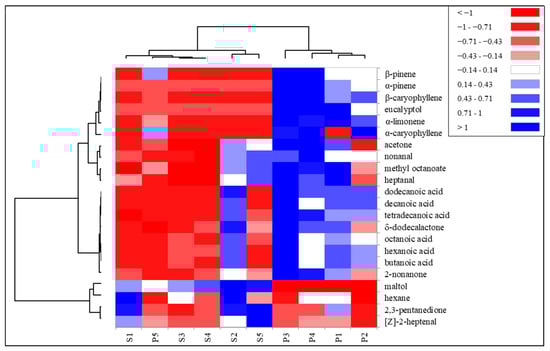
Figure 3.
Heat map of the diversity of volatile compounds in Pasture (P) and Stall (S) milk samples of the five milking periods. Volatile compounds were plotted on the Y axis, while the X axis had the milk samples from each period. Results are displayed as negative (−1) to positive (+1) correlation of the volatile compounds in the permuted matrix for the respective milk samples.
The cluster lines on the left side of Figure 3 represent volatile compounds clusters. Volatile compounds were grouped into three main clusters. The first two, starting from the top of the map, were represented by the terpene compounds and the acids, most abundant in P milk. The other cluster was represented by the molecules most present in S milk.
The cluster lines on the top of Figure 3 represent the milking period and type of diet. Pasture milk of the last period, P5, was grouped with S milk samples, due to a lower quantity of some terpene compounds and acids that helped discriminate pasture milk from previous periods. The exclusive presence of terpene compounds in the milk of pasture-fed goats suggests how the terpene profile of the milk of grazing ruminants can help in the authentication of milk. The content of terpenes in milk is higher when animals are fed in highly biodiverse pastures rich in dicotyledons than monotonous forage [51]. Sant’Ana et al. [35] identified α-terpineol and β-caryophyllene only in the milk of goats fed on Caatinga native high-biodiverse pasture with concentrate supplementation compared to stall-fed goats with elephant grass, hay and concentrate. The authors also reported higher amounts of acids in the milk of grazing goats. The higher quantity of acids in the pasture milk samples could be due to a higher quantity of aldehydes found in P, since the acids can also derive from the oxidation of aldehydes [52]. However, the results reported in literature on the quantity of acids in milk from animals fed with the addition of fresh fodder show a contrasting trend [36,50]. In these studies, the fresh fodder (monoculture) was fed in the stable and the animals did not graze. The amount of free fatty acids in milk does not appear to be related to the concentration of total fat in milk [36] but to a post milking lipolytic activity. Higher post-milking lipolysis activity has been reported in the milk of grazing animals compared to those fed a hay-based diet in the stable [53], which could explain the higher amounts of free fatty acids in pasture milk. These findings have led us to hypothesize a greater lipolytic activity in the milk of grazing goats.
The distinctive presence of terpene compounds in milk can be due to a directly oral or respiratory transfer from forage plants when are eaten by ruminants [46,54]. They can be also related to the botanical composition and the geographical origin of pasture. During the summer season the terpene content varied qualitatively and quantitatively in different pastures [55]. Fedele et al. [56] reported that in the summer season, goat’s milk reached a higher amount of sesquiterpenes than in the other seasons. Recently, Cifuni et al. [57] have reported that the profile of terpenes in milk varied with pasture quality and may help authenticate milk based on the animal diet. Furthermore, the high biodiversity and phenology of the pasture helped in the discrimination of milk [58]. Sesquiterpenes have only been identified in grazing goat [35] and sheep [46] milk.
3.4. Relationship between Sensory and Instrumental Data
PLSR analysis was applied to summarise the results and investigate the correlation between the odour sensory descriptors and instrumental data (volatile compounds and E-nose analysis) in the differentiation of P and S milk samples (Figure 4).
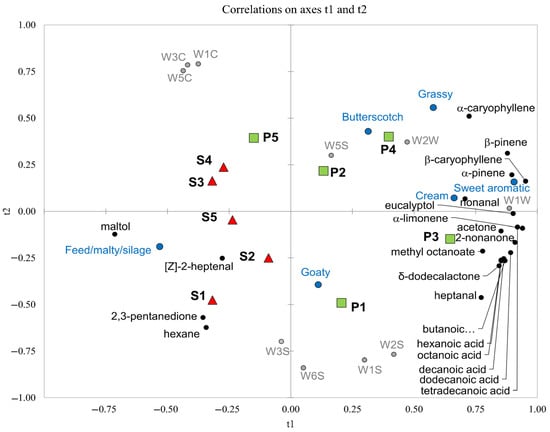
Figure 4.
PLS-loading plot (t1 vs. t2) for volatile organic compounds (black circle), E-nose sensors (grey circle) and olfactory sensory descriptors (blue circle) of Pasture goat’s milk (P; green square) and Stall goat’s milk (S; red triangle). Numbers 1 to 5 indicate the milking period (April 2021 to June 2021).
The instrumental data were selected as the X variables and the sensory response values as Y variables. The results show a good separation of the two milk (P and S) samples. Feeding the goats on pasture has given milk different odours, such as sweet aromatic, grassy, butterscotch and cream. These olfactory descriptors are well correlated to the presence of terpenes, some acids, δ-dodecalactone, 2-nonanone, methyl octanoate and heptanal and mostly agree with the odour descriptors reported in the literature for these molecules (Table 4).
S milk was positively correlated to volatile compounds such as maltol, [Z]-2-heptenal, 2,3-pentanedione and hexane, with pungent, buttery, fresh milk and caramel odours (Table 4), well correlated to the “Feed/malty/silage” odour descriptor.
The E-nose sensors that allowed discriminating P milk samples were W5S, W2W and W1W. These MOS sensors had stronger responses to the terpene compounds and are in line with the results reported by Yin et al. [59], who obtained a positive correlation of some terpenes, such as α-pinene, β-pinene and limonene, with W5S, W2W and W1W sensors, as well as the W1S and W2S sensors, which also in our study were positively correlated to P milk samples (Figure 4). Still in agreement with Yin et al. [59], the W1S and W2S sensors also had higher responses for the chemical class of free fatty acids, which are more present in P milk samples (Figure 4).
The responses of W1C, W3C and W5C sensors were relatively higher in S milk samples (Figure 4). It was indicated that W1C, W3C and W5C sensors were sensitive to hydrocarbons, aromatic compounds [60] and some ketones [59], and the S milk samples had higher amounts of volatile compounds such as hexane and 2,3-pentanedione.
4. Conclusions
In our study, E-nose has proved to be a reproducible method for routine quality control analyses by correctly authenticating milk from pasture-fed goats. Using linear discriminant analysis to process E-nose data, Pasture milk has been discriminated from Stall milk with a correct discrimination rate of 88%. Pasture milk achieved a significantly higher intensity for “grassy” and “sweet aromatic” odour descriptors and the E-nose sensors that have best discriminated these milk samples were W5S, W2W and W1W. Terpene compounds have qualitatively characterised the milk from pasture-fed goats and could be chemical markers of pasture milk. The evidence from this study implies that E-nose can be a useful and simple device for the rapid control of the genuineness of raw milk in order to protect producers and consumers of dairy products from potential fraud, especially if the production of milk must comply with a production specification. Further investigation would be recommended to better understand the link between terpene compounds and type of grazed forage crops as well as their contribution to the different response intensities of the E-nose sensors.
Author Contributions
Conceptualization, R.T.; methodology, R.T., P.I. and A.G.; formal analysis, A.B. and A.G.; investigation, A.B., P.I. and S.C.; resources, R.S.; data curation, A.B.; writing—original draft preparation, A.B.; writing—review and editing, A.B. and A.G.; visualization, A.B. and A.G.; supervision, R.S. and A.G.; project administration, R.T. and R.S.; funding acquisition, R.T. and R.S. All authors have read and agreed to the published version of the manuscript.
Funding
This work was supported by Campania Region, Italy (Project Code: PSR Campania 2014/2020, Misura 19—94250203448 “Nobili Cilentani”).
Institutional Review Board Statement
No ethical approval was required for this study since the animals were reared under actual farm conditions, and no distress, pain suffering, or lasting harm was caused to them. The animals were managed in compliance with the European requirements concerning the protection of animals used for scientific purposes (Dir. 2010/63/UE), as implemented by the Italian legislation (DL n. 26, 4 March 2014).
Informed Consent Statement
Not applicable.
Data Availability Statement
Data supporting the conclusions of this article not already presented in the tables and figures will be available from the corresponding author (A.G.) upon reasonable request.
Acknowledgments
Thanks are due to the staff of the farm “I Moresani” (Casal Velino, SA, Italy) for help with the care of the animals.
Conflicts of Interest
The authors declare no conflict of interest. The funders had no role in the design of the study; in the collection, analyses or interpretation of data; in the writing of the manuscript, or in the decision to publish the results.
References
- Hanrahan, L.; McHugh, N.; Hennessy, T.; Moran, B.; Kearney, R.; Wallace, M.; Shalloo, L. Factors associated with profitability in pasture-based systems of milk production. J. Dairy Sci. 2018, 101, 5474–5485. [Google Scholar] [CrossRef] [PubMed]
- Infascelli, L.; Tudisco, R.; Iommelli, P.; Capitanio, F. Milk quality and animal welfare as a possible marketing lever for the economic development of rural areas in southern Italy. Animals 2021, 11, 1059. [Google Scholar] [CrossRef] [PubMed]
- Alothman, M.; Hogan, S.A.; Hennessy, D.; Dillon, P.; Kilcawley, K.N.; O’Donovan, M.; Tobin, J.; Fenelon, M.A.; O’Callaghan, T.F. The “grass-fed” milk story: Understanding the impact of pasture feeding on the composition and quality of bovine milk. Foods 2019, 8, 350. [Google Scholar] [CrossRef]
- Magan, J.B.; O’Callaghan, T.F.; Kelly, A.L.; McCarthy, N.A. Compositional and functional properties of milk and dairy products derived from cows fed pasture or concentrate-based diets. Compr. Rev. Food Sci. Food Saf. 2021, 20, 2769–2800. [Google Scholar] [CrossRef] [PubMed]
- Tudisco, R.; Morittu, V.M.; Addi, L.; Moniello, G.; Grossi, M.; Musco, N.; Grazioli, R.; Mastellone, V.; Pero, M.E.; Lombardi, P. Influence of pasture on stearoyl-coa desaturase and mirna 103 expression in goat milk: Preliminary results. Animals 2019, 9, 606. [Google Scholar] [CrossRef]
- Cavaliere, G.; Trinchese, G.; Musco, N.; Infascelli, F.; De Filippo, C.; Mastellone, V.; Morittu, V.M.; Lombardi, P.; Tudisco, R.; Grossi, M. Milk from cows fed a diet with a high forage: Concentrate ratio improves inflammatory state, oxidative stress, and mitochondrial function in rats. J. Dairy Sci. 2018, 101, 1843–1851. [Google Scholar] [CrossRef]
- Crump, A.; Jenkins, K.; Bethell, E.J.; Ferris, C.P.; Arnott, G. Pasture access affects behavioral indicators of wellbeing in dairy cows. Animals 2019, 9, 902. [Google Scholar] [CrossRef]
- Rivero, M.J.; Lee, M.R.F. A perspective on animal welfare of grazing ruminants and its relationship with sustainability. Anim. Prod. Sci. 2022, 62, 1739–1748. [Google Scholar] [CrossRef]
- Musco, N.; Tudisco, R.; Grossi, M.; Mastellone, V.; Morittu, V.M.; Pero, M.E.; Wanapat, M.; Trinchese, G.; Cavaliere, G.; Mollica, M.P.; et al. Effect of a high forage: concentrate ratio on milk yield, blood parameters and oxidative status in lactating cows. Anim. Prod. Sci. 2020, 60, 1531–1538. [Google Scholar] [CrossRef]
- Mastellone, V.; Musco, N.; Infascelli, F.; Scandurra, A.; D’Aniello, B.; Pero, M.E.; Iommelli, P.; Tudisco, R.; Lombardi, P. Higher forage: Concentrate ratio and space availability may favor positive behaviors in dairy cows. J. Vet. Behav. 2022, 51, 16–22. [Google Scholar] [CrossRef]
- Dumont, B.; Groot, J.; Tichit, M. Make ruminants green again–how can sustainable intensification and agroecology converge for a better future? Animal 2018, 12, s210–s219. [Google Scholar] [CrossRef] [PubMed]
- Schader, C.; Muller, A.; Scialabba, N.E.-H.; Hecht, J.; Isensee, A.; Erb, K.-H.; Smith, P.; Makkar, H.P.; Klocke, P.; Leiber, F. Impacts of feeding less food-competing feedstuffs to livestock on global food system sustainability. J. R. Soc. Interface 2015, 12, 20150891. [Google Scholar] [CrossRef] [PubMed]
- Noble Method Disciplinary. Disciplinare e Regolamento del Metodo Nobile. Available online: https://www.metodonobile.com/sito/wp-content/uploads/2019/10/Disciplinare-e-Regolamento.pdf (accessed on 1 April 2022).
- Renna, M.; Ravetto Enri, S.; Probo, M.; Lussiana, C.; Cornale, P.; Bellio, A.; Astegiano, S.; Decastelli, L.; Battaglini, L.M.; Lombardi, G. Production regulations and characteristics of cow Piedmontese Noble Milk. In Proceedings of the 21th ASPA Congress, Milano, Italy, 9–12 June 2015; p. 33. [Google Scholar]
- Lombardi, G.; Peira, G.; Cortese, D. Strategie per la Valorizzazione Commerciale del Latte Nobile piemontese; Edizioni Disafa: Torino, Italy, 2016; 174p, ISBN 978-88-99108-05-2. [Google Scholar]
- Cabiddu, A.; Delgadillo-Puga, C.; Decandia, M.; Molle, G. Extensive ruminant production systems and milk quality with emphasis on unsaturated fatty acids, volatile compounds, antioxidant protection degree and phenol content. Animals 2019, 9, 771. [Google Scholar] [CrossRef] [PubMed]
- Mu, F.; Gu, Y.; Zhang, J.; Zhang, L. Milk source identification and milk quality estimation using an electronic nose and machine learning techniques. Sensors 2020, 20, 4238. [Google Scholar] [CrossRef] [PubMed]
- Wojtasik-Kalinowska, I.; Marcinkowska-Lesiak, M.; Onopiuk, A.; Stelmasiak, A.; Szpicer, A.; Holc, D.; Wierzbicka, A.; Poltorak, A. Geese fillets flavor stability and quality characteristics at different stages of sous-vide cooking. Anim. Sci. Pap. Rep. 2021, 39, 419–435. [Google Scholar]
- Wojtasik-Kalinowska, I.; Guzek, D.; Górska-Horczyczak, E.; Głąbska, D.; Brodowska, M.; Sun, D.-W.; Wierzbicka, A. Volatile compounds and fatty acids profile in Longissimus dorsi muscle from pigs fed with feed containing bioactive components. LWT-Food Sci. Technol. 2016, 67, 112–117. [Google Scholar] [CrossRef]
- Xiao, Z.; Yu, D.; Niu, Y.; Chen, F.; Song, S.; Zhu, J.; Zhu, G. Characterization of aroma compounds of Chinese famous liquors by gas chromatography–mass spectrometry and flash GC electronic-nose. J. Chromatogr. B 2014, 945, 92–100. [Google Scholar] [CrossRef]
- Zhang, H.; Wang, J.; Ye, S.; Chang, M. Application of electronic nose and statistical analysis to predict quality indices of peach. Food Bioprocess Technol. 2012, 5, 65–72. [Google Scholar] [CrossRef]
- Yakubu, H.G.; Kovacs, Z.; Toth, T.; Bazar, G. Trends in artificial aroma sensing by means of electronic nose technologies to advance dairy production–a review. Crit. Rev. Food Sci. Nutr. 2021, 63, 234–248. [Google Scholar] [CrossRef]
- Carrillo-Gómez, J.K.; Acevedo, C.M.D.; García-Rico, R.O. Detection of the bacteria concentration level in pasteurized milk by using two different artificial multisensory methods. Sens. Bio-Sens. Res 2021, 33, 100428. [Google Scholar] [CrossRef]
- Phukkaphan, N.; Eamsa-ard, T.; Chairanit, C.; Kerdcharoen, T. The Application of Gas Sensor Array based Electronic Nose for Milk Spoilage Detection. In Proceedings of the 2021 7th International Conference on Engineering, Applied Sciences and Technology (ICEAST), Pattaya, Thailand, 1–3 April 2021; pp. 273–276. [Google Scholar]
- Tohidi, M.; Ghasemi-Varnamkhasti, M.; Ghafarinia, V.; Bonyadian, M.; Mohtasebi, S.S. Development of a metal oxide semiconductor-based artificial nose as a fast, reliable and non-expensive analytical technique for aroma profiling of milk adulteration. Int. Dairy J. 2018, 77, 38–46. [Google Scholar] [CrossRef]
- Tohidi, M.; Ghasemi-Varnamkhasti, M.; Ghafarinia, V.; Mohtasebi, S.S.; Bonyadian, M. Identification of trace amounts of detergent powder in raw milk using a customized low-cost artificial olfactory system: A novel method. Measurement 2018, 124, 120–129. [Google Scholar] [CrossRef]
- Falchero, L.; Sala, G.; Gorlier, A.; Lombardi, G.; Lonati, M.; Masoero, G. Electronic Nose analysis of milk from cows grazing on two different Alpine vegetation types. J. Dairy Res. 2009, 76, 365–371. [Google Scholar] [CrossRef]
- Yang, C.; Ding, W.; Ma, L.; Jia, R. Discrimination and characterization of different intensities of goaty flavor in goat milk by means of an electronic nose. J. Dairy Sci. 2015, 98, 55–67. [Google Scholar] [CrossRef] [PubMed]
- De Santis, D.; Giacinti, G.; Chemello, G.; Frangipane, M.T. Improvement of the sensory characteristics of goat milk yogurt. J. Food Sci. 2019, 84, 2289–2296. [Google Scholar] [CrossRef] [PubMed]
- Schiano, A.; Harwood, W.; Drake, M. A 100-year review: Sensory analysis of milk. J. Dairy Sci. 2017, 100, 9966–9986. [Google Scholar] [CrossRef]
- Genovese, A.; Marrazzo, A.; De Luca, L.; Romano, R.; Manzo, N.; Masucci, F.; Di Francia, A.; Sacchi, R. Volatile organic compound and fatty acid profile of milk from cows and buffaloes fed mycorrhizal or nonmycorrhizal ensiled forage. Molecules 2019, 24, 1616. [Google Scholar] [CrossRef]
- Delgado, F.J.; González-Crespo, J.; Cava, R.; García-Parra, J.; Ramírez, R. Characterisation by SPME–GC–MS of the volatile profile of a Spanish soft cheese PDO Torta del Casar during ripening. Food Chem. 2010, 118, 182–189. [Google Scholar] [CrossRef]
- Fedele, V.; Rubino, R.; Claps, S.; Sepe, L.; Morone, G. Seasonal evolution of volatile compounds content and aromatic profile in milk and cheese from grazing goat. Small Rumin. Res. 2005, 59, 273–279. [Google Scholar] [CrossRef]
- Bergamaschi, M.; Aprea, E.; Betta, E.; Biasioli, F.; Cipolat-Gotet, C.; Cecchinato, A.; Bittante, G.; Gasperi, F. Effects of dairy system, herd within dairy system, and individual cow characteristics on the volatile organic compound profile of ripened model cheeses. J. Dairy Sci. 2015, 98, 2183–2196. [Google Scholar] [CrossRef]
- Sant’Ana, A.M.; Bessa, R.J.; Alves, S.P.; Medeiros, A.N.; Costa, R.G.; de Sousa, Y.R.; Bezerril, F.F.; Batista, A.S.M.; Madruga, M.S.; Queiroga, R.C. Fatty acid, volatile and sensory profiles of milk and cheese from goats raised on native semiarid pasture or in confinement. Int. Dairy J 2019, 91, 147–154. [Google Scholar] [CrossRef]
- Villeneuve, M.-P.; Lebeuf, Y.; Gervais, R.; Tremblay, G.; Vuillemard, J.; Fortin, J.; Chouinard, P. Milk volatile organic compounds and fatty acid profile in cows fed timothy as hay, pasture, or silage. J. Dairy Sci. 2013, 96, 7181–7194. [Google Scholar] [CrossRef] [PubMed]
- Clarke, H.J.; Griffin, C.; Rai, D.K.; O’Callaghan, T.F.; O’Sullivan, M.G.; Kerry, J.P.; Kilcawley, K.N. Dietary compounds influencing the sensorial, volatile and phytochemical properties of bovine milk. Molecules 2019, 25, 26. [Google Scholar] [CrossRef] [PubMed]
- Croissant, A.E.; Washburn, S.; Dean, L.; Drake, M. Chemical properties and consumer perception of fluid milk from conventional and pasture-based production systems. J. Dairy Sci. 2007, 90, 4942–4953. [Google Scholar] [CrossRef] [PubMed]
- Shipe, W.; Ledford, R.; Peterson, R.; Scanlan, R.; Geerken, H.; Dougherty, R.; Morgan, M. Physiological mechanisms involved in transmitting flavors and odors to milk. II. Transmission of some flavor components of silage. J. Dairy Sci. 1962, 45, 477–480. [Google Scholar] [CrossRef]
- Manzocchi, E.; Martin, B.; Bord, C.; Verdier-Metz, I.; Bouchon, M.; De Marchi, M.; Constant, I.; Giller, K.; Kreuzer, M.; Berard, J. Feeding cows with hay, silage, or fresh herbage on pasture or indoors affects sensory properties and chemical composition of milk and cheese. J. Dairy Sci. 2021, 104, 5285–5302. [Google Scholar] [CrossRef] [PubMed]
- Watkins, P.J.; Jaborek, J.R.; Teng, F.; Day, L.; Castada, H.Z.; Baringer, S.; Wick, M. Branched chain fatty acids in the flavour of sheep and goat milk and meat: A review. Small Rumin. Res. 2021, 200, 106398. [Google Scholar] [CrossRef]
- Bendall, J.G. Aroma compounds of fresh milk from New Zealand cows fed different diets. J. Agric. Food Chem. 2001, 49, 4825–4832. [Google Scholar] [CrossRef]
- Clarke, H.J.; Fitzpatrick, E.; Hennessy, D.; O’Sullivan, M.G.; Kerry, J.P.; Kilcawley, K.N. The Influence of Pasture and Non-pasture-Based Feeding Systems on the Aroma of Raw Bovine Milk. Front. Nutr. 2022, 9, 841454. [Google Scholar] [CrossRef]
- Cornu, A.; Rabiau, N.; Kondjoyan, N.; Verdier-Metz, I.; Pradel, P.; Tournayre, P.; Berdagué, J.-L.; Martin, B. Odour-active compound profiles in Cantal-type cheese: Effect of cow diet, milk pasteurization and cheese ripening. Int. Dairy J. 2009, 19, 588–594. [Google Scholar] [CrossRef]
- Siefarth, C.; Buettner, A. The aroma of goat milk: Seasonal effects and changes through heat treatment. J. Agric. Food Chem. 2014, 62, 11805–11817. [Google Scholar] [CrossRef] [PubMed]
- Moio, L.; Rillo, L.; Ledda, A.; Addeo, F. Odorous constituents of ovine milk in relationship to diet. J. Dairy Sci. 1996, 79, 1322–1331. [Google Scholar] [CrossRef] [PubMed]
- Tian, H.; Sun, X.; Yu, H.; Ai, L.; Chen, C. Characterization of the key aroma compounds in Yunnan goat milk cake using a sensory-directed flavor analysis. J. Food Sci. 2020, 85, 3981–3997. [Google Scholar] [CrossRef] [PubMed]
- Karagül-Yüceer, Y.; Drake, M.; Cadwallader, K.R. Aroma-active components of nonfat dry milk. J. Agric. Food Chem. 2001, 49, 2948–2953. [Google Scholar] [CrossRef]
- Natrella, G.; Gambacorta, G.; De Palo, P.; Maggiolino, A.; Faccia, M. Volatile organic compounds in milk and mozzarella: Comparison between two different farming systems. Int. J. Food Sci. Technol. 2020, 55, 3403–3411. [Google Scholar] [CrossRef]
- Sacchi, R.; Marrazzo, A.; Masucci, F.; Di Francia, A.; Serrapica, F.; Genovese, A. Effects of inclusion of fresh forage in the diet for lactating buffaloes on volatile organic compounds of milk and mozzarella cheese. Molecules 2020, 25, 1332. [Google Scholar] [CrossRef]
- Kalač, P. The effects of silage feeding on some sensory and health attributes of cow’s milk: A review. Food Chem. 2011, 125, 307–317. [Google Scholar] [CrossRef]
- Curioni, P.; Bosset, J. Key odorants in various cheese types as determined by gas chromatography-olfactometry. Int. Dairy J. 2002, 12, 959–984. [Google Scholar] [CrossRef]
- Ferlay, A.; Martin, B.; Pradel, P.; Coulon, J.B.; Chilliard, Y. Influence of grass-based diets on milk fatty acid composition and milk lipolytic system in Tarentaise and Montbéliarde cow breeds. J. Dairy Sci. 2006, 89, 4026–4041. [Google Scholar] [CrossRef]
- Székelyhidi, R.; Lakatos, E.H.; Ajtony, Z. Application of the SPME technique for determinate the quality indicators of dairy products. Elelmvizsg. Kozl. 2020, 66, 3194. [Google Scholar]
- Peiretti, P.G.; Tassone, S.; Vahdani, N.; Battelli, G.; Gai, F. Evaluation of the Nutritive Value and the Fatty Acid, Phenol, Tannin and Terpenoid Contents of Nine Pastures in an Alpine District during the Summer Season. Agriculture 2020, 10, 42. [Google Scholar] [CrossRef]
- Fedele, V.; Claps, S.; Rubino, R.; Sepe, L.; Cifuni, G. Variation in terpene content and profile in milk in relation to the dominant plants in the diet of grazing goats. S. Afr. J. Anim. Sci. 2004, 34, 145–147. [Google Scholar]
- Cifuni, G.F.; Claps, S.; Signorelli, F.; Di Francia, A.; Di Napoli, M.A. Fatty acid and terpenoid profile: A signature of mountain milk. Int. Dairy J. 2022, 127, 105301. [Google Scholar] [CrossRef]
- Coppa, M.; Martin, B.; Pradel, P.; Leotta, B.; Priolo, A.; Vasta, V. Effect of a hay-based diet or different upland grazing systems on milk volatile compounds. J. Agric. Food Chem. 2011, 59, 4947–4954. [Google Scholar] [CrossRef] [PubMed]
- Yin, X.; Wen, R.; Sun, F.; Wang, Y.; Kong, B.; Chen, Q. Collaborative analysis on differences in volatile compounds of Harbin red sausages smoked with different types of woodchips based on gas chromatography–mass spectrometry combined with electronic nose. LWT 2021, 143, 111144. [Google Scholar] [CrossRef]
- Shi, J.; Nian, Y.; Da, D.; Xu, X.; Zhou, G.; Zhao, D.; Li, C. Characterization of flavor volatile compounds in sauce spareribs by gas chromatography–mass spectrometry and electronic nose. LWT 2020, 124, 109182. [Google Scholar] [CrossRef]


Disclaimer/Publisher’s Note: The statements, opinions and data contained in all publications are solely those of the individual author(s) and contributor(s) and not of MDPI and/or the editor(s). MDPI and/or the editor(s) disclaim responsibility for any injury to people or property resulting from any ideas, methods, instructions or products referred to in the content. |
© 2023 by the authors. Licensee MDPI, Basel, Switzerland. This article is an open access article distributed under the terms and conditions of the Creative Commons Attribution (CC BY) license (https://creativecommons.org/licenses/by/4.0/).