Article

A Simple Method to Convert Cellular Polymers into Auxetic Metamaterials

1
Department of Chemical Engineering, Laval University, Quebec, QC G1V 0A6, Canada
2
Advanced Materials & Energy Section, Defence R&D Canada—Atlantic Research Centre, Dartmouth, NS B2Y 3Z72, Canada
*
Author to whom correspondence should be addressed.
Appl. Sci. 2023, 13(2), 1148; https://doi.org/10.3390/app13021148
Submission received: 10 December 2022 / Revised: 22 December 2022 / Accepted: 10 January 2023 / Published: 14 January 2023
(This article belongs to the Special Issue Selected Papers in the Section Materials 2022)

Abstract

:
The objective of this study was to present a simple and environmentally friendly process combining low pressure (vacuum) and mechanical compression to convert low-density polyethylene (LDPE) foams into low-density foams (76–125 kg/m3) with negative tensile and compressive Poisson’s ratios (NPR). As a first step, four series of recycled LDPE foams (electronics packaging) with starting densities of 16, 21, 30 and 36 kg/m3 were used to determine the effect of different processing conditions including temperature and pressure. Based on the optimized conditions, the tensile and compressive Poisson ratios of the resulting auxetic foams reached −2.89 and −0.66, while the tensile and compressive modulus of the auxetic foams reached 40 kPa and 2.55 kPa, respectively. The foam structure of the samples was characterized via morphological analysis and was related to the mechanical properties before and after the treatment (i.e., foams with positive and negative Poisson’s ratios). The tensile and compressive properties (Young’s modulus, strain energy, energy dissipation and damping capacity) for these auxetic foams were also discussed and were shown to be highly improved. These auxetic foams can be applied in sports and military protective equipment. To the best of our knowledge, there is only one report on vacuum being used for the production of auxetic foams.

1. Introduction

Expanded polyethylene is frequently used for the packaging of sensitive products such as glassware and electronics [1,2]. Polyethylene (PE) foams contain a high number of small cells that can deform and produce highly absorbing materials. Due to their low density (high porosity), they occupy large volumes and are mostly gas-filled cells separated by thin walls of polymer. Although they are very efficient packaging materials, they generate large volumes of waste at their end-of-life, which is an important problem when it comes to their handling, storage, transport and disposal [3]. This waste leads to pollution/environmental issues if not carefully collected and recycled. PE foams are water- and moisture-resistant, so they are not biodegradable/compostable. Furthermore, conventional disposal methods, such as landfilling or burning, are no longer acceptable under the concept of a circular economy. They contribute to environmental problems, as PE does not breakdown in landfill, while burning contributes to carbon emissions. PE has good thermal stability/resistance, enabling it to maintain its chemical structure, and since most PE foams are un-crosslinked thermoplastics, they can be mechanically recycled (remelted and reshaped) numerous times into different geometries. Another option for PE is to directly reuse the PE foams and generate added value [4,5]. This can be achieved by modifying the structure/morphology of these foams. In our previous work, preliminary results were presented showing the application of a thermo-mechanical treatment to LDPE foams, yielding auxetic foams [6].
Auxetic foams are materials with a negative Poisson ratio; they expand laterally under elongation and conversely contract under compression. These metamaterials can be produced by converting a standard PE foam structure (honeycomb/polyhedral shaped cells) into a re-entrant cellular structure. In the past, different post-fabrication treatments were proposed including mechanical, thermal, physical and chemical treatments, which were performed alone or in combination [7,8,9,10,11,12]. The success of these methods depended mostly on whether the foam was of an open- or closed-cell structure. For open cells, the main methods combined mechanical compression with thermal treatments. The mechanical compression was either uniaxial [7], biaxial [7,8] or triaxial [9,10], but the half-mold process [11] is similar. Although several methods have been proposed in the literature, very few polymers have been investigated. Most of the work has explored polyether urethane foam (PU) with the exception of Lakes et al. [9] who used polyester (PES) foams. In all cases, a limited range of negative Poisson’s ratios was obtained (−0.2 to −1.0).
Alderson et al. [7] reported on thin auxetic flat and curved sheets via uniaxial compression at 150 °C. The flat foam sheets had an NPR of −0.3, while the curved foams had values down to −3 at 1% strain (multilayer foams). Bianchi et al. [11,12,13] used multiaxial compression for conventional PU foam (open-cell) and heating of the compressed specimens above the polymer matrix softening point. The samples were made at different temperatures (135 and 150 °C) and compression ratios (1.7–6.5) and with different cooling methods (water or room-temperature exposure) [12,13,14,15,16,17,18,19,20,21]. The minimum NPR reached was −1.3 for a density of 27 kg/m3 [11]. The authors also observed that removing the foam from the mold immediately after heating created a different microstructure between the internal and external parts; a lower density core with a rigid skin was obtained. This behavior was a result of a temperature profile inside the sample, as the external region, in contact with the mold walls, was at a higher temperature than the interior. Therefore, the samples only produced an NPR of −0.34 under compression [14]. Recently, Zhang et al. [15,16,17] used open-cell PU foams to convert into auxetic foams. This was conducted by using an open mold and a single-direction (uniaxial) thermoforming compression (density of 27 kg/m3) [15]. The mechanical tests showed an auxetic behavior with an NPR from −1 to 0 with a slope of the stress–strain curve (tangent modulus) between 0.2 to 2 MPa when the volumetric compression ranged from 40% to 80%. In a second study, they proposed another conversion method, also using a PU foam of 28 kg/m3. This was achieved via vacuum bags in an autoclave after thermoforming at 148 °C [16]. The final foams were transversely isotropic, showing deformed semi-reticulated configurations. The NPR of the auxetic foams reached −1.3 (at 0.03 of tensile strain) for the thinner specimens (5 mm). The authors reported that the low thickness and high tensile strain reduced the rigidity but improved the auxetic behavior of these cellular materials. Unfortunately, anisotropy inside the pristine foam seemed to have an important effect on the final performances of these auxetic materials. Finally, three series of auxetic foams that were uniaxially deformed in three directions were investigated by Zhang et al. [17]. The results showed that different mechanical performances and auxetic behaviors were observed due to the anisotropy of the original foam, i.e., the final properties were a function of the initial state.
Some publications reporting the conversion of closed-cell PE foams into NPR foams were found [18,19,20,21]. Martz et al. [18] explored two polymer foams with three types of closed-cell structures: polymethacrylimide (PMI) (52, 205 and 301 kg/m3) sold under the tradename Rohacell® and Ethafoam® low-density polyethylene (LDPE) (59, 109 and 158 kg/m3). The LDPE produced a re-entrant geometry leading to NPR, while the PMI did not. Furthermore, only the lowest density (59 kg/m3) LDPE foam was successfully converted. The pressure method was performed at 110 °C and 662 kPa, leading to an NPR between −2.5 ± 1.5 (note the large error bars), while for vacuum with heating, only the 59 kg/m3 LDPE showed an auxetic behavior with an NPR of −0.5 ± 0.5 under −82 kPa and 86 °C for small deformation (8% strain). Fan et al. [19] produced auxetic foams by a steam (water vapor) method at 1 atm with closed-cell polyethylene foams with different initial densities (20, 30 and 45 expansion ratios, which is the ratio between the matrix density and the final foam density). After 6 h at 100 °C, the cells were deformed inwards and cell-wall bending led to a re-entrant structure. The minimum NPR values under tension were −0.278, −0.439 and −0.487 for the 20, 30 and 45 expansion ratios, respectively. Under compression, the minimum NPR values of the specimens were only −0.026, −0.090 and −0.118 at 20, 30 and 45 expansion ratios, respectively. The Poisson ratio was also found to increase with deformation under tensile and compressive stresses [19].
Duncan et al. reported on the preparation of auxetic foams via steam (water vapor) treatment [20] and a pressure-vessel method (vacuum) [21]. The original foam was a closed-cell LDPE (low-density polyethylene) foam of 60 kg/m3. For the steam treatment, NPR values as low as −0.3 in tension and −1.1 in compression were obtained, while the value of Young’s modulus in tension was improved (between 2 and 6 MPa). For the vacuum method, Poisson’s ratios down to −0.2 and Young’s modulus up to 1.2 MPa were reported.
Fan et al. prepared auxetic foams directly from polypropylene [22] and a nylon elastomer (NE) [23] by a single-step process using CO2. The polypropylene and polyamide (nylon) elastomer (NE) auxetic foams had NPR values of −0.46 and −1.29, respectively.
As for any mechanical properties of viscoelastic materials, the effect of the strain rate is also important when reporting the properties. Duncan et al. [24] discussed the influence of the compressive strain rate (0.005 and 200 s−1) on auxetic foams based on PU open-foam and LDPE closed-cell foams produced via thermo-mechanical compaction in three orthogonal directions. The minimum NPR values ranged from −0.4 (at 0.005 s−1) to −0.3 (at 200 s−1) for the open-cell foams, while a narrower range of −0.1 (at 0.005 s−1) to −0.05 (at 200 s−1) was observed for the closed-cell foams at a 2% compressive strain. However, the values of Young’s modulus increased by almost 100% (between 1 MPa and 1.8 MPa).
In our previous work, a combination of solvent (ethanol) evaporation–condensation and mechanical compression (SECC) led to foams with negative Poisson’s ratios (NPR) in tension [6]. Different series based on recycled LDPE foams (16, 21 and 36 kg/m3) were optimized using a range of time, temperature and pressure. Based on the samples prepared, the minimum NPR values obtained were −3.5, −2.6 and −1.5 for D16, D21 and D36, respectively. The results also showed that ethanol was better than water as the solvent in this technique due to its higher volatility [6,25].
In the current work, a method for the fabrication of auxetic foams based on recycled LDPE foams was presented. The method was based on vacuum combined with mechanical compression (VMC). The main advantage over the previous SECC method was that no solvent was used, leading to a simpler and greener method by eliminating the need to add and recycle the solvent. The mechanisms to convert the conventional PE foams into NPR materials were discussed, especially in terms of the vacuum level and mechanical stress (weight) imposed on the sample during conversion. For the samples produced, the NPR value was reported for both tensile and compressive deformations. Finally, the foam morphologies were reported and related to the mechanical behavior measured.

2. Experimental

2.1. Materials

Four materials based on recycled LDPE (rLDPE) were used as per our previous study [6]. The foams selected had initial densities of 16 kg/m3 (D16), 21 kg/m3 (D21), 30 kg/m3 (D30) and 36 kg/m3 (D36). A vacuum oven (Cole-Parmer OVV-400-24-120 Programmable Vacuum Oven, 24 L, Laval, QC, Canada) was used in this work.

2.2. Methods

Each material was cut into samples of dimensions of 10 × 10 × 5.0 cm3 with a doctor blade. Each sample was placed in a vacuum oven along with a metal block with a pre-planned weight (1020–2040 g) and heated from room temperature to 100–105 °C for about 1 h. This temperature was above the softening temperature of LDPE but below its melting temperature. The oven was then placed under vacuum (maximum –0.88 bar) for 3 h at 100 °C before returning the oven to ambient pressure. The oven was opened, and a metal block was placed on top of the sample (applying a mechanical pressure of 1.0–2.1 kPa). The oven door was closed, and the sample was cooled for 1–2 h, thus generating PE auxetic foams [6]. Figure 1A presents the mechanism generating a re-entrant structure from a polygonal morphology by vacuum with mechanical compression, while Figure 1B presents the oven temperature, sample temperature and oven vacuum profile as a function of time after optimization [6].
During the VMC process, volume expansion occurred due to the elevated temperature (100 °C) and the application of the vacuum. This was because the PE samples were soft, and the pressure inside the closed cells was still at ambient pressure, while the pressure outside the cells was reduced (this was similar to blowing up a balloon). When left under vacuum for 3 h, the pressure inside the cells was allowed to reach an equilibrium with the outside of the cell, but the volume of the foam did not change. As the oven was brought back to ambient pressure, the air pressure outside the foam cells was higher than that within the cells. The increased pressure compressed the foam, causing the sample to shrink quickly. The cell wall then collapsed, producing a re-entrant morphology. By adding a weight to the sample, additional pressure was applied over and above that of the ambient pressure, leading to further shrinkage and cell-wall collapse. Once the sample was cooled down to room temperature, the new cell structure was locked in place.

2.3. Characterization

2.3.1. Initial LDPE Foams

The foam density (ρf) was obtained as its weight (Wf) divided by its volume (Vf, calculated from measuring the length, width and thickness of the samples). Each dimension was measured at 4 places and averaged to obtain:
ρ f = W f V f
Porosity was calculated as:
P = ρ l ρ f ρ l ρ a   ( 100 % )  
where ρa and ρl are the density of air (1.225 kg/m3) and solid matrix (918 kg/m3), respectively.
The solid (PE) volume (Vl) was calculated as:
V l = ρ f ρ a ρ l ρ a   V f  
while the gas phase (air) was calculated as:
V a = P   V f
The open-cell percentage (OCP) was determined by completely immersing the foam in an ethanol bath overnight so that the foam absorbed the ethanol into the open cells. The volume of ethanol was determined using the weight gained in ethanol (We), the density of ethanol (ρe = 789 kg/m3) and the mass of the solid polymer in the foam (Vl ρl):
V e = W e V l   ρ l ρ e
and
O C P = V e V a   ( 100 % )

2.3.2. Foam Structure

The cellular structure was analyzed with a VHX-7000 (Keyence, Mississauga, ON, Canada) microscope. Images were analyzed via Image J (National Institutes of HealthNIH, Washington, DC, USA) to determine the cell diameters.

2.3.3. Differential Scanning Calorimetry

DSC was performed on a DSC 7 (Perkin Elmer) and using the Pyris 1 software. Samples around 3–8 mg were used, and the temperature rate was fixed at 10 °C/min between 50 °C and 200 °C before cooling to 50 °C and heating to 200 °C again. A constant rate (20 mL/min) of dry nitrogen was applied.

2.3.4. Poisson’s Ratio

The Poisson ratio was obtained via testing (1.2 mm/min) on a dynamic mechanical analyzer (DMA) RSA III (TA Instruments, New Jersey, USA). The deformation was also followed by a high-resolution FDR-AX53 video camera (SONY, Tokyo, Japan) from two perpendicular directions. Image J was again used to analyze the images after spatial calibration. The Poisson ratio (ʋ) was calculated as the negative ratio between the transverse (εy or εz) and the axial (εx) deformations as [25,26]:
v = d ε y d ε x   o r d ε z d ε x

2.3.5. Mechanical Properties

Engineering stress–strain curves were obtained from the force-displacement curves combined with sample dimensions. Quasi-static tests were conducted with an RSA III (TA Instruments, New Castle, DE, USA). From the preliminary tests, a deformation rate of 1.2 mm/min was selected for both tension and compression. The moduli were calculated form the slope of the linear part of the stress–strain curves (below 5% deformation). The same experimental set-up was used for the hysteresis loops by imposing a strain between 0.1 and 3% (up-and-down) at a frequency of 1 rad/s. The maximum potential energy (Ep), which is the total strain energy in a cycle, was calculated as the area below the curve as shown in [27]:
E p = 0 ε m a x σ   d ε
To determine the dissipated energy (Ed), the energy loss, which is the work of the internal forces upon a full cycle of variable load, was calculated as the area enclosed by the hysteresis loop for one cycle in a stress (σ)–strain (Ɛ) plot. Data are reported by unit of sample volume as [27,28]:
E d = ε m i n ε m a x σ   d ε
The damping capacity measures the capacity to dissipate elastic energy during mechanical vibration or wave propagation. The ratio between the energy loss over the total strain energy in a cycle was determined, and the relative damping value (Ψ) was calculated as [29]:
Ψ = E d E p   ( 100 % )

3. Results and Discussion

3.1. Properties of the LDPE

The initial foams were analyzed in terms of their pore diameters, foam density, foam porosity and OCP, which are summarized in Table 1. The initial foam densities were determined as 15.5 (D26), 20.9 (D21), 29.7 (D30) and 35.5 kg/m3 (D36). The average cell sizes (diameters) were 752, 1107, 1209 and 694 µm, respectively, leading to a decreasing porosity (between 98.4% and 96.2%) and leading to a higher foam density. Sample D21 had the highest OCP (12.3%), while values of 7.3, 8.3 and 6.3% were measured for D16, D30 and D36, respectively. These results implied that the samples were of a closed-cell structure. Finally, D21 had a higher OCP and larger pore sizes. This had a direct effect on the processing (conversion to auxetic foam).
The nomenclature for the samples reported in Table 1 starts with “PE” for the foam (LDPE), where Dx is the initial foam density (kg/m3) and Px is the mechanical pressure (kPa). Based on our preliminary work [5], the treatment (vacuum) time was fixed at 3 h for all the samples. The temperature was fixed at 100 °C except for the two samples prepared at 105 °C for comparison. Hence, the sample PE-D16-P1.2 represents a foam with an original density of 16 kg/m3 treated with a mechanical pressure of 1.2 kPa at 100 °C and the maximum vacuum (−0.88 bar) for 3 h, while PE-D16-O is the initial LDPE foam (neat sample) with an original density of 16 kg/m3.
The densities of the auxetic foams PE-D16-P1.5, PE-D21-P1.6, PE-D30-P1.5 and PE-D36-P1.5 were 120, 98.9, 87.3 and 90.3 kg/m3, respectively, so the density increased by 7.5, 4.2, 3.8 and 2.5 kg/m3 compared to the original D16, D21, D30 and D36 foams. This led to a decreased porosity and an increased percentage of open cells, especially for the samples based on D16, from 7.3% to 43.8%. This also indicated that the conversion broke several cell walls to produce a re-entrant structure, which had an influence on the mechanical properties, as described later.
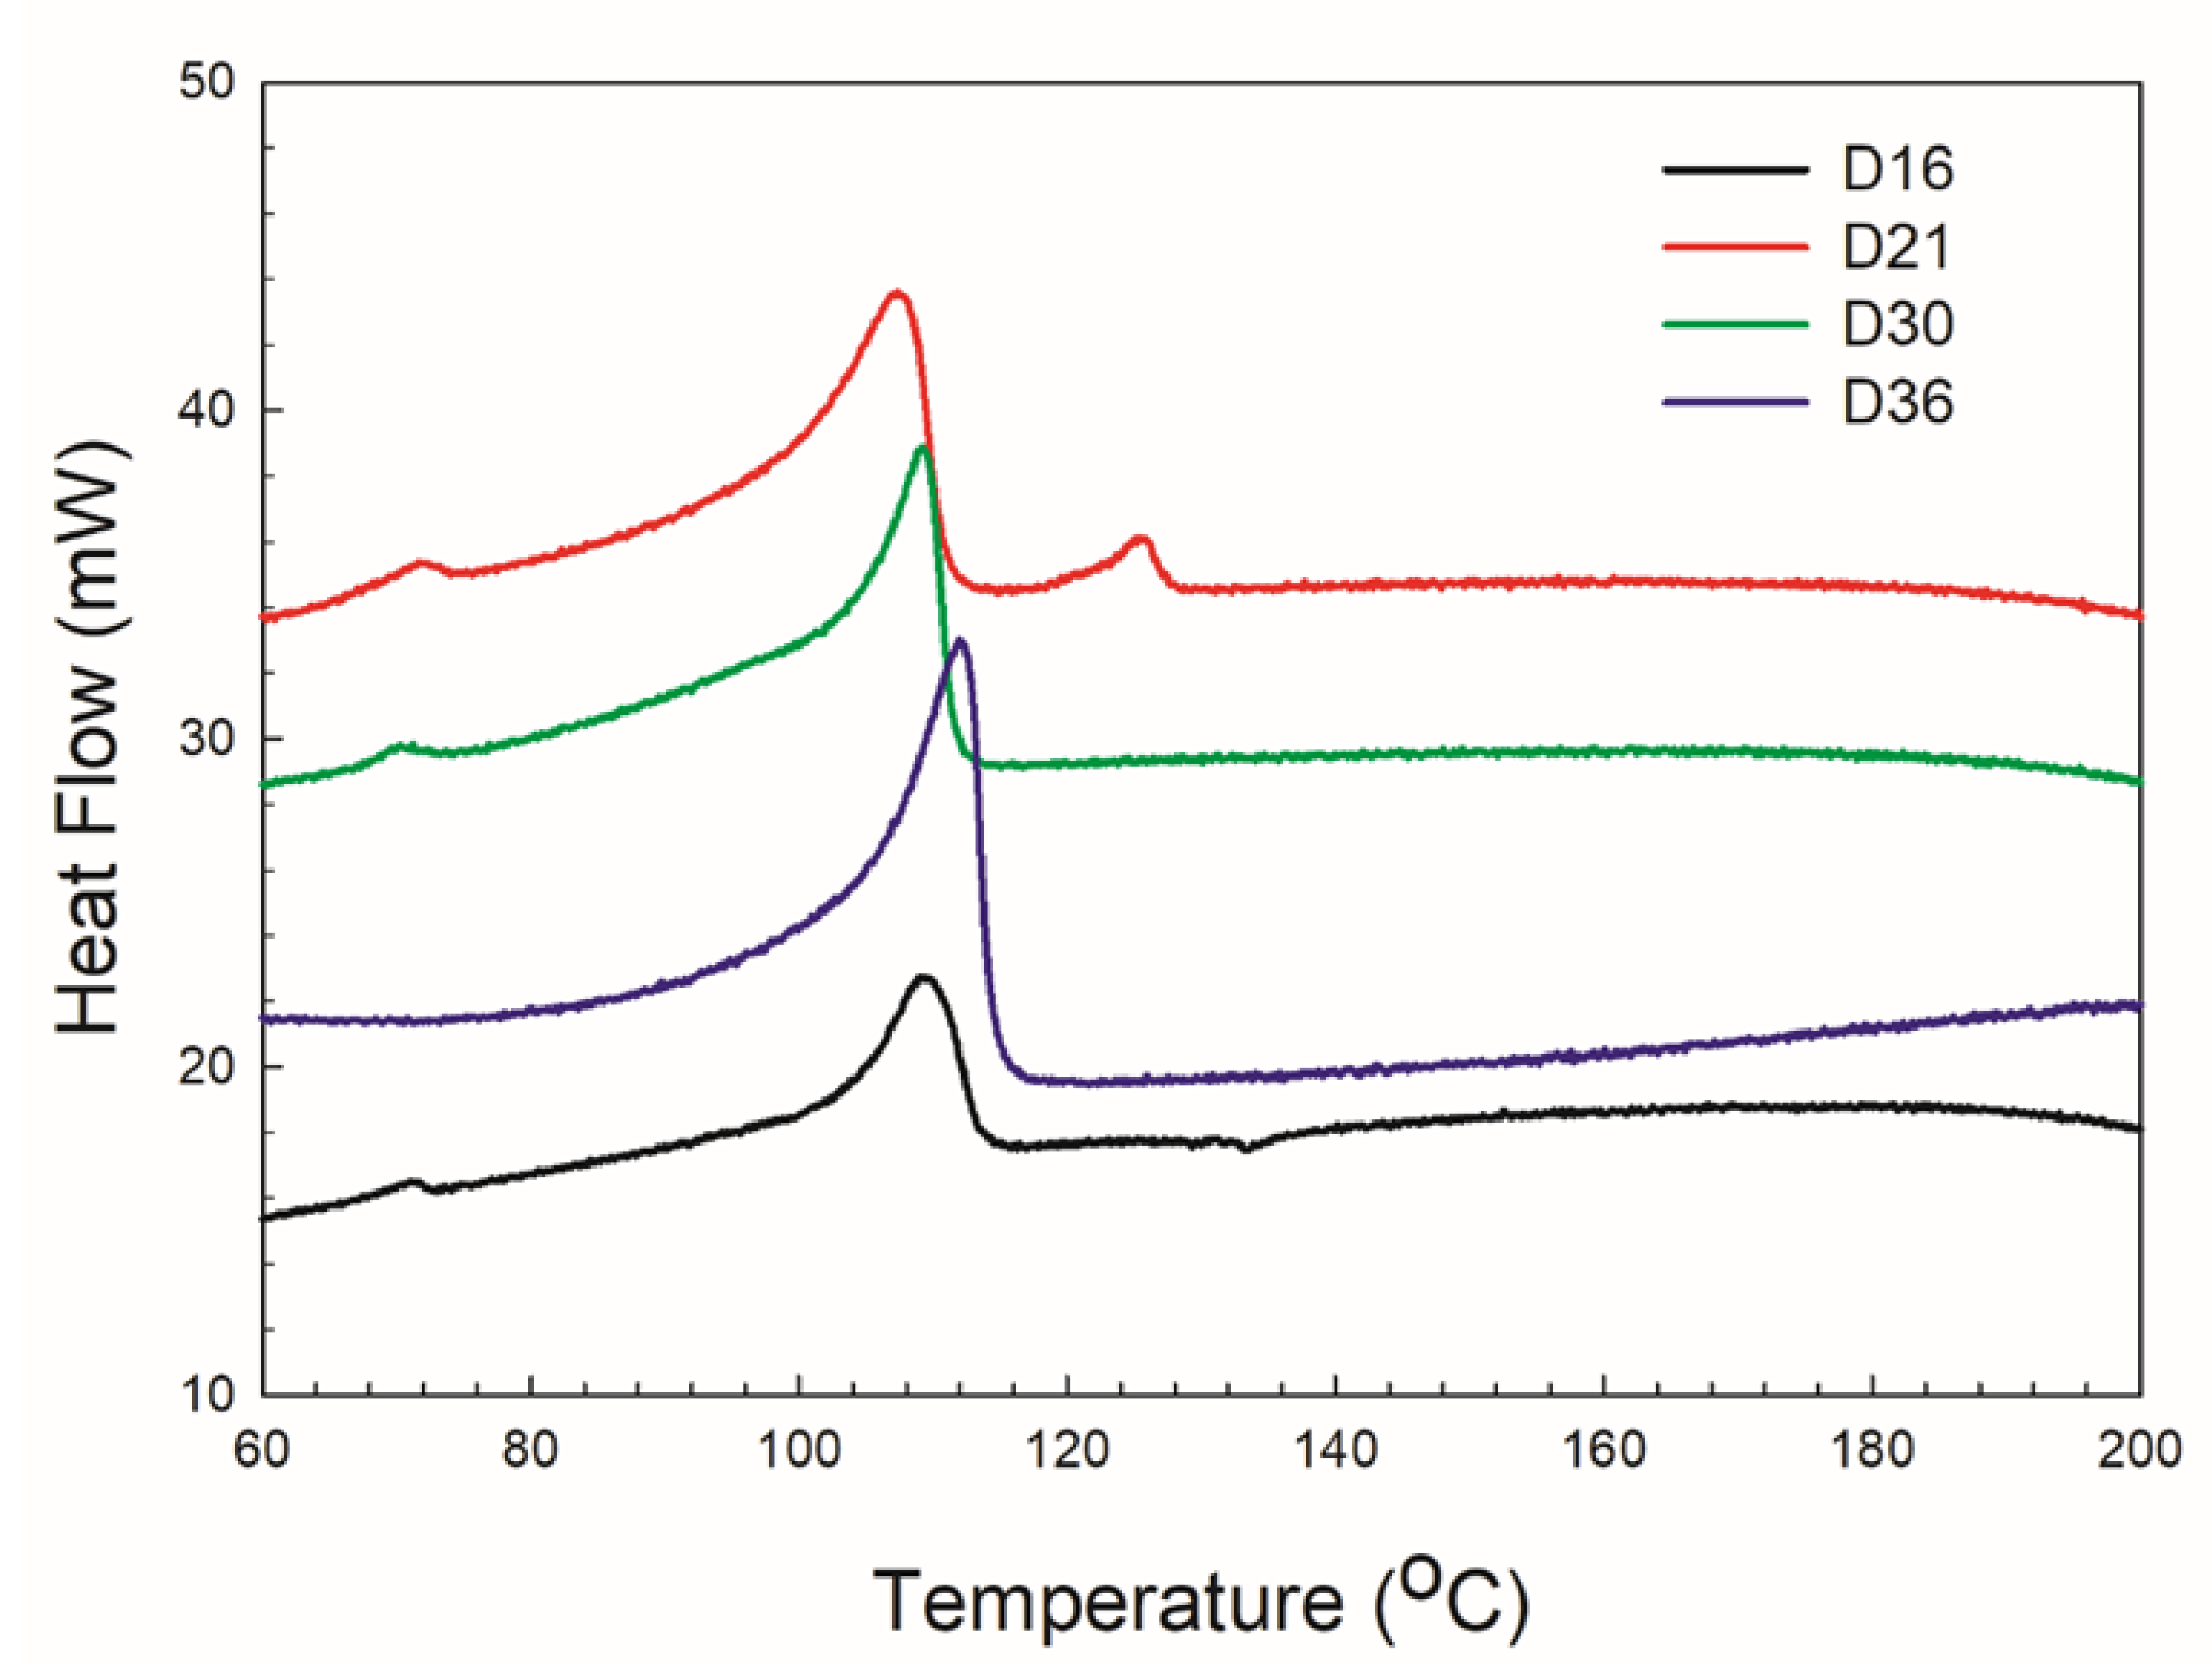
Figure 2 shows the DSC thermograms for the original LDPE foams. Each sample presented a melting point of 107–112 °C, which is typical for LDPE. Nevertheless, the crystallinity was different; it decreased with increasing the foam density. The crystallinity (Xc) was obtained via:
X c = H m H 100   ( 100 % )
where ∆Hm is the sample enthalpy (heat step), and ∆H100 is the theoretical value for 100% crystalline LDPE (293 J/g) [30].
The four types of auxetic foam were analyzed by DSC, and the results were compared to the original foams, as shown in Table 2. The crystallinities of D16 and D30 were the lowest, while that of D36 was the highest. The analysis of the DSC heating curves shown in Figure 2 showed that D16, D21 and D30 had an additional peak around 72 °C, while D16 and D21 had another peak around 126–133 °C. The presence of additional peaks implied the presence of other polyethylene resins and/or additives. This material should only contain LDPE but, depending on the manufacturer, other resins might be added for improved processing and/or mechanical properties. Other reasons may be (a) the different molecular weights of the same resins; (b) the different size and/or type of crystals; (c) a degraded/contaminated sample and (d) a combination of all of the above. In our case, the materials were collected internally and identified as recyclable LDPE foams. From the main melting point in the DSC results, the processing temperature was selected to be above the softening temperature and below the main melting point between 100–110 °C. Comparing the auxetic foams with their original counterparts, there was no significant difference between the melting points before and after conversion. However, the crystallinity showed a marked decrease after treatment. The crystallinity controls the long-range order and highly influences the final properties. During VCM, thermal and mechanical energies are applied to the original foam to produce the re-entrant morphology, but they also modify the level of long-range order, i.e., a lower crystallinity.

3.2. Auxetic Foams

3.2.1. Morphological Properties

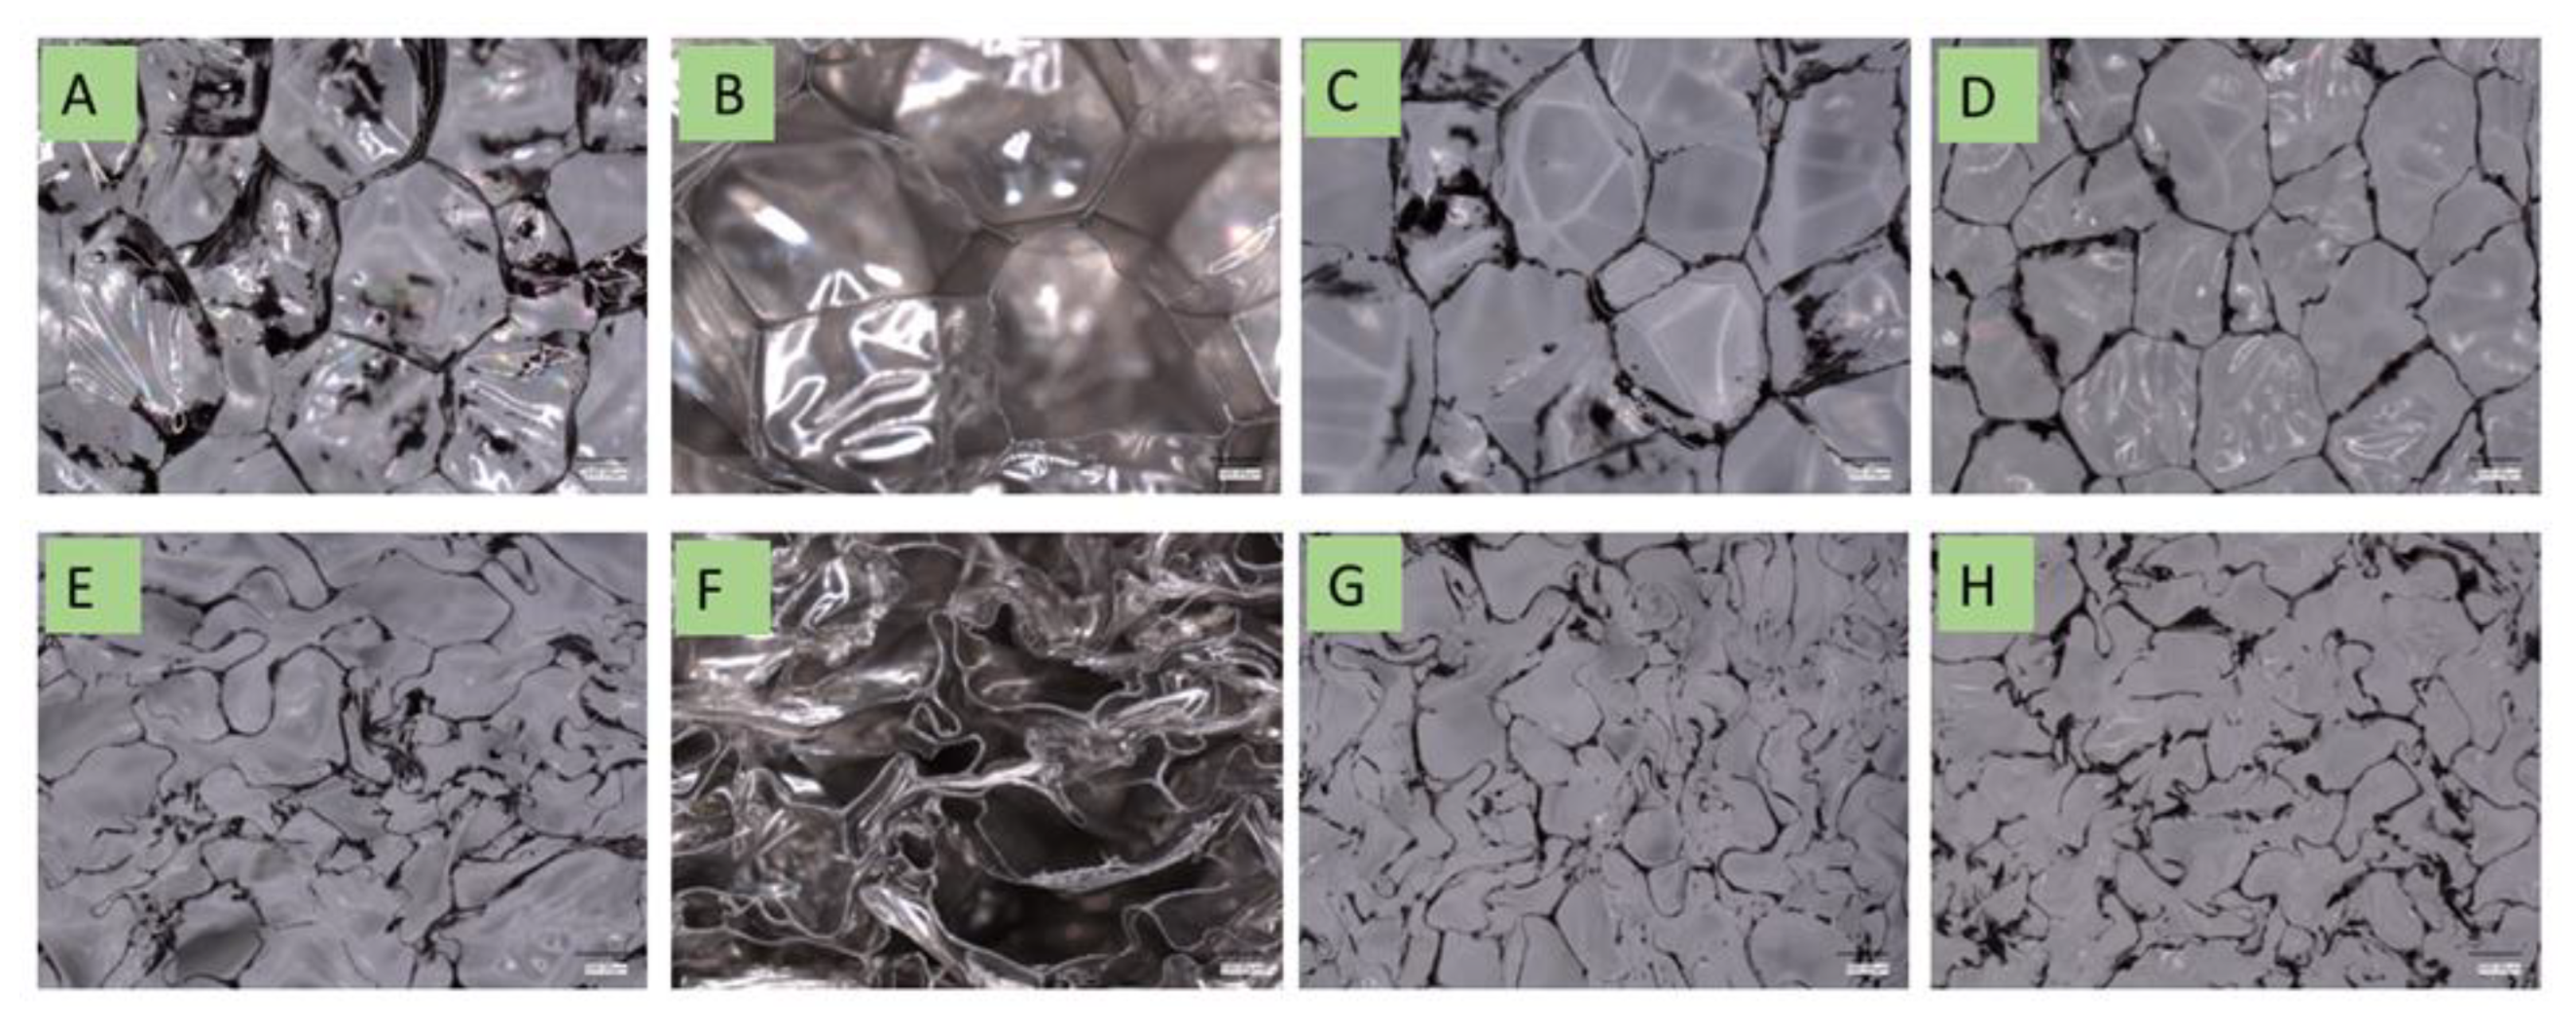
Cross-sections of the initial LDPE foams and after their modification are shown in Figure 3. The initial foams had a honeycomb cell geometry (Figure 3A–D), but it was clear that after the modification, the pores collapsed inward, generating re-entrant structures (Figure 3E–H). As expected, the cell size and sample thickness decreased due to the mechanical stress applied. Therefore, a higher final foam density was produced with respect to the conditions imposed.

3.2.2. Poisson’s Ratio

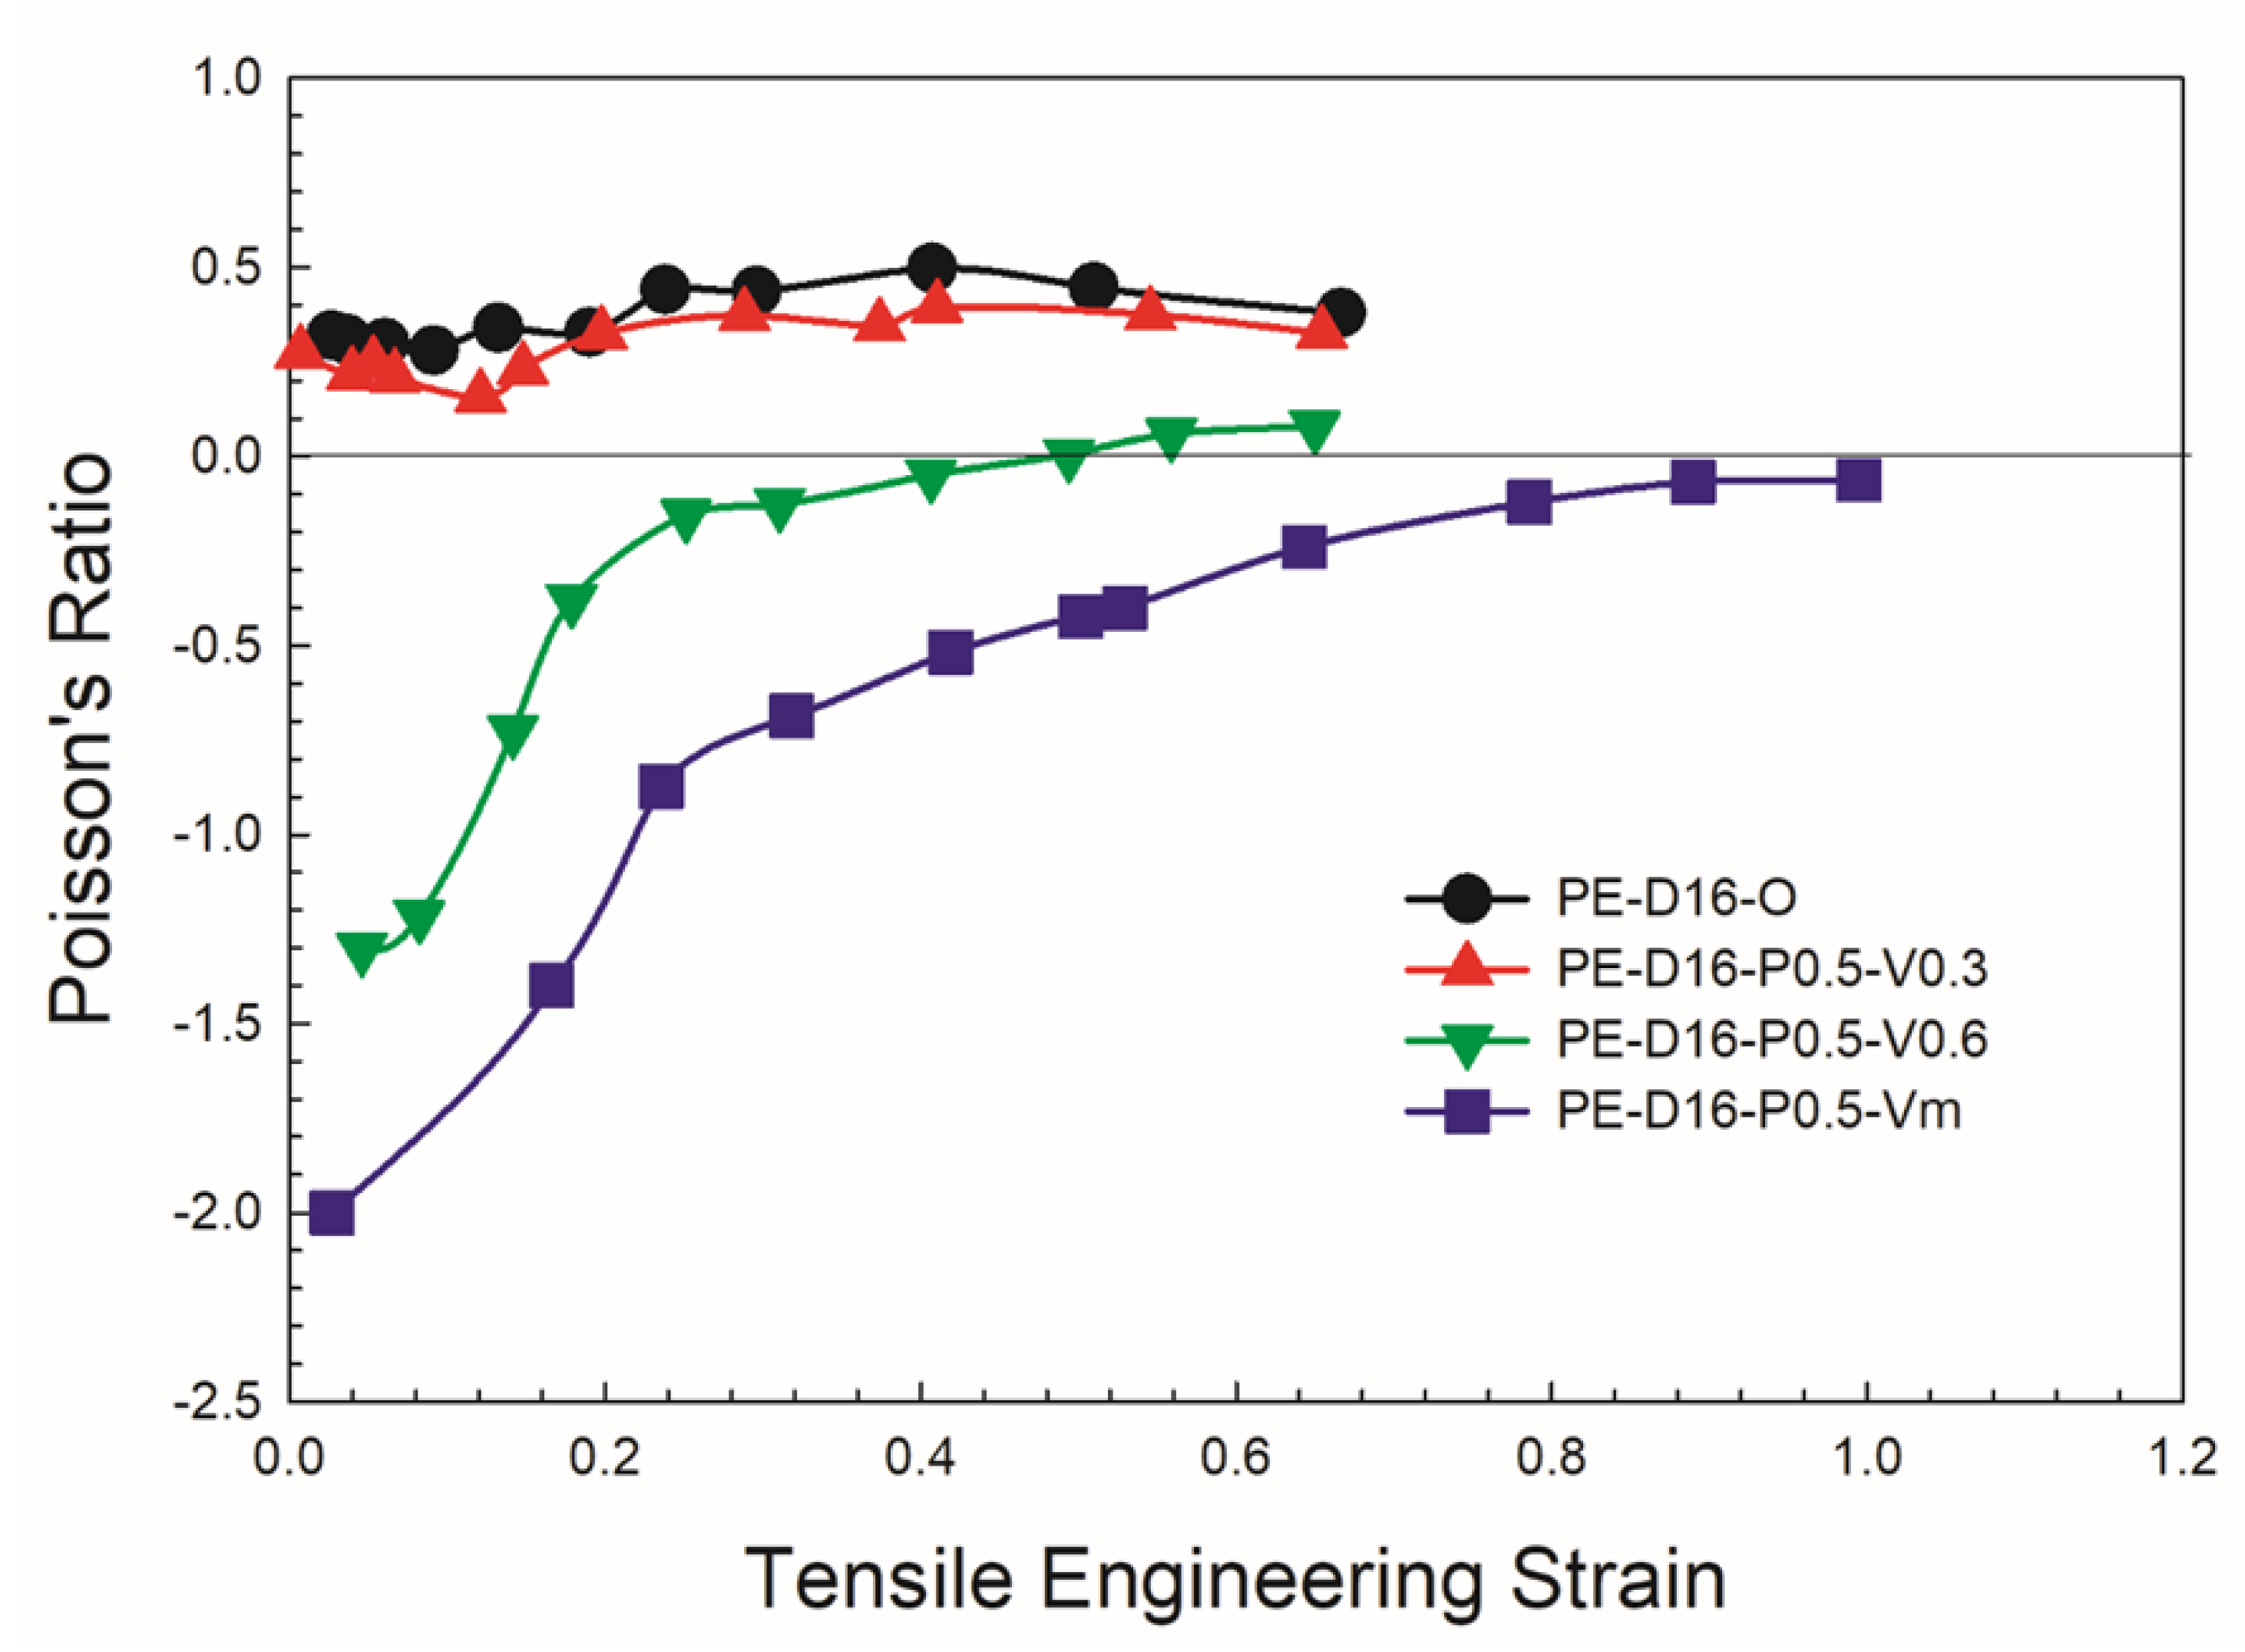
To maximize the NPR, optimization of the processing conditions was explored. The first parameter examined was the level of vacuum. Figure 4 presents the Poisson ratio of D16 with respect to the tensile strain at three different vacuum pressures: −0.3, −0.6 and −0.88 bar. The Poisson ratio did not significantly change between the original foam and the –0.3-bar (red triangles) samples. They both showed a constant positive Poisson’s ratio (0.36–0.38). However, negative Poisson’s ratios were obtained when stronger vacuum levels were applied, i.e., at least −0.6 bar. NPR was achieved when the strain was less than 0.5 for PE-D16-P0.5-V0.6 (green inverted triangles), and for all strains, values up to 100% were achieved for PE-D16-P0.5-Vm (blue squares). In all cases, the Poisson ratios increased with increasing the engineering strain, as reported in the literature. Based on these results, the maximum vacuum (−0.88 bar) was used for all the following experiments.
The Poisson ratio of a material defines the ratio of between the transverse strain (X direction) and the axial strain (Y direction). The strain is defined as the ratio between the deformation and the initial size. The deformation in the Y direction (stretching direction) had a fixed rate (imposed by the machine), while in the X direction (thickness direction) it increased to 0.2–0.3 (depending on the sample) before decreasing with increasing strain. Therefore, the slope of the curve changed when the tensile engineering strain was around 0.2–0.3.
All the properties of the foams are listed in Table 3. The volume compression ratio (Df/Do) is the ratio between the final and original densities for which the honeycomb structure was transformed into a re-entrant morphology. The minimum tensile NPR of the auxetic D16 foams decreased from −2.53 to −2.89, while the compression ratio increased from 4.9 to 7.61 and then increased to −0.89 with a compression ratio of 7.74. The best NPR value (−2.89) was obtained for PE-D16-P1.5, but PE-D16-P1.3 and PE-D16-P1.0 were very close with values of −2.83 and −2.55, respectively.
For the other auxetic foams (D21, D30 and D36), the minimum NPR values obtained in tension were −2.55, −1.60 and −1.50, respectively. The best compression ratios (Df/Do) were different for the D16, D21, D30 and D36 foams, these being 7.6, 4.7, 3.9 and 2.3, respectively. A higher mechanical pressure generated a higher foam density and a more re-entrant structure. However, too much compression resulted in cell collapse, completely destroying the re-entrant structure generated. This trend was also observed in our previous work [6].
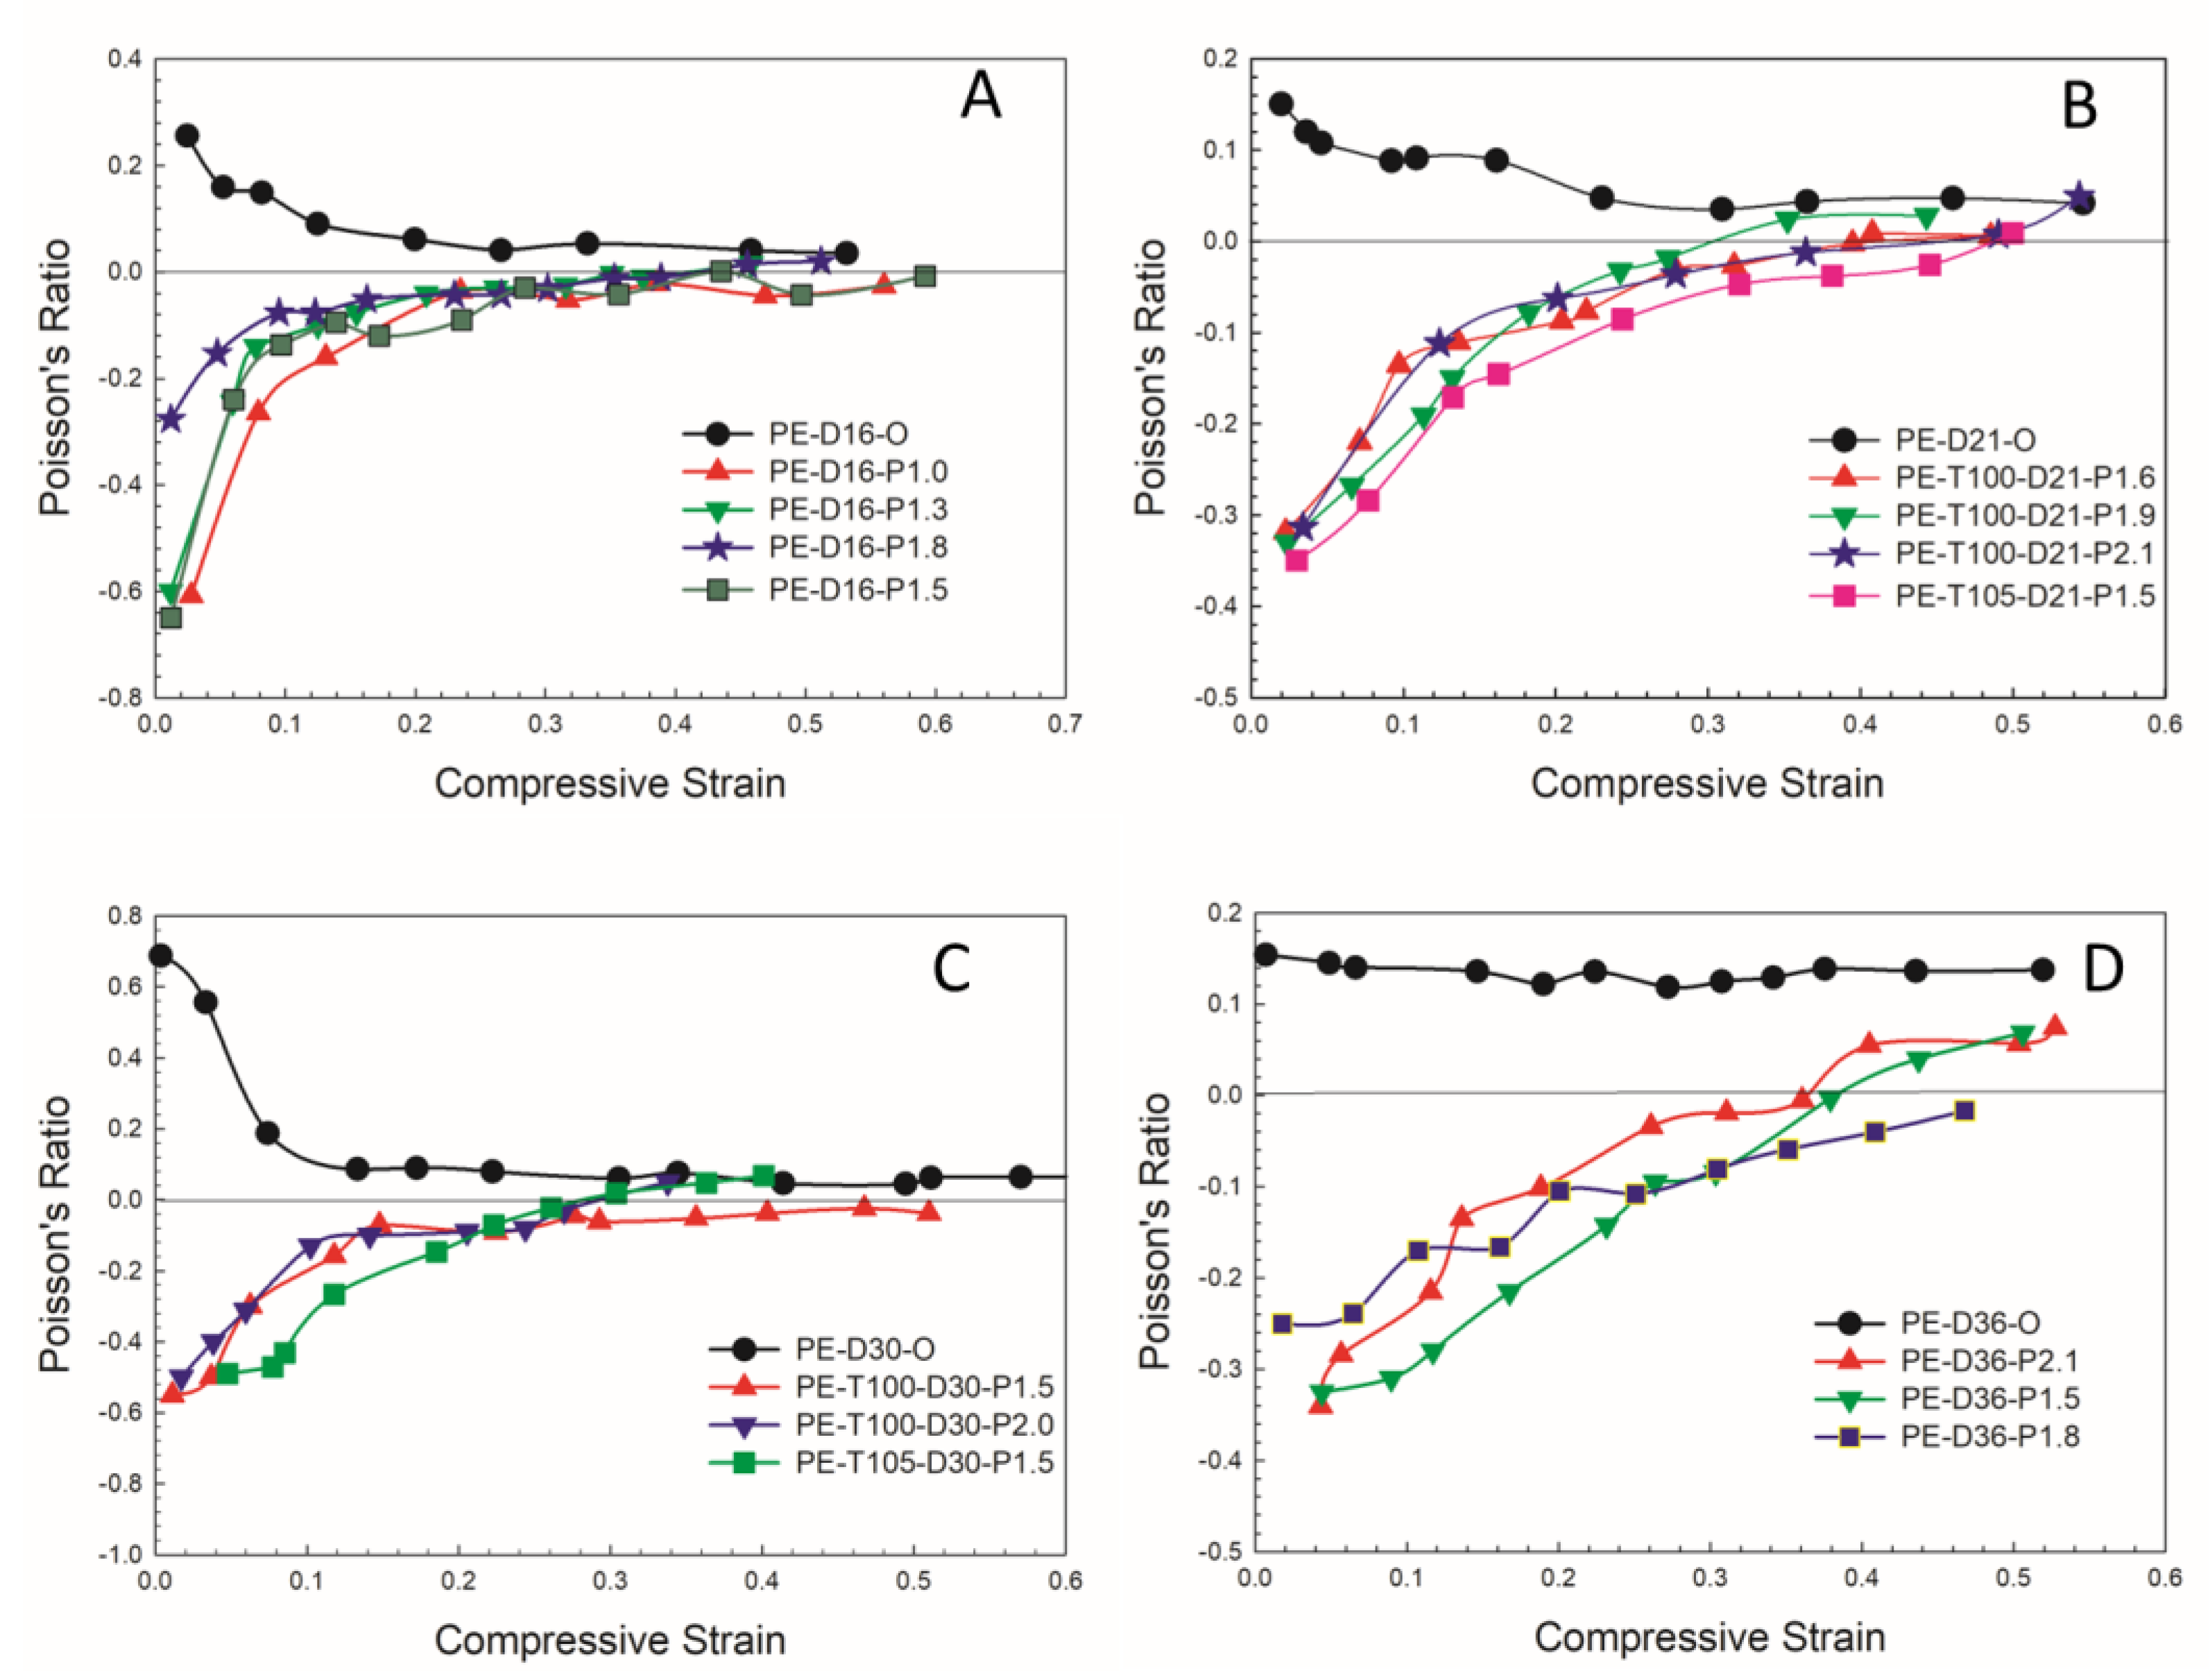
The average compressive Poisson ratios were 0.10, 0.08, 0.16 and 0.13 for D16, D21, D30 and D36, respectively. This indicated that the Poisson ratio determined under compression was lower than that determined under tension (0.38, 0.34, 0.37 and 0.40, respectively). This phenomenon likely depended on the foam’s cellular structure (anisotropy). The minimum compressive NPR values for the auxetic foams were −0.62, −0.33, −0.51 and −0.34 for D16, D21, D30 and D36, respectively. However, the minimum compressive NPR did not vary significantly with increasing the processing pressure.
Very limited data is available in the literature on the compressive NPR of closed-cell foams. Fan et al. reported very small minimum compressive Poisson’s ratios of −0.026, −0.090 and −0.118 based on 20, 30 and 45 expansion ratios, respectively, of LDPE closed-cell foams [15]. Similarly, Duncan et al. reported compressive NPR values of −0.1 and −0.05 for PU closed-cell foams at different compressive strain rates [19]. Bianchi et al. obtained a better compressive NPR value (−0.34) for an auxetic foam based on open-cell PU foam [14]. Bouchahdane et al. reported the best minimum NPR value (−0.85) for a compression of 3.33%, while the NPR value was substantially decreased (−0.12) for a 27 kg/m3 PU open-cell foam with a compression ratio of 80% [31]. Thus, the minimum compressive NPR value of −0.65 reported here was the lowest value for closed -cell PE foams.
The tensile Poisson ratio of the original foams (D16, D21, D30 and D16) were measured with average values of 0.38, 0.34, 0.37 and 0.38, respectively. The Poisson ratio of the treated samples is shown in Figure 5. As expected, the relation between the Poisson ratio and tensile engineering strain were similar; the Poisson ratio increased with the engineering strain, as observed in the literature and in our previous work [6,11,17,18,19]. Figure 5 also shows that an NPR was observed up to large strains (above 1.0, the maximum strain being 1.4 in this case). However, most of the literature reported auxetic foams (NPR) only at very small strains of 0.3 [16] and 0.6 [18]. Even our previous work showed that the maximum strain to obtain an NPR was 0.8 [6]. Therefore, the advantages of the current method, combining vacuum with mechanical compression (VMC), were that it is not only environmentally friendly as no solvent is used but also that NPR (Figure 5A–D) can be achieved up to much higher engineering strains, i.e., above 100%.
Finally, the effect of the treatment temperature was studied. In this case, two temperatures were selected: 100 °C and 105 °C. The temperature value was appended to the sample codes with their value, i.e., T100 and T105 (PE-T100-D21-P1.6 and PE-T105-D21-P1.6). Figure 5B shows that the curves were very similar for both samples. This was expected, because a difference of only 5 °C when the sample was already above the softening temperature would not significantly affect the main driving force of the applied vacuum and/or mechanical pressure.
Figure 6 presents the Poisson ratio as a function of the compressive engineering strain for the auxetic and original samples. Compared to the tensile NPR, the compressive NPR was less negative in value.
The values of the compressive NPR at each pressure had a smaller variance than those of the tensile NPR (see Figure 5 and Figure 6). Auxetic behavior could be reached at larger tensile engineering strains (strain above 100%) than compressive strains (only at 50–60%). When the compressive engineering strain was above 50%, most of the compressive Poisson’s ratios were positive (Figure 6B,D). However, this was the same trend as for the original foams, for which the NPR increased with increasing the compressive strain.

3.2.3. Mechanical Properties

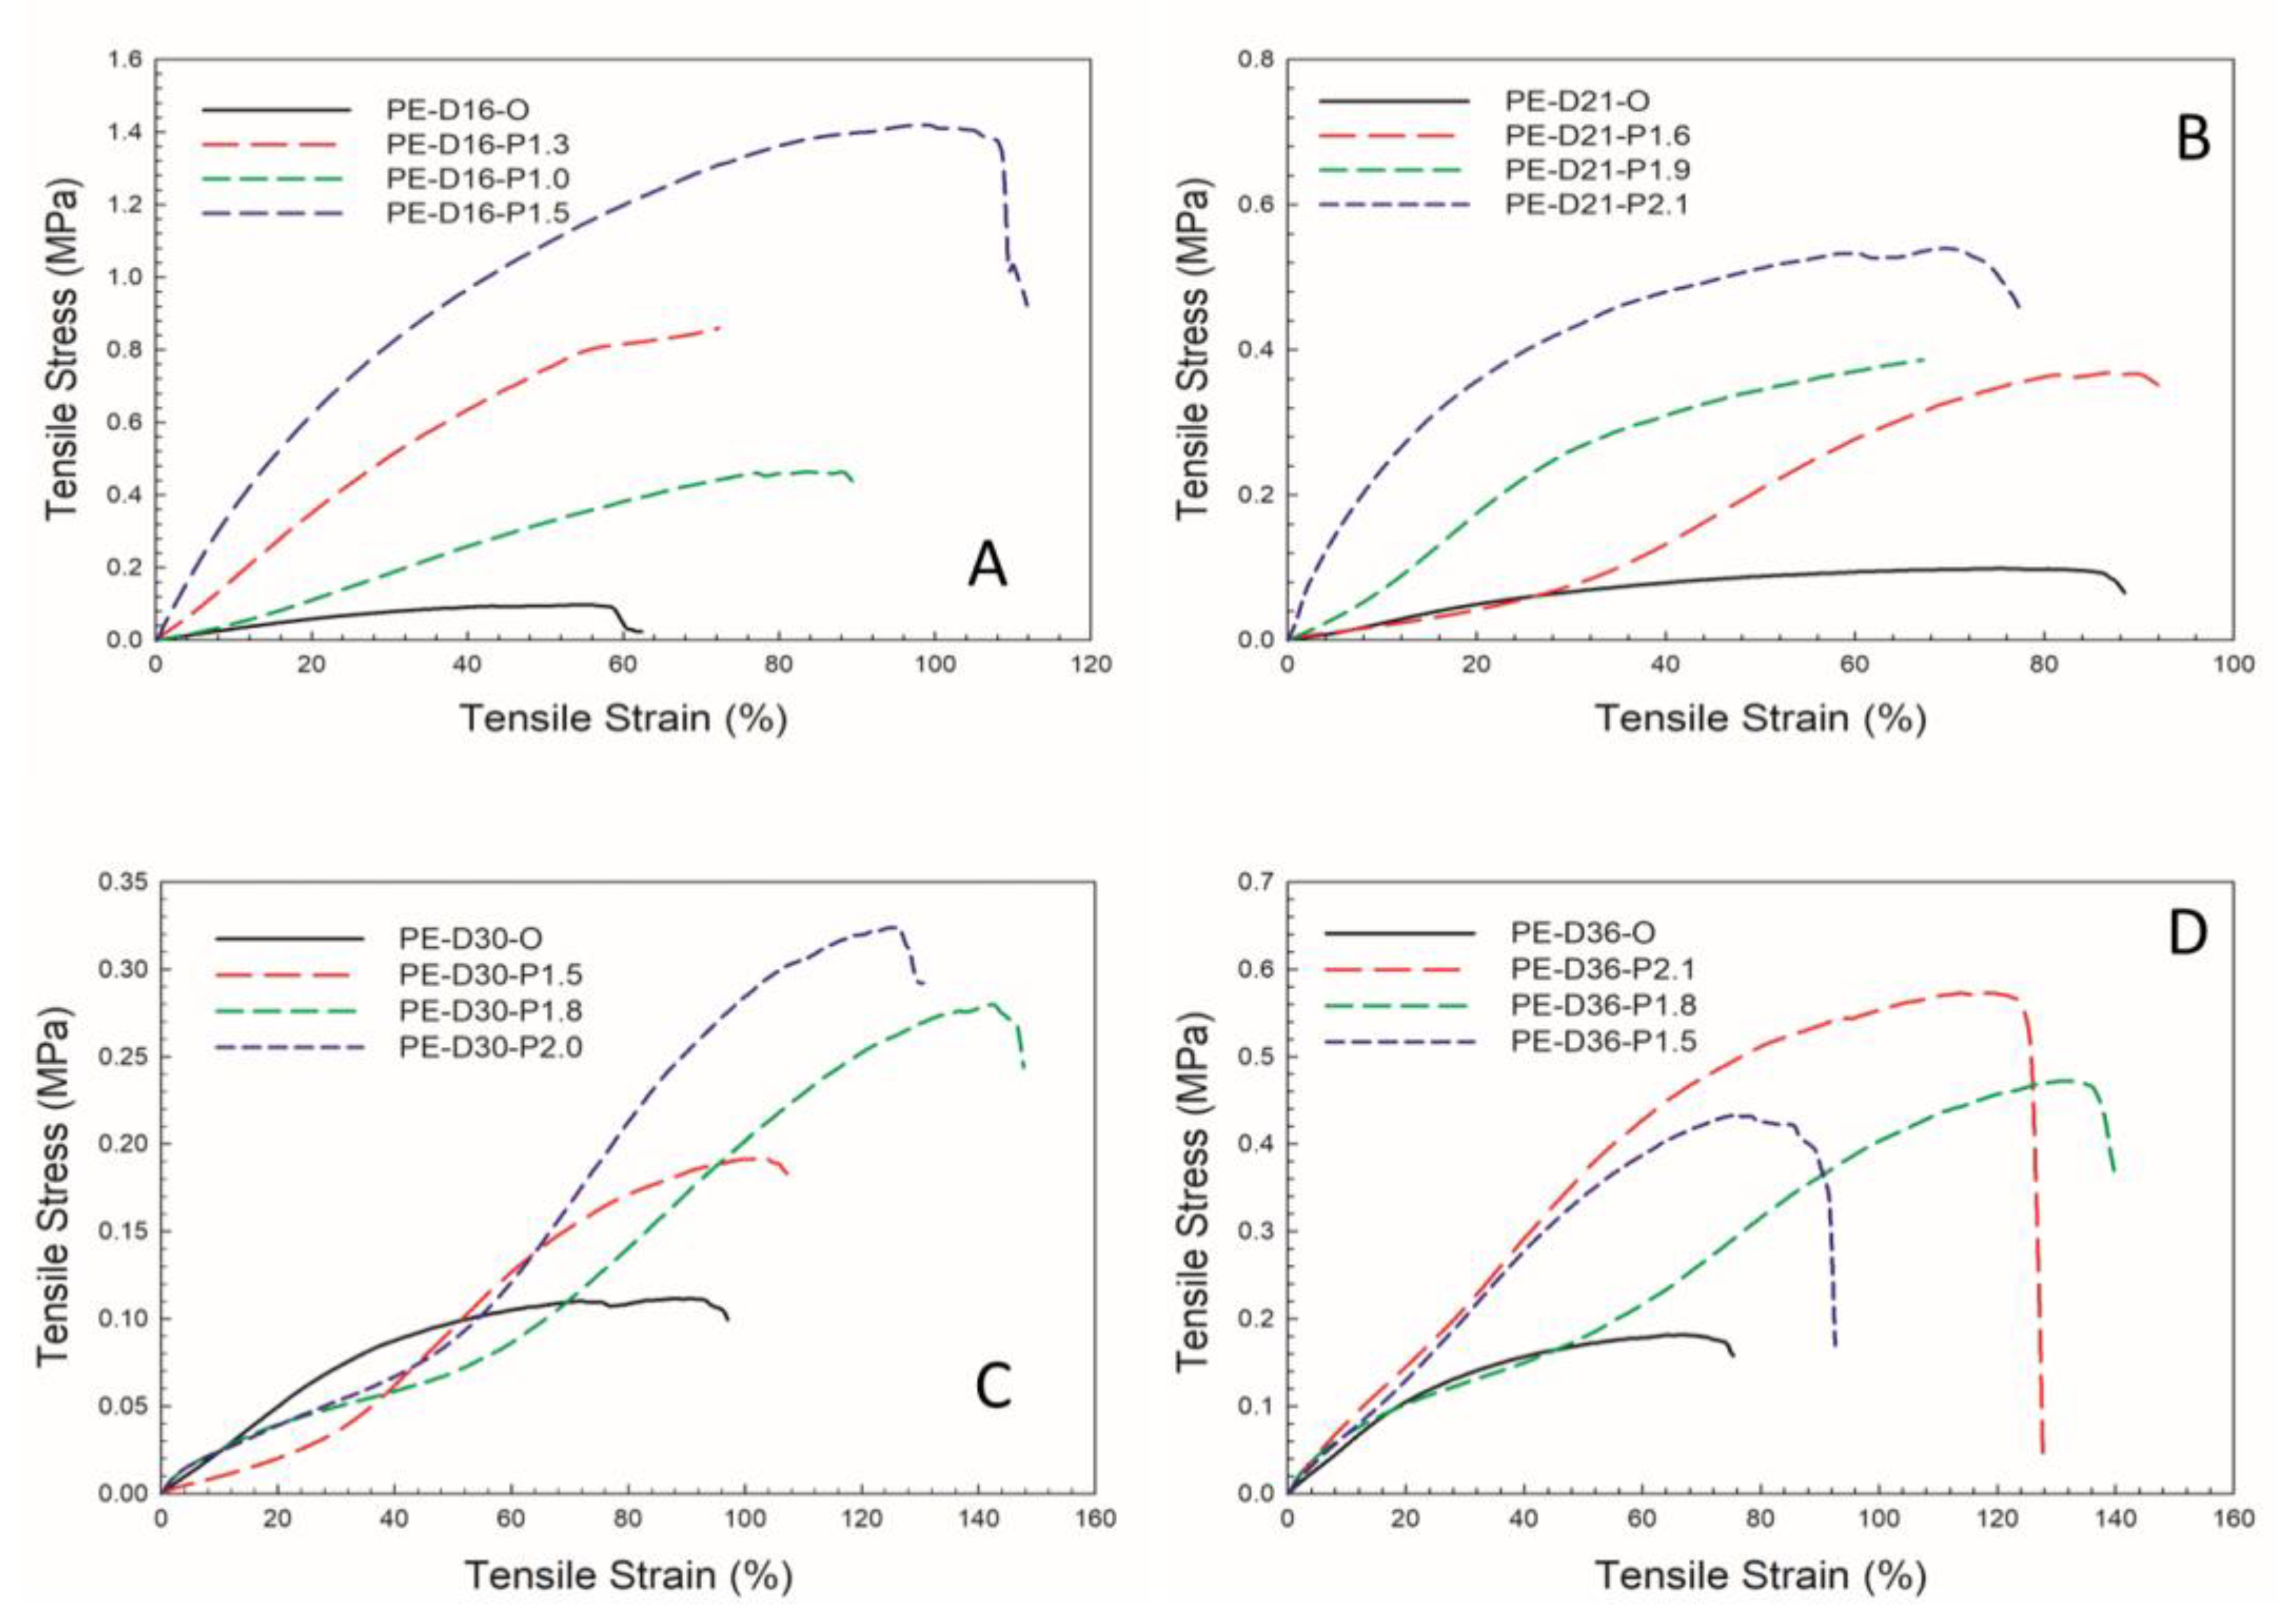
Figure 7 presents the tensile stress–strain curves for the samples before and after the VMC treatment. For all the properties (tensile modulus, energy at break (Ep) and elongation at break), an improvement was observed compared with the original foams. This was similar to that reported in the literature, where the mechanical strength and energy absorption were much better for auxetic foams compared to conventional ones [18,25,32,33]. The curves for the original foams (solid lines in Figure 7) showed a classical quasi-linear behavior until failure at about 60%, 90%, 92% and 78% tensile strains for D16, D21, D30 and D36, respectively. The auxetic foams showed higher tensile stresses at failure than the original foams due to their higher density (Table 4). The values of Young’s modulus and energy absorption (Ep) were also improved at a higher final foam density (and crystallinity) because Young’s modulus is related to the amount of material sustaining the stresses and its intrinsic rigidity [34]. The energy absorption, which is related to toughness, also increased with the density [35].
However, one tensile modulus (Young’s modulus) decreased after the VMC treatment. The value of Young’s modulus for the original D30 foam was approximately 2.39 kPa, while that of the PE-D30-P1.5 sample was 1.13 kPa. This was similar to Bezazi et al. [30], who attributed the decrease to the foam unit cells buckling during processing, providing a rotational point between the cell ribs [34]. However, above a specific tensile deformation, the cells/ribs tended to align, generating a higher resistance to the applied stresses [34]. As such, only low stresses are needed at low strain (beginning of a test and below 5% deformation) [34]. Here, we proposed another explanation related with the OCP (Table 1): as some closed cells became open cells because their cell walls were broken during the VMC process, there was less material available to sustain the applied stresses, especially at lower strains (before cell buckling and collapsing).
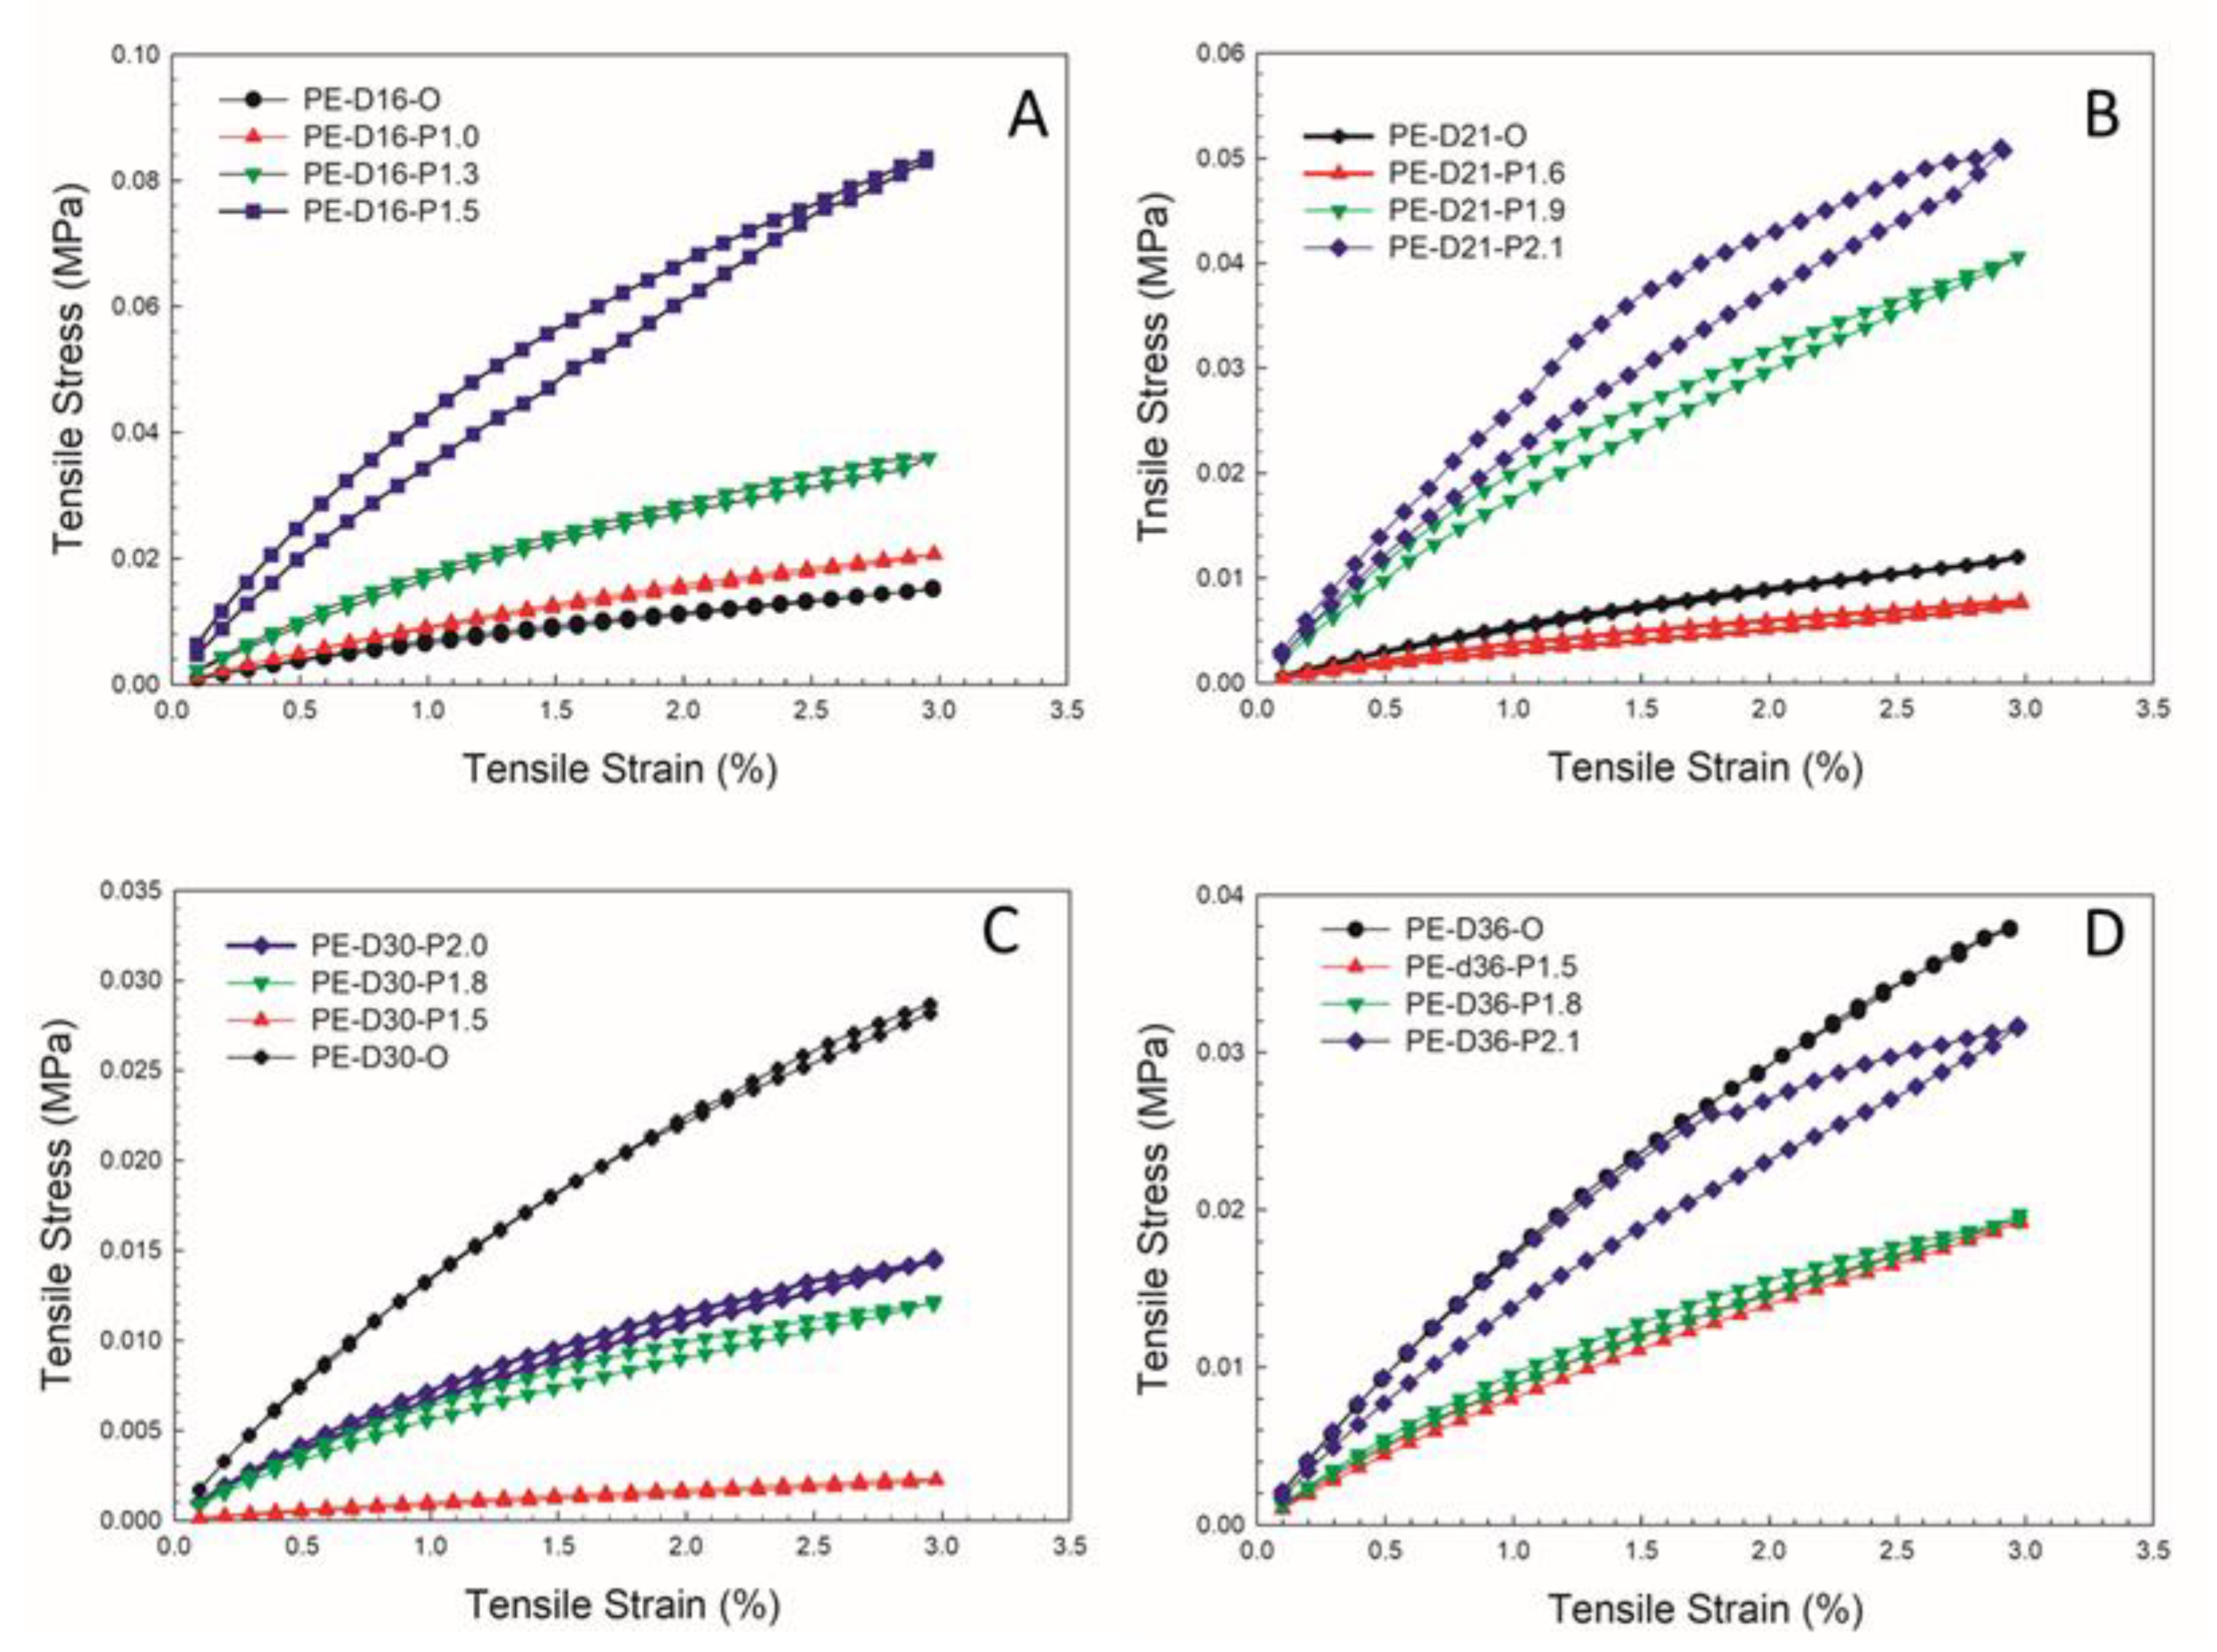
Quasi-static cyclic tensile tests (up to 3% engineering strains at a rate of 0.2 mm/min) were performed to generate hysteresis cycles. Figure 8 presents the hysteresis loops for the auxetic and initial samples. The strain energy (Ep) of PE-D16-O was the lowest compared to the VMC-treated samples, but PE-D21-O, PE-D30-O and PE-D36-O had higher Ep values than the auxetic foams (Table 4). As previously mentioned, it was believed that when the VMC changed the cellular structure, some cells were broken, and this was why some of the auxetic foams showed low stresses at low strains (0.1–3%). The presence of hysteresis loops confirmed the typical energy dissipation (Ed) behavior of these materials under slow deformation.
The energy dissipation of the auxetic foams was better than that of the original foams (Table 4). The auxetic foams based on D16 had Ed values of 1.22 mJ/cm3, 3.47 mJ/cm3 and 15.5 mJ/cm3 compared to 0.95 mJ/cm3 for D16. The damping capacity is the capacity to absorb vibration using internal friction and to convert mechanical energy into heat. The damping capacities of the four original foams were 3.8%, 2.4%, 0.87% and 0.12%, while those of the auxetic foams were 11.4%, 13.8%, 13.4% and 15.5% (Table 4). For the D16, D21 and D30 foams, an improved damping capacity corresponded to an increasingly negative tensile NPR. This trend did not hold for D36, and the reason behind this difference was unclear.
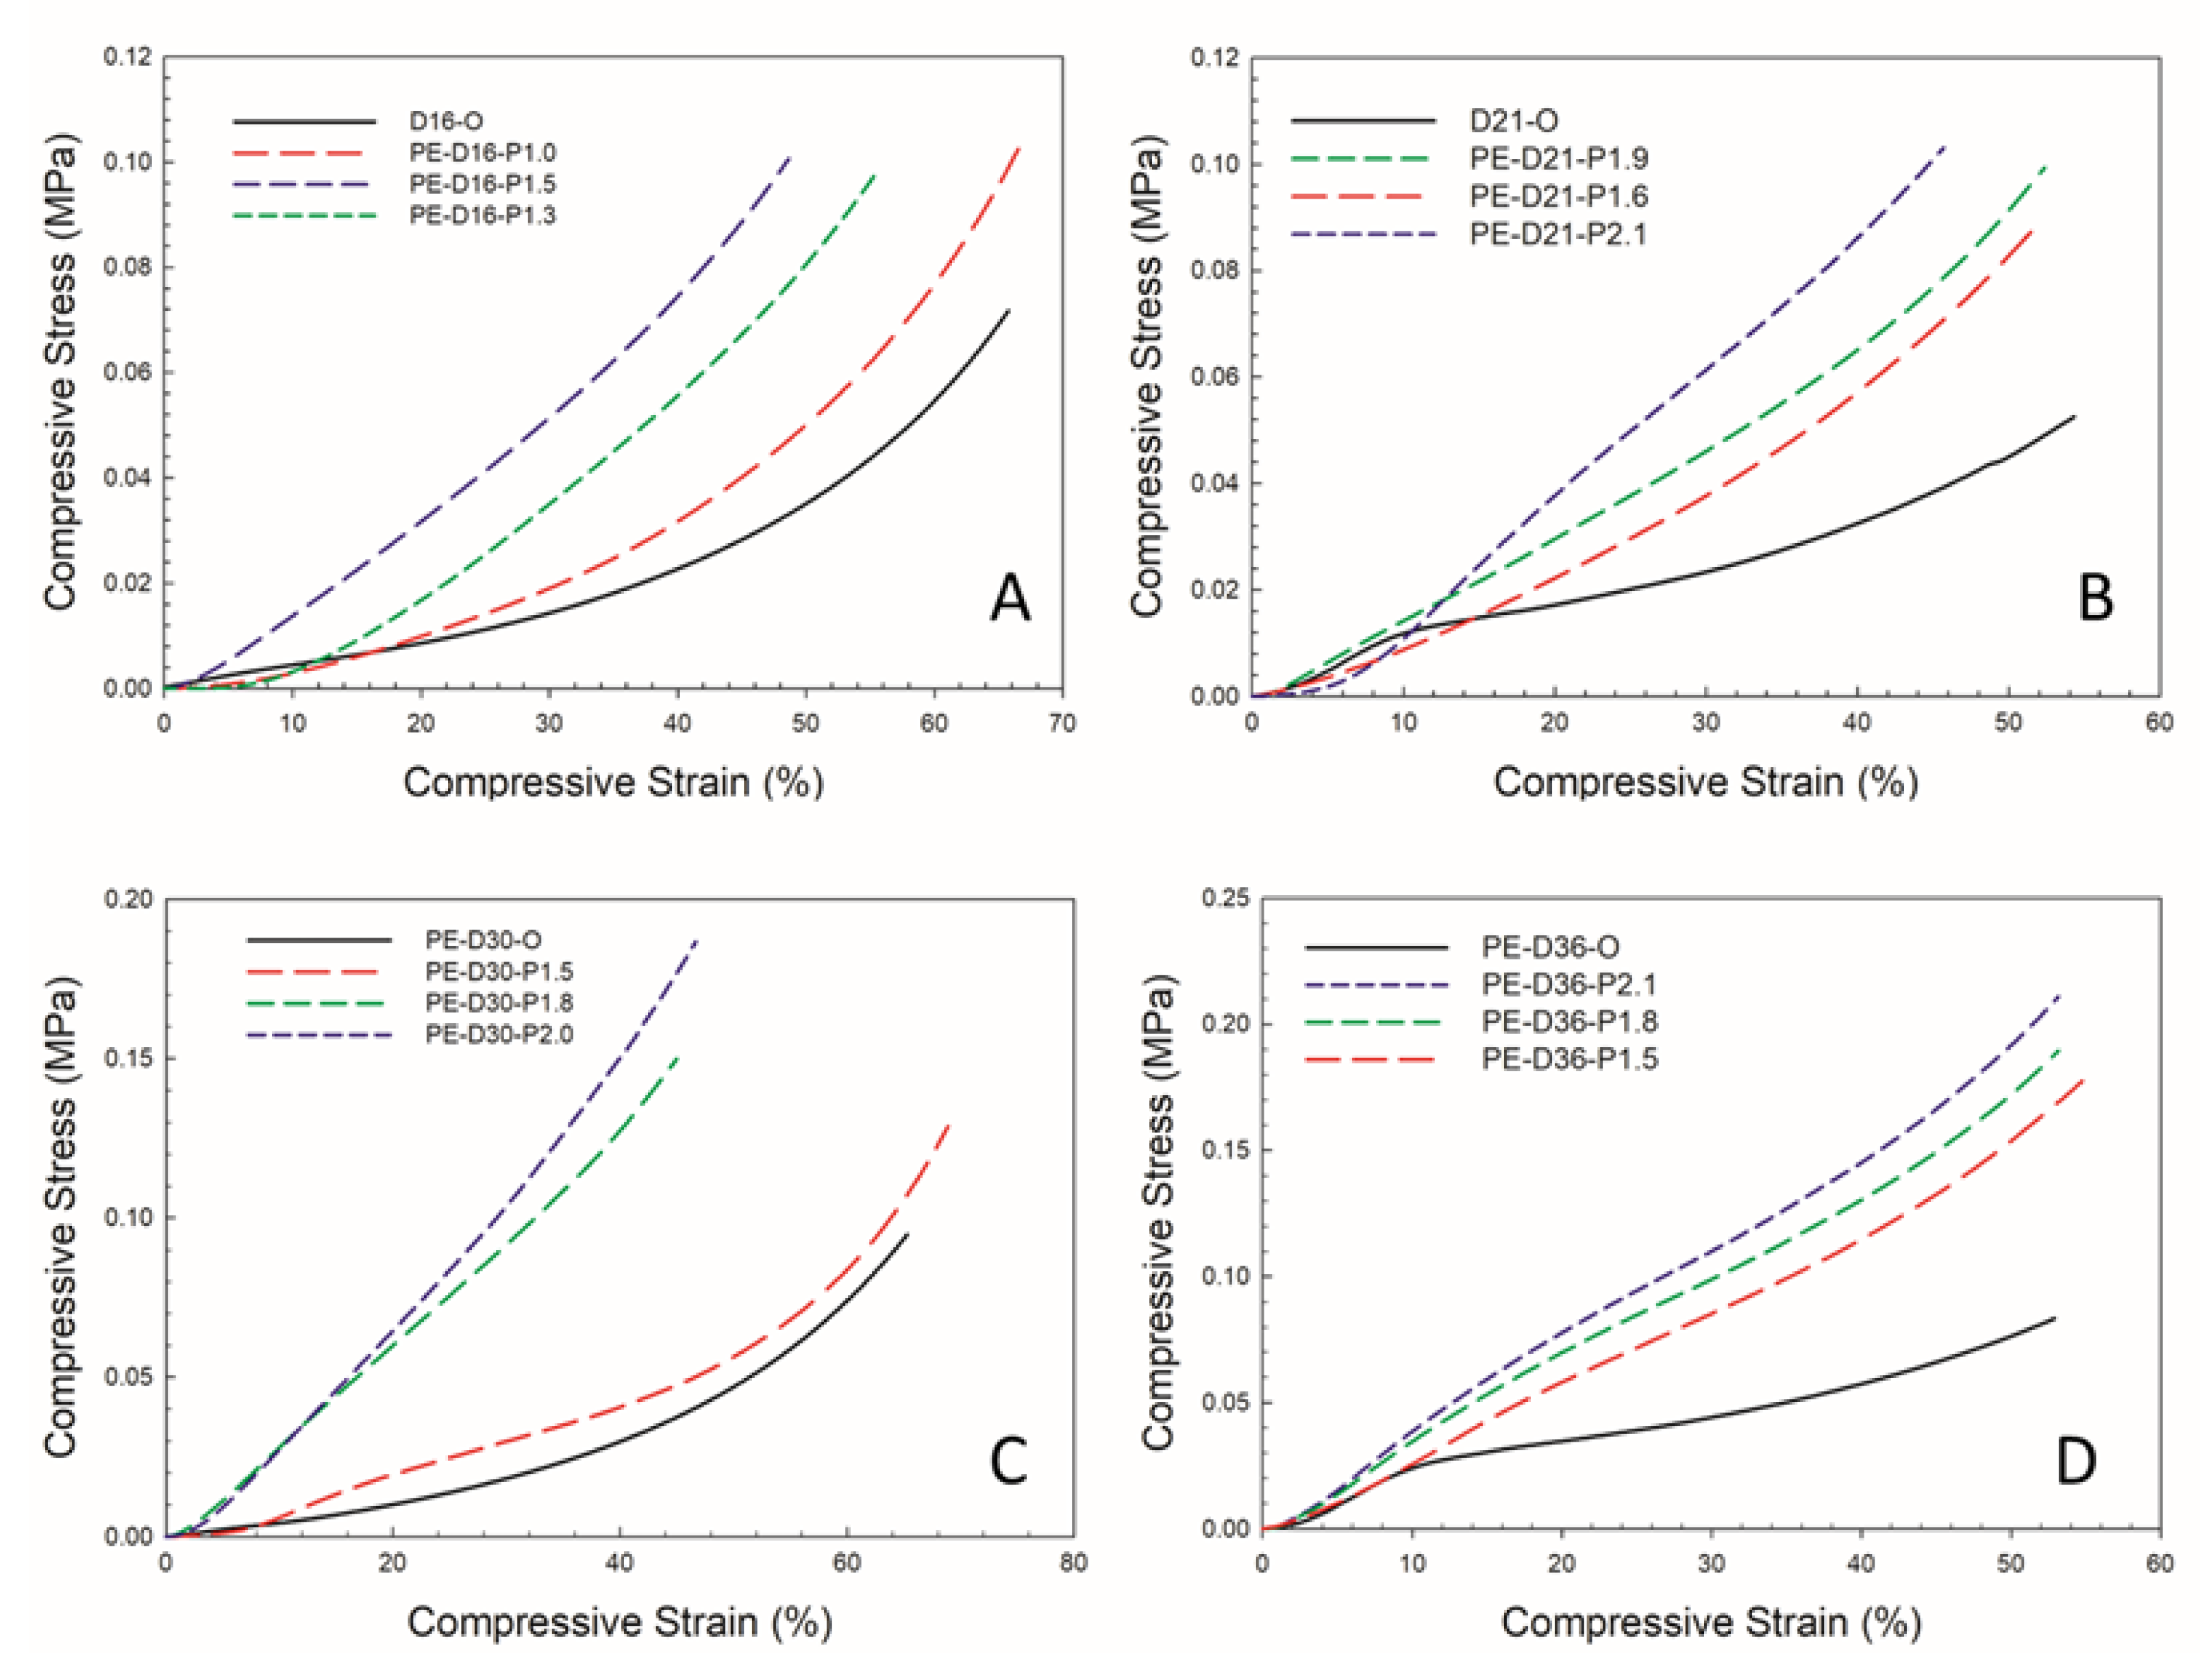
Figure 9 and Figure 10 and Table 4 report the mechanical properties obtained from the compressive stress–strain curves and the quasi-static cyclic testing. The compressive modulus and strain energy (Ep) values presented in Table 4 showed the same trend as the tensile data; the strain energies of the original foams were larger than those of the auxetic foams (PE-D16-P1.0 and PE-D21-P1.6). However, as the VMC treatment pressure increased, so did the strain energies, surpassing those of the original foams. The energy dissipated (Ed) and damping capacities (%) of the auxetic foams tested under compression all showed a great improvement over their original foams. The best damping capacity values were 13.4%, 20.2%, 29.7% and 28.1% for the four types of auxetic foams. Scarpa et al. [36] obtained an energy loss per unit volume of (~0.05 mJ/cm3) for conventional PU foam (27 kg/m3) after 20,000 cycles, while the auxetic foams reported here had an average of around 0.8 mJ/cm3; a 16-fold increase under compressive cyclic loading.

4. Conclusions

A simple and green method was proposed based on vacuum combined with mechanical compression (VMC) to convert a standard polymer foam into an auxetic foam by generating a re-entrant cellular morphology. As an upcycling project, the initial material selected was LDPE foam.
The minimum tensile Poisson ratios reached were −2.89, −2.55, −1.52 and −1.50 for initial foam densities of 16, 21, 30 and 36 kg/m3, respectively. On the other hand, the minimum compressive Poisson ratios obtained were −0.65, −0.35, −0.55 and −0.34 for the same samples. Furthermore, the tensile mechanical properties of these auxetic foams were substantially increased compared in terms of Young’s modulus (40 kPa), tensile strength absorption energy (136 kPa at a strain of 3%), energy dissipation (15.5 mJ/cm3) and damping capacity (11%) compared to the most negative PR auxetic foams, which had the lowest NPR values. Under compression, the Young modulus (2.54 kPa), strength absorption energy (17.6 kPa at a strain of 3%), energy dissipation (3.43 mJ/cm3) and damping capacity (19%) were also better than those of the original foams.
Based on the analyses performed, the NPR values for these auxetic foams were lower, and they presented better mechanical performances compared to the current literature. These results showed that an environmentally benign process can be applied to upcycle single-use LDPE foams of low density. As most of the literature on auxetic foams has focused on PU, this work increases our knowledge on using LDPE.
Finally, these auxetic foams can be applied as impact mitigation for defense applications, such as behind armor padding, as well as in the production of protective sports equipment. The main application of these materials is for protection against impact, i.e., dissipating and absorbing energy while reducing peak forces/accelerations and pressures. Typical examples include helmets, knee/elbow pads, etc. Another application would be protection against penetration, abrasion and laceration. These auxetic foams can become personal protective equipment and supports for joints, muscles and the skeleton [37]. Nevertheless, more work is under way to apply the process (VCM) to larger samples for a wider range of densities and for other polymers.

Author Contributions

Conceptualization, D.R. and X.Y.C.; methodology, X.Y.C.; validation, D.R.; formal analysis, X.Y.C.; investigation, X.Y.C.; resources, D.R.; data curation, D.R.; writing—original draft preparation, X.Y.C.; writing—review and editing, D.R. and R.S.U.; visualization, X.Y.C.; supervision, D.R.; project administration, D.R.; funding acquisition, D.R. All authors have read and agreed to the published version of the manuscript.

Funding

This research was funded by the Innovation for Defense Excellence and Security (IDEaS) program from the Department of National Defense (DND) of Canada, grant number CFPMN1-032.

Institutional Review Board Statement

Not applicable.

Informed Consent Statement

Not applicable.

Data Availability Statement

Data available upon request.

Conflicts of Interest

The authors declare no conflict of interest.

Abbreviations

DSCdifferential scanning calorimetry
Eddissipated energy
Epmaximum potential energy
LDPElow-density polyethylene
NEnylon elastomer
NPRnegative Poisson’s ratio
OCPopen-cell percentage
pporosity
PEpolyethylene
PMIpolymethacrylimide
PPpolypropylene
PUpolyether urethane foam
SECCsolvent evaporation–condensation and mechanical compression
Vaair volume
Vlsolid volume
VMCvacuum combined with mechanical compression
Xccrystallinity
εxaxial deformation
εy or εztransverse deformations
H100enthalpy of 100% crystalline LDPE
Hmsample enthalpy
ρadensity of air
ρffoam density
ρlsolid matrix density
ʋPoisson’s ratio
Ψdamping capacity

References

  1. Raps, D.; Hossieny, N.; Park, C.B.; Altstädt, V. Past and present developments in polymer bead foams and bead foaming technology. Polymer 2015, 56, 5–19. [Google Scholar] [CrossRef]
  2. Kuhnigk, J.; Standau, T.; Dörr, D.; Brütting, C.; Altstädt, V.; Ruckdäschel, H. Progress in the development of bead foams—A review. Cell. Plast. 2022, 58, 707–735. [Google Scholar] [CrossRef]
  3. Available online: https://www.flexipack.com/blog/epe-foam (accessed on 10 October 2022).
  4. Hamdi, O.; Rodrigue, D. Production, Modeling and Applications. Curr. Appl. Polym. Sci. 2021, 4, 159. [Google Scholar] [CrossRef]
  5. Jiang, W.; Ren, X.; Wang, S.L.; Zhang, X.G.; Zhang, X.Y.; Luo, C.; Xie, Y.M.; Scarpa, F.; Alderson, A.; Evans, K.E. Manufacturing, characteristics and applications of auxetic foams: A state-of-the-art review. Compos. Part B 2022, 235, 109733. [Google Scholar] [CrossRef]
  6. Chen, X.; Hamdi, O.; Rodrigue, D. Conversion of low-density polyethylene foams into auxetic metamaterials. Polym. Adv. Technol. 2023, 34, 228–237. [Google Scholar] [CrossRef]
  7. Alderson, K.; Alderson, A.; Ravirala, N.; Simkins, V.; Davies, P. Manufacture and characterization of thin flat and curved auxetic foam sheets. Phys. Status. Solidi B 2012, 249, 1315–1321. [Google Scholar] [CrossRef]
  8. Alderson, K.A.; Alderson, P.; Davies, G.; Smart, G. Process for the Preparation of Auxetic Foams. Patent 8277719, 10 May 2012. [Google Scholar]
  9. Lakes, R. Foam structures with a negative Poisson’s ratio. Science 1987, 235, 1038–1040. [Google Scholar] [CrossRef]
  10. Chan, N.; Evans, K. Fabrication methods for auxetic foams. J. Mater. Sci. 1997, 32, 5945–5953. [Google Scholar] [CrossRef]
  11. Bianchi, M.; Scarpa, F.; Banse, M.; Smith, C. Novel generation of auxetic open cell foams for curved and arbitrary shapes. Acta Mater. 2011, 59, 686. [Google Scholar] [CrossRef]
  12. Bianchi, F.M.; Scarpa, C.W. Smith Stiffness and energy dissipation in polyurethane auxetic foams. J. Mater. Sci. 2008, 43, 5851. [Google Scholar] [CrossRef]
  13. Bianchi, F.M.; Scarpa, C.W. Smith, Shape memory behaviour in auxetic foams: Mechanical properties. Acta Mater. 2010, 58, 858–865. [Google Scholar] [CrossRef]
  14. Bianchi, F.M.; Frontoni, F.; Scarpa, C.W. Smith, Density changes during the manufacturing process of PU–PE open cell auxetic foams. Phys. Status Solidi B 2011, 248, 30–38. [Google Scholar] [CrossRef]
  15. Zhang, Q.; Lu, W.; Scarpa, F.; Barton, D.; Lakes, R.; Zhu, Y.; Lang, Z.; Peng, H. Large stiffness thermoformed open cell foams with auxeticity. Appl. Mater. Today 2020, 20, 100775. [Google Scholar] [CrossRef]
  16. Zhang, Q.; Lu, W.; Scarpa, F.; Barton, D.; Rankin, K.; Zhu, Y.; Lang, Z.-Q.; Peng, H.-X. Topological characteristics and mechanical properties of uniaxially thermoformed auxetic foam. Mater. Des. 2021, 211, 110139. [Google Scholar] [CrossRef]
  17. Zhang, Q.; Yu, X.; Scarpa, F.; Barton, D.; Rankin, K.; Lang, Z.; Zhang, D. Anisotropy in conventional and uniaxially thermoformed auxetic polymer foams. Compos. B Eng. 2011, 237, 109849. [Google Scholar] [CrossRef]
  18. Martz, E.; Lee, T.; Lakes, R.; Goel, V.; Park, J. Re-entrant transformation of methods in closed cell foams, adapted from cellular polymers. Polymers 1996, 15, 229. [Google Scholar]
  19. Fan, D.; Li, M.; Qiu, J.; Xing, H.; Jiang, Z.; Tang, T. Preparing Auxetic Foam from Closed-Cell Polymer Foam Based on the Steam Penetration and Condensation Process. ACS Appl. Mater. Interfaces 2018, 10, 22669. [Google Scholar] [CrossRef]
  20. Duncan, O.; Allen, T.; Birch, A.; Foster, L.; Hart, J.; Alderson, A. Effect of steam conversion on the cellular structure, Young’s modulus and negative Poisson’s ratio of closed-cell foam. Smart Mater. Struct. 2020, 30, 015031. [Google Scholar] [CrossRef]
  21. Duncan, O.; Leslie, G.; Moyle, S.; Sawtell, D.A.G.; Allen, T. Developments on auxetic closed cell foam pressure vessel fabrications. Smart Mater. Struct. 2022, 31, 074002. [Google Scholar] [CrossRef]
  22. Li, N.; Liu, Z.; Shi, X.; Fan, D.; Xing, H.; Qiu, J.; Li, M.; Tang, T. Preparing Polypropylene Auxetic Foam by a One-Pot CO2 Foaming Process. Adv. Eng. Mater. 2021, 24, 2100859. [Google Scholar] [CrossRef]
  23. Fan, D.; Shi, Z.; Li, N.; Qiu, J.; Xing, H.; Jiang, Z.; Li, M.; Tang, T. Novel Method for Preparing a High-Performance Auxetic Foam Directly from Polymer Resin by a One-Pot CO2 Foaming Process. ACS Appl. Mater. Interfaces 2020, 12, 48040–48048. [Google Scholar] [CrossRef]
  24. Duncan, O.; Bailly, N.; Allen, T.; Petit, Y.; Wagnac, E.; Alderson, A. Effect of Compressive Strain Rate on Auxetic Foam. Appl. Sci. 2021, 11, 1207. [Google Scholar] [CrossRef]
  25. Critchley, R.; Corni, I.; Wharton, J.; Walsh, F.; Wood, R.; Stokes, K. A review of the manufacture, mechanical properties and potential applications of auxetic foams. Phys. Status. Solid 2013, 250, 1963–1982. [Google Scholar] [CrossRef]
  26. Evans, K.; Alderson, A. Auxetic Materials: Functional Materials and Structures from Lateral Thinking. Adv. Mater. 2000, 12, 617–628. [Google Scholar] [CrossRef]
  27. Frioui, N.; Bezazi, A.; Remillat, C.; Scarpa, F.; Gomez, J. Viscoelastic and compression fatigue properties of closed cell PVDF foam. Mech. Mater. 2010, 42, 189. [Google Scholar] [CrossRef]
  28. Belaadi, A.; Bezazi, A.; Bourchak, M.; Scarpa, F. Tensile static and fatigue behaviour of sisal fibres. Mater. Des. 2012, 46, 76–83. [Google Scholar] [CrossRef]
  29. Panin, S.; Bogdanov, A.; Eremin, A.; Buslovich, D.; Alexenko, V. Estimating Low- and High-Cyclic Fatigue of Polyimide-CF-PTFE Composite through Variation of Mechanical Hysteresis Loops. Materials 2022, 15, 4656. [Google Scholar] [CrossRef]
  30. Li, D.; Zhou, L.; Wang, X.; He, L.; Yang, X. Effect of Crystallinity of Polyethylene with Different Densities on Breakdown Strength and Conductance Property. Materials 2019, 12, 1746. [Google Scholar] [CrossRef] [Green Version]
  31. Bouchahdane, K.; Ouelaa, N.; Belaadi, A. Static and fatigue compression behaviour of conventional and auxetic open-cell foam. Adv. Mater. Struct. 2021, 29, 6154–6167. [Google Scholar] [CrossRef]
  32. Yuan, S.; Chua, C.K.; Zhou, K. 3D-Printed Mechanical Metamaterials with High Energy Absorption. Adv. Mater. Technol. 2019, 4, 1800419. [Google Scholar] [CrossRef]
  33. Williams, J.; Bartos, J.; Wilkerson, M. Elastic modulus dependence on density for polymeric foams with systematically changing microstructures. J. Mater. Sci. 1990, 25, 5134. [Google Scholar] [CrossRef]
  34. Bezazi, A.; Scarpa, F. Tensile fatigue of conventional and negative Poisson’s ratio open cell PU foams. Int. J. Fatigue 2009, 31, 488–494. [Google Scholar] [CrossRef]
  35. Zhang, Y.; Rodrigue, D. High Density Polyethylene Foams. II. Elastic Modulus. J. Appl. Polym. Sci. 2003, 90, 2130. [Google Scholar] [CrossRef]
  36. Scarpa, F.; Giacomin, J.; Bezazi, A.; Bullough, W. Dynamic behavior and damping capacity of auxetic foam pads. In Smart Structures and Materials 2006: Damping and Isolation; SPIE: Bellingham, WA, USA, 2006; Volume 6169. [Google Scholar] [CrossRef] [Green Version]
  37. Duncan, O.; Shepherd, T.; Moroney, C.; Foster, L.; Venkatraman, P.D.; Winwood, K.; Allen, T.; Alderson, A. Review of Auxetic Materials for Sports Applications: Expanding Options in Comfort and Protection. Appl. Sci. 2018, 8, 941. [Google Scholar] [CrossRef]
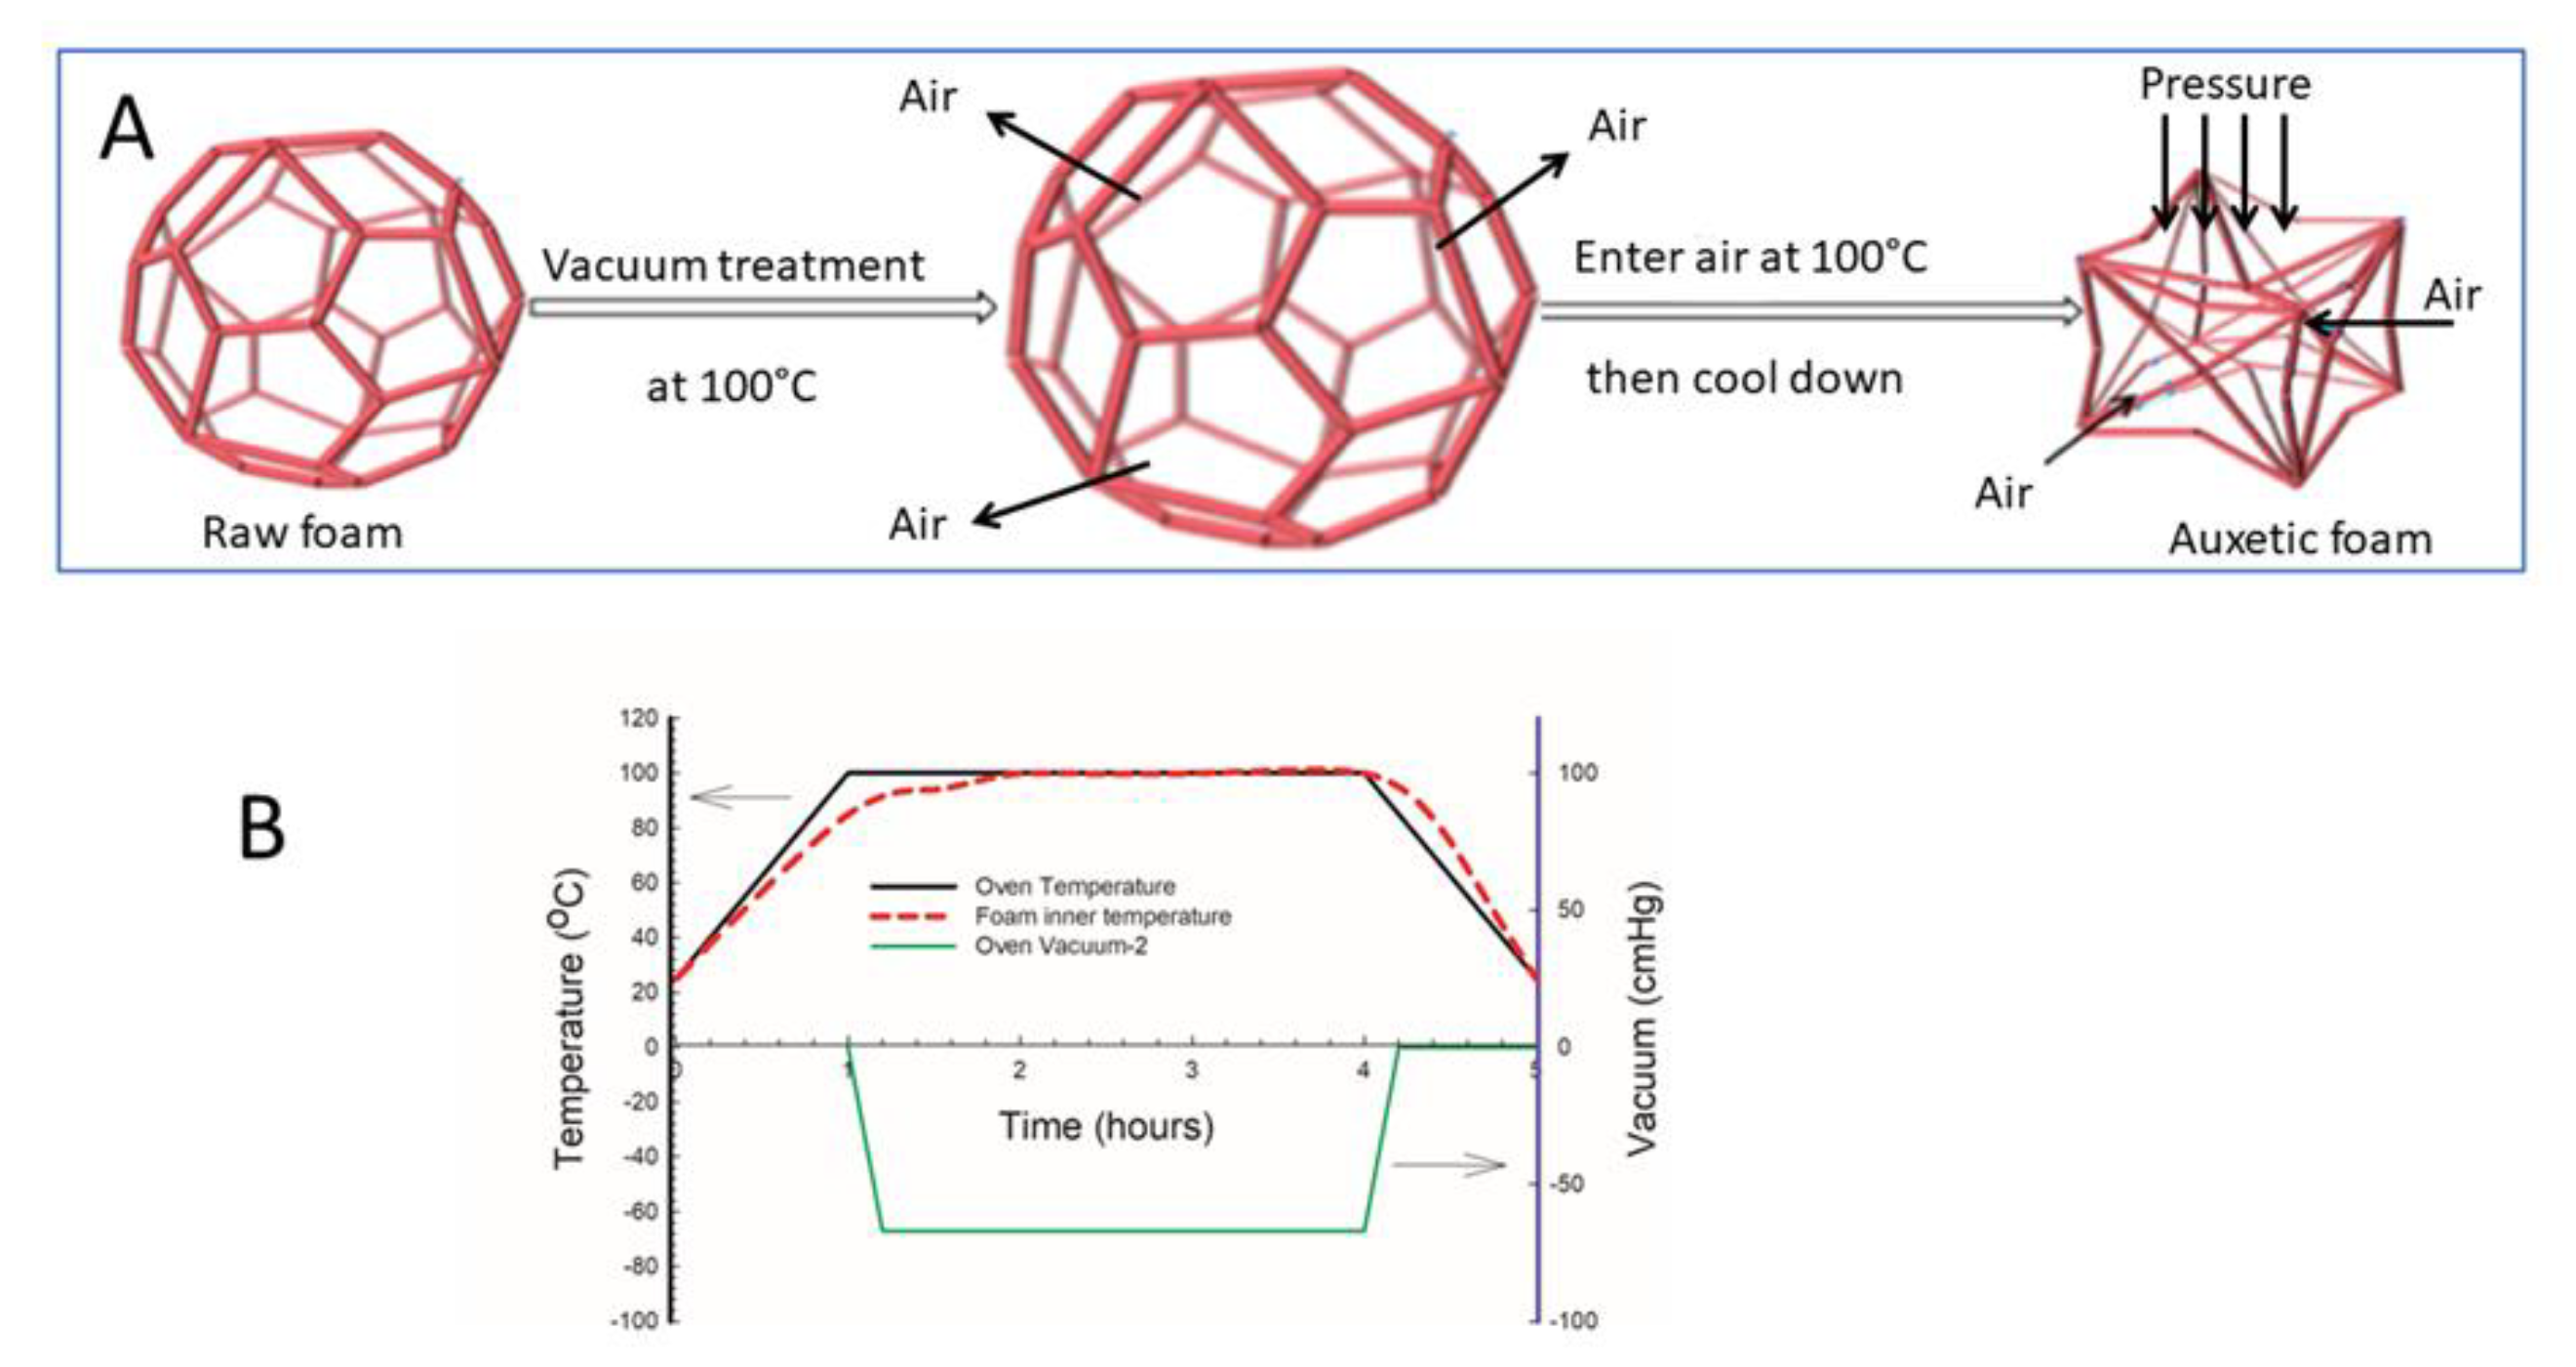
Figure 1. (A) Schematic representation of the mechanism generating a re-entrant structure from a polygonal morphology via vacuum combined with mechanical compression (VMC) and (B) the temperature profile imposed.
Applsci 13 01148 g001
Figure 2. DSC curves (second heating) for the initial polyethylene foams.
Applsci 13 01148 g002
Figure 3. Typical images of the initial foams: (A) D16, (B) D21, (C) D30 and (D) D36; and the auxetic foams: (E) PE-D16-P1.5, (F) PE-D21-P1.9, (G) PE-D30-P2.0 and (H) D36. PE-D36-P1.5.
Applsci 13 01148 g003
Figure 4. Poisson’s ratio as a function of tensile engineering strain for samples based on D16 (different vacuum conditions).
Applsci 13 01148 g004
Figure 5. Poisson’s ratio as a function of tensile engineering strain for auxetic foams produced under different conditions (temperature and mechanical compression) with their initial foams based on (A) D16, (B) D21, (C) D30 and (D) D36.
Applsci 13 01148 g005
Figure 6. Poisson’s ratio as a function of compressive engineering strain for auxetic foams produced under different conditions (temperature and mechanical compression) with their initial foams based on (A) D16, (B) D21, (C) D30 and (D) D36.
Applsci 13 01148 g006
Figure 7. Tensile stress–strain plots of the auxetic and original foams based on (A) D16, (B) D21, (C) D30 and (D) D36.
Applsci 13 01148 g007
Figure 8. Tensile hysteresis loops of the auxetic and original foams based on (A) D16, (B) D21, (C) D30 and (D) D36.
Applsci 13 01148 g008
Figure 9. Compressive stress–strain diagrams for the auxetic and original foams based on (A) D16, (B) D21, (C) D30 and (D) D36.
Applsci 13 01148 g009
Figure 10. Compressive hysteresis loops for the auxetic and original foams based on (A) D16, (B) D21, (C) D30 and (D) D36.
Applsci 13 01148 g010
Table 1. Properties of the initial LDPE and auxetic foams.
Foam CodeInitial Foam DensityCell DiameterPorosityOCPAuxetic Foam CodeDensityPorosityOCP
-kg/m3µm%%-kg/m3%%
D1615.5 ± 0.4752 ± 20498.47.3PE-D16-P1.5120.086.943.8
D2120.9 ± 0.31107 ± 23897.812.3PE-D21-P1.698.989.219.8
D3029.7 ± 0.31209 ± 27996.88.3PE-D30-P1.5116.087.322.2
D3635.6 ± 0.4694 ± 20396.26.3PE-D36-P1.589.690.310.1
Table 2. DSC results (main peak) of the initial LDPE and auxetic foams.
SampleTm
(°C)
ΔHm
(J/g)
Xc
(%)
Auxetic FoamsTm
(°C)
ΔHm
(J/g)
Xc
(%)
D16110.345.715.6PE-D16-P1.5110.115.05.1
D21107.364.821.8PE-D21-P1.6107.912.64.3
D30108.845.515.5PE-D30-P1.5108.918.56.3
D36112.094.832.4PE-D36-P1.5112.215.45.2
Table 3. Performance of auxetic LDPE foams.
SampleInitial Density (kg/m3)Final Density (kg/m3)Compression Ratio (Df/Do)Minimum PR (Tension)Minimum PR (Compression)
D16PE-D16-O15.515.510.38 (mean)0.10 (mean)
PE-D16-P1.015.576.04.90−2.55−0.61
PE-D16-P1.315.51097.03−2.83−0.60
PE-D16-P1.515.51187.61−2.89−0.65
PE-D16-P1.815.51207.74−0.89−0.28
D21PE-D21-O20.920.910.34 (mean)0.08 (mean)
PE-T105-D21-P1.520.988.04.21−1.52−0.35
PE-D21-P1.620.988.84.25−1.60−0.32
PE-D21-P1.920.998.44.71−2.55−0.33
PE-D21-P2.120.999.54.76−1.07−0.31
D30PE-D30-O29.729.710.37 (mean)0.16 (mean)
PE-D30-P1.529.71163.91−1.60−0.55
PE-D30-P1.829.71204.04−0.97−0.51
PE-D30-P2.029.71264.24−1.52−0.50
PE-T105-D30-P1.529.7125.24.22−1.00−0.49
D36D36-O35.635.610.40 (mean)0.13 (mean)
PE-D36-P2.135.6108.73.05−0.49−0.34
PE-D36-P1.835.689.02.50−0.72−0.32
PE-D36-P1.535.681.52.29−1.50−0.25
Table 4. Tensile properties of the auxetic foams produced.
SampleTensile Modulus (kPa)Strain Energy (Ep) (kPa)Energy Dissipated
(Ed) (mJ/cm3)
Damping Capacity
(%)
Tensile NPR
(-)
PE-D16-O3.2625.00.953.800.38
PE-D16-P1.03.9731.21.223.91−2.55
PE-D16-P1.315.664.63.475.68−2.83
PE-D16-P1.540.413615.511.4−2.89
PE-D21-O1.7320.30.472.380.34
PE-D21-P1.62.0613.71.9716.7−1.60
PE-D21-P1.96.0767.44.917.28−2.55
PE-D21-P2.130.181.311.213.8−1.07
PE-D30-O2.3949.50.430.8710.37
PE-D30-P1.51.133.410.4613.4−1.60
PE-D30-P1.83.4924.91.305.20−0.97
PE-D30-P2.03.5420.61.838.88−1.52
PE-D36-O2.1864.50.0780.120.40
PE-D36-P1.56.3931.61.695.30−1.50
PE-D36-P1.85.1133.31.775.33−0.72
PE-D36-P2.19.4452.58.1315.5−0.49
SampleCompressive Modulus (kPa)Strain Energy(Ep)(kPa)Energy Dissipated
(Ed)(mJ/cm3)
Damping Capacity
(%)
PE-D16-O0.2092.410.0863.56
PE-D16-P1.00.1591.640.2414.3
PE-D16-P1.30.2683.890.5113.0
PE-D16-P1.51.042.550.2610.2
PE-D21-O0.6783.090.3410.9
PE-D21-P1.60.7602.260.4620.2
PE-D21-P1.90.4393.420.3712.3
PE-D21-P2.10.9424.540.4510.0
PE-D30-O0.7885.630.346.11
PE-D30-P1.50.4713.410.4613.4
PE-D30-P1.82.425.650.6112.0
PE-D30-P2.01.718.601.9629.7
PE-D36-O1.684.280.6815.8
PE-D36-P1.52.567.191.9026.4
PE-D36-P1.83.108.922.5028.1
PE-D36-P2.12.5417.63.4319.5
Disclaimer/Publisher’s Note: The statements, opinions and data contained in all publications are solely those of the individual author(s) and contributor(s) and not of MDPI and/or the editor(s). MDPI and/or the editor(s) disclaim responsibility for any injury to people or property resulting from any ideas, methods, instructions or products referred to in the content.