Article

All-Year Dropout Prediction Modeling and Analysis for University Students

1
Department of Management Information Systems, Graduate School, Dong-A University, Busan 49315, Republic of Korea
2
Smart Logistics R&D Center, Dong-A University, Busan 49315, Republic of Korea
*
Author to whom correspondence should be addressed.
Appl. Sci. 2023, 13(2), 1143; https://doi.org/10.3390/app13021143
Submission received: 25 October 2022 / Revised: 2 January 2023 / Accepted: 12 January 2023 / Published: 14 January 2023
(This article belongs to the Special Issue Artificial Intelligence in Online Higher Educational Data Mining)

Abstract

:
The core of dropout prediction lies in the selection of predictive models and feature tables. Machine learning models have been shown to predict student dropouts accurately. Because students may drop out of school in any semester, the student history data recorded in the academic management system would have a different length. The different length of student history data poses a challenge for generating feature tables. Most current studies predict student dropouts in the first academic year and therefore avoid discussing this issue. The central assumption of these studies is that more than 50% of dropouts will leave school in the first academic year. However, in our study, we found the distribution of dropouts is evenly distributed in all academic years based on the dataset from a Korean university. This result suggests that Korean students’ data characteristics included in our dataset may differ from those of other developed countries. More specifically, the result that dropouts are evenly distributed throughout the academic years indicates the importance of a dropout prediction for the students in any academic year. Based on this, we explore the universal feature tables applicable to dropout prediction for university students in any academic year. We design several feature tables and compare the performance of six machine learning models on these feature tables. We find that the mean value-based feature table exhibits better generalization, and the model based on the gradient boosting technique performs better than other models. This result reveals the importance of students’ historical information in predicting dropout.

1. Introduction

Dropping out of school has globally become a significant challenge most universities are facing. According to a recent study by UNESCO [1], the disruption to education caused by COVID-19 has put 24 million learners at risk of not being able to continue their studies. The study notes that higher education is likely to experience the highest dropout rate and a projected 3.5% decline rate in enrolment, which is expected to result in 7.9 million fewer students. Many students experience various difficulties in school life, which eventually cause them to give up studying. However, the difficulties those dropout students face cannot be solved just by dropping out. After the dropout students enter society, the difficulties these dropout students face at school will turn into social pressure due to their premature entry into society and academic failure. This may result in employment difficulties, low income, and even crime [2].
The reasons for dropping out can be attributed to school, family, society, and psychology [3,4,5,6,7]. A number of studies have shown that the mono-causal approach is not enough to accurately explain the phenomenon of students dropping out, but a multitude of factors must be considered [8,9]. The studies on online courses indicated that time-dependent data on student trajectories could be used to predict dropouts [10,11,12]. Dropout prediction can be transformed into a sequence classification problem by obtaining students’ continuous features over time [10,11]. However, offline education rarely uses time series to solve dropout problems because it is challenging to get the same large data streams as online education.
Machine learning has been shown to effectively extract features from data [13]. Using machine learning techniques to identify students at risk of dropping out has also proven effective [14,15,16]. Decision tree-based models such as XGBoost [17] and random forest [18] achieve excellent results with a small number of features and sample sizes [14,15]. The authors in [14] reported an XGBoost model with 90% accuracy in predicting dropout. In another study [15], the authors reported a 93% accuracy of the random forest model in predicting dropout. In these studies [14,15,16], grades proved to be the most important feature. However, a detailed discussion of the way features are generated is lacking. The impact of feature-generation methods on model performance is unclear.
How the feature is generated determines the prediction model’s performance [19]. The feature table represents how the feature is organized and determines the information that the model can obtain. Students in different semesters will have different data lengths; for example, a student in the third semester will have three semesters of scholarship records, while a student in the second semester will have only two. The method used to effectively process these data to generate feature tables that predict dropout has not been studied quantitatively. Most current research predicts student dropouts in the first academic year [20,21,22,23,24] and therefore avoids discussing this issue. However, the model’s generalizability is limited if it only considers the first or a specific academic year. The main challenge in providing dropout predictions for students across the academic year is the length of the data. Because students in different academic years have data of different lengths, how feature tables are extracted to obtain the best predictions has not been studied quantitatively.
Therefore, the purpose of this study is to explore the most applicable feature table generation methods for university dropout prediction in all academic years. In this study, based on data from 60,010 students from a Korean university, we (i) analyze dropout-related factors hidden in student trajectory data, (ii) design four sets of feature tables to summarize student trajectory data and compare the performance of six machine learning models on these feature tables. The main contributions of this paper are summarized as follows: (1) To the best of our knowledge, this is a pioneering study exploring how the feature tables for machine learning are generated when conducting dropout prediction for university students in all academic years; (2) We identified the dropout-related factors hidden in student trajectory data; (3) We explored the temporal distribution of dropout students’ characteristics based on the analysis of large data set (n = 60,010); (4) We evaluated 6 dropout prediction models for 4 feature tables based on using the F1 Score, precision, recall, and accuracy.
The rest of the paper is organized as follows: In Section 2, we introduce the contribution factors of student dropout and current research on dropout prediction. In Section 3, we describe the dataset and data pre-processing methods we used, and we then describe the feature generation methods and the machine learning models we used. At the end of Section 3, we introduce the SMOTE method that can solve the data imbalance. In Section 4, We analyze the characteristic correlations and the temporal distribution of dropout students, and we then evaluate the performance of the proposed models. In Section 5 the conclusions are given.

2. Related Works

2.1. The Contribution Factors of Student Dropout

The studies over the past two decades have provided important information on the relevance of student performance and student dropout. The majority of the studies reveal a series of common characteristics and center their analyzes on the following group of variables: the grade point average (GPA), the number of late to class, the number of absent from class, the number of talks with the professor, the student’s major and discipline. Most studies regard grades as the most critical factor influencing students’ decisions to drop out. Respondek et al. [25] indicated that the longitudinal linkages between perceived academic control and university grades revealed their influence on subsequent dropouts. Rovira et al. [26] performed similar research to show the relationship between GPA and dropouts and revealed that the academic data could be used to predict the course grade and dropouts. The authors in [15] analyzed the data from the 261 students and revealed that grades and attendance are the essential factors that predict student dropout.
Although school performance can be seen as a crucial contributing factor to student dropout, social and family factors also play an essential role. A large volume of published studies describes the role of social integration and family factor in student dropout. A recent study by [27] showed that those students who were farther away from family support were 1.32 times more likely to drop out each semester. On the other hand, the financial ability of the student’s family and the financial support or scholarship that the university can provide are considered to be the key factors affecting the student’s decision to drop out [28]. Rising tuition costs may exacerbate the economic impact of student dropouts [29].
Recent research has revealed some personal factors that contribute to dropping out of university. Stinebrickner et al. [30] reported that a student’s major influences dropout intentions and that students’ excessive optimism about completing a science degree might lead to higher dropout rates. Moreira da Silva et al. [14] reported that age is an essential factor in academic dropout. The authors claim that the successful completion of the course depends on the maturity of the students (age).
These studies together provide important insight into the role of school factors, family factors, social factors, and student personal factors in student dropout. Therefore, this study comprehensively collected the features of students’ school performance, scholarship, and personal background from the dataset to predict student dropout. The authors describe the features used in this study in Section 3.1.

2.2. Student Dropout Prediction

The key factors associated with student dropouts have been described in the previous section; however, the effective use of these features for dropout prediction requires machine learning techniques. The literature has revealed that the pattern hidden in educational data can be used to predict student dropout using machine learning technologies and that better predictive models can be developed by combining knowledge from other fields [31]. Sivakumar et al. [32] improved the traditional decision tree algorithm using Rényi Entropy, Information Gain, and Association Function. The authors reported that the accuracy of predicting student dropout was 97.50%, significantly higher than the traditional decision tree’s 92.50%. The authors in [33] proposed the Bayesian profile regression approach and emphasized the importance of students’ performance, motivation, and resilience in identifying students at risk of academic failure.
The key factors determining model performance are features and sample size. Table 1 sums up the models, sample sizes, features, metrics used and the results obtained in previous studies.
High school grades and performance are often used to predict dropout probability for first-year college freshmen. Nagy and Molontay [24] used personal information and high school grades to predict the dropout probability for first-academic-year freshmen. The study used a large dataset containing 15,825 student data. However, the insufficient accuracy (0.74) indicates that the feature or model needs improvement. Cardona and Cudney [34] used high school data and academic grades as features and reported an accuracy of 0.78. This result shows that adding academic grade information can improve the accuracy of the model’s prediction. Del Bonifro et al. [16] also demonstrated this result with a larger dataset. Plagge [22] used academic performance to predict first-year student dropout based on 5955 students’ data. The author claimed that accuracy is directly related to dataset size. Other studies reveal that better predictive models can be developed by combining knowledge from other features. Kemper et al. [35] reported a 0.89 accuracy of the decision tree based on 3176 students’ data. The authors found a strong correlation between the average exam pass rate and dropout, which allows us to reduce the model complexity and get good results. Kabathova and Drlik [15] proposed a more fine-grained model based on course-level features. Although the dataset used is very small, the dropout prediction model tailored to individuals may be more accurate. Moreira da Silva et al. [14] found that students’ personal details, like age, are also an important factor in student dropout.
However, the complexity of dropout prediction is not only reflected in the selection of features but also in the processing of time-dependent features. As stated in the fourth paragraph of Section 1, there have been no quantitative studies on how to handle student data of different lengths in different semesters. Some studies [14,34,35] do not use features that vary across academic years or do not discuss how data from different years are treated. Other studies [15,16] used data from the first academic year or a specific academic year to predict dropout and therefore do not discuss this issue. In similar areas of research, for example, predicting online course dropout, the impact of time-dependent features on dropout has been identified [10,11,36]. However, dropout prediction methods based on online courses are not suitable for offline dropout prediction due to different data structures. Therefore, it is necessary to quantitatively study the processing methods of time-related features.

3. Methodology

3.1. Data Description

The sample group consists of 60,010 students enrolled in a major university in South Korea from 2010 to 2021. The student data contain each student’s attendance history, grades for all courses, scholarship for each semester, family income, gender, age, number of leave of absence, and tuition payment history. All student data are anonymized. Table 2 shows the 23 features used in this study. We use the cohort dropout rate method [37] to calculate the dropout rate of students in the dataset. Table 3 presents the summary statistics for the student dropout rate from 2010 to 2021, calculated according to the Cohort Method. The university had a total of 60,010 students during these 12 years. Among them, 29,099 students have graduated, 6963 students have dropped out of school, and the remaining 23,948 students are in school or suspended from school. The significant drop in the dropout rate after 2015 is that there are still students who have not graduated. It usually takes six years for male students in South Korea to graduate from university due to South Korea’s compulsory military service system.

3.2. Data Preprocessing and Feature Generation

Irrelevant, noisy, and inconsistent data are removed in the data preprocessing stage. Null values are filled using the median value. Because students in different semesters have different historical data lengths, we propose the following four feature extraction methods to generate feature tables in a uniform format.
  • Mean value-based feature extraction approach. This method calculates the longitudinal average of each feature in the student data. For example, if a student in the 4th semester has four records of the number of scholarship awards, the mean value-based feature extraction approach calculates the mean of these four scholarship awards;
  • Median value-based feature extraction approach. This method calculates the longitudinal median of each feature in the student data;
  • Last semester data-based feature extraction approach. This method considers only the last valid semester data in the student data;
  • First-semester data-based feature extraction approach. This method considers only the first valid semester data in the student data.
Some features are seen as fixed attributes of students, so they are fixed in the feature table. These features are (1) Professional classification, (2) Sex, (3) Birth, and (4) Access year.

3.3. Machine Learning Models Used

This study use tree-based models, kernel-based models, and linear models for student dropout prediction, which belongs to a binary classification problem that the student will be dropped out or not.
Tree-based models use if-then-else rules to solve problems. All tree-based models can be used for classification (predicting categorical values) as well as regression (predicting numerical values). Kernel-based models transform nonlinear problems into linear problems in feature space to solve the problem. Linear models can be generalized as functions that make predictions from linear combinations of features. In this paper, five commonly used classification models have been used:
  • Four tree-based models: Decision Tree [38], which draws the different solutions of the decision as branches of the tree and uses the branching and pruning method to find the optimal solution. Random Forest [18], which consists of a bootstrap aggregation method that combines the predictions of many trees. LightGBM [39], which uses histogram-based algorithms and bucket continuous feature (attribute) values into discrete bins. XGBoost [17], which provides a parallel tree boosting to solve problems quickly
  • One linear model: Logistic regression [40], which is a linear model for classification often used as a baseline model;
  • One Kernel-based model: Support Vector Machine [41], which transforms a linearly inseparable problem in the original feature space into a linearly separable problem in a high-dimensional feature space.
Since student dropouts can be classified as a binary classification problem in machine learning, this study used four performance metrics to evaluate our models: accuracy, precision, recall, and F1 Score based on the confusion matrix, as shown in Table 4.
The accuracy is the percentage of the total sample that the model correctly predicted, defined as follows:
Accuracy = TP + TN TP + FP + FN + TN
The recall (or true positive rate) measures the ability of the model to detect positive samples, defined as follows:
Recall = TP TP + FN
The precision (or positive predictive value) is the ratio between the number of samples correctly classified as positive and the total number of samples classified as positive (correct or incorrect), defined as follows:
Precision = TP TP + FP
The F1 score comprehensively evaluates the classification performance of the classifier with precision and recall, defined as follows:
F 1   Score = 2 × TP 2 × TP + FP + FN

3.4. SMOTE

A significant challenge faced by DEWS is the data imbalance problem. Students who drop out only make up about 15% of the total number of students (according to Section 4.2), which can cause the model to over-fit non-dropout students and fail to accurately identify students who would drop out. SMOTE (Synthetic Minority Over-sampling Technique) was used as a data balancing algorithm for student dropout prediction [21,42,43]. SMOTE inserts artificially synthesized minority samples between samples closest to a minority sample, thereby increasing the number of minority class samples to balance the dataset. In our study, only the training dataset has been rebalanced, 50% non-dropout students and 50% dropout students, using the SMOTE algorithm, but the test dataset has not.

4. Results and Discussion

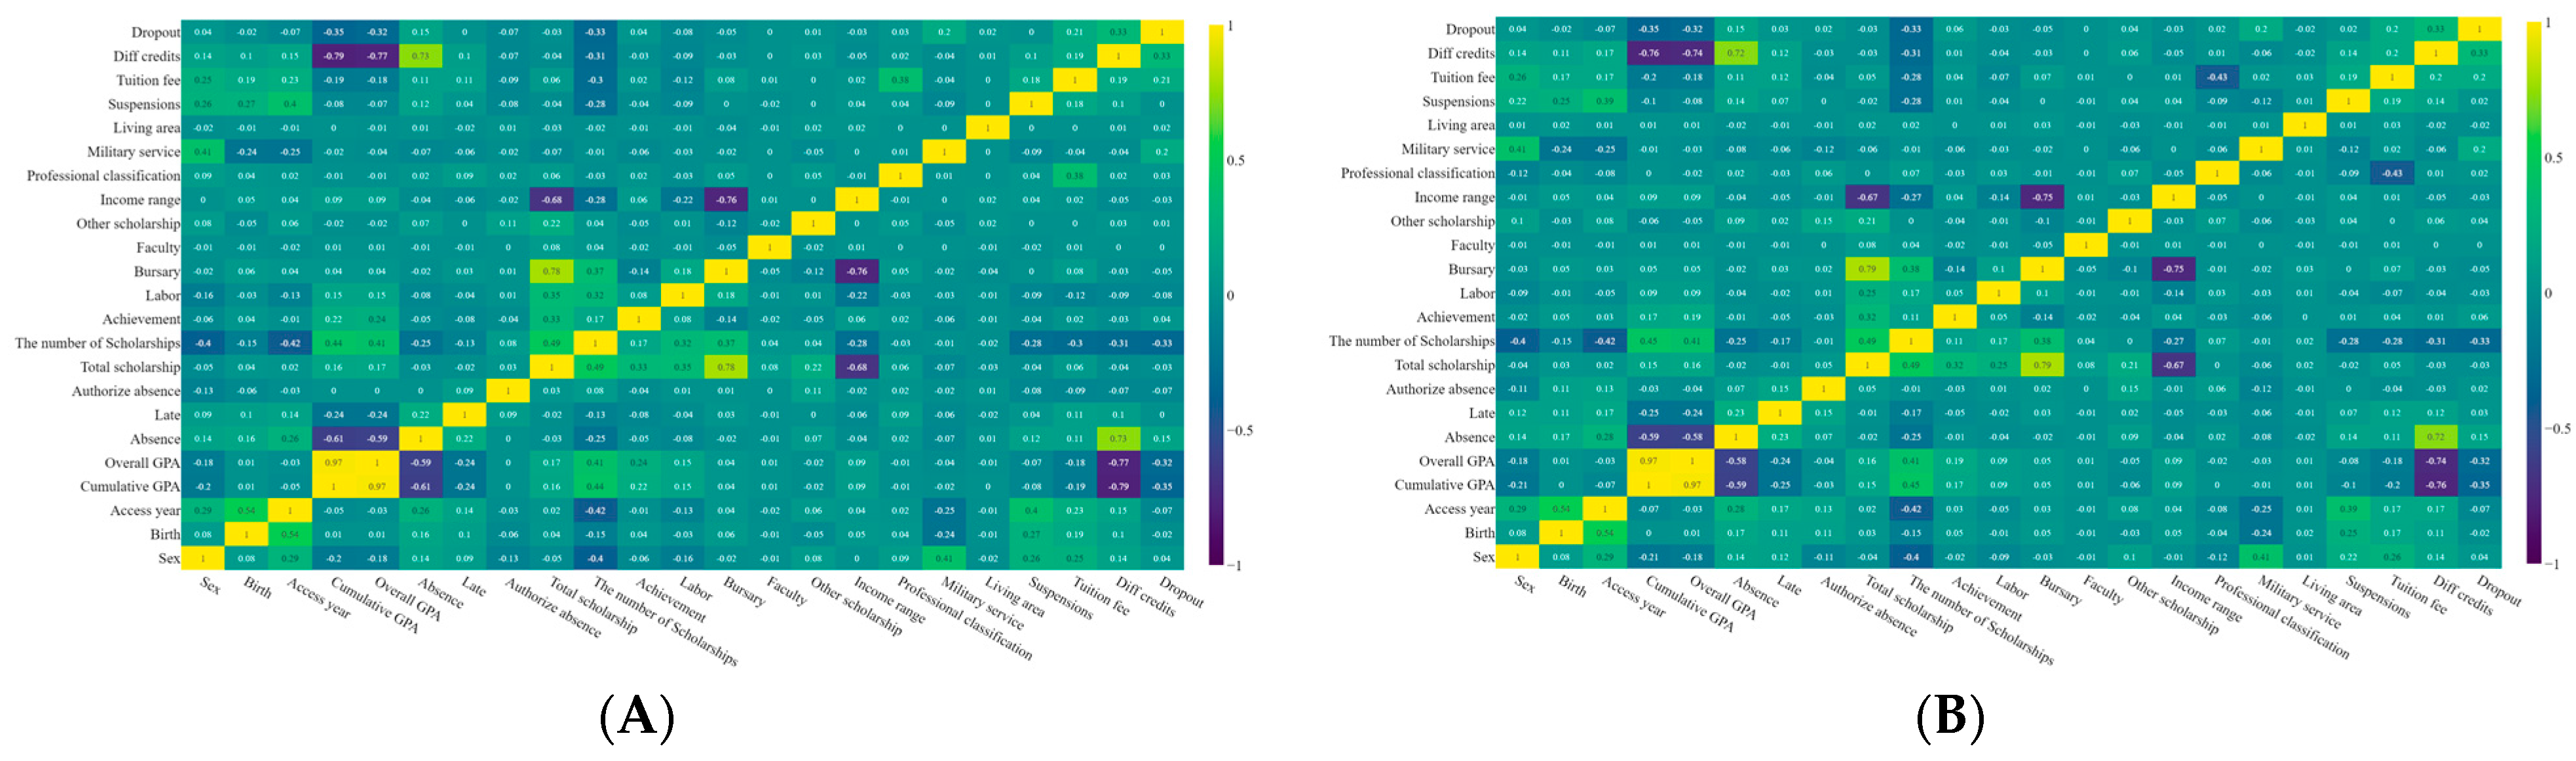
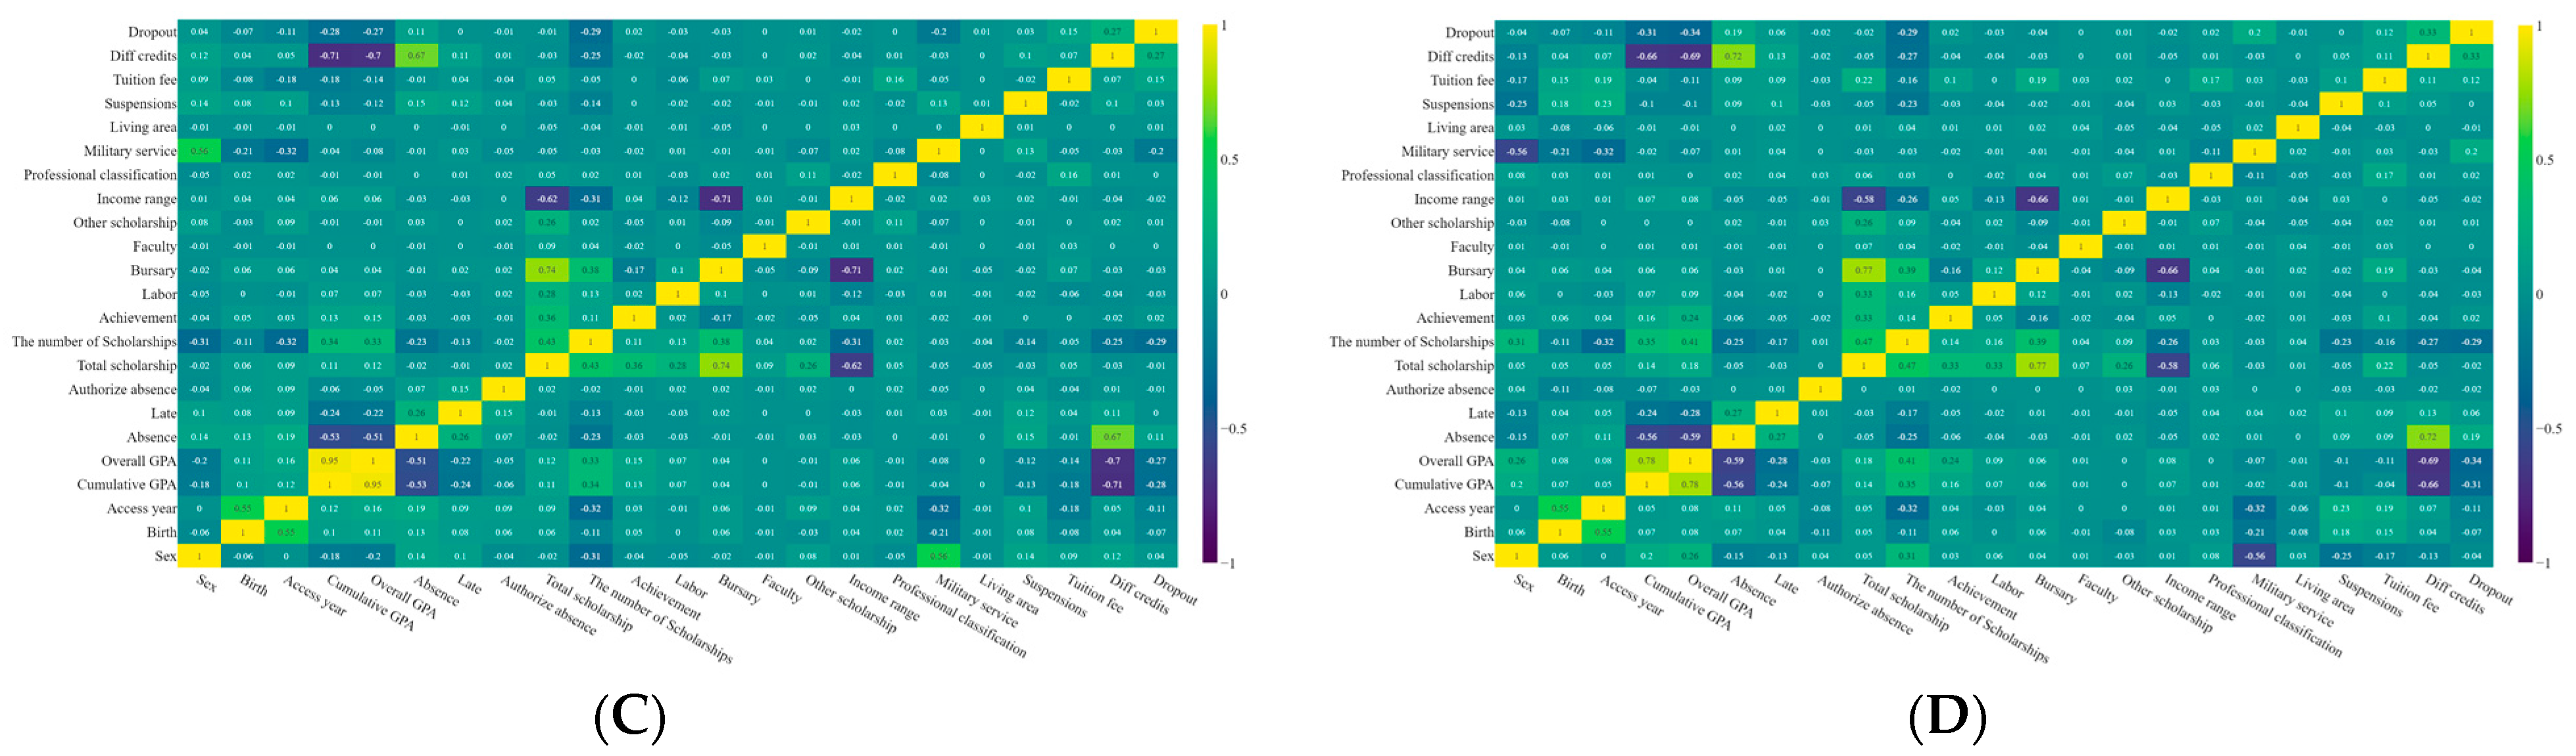
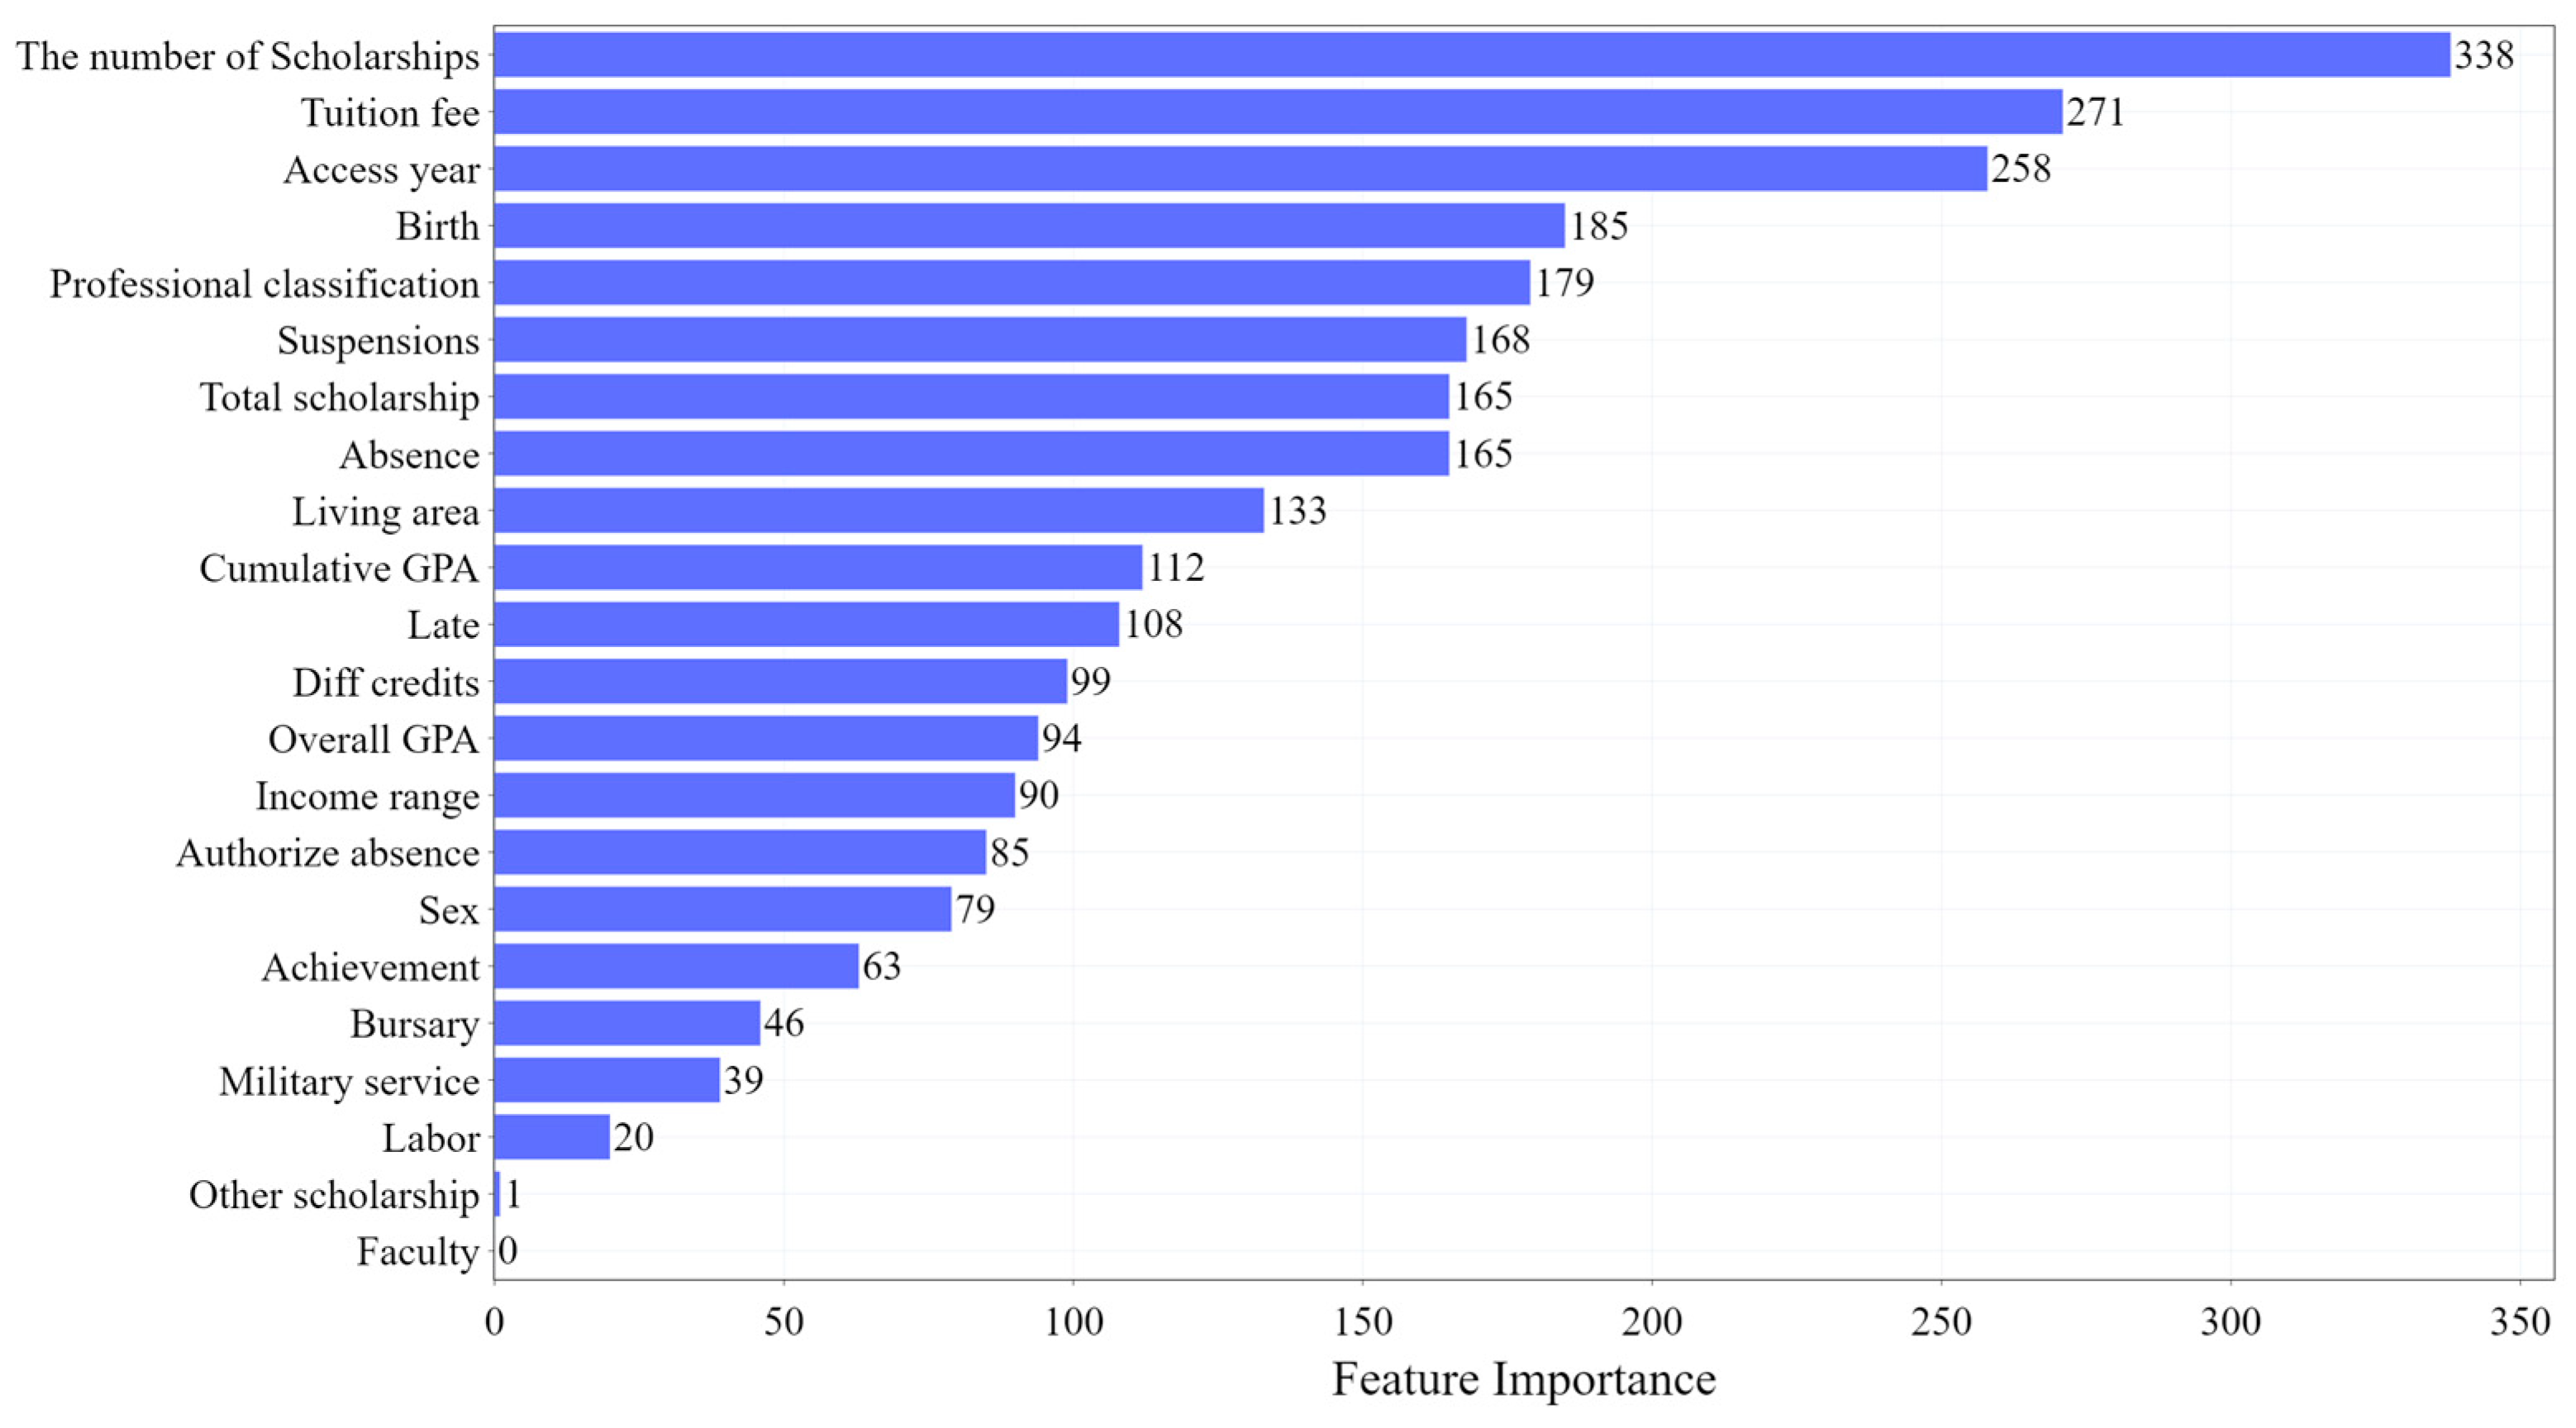
4.1. Feature Analysis

Figure 1 shows the heat map of the features generated by the four feature tables. What stands out in Figure 1 is that the GPA, the number of absences, and Diff Credits have a high correlation with dropout in the four heat maps. This reveals that school performance may play a significant role in student dropout. Since the correlation coefficient of the number of scholarships and the tuition fee is also relatively high, it could be considered that the financial situation of students also affects their decision to drop out. In addition, the number of absences and GPA are highly correlated, which suggests that absent students more often have relatively poorer school performance.
Although the four feature tables generate similar heat maps, some differences are worth mentioning. In Figure 1C, there is a negative correlation (−0.2) between military service and dropout, while positive correlations (0.2) appear in the rest of the graphs. The heat map in Figure 1C represents the generation method of the feature table based on the student data of the first semester. This means that in this feature table, only the data for each student’s first semester will be calculated. For these students, if they have served in the military, it means that the student served in the military before formally enrolling in the university. Therefore, it can be argued that these students’ university studies were not “interrupted” by military service, and thus they were less likely to drop out (military service is negatively associated with dropout).

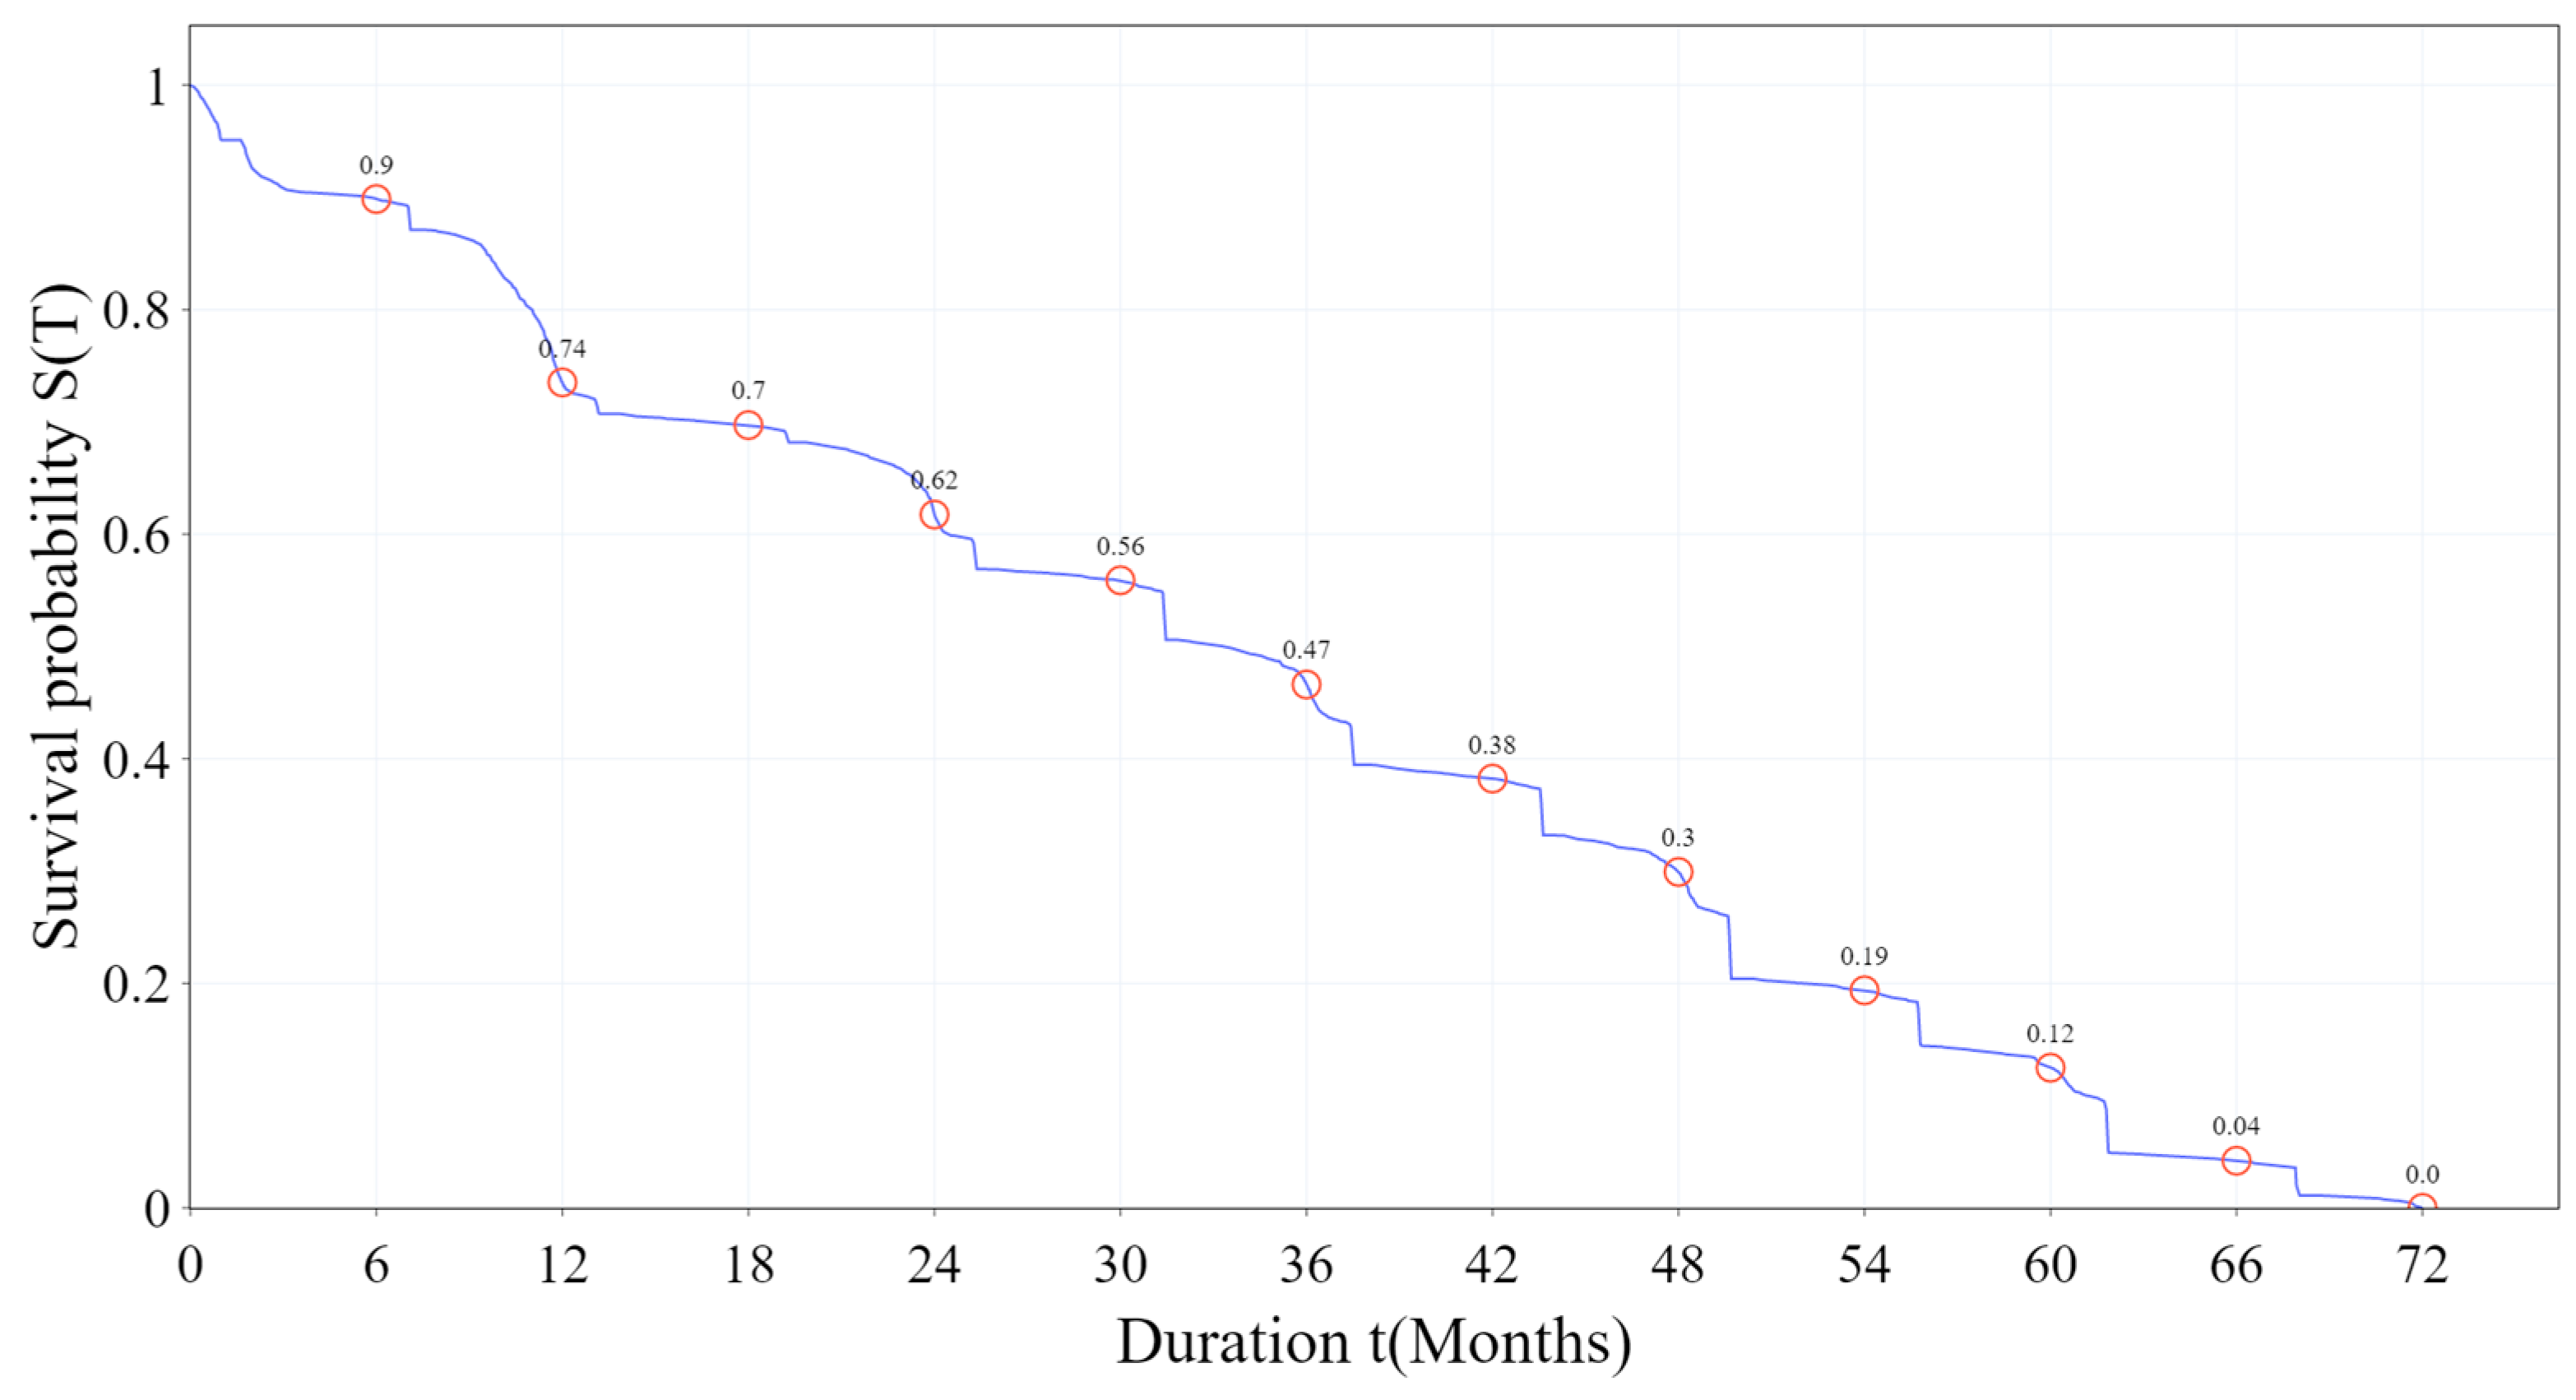
4.2. Kaplan–Meier Curve for Student Dropout

The Kaplan–Meier curve [44] measures the nonparametric empirical distribution of the occurrence of events in ordered discrete occurrence times. Figure 2 represents the Kaplan–Meier curve for student dropout. The x-axis represents the survival time of dropout students, and the y-axis represents the remaining proportion or survival probability of dropout students. Assuming that the dropout students’ proportion is one at the time of enrollment, it will gradually decrease to zero until the time of dropout. Therefore, the curve slope can indicate the rate of decrease for dropout students.
In detail, the curve shows that about 26% of students drop out in the first 12 months. After that, about 12% of students drop out in the next 12 months. The following 15% of students drop out between 24 and 36 months. The following 17% of students drop out between 36 and 48 months. The following 18% of students drop out in 48 and 60 months, and the remaining 12% leave in 60 months.
In short, the distribution of dropout probability is relatively uniform, but the dropout probability in the first school year is relatively higher than in other school years. This result is inconsistent with previous studies claiming that nearly 50% of all dropouts left college between 6 and 18 months [45,46,47]. This result demonstrates the importance of dropout prediction for students in all semesters rather than for a specific semester [15,16,21]. Therefore, we extract features from student data of different lengths to predict dropouts in all academic years and quantitatively investigate the impact of different feature table generation methods on the performance of the prediction models. The results are reported in Section 4.3.

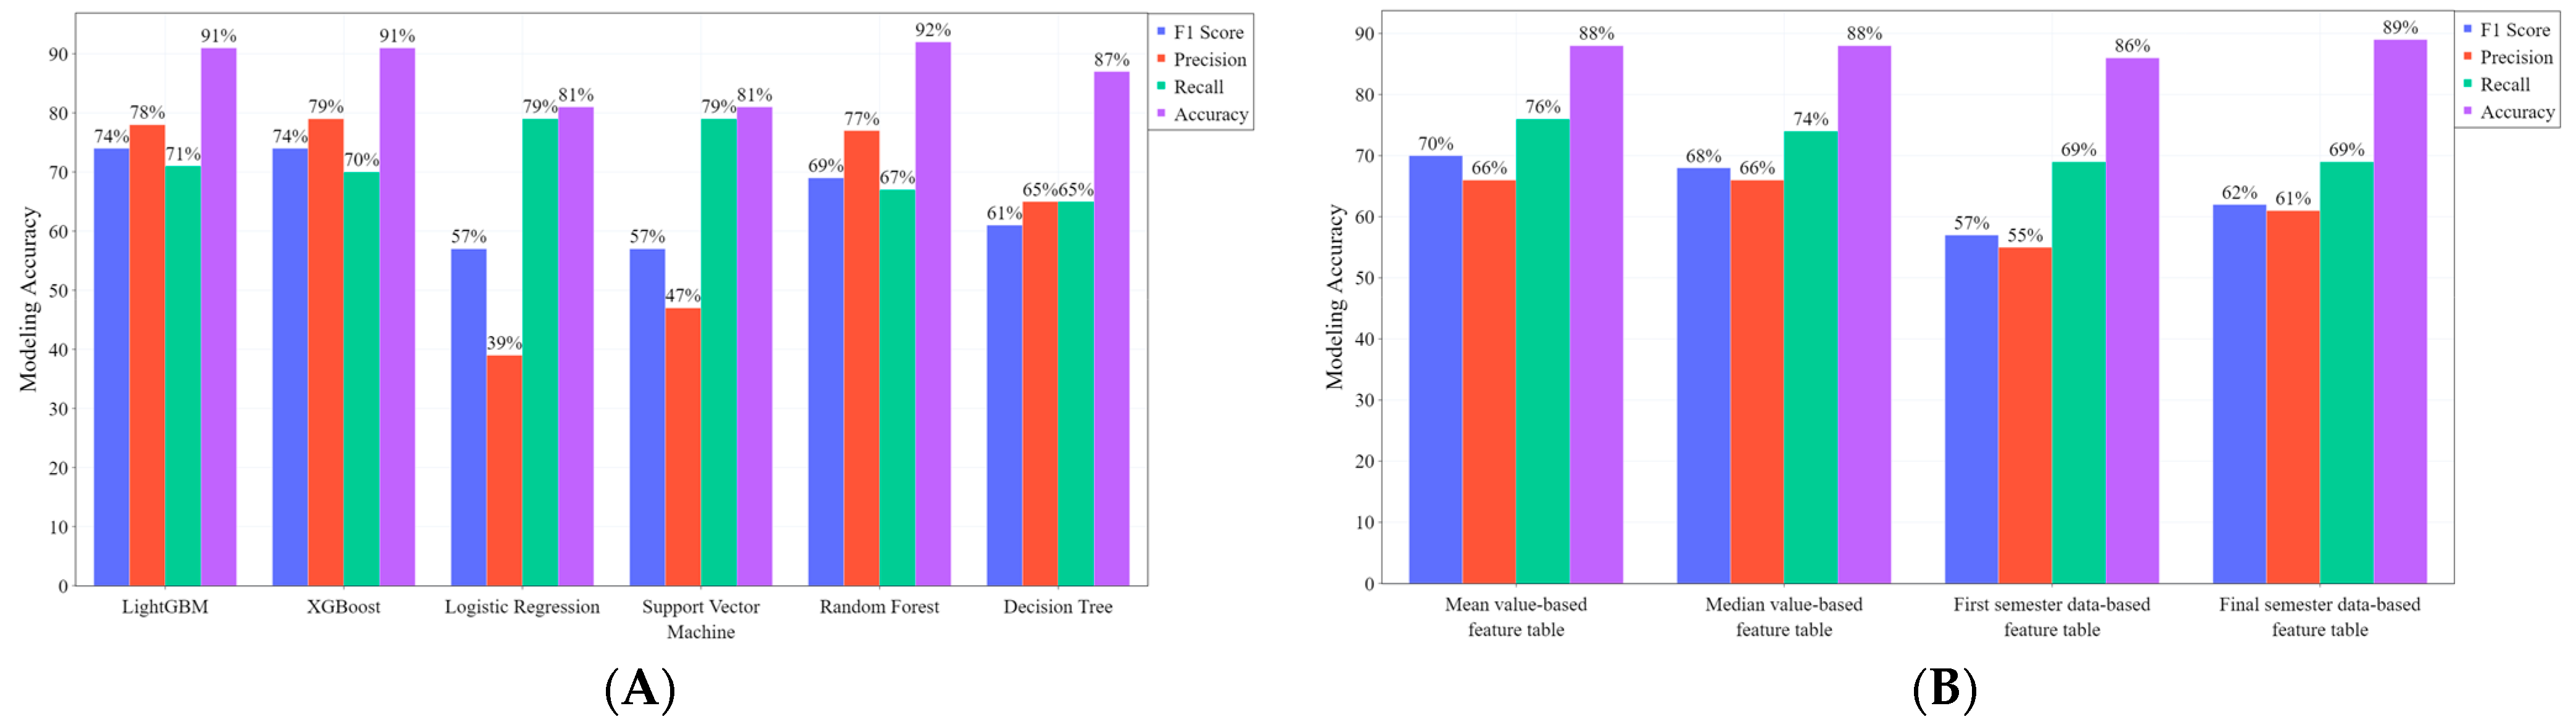
4.3. Model Test Results

There are a total of 60,010 student records in our dataset. Among them, the number of graduates is 29,099, the number of dropouts is 6963, and the remaining 23,948 students are in school or suspended from school. We divide the dataset as follows:
  • Training set: 70% of all graduates and dropouts, a total of 25,244 pieces of student data;
  • Test set: 30% of all graduates and dropouts, a total of 10,818 pieces of student data;
  • Prediction set: a total of 23,948 students in school or suspended from school were used to predict the possible dropouts in the future.
Table 5 shows the test results obtained by Logistic Regression, Decision Tree, Random Forest, LightGBM, Support Vector Machines, and XGBoost algorithms, reporting on the most popular indicators of success: accuracy, precision, recall, and F1 Score.
As shown in Table 5, the LightGBM model in the mean value-based feature table obtained the highest F1 score and accuracy on the test dataset with 79% and 94%, respectively. The precision value is 81%, which is only 2% different from the highest value of 79%. More specifically, the LightGBM model has relatively balanced precision and recall values, which means that the model can accurately distinguish dropout students from non-dropout students without much bias in the case of unbalanced samples. The XGBoost model in the median value-based feature table obtained the best precision and the second-best F1 score and accuracy.
Figure 3 reveals the performance of the feature tables and models in more detail. LightGBM and XGBoost have similar performance, while Logistic Regression, Support Vector Machine, and Decision Tree are insufficient (Figure 3A). Because both the LightGBM and XGBoot models are based on the gradient boost technique, the result reveals the superiority of the gradient boosting technique in predicting student dropout. In Figure 3B, the mean value-based feature table has the highest F1 Score (70%), precision (66%), and recall (76%). On the contrary, the average F1 Score, precision, and recall of the first and final semester-based feature table are significantly lower than the mean and median value-based feature table. This demonstrates that using features that include historical student data gets better predictive performance than using data from a particular point in time (semester). This result is also intuitive; for example, if a student in the third semester had excellent grades in the first two semesters but declined in the third semester, it would be inaccurate to consider only the first two semesters or the third semester when predicting dropout.
Figure 4 presents the feature importance of the LightGBM model trained in the mean value-based feature table. The three most important features are (1) tuition fee, (2) the average number of scholarships per semester, and (3) entry year. It is evident that for Korean university students included in this study, the economic aspect may be an important factor influencing whether they drop out of school. Tuition and scholarships reflect the financial pressures burdened by students’ families. This result is contrary to the study by [48], which reported that grades are the most important influencing factor. We believe this is due to the high tuition fees of private universities in South Korea, making it easier for students who cannot get scholarships to drop out. Our findings suggested that increasing scholarships and reducing tuition fees may be effective intervention measures to reduce the dropout rate.
Compared to previous studies [14,16,21,42,44] on dropout prediction centered on student achievement. The findings of this study reveal the importance of features that are unrelated or not directly related to grades in predicting dropout. As shown in Figure 4, among the top ten features of feature importance, there are 6 features that are irrelevant or not directly related to grades (tuition fee, access year, birth, professional classification, absence, and living area). Since current research on dropout prediction is mainly centered on academic performance, these features may be overlooked, resulting in a portion of students being left out of the dropout prediction system. Therefore, incorporating these features that are not or directly related to grades into the dropout prediction system may improve the system’s performance.
We have integrated the LightGBM model based on the mean value-based feature table with the university’s academic management system to predict dropouts. The proposed system has been put into operation. To interpret the model results for professors and students, we generate the dropout risk report, as shown in Figure 5. Compared to the average of the overall students, this student with a 92% probability of dropping out has a low average number of scholarship awards, while his average number of absences is high. This also illustrates that the mean value-based feature generation methods can identify students at risk of dropping out of school.

5. Conclusions

This study explored the most applicable feature table generation methods for university dropout prediction. We analyzed the factors associated with dropout in the student history data. Then we designed four different generation methods of feature tables and compared the performance of six machine learning models on these feature tables. Our results revealed that the distribution of dropout probability is evenly distributed in all academic years. This demonstrated the importance of dropout prediction for students in all semesters rather than for a specific semester.
Furthermore, our comparative study for feature table generation methods revealed that the mean value-based feature generation method is better than other methods when predicting dropout for a university student in all academic years. This provides a theoretical basis for future research about the prediction of university dropouts across the academic year. In addition, one of the strengths of our study is the completeness of the dataset. Compared to previous dropout studies with small samples [7,14], the complete data (n = 60,010) from one university and the detailed description of feature generation methods make the results of the model reliable. Some limitations of this study are worth noting. To compare the effects of different feature table generation methods on the model results, we did not perform feature combinations. Future research can therefore consider feature combinations based on the mean value-based feature table to obtain higher prediction performance.

Author Contributions

Conceptualization, Formal analysis, Investigation, Methodology, Writing—original draft, Writing—review & editing, Z.S.; Formal analysis, Writing—review & editing, S.-H.S.; Formal analysis, Investigation, D.-M.P.; Supervision, Validation, Data acquisition, Revising—review & editing, B.-K.P. All authors have read and agreed to the published version of the manuscript.

Funding

This work was supported by the Dong-A University research fund.

Institutional Review Board Statement

Not applicable.

Informed Consent Statement

Not applicable.

Data Availability Statement

The data presented in this study are available on request from the corresponding author. The data are not publicly available due to personal information leakage concerns.

Conflicts of Interest

The authors declare no conflict of interest.

References

  1. UNESCO. How Many Students Are at Risk of not Returning to School? Available online: http://www.unesco.org/open-access/terms-use-ccbysa-en (accessed on 16 August 2022).
  2. Council of Economic Advisers. Investing in Higher Education: Benefits, Challenges, and the State of Student Debt. 2016. Available online: https://obamawhitehouse.archives.gov/sites/default/files/page/files/20160718_cea_student_debt.pdf (accessed on 26 December 2022).
  3. Del Savio, A.A.; Galantini, K.; Pachas, A. Exploring the relationship between mental health-related problems and undergraduate student dropout: A case study within a civil engineering program. Heliyon 2022, 8, e09504. [Google Scholar] [CrossRef] [PubMed]
  4. Contreras, D.; González, L.; Láscar, S.; López, V. Negative teacher–student and student–student relationships are associated with school dropout: Evidence from a large-scale longitudinal study in Chile. Int. J. Educ. Dev. 2022, 91, 102576. [Google Scholar] [CrossRef]
  5. Masserini, L.; Bini, M. Does joining social media groups help to reduce students’ dropout within the first university year? Socioecon. Plann. Sci. 2021, 73, 100865. [Google Scholar] [CrossRef]
  6. Dahal, T.; Topping, K.; Levy, S. Educational factors influencing female students’ dropout from high schools in Nepal. Int. J. Educ. Res. 2019, 98, 67–76. [Google Scholar] [CrossRef]
  7. Oliveira Silva, G.; Aredes, N.D.A.; Galdino-Júnior, H. Academic performance, adaptation and mental health of nursing students: A cross-sectional study. Nurse Educ. Pract. 2021, 55, 103145. [Google Scholar] [CrossRef]
  8. Heredia, D.; Amaya, Y.; Barrientos, E. Student Dropout Predictive Model Using Data Mining Techniques. IEEE Lat. Am. Trans. 2015, 13, 3127–3134. [Google Scholar] [CrossRef]
  9. Araque, F.; Roldán, C.; Salguero, A. Factors influencing university drop out rates. Comput. Educ. 2009, 53, 563–574. [Google Scholar] [CrossRef]
  10. Prenkaj, B.; Distante, D.; Faralli, S.; Velardi, P. Hidden space deep sequential risk prediction on student trajectories. Futur. Gener. Comput. Syst. 2021, 125, 532–543. [Google Scholar] [CrossRef]
  11. Fei, M.; Yeung, D.-Y. Temporal Models for Predicting Student Dropout in Massive Open Online Courses. In Proceedings of the 2015 IEEE International Conference on Data Mining Workshop (ICDMW), Atlantic City, NJ, USA, 14–17 November 2015; IEEE: Pitscatway, NJ, USA, 2015; pp. 256–263. [Google Scholar]
  12. Xing, W.; Chen, X.; Stein, J.; Marcinkowski, M. Temporal predication of dropouts in MOOCs: Reaching the low hanging fruit through stacking generalization. Comput. Hum. Behav. 2016, 58, 119–129. [Google Scholar] [CrossRef]
  13. Song, Z.; Park, H.-J.; Thapa, N.; Yang, J.-G.; Harada, K.; Lee, S.; Shimada, H.; Park, H.; Park, B.-K. Carrying Position-Independent Ensemble Machine Learning Step-Counting Algorithm for Smartphones. Sensors 2022, 22, 3736. [Google Scholar] [CrossRef]
  14. Moreira da Silva, D.E.; Solteiro Pires, E.J.; Reis, A.; de Moura Oliveira, P.B.; Barroso, J. Forecasting Students Dropout: A UTAD University Study. Futur. Internet 2022, 14, 76. [Google Scholar] [CrossRef]
  15. Kabathova, J.; Drlik, M. Towards Predicting Student’s Dropout in University Courses Using Different Machine Learning Techniques. Appl. Sci. 2021, 11, 3130. [Google Scholar] [CrossRef]
  16. Del Bonifro, F.; Gabbrielli, M.; Lisanti, G.; Zingaro, S.P. Student Dropout Prediction. In Lecture Notes in Computer Science (Including Subseries Lecture Notes in Artificial Intelligence and Lecture Notes in Bioinformatics); Springer International Publishing: Midtown Manhattan, NY, USA, 2020; Volume 12163 LNAI, pp. 129–140. ISBN 9783030522360. [Google Scholar]
  17. Chen, T.; Guestrin, C. XGBoost: A Scalable Tree Boosting System. In Proceedings of the 22nd ACM SIGKDD International Conference on Knowledge Discovery and Data Mining; ACM: New York, NY, USA, 2016; pp. 785–794. [Google Scholar]
  18. Breiman, L. Random Forests. Mach. Learn. 2001, 45, 5–32. [Google Scholar] [CrossRef] [Green Version]
  19. Cai, J.; Luo, J.; Wang, S.; Yang, S. Feature selection in machine learning: A new perspective. Neurocomputing 2018, 300, 70–79. [Google Scholar] [CrossRef]
  20. Pellagatti, M.; Masci, C.; Ieva, F.; Paganoni, A.M. Generalized mixed-effects random forest: A flexible approach to predict university student dropout. Stat. Anal. Data Min. ASA Data Sci. J. 2021, 14, 241–257. [Google Scholar] [CrossRef]
  21. Meedech, P.; Iam-On, N.; Boongoen, T. Prediction of Student Dropout Using Personal Profile and Data Mining Approach. In Intelligent and Evolutionary Systems; Springer: Cham, Switzerland, 2016; pp. 143–155. ISBN 9783319270005. [Google Scholar]
  22. Plagge, M. Using artificial neural networks to predict first-year traditional students second year retention rates. In Proceedings of the 51st ACM Southeast Conference on—ACMSE ’13, New York, NY, USA, 4–6 April 2013; ACM Press: New York, NY, USA, 2013; p. 1. [Google Scholar]
  23. Opazo, D.; Moreno, S.; Álvarez-Miranda, E.; Pereira, J. Analysis of First-Year University Student Dropout through Machine Learning Models: A Comparison between Universities. Mathematics 2021, 9, 2599. [Google Scholar] [CrossRef]
  24. Nagy, M.; Molontay, R. Predicting Dropout in Higher Education Based on Secondary School Performance. In Proceedings of the 2018 IEEE 22nd International Conference on Intelligent Engineering Systems (INES), Las Palmas de Gran Canaria, Spain, 21–23 June 2018; IEEE: Pitscatway, NJ, USA, 2018; pp. 000389–000394. [Google Scholar]
  25. Respondek, L.; Seufert, T.; Hamm, J.M.; Nett, U.E. Linking changes in perceived academic control to university dropout and university grades: A longitudinal approach. J. Educ. Psychol. 2020, 112, 987–1002. [Google Scholar] [CrossRef]
  26. Rovira, S.; Puertas, E.; Igual, L. Data-driven system to predict academic grades and dropout. PLoS ONE 2017, 12, e0171207. [Google Scholar] [CrossRef] [Green Version]
  27. Sosu, E.M.; Pheunpha, P. Trajectory of University Dropout: Investigating the Cumulative Effect of Academic Vulnerability and Proximity to Family Support. Front. Educ. 2019, 4, 6. [Google Scholar] [CrossRef] [Green Version]
  28. Aina, C.; Baici, E.; Casalone, G.; Pastore, F. The Economics of University Dropouts and Delayed Graduation: A Survey. SSRN Electron. J. 2018. [Google Scholar] [CrossRef]
  29. Lee, Y.H.; Kim, K.S.; Lee, K.H. The effect of tuition fee constraints on financial management: Evidence from Korean private universities. Sustain. 2020, 12, 5066. [Google Scholar] [CrossRef]
  30. Stinebrickner, R.; Stinebrickner, T.R. A Major in Science? Initial Beliefs and Final Outcomes for College Major and Dropout. Rev. Econ. Stud. 2014, 81, 426–472. [Google Scholar] [CrossRef]
  31. Santos, K.J.d.O.; Menezes, A.G.; de Carvalho, A.B.; Montesco, C.A.E. Supervised Learning in the Context of Educational Data Mining to Avoid University Students Dropout. In Proceedings of the 2019 IEEE 19th International Conference on Advanced Learning Technologies (ICALT), Maceió, Brazil, 15–18 July 2019; IEEE: Pitscatway, NJ, USA, 2019; pp. 207–208. [Google Scholar]
  32. Sivakumar, S.; Venkataraman, S.; Selvaraj, R. Predictive Modeling of Student Dropout Indicators in Educational Data Mining using Improved Decision Tree. Indian J. Sci. Technol. 2016, 9, 87032. [Google Scholar] [CrossRef] [Green Version]
  33. Sarra, A.; Fontanella, L.; Di Zio, S. Identifying Students at Risk of Academic Failure Within the Educational Data Mining Framework. Soc. Indic. Res. 2019, 146, 41–60. [Google Scholar] [CrossRef]
  34. Cardona, T.A.; Cudney, E.A. Predicting Student Retention Using Support Vector Machines. Procedia Manuf. 2019, 39, 1827–1833. [Google Scholar] [CrossRef]
  35. Kemper, L.; Vorhoff, G.; Wigger, B.U. Predicting student dropout: A machine learning approach. Eur. J. High. Educ. 2020, 10, 28–47. [Google Scholar] [CrossRef]
  36. Prenkaj, B.; Velardi, P.; Stilo, G.; Distante, D.; Faralli, S. A Survey of Machine Learning Approaches for Student Dropout Prediction in Online Courses. ACM Comput. Surv. 2021, 53, 1–34. [Google Scholar] [CrossRef]
  37. Lehr, C.A.; Johnson, D.R.; Bremer, C.D.; Cosio, A.; Thompson, M. Increasing Rates of School Completion: Moving From Policy and Research to Practice; National Center on Secondary Education and Transition: Minneapolis, MN, USA, 2004. [Google Scholar]
  38. Song, Y.Y.; Lu, Y. Decision tree methods: Applications for classification and prediction. Shanghai Arch. Psychiatry 2015, 27, 130–135. [Google Scholar] [CrossRef]
  39. Ke, G.; Meng, Q.; Finley, T.; Wang, T.; Chen, W.; Ma, W.; Ye, Q.; Liu, T.Y. LightGBM: A highly efficient gradient boosting decision tree. Adv. Neural Inf. Process. Syst. 2017, 2017, 3147–3155. [Google Scholar]
  40. DeMaris, A. A Tutorial in Logistic Regression. J. Marriage Fam. 1995, 57, 956. [Google Scholar] [CrossRef]
  41. Hearst, M.A.; Dumais, S.T.; Osuna, E.; Platt, J.; Scholkopf, B. Support vector machines. IEEE Intell. Syst. Appl. 1998, 13, 18–28. [Google Scholar] [CrossRef]
  42. Lee, S.; Chung, J.Y. The Machine Learning-Based Dropout Early Warning System for Improving the Performance of Dropout Prediction. Appl. Sci. 2019, 9, 3093. [Google Scholar] [CrossRef] [Green Version]
  43. Marquez-Vera, C.; Morales, C.R.; Soto, S.V. Predicting School Failure and Dropout by Using Data Mining Techniques. IEEE Rev. Iberoam. Tecnol. Del Aprendiz. 2013, 8, 7–14. [Google Scholar] [CrossRef]
  44. Csalódi, R.; Abonyi, J. Integrated Survival Analysis and Frequent Pattern Mining for Course Failure-Based Prediction of Student Dropout. Mathematics 2021, 9, 463. [Google Scholar] [CrossRef]
  45. Neumann, I.; Jeschke, C.; Heinze, A. First Year Students’ Resilience to Cope with Mathematics Exercises in the University Mathematics Studies. J. Für Math. 2021, 42, 307–333. [Google Scholar] [CrossRef]
  46. Venegas-Muggli, J.I. Higher education dropout of non-traditional mature freshmen: The role of sociodemographic characteristics. Stud. Contin. Educ. 2020, 42, 316–332. [Google Scholar] [CrossRef]
  47. Wild, S.; Schulze Heuling, L. Student dropout and retention: An event history analysis among students in cooperative higher education. Int. J. Educ. Res. 2020, 104, 101687. [Google Scholar] [CrossRef]
  48. Rodríguez-Hernández, C.F.; Musso, M.; Kyndt, E.; Cascallar, E. Artificial neural networks in academic performance prediction: Systematic implementation and predictor evaluation. Comput. Educ. Artif. Intell. 2021, 2, 100018. [Google Scholar] [CrossRef]
Figure 1. The heat map based on (A) the mean value-based feature table, (B) the median value-based feature table, (C) the first-semester data-based feature table, and (D) the final semester data-based feature table.
Applsci 13 01143 g001aApplsci 13 01143 g001b
Figure 2. Kaplan Meier Plot for Student Dropout (n = 6963).
Applsci 13 01143 g002
Figure 3. (A) Average performance of the six models. (B) Average performance of the four feature tables.
Applsci 13 01143 g003
Figure 4. Feature Importance of LightGBM Model trained in the mean value-based feature table.
Applsci 13 01143 g004
Figure 5. The Student Dropout Risk Report.
Applsci 13 01143 g005
Table 1. Model, Sample Size, Features, and Metrics Used and Results Obtained.
WorkSample SizeFeaturesBest MethodMetricsResult
Plagge [22]5955Academic performanceArtificial Neural NetworksAccuracy0.75
Nagy and Molontay [24]15,825High school data, Personal detailGradient Boosted TreeAccuracy
AUC (area under the curve)
0.74
0.81
Cardona and Cudney [34]282High school data, Academic gradeSupport Vector MachineAccuracy0.78
Del Bonifro et al. [16]15,000High school data, Academic grade, Personal detailSupport Vector MachineAccuracy
Sensitivity
Specificity
0.86
0.88
0.86
Kemper et al. [35]3176Academic gradeDecision TreeAccuracy Sensitivity
Specificity
0.89
0.41
0.97
Kabathova and Drlik [15]261Academic performanceRandom
Forest
Accuracy0.93
Precision0.86
Recall0.96
F1 Score0.91
Moreira da Silva et al. [14]331Academic grade, Personal detailXGBoostAccuracy0.90
Precision0.82
Recall0.92
F1 Score0.87
AUC0.95
Table 2. Feature Table from Student Data.
CategoryAttributeTypeDetails
Student’s gradeCumulative GPANumericThe grade point average of all grades a student has secured in a semester or term
Overall GPANumericAn average of all cumulative GPAs that a student has secured in all semesters and all the courses in an academic term
Diff creditsNumericThe difference between the applied credits and the credits taken.
Student’s attendanceAbsenceNumericThe number of absences
LateNumericThe number of lates
Authorize absenceNumericThe number of authorized lates
Student’s scholarshipTotal scholarshipNumericTotal scholarship amount received per semester
The number of scholarshipsNumericThe number of scholarship types received per semester
AchievementNumericAchievement scholarship amount received per semester
BursaryNumericBursaries for underprivileged students scholarships amount received per semester
Other scholarshipNumericOther scholarship amounts received per semester
LaborNumericLabor scholarship amount received per semester
FacultyNumericFaculty scholarship amount received per semester
Student’s personal backgroundIncome rangeNumericThe income range of the student’s family
Professional classificationNumericStudent’s professional classification
Military serviceNominalWhether the student has served in the military.
Living areaNumericLiving area
SuspensionsNumericTotal semester number of suspensions of schooling
Tuition feeNumericTuition fees per semester
SexNominalSex of the student
BirthNumericYear of birth
Access yearNumericYear of enrollment
Student’s statusDropoutNominalStudent status: Yes (Dropout) or No (Not dropout)
Table 3. Dropout Rate Calculated according to the Cohort Method.
Year of AdmissionNumber of Students in SchoolNumber of Student GraduatesNumber of Student DropoutsSumDropout Rate
20106457884554290.16
201124452485254000.16
201254448386954060.16
2013126425973851230.14
2014371391479450790.16
2015935308668047010.14
20161923234958848600.12
20172870129051946790.11
2018403333643248010.09
2019417828033647940.07
20204614025948730.05
2021481405148650.01
Sum23,94829,099696360,0100.13
Table 4. The Confusion Matrix.
Actual
PositiveNegative
PredictedPositiveTrue positive (TP)False positive (FP)
NegativeFalse negative (FN)True negative (TN)
Table 5. F1 Score, Precision, Recall, and Accuracy for class dropout in the test dataset.
Feature TableModel NameF1 ScorePrecisionRecallAccuracy
Mean value-based feature tableLightGBM0.790.810.780.94
XGBoost0.770.760.790.93
Logistic Regression0.610.500.780.80
Support Vector Machine0.620.510.780.80
Random Forest0.750.770.730.93
Decision Tree0.660.630.700.89
Average0.700.660.760.88
Median value-based feature tableLightGBM0.770.800.740.92
XGBoost0.780.830.740.93
Logistic Regression0.570.440.790.81
Support Vector Machine0.570.440.790.81
Random Forest0.750.800.710.93
Decision Tree0.660.650.680.85
Average0.680.660.740.88
First-semester data-based feature tableLightGBM0.680.720.650.85
XGBoost0.680.750.630.87
Logistic Regression0.430.290.810.81
Support Vector Machine0.430.290.810.80
Random Forest0.660.720.610.93
Decision Tree0.550.500.600.91
Average0.570.550.690.86
Final semester data-based feature tableLightGBM0.730.790.670.93
XGBoost0.730.820.650.93
Logistic Regression0.470.340.780.83
Support Vector Machine0.470.340.780.84
Random Forest0.710.790.640.92
Decision Tree0.600.570.630.86
Average0.620.610.690.89
Disclaimer/Publisher’s Note: The statements, opinions and data contained in all publications are solely those of the individual author(s) and contributor(s) and not of MDPI and/or the editor(s). MDPI and/or the editor(s) disclaim responsibility for any injury to people or property resulting from any ideas, methods, instructions or products referred to in the content.

