
Intelligent Detection of Rebar Size and Position Using Improved DeeplabV3+

Abstract
:1. Introduction
- (1)
- The segmentation of rebar edges is different, resulting in missed detections in local areas of rebars;
- (2)
- The identification of the rebar intersections and discontinuous segmentation is incomplete;
- (3)
- Due to the effects of the background and lighting, there are some instances where the background is mistakenly checked as rebar.
2. Methodology
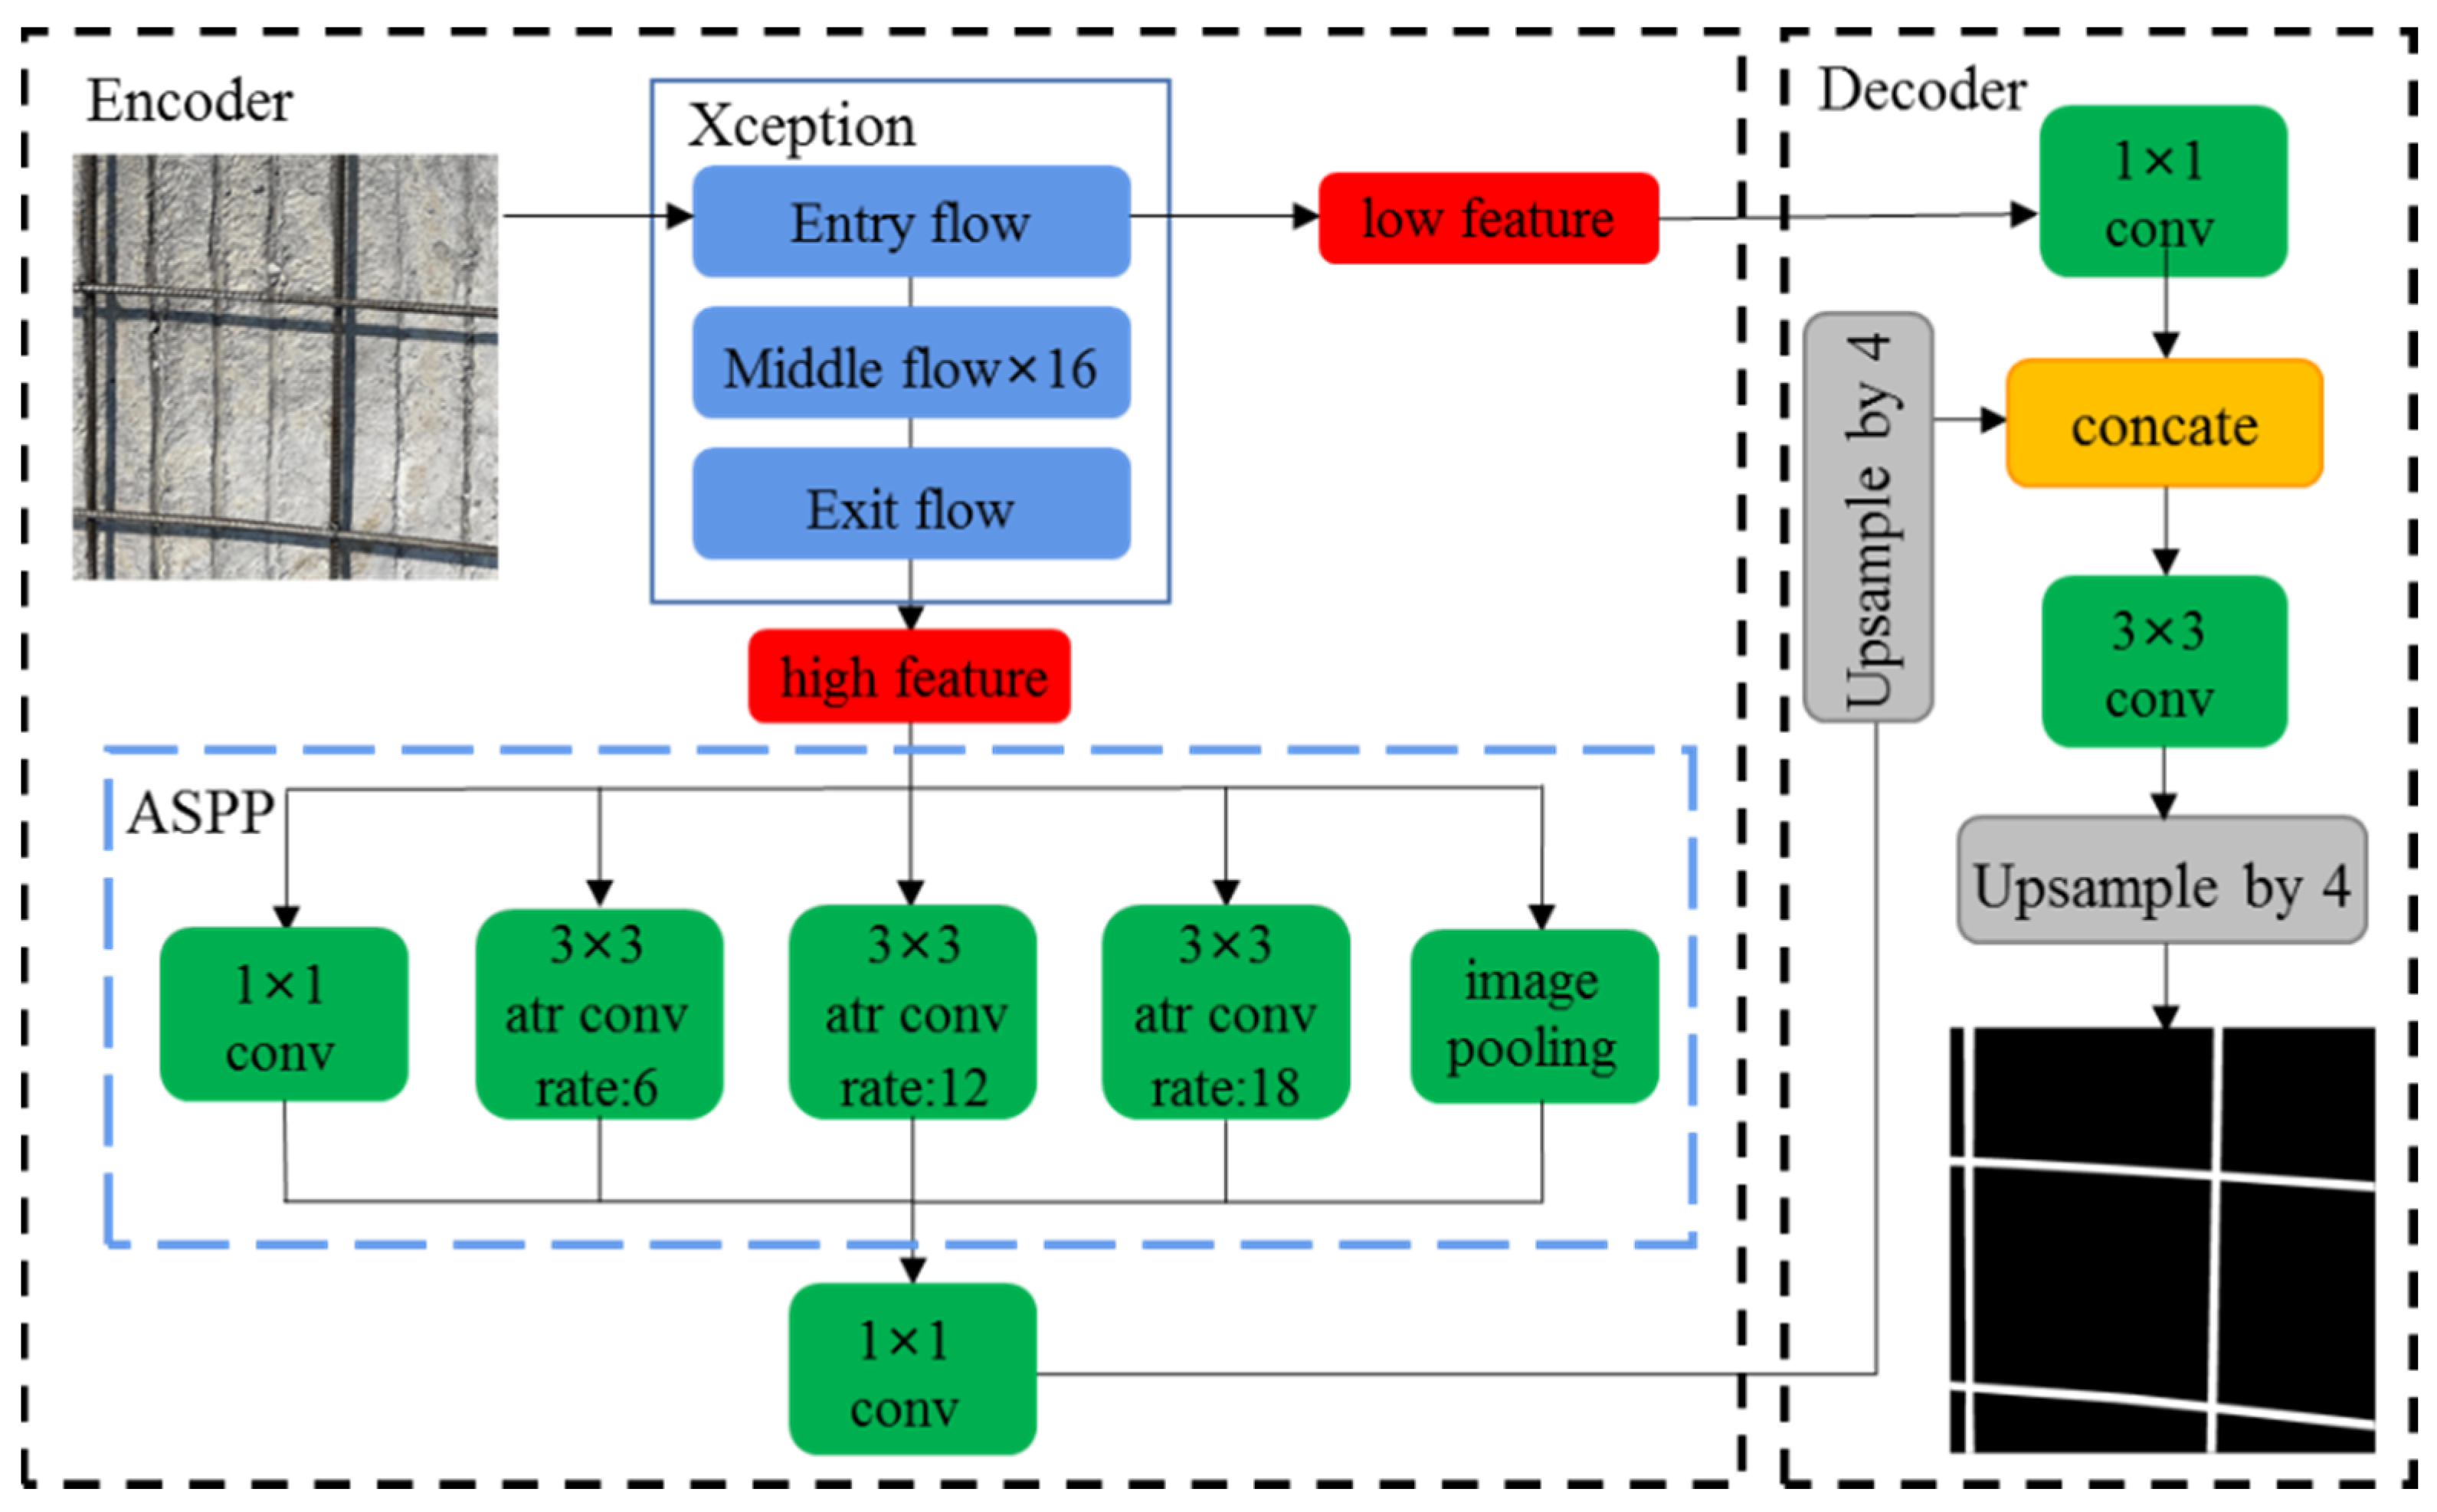
2.1. DeeplabV3+
2.2. Improved DeeplabV3+
- (1)
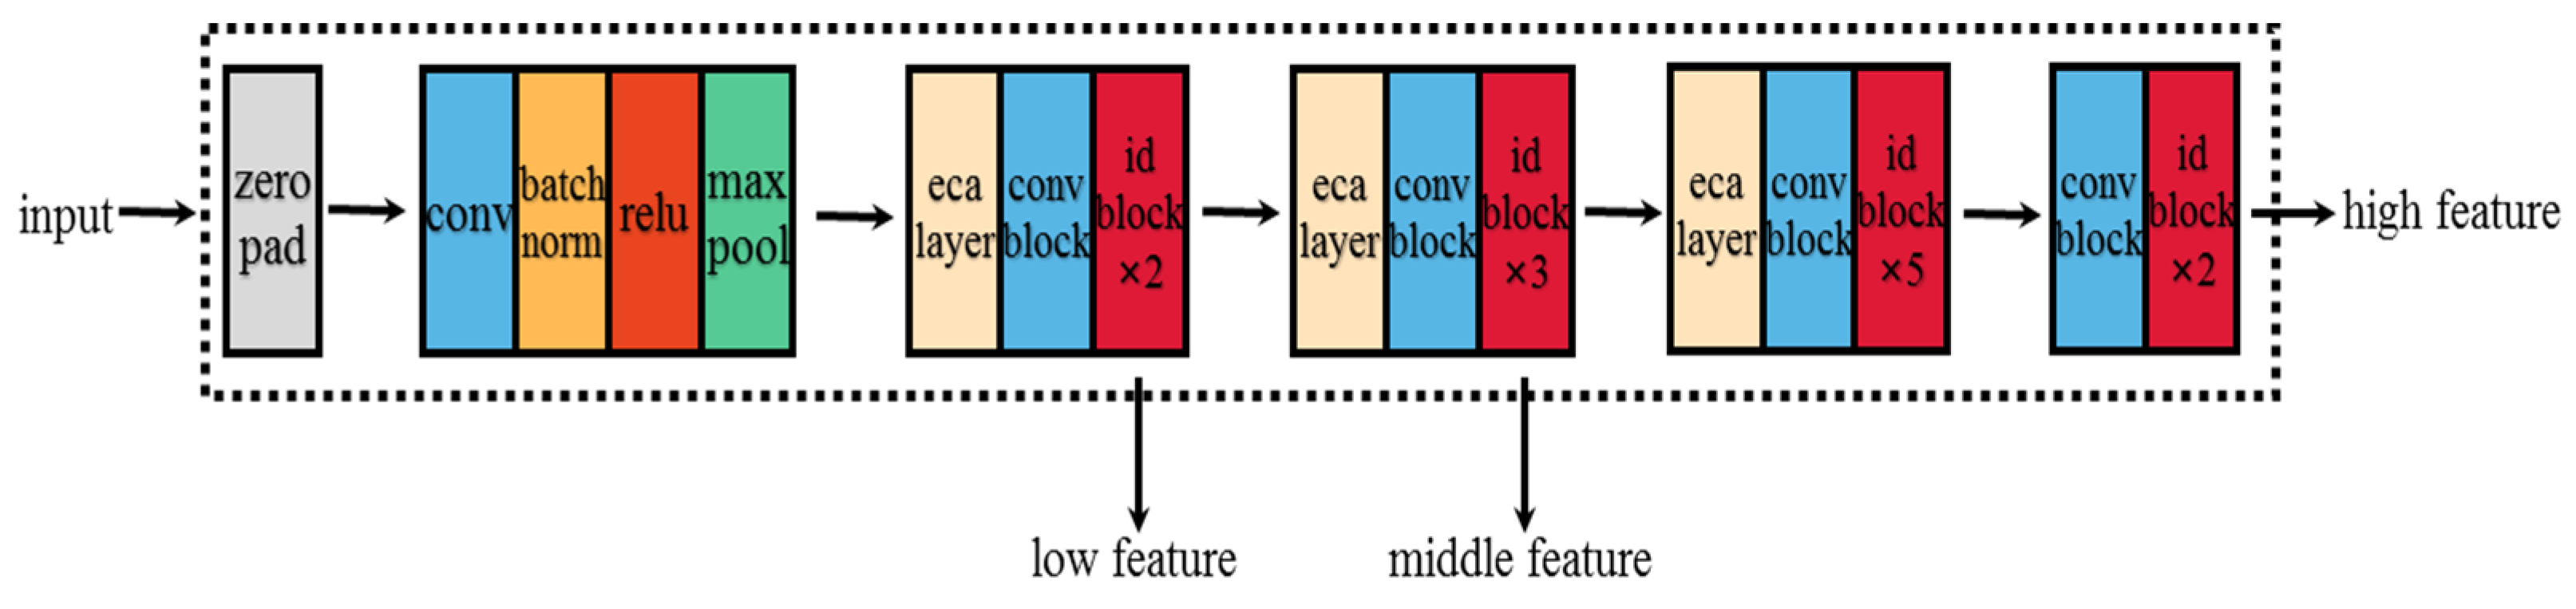
- The detection of rebars was the target of present study. To reduce the complexity of original DeeplabV3+ model, ResNet50 was selected as the backbone extraction network;
- (2)
- According to the feature information and distribution pattern of the rebar dataset, an efficient attention module was added to the backbone network to optimize the feature extraction pattern of the network, as well as to deepen the sensitivity of the network to identify rebar. Thus, the redundant operations of the network to extract non-object features could be avoided;
- (3)
- To solve the problem of incomplete edge information and loss of detailed information in the segmentation effect of the original DeeplabV3+ model, the convolutional dilation rate and convolutional density of the cavity convolution in the ASPP module were changed from 6, 12, and 18 to 3, 6, and 9, so there was no cavity loss when performing scale fusion.
2.2.1. Improvement of Backbone
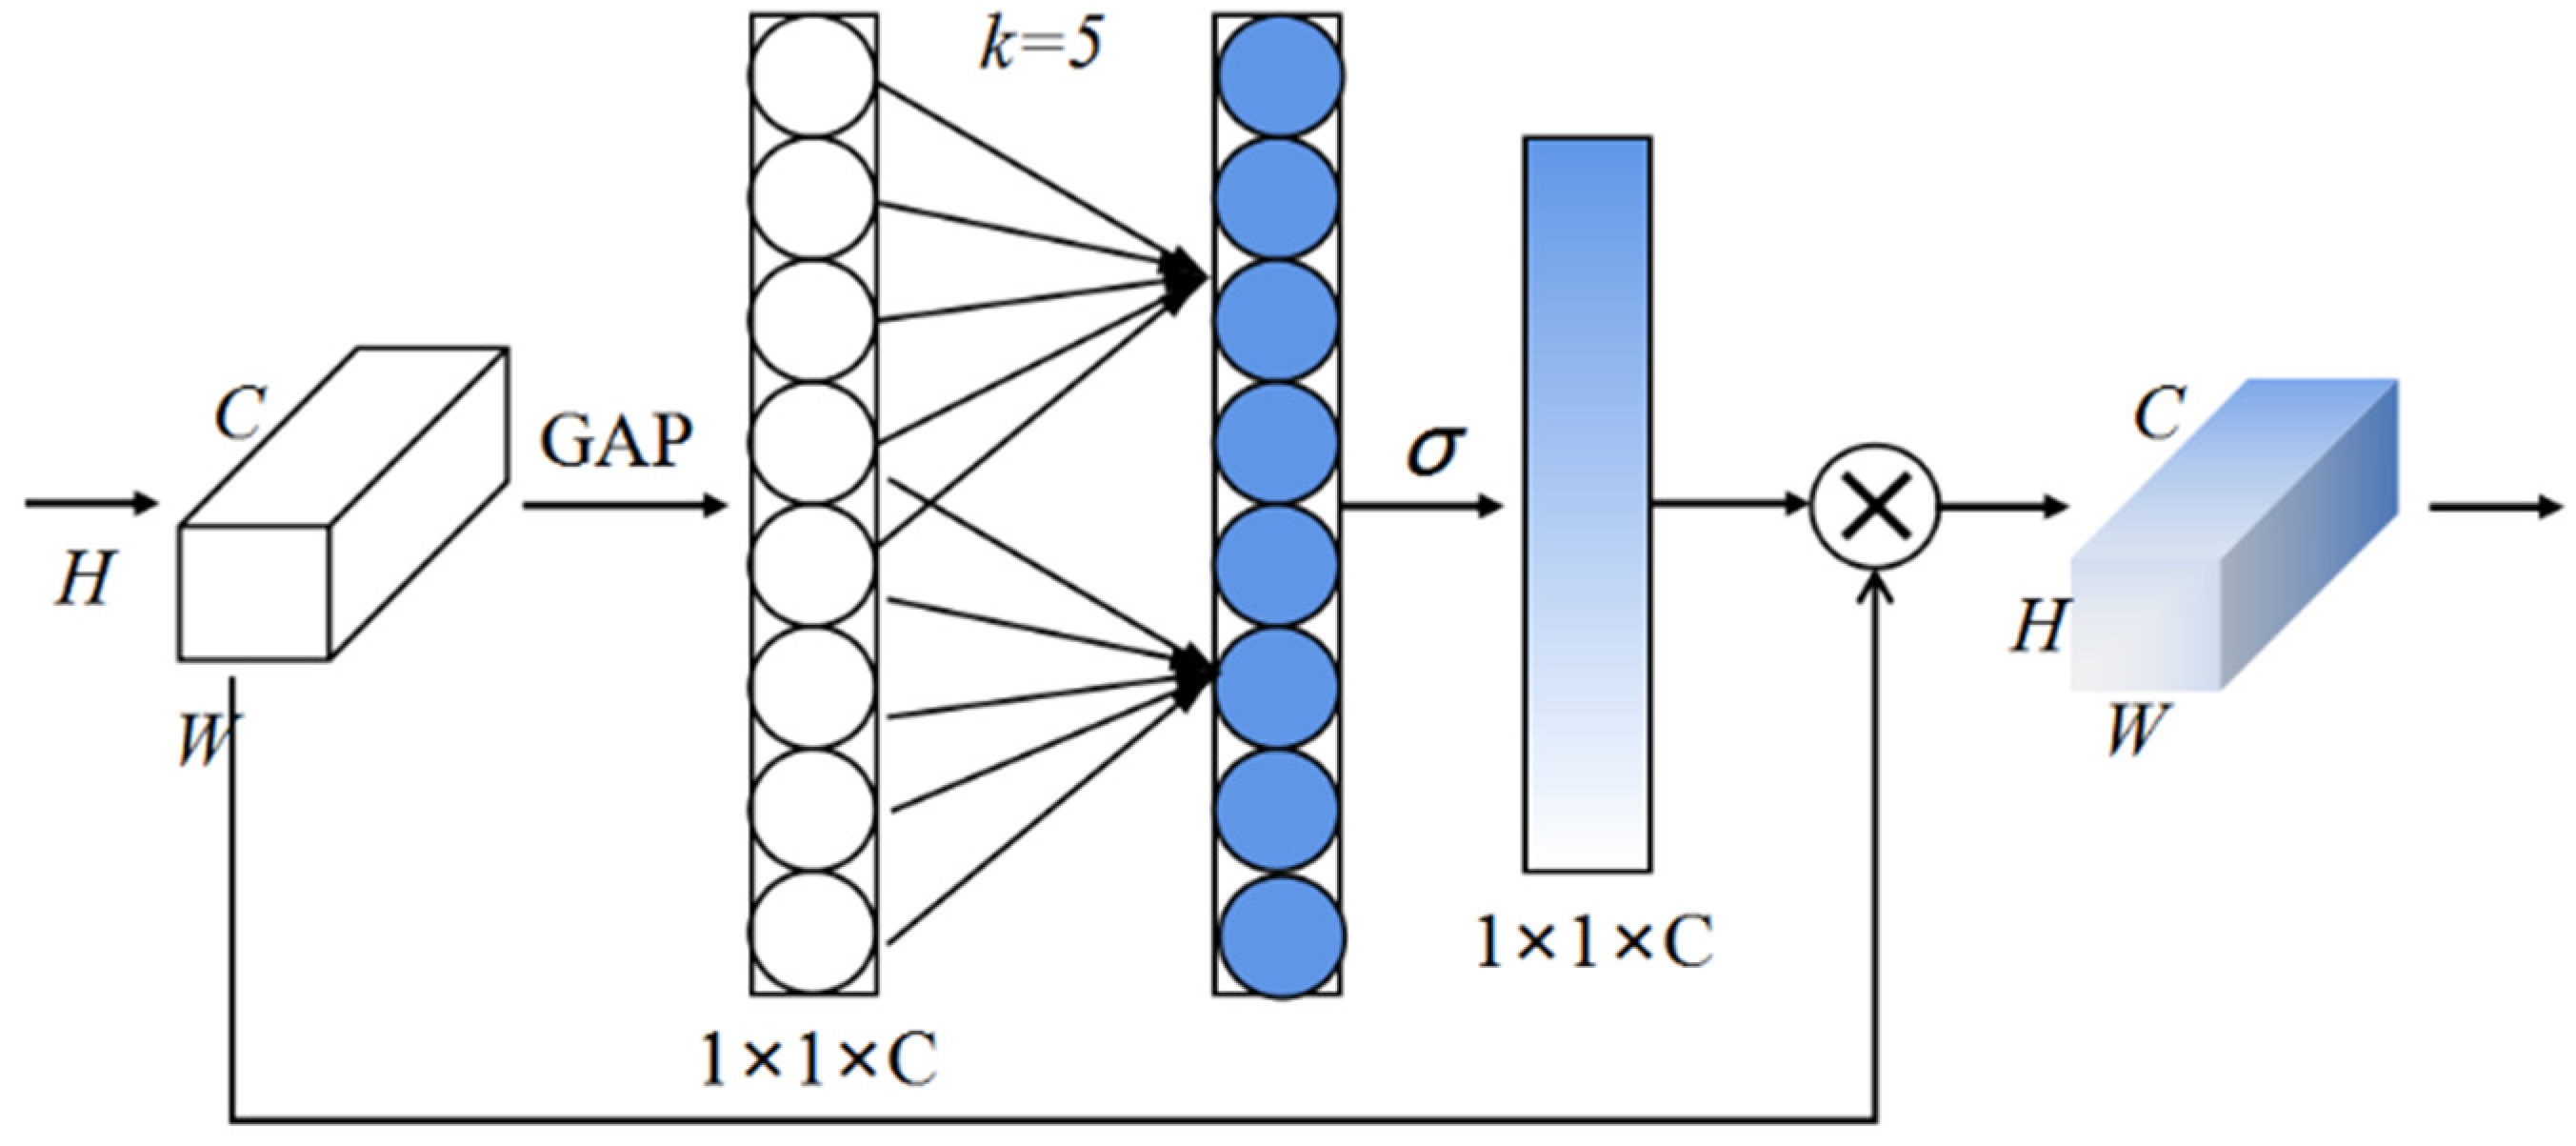
2.2.2. Efficient Channel Attention Module
2.2.3. Adjusting Atrous Convolution
3. Datasets and Experimental Conditions
3.1. Datasets
3.2. Experimental Conditions
3.3. Evaluation Index
4. Results and Analysis
4.1. Performance Comparison of Improved Backbone
4.2. Ablation Experiment of Improved Module
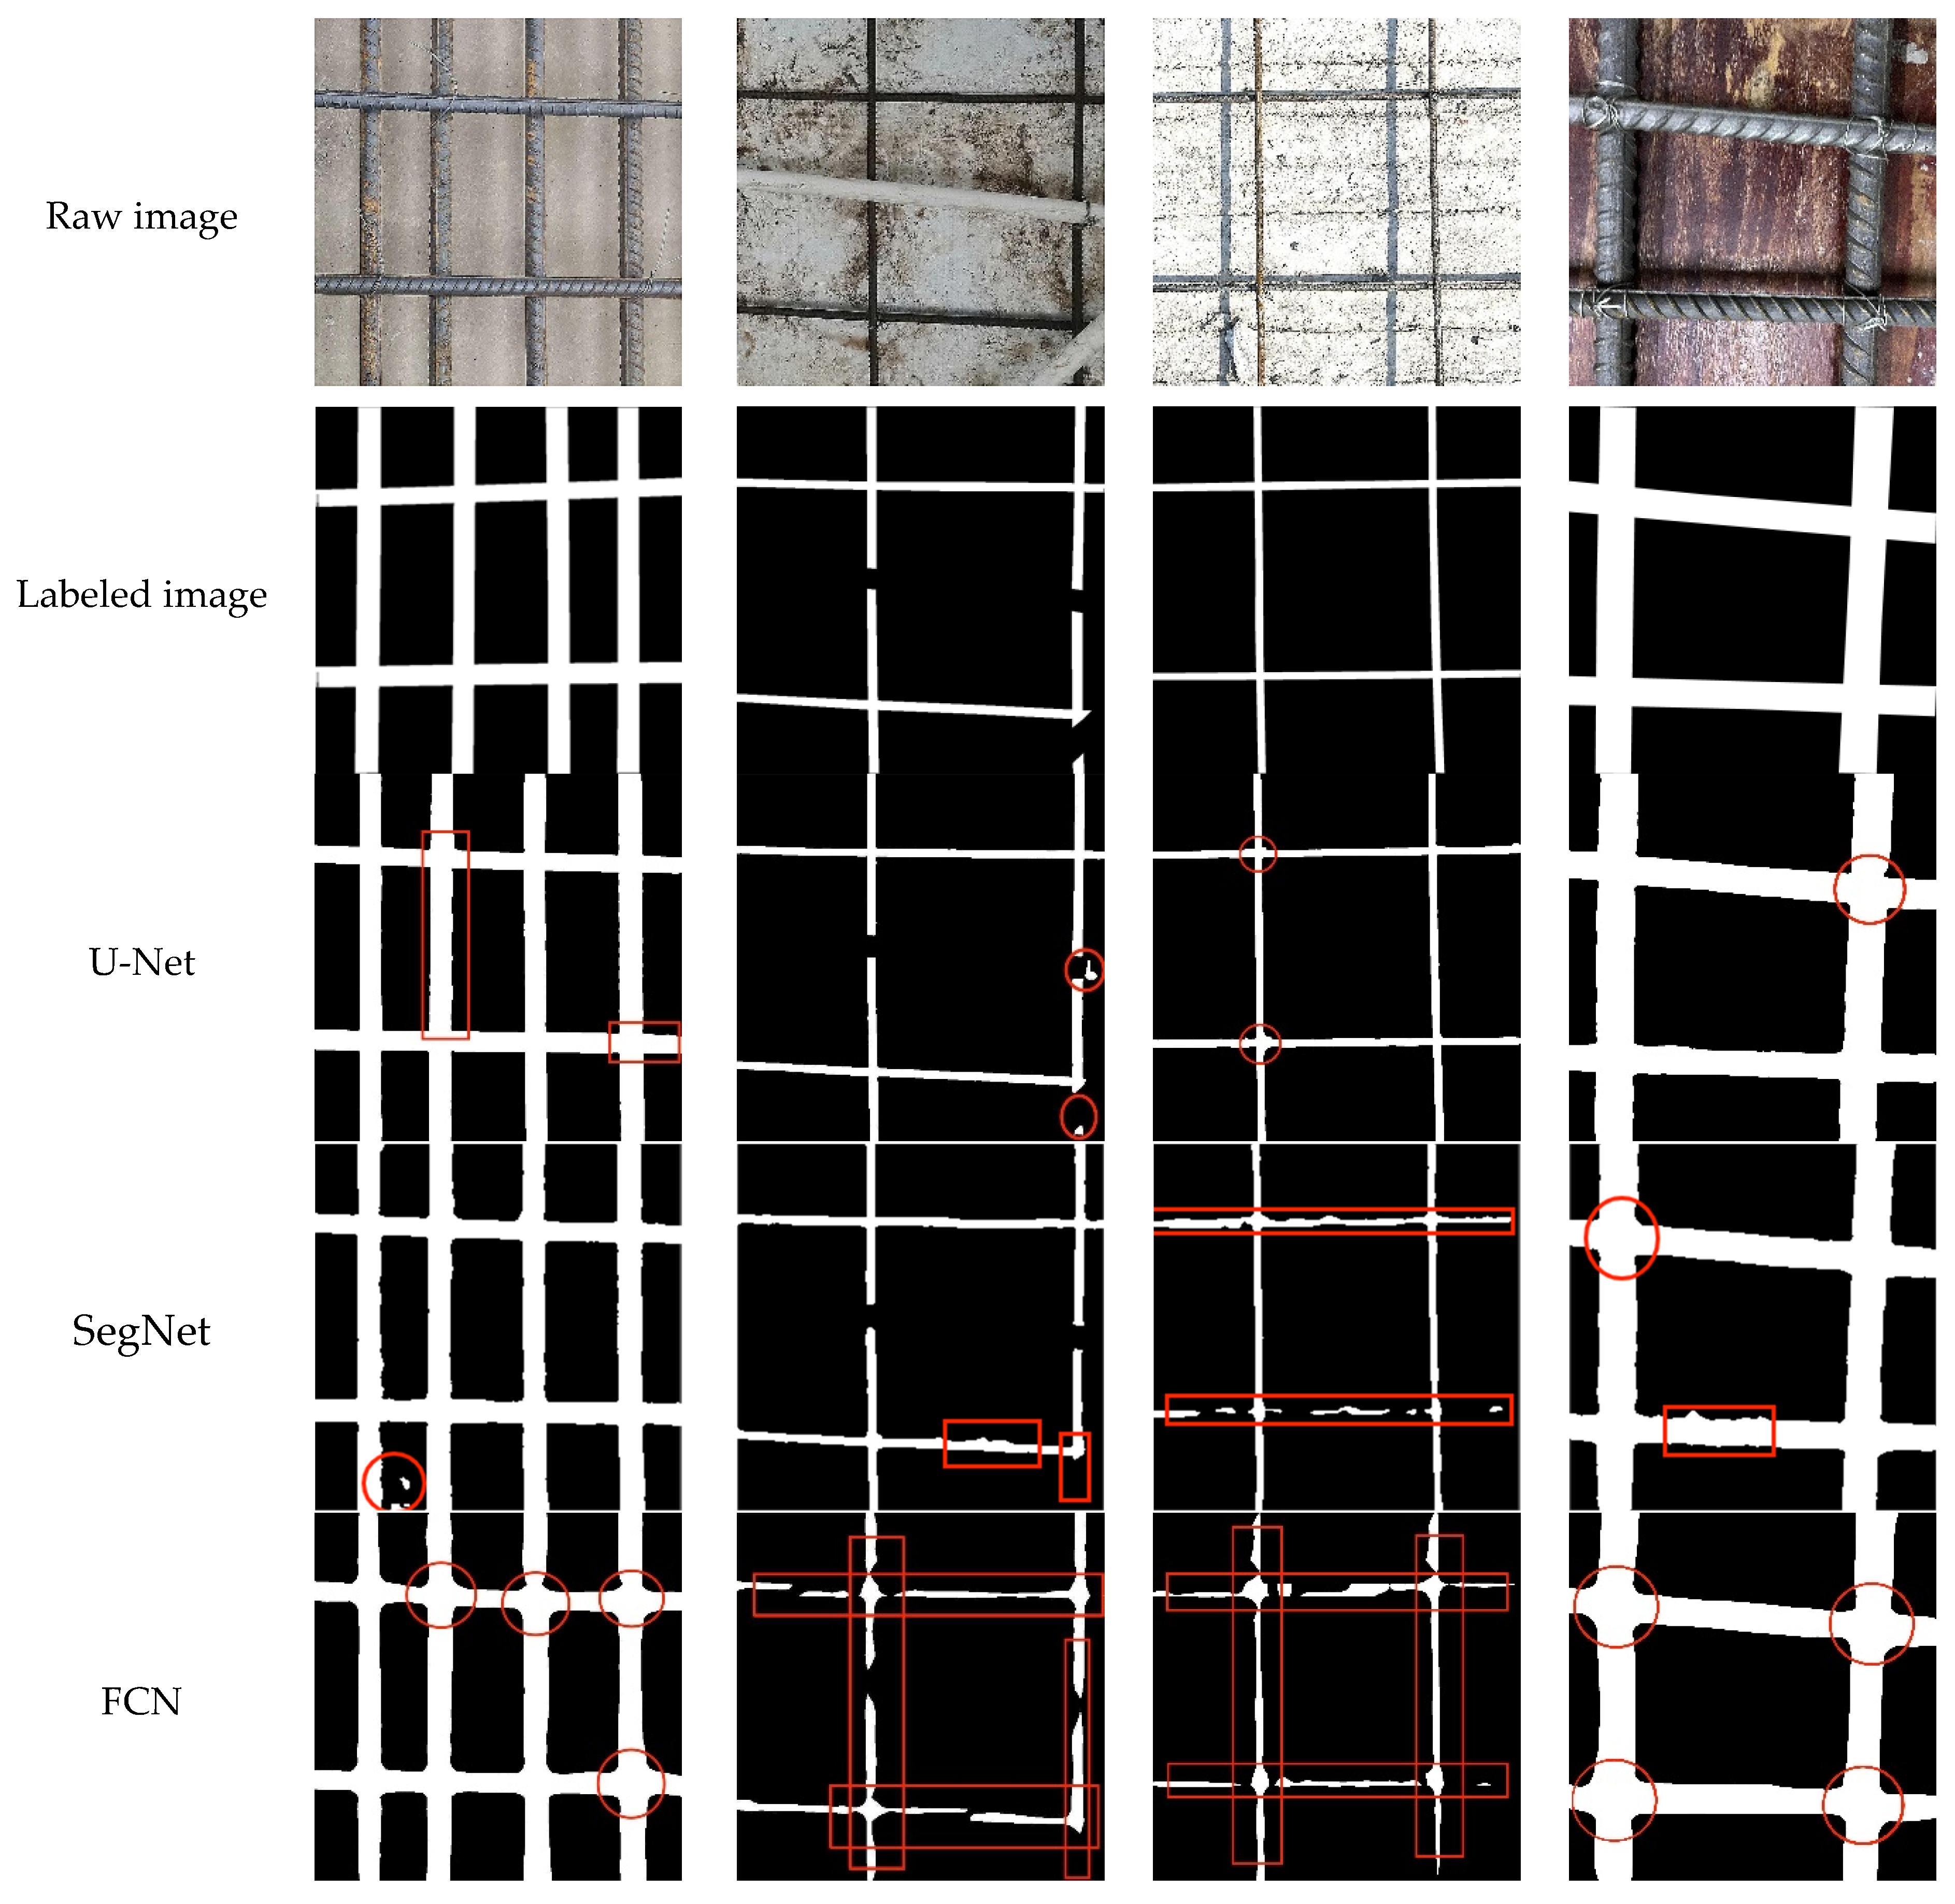
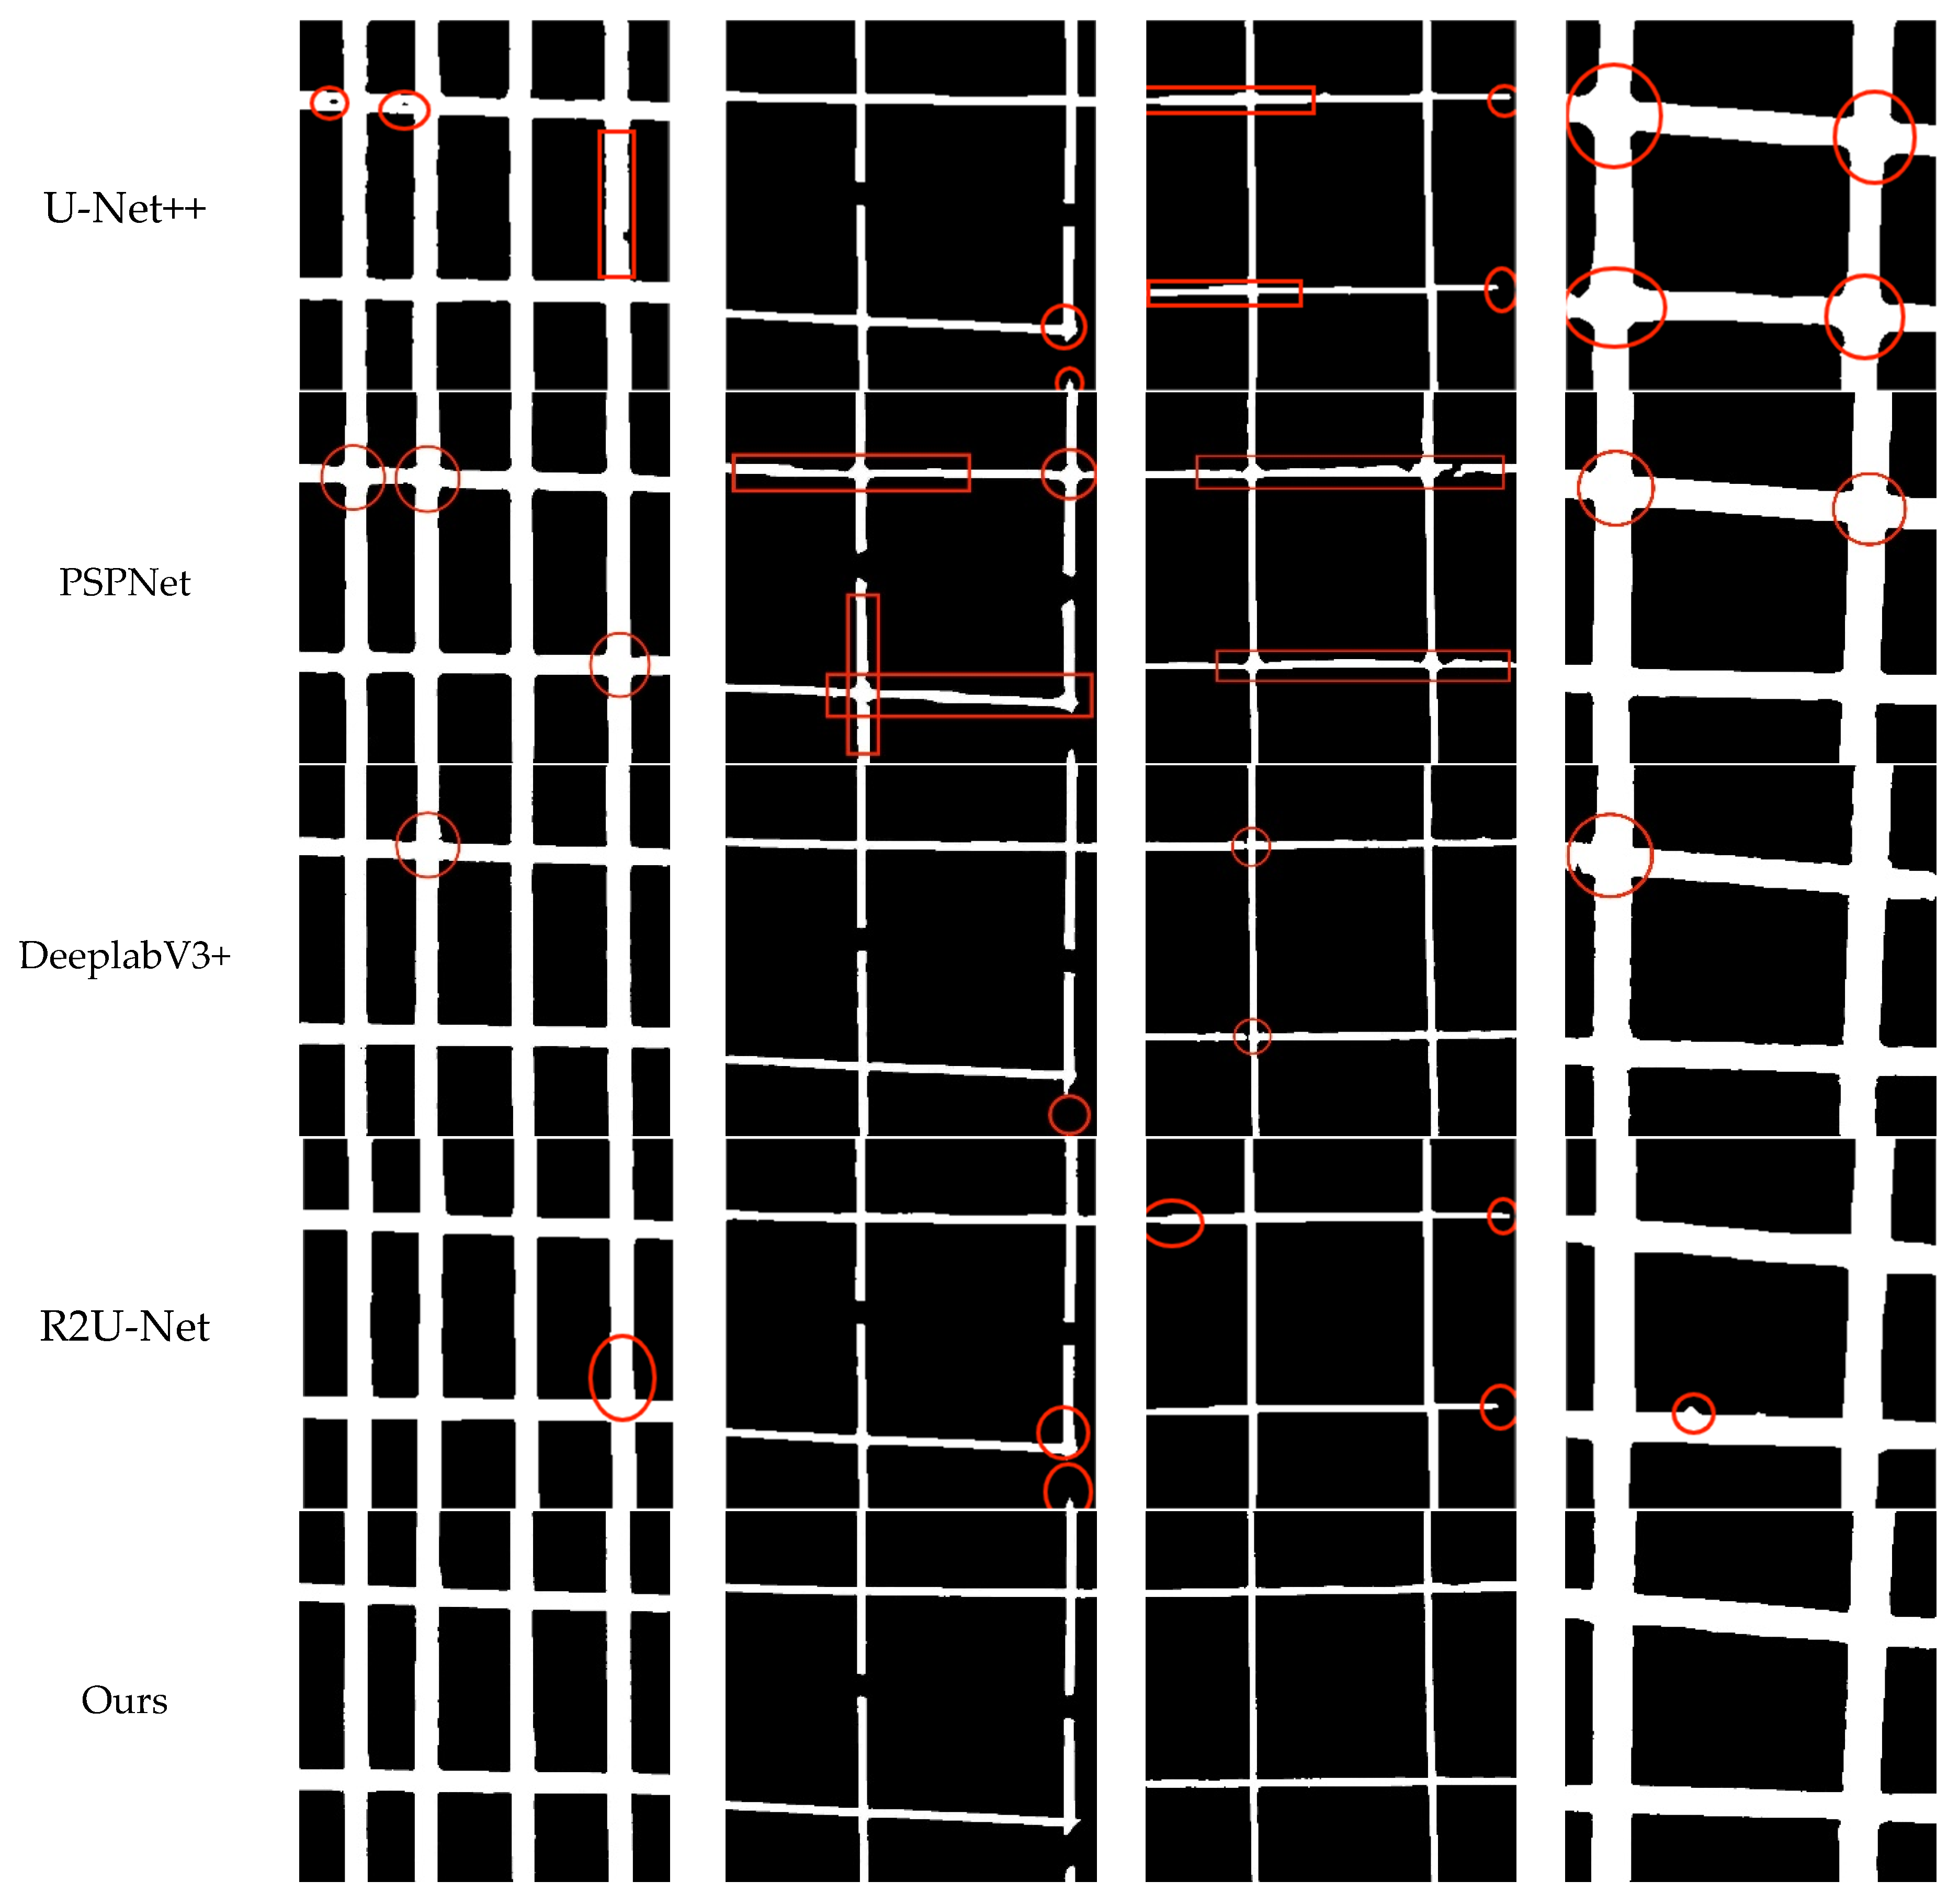
4.3. Comparative Results of Different Models
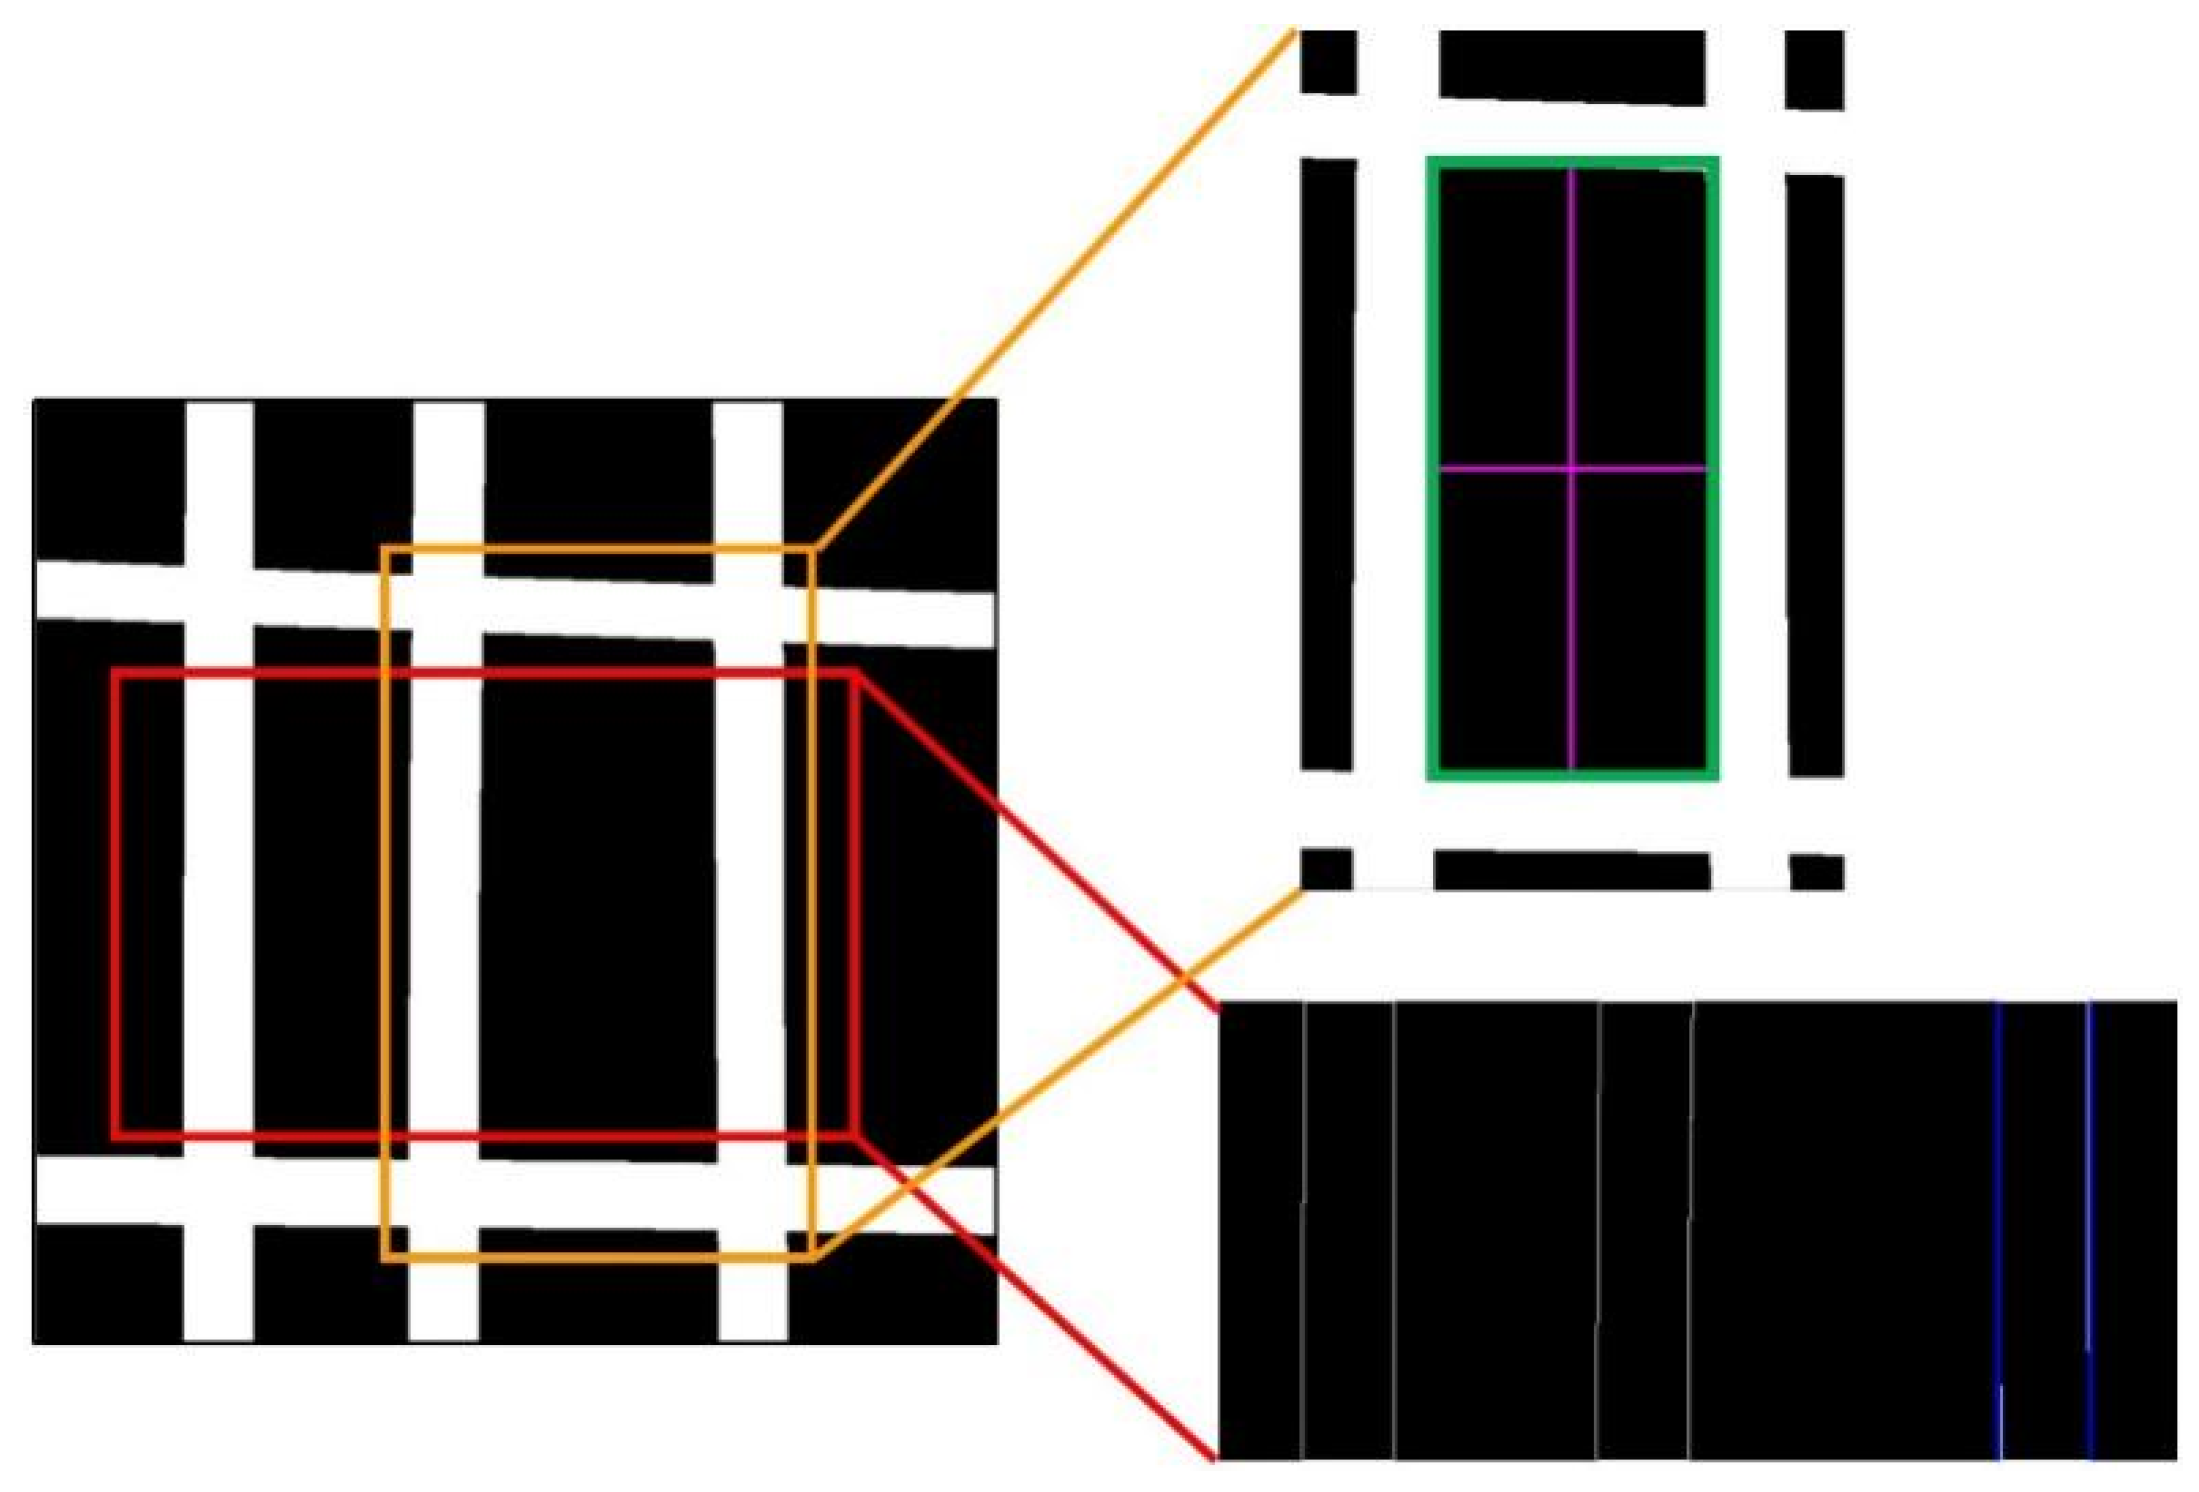
5. Rebar Size Measurements
6. Concluding Remarks
Author Contributions
Funding
Institutional Review Board Statement
Informed Consent Statement
Data Availability Statement
Acknowledgments
Conflicts of Interest
References
- Saon, G.; Picheny, M. Recent advances in conversational speech recognition using convolutional and recurrent neural networks. IBM J. Res. Dev. 2017, 61, 1:1–1:10. [Google Scholar] [CrossRef]
- Redmon, J.; Divvala, S.; Girshick, R.; Farhadi, A. You only look once: Unified, real-time object detection. In Proceedings of the IEEE Conference on Computer Vision and Pattern Recognition, Las Vegas, NV, USA, 26 June–1 July 2016; pp. 779–788. [Google Scholar]
- Redmon, J.; Farhadi, A. YOLO9000: Better, faster, stronger. In Proceedings of the IEEE Conference on Computer Vision and Pattern Recognition, Honolulu, HI, USA, 21–26 July 2017; pp. 7263–7271. [Google Scholar]
- Redmon, J.; Farhadi, A. Yolov3: An incremental improvement. arXiv 2018, arXiv:1804.02767. [Google Scholar]
- Bochkovskiy, A.; Wang, C.; Liao, H.M. Yolov4: Optimal speed and accuracy of object detection. arXiv 2018, arXiv:2004.10934. [Google Scholar]
- Zhu, X.; Lyu, S.; Wang, X. TPH-YOLOv5: Improved YOLOv5 based on transformer prediction head for object detection on drone-captured scenarios. In Proceedings of the IEEE/CVF International Conference on Computer Vision (ICCV) Workshops, Virtual, 11–17 October 2021. [Google Scholar]
- Li, C.; Li, L.; Jiang, H. YOLOv6: A single-stage object detection framework for industrial applications. arXiv 2022, arXiv:2209.02976. [Google Scholar]
- Wang, C.; Bochkovskiy, A.; Liao, H.M. YOLOv7: Trainable bag-of-freebies sets new state-of-the-art for real-time object detectors. In Proceedings of the IEEE/CVF Conference on Computer Vision and Pattern Recognition, Vancouver, BC, Canada, 18–22 June 2023. [Google Scholar]
- Liu, W.; Anguelov, D.; Erhan, D.; Szegedy, C.; Reed, S.; Fu, C.; Berg, A.C. SSD: Single shot multibox detector. In European Conference on Computer Vision; Springer: Cham, Switzerland, 2016; pp. 21–37. [Google Scholar]
- Ren, S.; He, K.; Girshick, R.; Sun, J. Faster R-CNN: Towards real-time object detection with region proposal networks. In Proceedings of the Advances in Neural Information Processing Systems 28 (NIPS 2015), Montreal, QC, Canada, 7–12 December 2015; Volume 28. [Google Scholar]
- He, K.; Gkioxari, G.; Dollár, P.; Girshick, R. Mask R-CNN. In Proceedings of the IEEE International Conference on Computer Vision, Venice, Italy, 22–29 October 2017; pp. 2961–2969. [Google Scholar]
- Liu, S.; Qi, X.; Shi, J.; Zhang, H.; Jia, J. Multi-scale patch aggregation (mpa) for simultaneous detection and segmentation. In Proceedings of the IEEE Conference on Computer Vision and Pattern Recognition, Las Vegas, NV, USA, 26 June–1 July 2016; pp. 3141–3149. [Google Scholar]
- Hariharan, B.; Arbeláez, P.; Girshick, R.; Malik, J. Simultaneous detection and segmentation. In European Conference on Computer Vision; Springer: Cham, Switzerland, 2014; pp. 297–312. [Google Scholar]
- Chen, L.; Papandreou, G.; Kokkinos, I.; Murphy, K.; Yuille, A.L. Semantic image segmentation with deep convolutional nets and fully connected crfs. arXiv 2014, arXiv:1412.7062. [Google Scholar]
- Chen, L.-C.; Papandreou, G.; Kokkinos, I.; Murphy, K.; Yuille, A.L. DeepLab: Semantic Image Segmentation with Deep Convolutional Nets, Atrous Convolution, and Fully Connected CRFs. IEEE Trans. Pattern Anal. Mach. Intell. 2017, 40, 834–848. [Google Scholar] [CrossRef] [PubMed]
- Chen, L.; Papandreou, G.; Schroff, F.; Adam, H. Rethinking atrous convolution for semantic image segmentation. arXiv 2017, arXiv:1706.05587. [Google Scholar]
- Badrinarayanan, V.; Kendall, A.; Cipolla, R. Segnet: A deep convolutional encoder-decoder architecture for image segmentation. IEEE Trans. Pattern Anal. Mach. Intell. 2015, 39, 2481–2495. [Google Scholar] [CrossRef] [PubMed]
- Guo, S.; Li, D.; Wang, Z.; Zhou, X. Safety helmet detection method based on Faster R-CNN. In International Conference on Artificial Intelligence and Security; Springer: Singapore, 2020; pp. 423–434. [Google Scholar]
- Chen, J.; Deng, S.; Wang, P.; Huang, X.; Liu, Y. Lightweight Helmet Detection Algorithm Using an Improved YOLOv4. Sensors 2023, 23, 1256. [Google Scholar] [CrossRef] [PubMed]
- Liu, H.; Xu, K. Densely End Face Detection Network for Counting Bundled Steel Bars Based on YoloV5. In Chinese Conference on Pattern Recognition and Computer Vision (PRCV); Springer: Cham, Switzerland, 2021; pp. 293–303. [Google Scholar]
- Park, S.E.; Eem, S.-H.; Jeon, H. Concrete crack detection and quantification using deep learning and structured light. Constr. Build. Mater. 2020, 252, 119096. [Google Scholar] [CrossRef]
- Ruan, X.; Wang, B.; Wu, J. Identification of SpaUed Concrete and Exposed Reinforcement in Reinforced Concrete Bridge Based on Deep Learning. World Bridges 2020, 48, 88–92. [Google Scholar]
- Ahmed, H.; Le, C.P.; La, H.M. Pixel-level classification for bridge deck rebar detection and localization using multi-stage deep encoder-decoder network. Dev. Built Environ. 2023, 14, 100132. [Google Scholar] [CrossRef]
- Zheng, Y.; Zhou, G.; Lu, B. A Multi-Scale Rebar Detection Network with an Embedded Attention Mechanism. Appl. Sci. 2023, 13, 8233. [Google Scholar] [CrossRef]
- Shin, Y.; Heo, S.; Han, S.; Kim, J.; Na, S. An Image-Based Steel Rebar Size Estimation and Counting Method Using a Convolutional Neural Network Combined with Homography. Buildings 2021, 11, 463. [Google Scholar] [CrossRef]
- Yan, T.; Ma, X.; Rao, Y.; Du, Y. Rebar size detection algorithm for intelligent construction supervision based on improved Mask R-CNN. Comput. Eng. 2021, 47, 274–281. [Google Scholar]
- An, M.; Kang, D. The distance measurement based on corner detection for rebar spacing in engineering images. J. Supercomput. 2022, 78, 12380–12393. [Google Scholar] [CrossRef]
- Chen, L.; Zhu, Y.; Papandreou, G.; Schroff, F.; Adam, H. Encoder-decoder with atrous separable convolution for semantic image segmentation. In Proceedings of the European Conference on Computer Vision (ECCV), Munich, Germany, 8–14 September 2018; pp. 801–818. [Google Scholar]
- Long, J.; Shelhamer, E.; Darrell, T. Fully convolutional networks for semantic segmentation. In Proceedings of the IEEE Conference on Computer Vision and Pattern Recognition, Boston, MA, USA, 7–12 June 2015; pp. 3431–3440. [Google Scholar]
- He, K.; Zhang, X.; Ren, S.; Sun, J. Deep residual learning for image recognition. In Proceedings of the IEEE Conference on Computer Vision and Pattern Recognition, Las Vegas, NV, USA, 26 June–1 July 2016; pp. 770–778. [Google Scholar]
- Wang, Q.; Wu, B.; Zhu, P.; Li, P.; Zuo, W.; Hu, Q. ECA-Net: Efficient channel attention for deep convolutional neural networks. In Proceedings of the 2020 IEEE/CVF Conference on Computer Vision and Pattern Recognition, Virtual, 14–19 June 2020; pp. 13–19. [Google Scholar]
- Hu, J.; Shen, L.; Sun, G. Squeeze-and-excitation networks. In Proceedings of the IEEE Conference on Computer Vision and Pattern Recognition, Salt Lake City, UT, USA, 18–22 June 2018; pp. 7132–7141. [Google Scholar]
- Zhao, H.; Shi, J.; Qi, X.; Wang, X.; Jia, J. Pyramid scene parsing network. In Proceedings of the IEEE Conference on Computer Vision and Pattern Recognition, Honolulu, HI, USA, 21–26 July 2017; pp. 2881–2890. [Google Scholar]
- Ronneberger, O.; Fischer, P.; Brox, T. U-Net: Convolutional networks for biomedical image segmentation. In International Conference on Medical Image Computing and Computer-Assisted Intervention; Springer: Cham, Switzerland, 2015; pp. 234–241. [Google Scholar]
- Zhou, Z.; Siddiquee, M.M.R.; Tajbakhsh, N. UNet++: A Nested U-Net Architecture for Medical Image Segmentation. In Deep Learning in Medical Image Analysis and Multimodal Learning for Clinical Decision Support, Proceedings of the 4th International Workshop, DLMIA 2018, and 8th International Workshop, ML-CDS 2018, Held in Conjunction with MICCAI 2018, Granada, Spain, 20 September 2018; Springer: Cham, Switzerland; pp. 3–11.
- Alom, M.Z.; Hasan, M.; Yakopcic, C. Recurrent residual convolutional neural network based on u-net (r2u-net) for medical image segmentation. arXiv 2018, arXiv:1802.06955. [Google Scholar]


| Configuration | Parameter |
|---|---|
| CPU | Intel Xeon E5-2686 v4 |
| GPU | NVIDIA GeForce RTX 3080 TI |
| Development environment | Keras 2.3.1, TensorFlow 2.6, CUDA 11.2, cuDNN 8.0 |
| Operating system | Ubuntu 18.04 |
| Method | Backbone | Size | Param (M) | mIoU (%) | Precision (%) | Recall (%) | F1_Score (%) |
|---|---|---|---|---|---|---|---|
| original DeeplabV3+ | Xception | 512 × 512 | 42.1 | 89.66 | 97.20 | 91.91 | 94.48 |
| Mobilenetv2 | 2.7 | 84.12 | 94.88 | 89.08 | 91.89 | ||
| Resnet50 | 26.9 | 88.58 | 96.16 | 90.43 | 93.21 | ||
| Resnet101 | 45.9 | 90.11 | 94.42 | 93.91 | 94.16 | ||
| Ours | 27.4 | 92.98 | 97.32 | 95.29 | 96.29 |
| Serial Number | IB * | AT * | AC * | Param (M) | mIoU (%) | Precision (%) | Recall (%) | F1_Score (%) |
|---|---|---|---|---|---|---|---|---|
| 1 | 42.1 | 89.66 | 97.20 | 91.91 | 94.48 | |||
| 2 | √ | 26.9 | 88.58 | 96.16 | 90.43 | 93.21 | ||
| 3 | √ | √ | 27.4 | 92.98 | 97.32 | 95.29 | 96.29 | |
| 4 | √ | √ | √ | 27.4 | 94.62 | 97.42 | 96.95 | 97.18 |
| Model | mIoU (%) | Precision (%) | Recall (%) | F1_Score (%) | Time (s/Item) |
|---|---|---|---|---|---|
| U-Net | 92.88 | 96.42 | 95.98 | 96.20 | 2.37 |
| SegNet | 86.72 | 90.87 | 88.52 | 89.68 | 2.14 |
| FCN | 82.30 | 88.43 | 85.19 | 86.78 | 2.72 |
| U-Net++ | 92.81 | 96.56 | 95.67 | 96.11 | 2.11 |
| PSPNet | 81.97 | 91.81 | 87.42 | 89.56 | 2.25 |
| Deeplab v3+ | 89.66 | 97.20 | 91.91 | 94.48 | 1.86 |
| R2U-Net | 92.98 | 96.68 | 95.48 | 96.08 | 1.42 |
| Ours | 94.62 | 97.42 | 96.95 | 97.18 | 1.21 |
| Type | Real Diameter /mm | Model | Test Results /mm | Error /mm | Qualified or Not |
|---|---|---|---|---|---|
| 8 | 8.32 | DeeplabV3+ | 9.21 | +0.89 | No |
| Ours | 7.61 | −0.71 | Yes | ||
| 12 | 11.86 | DeeplabV3+ | 13.12 | +1.26 | No |
| Ours | 12.44 | +0.58 | Yes | ||
| 14 | 14.16 | DeeplabV3+ | 15.05 | +0.89 | No |
| Ours | 14.55 | +0.39 | Yes | ||
| 16 | 15.94 | DeeplabV3+ | 17.17 | +1.23 | No |
| Ours | 15.48 | −0.66 | Yes | ||
| 18 | 18.02 | DeeplabV3+ | 18.93 | +0.91 | No |
| Ours | 18.44 | +0.42 | Yes | ||
| 20 | 19.92 | DeeplabV3+ | 21.04 | +1.12 | No |
| Ours | 20.68 | +0.76 | Yes |
| Number | Real Spacing /mm | Model | Test Results /mm | Error /mm | Qualified or Not |
|---|---|---|---|---|---|
| 1 | 203.5 | DeeplabV3+ | 184.4 | −19.1 | No |
| Ours | 196.2 | −7.3 | Yes | ||
| 2 | 202.4 | DeeplabV3+ | 186.2 | −16.2 | No |
| Ours | 199.6 | −2.8 | Yes | ||
| 3 | 201.9 | DeeplabV3+ | 181.4 | −15.5 | No |
| Ours | 199.3 | −5.6 | Yes | ||
| 4 | 201.6 | DeeplabV3+ | 183.1 | −18.5 | No |
| Ours | 195.0 | −6.6 | Yes | ||
| 5 | 206.8 | DeeplabV3+ | 184.4 | −12.4 | No |
| Ours | 199.4 | −7.4 | Yes | ||
| 6 | 202.3 | DeeplabV3+ | 188.1 | −14.2 | No |
| Ours | 197.2 | −5.1 | Yes |
Disclaimer/Publisher’s Note: The statements, opinions and data contained in all publications are solely those of the individual author(s) and contributor(s) and not of MDPI and/or the editor(s). MDPI and/or the editor(s) disclaim responsibility for any injury to people or property resulting from any ideas, methods, instructions or products referred to in the content. |
© 2023 by the authors. Licensee MDPI, Basel, Switzerland. This article is an open access article distributed under the terms and conditions of the Creative Commons Attribution (CC BY) license (https://creativecommons.org/licenses/by/4.0/).
Share and Cite
Chen, W.; Fu, X.; Chen, W.; Peng, Z. Intelligent Detection of Rebar Size and Position Using Improved DeeplabV3+. Appl. Sci. 2023, 13, 11094. https://doi.org/10.3390/app131911094
Chen W, Fu X, Chen W, Peng Z. Intelligent Detection of Rebar Size and Position Using Improved DeeplabV3+. Applied Sciences. 2023; 13(19):11094. https://doi.org/10.3390/app131911094
Chicago/Turabian StyleChen, Wei, Xianglin Fu, Wanqing Chen, and Zijun Peng. 2023. "Intelligent Detection of Rebar Size and Position Using Improved DeeplabV3+" Applied Sciences 13, no. 19: 11094. https://doi.org/10.3390/app131911094
APA StyleChen, W., Fu, X., Chen, W., & Peng, Z. (2023). Intelligent Detection of Rebar Size and Position Using Improved DeeplabV3+. Applied Sciences, 13(19), 11094. https://doi.org/10.3390/app131911094