Abstract
The double vertical-axis wind turbine (VAWT) system serves as a high-performance design solution. The Nautilus wind turbine investigated in this research imitated the structure of a Nautilus shell and is a vertical-axis drag-type wind turbine that exhibits relatively low efficiency. Therefore, the improvement of its wind energy efficiency is of paramount importance. This paper utilizes Computational Fluid Dynamics (CFD) software, based on the Reynolds-averaged Navier–Stokes equations and dynamic meshing techniques, to conduct numerical investigations on the aerodynamic performance of the Nautilus wind turbine array layout. The effects of wind direction, spacing ratio, and rotation direction are individually studied, and the interpretations and explanations are provided based on flow field characteristics. The results show that when the wind direction is 90°, i.e., a transverse layout, the closer the spacing between the transverse turbines, the higher the average power coefficient of the entire wind turbine system, with little effect from the three rotation directions. The maximum average power coefficient reached 28.9% and the power gain factor (TPGF) reached 11.1%. The enhancement effect primarily originates from the wake interaction among neighboring turbines. The experimental results showed a deviation of 8.1% compared to the CFD simulation results, thus validating the accuracy of the numerical CFD modeling. Ultimately, several array layouts are proposed, based on the prevalent wind direction and spacing ratio research. The enhancement of the wind turbine array’s situation could significantly increase the average efficiency of the entire wind turbine cluster. Consequently, this study provides a reference for the practical application of biomimetic vertical-axis drag-type wind turbine systems in actual engineering.
1. Introduction
The massive exploitation and development of fossil fuels have been leading to the continuous degradation of the world’s environment. In recent years, many countries have been developing clean energy sources, with wind energy being an important way to reduce the use of fossil fuels and carbon emissions. Compared to open areas, micro wind farms in urban areas are considered an essential supplement to wind power generation [1]. However, in urban areas with high-rise buildings, changing wind directions and strong turbulence make traditional large horizontal axis wind turbines (HAWTs) extremely disadvantageous. Moreover, the high cost of land resources in urban areas limits the installation of wind turbines [2,3]. However, VAWTs are suitable for small-scale power generation in urban environments due to their unique features [4,5]. However, VAWT suffers from a fatal flaw; its efficiency is not comparable to HAWT, especially at low Reynolds numbers [6]. The Nautilus wind turbine studied in this paper is a vertical-axis drag-type wind turbine with a relatively low efficiency, and improving its efficiency is urgently needed.
When wind turbines work to generate electricity, they are often used to construct wind farms to provide power. Since HAWT has a higher efficiency than VAWT, most wind farms are primarily composed of HAWTs. However, the wake field formed by upstream wind turbines has a significant impact on downstream wind turbines and usually requires at least 20 wind turbine diameters [7,8]. In some areas with limited land resources, it is necessary to optimize the layout of wind turbines to increase the power density of the entire wind farm. Seyed H et al. [9] first demonstrated that the cluster of VAWTs can increase the efficiency of each individual wind turbine by 10% compared to traditional HAWT configurations. Furthermore, the number of clusters is significantly greater than that of a standalone unit, which can significantly increase the power generation of the entire wind farm, significantly increasing the power per unit area of land. Ahmed S et al. [10] have developed a multi-stage twisted Savonius wind turbine and studied it from an axial angle. The results showed that multi-stage rotors can improve the efficiency of the entire wind turbine, especially reducing mechanical vibration and noise emissions. Dabiri J [11] demonstrated the layout of VAWTs in a field experiment, showing that each wind turbine can harvest energy from adjacent wake fields and wind farms, thus improving power output. Wu C et al. [12] have used physical interpretation to optimize the layout of wind farms and have proposed a sunflower method that significantly improves the performance of the entire unit. Su H et al. [13] have tested various horizontal and vertical layouts, studied the layout of double wind turbines, and, ultimately, proposed a triangular and truss layout. The optimization of the array configuration significantly improves the average efficiency. Xu W et al. [14] have proposed a vertical-axis wind turbine array between buildings. The results showed that the average power output of wind turbine clusters in urban areas is always greater than that of a single wind turbine. Numerous published studies have indicated that efficiency significantly decreases when multiple HAWTs are grouped together due to the wake effects between turbines. However, VAWTs grouped in a configuration distinct from traditional HAWTs can greatly improve the average efficiency. With a well-designed layout, it is possible to achieve an average efficiency for the turbine array that surpasses the efficiency of individual wind rotors, which is an advantage not possessed by HAWTs.
Research has shown that VAWT arrays could achieve high power outputs on effective land areas. The dual VAWTs configuration is a common form of multi-turbine arrays. Therefore, various studies worldwide have started to investigate double VAWT arrays to save computer resources. Jin G et al. [15] researched the aerodynamic performance of a double VAWT system and found that the system’s efficiency was significantly improved. Their findings also validate that the blade azimuth angle has little impact on the aerodynamic performance. Xu Z et al. [16] demonstrated through their research that close spacing arrangements of VAWTs in an array formation have been proven to be superior compared to standalone VAWTs. It has been shown that the overall power output can be increased by more than 20%. Kuang L et al. [17] studied floating double VAWT systems offshore, investigating different spacing, pitch angles, and periods of upstream turbines. They found relatively large pitch angles and relatively small pitch periods reducing the negative effects of wake interference and small spacing having better power output. Mahsa H and Leila N [18] investigated the effect of spacing, wind direction, and vertical height difference on the efficiency of double VAWT systems based on the Taguchi method. Their results indicate that the vertical height difference has the most significant impact on the entire unit, and with the same height, double rotors have a 26.6% higher efficiency than single rotor ones. Chen Y et al. [19] investigated the influence of different wind conditions on the power output of dual-rotor systems. The findings revealed that wind direction, particularly when the wind frequency is high relative to the wind speed, has a significant impact on determining the optimal installation direction. Furthermore, it was determined that the maximum average power coefficient (CP) is 1.27 times higher than that of an isolated wind turbine. Zhao P et al. [20] added diamond-shaped flow deflectors to the double VAWT system and found that the average torque coefficient could be increased by 23% under the deflectors’ influence. Their study also revealed that the double VAWT system’s performance is sensitive to wind direction. Fatahian H et al. [21] studied the performance of dual Savonius rotors using the Taguchi design method. The CFD and experimental results indicated that the average power coefficient of the dual-rotor configuration improved by 19% compared to standalone wind turbines without the use of deflectors.
Numerous studies indicate that double VAWT configuration can significantly improve wind turbine performance. Previous studies by our research group have shown that a standalone Nautilus wind turbine has a conversion efficiency of 26%, which is quite remarkable. However, previous studies have not identified the fundamental reasons behind the enhancement effect; instead, they have merely described the phenomena in isolation. This paper investigates the flow field details and performance enhancement of double rotor systems at different spacing ratios and wind directions, explaining the nature of the performance improvement of VAWT arrays. Based on the research results, several reasonable array layouts were proposed, which represents a significant breakthrough, and the accuracy of the computational simulations was verified through wind tunnel experiments.
2. Methods
2.1. Theoretical Governing Equation
The entire CFD involves two partial differential equations: the mass conservation equation and the momentum conservation equation [22]. The mass conservation equation, also known as the continuity equation, represents that the increment of the total mass of the fluid is equal to the mass entering the fluid. The equation is expressed as follows:
In the equation, ρ is the fluid density and v is the velocity vector. The momentum conservation equation, also known as the Navier–Stokes equation, represents that the momentum entering the fluid is equal to the sum of the momentum and force generated externally [23]. It is the fundamental differential equation for CFD solutions and is expressed as follows:
In the equation, f represents the volume-based forces acting on the fluid, and μ is the viscosity coefficient of the fluid [24].
2.2. Model
The entire Nautilus wind turbine consists of three blades, which are biomimetic to the shell of a Nautilus in nature, with characteristics such as being aesthetically pleasing, having a smooth exterior shell, and being robust [25]. The model’s thought process is shown in Figure 1. The relevant parameters of the wind turbine are shown in Table 1.
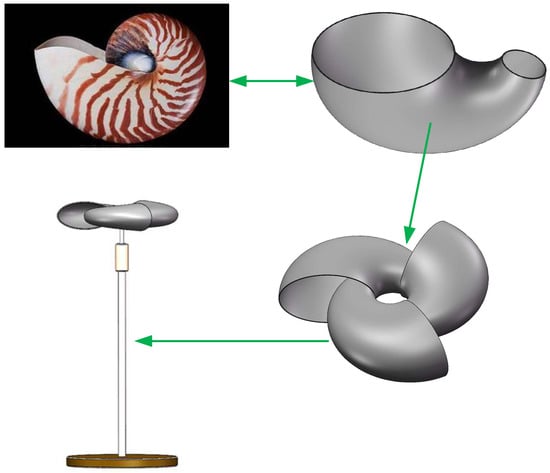
Figure 1.
Nautilus wind turbine model.

Table 1.
Geometric features of selected VAWTs.
2.3. Mesh
The entire flow field domain was discretized into elements for solving the governing equations. ANSYS-Mesh was used to divide the internal and external flow domains into tetrahedral and hexahedral grids. Complex flow occurs near the wind turbine wall, and a boundary layer treatment is applied to the wind turbine wall. The first layer height is 0.25 mm, with a total of 20 layers and a growth ratio of 1.1. The entire computational domain grid is shown in Figure 2, with the grid gradually refined from the external stationary flow region to the rotating region on the wind turbine surface to meet higher computational requirements.
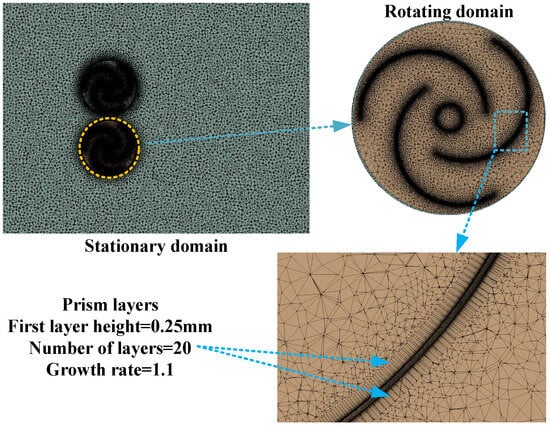
Figure 2.
Grid model of watershed inner and outer of the flow field.
2.4. Solver and Boundary Condition Settings
The k-ω (SST) turbulence model was selected, which considers both the boundary layer and the free stream. This enables it to more accurately capture the effects of turbulence in wind turbine analysis. Additionally, this model provides better predictions of turbulence generation, propagation, and variations in turbulent eddies. The simulations were based on the RANS equations and dynamic meshing techniques. The Mach number for all numerical experiments was less than 0.3, and the airflow was regarded as being incompressible. Therefore, a pressure-based solver was used to solve the momentum and pressure correction equations [26]. The air density is 1.225 kg/m3, the viscosity is 1.79 × 10⁻⁵ Pa/s, the inlet velocity was set to 4 m/s, and the outlet pressure was set to 0 Pa. The boundary conditions for the entire flow field are shown in Figure 3. Pressure-velocity coupling scheme was adopted, and a second-order implicit technique was used for time discretization, with a convergence iteration residual set to 10−5 The torque generated for each time step was monitored to calculate the power coefficient.
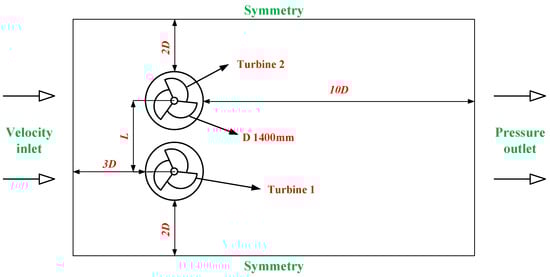
Figure 3.
Boundary conditions of flow field.
2.5. Grid and Time Step Verification
To ensure the accuracy of the simulation results, independent verification was conducted on the number of grid elements and the time step. A simulation with TSR = 0.6 was selected, and the torque generated by the wind turbine was monitored and compared. Figure 4a shows the torque generated by the wind turbine at different numbers of grid elements. When the number of grid elements was less than 1.4 million, the torque generated by the wind turbine was unstable, which affected the experimental results. However, when the number of grid elements exceeded 1.5 million, the torque generated tended to be balanced and was approximately 1.68. A finer grid resolution did not improve the calculation accuracy and wasted resources [27]. This result indicates that 1.5 million grid elements were the most suitable number of grid elements. In addition to the grid independence verification, research on the time step was also needed to ensure that the simulation results were independent of the time step [28]. Three times steps were used in the simulation, namely Δt = 0.00256 s, Δt = 0.00513 s, and Δt = 0.01026 s. These time steps corresponded to the time for the VAWT to rotate 1°, 2°, and 3° positions. Figure 4b shows the relationship between torque and azimuth angle for these time steps. The result with Δt = 0.00513 s was more consistent with the simulation result with Δt = 0.00256 s and consumed more reasonable resources. Therefore, Δt = 0.00513 s was selected as the appropriate time step for the simulation.
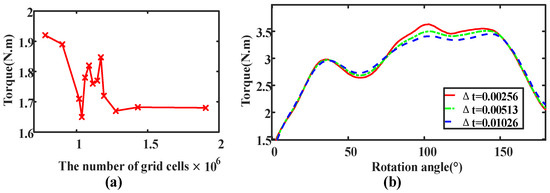
Figure 4.
Model validity verification: (a) torque changes at different grid cells; (b) torque changes at different time steps with rotation azimuth angle.
3. Results and Discussion
Based on the wake effect of wind turbines, arranging wind turbine arrays reasonably can improve critical performance indicators such as power density and average power coefficient for the entire wind farm. Compared with HAWTs, VAWTs can improve the average power coefficient of the entire wind turbine array, especially for the transverse arrangement of wind turbines, which is perpendicular to the wind direction. Due to limited computational resources, this study investigated the performance of a two-wind turbine array. The term “double turbine array” can also be used to refer to the performance of multiple wind turbine arrays. This study explored the aerodynamic performance of wind turbine arrays based on three parameters: the spacing ratio, wind direction, and rotation direction.
3.1. Wind Direction
Compared with HAWTs, one advantage of a single VAWT operating alone is that there is no need for a wind direction device. However, when a VAWT array operates together, research shows that changes in wind direction have a significant impact on the efficiency of the entire array. In actual scenarios, the wind is not always in a single direction, and prevailing winds often exist. For example, in China’s southeastern coastal areas, the prevailing winds are southeast in summer and northwest in winter. Therefore, utilizing wind direction rationally is also crucial [29].
This study investigated four wind directions, α = −45°, α = 0°, α = 45°, and α = 90°, where the other wind directions were symmetrical and thus omitted. The spacing between the wind turbines was 2D. To facilitate the full development of the Nautilus wind turbine wake flow and, at the same time, consider the performance of the computer, the outflow field of the cross-section under different wind directions was reasonably arranged, as shown in Figure 5. It is worth noting that, for the 0° wind direction, which corresponds to the horizontal wind direction, the wind direction is parallel to the connecting line between the wind turbine array, and the wind turbines are horizontally arranged, which makes the analysis easier. In the exploration of wind turbine aerodynamic performance, the power coefficient, which represents the wind energy conversion efficiency, is of paramount importance. The power coefficient can be expressed as
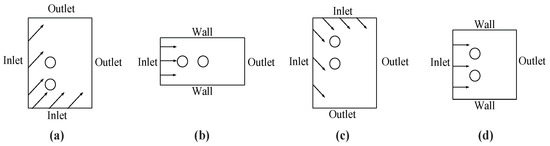
Figure 5.
Flow field models with different wind directions: (a) α = 45°, (b) α = 0°, (c) α = −45°, (d) α = 90°.
In the equation, T represents torque, ω represents angular velocity, H represents the height of the wind turbine, and D represents the diameter of the wind turbine. To further investigate the aerodynamic performance of the turbine array, this study proposed a concept of average power coefficient, which is expressed as follows:
CP1 and CP2, respectively, represent the power coefficients of wind turbines 1 and 2.
The average efficiency of the Nautilus wind turbines under different wind directions is shown in Figure 6. From Figure 6a, it can be seen that the average efficiency curve of the wind turbine array under different wind directions is consistent and reaches its maximum value at TSR = 0.6 compared to a single wind turbine. It can be observed from Figure 5a,c that the −45° and 45° wind directions are symmetrical about the x-axis, so the wind energy conversion efficiency curves of these two wind turbine arrays are consistent, with a maximum average power coefficient of about 23%. Compared with other wind directions, the efficiency of the wind turbine array under the 0° wind direction is significantly lower, with a maximum average efficiency of only 17%. The maximum conversion efficiency of the 90° wind turbine array is higher than that of a single wind turbine. The 90° wind direction is perpendicular to the centerline of the wind turbine; that is, the wind turbines are arranged in a transverse configuration, which is consistent with previous research results [30], and the maximum conversion efficiency reaches 27.5%. The optimal efficiency polar coordinate comparison curves of the wind turbine arrays under different wind directions are shown in Figure 6b, where it can be seen that the conversion efficiency is highest for wind directions at the top and bottom, and the efficiency decreases as the wind direction becomes more horizontal.
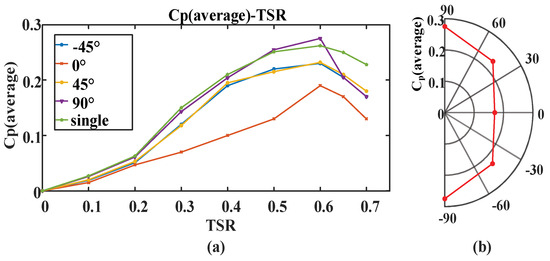
Figure 6.
(a) Efficiency comparison curves of different wind directions under different TSR; (b) polar coordinate efficiency comparison curves of different wind directions under optimal TSR.
To further explain the above results, the wake velocity fields are quoted. The wake velocity cloud maps of wind turbine arrays under different wind directions are shown in Figure 7, where the turbine numbers are indicated in a and b. As shown in Figure 7b, under the 0° horizontal wind direction, wind turbine 2 is completely in the wake of wind turbine 1, resulting in obvious wake interference and a sharp decrease in the conversion efficiency of wind turbine 2. This is similar to the wake flow of a HAWTs array, which is an axial layout. In order to improve the efficiency of downstream axial wind turbines, they need to be arranged far away, which wastes land resources and does not increase the power density of the entire wind farm. Similarly, 45° and −45° wind directions have interference from the wake flow to some extent, making it difficult to arrange wind turbine arrays, as can be seen in Figure 7c,d. When the wind direction is not horizontal, as shown in Figure 7a,c,d, there are gaps between the wind turbines. As indicated by the Venturi effect, when the gap between two wind turbines is small, a high-speed airflow is generated, shown as the circled purple areas, which creates a gain effect between the entire VAWTs. However, interference from the wake flow of upstream wind turbines exists for 45° and −45° wind directions, while there is no wake interference for the 90° wind direction. Therefore, the transverse arrangement of wind turbine arrays can improve the average power coefficient of the entire system, which explains the results in Figure 6.
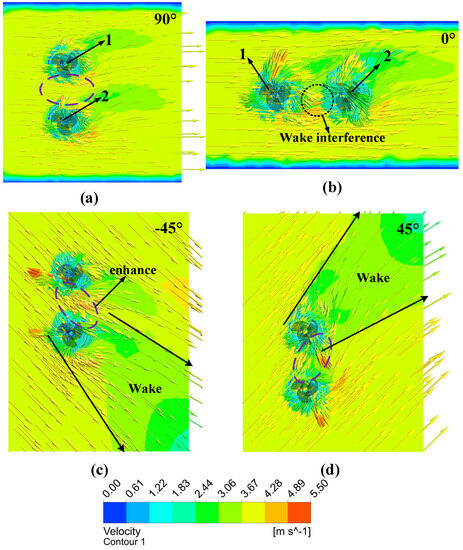
Figure 7.
Velocity wake field of different wind directions, (a) α = 90°, (b) α = 0°, (c) α = −45°, (d) α = 45°.
3.2. Spacing Ratio
As mentioned earlier, the transverse arrangement of wind turbine arrays can improve the average efficiency of the wind turbines. The following study focuses on the spacing ratio between the wind turbine arrays in the transverse direction, with the aim of examining the enhancement effect. The spacing between wind turbines has an important impact on the entire transverse wind turbine array. The spacing ratio between VAWTs is expressed as L/D, where L is the distance between the centers of the wind turbines, and D is the maximum rotational diameter of the Nautilus wind turbine. In this study, wind turbine array models with L/D ratios of 1.2, 1.5, and 2 are investigated.
The power coefficients of wind turbine arrays with different L/D ratios are shown in Figure 8. It can be seen from the figure that the efficiency curve of the array has some similarity with the efficiency curve of a single wind turbine. The efficiency reaches its highest value at TSR = 0.6, and the average efficiency of the entire array reaches 28.87% when L/D = 1.2. As the spacing between wind turbines decreases, the average power coefficient of the entire wind turbine array continues to increase, indicating that the more compact the spacing between two wind turbines, the higher the performance of the entire wind turbine array can be improved [31].
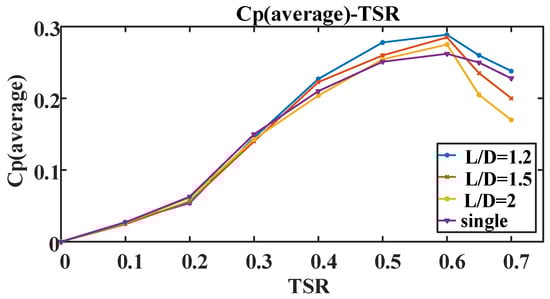
Figure 8.
Comparison of average power coefficients at different spacing ratios.
To clarify the enhancement effect, the concept of wind turbine power gain factor (TPGF) is introduced to evaluate the improvement of the dual wind turbine system’s overall power output. The TPGF is expressed as follows:
The power coefficient comparison between wind turbine arrays and single wind turbines at the optimal TSR = 0.6 is shown in Figure 9. It is clear from Figure 9 that the wind turbine array has enhanced performance, with stronger enhancement at smaller spacing ratios. When L/D = 1.2, the power gain factor (TPGF) of the dual Nautilus wind turbine array reaches 10.2%. The closer and more compact the spacing between two wind turbines, the stronger the enhancement effect. However, in practical engineering applications, there should be a sufficient safety distance between two rotors to prevent any potential danger.
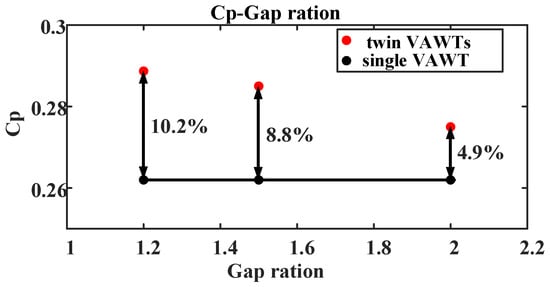
Figure 9.
Comparison of TPGF of wind turbines with different spacing ratios.
To further elucidate the enhancement effect of wind turbine clusters, this paper explains it from the post-processing of the cross-sectional velocity wake field. Figure 10 shows the velocity contour of wind turbine sections with different spacing ratios, where the spacing between wind turbines is shown in Figure 10a, and 2D represents the spacing between the centers of the wind turbines perpendicular to the wind direction. The airflow passes through the wind turbine group with a certain spacing, and the wind turbines rotate clockwise. The flow field bends obliquely upward, showing the asymmetry of the wake field distribution, as indicated by the black arrows in Figure 10a,b. According to the Bernoulli principle, the smaller the spacing, the faster the wind speed, and the darker the color in the wake velocity field. The arrow represents the vector diagram of particle velocity. The downstream wind turbine 2 is not only affected by the incoming wind speed, but also by the flow direction generated by the rotation of the upstream wind turbine 1, which promotes, rather than hinders, the performance of the wind turbine as indicated by the black circle in Figure 10c. The smaller the spacing between wind turbines, the stronger this enhancement effect. Wind turbines 1 and 2 can obtain energy from neighboring wake fields. This gain effect is not possible with standalone wind turbines and horizontal-axis wind turbine groups, which explains the essence of the enhanced effect of the transverse vertical-axis wind turbine group.
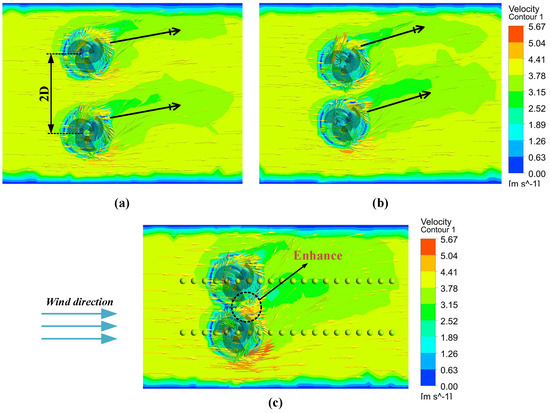
Figure 10.
Wake velocity contour of sections with different spacing ratios: (a) L/D = 2, (b) L/D = 1.5, (c) L/D = 1.2.
To further investigate the flow characteristics of wind turbine groups, a velocity normalization analysis of the downstream wake was conducted. Twenty sampling points were selected for each wind turbine, as shown by the dots in Figure 10c. The comparison curves are shown in Figure 11. The wake velocity recovery is different for different spacing ratios. Compared to standalone wind turbines, the wake recovery speed of the group is faster, especially for the L/D = 2 cases, where it has recovered to 92% of the inflow wind speed at x/D = 1.5 downstream, almost regaining the original wind speed. Under other spacing conditions, the wake has recovered to the original wind speed at x/D = 2~3. This is an advantage that standalone wind turbines do not possess [32] and provides more references for downstream wind turbine array arrangements.
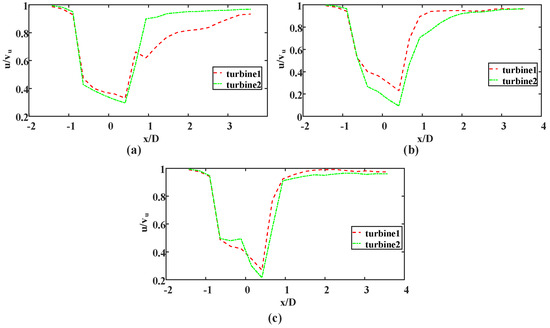
Figure 11.
Velocity normalization curves with different spacing ratios: (a) L/D = 1.2, (b) L/D = 1.5, (c) L/D = 2.
3.3. Rotation Directions
For a pair of closely spaced wind turbines, three different configurations are possible based on the rotation direction of each wind turbine. As shown by the black arrows in Figure 13a, the wind turbine is rotating in the opposite direction and upwards, indicating that the rotation direction of the blades in the gap between the two wind turbines is opposite to the wind direction; (b) shows that the wind turbine is rotating in the opposite direction and downwards; (c) shows that the wind turbine is rotating in the same direction. The maximum average power coefficient corresponding to different rotation directions is shown in Figure 12, with little difference between them. The highest efficiency corresponds to the opposite direction and downward rotation, which is 28.9%, and the gain factor TPGF reaches 11.1%. The lowest efficiency corresponds to the opposite direction and upward rotation, with a 6% difference. All three rotation methods show higher efficiency than that of a standalone wind turbine. This indicates that regardless of the installation method, closely spaced dual turbine groups can improve the average conversion efficiency of the entire unit.
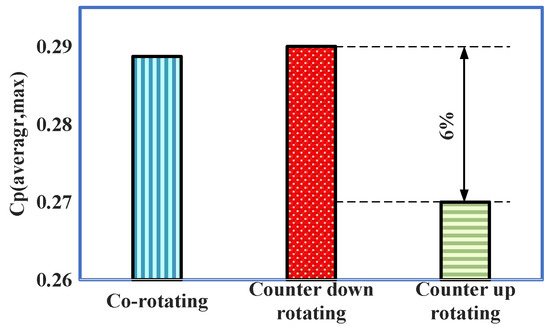
Figure 12.
Maximum average power coefficient corresponding to different rotation directions.
Three different rotation modes’ velocity wake fields are shown in Figure 13, demonstrating an asymmetry in the wake velocity, as indicated by the red arrows, which is a fundamental characteristic of the flow field. In particular, for (b) downward reverse rotation, the wake produces a convergence effect, resulting in a smaller wake velocity area where more wind energy can be absorbed by the turbine and converted into mechanical energy, leading to higher efficiency.
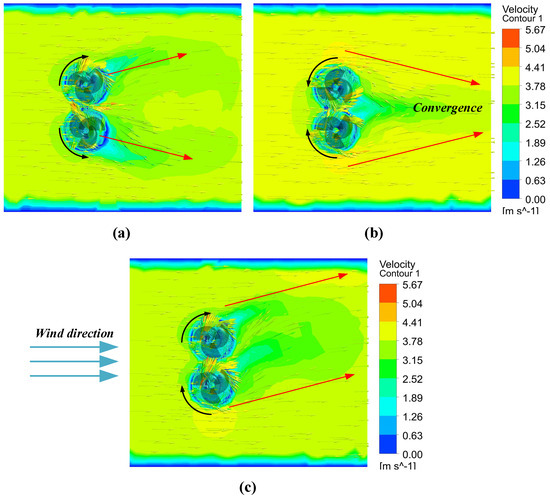
Figure 13.
Velocity wake contour for different rotation directions: (a) counter up rotating, (b) counter down rotating, (c) co-rotating.
3.4. Recommended Array Layout
By comparing the results of Section 3.1 and Section 3.2, it can be concluded that the lateral layout and compact layout are beneficial for improving the average power coefficient of the entire wind turbine group. Based on this concept, several array layouts are proposed, as shown in Figure 14. The conventional rectangular symmetrical layout is shown in (a). In this layout, the downstream wind turbines will be affected by the wake interference of the upstream wind turbines, which is disadvantageous for the wind energy capture of the downstream wind turbines and severely reduces the efficiency of the entire group. Based on the research results of Section 3.1 on wind direction, two layouts (b) and (c) were proposed, and an interleaved arrangement was designed according to the wind direction to reduce the wake interference of the upstream wind turbines. If farm conditions allow for it, a fully lateral layout can be designed, which would significantly increase the average power coefficient, as shown in (c). Based on the research results of Section 3.2 on spacing, three layouts, (d), (e), and (f), were proposed. They mainly propose a compact VAWT layout, a compact layout of dual and triple wind turbines, which should also be arranged in an interleaved manner to reduce the interference of upstream wind turbines. Regarding the wind turbine rotation direction studied in Section 3.3, all the different rotation directions can improve efficiency, and the differences in efficiency among the three modes are not significant. Therefore, they are not considered further. Overall, wind direction has no effect on standalone VAWTs, which is an advantage of these wind turbines. However, wind direction does have a significant impact on the entire wind turbine group. The spacing research indicates that a compact layout is recommended, which distinguishes it from HAWT groups. This is a significant advantage of VAWT groups, as it can significantly increase the power density of the entire wind farm [33].
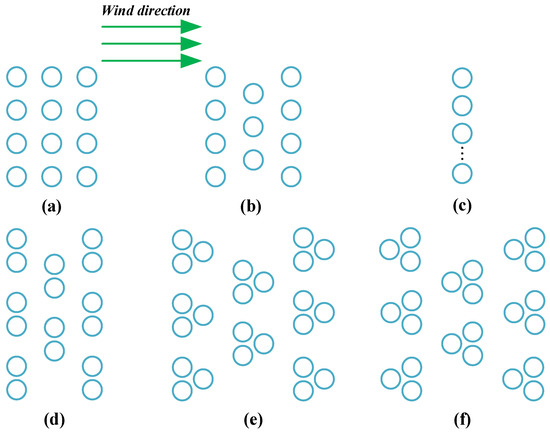
Figure 14.
Different array layouts.
3.5. Experimental Analysis
To ensure accurate numerical simulation results, an experimental platform for the two Nautilus VAWTs was constructed for experimental comparisons. The experimental setup for the Nautilus VAWT in this study was built based on the testing platform constructed by Santamaría et al. [34]. The experimental setup used in this study is shown in Figure 15, and it mainly consists of a Nautilus wind rotor, a middle shaft, a wind speed monitor, a speed detector, a bearing, and a series of components. Two wind rotors are designed and manufactured using 3D printing, and the wind speed monitor uses an anemometer (range 0.3~30 m/s, measurement error ± 3%rdg ± 0.1), while the speed detector uses a combination device of a timer and a counter. Anemometers were placed around the wind turbine, and the average value was recorded. The magnitude of the wind speed was controlled by adjusting the distance between the wind turbine and the blower. The farther the distance from the blower, the lower the wind speed. The timer is set to its default value of 60 s, and the counter works through a Hall effect switch. The number of wind rotor rotations in one minute is recorded by the counter to calculate the rotor speed. The same operating conditions were set in CFD, and the rotor speed was monitored during the calculation. The experimental results were compared with CFD results, as shown in Figure 16. Each line represents the average speed of two wind turbines. The CFD data is represented by solid lines, while the experimental data is represented by dashed lines. By using different spacing ratios, which are also the focus of this study, it can be observed that the experimental and CFD speed curves exhibit similar trend patterns. The experimentally measured overall average speed is 8.1% lower than the simulated CFD speed. This is due to the presence of support frames during the platform setup, frictional forces between structures [35], instrument accuracy, and other factors [36], which inevitably lead to some errors that are acceptable. It is acceptable that the CFD results have guiding significance for the calculation model.
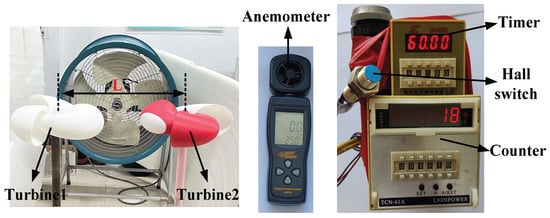
Figure 15.
Experimental prototype model.
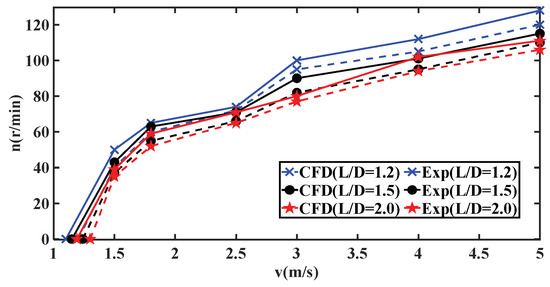
Figure 16.
Comparison of speed between experiment and CFD.
4. Conclusions
In the current research work, the aerodynamic performance of a double Nautilus-type vertical-axis wind turbine was studied in detail through numerical simulation using the Reynolds-averaged Navier–Stokes equations and dynamic sliding mesh technology, as well as a 3D unsteady incompressible turbulent model. The results showed that the average power coefficient of the entire wind turbine group can be significantly improved by reasonably optimizing the wind turbine array configuration. The following conclusions can be drawn from this study:
- (1)
- When the distance between two wind turbines is 2D and the wind direction is 90°, the average power coefficient of the entire group is the highest, and the lateral layout of the wind turbines can significantly improve the performance of the entire wind turbine, which is a performance advantage that HAWTs do not have.
- (2)
- When the wind turbines are laterally arranged and the distance between them is 1.2D, the maximum CP (average) of the double wind turbine group compared to a single wind turbine has a TPGF of 10.2%. The closer the distance, the stronger the performance improvement, mainly due to a promoting and enhancing effect among wind turbines. Each wind turbine can obtain energy from the adjacent wake field and wind field, thereby improving power output. This effect, which is not present in HAWTs, provides novelty to this study and explains the essence of the enhancement phenomenon. In actual production, the material performance of the wind turbine should also be taken into consideration, and the distance between wind turbines should not be too small to avoid damage to the wind turbine.
- (3)
- Compared with a single wind turbine, the double-turbine system can improve the power coefficient for all three different rotation directions, especially for the counter down rotating, where the gain factor TPGF reaches 11.1%. Overall, the average maximum power coefficients for the three rotation modes are not significantly different.
- (4)
- Several array layouts are proposed based on the above research, and compared to the conventional rectangular symmetrical layout, the array layouts proposed in this study can significantly improve performance in wind energy capture.
- (5)
- A prototype experimental platform was built for experimental comparison analysis, and the speed error was 8.1%, indicating that the CFD simulation results were reliable.
In the future, we will conduct double-rotor experiments to ensure the accuracy of the CFD simulations. The VAWTs array is affected by two important factors, wind direction and spacing. By utilizing these parameters reasonably, the array cluster of VAWTs can significantly improve the average power coefficient relative to a single VAWT, indicating that the array configuration of VAWTs has enormous potential to increase the power density of the wind field. In the future, the construction of VAWT arrays should fully consider local weather and meteorological conditions, as well as the material performance of the parrot-type wind turbines themselves, to better serve humanity.
Author Contributions
Conceptualization, G.X. and Y.C.; methodology, G.X.; software, Y.C.; validation, G.X.; formal analysis, G.X. and Z.Q.; investigation, Z.Q. and G.W.; resources, G.X., Y.C. and J.W.; data curation, J.W., T.G. and W.Z.; writing—original draft preparation, G.X.; Visualization, Y.C. and Y.Y.; Supervision, Y.C. and Y.Z.; Project administration, Y.C., Z.Q., Y.Z., T.G. and Y.W.; Funding acquisition, Y.C. All authors have read and agreed to the published version of the manuscript.
Funding
This work was completed with the support of the National Natural Science Foundation of China (grant number 51376096), “Thirteenth Five-Year Plan” Provincial Key Construction Discipline Project of Jiangsu Province (2016-0802 Mechanical Engineering) and Jiangsu Engineering Research Center for Wind Energy Application.
Institutional Review Board Statement
Not applicable.
Informed Consent Statement
Not applicable.
Data Availability Statement
Not applicable.
Conflicts of Interest
The authors declare no conflict of interest.
Nomenclature
| VAWT | Vertical-axis wind turbine | HAWT | Horizontal-axis wind turbines |
| TPGF | The power gain factor | CFD | Computational Fluid Dynamics |
| ρ | Fluid density | v | Wind velocity |
| f | Volume-based force | μ | Viscosity coefficient |
| TSR | Tip speed ration | D | Wind wheel diameter |
| H | Wind wheel height | α | Wind direction |
| CP | Wind energy efficiency | L | Spacing ration |
| T | Torque | ɷ | Angular velocity |
References
- Tasneem, Z.; Al Noman, A.; Das, S.K.; Saha, D.K.; Islam, M.R.; Ali, M.F.; Badal, M.F.R.; Ahamed, M.H.; Moyeen, S.I.; Alam, F. An analytical review on the evaluation of wind resource and wind turbine for urban application: Prospect and challenges. Dev. Built Environ. 2020, 4, 100033. [Google Scholar] [CrossRef]
- Stathopoulos, T.; Alrawashdeh, H.; Al-Quraan, A.; Blocken, B.; Dilimulati, A.; Paraschivoiu, M.; Pilay, P. Urban wind energy: Some views on potential and challenges. J. Wind Eng. Ind. Aerodyn. 2018, 179, 146–157. [Google Scholar] [CrossRef]
- El-Askary, W.; Burlando, M.; Mohamed, M.H.; Eltayesh, A. Improving performance of h-type naca 0021 darrieus rotor using leading-edge tationary/rotating microcylinders: Numerical studies. Energy Convers. Manag. 2023, 292, 117398. [Google Scholar] [CrossRef]
- Blubaugh, D.J.; Atamian, M.; Babcock, G.T.; Golbeck, J.H.; Cheniae, G.M. Aerodynamic performance improvement of Savonius wind turbine through a passive flow control method using grooved surfaces on a deflector. Ocean Eng. 2023, 284, 115282. [Google Scholar] [CrossRef]
- Battisti, L.; Benini, E.; Brighenti, A.; Dell’anna, S.; Castelli, M.R. Small wind turbine effectiveness in the urban environment. Renew. Energy 2018, 129, 102–113. [Google Scholar] [CrossRef]
- Brusca, S.; Lanzafame, R.; Messina, M. Design of a vertical-axis wind turbine: How the aspect ratio affects the turbine’s performance. Int. J. Energy Environ. Eng. 2014, 5, 333–340. [Google Scholar] [CrossRef]
- Brownstein, D.; Kinzel, M.; Dabiri, J. Performance enhancement of downstream vertical-axis wind turbines. J. Renew. Sustain. Energy 2016, 8, 053306. [Google Scholar] [CrossRef]
- Hau, E. Wind Turbines, Fundamentals, Technologies, Application, Economics, 2nd ed.; Springer: Berlin/Heidelberg, Germany, 2006. [Google Scholar]
- Hezaveh, S.H.; Bou-Zeid, E.; Dabiri, J.; Kinzel, M.; Cortina, G.; Martinelli, L. Increasing the Power Production of Vertical-Axis Wind-Turbine Farms Using Synergistic Clustering. Bound. Layer Meteorol. 2018, 169, 275–296. [Google Scholar] [CrossRef]
- Saad, A.S.; Elwardany, A.; El-Sharkawy, I.I.; Ookawara, S.; Ahmed, M. Performance evaluation of a novel vertical axis wind turbine using twisted blades in multi-stage Savonius rotors. Energy Convers. Manag. 2021, 235, 114013. [Google Scholar] [CrossRef]
- Dabiri, J. Potential order-of-magnitude enhancement of wind farm power density via counter-rotating vertical-axis wind turbine arrays. J. Renew. Sustain. Energy 2011, 3, 043104. [Google Scholar] [CrossRef]
- Wu, C.; Yang, X.; Zhu, Y. On the design of potential turbine positions for 1 physics-informed optimization of wind farm layout. Renew. Energy 2021, 164, 1108–1120. [Google Scholar] [CrossRef]
- Su, H.; Meng, H.; Qu, T.; Lei, L. Wind tunnel experiment on the influence of array configuration on the power performance of vertical axis wind Turbines. Energy Convers. Manag. 2021, 241, 114299. [Google Scholar] [CrossRef]
- Xu, W.; Li, Y.; Li, G.; Li, S.; Zhang, C.; Wang, F. High-resolution numerical simulation of the performance of vertical axis wind turbines in urban area: Part II, array of vertical axis wind turbines between Buildings. Renew. Energy 2021, 176, 25–39. [Google Scholar] [CrossRef]
- Jin, G.; Zong, Z.; Jiang, Y.; Zou, L. Aerodynamic analysis of side-by-side placed twin vertical-axis wind turbines. Ocean Eng. 2020, 209, 107296. [Google Scholar] [CrossRef]
- Xu, Z.; Chen, J.; Li, C. Research on the adaptability of dynamic pitch control strategies on H-type VAWT close-range arrays by simulation study. Renew. Energy 2023, 218, 119231. [Google Scholar] [CrossRef]
- Kuang, L.; Lu, Q.; Huang, X.; Song, L.; Chen, Y.; Su, J.; Han, Z.; Zhou, D.; Zhao, Y.; Xu, Y.; et al. Characterization of wake interference between two tandem offshore floating vertical-axis wind turbines: Effect of platform pitch motion. Energy Convers. Manag. 2022, 265, 115769. [Google Scholar] [CrossRef]
- Mahsa, H.; Leila, N. Aerodynamic optimization of the configuration of a pair of vertical axis wind turbines. Energy Convers. Manag. 2021, 238, 114069. [Google Scholar] [CrossRef]
- Chen, Y.; Zhang, D.; Qi, W.; Guo, P.; Li, J. Power prediction of a Savonius wind turbine cluster considering wind direction characteristics on three sites. J. Clean. Prod. 2023, 423, 138789. [Google Scholar] [CrossRef]
- Zhao, P.; Jiang, Y.; Liu, S.; Stoesser, T.; Zou, L.; Wang, K. Investigation of fundamental mechanism leading to the performance improvement of vertical axis wind turbines by deflector. Energy Convers. Manag. 2021, 247, 114680. [Google Scholar] [CrossRef]
- Fatahian, H.; Mishra, R.; Jackson, F.F.; Fatahian, E. Design optimization of an innovative deflector with bleed jets to enhance the performance of dual Savonius turbines using CFD-Taguchi method. Energy Convers. Manag. 2023, 296, 117655. [Google Scholar] [CrossRef]
- Maalouly, M.; Souaiby, M.; ElCheikh, A.; Issa, J.; Elkhoury, M. Transient analysis of H-type Vertical Axis Wind Turbines using CFD. Energy Rep. 2022, 8, 4570–4588. [Google Scholar] [CrossRef]
- Mohammadi, M.; Hosseinzadeh, K.; Ganji, D. Numerical analysis on the impact of axial grooves on vortex cooling behavior in gas turbine blade’s leading edge. Proc. Inst. Mech. Eng. Part E J. Process Mech. Eng. 2023, 09544089231163113. [Google Scholar] [CrossRef]
- Sun, S.; Liu, H.; Peng, H. Power performance and self-starting features of H-rotor and helical vertical axis wind turbines with different airfoils in turbulence. Energy Convers. Manag. 2023, 292, 117405. [Google Scholar] [CrossRef]
- Somoano, M.; Huera, F. Bio-inspired blades with local trailing edge flexibility increase the efficiency of vertical axis wind Turbines. Energy Rep. 2022, 8, 3244–3250. [Google Scholar] [CrossRef]
- Shukla, S.; Ramanan, C.; Bora, B.J.; Deo, A.; Alom, N. Numerical analysis of vertical axis wind turbine blades in ANSYS Fluent. Mater. Today Proc. 2022, 59, 1781–1785. [Google Scholar] [CrossRef]
- Zanforlin, S.; Nishino, T. Fluid dynamic mechanisms of enhanced power generation by closely spaced vertical axis wind Turbines. Renew. Energy 2016, 99, 1213–1226. [Google Scholar] [CrossRef]
- Lam, H.F.; Peng, H.Y. Measurements of the wake characteristics of Co- and counter-rotating twin H-rotor vertical axis wind Turbines. Energy 2017, 131, 13–26. [Google Scholar] [CrossRef]
- Elgendi, M.; AlMal, M. A review of wind turbines in complex Terrain. Int. J. Thermofluids 2023, 17, 100289. [Google Scholar] [CrossRef]
- Laws, P. Validating the ideal configuration and mutual coupling effect among Savonius wind turbine clusters using free rotation Analysis. Ocean Eng. 2022, 266, 112879. [Google Scholar] [CrossRef]
- Vergaerde, A.; De Troyer, T.; Standaert, L.; Kluczewska-Bordier, J.; Pitance, D.; Immas, A.; Silvert, F.; Runacres, M.C. Experimental validation of the power enhancement of a pair of Vertical-axis wind Turbines. Renew. Energy 2020, 146, 181–187. [Google Scholar] [CrossRef]
- Hansen, J.; Mahak, M.; Tzanakis, I. Numerical modelling and optimization of vertical axis wind turbine pairs: A scale up Approach. Renew. Energy 2021, 171, 1371–1381. [Google Scholar] [CrossRef]
- Azadani, L. Vertical axis wind turbines in cluster Configurations. Ocean Eng. 2023, 272, 113855. [Google Scholar] [CrossRef]
- Santamaría, L.; Díaz, K.M.A.; Vega, M.G.; Pérez, J.G.; Velarde-Suárez, S.; Oro, J.M.F. Performance assessment of vertical axis wind turbines (VAWT) through control volume Theory. Sustain. Energy Technol. Assess. 2022, 54, 102811. [Google Scholar] [CrossRef]
- Mendes, P.; Correia, J.A.; Castro, J.M.; Fantuzzi, N.; Aidibi, A.; Manuel, L. Horizontal and vertical axis wind turbines on existing jacket platforms: Part 1—A comparative Study. Structures 2021, 32, 1069–1080. [Google Scholar] [CrossRef]
- Seralathan, S.; Ganesh, C.P.V.S.; Venganna, B.P.R.; Srinivas, N.S.; Chowdary, B.L.; Hariram, V.; Premkumar, T.M. Simulation studies to analyze the static mechanical properties of helical Savonius vertical axis wind turbine Blade. Mater. Today Proc. 2020, 33, 3737–3745. [Google Scholar] [CrossRef]
Disclaimer/Publisher’s Note: The statements, opinions and data contained in all publications are solely those of the individual author(s) and contributor(s) and not of MDPI and/or the editor(s). MDPI and/or the editor(s) disclaim responsibility for any injury to people or property resulting from any ideas, methods, instructions or products referred to in the content. |
© 2023 by the authors. Licensee MDPI, Basel, Switzerland. This article is an open access article distributed under the terms and conditions of the Creative Commons Attribution (CC BY) license (https://creativecommons.org/licenses/by/4.0/).