Article

Construction Risk Assessment of Yellow River Bridges Based on Combined Empowerment Method and Two-Dimensional Cloud Model

1
Henan Jiaotou Jiaozheng Expressway Co., Ltd., Zhengzhou 450016, China
2
School of Water Conservancy and Transportation, Zhengzhou University, Zhengzhou 450001, China
*
Author to whom correspondence should be addressed.
Appl. Sci. 2023, 13(19), 10942; https://doi.org/10.3390/app131910942
Submission received: 2 September 2023 / Revised: 29 September 2023 / Accepted: 30 September 2023 / Published: 3 October 2023

Abstract

:
(1) In recent years, the economy of the Yellow River basin in China has developed rapidly, and a series of large bridges across the Yellow River have been built on both sides of the Yellow River, which has brought great convenience to regional socio-economic activities. However, risk events are prone to occur during the construction of bridges across the Yellow River, which affect the safety of the bridges’ structure. Therefore, it is necessary to establish a new scientific risk assessment system for the construction safety of bridges across the Yellow River. (2) Methods: Firstly, based on the construction safety risk assessment index system of bridges across the Yellow River, the cloud AHP method and the cloud entropy weight method are used to determine the subjective weight and objective weight of risk indexes, and then the game theory combination weighting method is used to determine the comprehensive weight of each risk index, and then the digital characteristic values of the risk probability cloud and the consequence cloud are calculated and input into the forward cloud generator algorithm. MATLAB was used to generate a two-dimensional comprehensive cloud map, which was visually compared with the standard cloud map, and the probability level and consequence level of each risk index were preliminarily obtained. Finally, the risk assessment matrix was used for comprehensive risk evaluation. (3) Results: Applying the method to the construction safety risk assessment of the Jiaoping Expressway, the overall construction safety risk level of the Yellow River bridge was determined as level 4, and the risk levels of the four primary indicators were: personnel risk (level 3), material and equipment risk (level 4), construction technology risk (level 5), and construction environment risk (level 4). (4) Conclusions: The results of the risk evaluation are consistent with the actual construction state of the bridge, which shows that game theory’s combination of empowerment with a two-dimensional cloud model is scientific and effective when applied to the construction safety risk evaluation of Yellow River bridges.

1. Introduction

In recent years, the rapid economic development of the Yellow River basin in China has led to the construction of a series of bridges across the Yellow River with high construction difficulty and large investment scale that have brought great convenience to regional socio-economic activities. However, the Yellow River basin is generally characterized by complex landforms, harsh geological conditions, and a changeable climate environment. Additionally, the Yellow River has a large sand content, a freezing period in winter, and a flood season in some river sections. The difficulty of constructing super-large bridges in the Yellow River basin is much higher than that in other areas, and problems related to difficult construction, long construction periods, difficult transportation of materials, and equipment are encountered. The construction risk is greatly increased, which can easily lead to construction safety accidents and can affect the sustainable development of bridge structures [1]. During bridge construction, risk usually includes two aspects: on the one hand, the possibility of risk accidents, that is, the risk probability; on the other hand, the severity of losses caused by risk accidents, also known as risk losses [2]. If risks are not effectively managed and controlled during the bridge construction process, they can easily lead to extremely serious losses, mainly in the form of structural damage to bridges, casualties, and schedule delays, which bring extremely negative impacts [3]. So far, there have been occasional safety accidents in the field of bridge construction, such as the sudden collapse of the beam body of the main beam of the Baiqiaokeng Bridge in Guangdong Province and the sudden collapse of the bridge-erecting machine when the prefabricated box girder was assembled as part of Jiashao Bridge in Zhejiang Province. The reasons are numerous, involving various aspects such as design, construction, environment, and management factors [4]. In view of the current research on the safety risk assessment of the construction of bridges across the Yellow River, most of the research focuses on qualitative analysis, which is easily limited to the study of the direct risk factors of safety accidents and lacks in-depth analysis of the nature and mechanism of risks. In addition, during construction, bridges across the Yellow River are affected by many factors such as social environment, natural environment, construction personnel, management, construction technology, materials, and equipment, and these uncertain factors greatly increase the difficulty of construction control. Therefore, it is necessary to establish a better scientific construction safety evaluation index system for bridges across the Yellow River, reasonably evaluate the construction safety risk level of bridges across the Yellow River, adopt an intuitive way to reflect the results of risk evaluations, and take corresponding control measures for high-risk-level indexes in time to ensure the absolute safety of bridge construction.
A. Nieto-Morote [5] proposed a hierarchical analysis (AHP)–fuzzy set theory risk evaluation method based on uncertainty factors in bridge construction and successfully applied the method to a bridge construction project. Hitoshi Furuta [6] developed an expert system for fuzzy bridge construction risk assessment using genetic algorithms combined with neural networks. Curra, J [7] proposed the HYRISK model for bridge erosion risk assessment, which was used to determine the probability of bridge erosion risk occurrence and the magnitude of the resulting loss. In their paper, data from the National Bridge Inventory (NBI) of the United States were used to successfully assess the erosion risk of a bridge in New York State. Jiang Zengguo [8] introduced the cloud model theory into the construction risk assessment of the Xuankengkou Bridge, taking into account the randomness and fuzziness of the risk assessment. In order to address the concern that a single risk evaluation method is too subjective or objective, Li-Chao Ren [9] proposed a new method of bridge construction risk evaluation by combining the assignment method with fuzzy mathematics. JM Kim [10] proposed an entropy method–topologic theory model to evaluate the probability level of bridge construction risks and formulated relevant preventive measures in advance according to the results of risk evaluation. Ng K H et al. [11] used two methods, Monte Carlo simulation and fuzzy mathematics–fault tree analysis, to accurately quantify the probability of failure during the construction of an arch bridge. S Ahn et al. [12] identified the major defects of in-service reinforced concrete girder bridges and established a safety risk probability model for major defects using the great likelihood estimation method and Kolmogorov’s test and introduced Reich’s human error analysis method into the field of in-service bridge safety risk assessment. Taejun Cho [13] used the theory of a network analysis method to establish a safety risk evaluation model for the construction of a large-span cable-stayed bridge and combined this with the TOPSIS evaluation method to evaluate the safety risk level of large-span cable-stayed bridge construction. Ashrafi B [14] proposed a risk assessment method for PC cable-stayed bridge construction based on event tree analysis, the F–A–M risk probability assessment method, and the improved LEC method, taking into account the characteristics of PC cable-stayed bridge construction. Agarwal A et al. [15] used the WBS–RBS method, constructed a hierarchical structure of five main risk dimensions, used the expert scoring method to obtain risk assessment data samples, and combined the hierarchical analysis method with gray system theory to evaluate the risk factors in bridge superstructure construction. The risk evaluation results are consistent with the bridge construction status. In the actual evaluation process, the existing bridge construction safety risk assessment method has the disadvantages of an incomplete index system, index weights that do not match with the actual project, relatively rough assessment results that cannot accurately reflect the actual project status, etc. Therefore, based on the summary of the existing assessment methods, this paper innovatively proposes a highway bridge construction safety risk assessment method based on the combined weighting method and two-dimensional cloud model and successfully applies it to construction risk assessment of the Jiaoping Expressway.
Based on the construction characteristics of the Jiaoping Expressway, this paper firstly identifies the main risk factors during the construction of the bridge across four dimensions, including literature research methods, accident causation theory, accident statistical analysis, and construction method analysis, and establishes a construction safety risk evaluation index system for the Jiaoping Expressway. This method fully considers the randomness and fuzziness of risk events, so that the calculated comprehensive weights can reflect both the subjective intention of decision makers and the objective attributes of data. Then, the expert scoring method is used to determine the risk probability and consequence scores, and the numerical characteristic values of the risk probability cloud and the consequence cloud are calculated. MATLAB was used to generate a two-dimensional integrated cloud map with a cloud generator algorithm, and the probability and consequence levels of each risk index were initially obtained by intuitive comparison with the standard cloud map. Then, the tightness N between the integrated cloud and the standard cloud was calculated, and comprehensive risk assessment was carried out by using the risk assessment matrix. The overall construction safety risk level of the Jiaoping Expressway is level 4. The risk levels of the four first-level indicators are level 3 for personnel risk, level 4 for material and equipment risk, level 5 for construction technology risk, and level 4 for construction environment risk.
The research flow of this paper is shown in Figure 1.

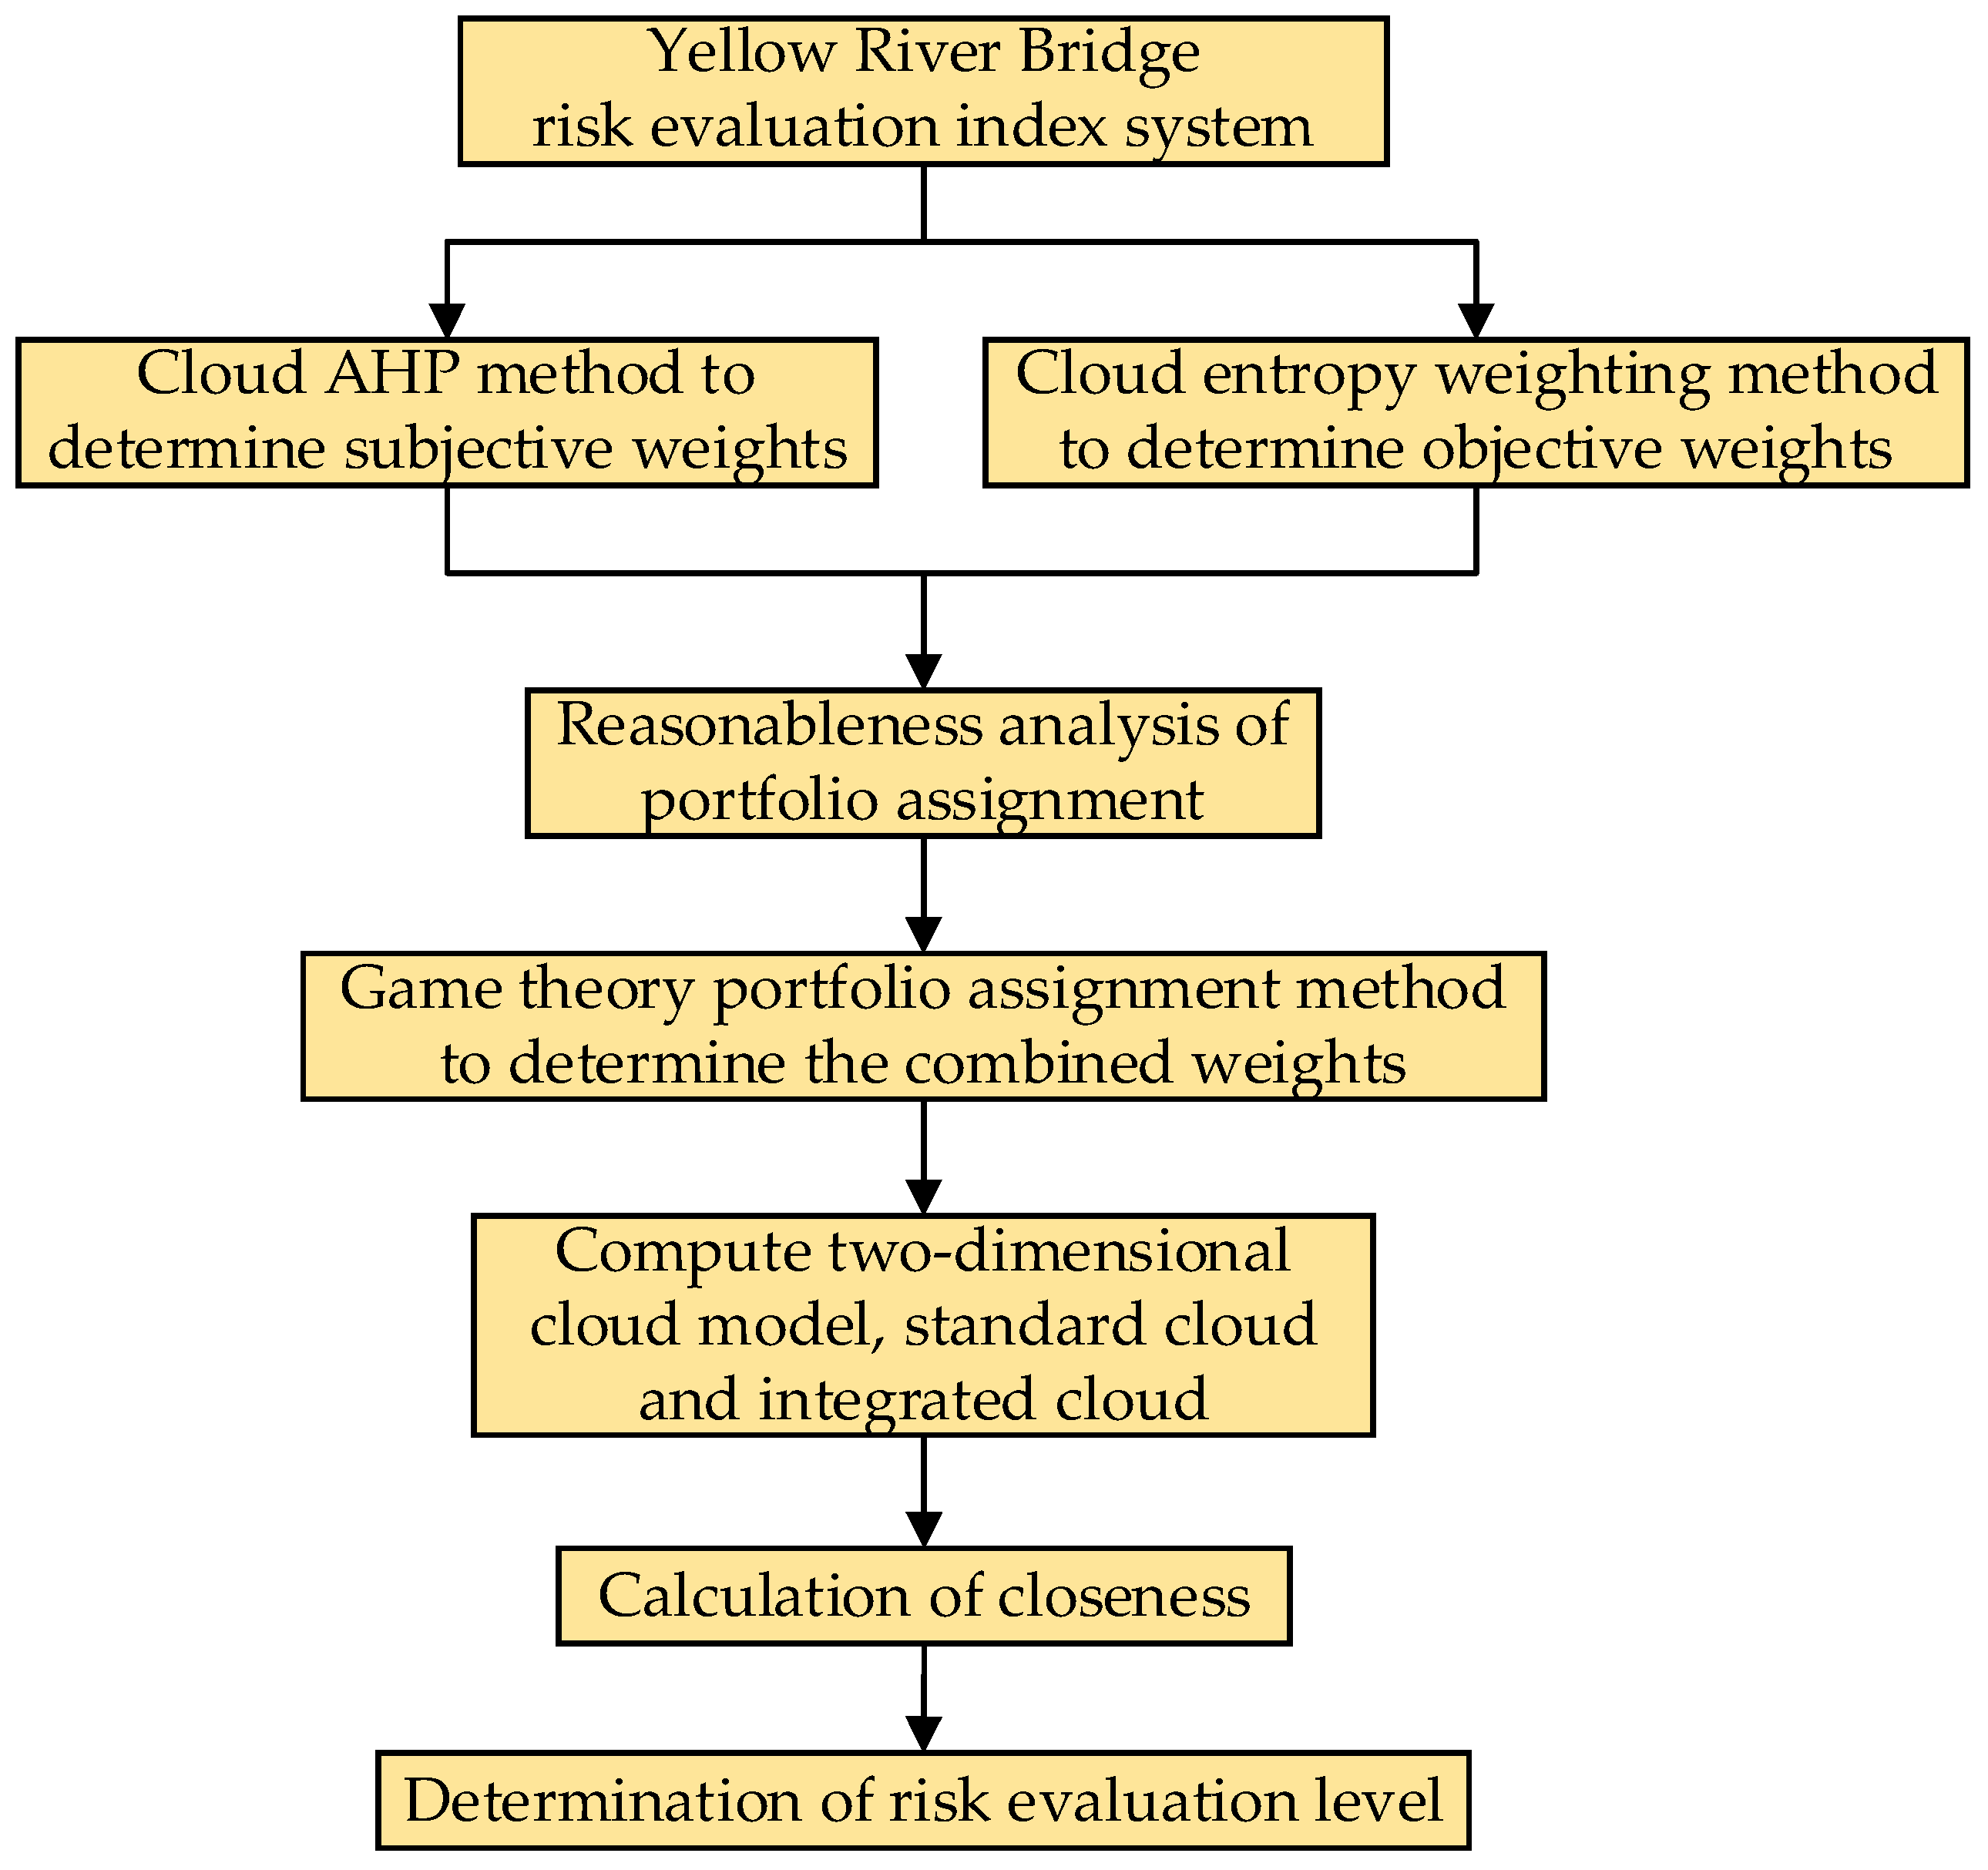
2. Evaluation Method

2.1. Cloud Model Theory

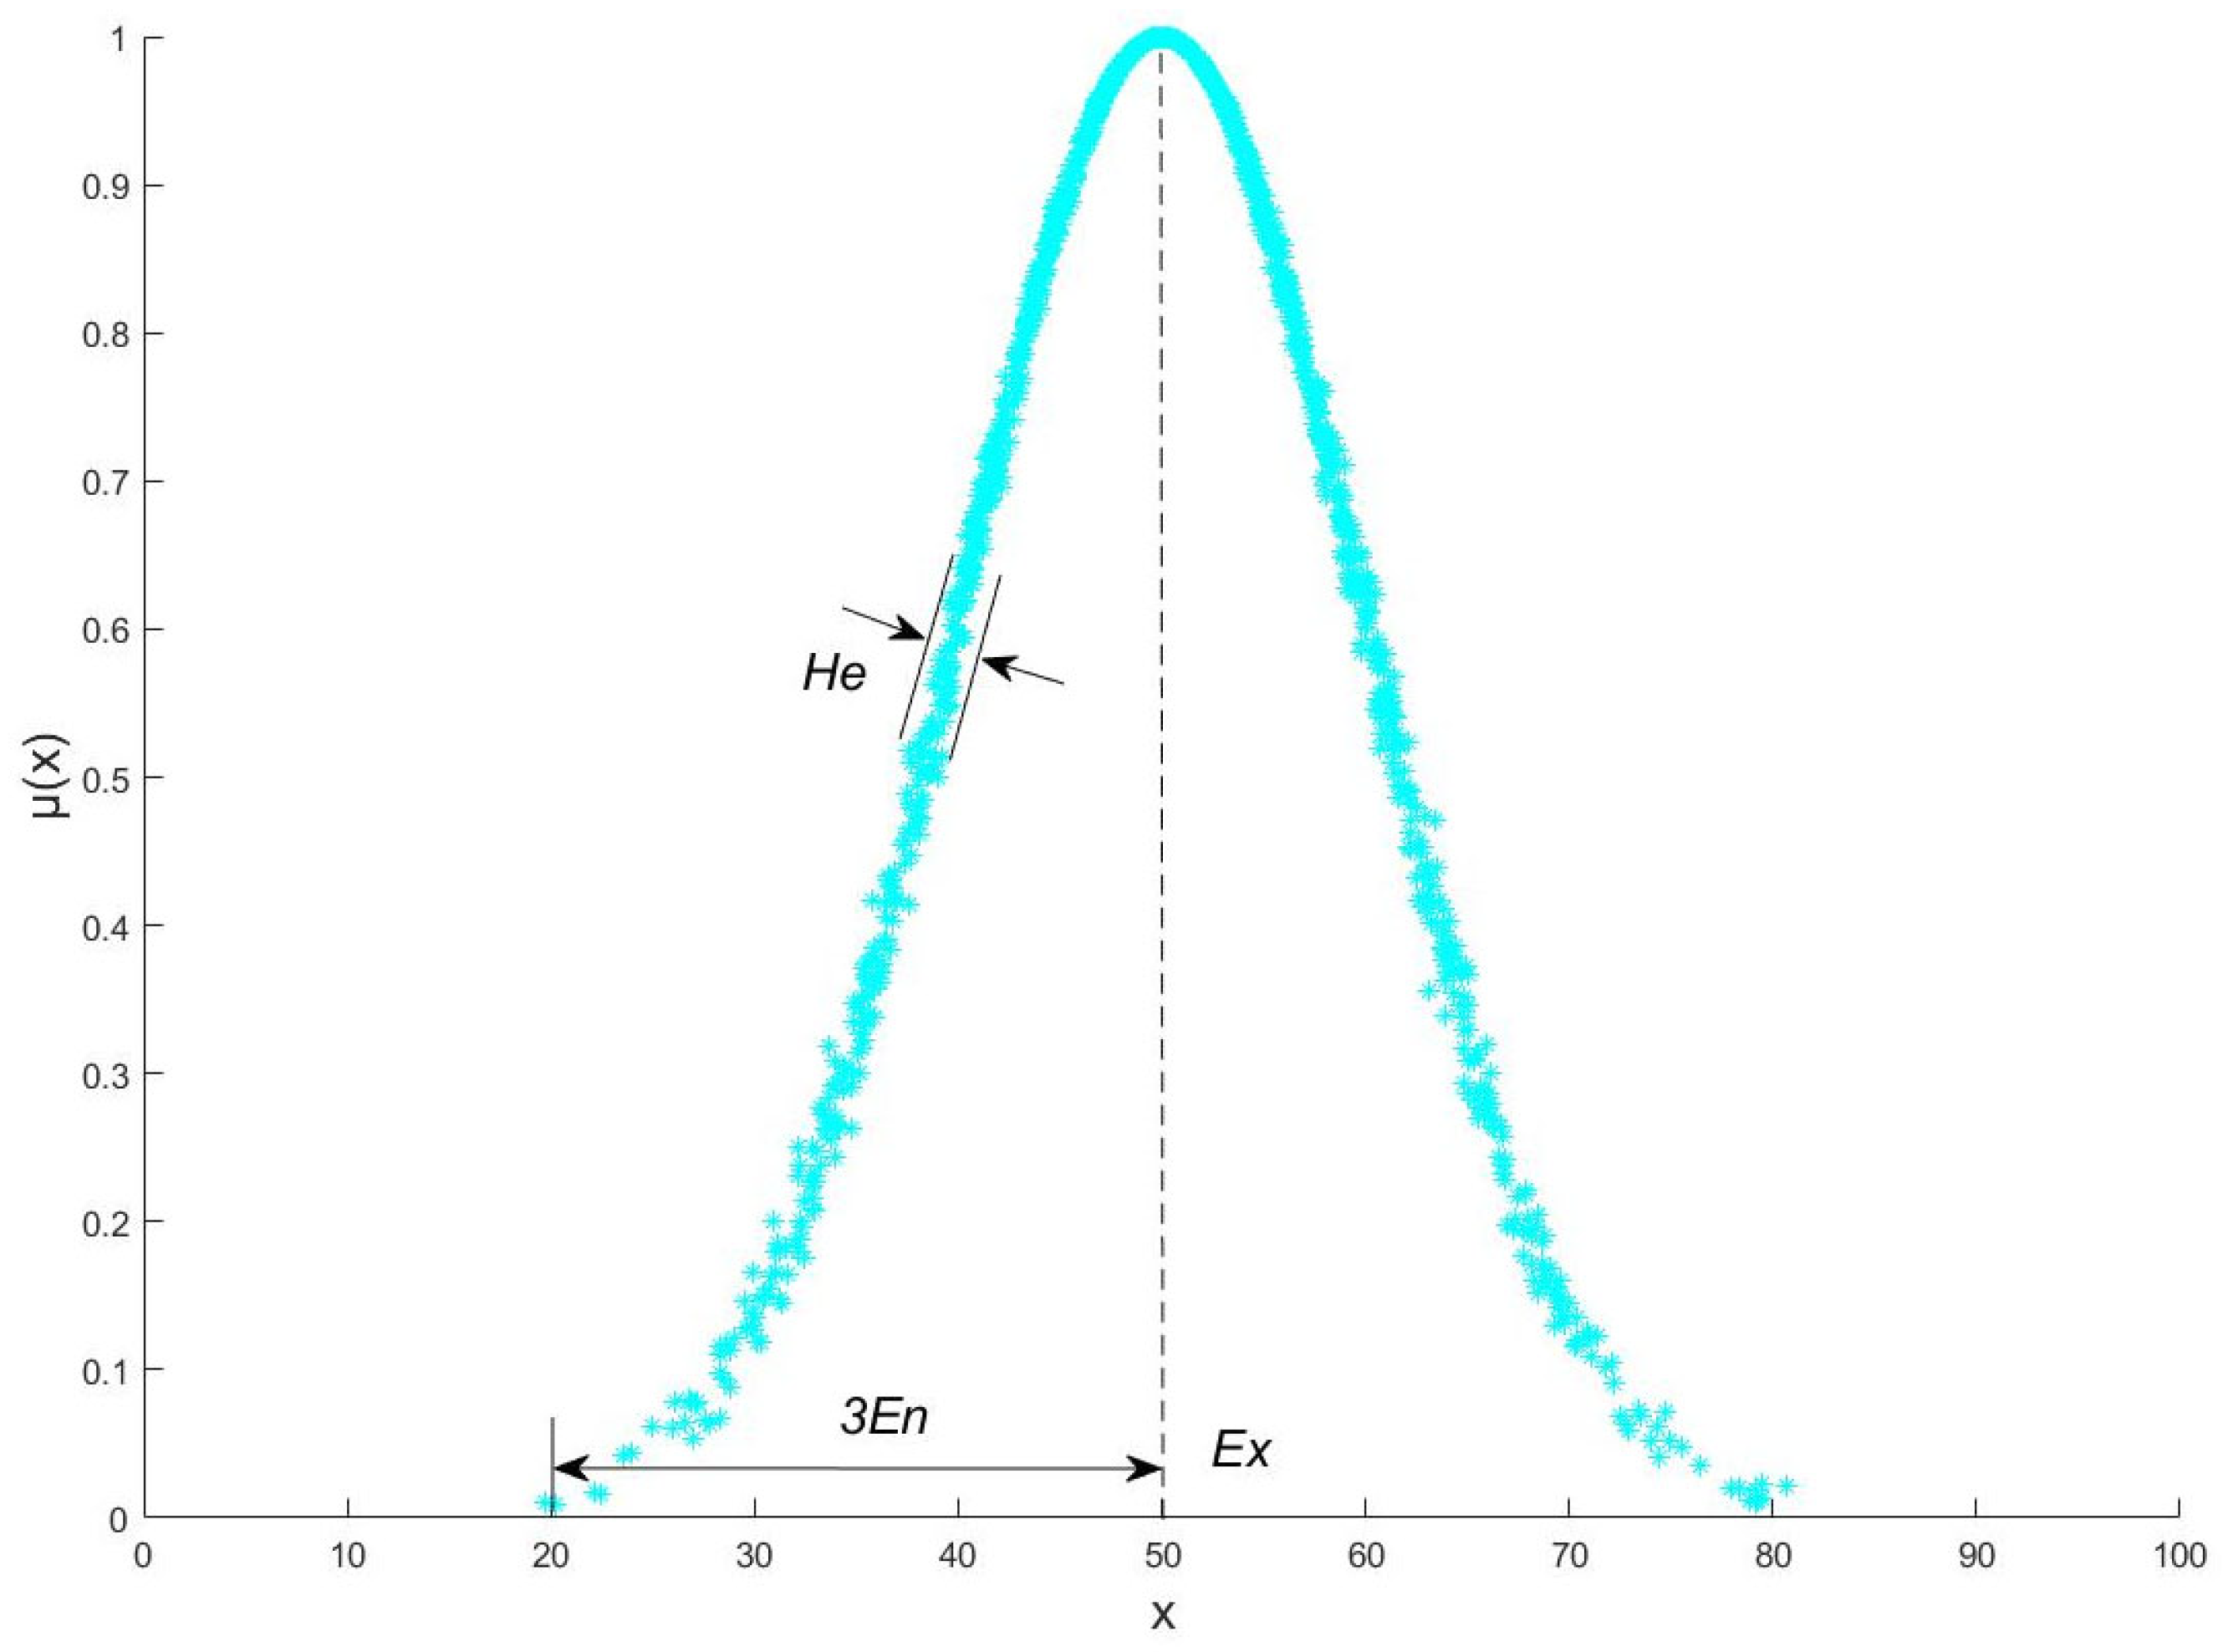
2.1.1. Definition of Cloud Model

Based on the integrated consideration of probability theory and fuzzy mathematical theory, Li Deyi proposed the cloud model theory in the 1990s [16], a model used to describe the randomness and fuzziness in the objective world and their interrelationships through uncertainty transformations between qualitative concepts and quantitative values, which avoids the limitations caused by the two theories when used separately and has now been widely used in risk evaluation, river health evaluation, reliability analysis, and other fields of research.
Definition of a normal cloud: let U be a theoretical domain, C be a qualitative concept on U with quantitative values xU, and x be a random realization of C if it satisfies: x~N(Ex, En2), where En2~N(En, He2), and x satisfies a certain law for the determinacy μ ( x ) of C [17]:
μ ( x ) = e [ ( x E x ) 2 2 ( E n ) 2 ]
where Ex is the expected value, Ex is the entropy value, and He is the super-entropy value.

2.1.2. Numerical Characteristics of Cloud Model

The normal cloud model is the main type of cloud model and uses a set of independent parameters (Ex, En, He) to express the uncertainty of a qualitative concept. Ex, En, and He are the three digital eigenvalues of the cloud model and are the basis for the representation of qualitative concepts by the cloud model and are also the carrier of qualitative and quantitative mapping between concepts [18]. The feature diagram of the cloud model is shown in Figure 2.
(1) Expect (Ex) is the point in the discourse space U that best represents this qualitative concept. At the same time, Ex is the most typical sample point for quantization of qualitative concepts and is also the central value of information of the discourse domain space, and its corresponding membership degree µ(x) is the largest, with a value of 1.
(2) Entropy (En) is used to describe the vagueness and randomness of a qualitative concept, i.e., the range of values that a qualitative concept can be accepted in the domain of the argument. The larger the entropy En, the larger the range of acceptable values of a qualitative concept in the domain of the argument, the greater the randomness and vagueness, and the more macroscopic the qualitative concept.
(3) Super-entropy (He) is the entropy of entropy, describes the thickness of the cloud graph, is a measure of entropy uncertainty, represents the randomness of the sample appearance of the qualitative concept value C, and is used to reveal the association between conceptual ambiguity and randomness.

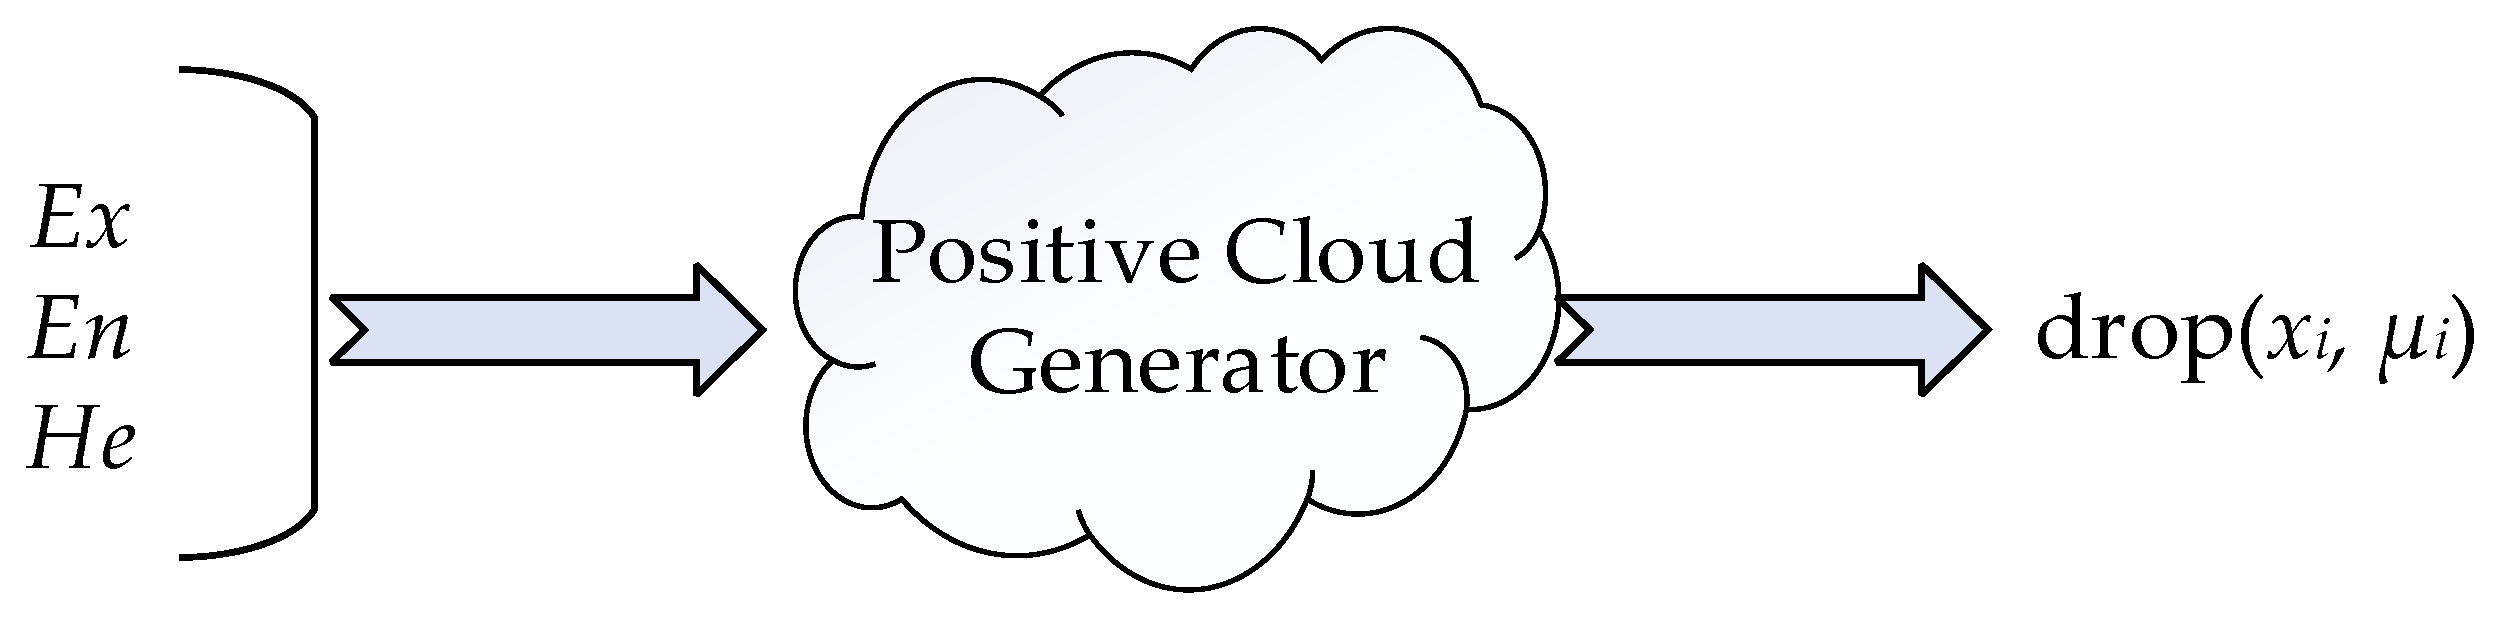
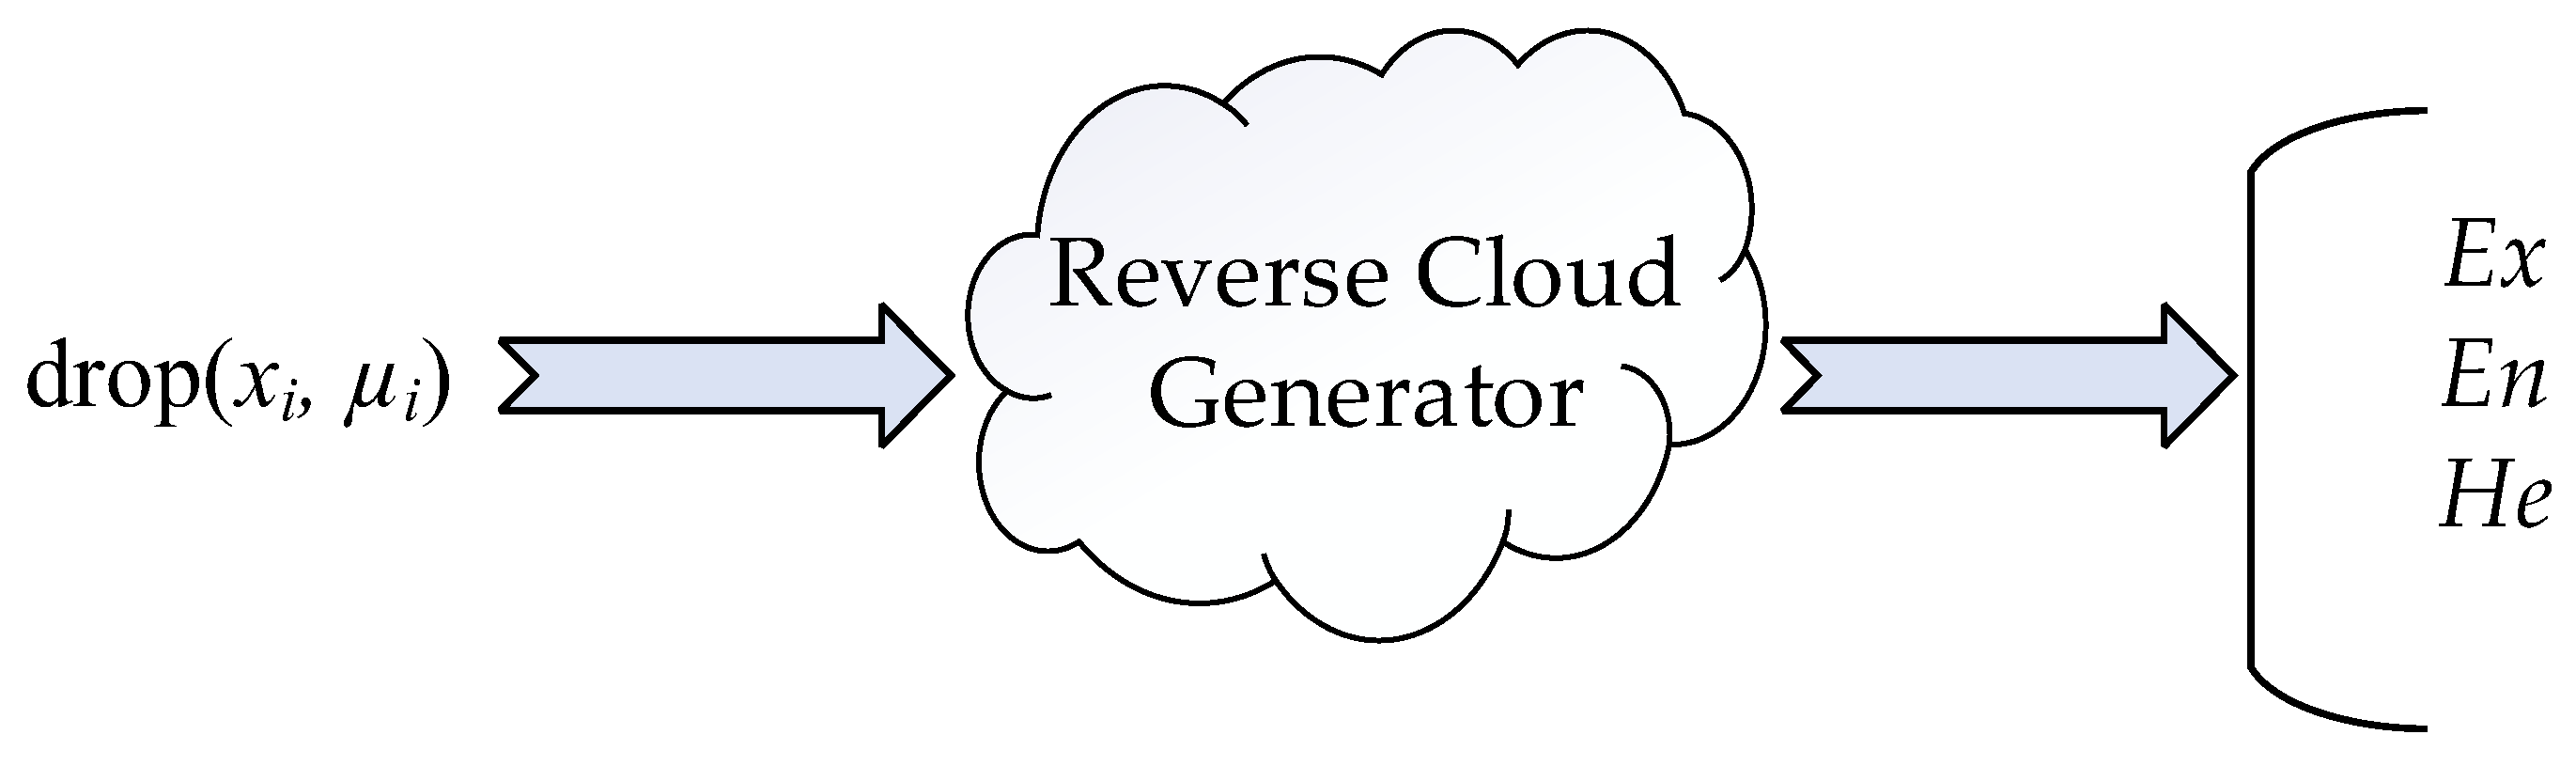
2.1.3. Cloud Model Generator

The cloud generator is a tool used to realize the conversion between qualitative concepts and quantitative values, mainly including the forward cloud generator and the reverse cloud generator [19].
(1)
Forward cloud generator
The forward cloud generator is used to convert three cloud digital eigenvalues (Ex, En, He) into several cloud drops (xi, µi) of the normal cloud model, that is, to quantitatively express a qualitative concept through the uncertainty transformation model. A schematic diagram of the forward cloud generator’s operation is shown in Figure 3.
(2)
Reverse cloud generator
In contrast to the forward cloud generator, the reverse cloud generator involves determining the three parameters (Ex, En, He) of the cloud model using the known cloud droplet distribution (xi, µi), which constitutes the process of achieving a mapping of concepts from quantitative to qualitative, i.e., effectively converting an exact value to an appropriate qualitative conceptual value, as shown in Figure 4.

2.2. Subjective Empowerment of Cloudification AHP Method

The analytic hierarchy process (AHP) is a hierarchical weight decision analysis method proposed by Syatt in the 1970s [20]. When solving multi-criterion decision problem, its judgment matrix adopts the 1–9 scale method to represent the importance of elements, so it cannot describe the fuzziness and randomness of importance judgment completely objectively and accurately. Therefore, this paper proposes an improved analytic hierarchy process based on a cloud model scaling judgment matrix. In the process of constructing the judgment matrix, the randomness and fuzziness of the relative importance comparison scale between the two indicators are fully considered, and the cloud model’s aggregation algorithm is used to aggregate the decision results of multiple experts, making the weight calculation results more objective and accurate. The weight calculation steps of the improved cloud model AHP method are as follows [21]
(1)
Establishment of cloud model scale
In this paper, the cloud model is introduced into the hierarchical analysis method, and the 1–9 scale shown in Table 1 is transformed into a cloud model scale, and then the judgment matrix for two-by-two importance comparisons of group experts is constructed based on the cloud model scale and, finally, the subjective weights of each index are calculated. The cloud model scale is used to construct the judgment matrix, which fully expresses the randomness and fuzziness of the qualitative language and has strong objective accuracy.
According to the above-mentioned 1–9 scaling method, take the domain of discourse [1,9] to establish 9 cloud models A i ( E x i , E n i , H e i ) , i = 1 , 2 , , 9 and E x i , E n i , H e i which are the expected value, entropy value, and super-entropy value of the cloud model, respectively, where E x 1 , E x 2 , E x 3 , E x 4 , E x 5 , E x 6 , E x 7 , E x 8 , E x 9 are equal to 1, 2, 3, 4, 5, 6, 8, and 9, respectively. Then, use the golden section method to calculate the entropy and super-entropy in the nine cloud models. The basic principle is to set the proportional relationship between the two cloud model scales with the golden section ratios of 0.618 and 0.382. The calculation of each parameter is shown in Formula (2).
E n 1 = E n 3 = E n 5 = E n 7 = E n 9 = 0.382 α ( β max β min ) / 6 = 0.437 E n 2 = E n 1 / 0.618 = E n 4 = E n 6 = E n 8 = 0.707 H e 1 = H e 3 = H e 5 = H e 7 = H e 9 = 0.382 α ( β max β min ) / 36 = 0.073 H e 2 = H e 1 / 0.618 = H e 4 = H e 6 = H e 8 = 0.118
In the formula, β max = 9, β min = 1.
According to Formula (2), we can obtain 9 pairwise comparative-scale cloud models, which are A 1 ( 1 , 0.437 , 0.073 ) , A 2 ( 2 , 0.707 , 0.118 ) , A 3 ( 3 , 0.437 , 0.073 ) , A 4 ( 4 , 0.707 , 0.118 ) , A 5 ( 5 , 0.437 , 0.073 ) , A 6 ( 6 , 0.707 , 0.118 ) , A 7 ( 7 , 0.437 , 0.073 ) , A 8 ( 8 , 0.707 , 0.118 ) , and A 9 ( 9 , 0.437 , 0.073 ) .
(2)
Determination of relative importance of indicators based on group decision making
After the cloud model scale is established, group experts use the language described by the cloud model to judge the relative importance of the indicators and use the method of generating floating clouds to gather the judgment results. The preferred method of generating floating clouds is as follows:
Assuming that there are two adjacent base clouds in the domain of discourse U, namely A 1 ( E x 1 , E n 1 , H e 1 ) and A 2 ( E x 2 , E n 2 , H e 2 ) , a floating cloud can be generated between the two base clouds that expresses the intermediate blank value of the qualitative concept expressed by the two base clouds. Assuming that the generated floating cloud is A ( E x , E n , H e ) , the relevant parameters of A can be obtained by Formula (3) [22].
E x = λ 1 E x 1 + λ 2 E x 2 E n = E n 1 ( E x 2 E x ) + E n 2 ( E x E x 1 ) E x 2 E x 1 H e = H e 1 ( E x 2 E x ) + H e 2 ( E x E x 1 ) E x 2 E x 1
In the formula, λ 1 , λ 2 are adjustable coefficients, λ 1 = l 1 l 1 + l 2 , λ 2 = l 2 l 1 + l 2 , and l i is the number of assembly iterations of the i-th cloud model. When the group experts agree that there is no need to intervene in the assembly activities, then λ 1 = λ 2 = 0.5 .
(3)
Analytic Hierarchy Process Based on Cloud Model Scale Judgment Matrix
Firstly, according to the group decision-making method above, the judgment matrix of the relative importance comparison of the lower-level indicators relative to an upper-level indicator is obtained as follows [23]:
( a i j ) n × n = A 11 A 12 A 1 n A 21 A 22 A 2 n A n 1 A n 2 A n n
In the formula, i = 1 , 2 , n ,   j = 1 , 2 , n , and n is the number of evaluation indicators, the expected value of the cloud model on the diagonal is 1, and the entropy value and super-entropy values are both 0, that is, A n n E x n n , E n n n , H e n n = A 1 , 0 , 0 . According to the reciprocal operation of the cloud model, the following can be obtained:
a j i = A E x j i , E n j i , H e j i = 1 a i j = 1 A E x i j , E n i j , H e i j = A 1 E x i j , E n i j E x i j 2 , H e i j E x i j 2
Then, the judgment matrix based on the cloud model scale constructed by multiple experts is assembled, and the aggregation formula is as follows:
E x i j = 1 n ( i = 1 n E x i j )
E n i j = 1 n ( i = 1 n E n i j ) 1 2
H e i j = 1 n ( i = 1 n H e i j ) 1 2
In the formula, E x i j , E n i j , and H e i j are the eigenvalues of the judgment matrix cloud model after assembly, and E x i j , E n i j , and H e i j are the eigenvalues of the cloud model before the evaluation results of multiple experts are assembled.
Then, for the cloud model scale judgment matrix assembled above, introduce the multiplication operation in cloud computing and combine the square root method to calculate the importance vector or relative weight α E x i 0 , E n i 0 , H e i 0 of each element’s expectation, ambiguity, and randomness. The calculation of each parameter is shown in Formulas (9)–(11).
E x i 0 = E x i E x i = ( j = 1 n E x i j ) 1 n i = 1 n ( j = 1 n E x i j ) 1 n  
E n i 0 = E n i E n i = ( j = 1 n E x i j ) j = 1 n ( E n i j E x i j ) 2 1 n i = 1 n ( j = 1 n E x i j ) j = 1 n ( E n i j E x i j ) 2 1 n
H e i 0 = H e i H e i = ( j = 1 n E x i j ) j = 1 n ( H e i j E x i j ) 2 1 n i = 1 n ( j = 1 n E x i j ) j = 1 n ( H e i j E x i j ) 2 1 n
(4)
Expectation consistency test
In order to verify the rationality of the above weight calculation, an expectation consistency test is required, and the specific steps are as follows [24]:
Step 1: Calculate the consistency index C.I. See Formulas (12)–(13).
C . I . = λ max n n 1
λ max = 1 n i = 1 n i = 1 n E x i j α i α i
In the formula, α i is the relative weight;
Step 2: Calculate the consistency ratio C.R. See Formula (14).
C . R . = C . I . R . I .
In the formula, R.I. is the average random consistency index, which can be determined in Table 2.
According to the consistency test standard, when the consistency ratio C.R. < 0.10, it indicates that the constructed judgment matrix satisfies the consistency test; otherwise, a new judgment matrix needs to be reconstructed until it meets the consistency test.

2.3. Objective Empowerment of Cloud Entropy Weight Method

The basic idea of the entropy weighting method is to determine the indicator weights based on the magnitude of the variability of the risk indicators, i.e., the more frequently a value appears, the greater its contribution to the qualitative concept [25]. In the actual evaluation process, expert opinions fluctuate around a certain value, i.e., a random number with a stable tendency can be used to replace the value, which is highly similar to the central idea of the cloud model and entropy weight method. Since the risk evaluation index system of the Yellow River bridge studied in this paper has many factors and is relatively independent, it is inconvenient to cross-compare them, and the traditional weight calculation method only considers the expectation Ex in the cloud model and the utilization of the parameter En; He is not sufficient, while the cloud entropy En reflects the consensus of experts on the factor, which is significant for the calculation of index weights [26]. Therefore, in this paper, the cloud model (combined with the entropy weight method for the evaluation of the variability of indicators) is used to transform the subjective judgment of experts into parameters representing uncertainty through the cloud model and is then combined with the cloud entropy weight method’s weight improvement model to calculate the objective weight value of each indicator, which reflects the importance of each indicator as scientifically as possible [27].
There are m experts and n risk evaluation indicators and x i j is the score of the i-th expert on evaluation index j; then, according to the calculation formula of the reverse cloud generator, the cloud model’s parameter value of the j-th evaluation index is obtained as in Formulas (15)–(17).
E x j = x j ¯ = 1 m i = 1 m x i j
E n j = π 2 × 1 m i = 1 m x i j E x j
H e j = 1 m 1 i = 1 m ( x i j E x j ) 2 E n j 2
In the formula, i = 1 , 2 , , m   ; j = 1 , 2 , , n , and E x j , E n j , and H e j are the expectation, entropy, and super-entropy of the j-th evaluation index, respectively.
Then, use the traditional weight calculation method to determine the weight of the j-th evaluation index; see Formula (18).
θ j = E x j j = 1 n E x j  
When m experts have the same expectation E x j for the importance of an indicator, the weights obtained by using the weight calculation method of Formula (18) are consistent. In fact, the changes in the scores among experts are not the same, that is, there is a difference between entropy E n j and super-entropy H e j , so this method cannot guarantee the comprehensiveness and accuracy of weight calculation. Therefore, this paper proposes an improved cloud model entropy weight method to replace the above traditional weight calculation method; see Formula (19).
β j = E x j ln ( 1 + E n j ) + 1 · 1 j = 1 n E x j ln ( 1 + E n j ) + 1   ( E n j 0 ) E x j j = 1 n E x j   ( E n j = 0 )
In the formula, β j is the objective weight value of the j-th index determined by the improved cloud model entropy weight method.

2.4. Game Theory Combination Weighting

In this paper, the game theory idea is applied to the combination assignment, and the weight with the smallest deviation from each basic weight is found among the index weights calculated by multiple methods to make the combined weight obtained after the combination assignment more suitable to the actual situation, and the specific calculation steps are as follows [28]:
(1) Use t t 2 methods to calculate the weight values of each risk indicator and construct the basic weight vector ω l = ω l 1 , ω l 2 , , ω l n l = 1 , 2 , , t ; then, the comprehensive weight vector of the linear combination of t weight calculation methods is:
ω = l = 1 t φ l ω l t   φ l > 0 , l = 1 t φ l = 1
In the formula, φ l is the combined weight coefficient.
(2) Minimize the deviations of ω and ω l , as shown in Formula (21), and see Formula (22) for the conditions for converting it into the optimal first-order derivative.
min l = 1 t φ l ω l T ω l 2
l = 1 t φ l ω l ω l T = ω l ω l T
Transform Formula (22) into a representation of a linear formula system:
ω 1 ω 1 T ω 1 ω 2 T ω 1 ω t T ω 2 ω 1 T ω 2 ω 2 T ω 2 ω t T ω t ω 1 T ω t ω 2 T ω t ω t T φ 1 φ 2 φ t = ω 1 ω 1 T ω 2 ω 2 T ω t ω t T
(3) Normalize the combination weight coefficient as shown in Formula (24).
φ l = φ l l = 1 t φ l   l = 1 , 2 , , t
(4) Calculate the combination weight value.
ω = l = 1 t φ l ω l T

2.5. Comprehensive Evaluation of Two-Dimensional Cloud Model

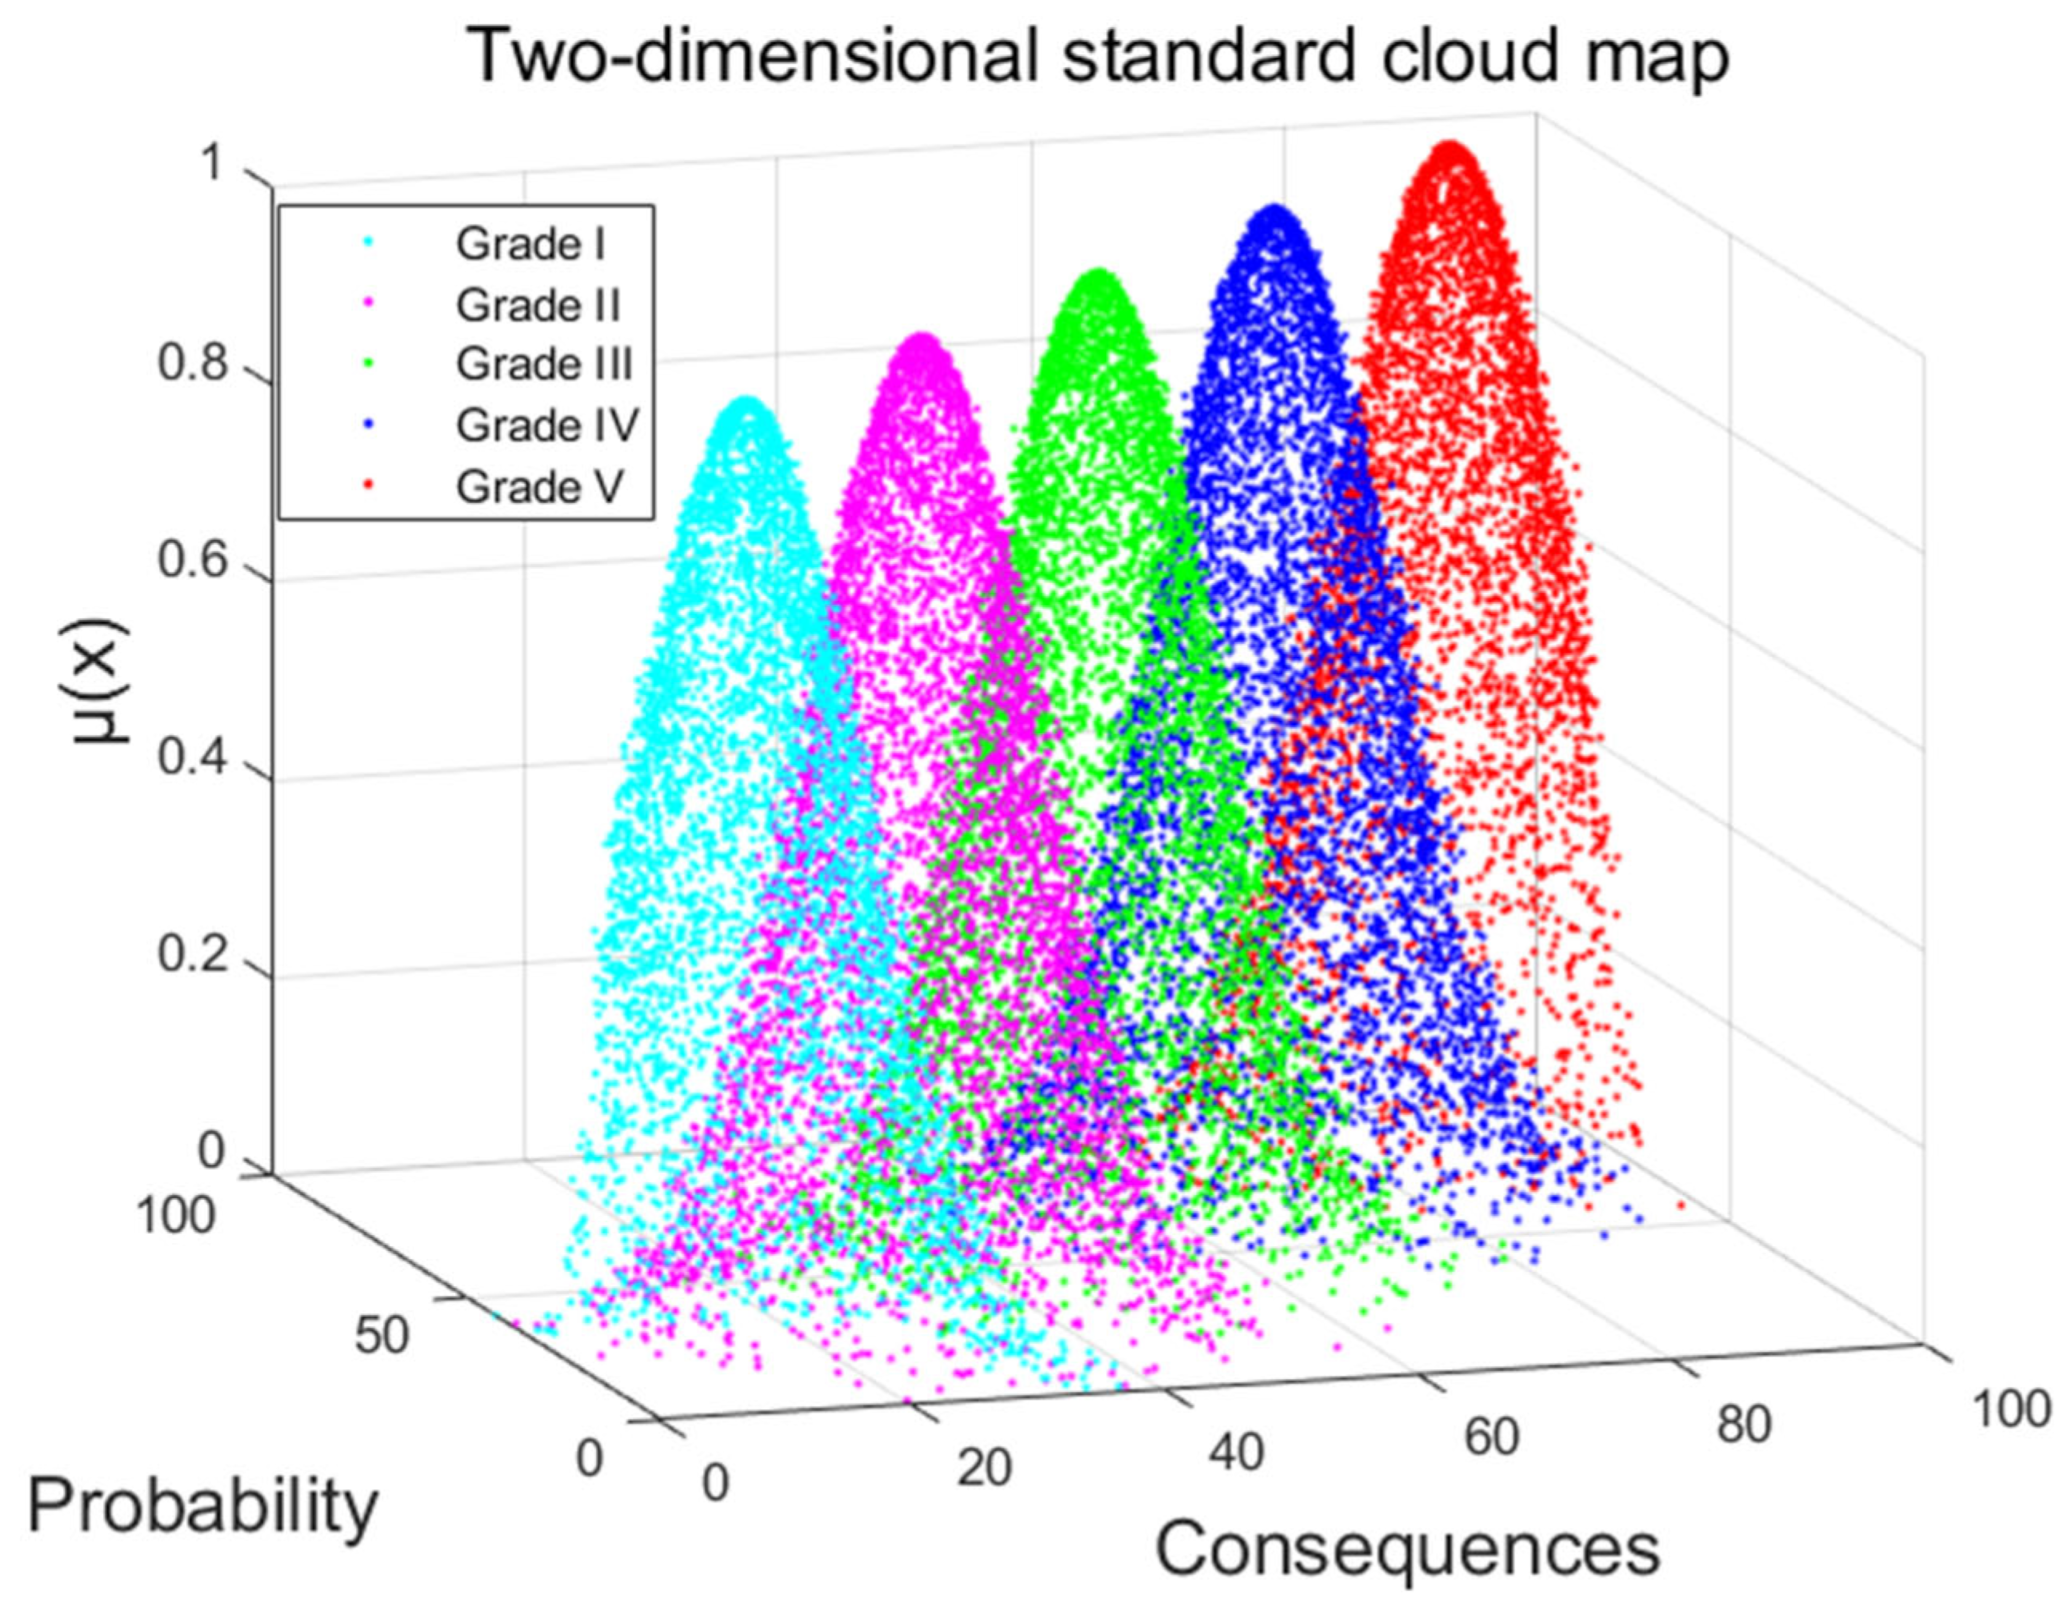
2.5.1. Definition of Two-Dimensional Cloud Model

The two-dimensional cloud model is synthesized from two one-dimensional cloud models to solve the problem of randomness and fuzziness under the combined effect of risk occurrence probability and consequence severity [29]. Suppose F is a two-dimensional random function that obeys a normal distribution, E x , E y are the expected values, E n x , E n y are the entropy values, and H e x , H e y are the super-entropy values, then the point that satisfies Formula (26) becomes a cloud droplet, and a large number of cloud droplets d r o p x i , y i , μ i condense into a two-dimensional normal cloud [30].
x i , y i = F E x , E y , E n x , E n y P x i , P y i = F E n x , E n y , H e x , H e y μ i = e 1 2 x i E x 2 P x i 2 + y i E y 2 P y i 2
In the formula, x i , y i are the cloud droplet coordinates, and μ i is the degree of membership.

2.5.2. Construction of Two-Dimensional Cloud Model

(1)
Risk Cloud Cn
The risk cloud is a cloud model generated by evaluating the original data through a reverse cloud generator, and it is a comprehensive representation of the probability of risk occurrence and the severity of consequences. This paper invites experts to score and assign risk indicators based on the two criteria of risk occurrence probability and consequence severity. The score range is [0, 100] and the score accuracy is 1, so as to obtain the risk probability cloud and risk consequence cloud. The numerical eigenvalues of the risk probability cloud and the risk consequence cloud can be obtained through Formula (27), the reverse cloud generator’s calculation formula.
E x n = 1 n i = 1 n x i E n n = 1 n π 2 i = 1 n x i E x n H e n = S 2 E n n 2 S 2 = 1 n 1 i = 1 n ( x i E x n ) 2
In the formula, x i represents the scoring data of the i-th expert; S 2 is the variance of the data; E x n is the expected value of the risk cloud; E n n is the entropy value of the risk cloud; and H e n is the super-entropy value of the risk cloud.
(2)
Standard Cloud Cm
The standard cloud is a cloud model generated by evaluation standards. Divide the risk probability level and consequence level into 5 levels and quantify them; the quantified level range is λ min i , λ max i , i = 1 , 2 , 3 , 4 , 5 . λ min i and λ max i are the quantified upper and lower limits of the i-th risk level, respectively. Then use the quantified minimum value λ min i and maximum value λ max i of the grade interval to establish five one-dimensional standard clouds based on probability and consequence criteria and combine the two to generate five two-dimensional standard clouds; the digital characteristic values of standard clouds in each grade interval are determined by Formula (28). The risk grade scores and digital characteristics of standard clouds are shown in Table 3 [31].
E x m = λ min i + λ max i / 2 E n m = λ max i λ min i / 2.355 H e m = k E n m
In the formula, E x m ( E n m ) H e m are the expectation of the standard cloud, the entropy, and the super-entropy, k is a constant, and the value is adjusted by the degree of conceptual fuzziness, which is taken as 0.1 in this paper.
According to the standard cloud digital characteristics in Table 3, taking the probability of risk occurrence and the severity of risk consequences as benchmarks, we used MATLAB programming to draw a two-dimensional standard cloud map, as shown in Figure 5.
(3)
Comprehensive cloud C
The comprehensive cloud C is obtained by combining the evaluation risk cloud Cn and the comprehensive weight ω of risk indicators [32] to obtain the digital eigenvalues of the risk probability cloud and the risk consequence cloud of each first-level index and further synthesize and calculate the digital eigenvalues of the comprehensive risk cloud. The calculation process is shown in Formula (29).
E x = i = 1 m ( E x i × ω i ) E n = i = 1 m ( E n i 2 × ω i ) H e = i = 1 m ( H e i × ω i )  
In the formula, E x , E n , and H e are the comprehensive cloud expectation value, entropy value, and super-entropy value, respectively, m is the number of evaluation indicators, ω i is the comprehensive weight value of the i-th evaluation index, and E x i , E n i , and H e i are the weight values of the i-th index’s risk cloud expectation, entropy, and super-entropy.

2.5.3. Determination of Risk Assessment Level

We input the calculated integrated cloud characteristic values into the forward cloud generator algorithm, used MATLAB to generate a two-dimensional integrated cloud image, and compared the positional relationship between the integrated cloud image and the standard cloud image to preliminarily determine the risk probability level and risk consequences of the studied Yellow River bridge.
Since there are certain similarities between the comprehensive cloud image and the standard cloud image, and because the two-dimensional cloud image has a three-dimensional view, it is easy to produce human visual errors, which will affect the accuracy of the evaluation results [33]. Therefore, this paper introduces the proximity degree N to calculate the proximity degree between the standard cloud image and the comprehensive cloud image, so as to accurately determine the risk level of bridge construction. The proximity degree is calculated in Formula (30).
N = 1 E x E x m 2 + E y E y m 2
In the formula, E x , E y are the expected value of the risk probability cloud and the risk consequence cloud, respectively, and E x m , E y m are the expected value of the standard probability cloud and the standard consequence cloud, respectively. The larger the closeness N is, the closer the evaluation level is to the standard risk level corresponding to the closeness.
By calculating the closeness N, the risk indicator probability level and consequence level are obtained, the two-dimensional evaluation is carried out according to the risk assessment matrix in Table 4, and the overall construction risk assessment level of the bridge and the evaluation levels of each primary and secondary risk indicator can be determined.

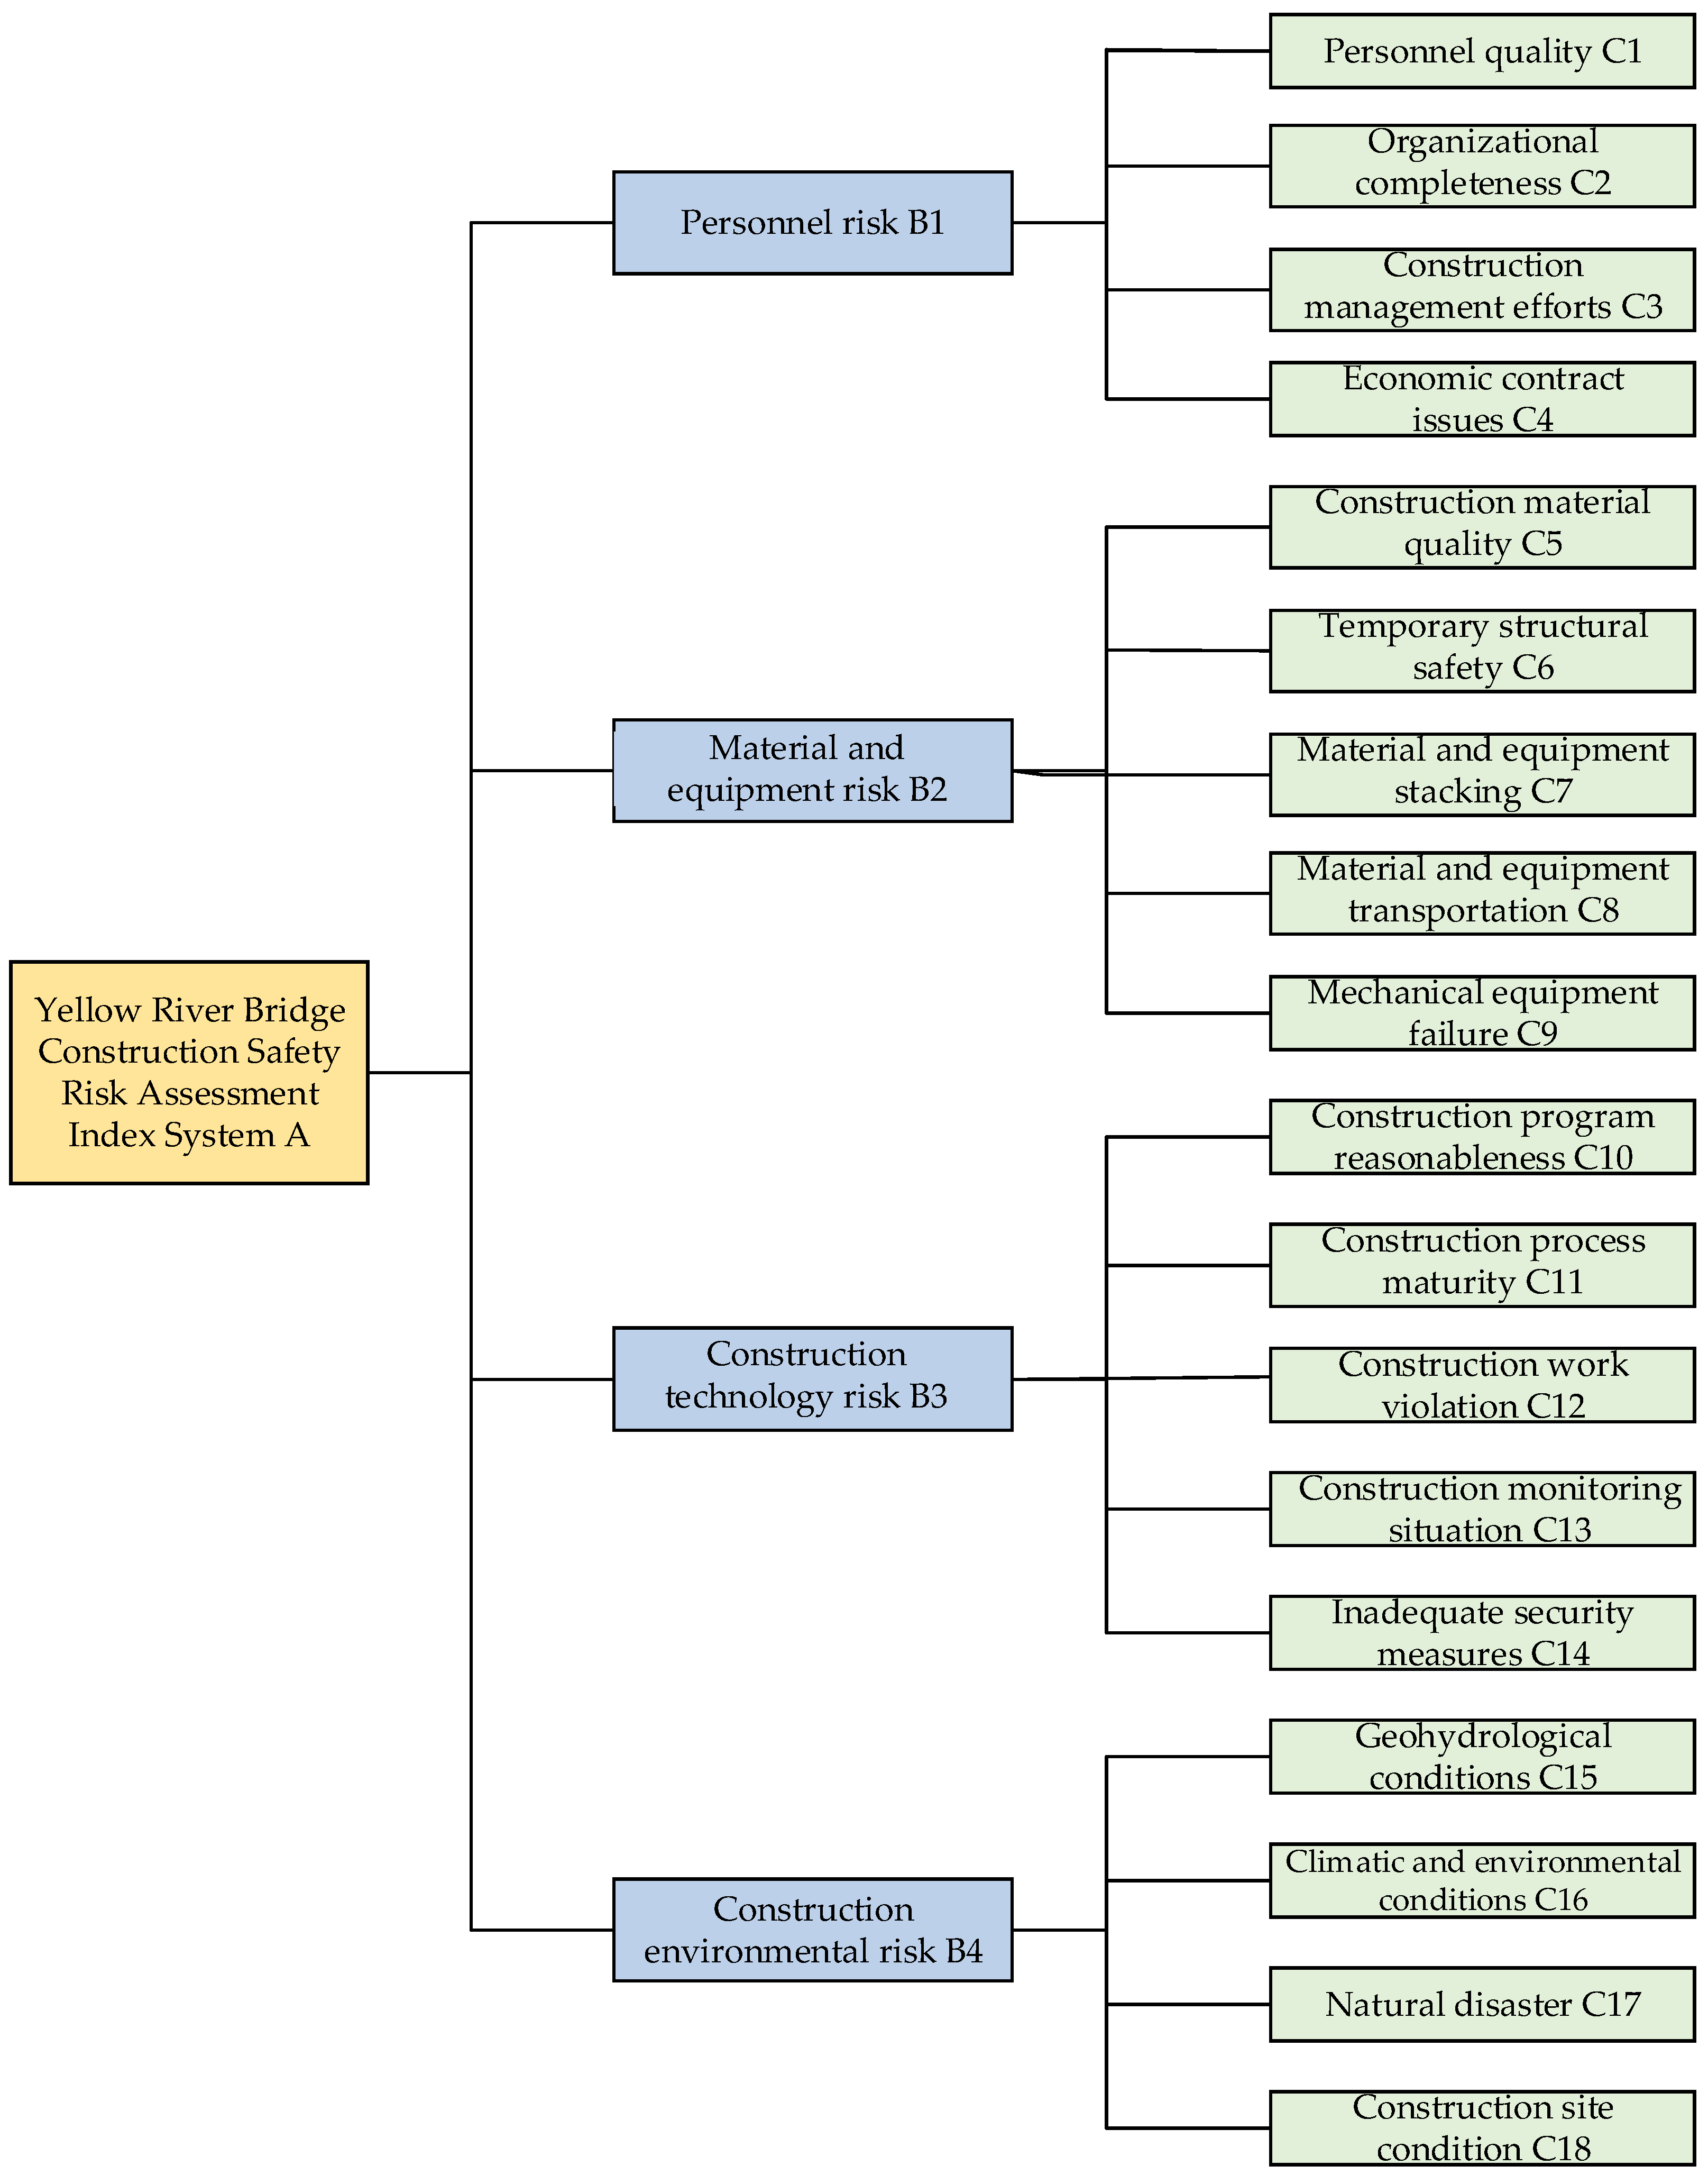
3. Selection of Evaluation Indicators

The construction safety risk assessment of the studied Yellow River bridge is an extremely complex issue. There are many factors affecting bridge construction safety, and the relationship between the factors interacting with each other is very complex. Therefore, the accurate and reasonable identification of risk factors in the bridge construction process and the systematic and scientific construction of a bridge construction safety risk evaluation index system directly affect the accuracy of the evaluation results [34].
This paper considers the identification of the main risk factors during bridge construction from four perspectives, including literature research methods, accident causation theory analysis, accident statistical analysis, and construction method analysis. Based on the literature research methods, this paper identifies the risk factors at the guideline level in the construction risk evaluation index system of the Yellow River bridge under study, which are personnel risk, material and equipment risk, construction technology risk, and construction environment risk. The risk sources are then identified quantitatively and qualitatively by combining accident causation theory, statistical analysis of bridge construction accidents, and construction method analysis, and 18 secondary risk indicators are identified in the guideline layer. In summary, based on the characteristics of the studied Yellow River bridge itself and environmental factors, a Yellow River bridge construction safety risk assessment index system was established, as shown in Figure 6.

4. Project Example Analysis

4.1. Overview of Jiaoping Expressway Yellow River Bridge Project

The starting point of the Jiaoping Expressway that spans across the Yellow River is located in Wen County, Jiaozuo City, and the end point is located in Xingyang City. The main bridge of the Jiaoping Expressway has a total length of 3650 m, with a left and right framing design, a bridge deck width of 2 × 16.55 m, and a span layout of 6 × (6 × 100 m) + 1 × 50 m, totaling seven sections. The main girder of the upper structure adopts steel–concrete composite box girder construction, the pier of the lower structure adopts vase pier construction, the abutment is a gravity abutment, a steel sheet pile cofferdam is used for construction, the foundation adopts bored pile foundation construction, and the main girder adopts jack-up construction. The maximum cantilever length is 100 m. The design speed adopts the technical standard of a 120 km/h, two-way six-lane expressway, and the standard roadbed width is 34.5 m.
The bridge site is located in a temperate monsoon climate with abundant sunshine, where it is cold in winter, hot in summer, warm in spring, and cool in autumn, with four distinct seasons. The annual average temperature is 14.3 °C and the annual average annual precipitation is 608.2 mm. The temporal and spatial distributions of precipitation are uneven, and it is rainy in summer. Summer months account for about 65% of the precipitation, and there is little rain and snow in winter. The lithology of the bridge site area is mainly composed of silty clay, silt, silty fine sand, fine sand, round gravel, pebbles, and cemented layers. Yellow River ice floods, earthquake liquefaction, bank slope collapse, and slope instability are prone to occur in the site area.

4.2. Cloudification AHP Method to Determine the Subjective Weight of Risk Indicators

According to the construction safety risk evaluation index system of the Yellow River bridge under study, the cloud model is used to improve the AHP method to carry out subjective weighting on each risk factor. In this paper, three experienced experts were invited to construct a comparison matrix of the relative importance of pairwise elements based on the improved cloud model scale, and the relative importance of the first-level and second-level indicators in the construction risk evaluation index system of the Yellow River bridge was analyzed. For comparison, the obtained comparison matrices are P1, P2, and P3. Due to space limitations, this article takes the first-level risk indicators and the second-level risk indicators under personnel risk B1 as examples. The results are summarized in Table 5 and Table 6.
We transformed the relative importance comparison matrix of the above risk indicators into a judgment matrix based on the cloud model scale and assembled the judgment matrix based on the cloud model scale constructed by three experts according to Formulas (6)–(8). The results are shown in Table 7 and Table 8.
For the judgment matrix based on the scale of the cloud model assembled above, the multiplication operation and square root method of the cloud model are introduced, and the subjective weights of each first-level and second-level risk indicator are calculated by using Formulas (9)–(11) and in order to check the rationality of the above weight calculation, we use Formulas (12)–(14) to carry out the expected consistency test; the calculation results are shown in Table 9 and Table 10.
The expected consistency test in the calculation of the safety risk weight of the above-mentioned Yellow River bridge meets the requirements, and the comprehensive weights of each primary and secondary risk index can be obtained, as shown in Table 11.

4.3. Cloud Entropy Weight Method to Determine the Objective Weight of Risk Indicators

In order to ensure the effectiveness of the cloud entropy weighting method’s weighting and cloud model generation, based on the principle of the importance of risk indicators, experts are invited to score risk indicators. The score range is [0, 100]; the greater the score, the greater the risk degree of the risk index. The scoring results are shown in Table 12.
According to Formula (18), the weight θ j determined by the traditional weight calculation method can be obtained, and then the risk weight β j determined by the improved cloud entropy weight method can be obtained by using Formula (19). The calculation results are shown in Table 13.
One can analyze Table 13 to determine the following:
(1) The score expectations in the table have a high degree of differentiation. Some indicators have an expected value close to 90, and some indicators have values lower than 50. The expected distribution is better, reflecting the scientific and accurate judgment of experts on the importance of each risk factor. The weight calculation provides a basis for data;
(2) The entropy value in the table represents the degree of dispersion of opinions. Some indicators have a large entropy value, which means that the opinions of experts are quite different, and some indicators have a small entropy value, which means that the experts’ opinions are relatively concentrated; the entropy value can well reflect the distribution of expert opinion;
(3) The weight value obtained by the traditional weight calculation method is generally in the interval 0.04 , 0.06 , and the weight is relatively average, which is not conducive to the distinction of the importance of risk factors and the determination of risk evaluation levels. The cloud entropy weight method can overcome this deficiency well, which makes the weight distribution range larger.
To sum up, the weight calculation model of the cloud entropy weight method fully guarantees the objective accuracy of risk weight calculation, reflects the importance of each index as scientifically as possible, and is more in line with people’s cognition.

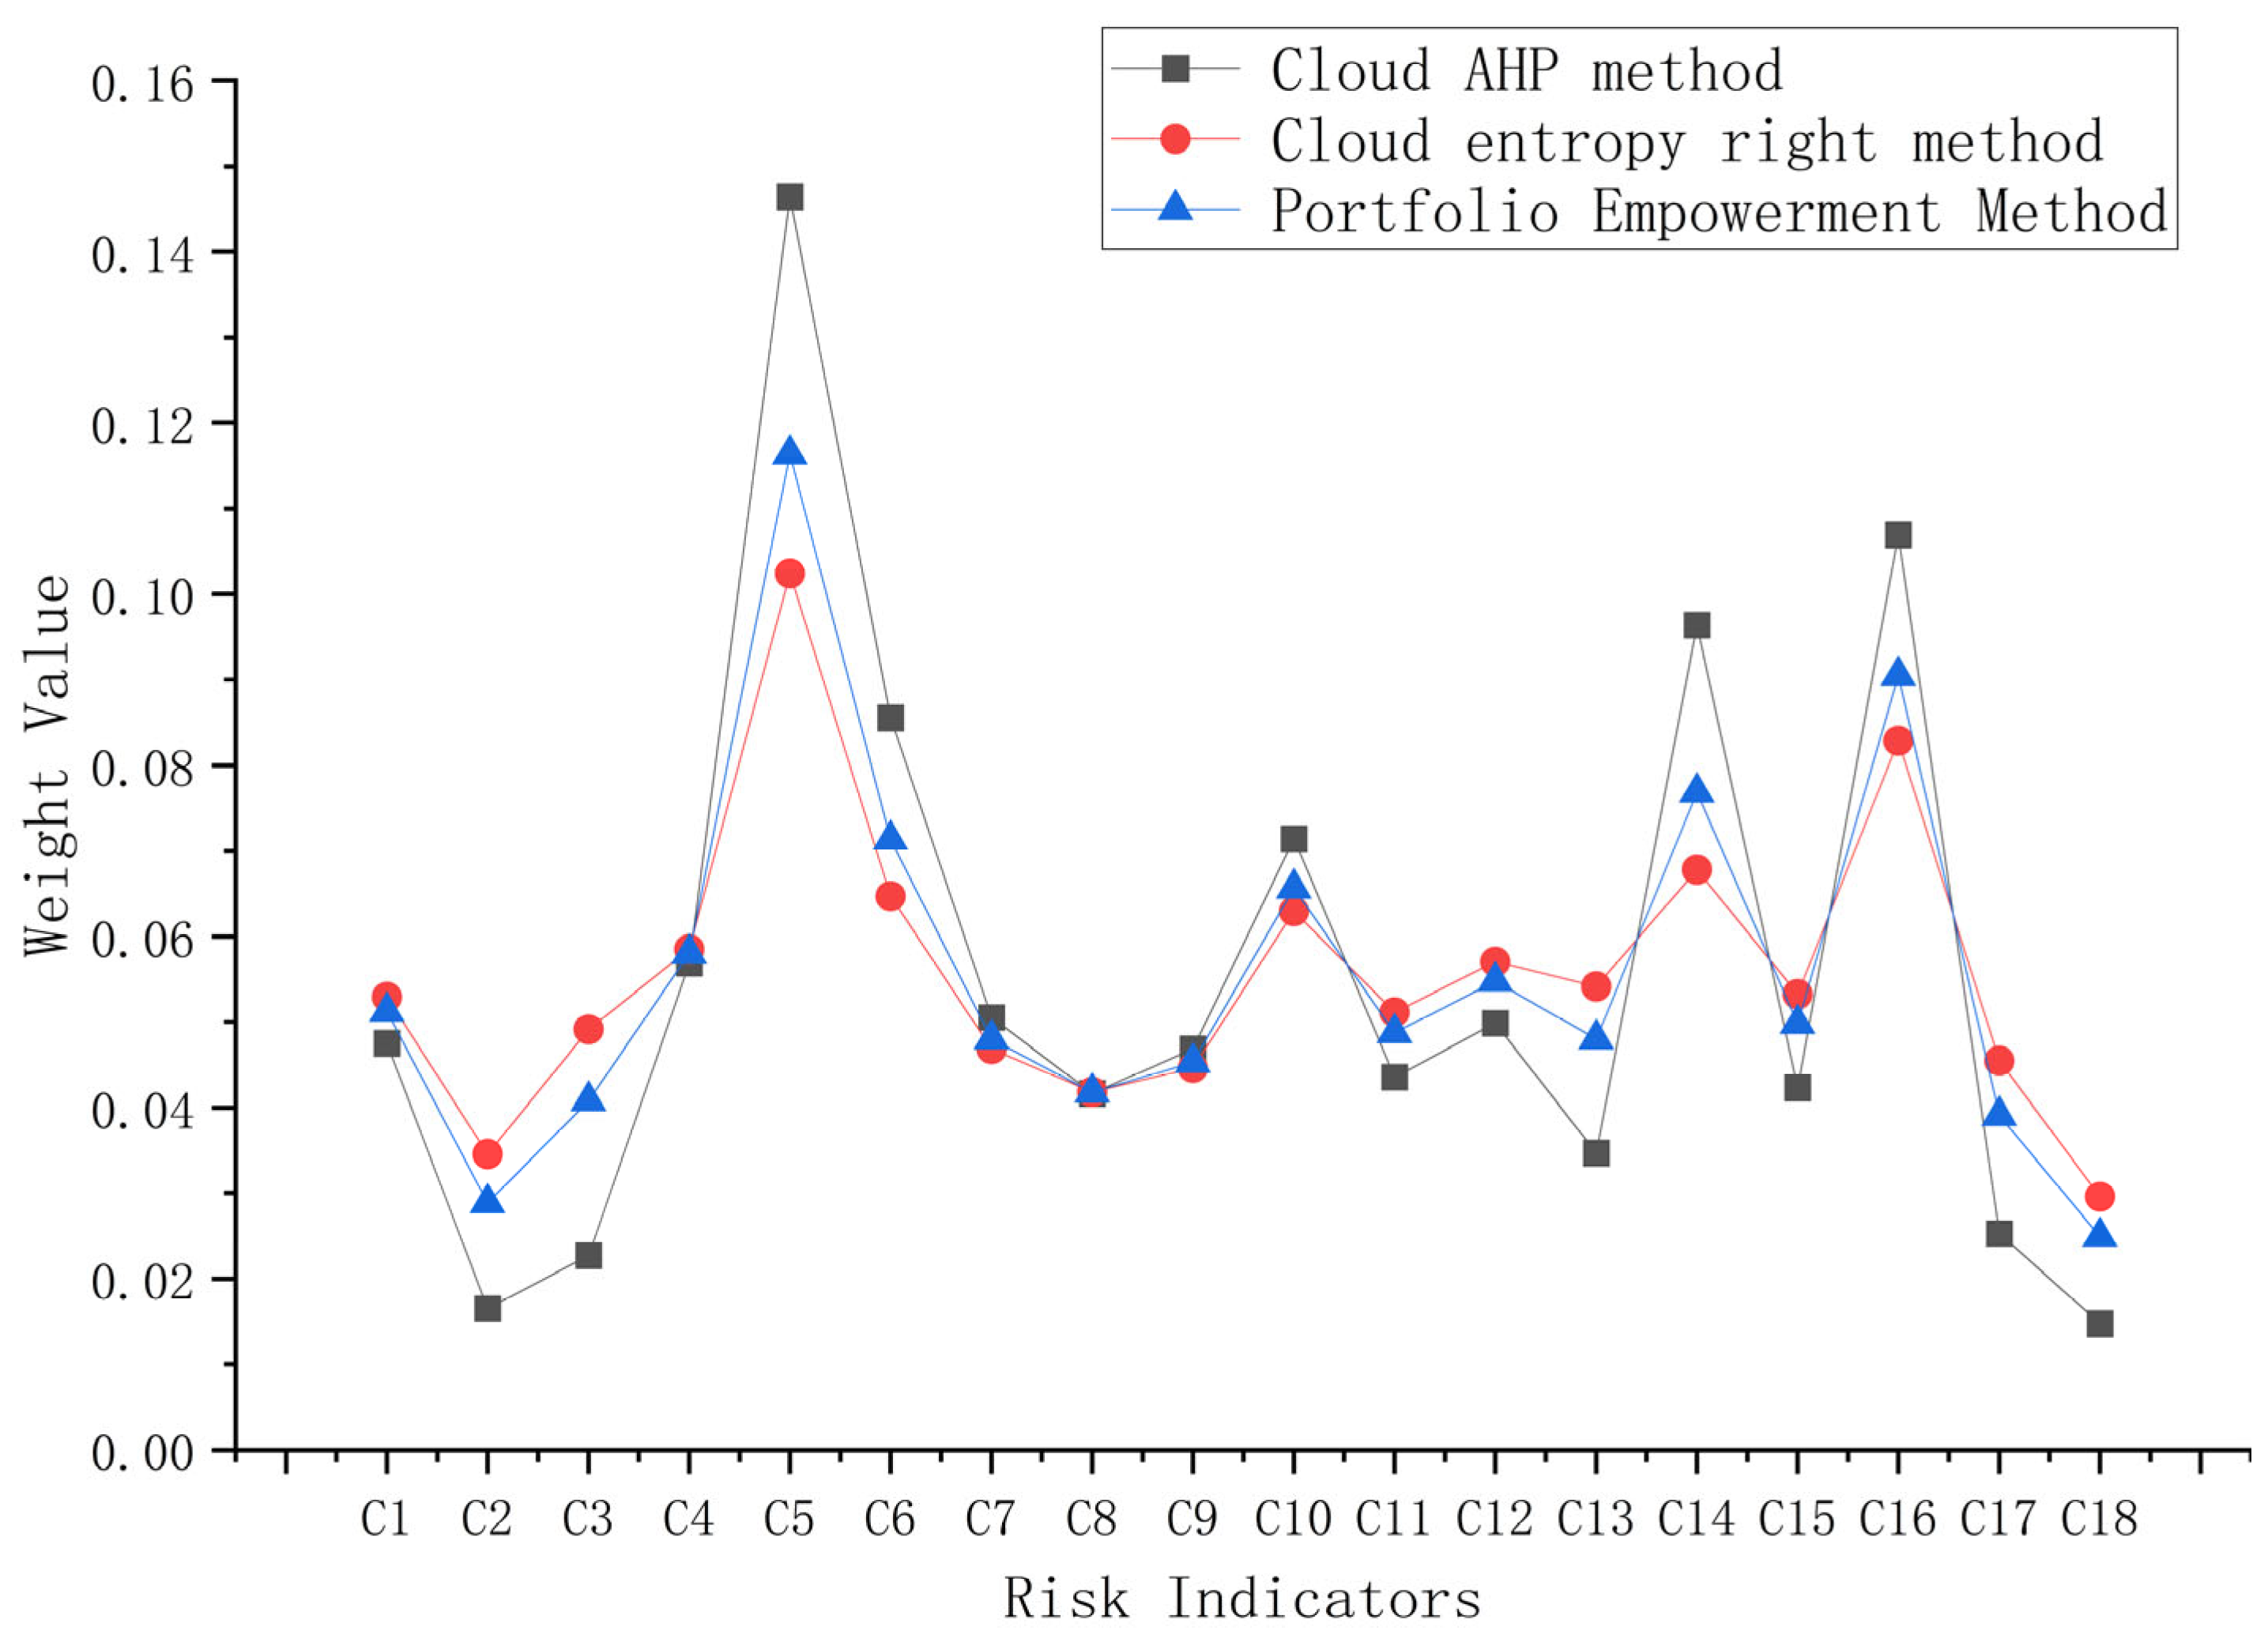
4.4. Combination Weighting Method of Game Theory to Determine Comprehensive Weight

For the same risk evaluation index, comparing the subjective and objective weights obtained by the cloud AHP method and the cloud entropy weight method, some indexes are quite different, such as C3, C7, C9, and C13. The combination weighting of game theory can minimize the deviation of subjective and objective weights, and the obtained comprehensive weight value is closer to the objective reality. In this paper, two different methods are used to weight the risk indicators, so t = 2, according to formulas (20)~(24), the combined weight coefficients of each risk evaluation index can be calculated as follows: subjective weight coefficient φ 1 = 0.316 , objective weight coefficient φ 2 = 0.684 , and the comprehensive weight results determined by the combined weighting method of game theory for each first-level and second-level index are shown in Table 14.
It can be seen from the above table that construction material quality C5, climatic and environmental conditions C16, insufficient security measures C14, temporary structure safety C6, construction program reasonableness C10, and economic contract issues C4 have relatively large weights, which belong to four different first-level indicators. The weight of the second-level indicators under each first-level indicator has a large difference, which makes the calculated weight value more reliable. The weight comparison of risk indicators obtained by different weighting methods is shown in Figure 7.
As can be seen from the figure above, the idea of game theory is applied to combined weighting, and among the index weights calculated by various methods, the weight with the smallest deviation from each basic weight is obtained, so that the comprehensive weight obtained after combined weighting is more accurate. It fits the actual situation, and the combined weighting method of game theory can fully avoid the one-sidedness of the single weighting method, so that the obtained comprehensive weight can not only reflect the subjective intention of the decision maker but can also reflect the objective attributes of the data.

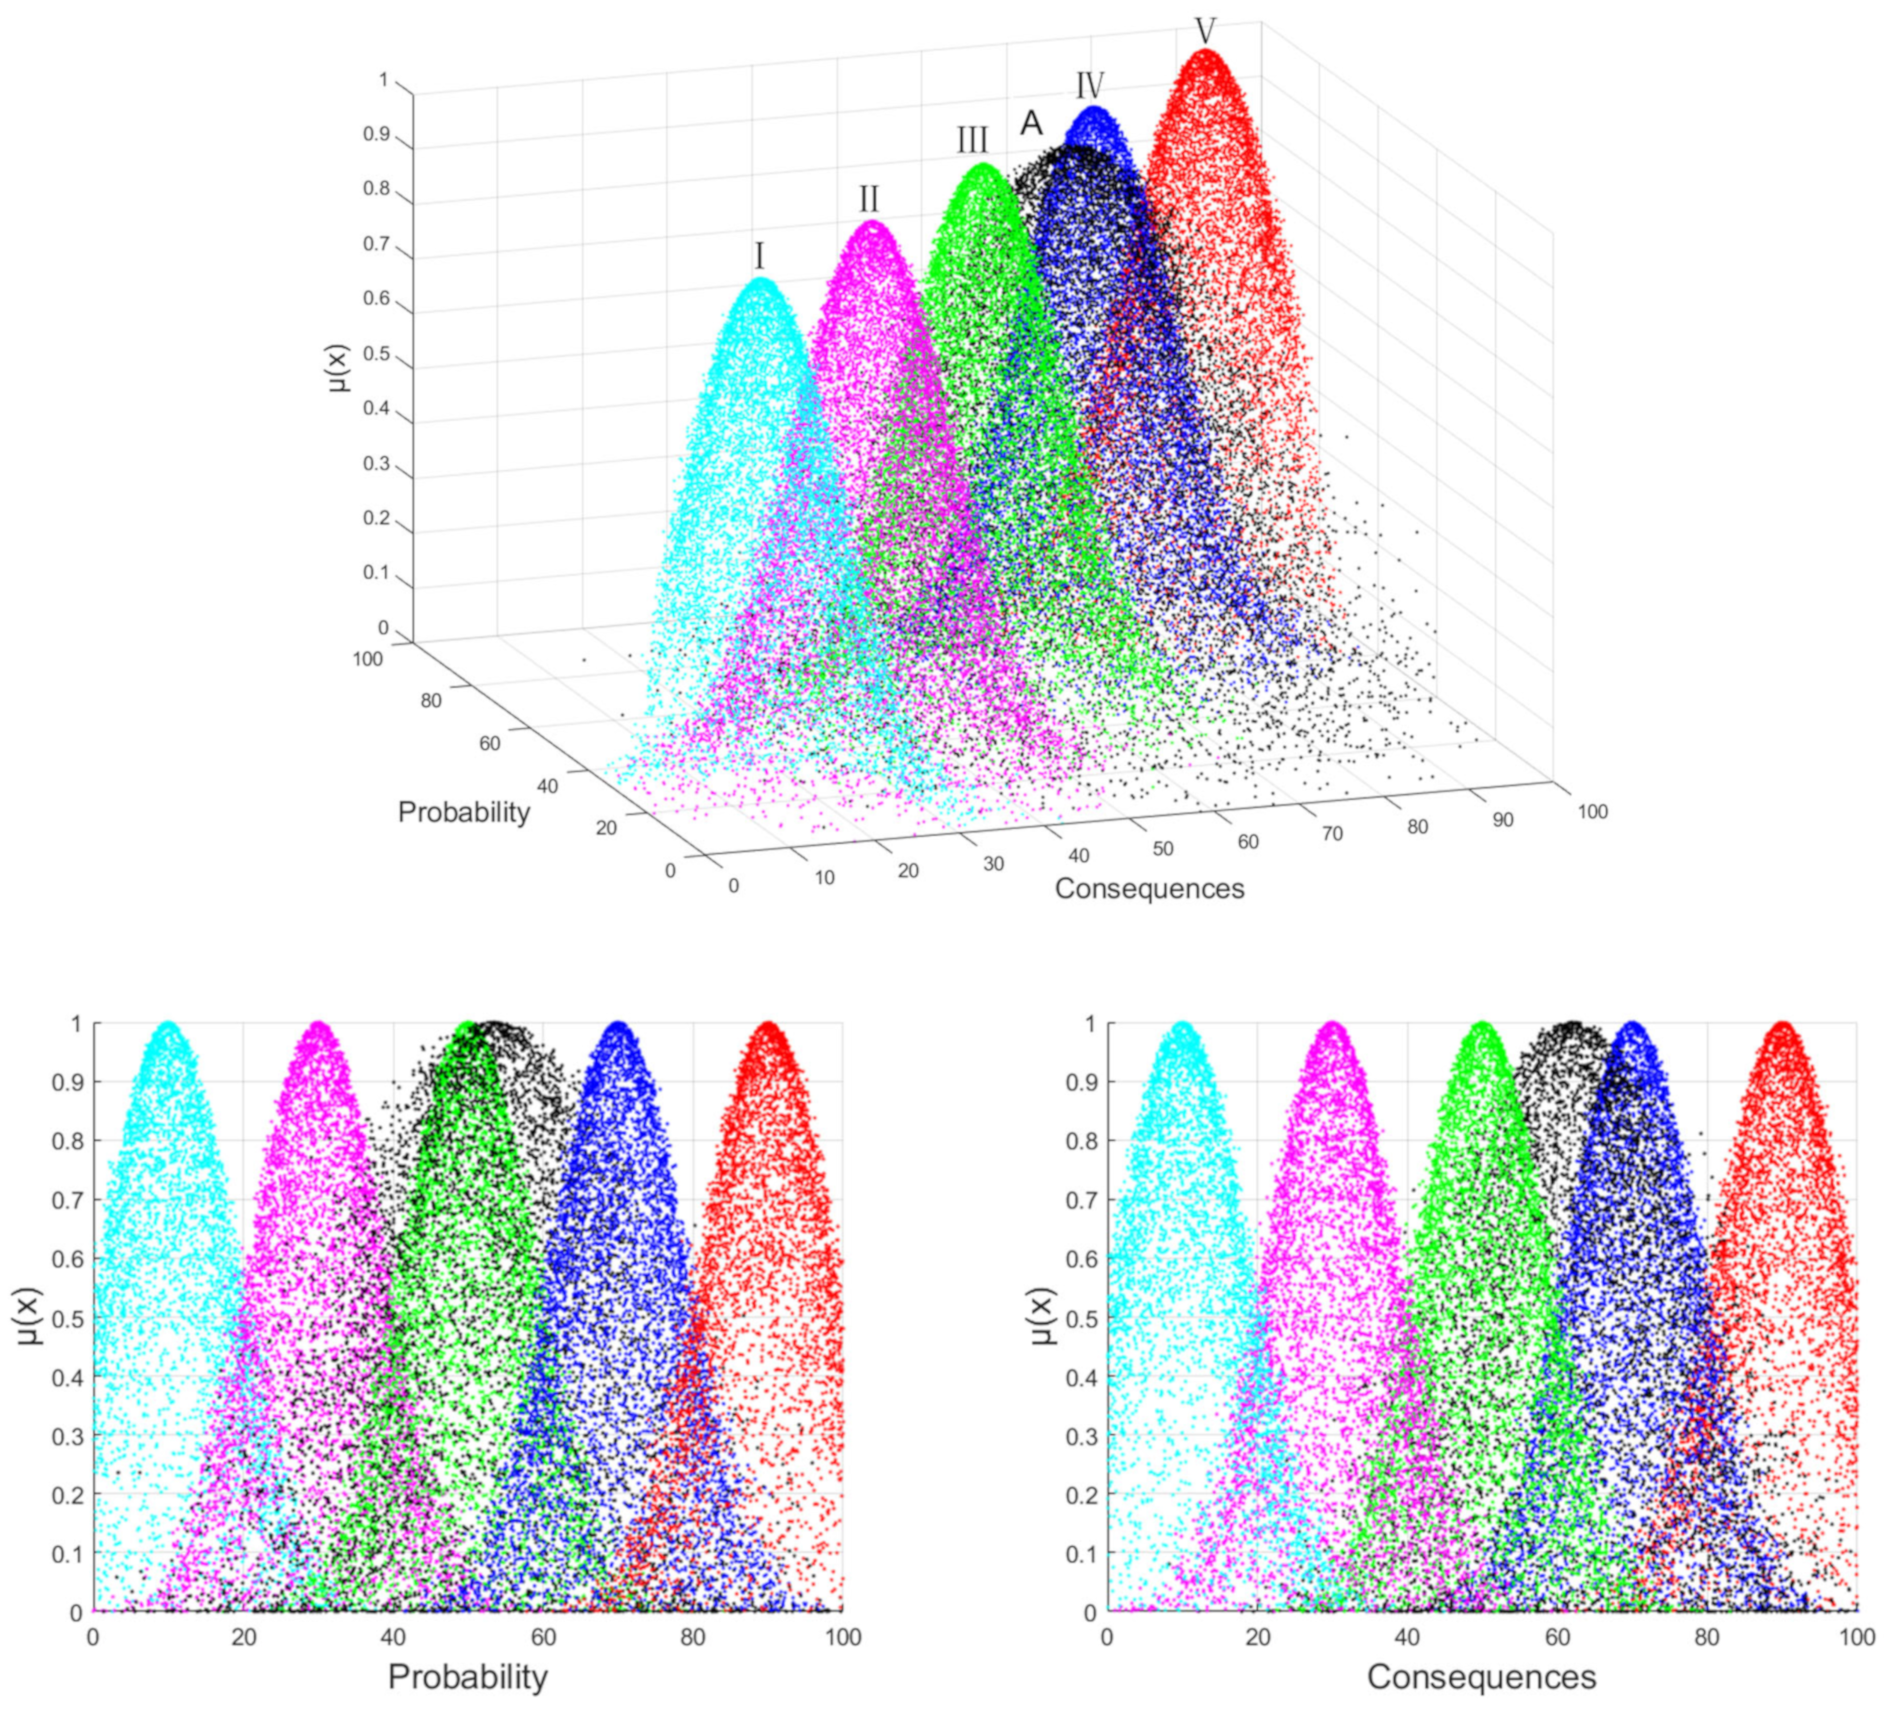
4.5. Construction Risk Assessment of the Yellow River Bridge Based on Two-Dimensional Cloud Model

In this paper, 10 experts are invited to score and assign values to risk indicators based on the two criteria of risk occurrence probability and consequence severity. The score interval is [0, 100], and the score accuracy is 1. The greater the probability score, the greater the probability of risk occurrence; the greater the consequence score, the more serious the consequence of risk occurrence. The data of risk probability and risk consequence score are shown in Table 15.
According to the risk probability score and risk consequence score in Table 15, the digital eigenvalues of the risk probability cloud and the risk consequence cloud of the secondary indicators are calculated using Formula (27). Combined with the risk weight value calculated in Section 4.4, Formula (29) is used to obtain the digital eigenvalues of the risk probability cloud and risk consequence cloud of each first-level indicator.
According to the first-level index risk probability cloud, the numerical characteristics of the consequence cloud, and the weight value of the first-level indexes in Table 16, comprehensive cloud numerical characteristics of the overall risk of the construction of the studied Yellow River bridge can be further obtained. Calculated by Formula (29), the eigenvalues are (62.08,14.40,4.37), and the numerical eigenvalues of the overall risk consequence cloud are (53.31,16.85,5.82).
We input the digital characteristics of the first-level index risk probability cloud and consequence cloud and the comprehensive construction risk cloud digital characteristics from Table 16 into a forward cloud generator in MATLAB to generate a two-dimensional comprehensive cloud image and compared it with the two-dimensional standard cloud image. The preliminary determination of the construction risk level of each index is limited to the space, and only a comparison chart of the overall construction risk’s comprehensive cloud and the standard cloud is shown in Figure 8.
As can be seen from Figure 8, the risk probability level of the overall construction risk A of the Yellow River bridge is between III–IV but closer to III, and the risk consequence level is between III–IV but closer to IV. Using the same method, it can be found that the risk probability level of personnel quality risk B1 is between II–III but closer to III, and the risk consequence level is between III–IV but closer to III. The risk probability level of material and equipment risk B2 is between III–IV but closer to III, and the risk consequence level is between III–IV but closer to IV. The risk probability level of construction technology risk B3 is closer to IV and the risk consequence level is closer to IV. The risk probability level of construction environment risk B4 is between II–III but closer to III, and the risk consequence level is between III–IV but closer to IV.
Due to the similarity between the two-dimensional comprehensive cloud image and the two-dimensional standard cloud image and the fact that the two-dimensional cloud image has a three-dimensional view, the spatial graphics cause visual errors, and the evaluation level of each construction risk of the Yellow River bridge can only be initially determined. Therefore, Formula (30) is used in this paper to calculate the close degree N of the standard cloud and the comprehensive cloud, so as to accurately determine the level of bridge construction risk. The calculation results of the close degree of bridge construction risk and risk level of each index are shown in Table 17.
Using the same method, the closeness calculation results of other secondary risk indicators can be obtained. According to the calculation results of closeness, we take the level of the maximum closeness to determine the risk probability level and consequence level and then conduct a two-dimensional comprehensive evaluation according to the risk assessment matrix in Table 4, so as to determine the comprehensive evaluation level of risk indicators and evaluate the risk level of each indicator. See Table 18 for a summary.
According to the closeness calculation results, the overall construction risk probability level of the Yellow River bridge is determined to be level 4, the risk consequence level is level 3, and the comprehensive risk level is determined to be “level four” by referring to Table 4. According to the results of the risk assessment, the importance of the risk factors of first-level indicators can be obtained in descending order as follows: construction technology risk B3, material and equipment risk B2, construction environmental risk B4, personnel risk B1; among the second-level risk factors, temporary structural safety C6, construction program reasonableness C10, construction work violation C12, construction material quality C5, and other risks have a high probability of occurrence and severity of consequences. Therefore, during construction, it is necessary to formulate corresponding risk control measures for factors with higher risk levels to ensure the safety of the construction of bridges across the Yellow River.

5. Conclusions

The construction safety risk evaluation of bridges across the Yellow River is an important part of bridge construction, and it is of great significance to propose a scientific and effective construction safety risk evaluation method for the construction safety and normal use of bridges across the Yellow River. In this paper, on the basis of referring to a large number of specifications and the literature, the construction safety risk of a Yellow River bridge is evaluated using game theory’s combination of empowerment with two-dimensional cloud model theory, and the main conclusions are as follows:
(1) Based on the construction characteristics of the studied Yellow River bridge, this paper divides the construction safety risk sources of the Yellow River bridge into 4 first-level risk indicators and 18 second-level risk indicators by referring to relevant norms and the literature and establishes a construction safety risk assessment index system for the bridge. Then, an improved cloud model AHP method and a cloud entropy weight method are adopted to determine the subjective and objective weights of the risk indicators. Then, game theory is used for combination weighting to determine the comprehensive weights of each risk index. The method fully considers the randomness and fuzziness of risk events, so that the calculated comprehensive weights can reflect both the subjective intention of decision makers and the objective attributes of data;
(2) In order to determine the level of bridge construction safety risk, the evaluation criteria and evaluation data are transformed into a cloud model; combined with risk weight values determined by the combined weighting method, the digital characteristic values of the risk cloud, comprehensive cloud, and standard cloud are calculated and input into a forward cloud generator algorithm. Then, a two-dimensional comprehensive cloud map is generated by MATLAB and visually compared with the standard cloud map. The probability level and consequence level of each risk index are preliminatively obtained. Then, by calculating the close degree N between the comprehensive cloud and the standard cloud, the risk assessment matrix is used to carry out comprehensive risk evaluation, and the construction safety risk evaluation level of the Yellow River bridge is obtained;
(3) This paper evaluates the construction safety risk of the studied Yellow River bridge. Since there are many risk factors affecting the construction safety of the bridge, this paper only selects 4 primary risk indicators and 18 secondary risk indicators that are relatively common and have a great impact on construction safety, and there are shortcomings in the number and importance of the evaluation indicators. Therefore, it is necessary to conduct more in-depth exploration and research on the safety risk assessment of the construction of bridges across the Yellow River in order to move forward in the direction of sustainable development. In addition, a new platform applied to bridge construction safety risk assessment needs to be developed in the future. By inputting relevant data of risk indicators, one can automatically calculate and analyze to obtain major risk sources.

Author Contributions

Conceptualization, J.Z. and L.W.; Data curation, Q.L. and R.J.; Investigation, Q.L. and L.W.; Methodology, J.Z. and R.J.; Resources, Q.L. and J.Z.; Software, R.J. and L.W.; Supervision, L.W. and Q.L.; Validation, J.Z. and R.J.; Visualization, J.Z. and L.W.; Writing—original draft, L.W. and R.J.; Writing—review and editing, L.W. and Q.L. All authors have read and agreed to the published version of the manuscript.

Funding

This research received no external funding.

Institutional Review Board Statement

Not applicable.

Informed Consent Statement

Not applicable.

Data Availability Statement

Not applicable.

Conflicts of Interest

The authors declare no conflict of interest.

References

  1. Khaleghi, B.; Schultz, E.; Seguirant, S. Accelerated bridge construction in Washington State: From research to practice. PCI J. 2012, 57, 34–49. [Google Scholar] [CrossRef]
  2. Mortazavi, S.; Kheyroddin, A.; Naderpour, H. Risk evaluation and prioritization in bridge construction projects using system dynamics approach. Pract. Period. Struct. Des. Constr. 2020, 25, 04020015. [Google Scholar] [CrossRef]
  3. Farhangdoust, S.; Mehrabi, A. Health monitoring of closure joints in accelerated bridge construction: A review of non-destructive testing application. J. Adv. Concr. Technol. 2019, 17, 381–404. [Google Scholar] [CrossRef]
  4. Kitada, T. Considerations on recent trends in, and future prospects of, steel bridge construction in Japan. J. Constr. Steel Res. 2006, 62, 1192–1198. [Google Scholar] [CrossRef]
  5. Nieto-Morote, A.; Ruz-Vila, F. A fuzzy approach to construction project risk assessment. Int. J. Proj. Manag. 2011, 29, 220–231. [Google Scholar] [CrossRef]
  6. Furuta, H.; He, J.; Watanabe, E. A fuzzy expert system for damage assessment using genetic algorithms and neural networks. Comput.-Aided Civ. Infrastruct. Eng. 1996, 11, 37–45. [Google Scholar] [CrossRef]
  7. Curra, J.; Omidvar, M.; Horine, B. A GIS-Based Platform for Bridge Scour Risk Assessment Using the HYRISK Model. In Geo-Congress 2019: Soil Erosion, Underground Engineering, and Risk Assessment; American Society of Civil Engineers: Reston, VA, USA, 2019; pp. 11–19. [Google Scholar]
  8. Jiang, Z.G.; Wu, Z.; Zhang, X.Q. Risk assessment of bridge construction based on two-dimensional cloud model. J. Wuhan Univ. Technol. (Transp. Sci. Eng. Ed.) 2019, 43, 218–221. [Google Scholar]
  9. Ren, L.C.; Li, Z.F. Bridge risk assessment model based on game theory and fuzzy mathematics. Highw. Eng. 2017, 42, 163–169. [Google Scholar]
  10. Kim, J.M.; Kim, T.; Ahn, S. Loss assessment for sustainable industrial infrastructure: Focusing on bridge construction and financial losses. Sustainability 2020, 12, 5316. [Google Scholar] [CrossRef]
  11. Ng, K.H.; Fairfield, C.A. Monte Carlo simulation for arch bridge assessment. Constr. Build. Mater. 2002, 16, 271–280. [Google Scholar] [CrossRef]
  12. Ahn, S.; Kim, T.; Kim, J.M. Sustainable risk assessment through the analysis of financial losses from third-party damage in bridge construction. Sustainability 2020, 12, 3435. [Google Scholar] [CrossRef]
  13. Cho, T.; Kim, T.S. Probabilistic risk assessment for the construction phases of a bridge construction based on finite element analysis. Finite Elem. Anal. Des. 2008, 44, 383–400. [Google Scholar] [CrossRef]
  14. Aliyari, M.; Ashrafi, B.; Ayele, Y.Z. Hazards identification and risk assessment for UAV–assisted bridge inspections. Struct. Infrastruct. Eng. 2022, 18, 412–428. [Google Scholar] [CrossRef]
  15. Agarwal, A.; Sharma, V.; Shukla, V. IoT-and NDT-based bridge risk assessment and identification. In Advances in Fire and Process Safety; Springer: Singapore, 2018; pp. 301–310. [Google Scholar]
  16. Li, D.Y.; Liu, C.Y.; Gan, W.Y. A new cognitive model: Cloud model. Int. J. Intell. Syst. 2009, 24, 357–375. [Google Scholar] [CrossRef]
  17. Wang, G.Y.; Xu, C.L.; Li, D.Y. Generic normal cloud model. Inf. Sci. 2014, 280, 1–15. [Google Scholar] [CrossRef]
  18. Wang, D.; Liu, D.F.; Ding, H. A cloud model-based approach for water quality assessment. Environ. Res. 2016, 148, 24–35. [Google Scholar] [CrossRef]
  19. Xu, X.; Huang, Q.; Ren, Y. Condition assessment of suspension bridges using local variable weight and normal cloud model. KSCE J. Civ. Eng. 2018, 22, 4064–4072. [Google Scholar] [CrossRef]
  20. Pan, N.F. Fuzzy AHP approach for selecting the suitable bridge construction method. Autom. Constr. 2008, 17, 958–965. [Google Scholar] [CrossRef]
  21. Xia, L.; Wang, Y.P.; Yang, J.P.; Sun, Z.J. An improved analytic hierarchy process based on cloud model scaling. J. Air Force Early Warn. Acad. 2019, 33, 112–115+120. [Google Scholar]
  22. Rashidi, M.; Ghodrat, M.; Samali, B. Remedial modelling of steel bridges through application of analytical hierarchy process (AHP). Appl. Sci. 2017, 7, 168. [Google Scholar] [CrossRef]
  23. Prasetyo, E.D.W.; Handajani, M. Criteria analysis, weight and priority for handling bridges in Kudus District using AHP and Promethee II methods. In Journal of Physics: Conference Series. In Proceedings of the 2nd Forum in Research, Science, and Technology, Palembang, Indonesia, 30–31 October 2018; IOP Publishing: Bristol, UK, 2019; Volume 1167, p. 012009. [Google Scholar]
  24. Liu, H.B.; Wang, X.R.; Tan, G.J.; He, X. System reliability evaluation of a bridge structure based on multivariate copulas and the AHP–EW method that considers multiple failure criteria. Appl. Sci. 2020, 10, 1399. [Google Scholar] [CrossRef]
  25. Li, Q.F.; Yu, Y.Q. Durability Evaluation of Concrete Bridges Based on the Theory of Matter Element Extension—Entropy Weight Method—Unascertained Measure. Math. Probl. Eng. 2021, 2021, 2646723. [Google Scholar] [CrossRef]
  26. Zhou, K.P.; Lin, Y.; Deng, H.W.; Li, J.L.; Liu, C.J. Prediction of rock burst classification using cloud model with entropy weight. Trans. Nonferrous Met. Soc. China 2016, 26, 1995–2002. [Google Scholar] [CrossRef]
  27. Li, Q.F.; Zhou, J.P.; Feng, J.H. Safety Risk Assessment of Highway Bridge Construction Based on Cloud Entropy Power Method. Appl. Sci. 2022, 12, 8692. [Google Scholar] [CrossRef]
  28. Oukil, A. Ranking via composite weighting schemes under a DEA cross-evaluation framework. Comput. Ind. Eng. 2018, 117, 217–224. [Google Scholar] [CrossRef]
  29. Wang, D.; Zeng, D.B.; Singh, V.P.; Xu, P.; Liu, D.; Wang, Y.; Zeng, X.; Wu, J.; Wang, L. A multidimension cloud model-based approach for water quality assessment. Environ. Res. 2016, 149, 113–121. [Google Scholar] [CrossRef] [PubMed]
  30. Wang, S.X.; Zhang, L.; Ma, N.; Wang, S. An evaluation approach of subjective trust based on cloud model. In Proceedings of the 2008 International Conference on Computer Science and Software Engineering, Wuhan, China, 12–14 December 2008; IEEE: New York, NY, USA, 2008; Volume 3, pp. 1062–1068. [Google Scholar]
  31. Mattioli, V.; Basili, P.; Bonafoni, S.; Ciotti, P.; Westwater, E.R. Analysis and improvements of cloud models for propagation studies. Radio Sci. 2009, 44, 1–13. [Google Scholar] [CrossRef]
  32. Putcha, C.; Dutta, S.; Rodriguez, J. Risk priority number for bridge failures. Pract. Period. Struct. Des. Constr. 2020, 25, 04020010. [Google Scholar] [CrossRef]
  33. Hackl, J.; Adey, B.T.; Woźniak, M.; Schümperlin, O. Use of unmanned aerial vehicle photogrammetry to obtain topographical information to improve bridge risk assessment. J. Infrastruct. Syst. 2018, 24, 04017041. [Google Scholar] [CrossRef]
  34. Andrić, J.M.; Lu, D.G. Risk assessment of bridges under multiple hazards in operation period. Saf. Sci. 2016, 83, 80–92. [Google Scholar] [CrossRef]
Figure 1. Flow chart of the study.
Applsci 13 10942 g001
Figure 2. Schematic diagram of cloud model’s digital features.
Applsci 13 10942 g002
Figure 3. Schematic diagram of forward cloud generator’s operation.
Applsci 13 10942 g003
Figure 4. Schematic diagram of reverse cloud generator’s operation.
Applsci 13 10942 g004
Figure 5. Two-dimensional standard cloud map.
Applsci 13 10942 g005
Figure 6. The construction safety risk evaluation index system of the studied Yellow River bridge.
Applsci 13 10942 g006
Figure 7. Comparison of weight values obtained by different weighting methods.
Applsci 13 10942 g007
Figure 8. Comparison of construction risk comprehensive cloud A and two-dimensional standard cloud.
Applsci 13 10942 g008
Table 1. 1–9 scaling method.
Value13579
Importanceequivalentslightly the sameslightly importantmore importantvery important
Note: Values of 2, 4, 6, and 8 indicate that the relative factor importance is between two adjacent levels.
Table 2. Average random consistency index R.I.
Order12345678910
R.I.000.520.891.121.261.361.411.461.49
Table 3. Standard cloud digital characteristics.
Risk LevelPossibility
Description
Severity
Description
Quantitative Range of Risk LevelStandard Cloud Digital Characteristics
Iextremely impossibleslight 0 , 20 10 , 8.49 , 0.85
IIimpossiblelarger 20 , 40 30 , 8.49 , 0.85
IIIoccasionallyserious 40 , 60 50 , 8.49 , 0.85
IVpossiblevery serious 60 , 80 70 , 8.49 , 0.85
Vextremely possibledisastrous 80 , 100 90 , 8.49 , 0.85
Table 4. Risk Assessment Matrix.
Probability LevelConsequence Level
IIIIIIIVV
Ilevel onelevel onelevel twolevel twolevel three
IIlevel onelevel onelevel twolevel threelevel four
IIIlevel twolevel twolevel threelevel fourlevel five
IVlevel twolevel threelevel fourlevel fivelevel five
Vlevel threelevel fourlevel fivelevel fivelevel five
Table 5. Relative importance comparison matrix of the first-level indicators A–B of the construction risk of the Yellow River Bridge.
Risk IndicatorP1P2P3
B1B2B3B4B1B2B3B4B1B2B3B4
B111/41/31/211/41/41/311/31/21/2
B2412341343123
B331/21341/31421/213
B421/31/3131/41/4121/31/31
Table 6. Relative importance comparison matrix of secondary indicators B1-C under personnel risk.
Risk IndicatorP1P2P3
C1C2C3C4C1C2C3C4C1C2C3C4
C11321/213311421
C21/311/31/41/3121/31/411/41/2
C31/2311/31/31/211/41/2411/3
C4243113411231
Table 7. A–B Judgment matrix based on cloud model scaling.
B1B2B3B4
B1(1,0,0)(0.28,0.03,0.004)(0.361,0.141,0.436)(0.444,0.085,0.014)
B2(3.667,0.364,0.061)(1,0,0)(2.333,0.364,0.061)(3.333,0.313,0.052)
B3(3,0.364,0.061)(0.444,0.085,0.014)(1,0,0)(3.333,0.313,0.052)
B4(2.333,0.364,0.061)(0.306,0.129,0.436)(0.306,0.129,0.436)(1,0,0)
Table 8. B1–C Judgment Matrix Based on Cloud Model Scaling.
C1C2C3C4
C1(1,0,0)(3.333,0.313,0.052)(2.333,0.364,0.061)(0.833,0.214,0.036)
C2(0.306,0.027,0.005)(1,0,0)(0.861,0.237,0.040)(0.361,0.063,0.010)
C3(0.444,0.085,0.014)(2.500,0.283,0.047)(1,0,0)(0.306,0.027,0.005)
C4(1.333,0.313,0.052)(3.000,0.364,0.061)(3.333,0.313,0.052)(1,0,0)
Table 9. Subjective weights of primary risk indicators.
Primary Indicators Subjective   Weight   α E x i 0 , E n i 0 , H e i 0 Judgment Matrix A–B
Consistency Test
Personnel risk B1(0.144,0.100,0.154)C.I. = 0.036
R.I. = 0.89
C.R. = 0.040 < 0.1
Material and equipment risk B2(0.371,0.451,0.357)
Construction technology risk B3(0.296,0.289,0.229)
Construction environmental risk B4(0.189,0.159,0.260)
Table 10. Subjective weight of secondary indicators under personnel risk B1.
Secondary Indicators Subjective   Weight   α E x i 0 , E n i 0 , H e i 0 Judgment Matrix B1–C
Consistency Test
Personnel quality C1(0.331,0.334,0.334)C.I. = 0.053
R.I. = 0.89
C.R. = 0.060 < 0.1
Organizational completeness C2(0.115,0.118,0.118)
Construction management efforts C3(0.158,0.154,0.154)
Economic contract issues C4(0.396,0.393,0.393)
Table 11. Subjective weights of construction safety risk factors of the Yellow River Bridge.
Primary IndicatorsWeightsSecondary IndicatorsWeightsSubjective Weight
Personnel risk B10.144Personnel quality C10.3310.048
Organizational completeness C20.1150.017
Construction management efforts C30.1580.023
Economic contract issues C40.3960.057
Material and equipment risk B20.371Construction material quality C50.3950.146
Temporary structure safety C60.2310.086
Material and equipment stacking C70.1360.051
Material and equipment transportation C80.1120.042
Mechanical equipment failure C90.1260.047
Construction technology risk B30.296Construction program reasonableness C100.2410.071
Construction process maturity C110.1470.044
Construction work violation C120.1690.050
Construction monitoring situation C130.1170.035
Insufficient security measures C140.3260.096
Construction environmental risk B40.189Geological conditions C150.2240.042
Climatic and environmental conditions C160.5650.107
Natural disaster C170.1340.025
Construction site conditions C180.0780.015
Table 12. Scoring results of the importance of risk indicators.
Risk IndicatorsExperts
12345678910
Personnel quality C160357565887075808585
Organizational completeness C260302070504035556070
Construction management efforts C370755071903550807579
Economic contract issues C487854070858674707560
Construction material quality C592868990909289879193
Temporary structure safety C650759085806090828890
Material and equipment stacking C772602585556055607585
Material and equipment transportation C840706225456565665850
Mechanical equipment failure C950606530605060657060
Construction program reasonableness C1080559085607090958590
Construction process maturity C1165857570658050307080
Construction work violation C1235758590627090809085
Construction monitoring situation C1385757285807555706535
Insufficient security measures C1460809070868575879095
Geological conditions C1570408562899085908650
Climatic and environmental conditions C1695858590938580908175
Natural disaster C1720657045607080825570
Construction site conditions C1850152070603055555020
Table 13. Calculation results of objective weights of risk indicators.
Risk Indicators E x E n H e θ j β j
Personnel quality C171.8016.744.160.0580.053
Organizational completeness C249.0020.126.020.0390.035
Construction management efforts C367.5017.634.700.0540.049
Economic contract issues C473.2012.127.170.0590.059
Construction material quality C589.903.523.300.0720.102
Temporary structure safety C679.0011.055.350.0630.065
Material and equipment stacking C763.2016.376.660.0510.047
Material and equipment transportation C854.6014.342.160.0440.042
Mechanical equipment failure C957.0013.167.090.0460.045
Construction program reasonableness C1080.0012.913.480.0640.063
Construction process maturity C1167.0014.547.510.0540.051
Construction work violation C1276.2015.747.070.0610.057
Construction monitoring situation C1369.7013.566.860.0560.054
Insufficient security measures C1481.8010.581.510.0660.068
Geological conditions C1574.7019.256.010.0600.053
Climatic and environmental conditions C1685.906.121.070.0690.083
Natural disaster C1761.7016.747.500.0500.045
Construction site conditions C1842.5021.318.650.0340.030
Table 14. Calculation results of comprehensive weight of risk indicators.
Primary IndicatorsComprehensive WeightSecondary IndicatorsSubjective WeightObjective WeightComprehensive Weight
B10.175C10.0480.0530.047
C20.0170.0350.029
C30.0230.0490.041
C40.0570.0590.058
B20.323C50.1460.1020.116
C60.0860.0650.071
C70.0510.0470.048
C80.0420.0420.042
C90.0470.0450.045
B30.298C100.0710.0630.066
C110.0440.0510.049
C120.0500.0570.055
C130.0350.0540.052
C140.0960.0680.077
B40.204C150.0420.0530.050
C160.1070.0830.090
C170.0250.0450.039
C180.0150.0300.025
Table 15. Risk probability/consequence score.
Risk IndicatorsExperts
12345678910
C130/7020/3045/8562/4871/8550/7053/7778/6280/7065/85
C252/4810/3021/1565/5535/4535/2520/3040/5060/4045/75
C355/4542/6845/1534/6878/6220/1056/472/4867/4364/54
C480/5470/6013/2755/4572/5875/5769/3970/3080/3055/25
C570/5475/3785/3380/4087/3383/4165/5380/3475/4790/36
C660/4060/9085/8588/8280/8060/6092/7880/8490/8685/75
C736/8860/4020/1070/8050/4044/5646/4445/5565/6570/80
C825/3548/7246/5812/1844/2660/5066/4440/7250/4635/45
C945/3559/4168/4225/1540/6040/4055/4548/6248/7240/60
C1075/6542/4872/8866/8448/5255/6572/8882/8870/8075/85
C1150/6070/8070/6065/5550/6062/7836/4427/1365/5570/70
C1220/3058/7269/8182/7850/5465/5573/8775/6582/7877/73
C1368/8265/6570/5465/8576/6462/6840/5050/7045/6535/15
C1446/3465/5576/6465/3575/5765/6560/5075/5985/5584/66
C1555/4535/540/9050/3470/6882/5880/5080/6070/6234/26
C1672/5862/4868/4282/3878/4865/4566/3474/4670/3267/13
C1730/1060/7050/7050/2065/3575/4575/6580/6462/2871/49
C1826/5410/1015/2555/6525/7510/3044/4620/7045/3514/16
Table 16. Numerical eigenvalues of indicator cloud models at all levels.
Primary IndicatorsProbability CloudConsequence CloudSecondary IndicatorsWeightProbability
Cloud
Consequence Cloud
B1(54.91,18.82,7.12)(49.05,19.16,4.87)C10.047(55.40,20.59,4.37)(68.20,19.56,4.89)
C20.029(38.30,19.55,5.17)(41.30,16.72,4.34)
C30.041(53.30,19.43,6.43)(41.70,24.19,2.92)
C40.058(63.90,16.33,10.80)(42.50,15.63,6.49)
B2(65.32,11.89,3.34)(52.46,16.08,5.89)C50.116(79.00,7.90,0.68)(40.80,12.33,6.86)
C60.071(78.00,2.46,3.57)(76.00,11.81,7.87)
C70.048(50.60,15.04,4.91)(55.80,23.71,2.52)
C80.042(42.60,14.11,6.12)(46.60,16.37,6.69)
C90.045(46.80,13.40,5.62)(47.20,19.74,3.12)
B3(63.68,14.15,4.30)(62.85,15.13,6.75)C100.066(65.70,11.91,3.92)(74.30,16.62,6.23)
C110.049(56.50,15.79,4.05)(57.50,15.79,10.71)
C120.055(65.10,16.89,8.38)(67.30,16.34,4.47)
C130.052(57.60,15.14,5.74)(61.80,16.64,10.41)
C140.077(69.60,11.78,0.90)(54.00,10.78,3.84)
B4(60.76,14.01,3.72)(44.40,18.24,5.15)C150.050(59.60,21.06,8.70)(49.80,22.36,8.26)
C160.090(70.40,6.12,0.93)(41.40,9.68,2.31)
C170.039(61.80,14.34,4.92)(45.60,22.56,5.94)
C180.025(26.40,16.24,2.00)(42.60,24.31,8.03)
Table 17. Calculation results of the closeness of the target layer and first-level indicators to the risk probability level.
Risk Probability LevelRisk Indicators
AB1B2B3B4
Level I0.0190.0220.0180.0190.020
Level II0.0310.0400.0280.0300.033
Level III0.0830.2040.0650.0730.093
Level IV0.1260.0660.2140.1580.108
Level V0.0360.0280.0410.0380.034
Table 18. Risk Levels of Indicators at All Levels.
Primary
Indicators
Probability
Level
Consequence
Level
Comprehensive LevelSecondary
Indicators
Probability
Level
Consequence
Level
Comprehensive Level
B1IIIIIILevel threeC1IIIIVLevel four
C2IIIIILevel two
C3IIIIIILevel three
C4IVIIILevel four
B2IVIIILevel fourC5IVIIILevel four
C6IVIVLevel five
C7IIIIIILevel three
C8IIIIIILevel three
C9IIIIIILevel three
B3IVIVLevel fiveC10IVIVLevel five
C11IIIIIILevel three
C12IVIVLevel five
C13IIIIVLevel four
C14IVIIILevel four
B4IVIIILevel fourC15IIIIIILevel three
C16IVIIILevel four
C17IVIIILevel four
C18IIIIILevel two
Disclaimer/Publisher’s Note: The statements, opinions and data contained in all publications are solely those of the individual author(s) and contributor(s) and not of MDPI and/or the editor(s). MDPI and/or the editor(s) disclaim responsibility for any injury to people or property resulting from any ideas, methods, instructions or products referred to in the content.

